Article

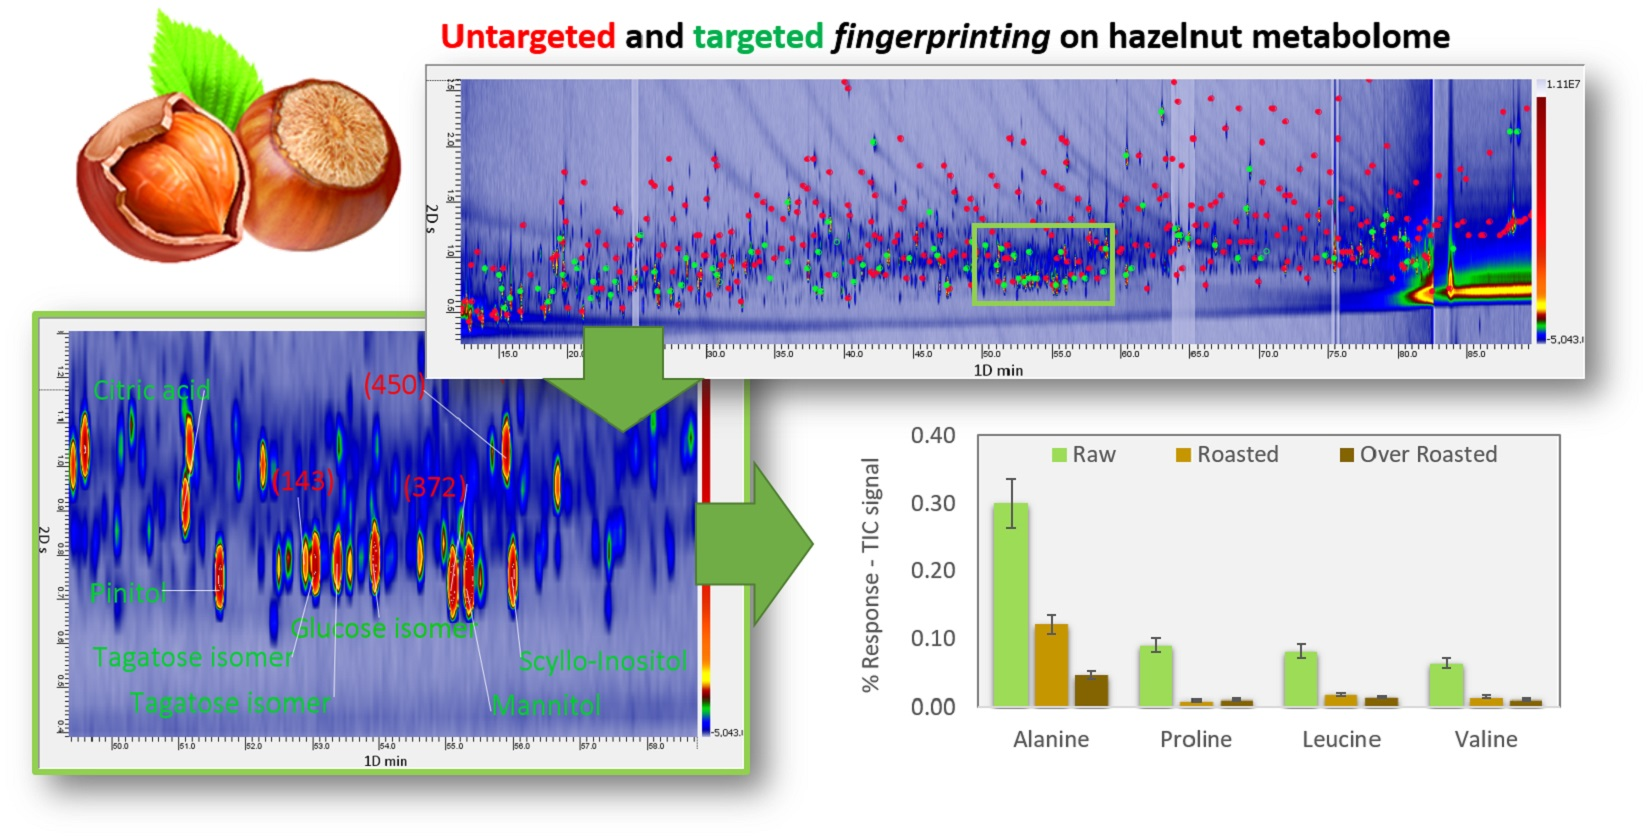
Combined Untargeted and Targeted Fingerprinting by Comprehensive Two-Dimensional Gas Chromatography to Track Compositional Changes on Hazelnut Primary Metabolome during Roasting

1
Dipartimento di Scienza e Tecnologia del Farmaco, Università degli Studi di Torino, Via Pietro Giuria 9, I-10125 Torino, Italy
2
Soremartec Italia srl, Piazzale Ferrero 1, I-12051 Cuneo, Italy
3
Computer Science and Engineering Department, University of Nebraska—Lincoln, 104E Avery Hall, Lincoln, NE 68588-0115, USA
4
GC Image LLC, P.O. Box 57403, Lincoln, NE 68505-7403, USA
5
Max Rubner-Institut, Federal Research Institute of Nutrition and Food, Department of Safety and Quality of Fruit and Vegetables, Haid-und-Neu-Straße 9, 76131 Karlsruhe, Germany
*
Author to whom correspondence should be addressed.
Appl. Sci. 2021, 11(2), 525; https://doi.org/10.3390/app11020525
Submission received: 12 December 2020 / Revised: 28 December 2020 / Accepted: 4 January 2021 / Published: 7 January 2021
(This article belongs to the Special Issue Analysis of Chemical Biomarkers and Contaminants in Food)

Abstract

:
This study focuses on the detectable metabolome of high-quality raw hazelnuts (Corylus avellana L.) and on its changes after dry-roasting. Informative fingerprinting was obtained by comprehensive two-dimensional gas chromatography with fast-scanning quadrupole mass spectrometry (GC×GC-qMS) combined with dedicated data processing. In particular, combined untargeted and targeted (UT) fingerprinting, based on pattern recognition by template matching, is applied to chromatograms from raw and roasted samples of Tonda Gentile Trilobata and Anakliuri hazelnuts harvested in Italy and Georgia. Lab-scale roasting was designed to develop a desirable organoleptic profile matching industrial standards. Results, based on 430 peak features, reveal that phenotype expression is markedly correlated to cultivar and pedoclimatic conditions. Discriminant components between cultivars are amino acids (valine, alanine, glycine, and proline); organic acids (citric, aspartic, malic, gluconic, threonic, and 4-aminobutanoic acids); and sugars and polyols (maltose, xylulose, xylitol, turanose, mannitol, scyllo-inositol, and pinitol). Of these, alanine, glycine, and proline have a high informational role as precursors of 2-acetyl- and 2-propionylpyrroline, two key-aroma compounds of roasted hazelnuts. Roasting has a decisive impact on metabolite patterns—it caused a marked decrease (−90%) of alanine, proline, leucine and valine, and aspartic and pyroglutamic acid and a −50% reduction of saccharose and galactose.

Graphical Abstract

1. Introduction

Roasting is a key technological step for hazelnut industrial transformation that yields distinctive flavors, color, and crunchy texture. It triggers a complex array of many different chemical reactions, mainly involving major constituents—carbohydrates, proteins, free amino acids, and fats [1,2,3,4,5,6]. Carbohydrates are subjected to dehydration, caramelization, and hydrolysis; amino acids and thermo-labile vitamins are degraded; and proteins can decompose or polymerize by cross-linkage between reactive functionalities. Moreover, the high temperatures adopted during roasting impact the integrity of oleosomes (reserve bodies of lipids in raw hazelnuts) and reduce oxidative stability [7]. Lipid oxidation contributes to the formation of reactive carbonyl compounds (in particular, glyoxal and methylglyoxal).
Furthermore, reducing sugars and polyols can react with amino acids and free amino groups forming Amadori and/or Heyns products within the first stages of the Maillard reaction [8]. The evolution of Maillard reaction forms more stable, moderately to highly polar, and volatile compounds, such as carbonyl derivatives (ketones and aldehydes), alcohols, acids, esters, lactones, and sulfur derivatives, together with many heterocycles (furans, pyrazines, pyrroles, thiophenes, pyridines, thiazoles, and oxazoles), aromatic compounds and phenols responsible for major aroma notes of roasted hazelnuts. At the same time, high-molecular-weight products characterized by a brown color (melanoidins) are formed, contributing to the final color of the product.
Texture changes during roasting are due to microstructure modification. Indeed, the roasting leads to thermal degradation of the middle lamella, one element of the cell wall composed of pectic compounds responsible for connecting cells. Consequently, cellular and intercellular spaces become larger, causing an increase in crispness and crunchiness.
Few studies have been devoted to a comprehensive understanding of the impact of dry-roasting on the detectable metabolome of raw hazelnuts. The existing literature covers specific fractions of interest while applying dedicated/targeted methodologies to profile primary metabolites (amino acids, sugars, organic acids, fatty acids, amines, etc.) or specialized metabolites (formerly defined as “plants secondary metabolites”) with known bio-activity (e.g., antioxidants), nutritional role, or organoleptic profile (e.g., tastants and astringent compounds). Of these, Ozdemir et al. [9] evaluated changes in total amino acids, thiamine, and riboflavin contents; peroxide value; and free fatty acids profiles in roasted Giresun and Akçakoca hazelnuts. The authors demonstrated a meaningful decrease on all tested parameters with a marked reduction of riboflavin level (−30%) in hazelnuts from the Akçakoca region of Turkey and of thiamine level (−50%). Within the group of nutritionally relevant amino acids, lysine (Lys) diminished <−6% in roasted Giresun hazelnuts but −31% in Akçakoca hazelnuts. Alasalvar et al. [10] screened eighteen native hazelnut varieties from the Giresun province of Turkey for their sugars, organic acids, condensed tannins, and free phenolic acids profile. Fructose, glucose, sucrose, myo-inositol, raffinose, and stachyose ranged from 1.99 g/100 g to 4.94 g/100 g among the considered samples. Organic acids (oxalic, maleic, citric, malic, lactic, succinic, and acetic) ranged between 0.96 g/100 g to 2.72 g/100 g, while gallic acid was between 0.159 mg/100 g and 0.871 mg/100 g. The authors observed that roasting brought significant losses (p < 0.05) of both condensed tannins (−97%) and gallic acid (−67%), whereas its effect on sugars and organic acids was not noteworthy.
In a study aimed at evaluating the impact of different roasting conditions on phenolic compounds, Schmitzer et al. [11] revealed a marked decrease of all individual phenolics, with the exception of gallic acid while confirming the presence of flavan-3-ols (catechin, epicatechin, 2 procyanidin dimers, and 3 procyanidin trimers), flavonols (quercetin pentoside, quercetin-3-O-rhamnoside, and myricetin-3-O-rhamnoside), hydrobenzoic acids (gallic acid, protocatechuic acid), and phloretin-2′-O-glucoside (dihydrochalcone class). Nevertheless, the authors evidenced that roasting did not impact the total phenolic content (TPC) and antioxidative potential of kernels. These results are in accordance with those obtained by Belviso et al. [12], who monitored the TPC and antioxidant activity along shelf-life. The effects of roasting on proanthocyanidins were studied by Lainas et al. [13], who compared the content of extractable and bound proanthocyanidins of raw and roasted Turkish Tombul hazelnuts. In raw hazelnuts, extractable proanthocyanidins fraction was 81% of the total phenolic fraction with the presence of oligomers (4–9 mers) and polymers (≥10 mers), whereas in roasted hazelnuts, extractable moieties were only monomers to trimers. This variation, likely related to skin loss during roasting, was accompanied by a higher recovery of dimers, trimers, and tetramers after alkaline hydrolysis of roasted hazelnut skins.
Amaral et al. [14] focused on the lipid fraction and revealed just minor changes in fatty acid and triacylglycerol compositions. After intense roasting conditions (165–200 °C for 15 min on average), the authors observed a slight increase of oleic acid, saturated fatty acids, and triacylglycerols containing oleic acid moieties; and a decrease of linoleic acid, phytosterols (maximum 14.4%), and vitamin E homologues (maximum 10.0%). Negligible amounts of trans fatty acids also were detected.
Of the studies focused on the effect of roasting in the development of characteristic brown color, Fallico et al. [15] evaluated the role of fat fraction, hexanal, and saccharose in color development and hydroxymethylfurfural (HMF) formation. HMF levels were highest in hazelnuts with the deepest browning; the lowest HMF and brown color were correlated to lower fat content (or defatted) samples. Arlorio et al. correlated color and D- amino acids distribution, proposing a complex mathematical model (Back Propagation Neural Network on the Discrete Fourier Transform output of the whole surface color) to predict the occurrence of toxic compounds.
The present study was designed to cover gaps for a more comprehensive understanding of the impact of roasting on the detectable metabolome of hazelnuts and on different hazelnut cultivars and harvest regions. The approach takes inspiration from food metabolomics [16,17,18,19] principles and exploits the information potential of multidimensional analytical (MDA) platforms that combine techniques for physicochemical discrimination/separation (e.g., gas chromatography GC) of analytes with spectroscopic detection (e.g., mass spectrometry MS).
MDA technologies enable comprehensive untargeted investigations and provide a larger number of features (i.e., aggregated information for pattern recognition) that, by suitable chemometrics, give access to higher-level information [20]. Characteristic and/or discriminant patterns of chemicals might inform on: (a) food sensory quality and spoilage [4,21,22,23]; (b) the impacts of environmental conditions on plant phenotype [24,25,26,27,28] and metabolome expression [29,30]; (c) the qualities and diagnostic roles of fat fractions [31,32]; and (d) the impact of harvesting and storage practices [19,33,34].
To be truly useful, an “untargeted” approach should detect and monitor as many features as possible by annotation and tracking across multiple samples [35,36]. It is conceptually in contrast to purely “targeted” strategies, that, a priori, define a limited number of known analytes and therefore provide limited information with regard to the total composition of a sample.
Based on preliminary results obtained by exploring the distribution of the detectable metabolome in hazelnuts of different cultivars/origins [37], this study makes a step forward in examining the impact of roasting, as an additional yet fundamental variable/process on the chemical signature of primary metabolites in hazelnut kernels. Quali-quantitative variations on known and unknown features/analytes are tracked using chromatographic fingerprinting based on peak features and template matching algorithms.
In particular, the approach known as combined untargeted and targeted (UT) fingerprinting [23,37,38,39] was applied to raw hazelnuts from the Tonda Gentile Trilobata cultivar (Protected Geographical Indication PGI) harvested in Piedmont (Italy) or Georgia, and from the Anakliuri cultivar, native to Georgia. Raw hazelnuts were submitted to lab-scale dry-roasting in a ventilated oven under time/temperature conditions tuned to develop the desired flavor and crunchy texture. A more intense roasting was also applied to exacerbate thermal stress and capture metabolites variations under even more drastic conditions.

2. Materials and Methods

2.1. Reagents and Chemicals

Methanol and ethanol (GC grade) were purchased from Merck (Darmstadt, Germany). Heptane (>99.0%) and pyridine (>99.5%) were from Carl Roth (Karlsruhe, Germany). N-methyl-N-(trimethylsilyl)trifluoroacetamide (MSTFA) with 1% trimethylchlorosilane (TMCS) was supplied by Macherey-Nagel (Düren, Germany). O-Methoxylamine hydrochloride was purchased from Chemos (Regenstauf, Germany). Internal standards, as well as standards used for identity confirmation of amino acids and sugars, were commercially acquired from Sigma-Aldrich (Steinheim, Germany), Carl Roth (Karlsruhe, Germany), ABCR (Karlsruhe, Germany), Merck (Darmstadt, Germany), TCI (Zwijndrecht, Belgium), Alfa-Aesar (Ward Hill, MA, USA), and ChromaDex (Irvine, CA, USA). All standards had a minimum purity of 95%.

2.2. Hazelnut Samples and Roasting Conditions

Commercial grade samples of raw hazelnuts (Corylus avellana L.), with a uniform caliber of 13–14 mm and harvested in 2017, were supplied by Soremartec Italia Srl (Alba, Cuneo, Italy). They were from different geographical areas: (a) cultivar Nocciola Gentile Trilobata (T), harvested in Piedmont (Italy—IT) and Georgia—GE, and (b) cultivar Anakliuri (AN), native to and harvested in Georgia along the Black Sea West coasts.
Two post-harvest drying regimes were used: (a) conventional in-shell drying, after de-husking, for the Anakliuri cultivar, in-field at 35–38 °C (E1) or (b) industrial processing by artificial dryers operating at 18–20 °C (E2). Drying achieved a final kernel humidity of 6%, a condition that keeps the product stable throughout its shelf-life. Before shipping to the laboratory, kernels were stored in (a) controlled conditions keeping the equilibrium relative humidity (ERH) at 65% (Controlled—C) or (b) without any stabilization of relative humidity (Uncontrolled—U). Post-harvest treatments were conducted by the R&D Raw Materials Department of Soremartec Italia Srl (Alba, Cuneo, Italy).
Raw hazelnuts were manually cut in half to check their quality, then put in liquid nitrogen in order to perform ball milling (model MM 400, Retsch, Haan, Germany) at 18 Hz for 10 s. After that, milled hazelnuts were stored in 40 mL glass vials at −18 °C until analysis.
Lab-scale roasting was carried out on a traditional ventilated oven by two different time-temperature protocols:
  • 180 °C for 10 min, to obtain optimally-roasted hazelnuts, in terms of flavor and color (roasted—R). These conditions were optimized to obtain full and balanced development of major key-odorants [6] and roasting markers [2,3].
  • 200 °C for 10 min for a higher level of roasting (over-roasted—OR).
After roasting, hazelnuts were left to reach ambient temperature and ball-milled at 14 Hz for 5 s.
Quality control samples (QC) for response normalization were prepared by mixing 1.00 g of each sample and then carefully mixed to obtain a homogeneous powder.
Table 1 summarizes the samples’ characteristics and notations used in the text.

2.3. Primary Metabolites Extraction and Derivatization

2.3.1. Primary Metabolites Micro-Scale Extraction

An aliquot of 0.020 g of hazelnuts was placed in a 2 mL glass vial and extracted by 750 µL of CH3OH with the addition of 20 µL of an internal standards mixture containing hexylamine (5 mM), 1-O-methyl-2-desoxy-D-ribose (5 mM), 2-chlorophenylacetic acid (3 mM), p-chloro-L-phenylalanine (2.5 mM), D–pinitol (5 mM), 3-O-methyl-D–glucopyranose (1 mM), 5-bromo-2,4-dihydroxybenzoic acid (1 mM), and phenyl-β-D-glucopyranoside (1 mM) in ethanol/water (1:1 v/v). Then, the sample was incubated for 10 min at 25 °C, shaken (1400 rpm), and centrifugated for 5 min at 4 °C at 16,100× g. After that, 700 µL of the supernatant were transferred into new 2 mL reaction tubes with the addition of 700 µL of n-hexane and 50 µL of water, for effective phase separation and fat removal. All described steps, after methanol extraction, were repeated twice. Finally, 40 µL of the collected extracts were dried in a rotary vacuum concentrator under a validated protocol [33]:
  • 1 h at 40 °C and p < 1 mbar;
  • addition of 15 µL of methanol for re-dissolving samples;
  • 30 min at 40 °C and p < 1 mbar.

2.3.2. Derivatization

Methoximation was performed by adding 20 µL of methoxylamine-hydrochloride in pyridine (20 mg/mL) to the dried extracts and then incubated for 1 h at 40 °C and 1400 rpm in a shaker. Silylation occurred by adding 70 µL of MSTFA with 1% TMCS followed by incubation for 1 h at 65 °C in static conditions.
For identity confirmation of primary metabolites, 1.00 mL of primary metabolites standards mixture (listed in Section 2.1) was submitted to the derivatization procedure and analyzed under conditions described in Section 2.4 and Section 2.5.

2.4. Comprehensive Two-Dimensional Gas Chromatography-Quadrupole Mass Spectrometry Instrument Set-Up and Experimental Conditions

Primary metabolome analyses were carried out on a GC×GC-qMS system, consisting of a GC coupled with a fast-scanning quadrupole Mass Spectrometer (QP2010 Ultra, Shimadzu Corp, Kyoto, Japan) and an AOC-20i/s autosampler (Shimadzu Corp, Kyoto, Japan). Cold split injection (split 1:3) used an OPTIC4 system (GL Sciences, Eindhoven, The Netherlands).
The modulation system was a loop-type cryogenic modulator, ZX2 (Zoex Corporation, Houston, TX, USA), cooled by a closed-cycle refrigerator/heat exchanger.
The MS acquisition (Scan mode, EI 70 eV) parameters were set as follows: mass range 60–550 m/z, data rate 33.3 Hz, and solvent delay 12.1 min. The detector voltage was time-programmed to ensure a sufficient signal intensity of low-abundance metabolites and, at the same time, avoid spectral distortion of major metabolites; for example, C18 fatty acids and sucrose. For this purpose, the following schedule was used: 0 min: 1.35 kV; 24.7 min: 1.15 kV; 25.19 min: 1.35 kV; 63.67 min: 1.15 kV; 65.30 min: 1.30 kV; 75.20 min: 1.15 kV; 75.77 min: 1.30 kV; 82.52–90.0 min: 1.15 kV. The ion source was set at 200 °C and the transfer line at 280 °C.

2.5. GC×GC Columns and Settings for Primary Metabolites Profiling

The column set was configured as follows: first dimension (1D) Rxi-5SilMS (95% polydimethylsiloxane, 5% phenyl), 60 m × 0.25 mm dc, 0.25 μm df (Restek Corporation, Bellefonte, PA, USA); and second dimension (2D) BPX50 column (50% phenyl methylpolysiloxane), 2.2 m × 0.15 mm × 0.15 µm (Trajan Scientific and Medical, Ringwood Victoria, Australia). The length of the effective 2D (after the loop) was 1.0 m. Columns were connected by a SilTite™ MiniUnion (Trajan Scientific and Medical, Ringwood Victoria, Australia).
The carrier gas was helium at a constant linear velocity with an initial column head pressure of 214.0 kPa. The oven temperature program was from 75 °C to 160 °C @2.5 °C/min, then @3.0 °C/min to 290 °C, @10 °C/min to 330 °C (hold 8.67 min). The injection volume was 1 μL. Injector temperature was ramped from 90 °C to 280 °C immediately after injection at 60 °C/min.
Modulation parameters were as follows: modulation period (PM) 2.7 s, cold-jet temperature −90 °C with a hot-jet pulse duration of 200 ms. The hot-jet temperature was programmed in a step-wise fashion: 0–20 min: 200 °C; 20–50 min: 250 °C; 50–65 min: 300 °C; 65–70 min: 350 °C; 70–89 min: 380 °C; at 89 min: cooldown to initial temperature (200 °C).
Each sample was injected once, without replicates. Extraction and derivatization efficiency were verified by monitoring internal standards’ (Section 2.3.1) responses. The measurement was organized in four day-wise batches. Injection repeatability and instrumental response stability were checked by QC analyses [18]. Six QC samples were freshly prepared/derivatized and injected at the beginning and the end of the daily batch (two consecutive QCs) as well as after each block of three study samples (single QCs). Within these blocks, study samples were measured in randomized order. At the beginning of each day, after the first QC twin injection, a reagent blank spiked with retention index markers (C7–C30 saturated Fatty Acids Methyl Esters—FAMES) to determine background levels of known reagent artifacts and contaminants and to define retention indices was injected [18].

2.6. Chromatographic Fingerprinting by Peak Features Alignment across Chromatograms

To comprehensively map the detectable metabolites signatures of hazelnut, data processing was based on a workflow developed to track untargeted and targeted components across multiple chromatograms. The process is termed UT fingerprinting [38] and was validated for complex fractions of volatiles [29,39,40,41] in biological fluids metabolomics [42,43,44] and food metabolomics [30,37]. It performs untargeted and targeted pattern recognition of individual 2D peaks by template matching algorithms [45].
The UT fingerprinting work-flow included four major steps:
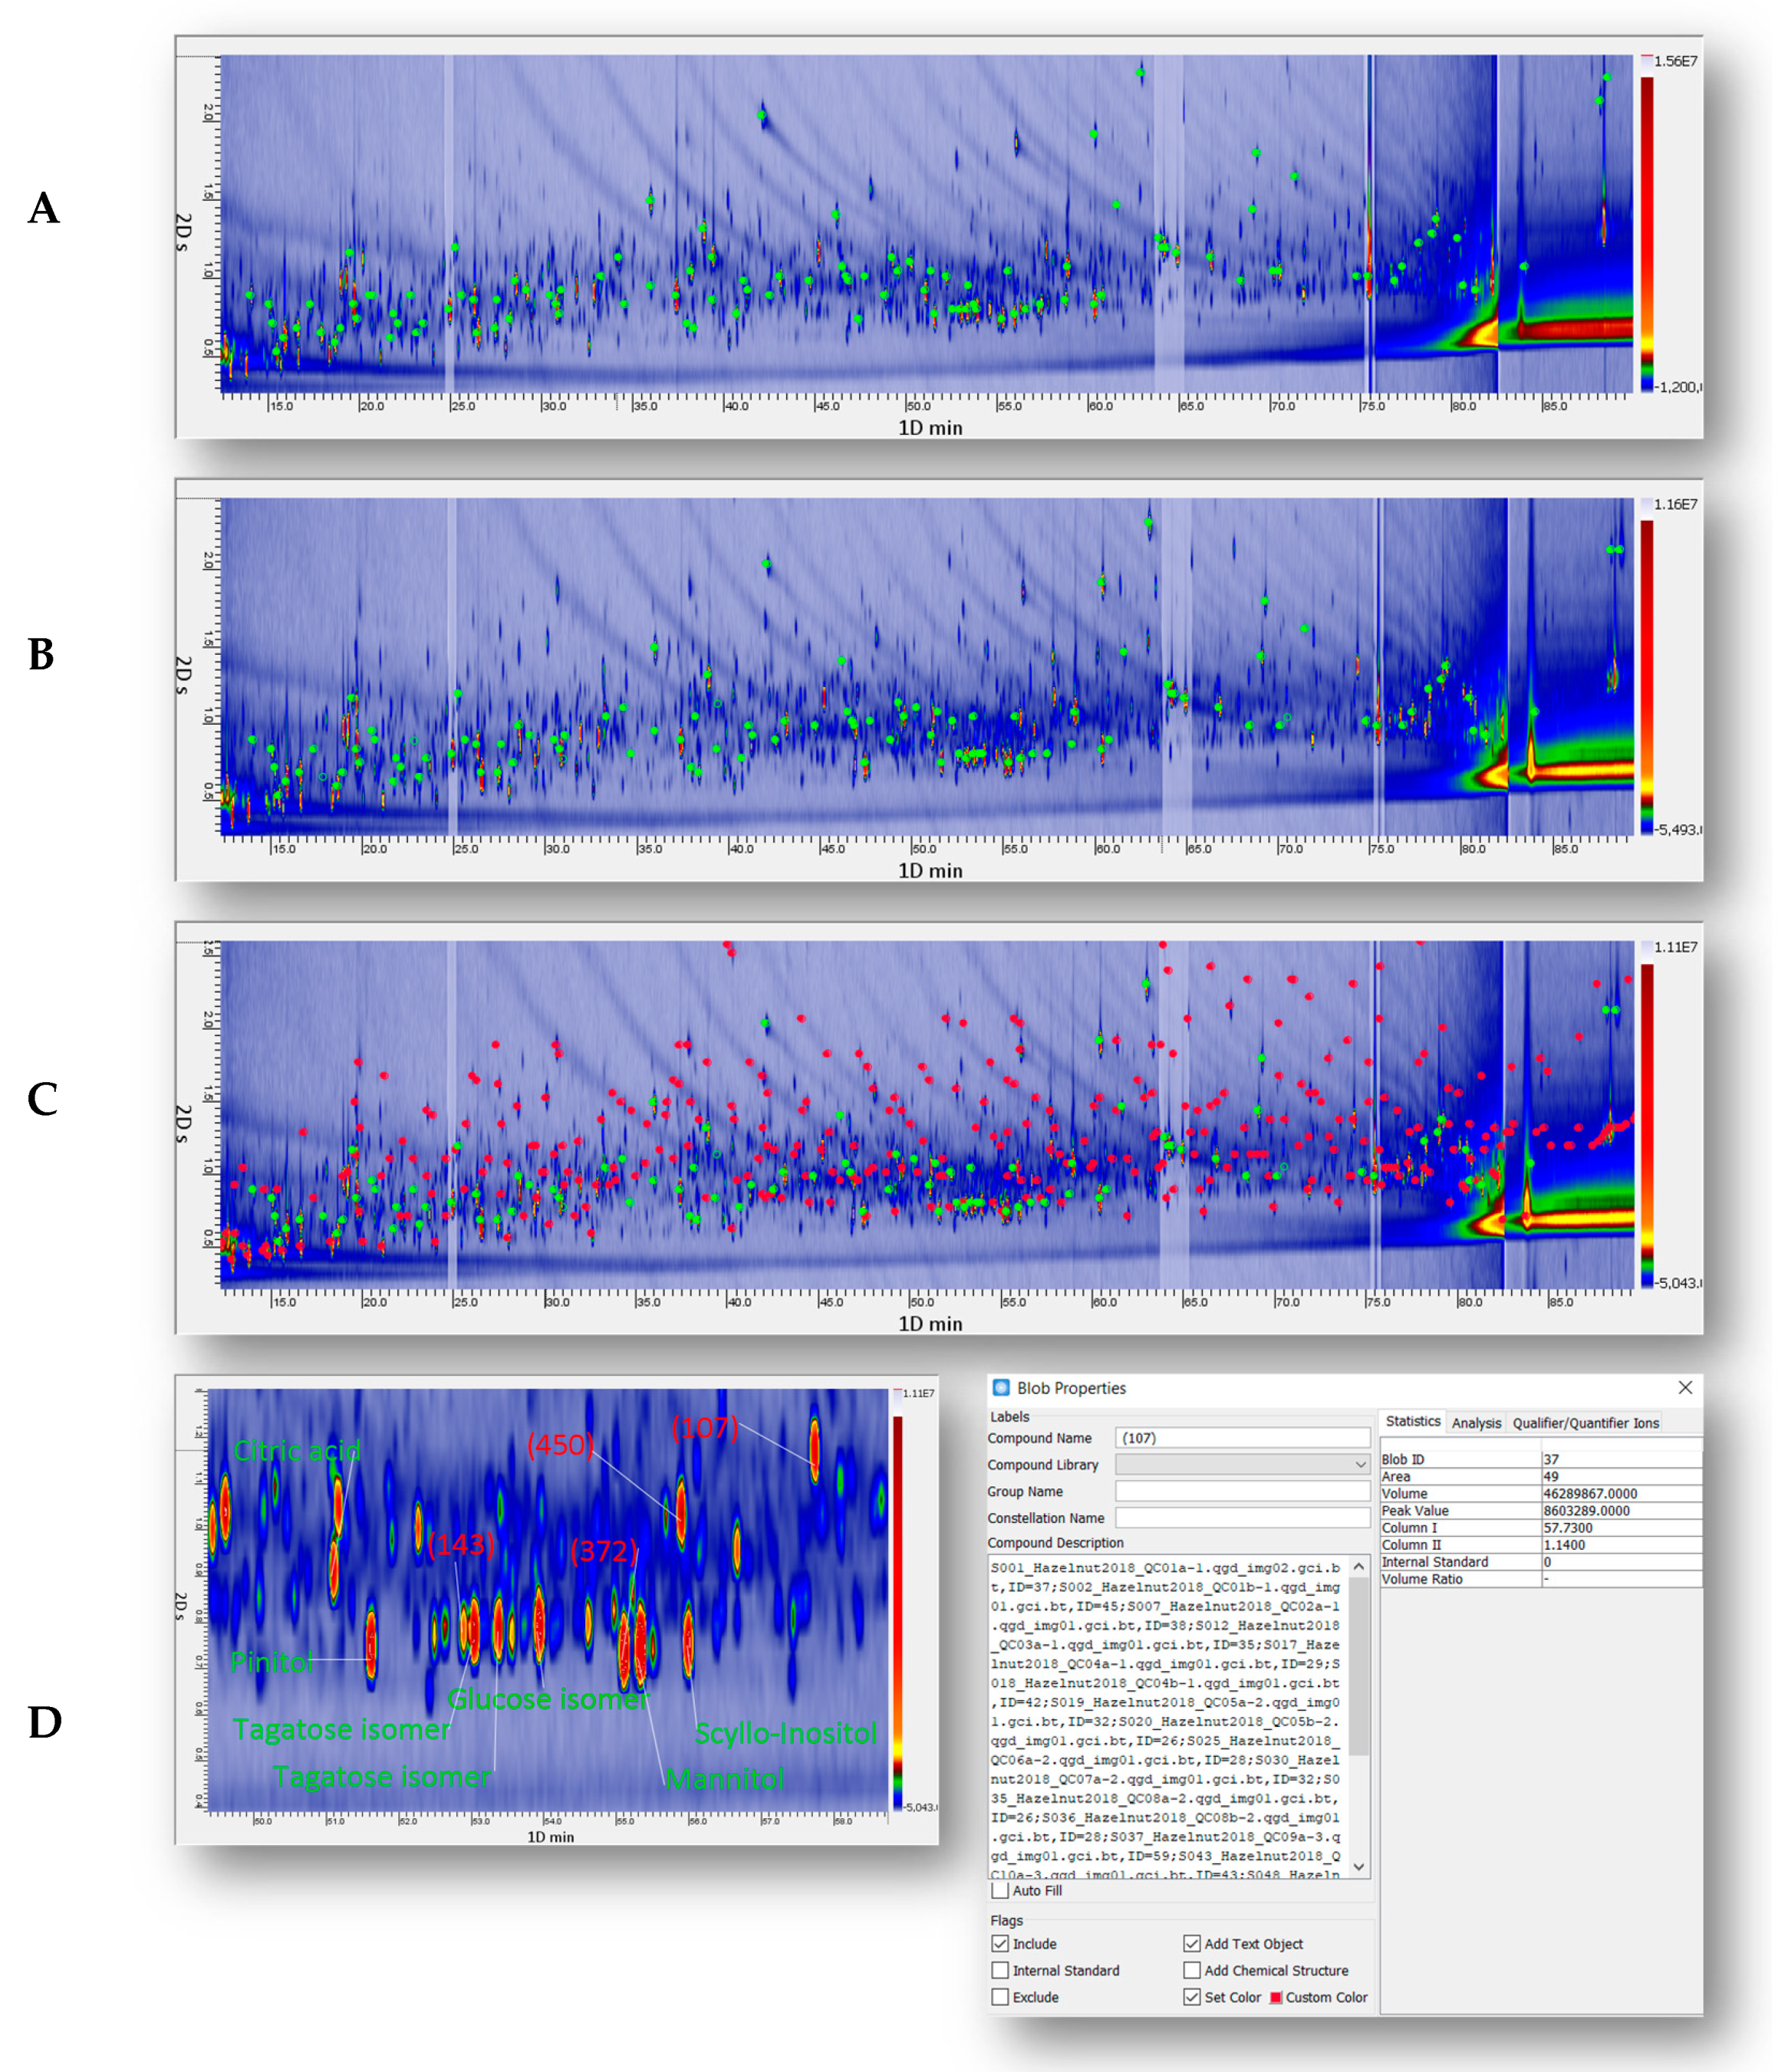
  • Step-1: Individual chromatograms were imported by the data processing software (GC Image, GC Image LLC, Lincoln, NE, USA), rasterized according to the PM, and pre-processed for baseline subtraction and peak detection. The detection threshold was set at 150 S/N, as previously validated [23].
  • Step-2: The untargeted feature template was created by a dedicated program of the GC Image suite (i.e., Image Investigator™) by cross-matching peak templates from all analyzed chromatograms (24 QCs + 36 samples). After re-alignment of 2D-peak patterns, peaks that consistently matched across all-but-one chromatograms were annotated as reliable peaks and included in the feature template. For peak matching a spectral similarity direct and reverse match factors (DMF and RMF) constraint was applied with the NIST (National Institute of Standards and Technology) similarity algorithm [46] using threshold values ≥ 750 [23].
  • Step 3: After feature template generation, the template was pruned by removing solvent peaks, column(s) bleed, and interferents, before proceeding with peaks targeting. Compounds targeting was a supervised process that made putative identifications from an MS library based on spectral similarity [46] using threshold values DMF ≥ 900, RMF ≥ 930, and 1D retention-index (IT) coherence (IT ± 15 units).
At this point, the feature template combined untargeted and targeted features—i.e., a UT template. Untargeted peaks correspond to reliable peaks defined at Step-2 but that remained unidentified applying the criteria of Step-3. Targeted peaks are those reliable peaks putatively identified at Step-3.
  • Step 4: The UT feature template was then matched to each sample chromatogram thereby recognizing re-aligned peak features, which were exported for further data elaboration. The output was a data matrix of UT peaks together with 1D and 2D retention times (1tR, 2tR), compound names for target analytes, fragmentation spectra, selected ions responses, total ions response, etc.

2.7. Method Performance Parameters

Method performance parameters were evaluated on replicated injections of QC samples. Intermediate precision on retention times and targeted peaks’ % response were estimated by calculating % relative standard deviation (% RSD). Results are reported in the Supplementary Table S1. Analytes’ % response was calculated on the total ion current (TIC) signal by the processing software on the basis of peak volumes normalized to the total response from all UT peaks excluding interfering compounds and column bleeding [47].
Retention times in both chromatographic dimensions (1tR and 2tR) were collected from targeted peaks on 24 QC analytical runs across all working days. Results are listed in Supplementary Table S1. A quite good retention time stability was achieved with an average % RSD of 0.05 for 1tR and 1.56 for 2tR. Response repeatability was 20.6% on average, with a median of 18.4%.

2.8. Data Acquisition, 2D Data Processing, and Statistical Analysis

GC×GC data were acquired by GCMS Solution version 4.11 (Shimadzu Deutschland GmbH, Duisburg, Germany) and processed by GC Image GC×GC Edition, ver 2.9 (GC Image, LLC, Lincoln, NE, USA). Data elaboration and results visualization were conducted by using XL-Stat (Addinsoft Inc., New York, NY, USA) and Gene-E (Broadinstitute.org).

3. Results and Discussion

3.1. Mapping Hazelnut Metabolome by Chromatographic Fingerprinting

The term “fingerprinting” has been described for metabolomics [48,49] and refers to analytical processes capable of unraveling compositional differences between samples. Although spectroscopic techniques, e.g., mass spectrometry (MS), nuclear magnetic resonance (NMR), and Fourier transform infrared spectroscopy (FTIR), have been used for years in metabolomic fingerprinting, modern MDA platforms offer further possibilities to exploit the concept of fingerprinting [20].
In fact, 2D peak patterns generated by comprehensive two-dimensional gas chromatography (GC×GC) can be considered as a sample’s distinctive fingerprint, and the detected compounds as minutiae features to be annotated and tracked across multiple samples. The term “minutiae” derives from biometric fingerprinting used in forensic science [50], therein indicating ridge endings and bifurcations on fingertips whose relative position is unique in each individual. Just as for automatic biometric fingerprinting, the localization and extraction of analytical (meta)data from 2D peak pattern features of single chromatograms enable effective cross-comparisons with an intrinsic potential of deepening the knowledge on chemical composition and components distribution. The adoption of MS detection adds orthogonal information about analytes’ identities, through distinctive spectral signatures, and amounts (relative or absolute).
In this study, chromatographic fingerprinting was applied by comprehensively extracting peak features information (i.e., summed data for each component peak with associated metadata) including for untargeted and targeted components. To enable effective cross-comparative analysis, peak features pattern matching across multiple chromatograms was guided by mass spectral similarity with DMF ≥ 800 [23,51] and a second-order-polynomial retention-times transformation [52,53]. For targeted components, the approach explicitly matches corresponding peak-features across chromatograms by the target name. For untargeted components, the software matches unidentified peaks across chromatograms by peak tracking and assigns unique identifiers (#n) based on reliable re-alignment of the data.
Figure 1A shows the pseudocolor image corresponding to a QC sample with targeted peak features highlighted by green circles. Of the 1000, on average, detectable 2D peaks above a response threshold of 50 signal-to-noise ratio (SNR), 80 components were identified by an electron ionization (EI) fragmentation pattern DMF above 900 and IT within a tolerance of ±15. Where possible, putative identifications were confirmed by authentic standards available in authors’ laboratories.
Figure 1B highlights both the untargeted (red circles) and targeted (green circles) peak features. Untargeted peak features were consistently extracted after template-based alignment and cross-matching. The process is detailed in the Materials and Methods Section 2.6 and supported by pertinent literature for those interested in its application. Untargeted components (red circles) accounted for 334 2D peaks.
Table 2 lists targeted (T) components together with their average retention times (1tR min, 2tR sec), experimentally determined 1D IT values, and tabulated retention indices (NIST database [54]). Supplementary Figure S1 illustrates the UT peaks % response distribution across all samples by heat-map and Hierarchical Clustering based on Pearson correlation. Data was log-normalized before computation.
The primary metabolome coverage was extensive and very informative, especially in that it was possible to target 80 compounds, and in particular, 15 amino acids/derivates, 16 sugars including mono- and di-saccharides, four sugar acids, seven polyols, and 24 organic acids involved in cell metabolism.
In addition, although it was not the focus of this study, some specialized metabolites were detected, identified, and monitored, including alkaloids (i.e., tryptamine), flavan-3-ols (i.e., catechin), and phytosterols (i.e., β-sitosterol).
The high information level encrypted in this hazelnuts data, explored through a process of combined UT fingerprinting and profiling, allows a deeper understanding of the influence of both phenotypes and degree of roasting on primary metabolites patterns, as described next.

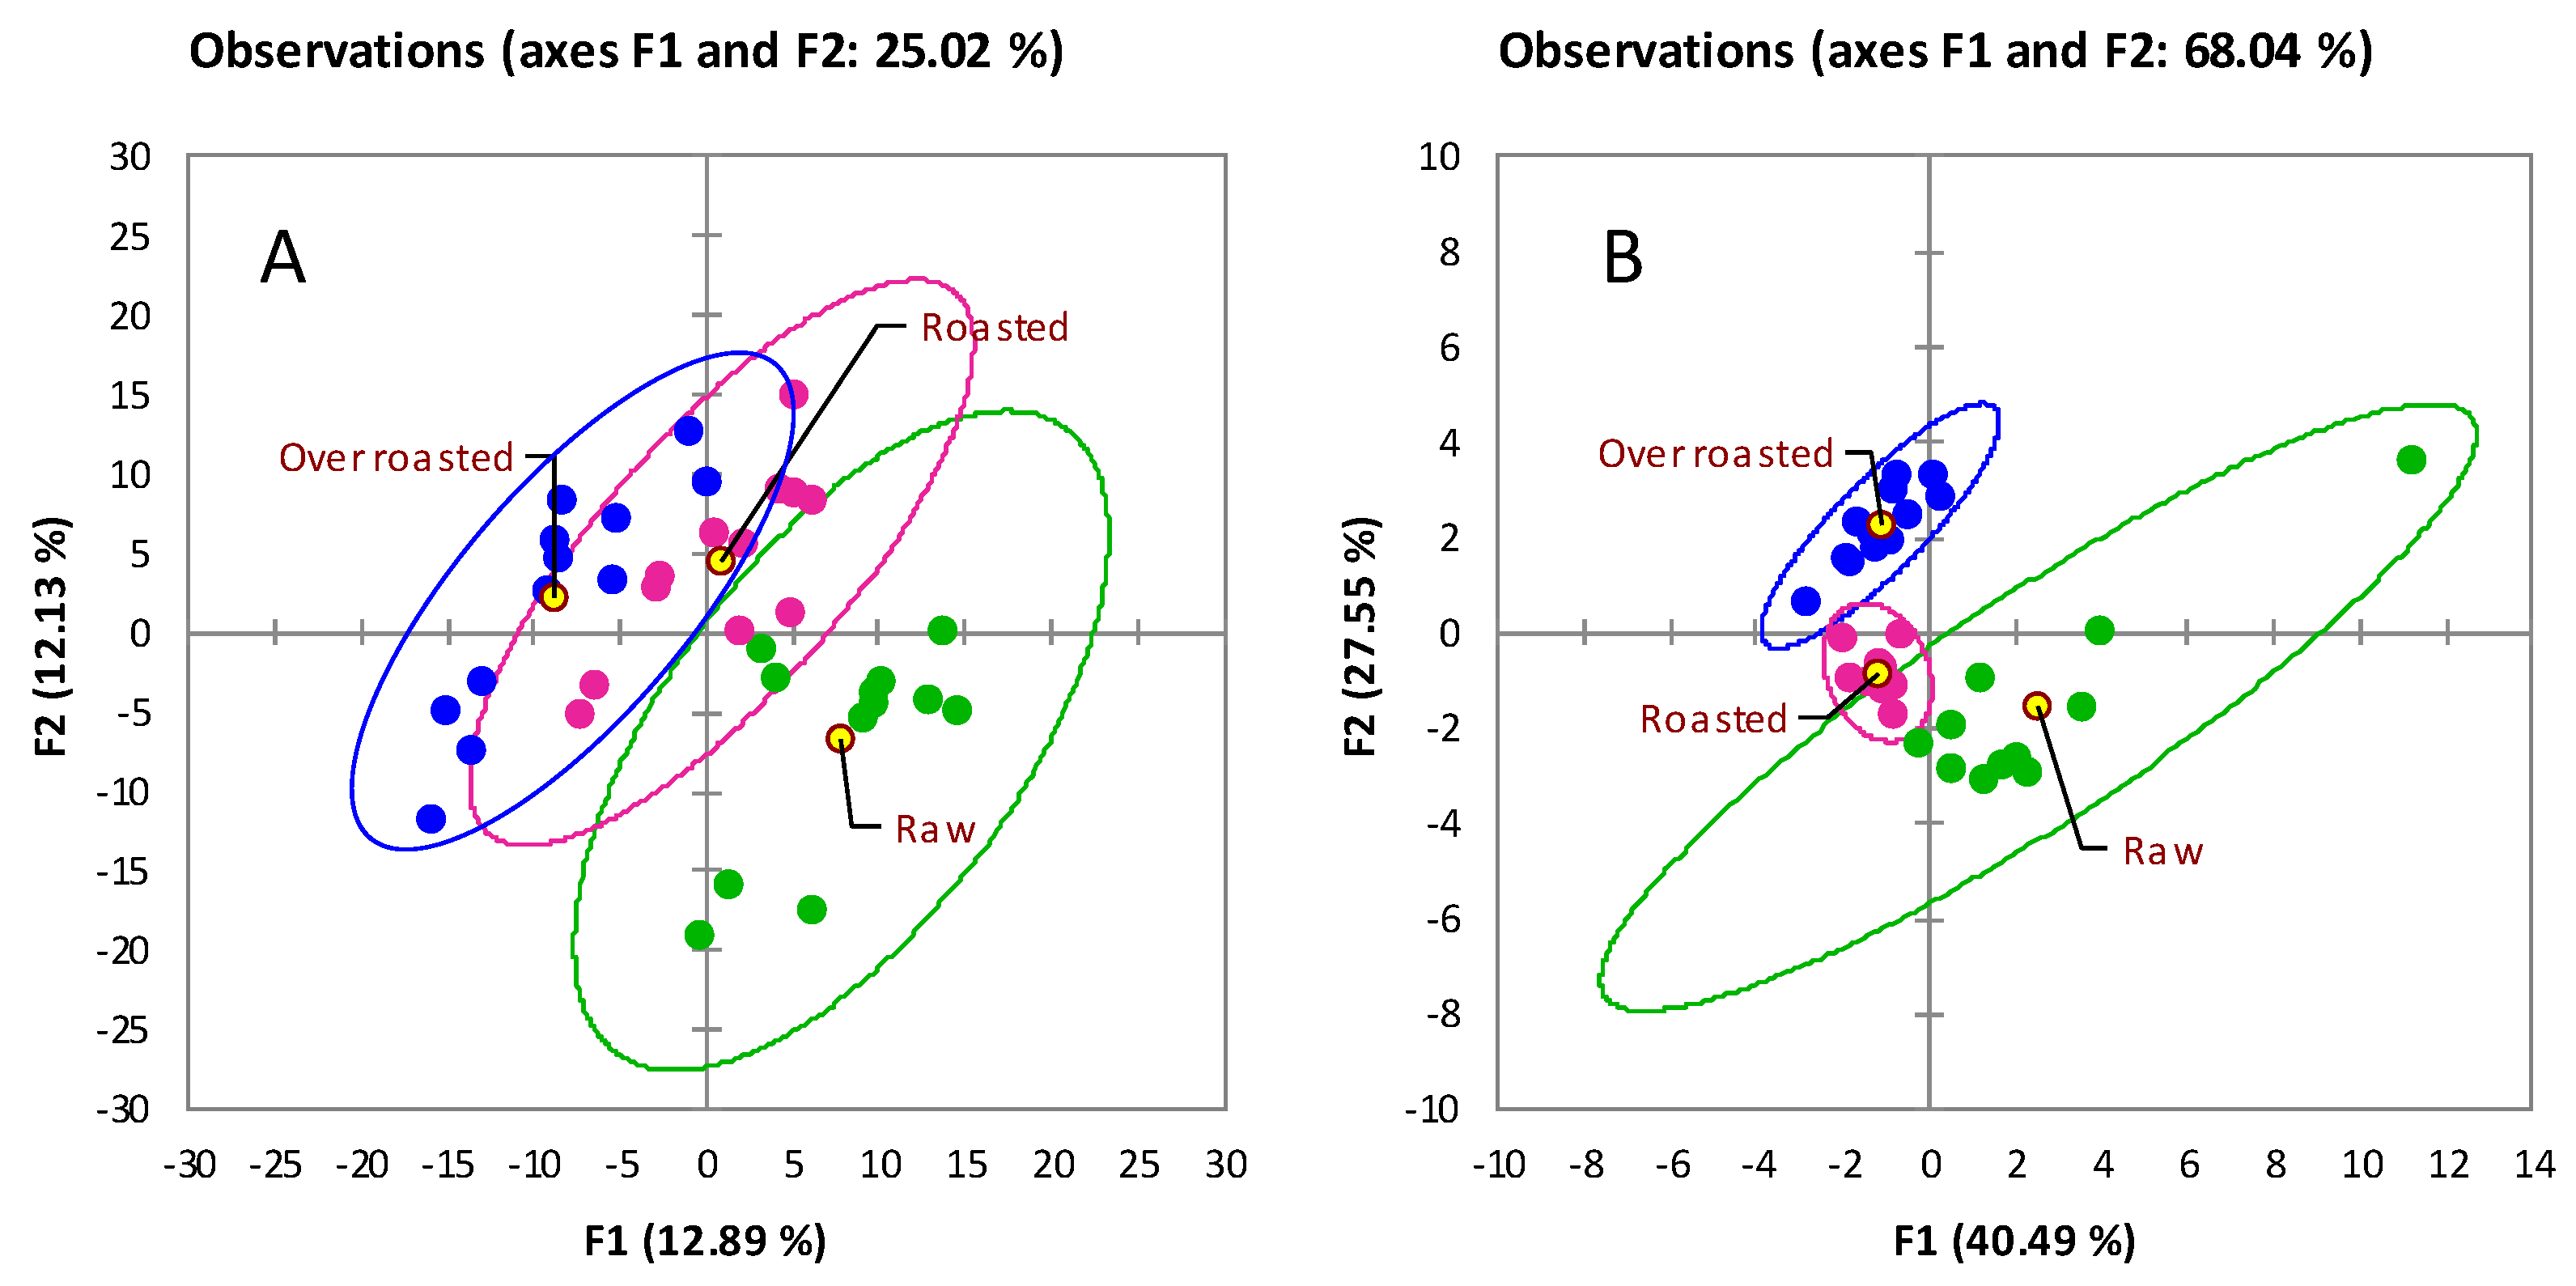
3.2. Chemical Patterns Characterizing Hazelnut Phenotype

The goal of the first pattern recognition was to evaluate the role of cultivar and pedoclimatic conditions on the metabolome expression (phenotype). In a previous study on primary metabolites signatures of high-quality hazelnuts [37], it was found that, based on this fraction, analyzed samples were independently clustered according to cultivar/origin. In particular, Piedmont (Tonda Gentile Trilobata) and Roman (Tonda Romana) hazelnuts were connoted by the greater relative abundance of several amino acids and sugars, delineating distinctive yet discriminant signatures. On the other hand, Turkish hazelnuts, from the Ordu region, were connoted by a generalized lesser amount of primary metabolites with the exception of Gly and tartaric acid. Moreover, the discrimination between Piedmont and Roman was mainly driven by glucose, galactose, maltose, and fructose, all present in higher amount in Tonda Gentile Trilobata as well as by Trp, Orn, and Tyr. In contrast, Tonda Romana hazelnuts were richer in Leu, Ile, Met, Val, Phe, Pro, and pyroglutamic acid and organic acids (lactic acid, glutaric acid, galacturonic acid, fumaric acid, tartaric acid, and oxalic acid).
In the current study, the metabolites coverage was similar; therefore, the UT data matrix, with 2D peaks % response, was submitted to hierarchical clustering (HC) and supervised exploration by partial least squares discriminant analysis (PLS-DA) to identify distinctive patterns for Tonda Gentile Trilobata vs. Anakliuri hazelnuts. Due to the concurrent presence of several confounding variables, (e.g., post-harvest drying E1 vs. E2 and storage U vs. C) observations were pre-filtered by Fisher-ratio score (F) to exclude UT features with a negligible role in discriminating the cultivar influence on the metabolome. Supplementary Figure S2 shows: (SF2A) HC based on Euclidean distances (Z-score normalization of the data) for % response with 56 UT peaks (F ≥ 4), and (SF2B) PLS-DA scores plot on targeted analytes with meaningful variations between Tonda Gentile Trilobata and Anakliuri. Results indicate that cultivar has a predominant role in the distinctive metabolites’ signatures and that the harvest region has a secondary role. Tonda Gentile Trilobata harvested in Italy form an independent cluster (cluster “a” in SF2A) while the geographical origin, although relevant in the discrimination, has a secondary role (cluster “b” in SF2A).
Within the most discriminant components, obtained by ranking the variable importance for the projections (VIPs), there were some amino acids (Val, Ala, Gly, and Pro); organic acids (citric, aspartic, malic, gluconic, threonic, and 4-aminobutanoic acids) and several sugars and polyols (maltose, xylulose, xylitol, turanose, mannitol, scyllo-inositol, and pinitol). Of them, Ala, Gly, and Pro have a high informational role since they may react with sugar degradation products (i.e., deoxyosones) within the Maillard reaction framework to form 2-acetyl and 2-propionylpyrroline, key-aroma compounds of hazelnuts [2].
Figure 2 shows univariate statistics, by box-plot visualization, for informative targets and their relative distribution in different samples. Pro and Ala, whose meaningful variations were discriminant between the two cultivars, also have coherent trends between the two pedoclimatic regions (Italy vs. Georgia), suggesting a predominant role of the genome on phenotypic expression. Scyllo-inositol, an inositol isomer, was close to the limit of detection for Anakliuri samples, citric acid, out of the discriminant analytes, has a higher amount in Georgian hazelnuts.
Also of note, non-optimal storage conditions, conducted without relative humidity stabilization (U vs. C samples), resulted in higher amounts of several metabolites. Fructose derivatives, galactose, glucose, mannitol, erythritol, gluconic acid, succinic acid, fumaric acid, Ala, Val, and Leu showed meaningful variations (p < 0.05) between U vs. C samples. These data suggest that enzymatic (endogenous and exogenous enzymes) activation most probably occurred by inducing the release of amino acids and sugars from storage deposits and cell metabolism activation. Evidence of kernel viability was confirmed in a previous study aimed at comprehensively mapping hazelnuts volatilome along 12 months of shelf-life [55].
Concerning the impact of drying conditions (E1 and E2), it was not possible to isolate, at this stage (i.e., at time 0 on fresh hazelnuts), a clear impact of drying although it is known to be decisive for long-term storage. In this case, and up to 18 months, low-temperature drying accompanied by low-temperature storage in an inert atmosphere, enables effective inactivation of enzymes and mold/bacteria development while reducing autoxidation of fats [55].

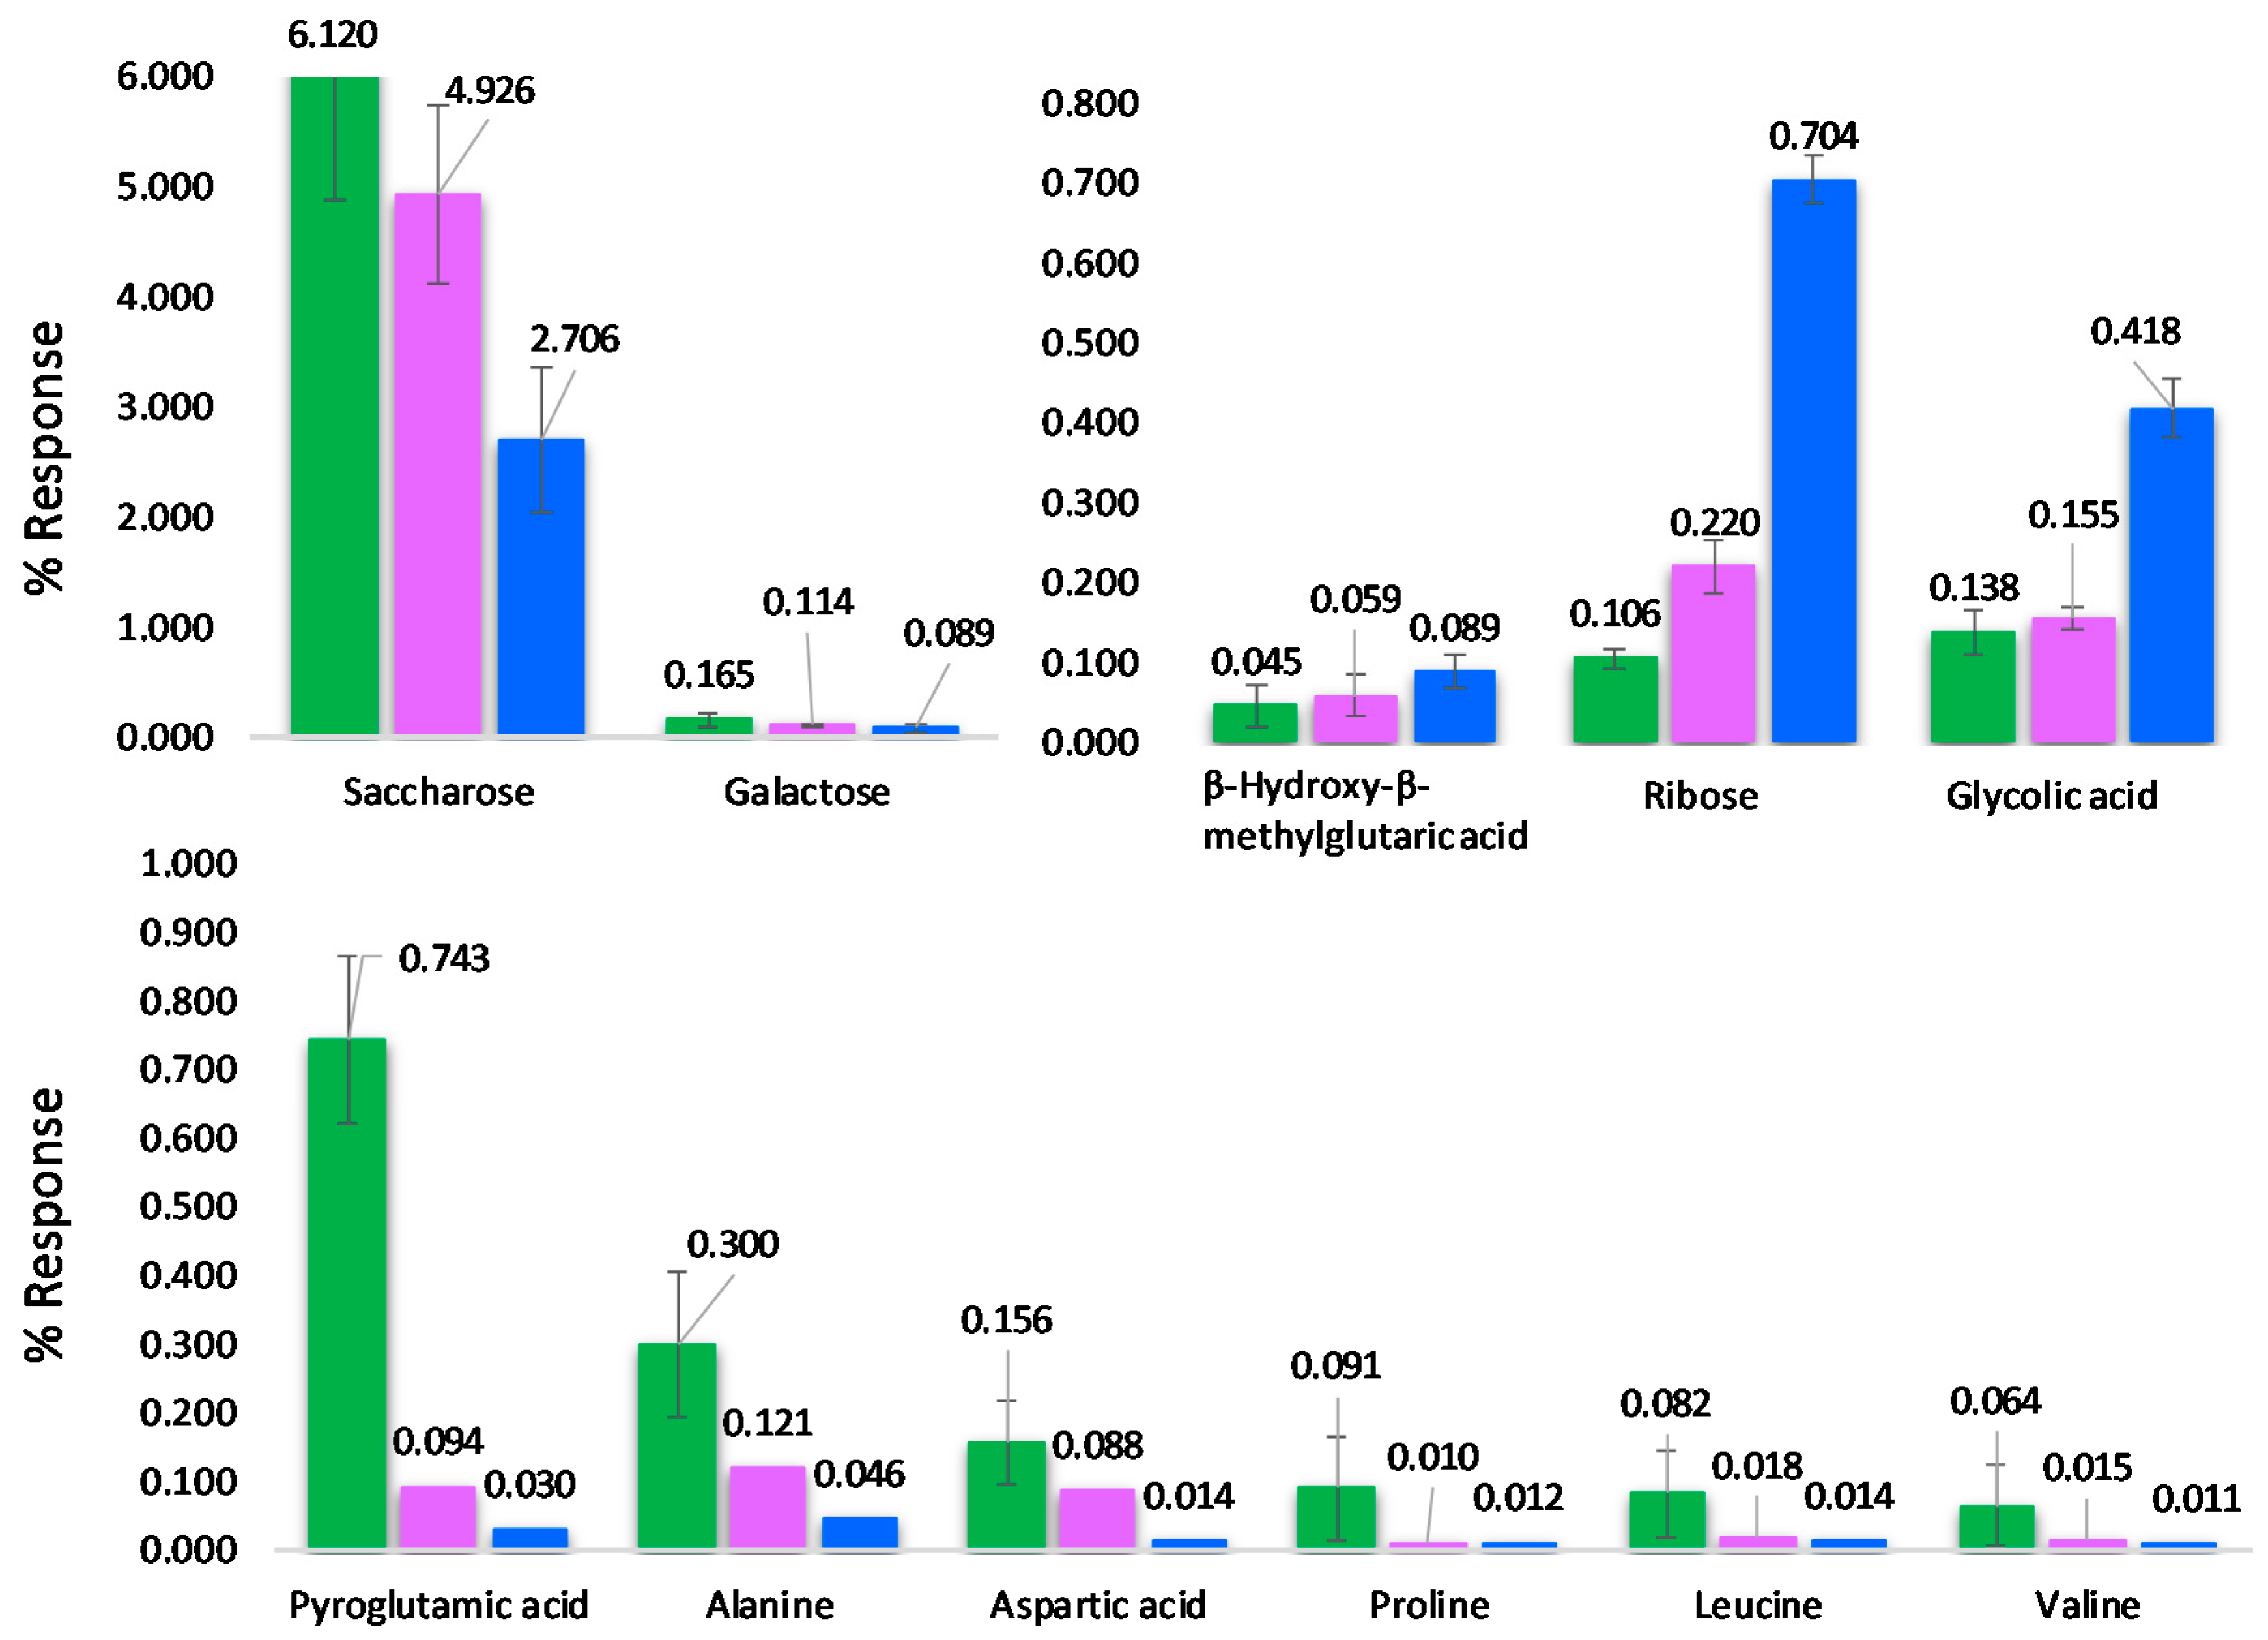
3.3. The Impact of Roasting on Primary Metabolites Patterns

Roasting, conducted in a lab-scale ventilated oven under previously optimized time/temperature conditions [55] (180 °C—0 min), enabled the development of an optimal flavor, color, and crunchy texture. Under these conditions, key-odorants showed strong negative correlations (Pearson correlation) with precursors distribution [37]. The Strecker aldehyde 3-methylbutanal was linearly correlated to Ile (R2 0.9284); 2,3-butanedione/2,3-pentanedione with fructose/glucose derivatives (R2 0.8543 and 0.8860); 2,5-dimethylpyrazine with Ala (R2 0.8822); and 1H-pyrrole, 3-methyl-1H-pyrrole, and 1H-pyrrole-2-carboxaldehyde with Orn and Ala derivatives (R2 0.8604).
In the current study, the focus was on the total detectable metabolome and not only on aroma precursors and/or on nutrients; therefore, to add a further tracking point on the roasting profile, the process was extended to reach a higher roasting temperature (200 °C—10 min), which is still acceptable for industrial applications. This “over-roasted” stage was similar to that applied in industrial transformation for “granella” (hazelnut grains) used in confectionery toppings.
The results are visualized in Figure 3A by principal component analysis (PCA) scores-plot based on % responses from all 430 UT peak features. The explained variance of the first two principal components (F1 and F2) was 25% of the total variance. However, samples appear clearly clustered according to the extent of thermal treatment.
The impact of roasting tracks along F1 (Figure 3A) and, from right to left, metabolites signatures of raw hazelnuts, green indicators, evolve to the over-roasted stage (blue indicators) with a concurrent slight decrease of the group’s internal variability as shown by confidence ellipses (95% confidence level). By tracking known metabolites along the roasting profile, those with meaningful variations across the three steps (raw, roasted, over-roasted) were reactive amino acids: Ala, Pro, Leu and Val, Asp, and pyroglutamic acid (a derivatization product of glutamic acid (Glu)). All amino acids followed a decreasing trend along roasting time with variations on % response ranging from −83% for Leu and Val to −96% for Glu. Sugars such as saccharose and galactose showed less marked decreases with −56% and −46%, respectively. Histograms in Figure 4 illustrate the % response variation for a selection of targeted analytes, with error bars corresponding to ± SD for the class.
Results are consistent with those of Ozdemir et al. [9], who reported a generalized decrease in absolute concentrations of all amino acids. Since our roasting protocol was by higher temperatures (i.e., 180–200 °C vs. 104–126 °C) the decrease of most reactive species was more marked.
When the roasting impact is examined in light of aroma precursors distribution (Table 2), the clustering of samples by PCA is even clearer. Figure 3B shows the PCA scores-plot based on % responses from 15 precursors. The intra-class variability for the roasted samples is lower (as shown by confidence ellipses) while the total explained variance is 68%. Aroma precursors (fructose, glucose, maltose, saccharose, Ala, Pro, Ile, Leu, Orn, 5-oxoproline above all) are all reactive species within the Maillard reaction and sugar degradation pathways and, during roasting, form potent odorants. In particular, carbohydrates dehydration and isomerization cause the formation of α-dicarbonyls (2,3-butanedione and 2,3-pentanedione) and furanones (5-hydroxymethyfurfural and 4-hydroxy-2,5-dimethyl-3(2H)-furanone). Strecker degradation of amino acids in the presence of α-dicarbonyls form 2-/3-Methylbutanal and phenylacetaldehyde from Ile, Leu, and Phe, respectively [56]. The intermediates from Strecker reaction, α-amino carbonyl compounds, can dimerize to dihydropyrazines which can either oxidize into pyrazines or further react with aldehydes to form substituted pyrazines [57]. Reactions between Ala, Arg, Lys, Pro and Orn, and deoxyosones (i.e., sugar degradation products) form 2-acetyl and 2-propionylpyrroline that can be further oxidized to pyrrole derivatives [2].
As detailed in Section 3.2, aroma precursors have characteristic signatures in raw hazelnuts (Figure 3A green indicators, larger intra-class variability) with strong correlations to cultivar and origin, but when lab-scale roasting is applied, they start to react and the resulting distribution patterns in roasted and over-roasted samples are more homogeneous. Roasting is a variable that dominates phenotype variations of key-aroma precursors.
Finally, within roasted samples, the impact of post-harvest drying, i.e., E1 vs. E2 conditions, was analyzed. The variable importance in projection (VIP) selection, conducted on roasted samples (23 runs) and considering all targeted analytes (n = 80), highlighted the presence of glucose (glucose 5TMS), fructose (fructose 5TMS syn- and anti-), 3-α-mannobiose 8 TMS, and threonic and malonic acid within the first 10 variables with the highest ranking (high VIP value and low standard deviation-SD). In particular, sugars were present in higher relative amounts for E1 drying, conducted in-field at higher temperatures, while acids were present in higher amounts for low-temperature drying (E2 conditions). These data should be interpreted in the light of previous results on volatiles signatures from raw and roasted hazelnuts (Tonda Romana and Ordu) submitted to post-harvest drying in similar conditions [55]. Low-temperature drying (E2) enabled effective stabilization of kernels along 12 months of storage and higher relative amounts of key odorants were developed during roasting. In contrast, E1 drying was correlated with an early incidence of autoxidation on raw hazelnuts that, from one side, developed higher amounts of linear saturated and unsaturated aldehydes from fatty acids hydroperoxides decomposition, while, on the other side, when roasted along shelf-life checkpoints, resulted in weaker flavor profiles with lower amounts of key odorants.

4. Conclusions

UT fingerprinting with GC×GC-MS data was shown to be an effective strategy for exploring the complex hazelnut metabolome and its variations due to variable inputs (e.g., cultivar, geographical origin, post-harvest treatments, and roasting). MDA platforms enabled consistent annotation and tracking of component features, offering the opportunity to explore available analytical metadata to target known analytes and have access to a deeper knowledge of the chemical code behind complex phenomena [58].
This proof-of-concept study, for the first time accurately captured the complex metabolome of raw hazelnuts and tracked its changes along roasting. Although many different variables concur to increase the chemical dimensionality of samples, their influence can be examined by applying various statistics. Untargeted features—being tracked together with all metadata—can be disambiguated/identified in the ex-post analysis. This study comprehensively tracked 430 peak features with 80 targeted components. However, encrypted information of those features that have been left untargeted also can be mined to extend even further our knowledge in light of new variables related to the sample set.
These results add new insights to the existing knowledge about hazelnut primary metabolites and constituents and provide a clearer picture of the interrelation between hazelnut varieties and their processing technologies, offering useful support for future investigations on breeding programs or harvesting procedures aimed at optimizing the overall compositional quality of hazelnuts.

Supplementary Materials

The following are available online at https://www.mdpi.com/2076-3417/11/2/525/s1 as non-published materials. Table S1. Method performance on retention times (1tR and 2tR) and targeted peaks % response intermediate precision estimated as % Relative Standard Deviation (% RSD) on 21 quality control (QC) samples analyzed twice a day over the entire study period, Supplementary Figure S1 combined untargeted and targeted (UT) peaks % response distribution across all samples by heat-map visualization and hierarchical clustering based on Pearson correlation. Data were log-normalized before computation; Supplementary Figure S2. (A) Hierarchical clustering based on Euclidean distances (Z-score normalization of the data) estimated on % response for 56 UT peaks (F ≥ 4); (B) partial least squares discriminant analysis (PLS-DA) scores plot based on targeted analytes with meaningful variations between Tonda Gentile Trilobata and Anakliuri.

Author Contributions

Conceptualization, R.M., C.H.W., S.E.K., and C.C.; Data curation, M.C.R., F.S., and C.H.W.; Formal analysis, M.C.R., C.H.W., and C.I.M.; Funding acquisition, C.B. and C.C.; Investigation, M.C.R., F.S., C.H.W., C.I.M., S.E.K., and C.C.; Methodology, C.H.W., C.I.M., and S.E.K.; Project administration, M.C., G.R., and R.M.; Software, S.E.R.; Supervision, C.H.W., S.E.K. and C.C.; Writing—original draft, M.C.R., F.S., and C.C.; Writing—review and editing, C.B., S.E.R., C.H.W., C.I.M., S.E.K., and C.C. All authors have read and agreed to the published version of the manuscript.

Funding

This research was funded by Soremartec Italia Srl, Project: Shelling nuts: a comprehensive investigation of hazelnuts flavor, taste and related health topics.

Data Availability Statement

The data presented in this study are available in supplementary material here.

Acknowledgments

The research was carried out thanks to the financial support of Soremartec Italia Srl, Alba (CN, Italy).

Conflicts of Interest

The authors declare the following financial interests/personal relationships which may be considered as potential competing interests: Stephen E. Reichenbach has a financial interest in GC Image, LLC. Melanie Charron, Ginevra Rosso and Roberto Menta are employees of Soremartec Italia Srl, Alba (CN, Italy).

References

  1. Alasalvar, C.; Shahidi, F.; Cadwallader, K.R. Comparison of natural and roasted Turkish Tombul hazelnut (Corylus avellana L.) volatiles and flavor by DHA/GC/MS and descriptive sensory analysis. J. Agric. Food Chem. 2003, 51, 5067–5072. [Google Scholar] [CrossRef]
  2. Burdack-Freitag, A.; Schieberle, P. Changes in the key odorants of Italian hazelnuts (Coryllus avellana L. Var. Tonda Romana) induced by roasting. J. Agric. Food Chem. 2010, 58, 6351–6359. [Google Scholar] [CrossRef]
  3. Burdack-freitag, A.; Schieberle, P. Characterization of the key odorants in raw Italian hazelnuts. J. Agric. Food Chem. 2012, 60, 5057–5064. [Google Scholar] [CrossRef]
  4. Cordero, C.; Liberto, E.; Bicchi, C.; Rubiolo, P.; Schieberle, P.; Reichenbach, S.E.; Tao, Q. Profiling food volatiles by comprehensive two-dimensional ga schromatography coupled with mass spectrometry: Advanced fingerprinting approaches for comparative analysis of the volatile fraction of roasted hazelnuts (Corylus avellana L.) from different ori. J. Chromatogr. A 2010, 1217, 5848–5858. [Google Scholar] [CrossRef] [PubMed]
  5. Nicolotti, L.; Cordero, C.; Bicchi, C.; Rubiolo, P.; Sgorbini, B.; Liberto, E. Volatile profiling of high quality hazelnuts (Corylus avellana L.): Chemical indices of roasting. Food Chem. 2013, 138, 1723–1733. [Google Scholar] [CrossRef] [PubMed]
  6. Kiefl, J.; Schieberle, P. Evaluation of process parameters governing the aroma generation in three hazelnut cultivars (Corylus avellana L.) by correlating quantitative key odorant profiling with sensory evaluation. J. Agric. Food Chem. 2013, 61, 5236–5244. [Google Scholar] [CrossRef] [PubMed]
  7. Saklar, S.; Ungan, S.; Katnas, S. Microstructural changes in hazelnuts during roasting. Food Res. Int. 2003, 36, 19–23. [Google Scholar] [CrossRef]
  8. Hasn-Dieter, B.; Grosch, W.; Schieberle, P. Food Chemistry; Springer: Berlin/Heidelberg, Germany, 2013. [Google Scholar] [CrossRef]
  9. Özdemir, M.; Açkurt, F.; Yildiz, M.; Biringen, G.; Gürcan, T.; Löker, M. Effect of roasting on some nutrients of hazelnuts (Corylus Avellena, L.). Food Chem. 2001, 73, 185–190. [Google Scholar] [CrossRef]
  10. Alasalvar, C.; Pelvan, E.; Amarowicz, R. Effects of roasting on taste-active compounds of Turkish hazelnut varieties (Corylus avellana L.). J. Agric. Food Chem. 2010, 58, 8674–8679. [Google Scholar] [CrossRef]
  11. Schmitzer, V.; Slatnar, A.; Veberic, R.; Stampar, F.; Solar, A. Roasting affects phenolic composition and antioxidative activity of hazelnuts (Corylus avellana L.). J. Food Sci. 2011, 76. [Google Scholar] [CrossRef]
  12. Belviso, S.; Bello, B.D.; Giacosa, S.; Bertolino, M.; Ghirardello, D.; Giordano, M.; Rolle, L.; Gerbi, V.; Zeppa, G. Chemical, mechanical and sensory monitoring of hot air- and infrared-roasted hazelnuts (Corylus avellana L.) during nine months of storage. Food Chem. 2017, 217, 398–408. [Google Scholar] [CrossRef] [PubMed]
  13. Lainas, K.; Alasalvar, C.; Bolling, B.W. Effects of roasting on proanthocyanidin contents of Turkish Tombul hazelnut and its skin. J. Funct. Foods. 2016, 23, 647–653. [Google Scholar] [CrossRef]
  14. Amaral, J.S.; Casal, S.; Seabra, R.M.; Oliveira, B.P.P. Effects of roasting on hazelnut lipids. J. Agric. Food Chem. 2006, 54, 1315–1321. [Google Scholar] [CrossRef] [PubMed]
  15. Fallico, B.; Arena, E.; Zappalà, M. Roasting of hazelnuts. Role of oil in colour development and hydroxymethylfurfural formation. Food Chem. 2003, 81, 569–573. [Google Scholar] [CrossRef]
  16. Ibáñ ez, E.; Cifuentes, A. Foodomics: Food science and nutrition in the postgenomic era. Compr. Anal. Chem. 2014. [Google Scholar] [CrossRef]
  17. Wishart, D.S. Metabolomics: Applications to food science and nutrition research. Trends Food Sci. Technol. 2008, 19, 482–493. [Google Scholar] [CrossRef]
  18. Ulaszewska, M.M.; Weinert, C.H.; Trimigno, A.; Portmann, R.; Lacueva, C.A.; Badertscher, R.; Brennan, L.; Brunius, C.; Bub, A.; Capozzi, F.; et al. Nutrimetabolomics: An integrative action for metabolomic analyses in human nutritional studies. Mol. Nutr. Food Res. 2019, 63. [Google Scholar] [CrossRef]
  19. Weinert, C.H.; Egert, B.; Kulling, S.E. On the applicability of comprehensive two-dimensional gas chromatography combined with a fast-scanning quadrupole mass spectrometer for untargeted large-scale metabolomics. J. Chromatogr. A 2015, 1405, 156–167. [Google Scholar] [CrossRef]
  20. Stilo, F.; Bicchi, C.; Jimenez-Carvelo, A.M.; Cuadros-Rodríguez, L.; Reichenbach, S.E.; Cordero, C. Chromatographic fingerprinting by comprehensive two-dimensional chromatography: Fundamentals and tools. Trends Anal. Chem. 2021. [Google Scholar] [CrossRef]
  21. Humston, E.M.; Zhang, Y.; Brabeck, G.F.; McShea, A.; Synovec, R.E. Development of a GCxGC-TOFMS method using SPME to determine volatile compounds in cacao beans. J. Sep. Sci. 2009, 32, 2289–2295. [Google Scholar] [CrossRef]
  22. Humston, E.M.; Knowles, J.D.; McShea, A.; Synovec, R.E. Quantitative assessment of moisture damage for cacao bean quality using two-dimensional gas chromatography combined with time-of-flight mass spectrometry and chemometrics. J. Chromatogr. A 2010, 1217, 1963–1970. [Google Scholar] [CrossRef] [PubMed]
  23. Stilo, F.; Liberto, E.; Reichenbach, S.E.; Tao, Q.; Bicchi, C.; Cordero, C. Untargeted and targeted fingerprinting of extra virgin olive oil volatiles by comprehensive two-dimensional gas chromatography with mass spectrometry: Challenges in long-term studies. J. Agric. Food Chem. 2019, 67, 5289–5302. [Google Scholar] [CrossRef] [PubMed]
  24. Mastello, R.B.; Capobiango, M.; Chin, S.T.; Monteiro, M.; Marriott, P.J. Identification of odour-active compounds of pasteurised orange juice using multidimensional gas chromatography techniques. Food Res. Int. 2015, 75, 281–288. [Google Scholar] [CrossRef] [Green Version]
  25. Wong, Y.F.; Perlmutter, P.; Marriott, P.J. Untargeted metabolic profiling of Eucalyptus spp. leaf oils using comprehensive two-dimensional gas chromatography with high resolution mass spectrometry: Expanding the metabolic coverage. Metabolomics 2017, 13, 1–17. [Google Scholar] [CrossRef]
  26. Vaz-Freire, L.T.; da Silva, M.D.R.G.; Freitas, A.M.C. Comprehensive two-dimensional gas chromatography for fingerprint pattern recognition in olive oils produced by two different techniques in Portuguese olive varieties Galega Vulgar, Cobrançosa e Carrasquenha. Anal. Chim. Acta 2009, 633, 263–270. [Google Scholar] [CrossRef]
  27. Cajka, T.; Riddellova, K.; Klimankova, E.; Cerna, M.; Pudil, F.; Hajslova, J. Traceability of olive oil based on volatiles pattern and multivariate analysis. Food Chem. 2010, 121, 282–289. [Google Scholar] [CrossRef]
  28. Stanimirova, I.; Üstün, B.; Cajka, T.; Riddelova, K.; Hajslova, J.; Buydens, L.M.C.; Walczak, B. Tracing the geographical origin of honeys based on volatile compounds profiles assessment using pattern recognition techniques. Food Chem. 2010, 118, 171–176. [Google Scholar] [CrossRef]
  29. Morimoto, J.; Rosso, M.C.; Kfoury, N.; Bicchi, C.; Cordero, C.; Robbat, A. Untargeted/targeted 2D gas chromatography/mass spectrometry detection of the total volatile tea metabolome. Molecules 2019, 24, 3757. [Google Scholar] [CrossRef] [Green Version]
  30. Stilo, F.; Tredici, G.; Bicchi, C.; Robbat, A.; Morimoto, J.; Cordero, C. Climate and processing effects on tea (Camellia sinensis L. Kuntze) metabolome: Accurate profiling and fingerprinting by comprehensive two-dimensional gas chromatography/time-of-flight mass spectrometry. Molecules 2020, 25, 2447. [Google Scholar] [CrossRef]
  31. Tranchida, P.Q.; Giannino, A.; Mondello, M.; Sciarrone, D.; Dugo, P.; Dugo, G.; Mondello, L. Elucidation of fatty acid profiles in vegetable oils exploiting group-type patterning and enhanced sensitivity of comprehensive two-dimensional gas chromatography. J. Sep. Sci. 2008, 31, 1797–1802. [Google Scholar] [CrossRef]
  32. Tranchida, P.Q.; Donato, P.; Dugo, G.; Mondello, L.; Dugo, P. Comprehensive chromatographic methods for the analysis of lipids. TrAC Trends Anal. Chem. 2007, 26, 191–205. [Google Scholar] [CrossRef]
  33. Romo-Pérez, M.L.; Weinert, C.H.; Häußler, M.; Egert, B.; Frechen, M.A.; Trierweiler, B.; Kulling, S.E.; Zörb, C. Metabolite profiling of onion landraces and the cold storage effect. Plant Physiol. Biochem. 2020, 146, 428–437. [Google Scholar] [CrossRef] [PubMed]
  34. Schmarr, H.-G.; Bernhardt, J. Profiling analysis of volatile compounds from fruits using comprehensive two-dimensional gas chromatography and image processing techniques. J. Chromatogr. A 2010, 1217, 565–574. [Google Scholar] [CrossRef] [PubMed]
  35. Song, X.; Jing, S.; Zhu, L.; Ma, C.; Song, T.; Wu, J.; Zhao, Q.; Zheng, F.; Zhao, M.; Chen, F. Untargeted and targeted metabolomics strategy for the classification of strong aroma-type baijiu (liquor) according to geographical origin using comprehensive two-dimensional gas chromatography-time-of-flight mass spectrometry. Food Chem. 2020, 314. [Google Scholar] [CrossRef] [PubMed]
  36. Schrimpe-Rutledge, A.C.; Codreanu, S.G.; Sherrod, S.D.; McLean, J.A. Untargeted metabolomics strategies challenges and emerging directions. J. Am. Soc. Mass Spectrom. 2016, 27, 1897–1905. [Google Scholar] [CrossRef] [PubMed] [Green Version]
  37. Cialiè Rosso, M.; Mazzucotelli, M.; Bicchi, C.; Charron, M.; Manini, F.; Menta, R.; Fontana, M.; Reichenbach, S.E.; Cordero, C. Adding extra-dimensions to hazelnuts primary metabolome fingerprinting by comprehensive two-dimensional gas chromatography combined with time-of-flight mass spectrometry featuring tandem ionization: Insights on the aroma potential. J. Chromatogr. A 2020, 1614, 1–11. [Google Scholar] [CrossRef]
  38. Magagna, F.; Valverde-Som, L.; Ruíz-Samblás, C.; Cuadros-Rodríguez, L.; Reichenbach, S.E.; Bicchi, C.; Cordero, C. Combined untargeted and targeted fingerprinting with comprehensive two-dimensional chromatography for volatiles and ripening indicators in olive oil. Anal. Chim. Acta. 2016, 936, 245–258. [Google Scholar] [CrossRef]
  39. Reichenbach, S.E.; Zini, C.A.; Nicolli, K.P.; Welke, J.E.; Cordero, C.; Tao, Q. Benchmarking machine learning methods for comprehensive chemical fingerprinting and pattern recognition. J. Chromatogr. A 2019. [Google Scholar] [CrossRef]
  40. Münch, P.; Schieberle, P. Quantitative studies on the formation of key odorants in thermally treated yeast extracts using stable isotope dilution assays. J. Agric. Food Chem. 1998, 46, 4695–4701. [Google Scholar] [CrossRef]
  41. Cordero, C.; Guglielmetti, A.; Bicchi, C.; Liberto, E.; Baroux, L.; Merle, P.; Tao, Q.; Reichenbach, S.E. Comprehensive two-dimensional gas chromatography coupled with time of flight mass spectrometry featuring tandem ionization: Challenges and opportunities for accurate fingerprinting studies. J. Chromatogr. A 2019, 1597, 132–141. [Google Scholar] [CrossRef]
  42. Bressanello, D.; Liberto, E.; Collino, M.; Reichenbach, S.E.; Benetti, E.; Chiazza, F.; Bicchi, C.; Cordero, C. Urinary metabolic fingerprinting of mice with diet-induced metabolic derangements by parallel dual secondary column-dual detection two-dimensional comprehensive gas chromatography. J. Chromatogr. A 2014, 1361, 265–276. [Google Scholar] [CrossRef] [PubMed]
  43. Bressanello, D.; Liberto, E.; Collino, M.; Chiazza, F.; Mastrocola, R.; Reichenbach, S.E.; Bicchi, C.; Cordero, C. Combined untargeted and targeted fingerprinting by comprehensive two-dimensional gas chromatography: Revealing fructose-induced changes in mice urinary metabolic signatures. Anal. Bioanal. Chem. 2018, 410, 2723–2737. [Google Scholar] [CrossRef]
  44. Cialiè Rosso, M.; Stilo, F.; Squara, S.; Liberto, E.; Mai, S.; Mele, C.; Marzullo, P.; Aimaretti, G.; Reichenbach, S.E.; Collino, M.; et al. Exploring extra dimensions to capture saliva metabolite fingerprints from metabolically healthy and unhealthy obese patients by comprehensive two-dimensional gas chromatography featuring Tandem Ionization mass spectrometry. Anal. Bioanal. Chem. 2020. [Google Scholar] [CrossRef]
  45. Reichenbach, S.E.; Carr, P.W.; Stoll, D.R.; Tao, Q. Smart Templates for peak pattern matching with comprehensive two-dimensional liquid chromatography. J. Chromatogr. A 2009, 1216, 3458–3466. [Google Scholar] [CrossRef] [PubMed] [Green Version]
  46. NIST Standard Reference Database. NIST/EPA/NIH Mass Spectral Library with Search Program: (Data Version: NIST 08, Software Version 2.0f), 2010 (2005). Available online: https://chemdata.nist.gov/mass-spc/ms-search/docs/Ver20Man.pdf (accessed on 7 January 2021).
  47. Mack, C.I.; Egert, B.; Liberto, E.; Weinert, C.H.; Bub, A.; Hoffmann, I.; Bicchi, C.; Kulling, S.E.; Cordero, C. Robust markers of coffee consumption identified among the volatile organic compounds in human urine. Mol. Nutr. Food Res. 2019, 63. [Google Scholar] [CrossRef] [PubMed]
  48. Horning, E.C.; Horning, M.G. Human metabolic profiles obtained by gc and gc/ms. J. Chromatogr. Sci. 1971, 9, 129–140. [Google Scholar] [CrossRef]
  49. Fiehn, O. Combining genomics, metabolome analysis, and biochemical modelling to understand metabolic networks. Comp. Funct. Genomics 2001, 2, 155–168. [Google Scholar] [CrossRef] [Green Version]
  50. Maltoni, D.; Cappelli, R.; Meuwly, D. Challenges for fingerprint recognition spoofing, skin diseases, and environmental effects. Handb. Biom. Forensic. Sci. 2017, 63–83. [Google Scholar] [CrossRef]
  51. Stilo, F.; Liberto, E.; Spigolon, N.; Genova, G.; Rosso, G.; Fontana, M.; Reichenbach, S.E.; Bicchi, C.; Cordero, C. An effective chromatographic fingerprinting workflow based on comprehensive two-dimensional gas chromatography—Mass spectrometry to establish volatiles patterns discriminative of spoiled hazelnuts (Corylus avellana L.). Food Chem. 2021, 340, 128135. [Google Scholar] [CrossRef]
  52. Rempe, W.D.; Reichenbach, S.E.; Tao, Q.; Cordero, C.; Rathbun, W.E.; Zini, C.A. Effectiveness of global, low-degree polynomial transformations for GCxGC data alignment. Anal. Chem. 2016, 88, 10028–10035. [Google Scholar] [CrossRef]
  53. Reichenbach, S.E.; Rempe, D.W.; Tao, Q.; Bressanello, D.; Liberto, E.; Bicchi, C.; Balducci, S.; Cordero, C. Alignment for comprehensive two-dimensional gas chromatography with dual secondary columns and detectors. Anal. Chem. 2015, 87, 10056–10063. [Google Scholar] [CrossRef] [PubMed]
  54. NIST/EPA/NIH Mass Spectral Library with Search Program Data Version: NIST v17, (n.d.). Available online: https://www.nist.gov/srd/nist-standard-reference-database-1a (accessed on 7 January 2021).
  55. Rosso, M.C.; Liberto, E.; Spigolon, N.; Fontana, M.; Somenzi, M.; Bicchi, C.; Cordero, C. Evolution of potent odorants within the volatile metabolome of high-quality hazelnuts (Corylus avellana L.): Evaluation by comprehensive two-dimensional gas chromatography coupled with mass spectrometry. Anal. Bioanal. Chem. 2018, 410, 3491–3506. [Google Scholar] [CrossRef] [PubMed]
  56. Taş, N.G.; Gökmen, V. Maillard reaction and caramelization during hazelnut roasting: A multiresponse kinetic study. Food Chem. 2017, 221, 1911–1922. [Google Scholar] [CrossRef]
  57. Guerra, P.V.; Yaylayan, V.A. Dimerization of azomethine ylides: An alternate route to pyrazine formation in the maillard reaction. J. Agric. Food Chem. 2010, 58, 12523–12529. [Google Scholar] [CrossRef]
  58. Stilo, F.; Bicchi, C.; Robbat, A.; Reichenbach, S.E.; Cordero, C. Untargeted approaches in food-omics: The potential of comprehensive two-dimensional gas chromatography/mass spectrometry. Trends Anal. Chem. 2020. [Google Scholar] [CrossRef]
Figure 1. Pseudocolor image of a quality control (QC) sample from the blend of raw and roasted hazelnuts. (A) The distribution of 80 targeted 2D peaks (green circles). (B) The distribution of untargeted and targeted (UT) peaks (red and green circles) comprehensively covering the chromatographic space. (C) The enlarged area highlights the retention region of monosaccharides while illustrating the chromatographic efficiency and resolution achieved by adopting a 60 m × 0.25 mm dc column in the 1D. (D) For untargeted peak #207, the available metadata including retention times, qualifiers/quantifiers ions, and results of cross-matching by untargeted and targeted (UT) fingerprinting.
Applsci 11 00525 g001
Figure 2. Univariate box-plots illustrate the % response for some primary metabolites and aroma precursors (Pro and Ala) in the analyzed hazelnut samples. For Pro and Ala, a further description of their distribution according to the geographical origin is shown (T—GE and T—IT).
Applsci 11 00525 g002
Figure 3. Principal component analysis (PCA) including all analyzed samples (36 runs) and based on % response (TIC 2D volumes) of re-aligned 2D peaks the feature template. (A) corresponds to 430 UT peaks while in (B) the computation is based on aroma precursors (see Table 2).
Applsci 11 00525 g003
Figure 4. Histograms illustrating the % response evolution across the roasting profile for targeted metabolites. Error bars correspond to ± SD over samples’ classes (raw-green bars; roasted-pink bars; over roasted-blue bars).
Applsci 11 00525 g004
Table 1. The samples’ characteristics and notations used in the text.
HarvestCultivarGeographical AreaDrying ConditionStorage Roasting Grade
2017Tonda Gentile
Trilobata—T
Piedmont, Italy—ITConventional—E1
Mild Temp.—E2
Uncontrolled—U
Controlled—C
raw—Raw
mild roasting—R
over-roasting—OR
Georgia—GE
Anakliuri—ANGeorgia—GE
Table 2. List of 80 targeted analytes with 1D and 2D retention times (1tR, 2tR) and IT (experimental and reference NIST values).
Chemical ClassCompound Name1tR (min)2tR (sec)Experimental ITRefeference IT
Amino acidsAlanine 2TMS a,b17.90.610981110
Leucine TMS a,b20.60.811511155
Isoleucine TMS a,b21.61.111731178
Valine 2TMS a,b23.50.712101208
Threonine 2TMS27.40.712861292
Proline 2TMS a,b27.60.812891282
Glycine 3TMS a,b28.30.713021310
Threonine 3TMS32.30.813801367
Aspartic acid 2TMS b34.21.114191413
5-Oxoproline 2TMS38.91.315161520
Aspartic acid 3TMS b39.40.815271522
Pyroglutamic acid 2TMS a39.41.115271521
Phenylalanine TMS a,b40.70.815551559
Ornithine 3TMS a42.61.116071610
Glutamic acid 3TMS a43.21.016121626
Organic acidsLactic Acid 2TMS a,c15.90.610511057
Glycolic acid 2TMS a16.60.710681072
Oxalic acid 2TMS a,c19.20.911231125
Malonic acid 2TMS22.90.911971205
Benzoic Acid TMS a25.31.212441248
Succinic acid 2TMS a28.61.013081313
Fumaric acid 2TMS a30.50.913451348
Decanoic acid TMS a36.00.914551450
Malic acid 3TMS a,c37.40.914831480
Hexanedioic acid 2TMS38.21.015001498
Dodecanoic acid TMS44.50.816481650
Azelaic acid 2TMS50.31.117891793
Citric acid 4TMS a,c51.10.918111816
Myristic acid TMS52.21.018441840
3-Deoxyhexonic acid 4TMS52.60.818541855
Pentadecanoic acid TMS55.71.019431943
Gluconic acid 6TMS a57.40.819951997
Palmitic acid TMS58.91.120412041
3-Deoxyarabino-hexaric acid 5TMS60.80.921002092
(Z,Z)-9,12-Octadecadienoic acid TMS64.01.222062208
(Z)-9-Octadecenoic acid TMS64.21.222122215
(E)-9-Octadecenoic acid TMS64.31.222182217
Stearic acid TMS64.91.122382239
Arachidic acid 3TMS70.21.024282432
PolyolsGlycerol 3TMS a26.50.612681266
Erythritol 4TMS a38.00.714961505
Xylitol 5TMS a47.40.717151710
Pinitol 5TMS51.60.718271826
Scyllo-inositol 6TMS a56.00.719521972
Myo-inositol 6TMS a,c60.40.820872096
1-Monooleoylglycerol 2TMS78.31.227522759
Sugars2-Deoxyribose 3TMS33.20.913971404
Erythrose 3TMS34.60.814261431
Deoxyribopyranose 3TMS38.40.715041502
Ribofuranose 4TMS43.00.816101625
anti-Fructose 5TMS a,c53.00.818661867
syn-Fructose 5TMS a,c53.40.818761878
Galactose 5TMS53.70.818891896
Glucose 5TMS a,c53.90.818911897
Mannitol 6TMS a55.30.719321928
Trehalose TMS66.81.123022304
Sucrose 8TMS a,c75.41.026272623
2-α-Mannobiose 8TMS77.01.026932700
3-α-Mannobiose 8TMS77.51.027152722
Galactinol 9TMS81.30.929242926
Maltose 8TMS a84.01.130622748
β-Lactose 8TMS88.72.132693260
Sugar acidsα-Hydroxyglutaric acid 3TMS41.40.915691576
β-Hydroxy-β-methylglutaric acid 3TMS42.40.815961606
Galactaric acid 6TMS a58.80.820372050
Galacturonic acid 5TMS a68.41.023632370
Others3-Pyridinol TMS15.10.810321034
Diacetone alcohol TMS15.30.710361040
Hydroxylamine 2TMS15.50.510421044
Hydroxylamine 3TMS18.70.611141111
2-Methyl-1,3-butanediol 2TMS21.70.611751174
Diethylene glycol 2TMS24.90.812371233
N-Butylacetamide 3TMS48.90.917531755
Tryptamine 2TMS49.31.117641770
Glucono-1,4-lactone 4TMS56.70.819721980
Pentaethylene glycol 2TMS61.61.421272107
Bis-2-ethylhexyl phthalate69.11.423872381
Bis-(2-ethylhexyl) decanedioate79.21.427962792
Catechin 5TMS80.51.128712861
β-Sitosterol TMS88.22.132463249
Superscript letters following chemical names indicate previous studies where these compounds were described in relation to the roasting process: a indicates Cialiè Rosso et al. [37], b Ozdemir et al. [9], and c Alasalvar et al. [10].
Publisher’s Note: MDPI stays neutral with regard to jurisdictional claims in published maps and institutional affiliations.

