Article

Winter Wheat Take-All Disease Index Estimation Model Based on Hyperspectral Data

1
College of Information and Management Science, Henan Agricultural University, Zhengzhou 450002, China
2
College of Geoscience and Surveying Engineering, China University of Mining and Technology, Beijing 100083, China
3
Hebei Research Center for Geoanalysis, Baoding 071051, China
4
Hebei Province Key Laboratory of Mineral Resources and Ecological Eenvironment Monitoring, Baoding 071051, China
5
Institute of Geo-Information and Earth Observation (IGEO), PMAS-Arid Agriculture University Rawalpindi, Rawalpindi 46300, Pakistan
*
Author to whom correspondence should be addressed.
Appl. Sci. 2021, 11(19), 9230; https://doi.org/10.3390/app11199230
Submission received: 31 July 2021 / Revised: 23 September 2021 / Accepted: 23 September 2021 / Published: 4 October 2021
(This article belongs to the Special Issue Applications of Optical Spectroscopy in Plant Sciences)

Abstract

:
Wheat take-all, caused by two variants of the fungus Gaeumannomyces gramnis (Sacc.) Arx & D. Olivier, was common in spring wheat areas in northwest and north China and occurred in winter wheat areas in north China. The yield of common disease areas was reduced by more than 20% and the yield of severe cases was reduced by more than 50%. Large-scale rapid and accurate estimation of the incidence of wheat take-all plays an important role in guiding field control and agricultural yield estimation. In this study, a portable ground spectrometer was used to collect the spectral reflectance in the 350–1050 nm band range of wheat canopy after take-all infection in the wheat grain filling stage and combined with the ground disease survey data.Then a winter wheat take-all disease index estimation model was proposed based on the spectral band division interval and selected band combination. According to the normalized difference spectral index (NDSI) and the determinative coefficient of the disease index formed by any two band combinations, the spectral index band combinations corresponding to the spectral index with high correlation in each region were screened by dividing spectral intervals. Partial least-squares regression was used to establish a binary and ternary disease index calibration model. The results showed that the model based on spectral indices of ternary variables had the highest coefficient of determination. Finally, the optimal regression model of wheat take-all disease condition index composed of NDSI(R590,R598), NDSI(R534,R742) and NDSI(R810,R834) was established: Y = 134.577 − 70.301 NDSI(R590,R598) − 223.533 NDSI(R534,R742) + 51.584 NDSI(R810,R834) (R2 = 0.743, RMSEP = 0.094, df = 15), which was the most suitable model for winter wheat take-all estimation. The construction of this model can provide new method and technical support for future evaluation and monitoring of wheat take-all disease on the field.

1. Introduction

The take-all wheat disease caused by the fungus of the Gaeumannomyces graminis (Sacc.) Arx & D. Olivier. These funguses mainly overwinters and oversummers on the diseased residues left in the soil or mixed with the diseased residues on the unripe manure and the seeds mixed with the diseased residues, which become the main infection of the subsequent wheat source. Wheat can be infected with take-all during the whole growth period, especially the root and stem base and the overground parts of the infected wheat plant will show symptoms. The main reason for the occurrence of the disease-free area is the mixed seeds with diseased and residual seeds. In recent years, the take-all wheat disease has spread to vast areas and led to large quantity of lost [1]. It is of great significance to strengthen the monitoring and early-warning research on this disease to ensure the high and stable yield of wheat.
Hyperspectral remote sensing technology can accurately obtain the spectral information of ground crops, especially when the plants are infected by diseases, since their external morphology and internal physiological processes will change [2]. Compared with healthy plants, the spectral characteristics of the affected plants will change to different degrees in some characteristic bands [3]. Therefore, with the rapid development of remote sensing technology, hyperspectral remote sensing technology is also increasingly being in crop disease monitoring research. Tan Changwei et al. [4] used hyperspectral remote sensing data to extract spectral information of vegetation canopy, making it possible to monitor vegetation in a large range. Zhao Hengqian et al. [5] used hyperspectral image data combined with vegetation index method to study cotton root rot and performed a large-scale graded monitoring of this disease. Guo Jiebin et al. [6] established the regression equation by using the relationship between the first-order differential index and the disease index and proved that hyperspectral inversion of the disease index of wheat stripe rust was completely feasible. Lei yu et al. [7] used hyperspectral data to accurately classify wheat stripe rust leaves. Chen Yunhao et al. [8] estimated the severity of wheat stripe rust by using principal component analysis and the empirical method of vegetation indices. Davoud et al. [9] used non-imaging hyperspectral data combined with RGB images to analyze the applicability of multiple vegetation indices to distinguish wheat stripe rust with different disease levels. Zheng Zhixiong et al. [10] used hyperspectral data to classify the disease degree of rice leaf blast and achieved good results. Qiao Hongbo et al. [11] used wheat spectral data collected by ASD non-imaging spectrometer to conduct experiments and proved that hyperspectral data could effectively monitor wheat take-all. Guo Wei et al. [12] built a winter wheat take-all monitoring model by using the relationship between spectral index and disease index and successfully analyzed the degree of wheat disease, which also provided a solution for monitoring winter wheat and other crop diseases on the plot scale. It can be seen from the above research results that hyperspectral technology has a good application potential in the identification of agricultural disease distribution and grading, especially wheat take-all, but the accuracy of the model and the effect of application still need to be optimized and explored [13].
Take-all disease causes great damage to the roots of wheat, obstructing the transport of nutrients and water. This leads to a lack of nutrients in the upper part of the wheat to produce white spike symptom [14]. The spectral characteristics will be significantly different in the visible and near infrared regions, which makes it possible to monitor infected crops through non-imaging hyperspectral spectroscopy. [15]. Different diseases have specific spectral responses. For crop diseases and insect pest identification based on non-imaging hyperspectral data, more attention should be paid to the selection of sensitive wavelengths corresponding to various diseases and insect pests and the construction of specific diseases and insect pests indices [16]. Researchers targeted disease-specific data and combined different wavelength data to construct specific disease and pest identification index [17,18]. For example, normalized difference vegetation index (NDVI), which is suitable for the analysis of green vegetation and has been applied in the analysis of stress of various diseases and insect pests. On the basis of this, many researchers have defined improved vegetation index, such as photochemical reflectance index [19] (PRI), structure-insensitive pigment index [20] (SIPI) and normalized difference infrared index [21] (NDII), which are based on the NDVI formula. In this paper, the normalized difference spectral index (NDSI) was used to calculate the spectral index of the whole bands based on the NDVI formula to highlight the characteristic information of the hyperspectral band. According to the bands of the constructed spectral index, the most bands for the identification of wheat take-all can be analyzed from different locations in order to realize the disease index estimation.
In this study, the winter wheat field infected with wheat take-all was taken as the research object and the NDSI was calculated according to the spectral data collected by hyperspectral instrument and the determination coefficients of each spectral index and disease index of different band combinations were calculated. The spectral index combinations that could be used to estimate the disease index in the field were selected by dividing the band range. Partial least squares regression was used to screen out a wheat take-all disease estimation model based on the combination of multiple spectral indices containing bands from different wavelength groups, so as to achieve the purpose of monitoring wheat take-all.

2. Materials and Methods
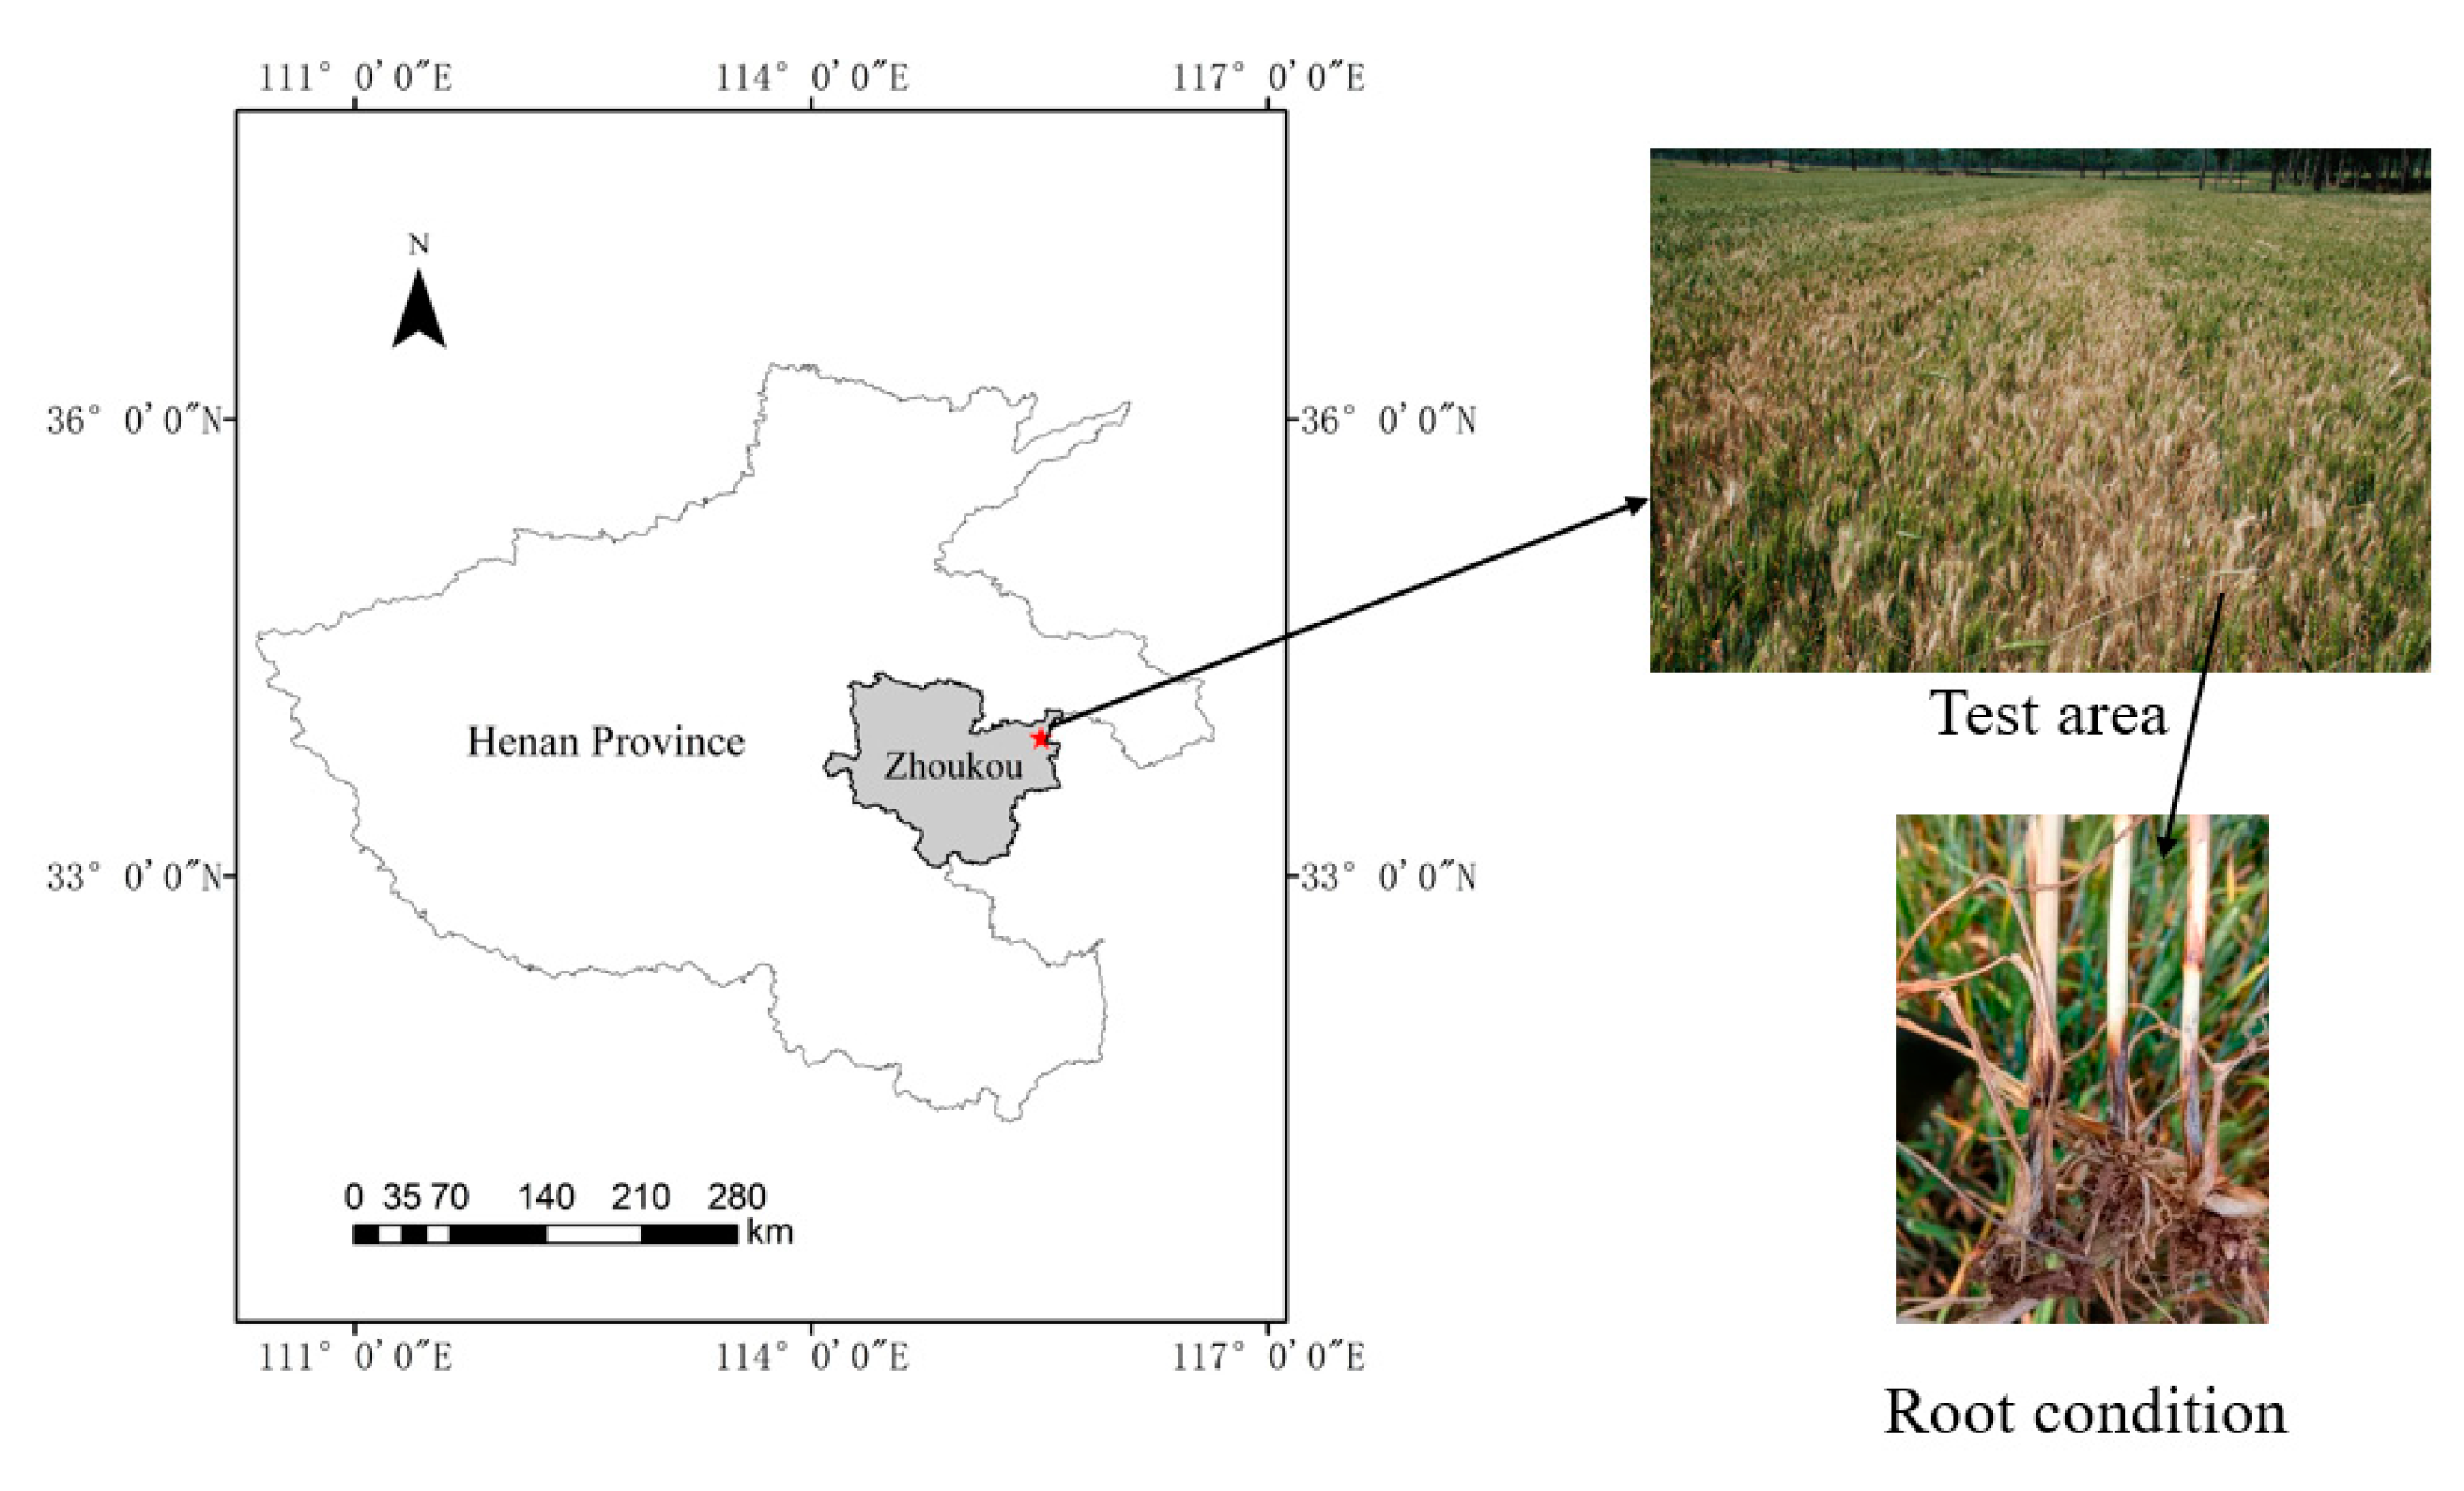
2.1. Test Area

The test area was located in Wobei Town, Luyi County, Zhoukou City, central and southern Henan Province (33°53′23′′ N, 115°29′26′′ E). It is located between the mid-latitudes of Huanghuai and has a temperate semi-humid monsoon climate [22]. The test site was 112 m long and 26 m wide. The winter wheat variety “Aikang 58” was used in the experiment, whose sowing date was October 12 2016. During the growth period of winter wheat, the cultivation measures were the same as that of the general high-yield field and wheat take-all occurred naturally in the field without inoculation. The location of the field test area for the take-all wheat disease and the roots of the diseased wheat are shown in Figure 1.

2.2. Data Acquisition and Processing

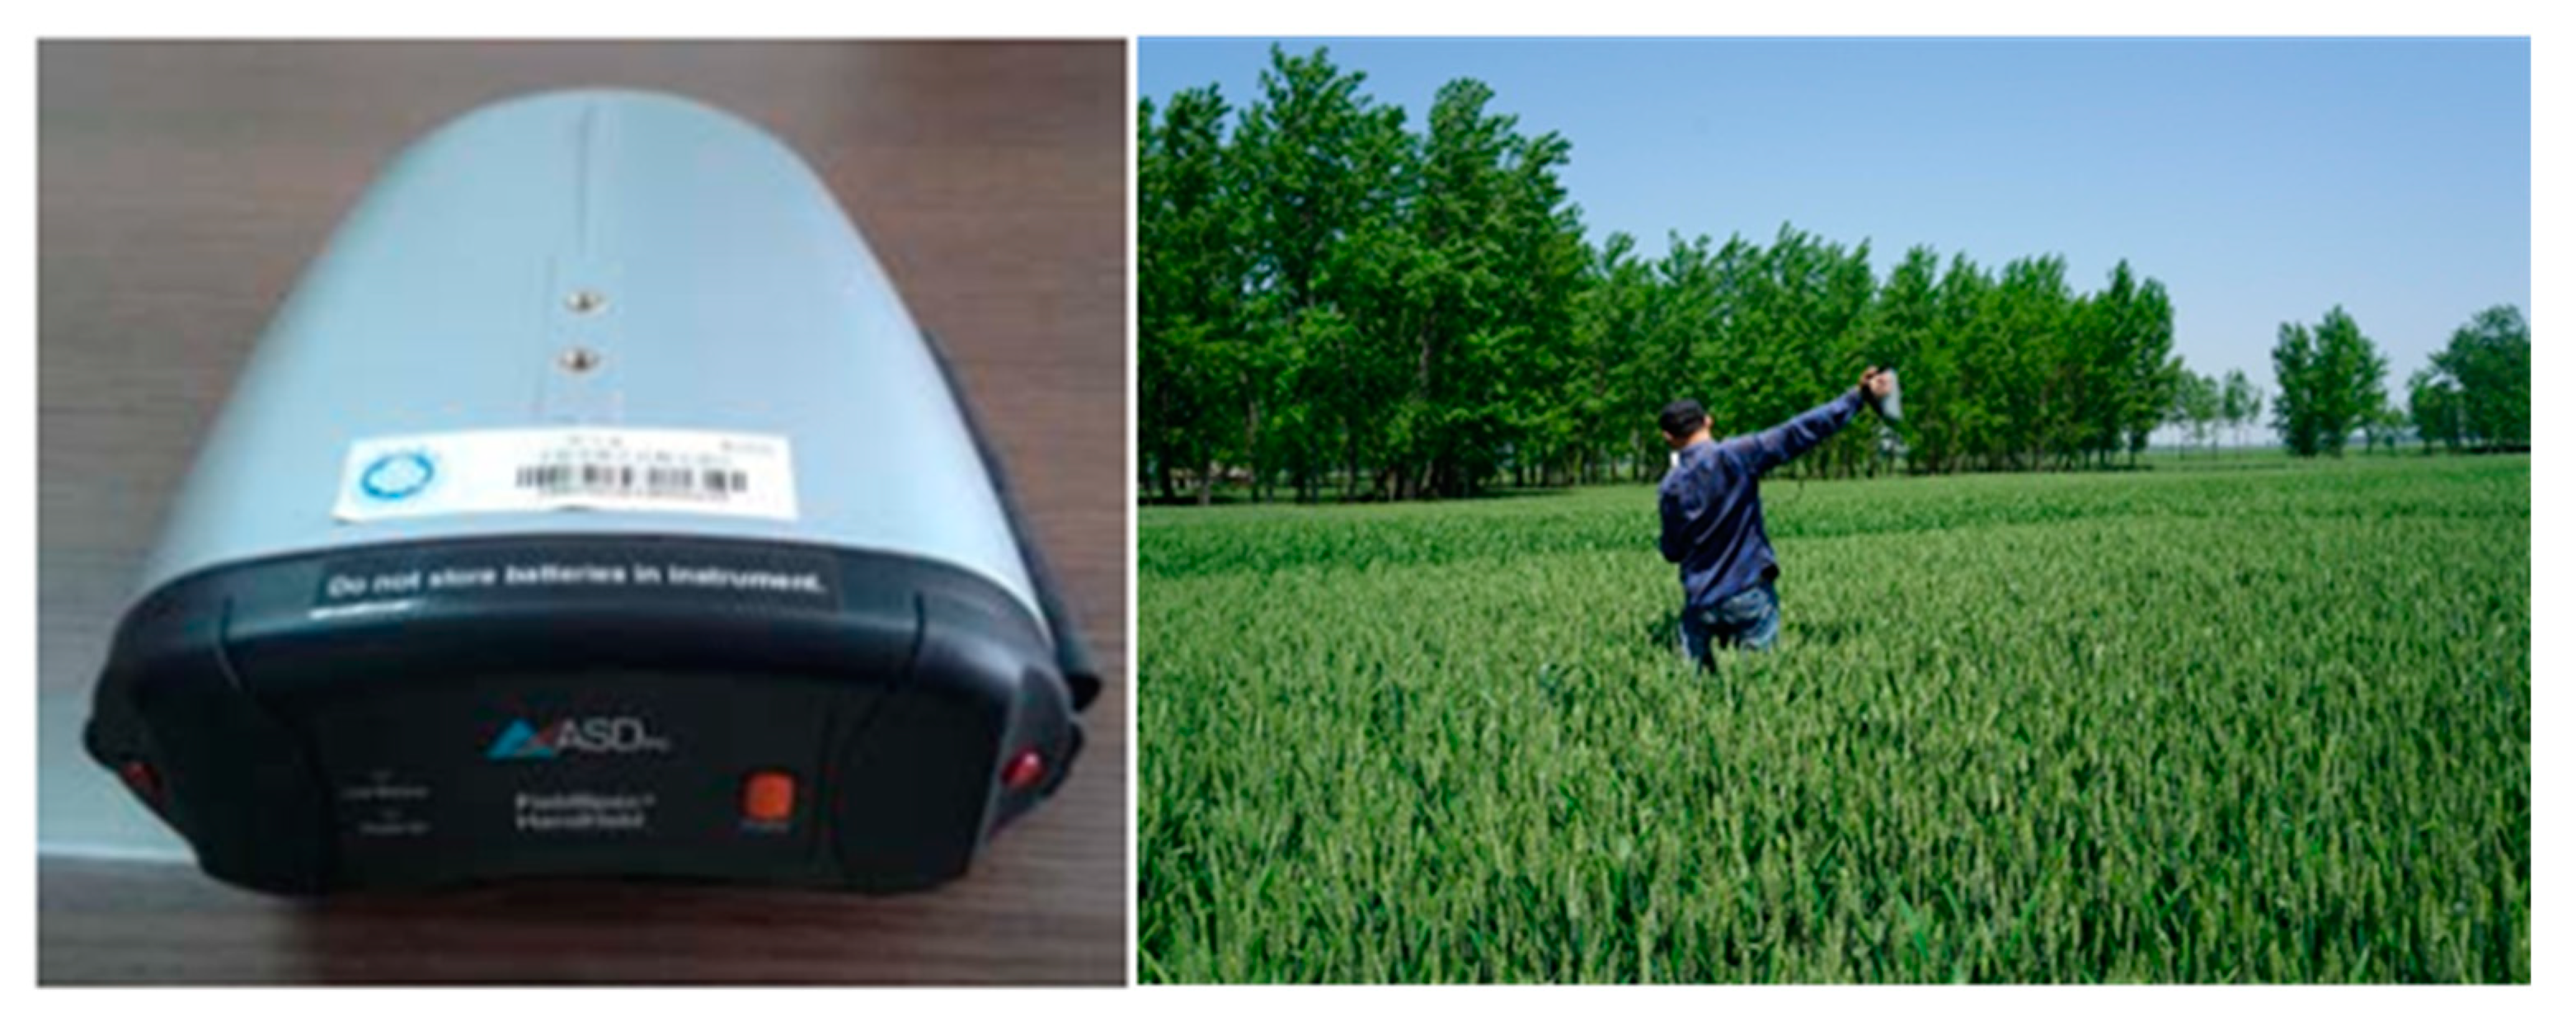
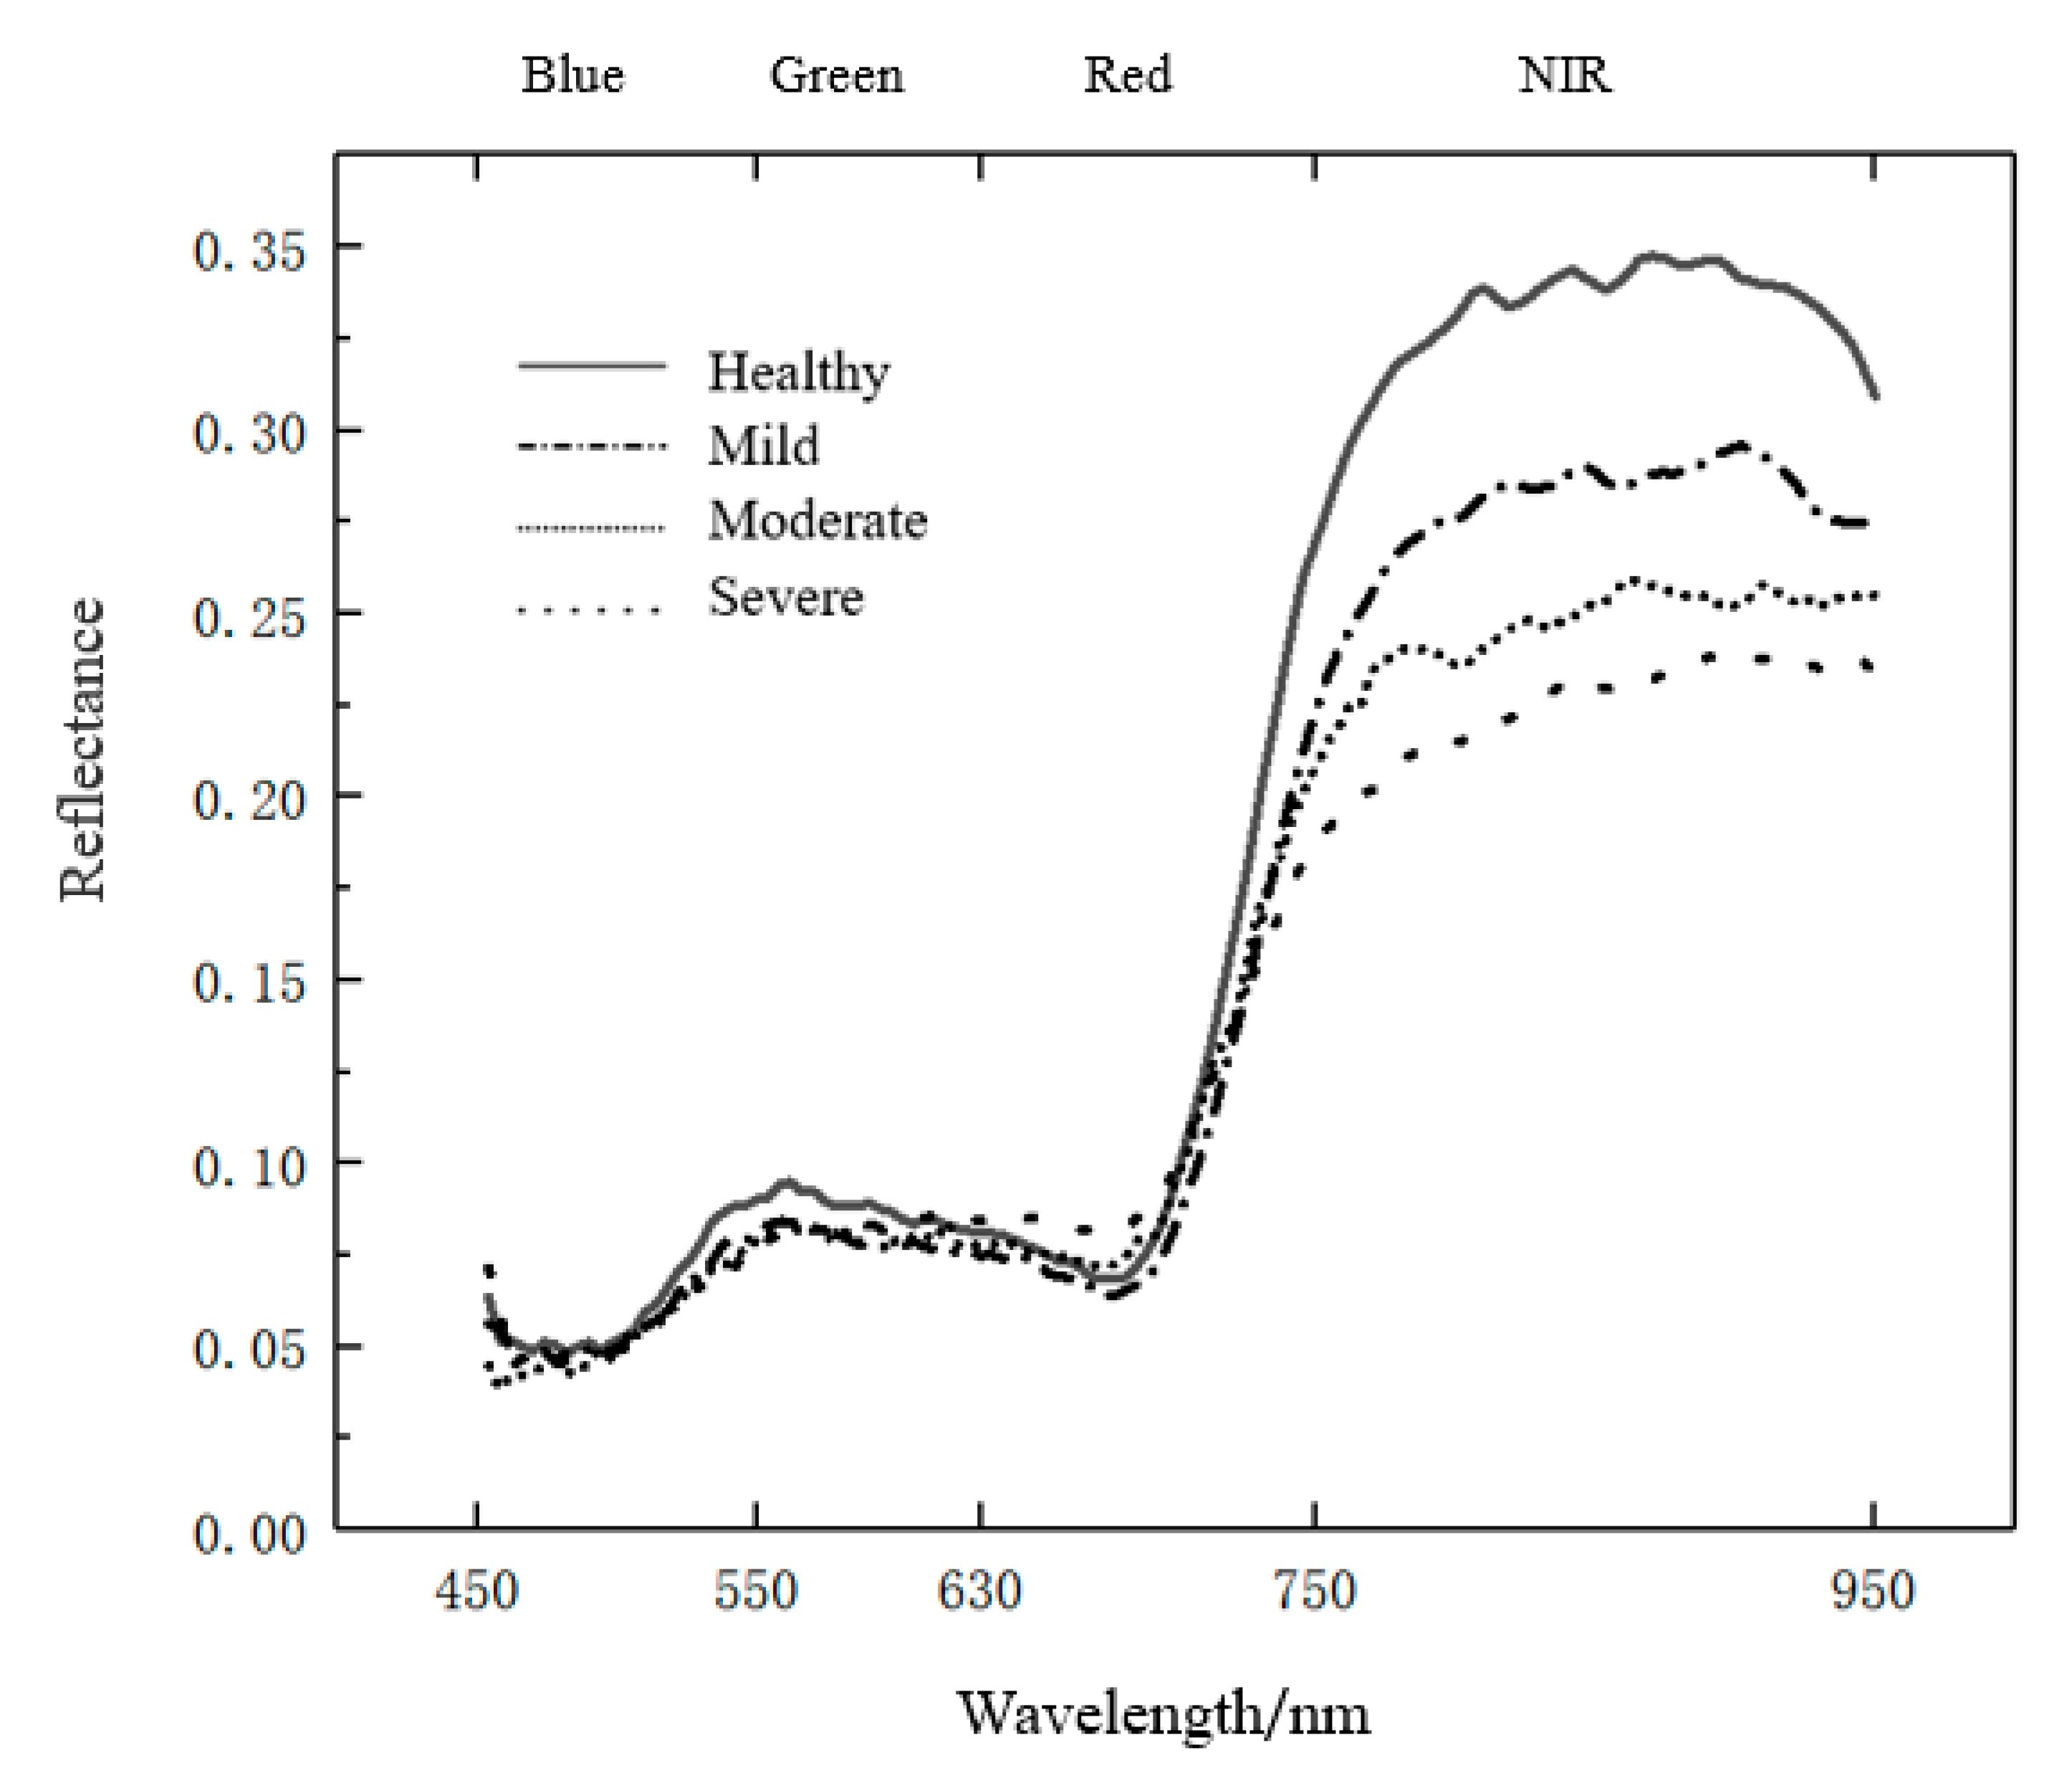
Disease Investigation and Spectral Collection

Spectral data were obtained under field-conditions, on May 21 2017, which was in the wheat grain filling stage and the “white spike” characteristics of wheat infected by take-all were the most obvious [23]. In order to obtain more accurate data and avoid the impact of other diseases, pests and pests on this experiment, we selected the sampling points in the field to be more uniform and the experiment was conducted after the occurrence of wheat rot disease was evaluated by botanists. According to different degrees of disease, 30 sample points in the field were selected as the sample points of canopy spectrum data; 1 m × 1 m in the right front of each spectral measurement sample was used as the disease investigation quadrate and the investigation method was carried out according to the national standard Pesticide—Guidelines for the field efficacy trials (II)—Part 109:Fungicides against take-all of wheat (GB-T-17980.109-2004), which stipulates the judgment requirements of the disease level in Table 1. In other words, wheat samples were selected from each root quadrat according to the traditional five-point sampling method (in the central area and the surrounding four corners) and 1 m long double-row wheat was selected from each spike quadrat to investigate the number of total spikes and the number of white spikes. Formula (1) is the formula used for calculating the White spike rate. The roots of samples were washed with clean water and the incidence of root disease was investigated under a white background. The disease progression was calculated according to the percentage of infected roots of each plant. The disease grading criteria are shown in Table 1.
In order to comprehensively consider the incidence and severity of wheat take-all, the disease index was calculated by combining the white spike rate and disease progression, which was used as a comprehensive index to evaluate the incidence degree of wheat take-all in this paper. Disease index (DI) calculation formula is:
white   spike   rate   of   wheat   % = the   number   of   witheredwhite   spikes   the   number   of   total   spikes × 100
Disease   index   = Number   of   white   spikes   of   each   grade ×   Disease   grade The   number   of   total   spikes   ×   Maximum   disease   grade × 100
According to previous research methods [24,25], the disease index was divided into four grades: healthy (0), mild (0–30%), moderate (30–50%) andsevere (>50%). In this data, there were 7 healthy samples, 16 mild samples, 5 moderate samples and 2 severe samples.
The hand-held field spectral radiometer, ASD Field SpecPro HH (American Analytical Spectral Devices, Inc.). was used to collect the spectral reflectance data of wheat canopy. The appearance of the instrument and the picture of the data collected in the field are shown in Figure 2. This equipment can continuously measure spectral data in the range of 350–1050 nm, the spectrum sampling interval is 1 nm and the spectrum resolution is 3 nm. The measurement time was chosen from 10:00 to 14:00 on a sunny, windless and cloudless day (the solar altitude angle is greater than 45°). Before measurement, the instrument was preheated in natural light for 20 min and then calibrated on standard whiteboard. The spectral measurement was carried out under natural light. The optical fiber probe was vertically downward and the distance from the measured wheat canopy was 50 cm and the area below the probe was ensured to have no shadow. For each sample area, a continuous acquisition of 10 spectral curves was performed and the average was taken as the representative spectral curve of that sample. Before each measurement, the instrument was optimized once and a standard whiteboard calibration was carried out. In this study, spectral data of 30 sample points were obtained and 10 spectral curves of each sample point were collected and averaged to identify the disease grade.

2.3. Spectral Index Construction

In this study, spectral indices were constructed from spectral reflectance of any two bands in the range of 450–950 nm from field detection data. Spectral index is a parameter composed of the reflectance factors of different spectral bands in a certain algebraic form. According to the external and internal physiological characteristics of wheat after take-all infection and the results of previous studies [26], the normalized difference spectral index (NDSI) was selected as the main spectral index in this study, which was defined as:
  N D S I ( R i , R j ) = R i R j )   /   ( R i + R j
In the formula, R i —represents the spectral reflectance corresponding to the wavelength i in the bands from 450–950 nm, R j —represents the spectral reflectance corresponding to wavelength j in the bands from 450–950 nm.

2.4. Modeling Method

Partial least squares regression (PLSR) method produces calibration models, models based on multiple linear regression, combining principal component analysis (PCA) and canonical correlation analysis (CCA). PLSR model is suitable for a large number of variables, multiple correlations among variables and small amount of observed data [27], which solves the problems of small samples and multicollinearity often encountered in multiple linear regression analysis. PLSR has a good prediction effect in the case of small sample data and has widely been used in the estimation of crop disease degree [28,29]. PLSR was used as the main modeling method in this study.

2.5. Accuracy Evaluation Method

In this study, the coefficient of determination (R2) and root mean square error prediction (RMSEP) were used to comprehensively evaluate the accuracy of wheat take-all calibration model [30,31]. The coefficient of determination (R2) is used to characterize the degree of fitting between the regression line and the observed value, meaning the accuracy of fitting degree between spectral index and DI value of each sample. The value of the coefficient of determination is between 0 and 1. The higher the R2 is, the better the fitting effect of the model is. That is, the better the spectral index model interprets the disease index, the greater is the reference value. The root mean square error prediction (RMSEP) reflects the degree of sample dispersion and can be used to observe the deviation between the true value and the prediction value of the disease index. For the disease index, RMSEP is very sensitive to large errors. When the RMSEP is smaller, the estimating accuracy of disease index is higher. When R2 is larger, RMSEP is smaller, which is the optimal model.
R 2 = 1 i = 1 n y i y ^ i 2 i = 1 n y i y ¯ i 2
where y i is the value to be fitted, its mean value is y ¯ i and the fitted value is y ^ i .
RMSEP = 1 n i = 1 n X i X ^ i 2
where X i   and X ^ i   are the values obtained in practice and by theoretical calculation, respectively and n is the number of observations of practice testing or theory calculation.

2.6. Data Analysis

We selected the sample squares in the area where the disease occurred and calculated the total number of spikes and the number of dead white spikes of 1 m × 1 m. The white spike rate equals to = the number of dead white spikes/total number of spikes. The number of wheat spikes in 1 square meter is about 600 spikes. On the basis of this, 30 sample squares were selected as our sample points. A total of 30 sample points were collected in this experiment, which were evenly distributed in the study area and included four disease levels. 30 sample points of four disease levels, were selected and tagged with numbers by using a random function, 50% of the sample points from the sample data points of different disease levels were taken and divided them into two groups of 15 points each, set as the modeling group and the validation group, respectively. Each group contains four grades of disease sample points and the number of sample points in each category was similar. The determination coefficient equipotential map was constructed by spectral reflectance and disease index and the band combination with high correlation with disease index was screened. In this study, the spectral interval was divided to select the combination of characteristic bands and the optimal spectral index within the interval was selected as the characteristic variable, partial least squares regression method was used to construct the multivariate variable disease index inversion model and the relationship between spectral characteristics and wheat take-all disease characteristics was fully explored. By comparing the high and low determination coefficients, the binary and ternary disease index inversion models were optimized and combined with the estimation accuracy of the data of the verification group, the optimal model was selected as the estimation model of wheat take-all disease index.
This process used Microsoft Excel 2019 for data processing; Matlab 2018a was used to calculate spectral index and multiple regression model for any two spectral; SPSS 26.0 was used for partial least squares regression model calculation.

3. Results

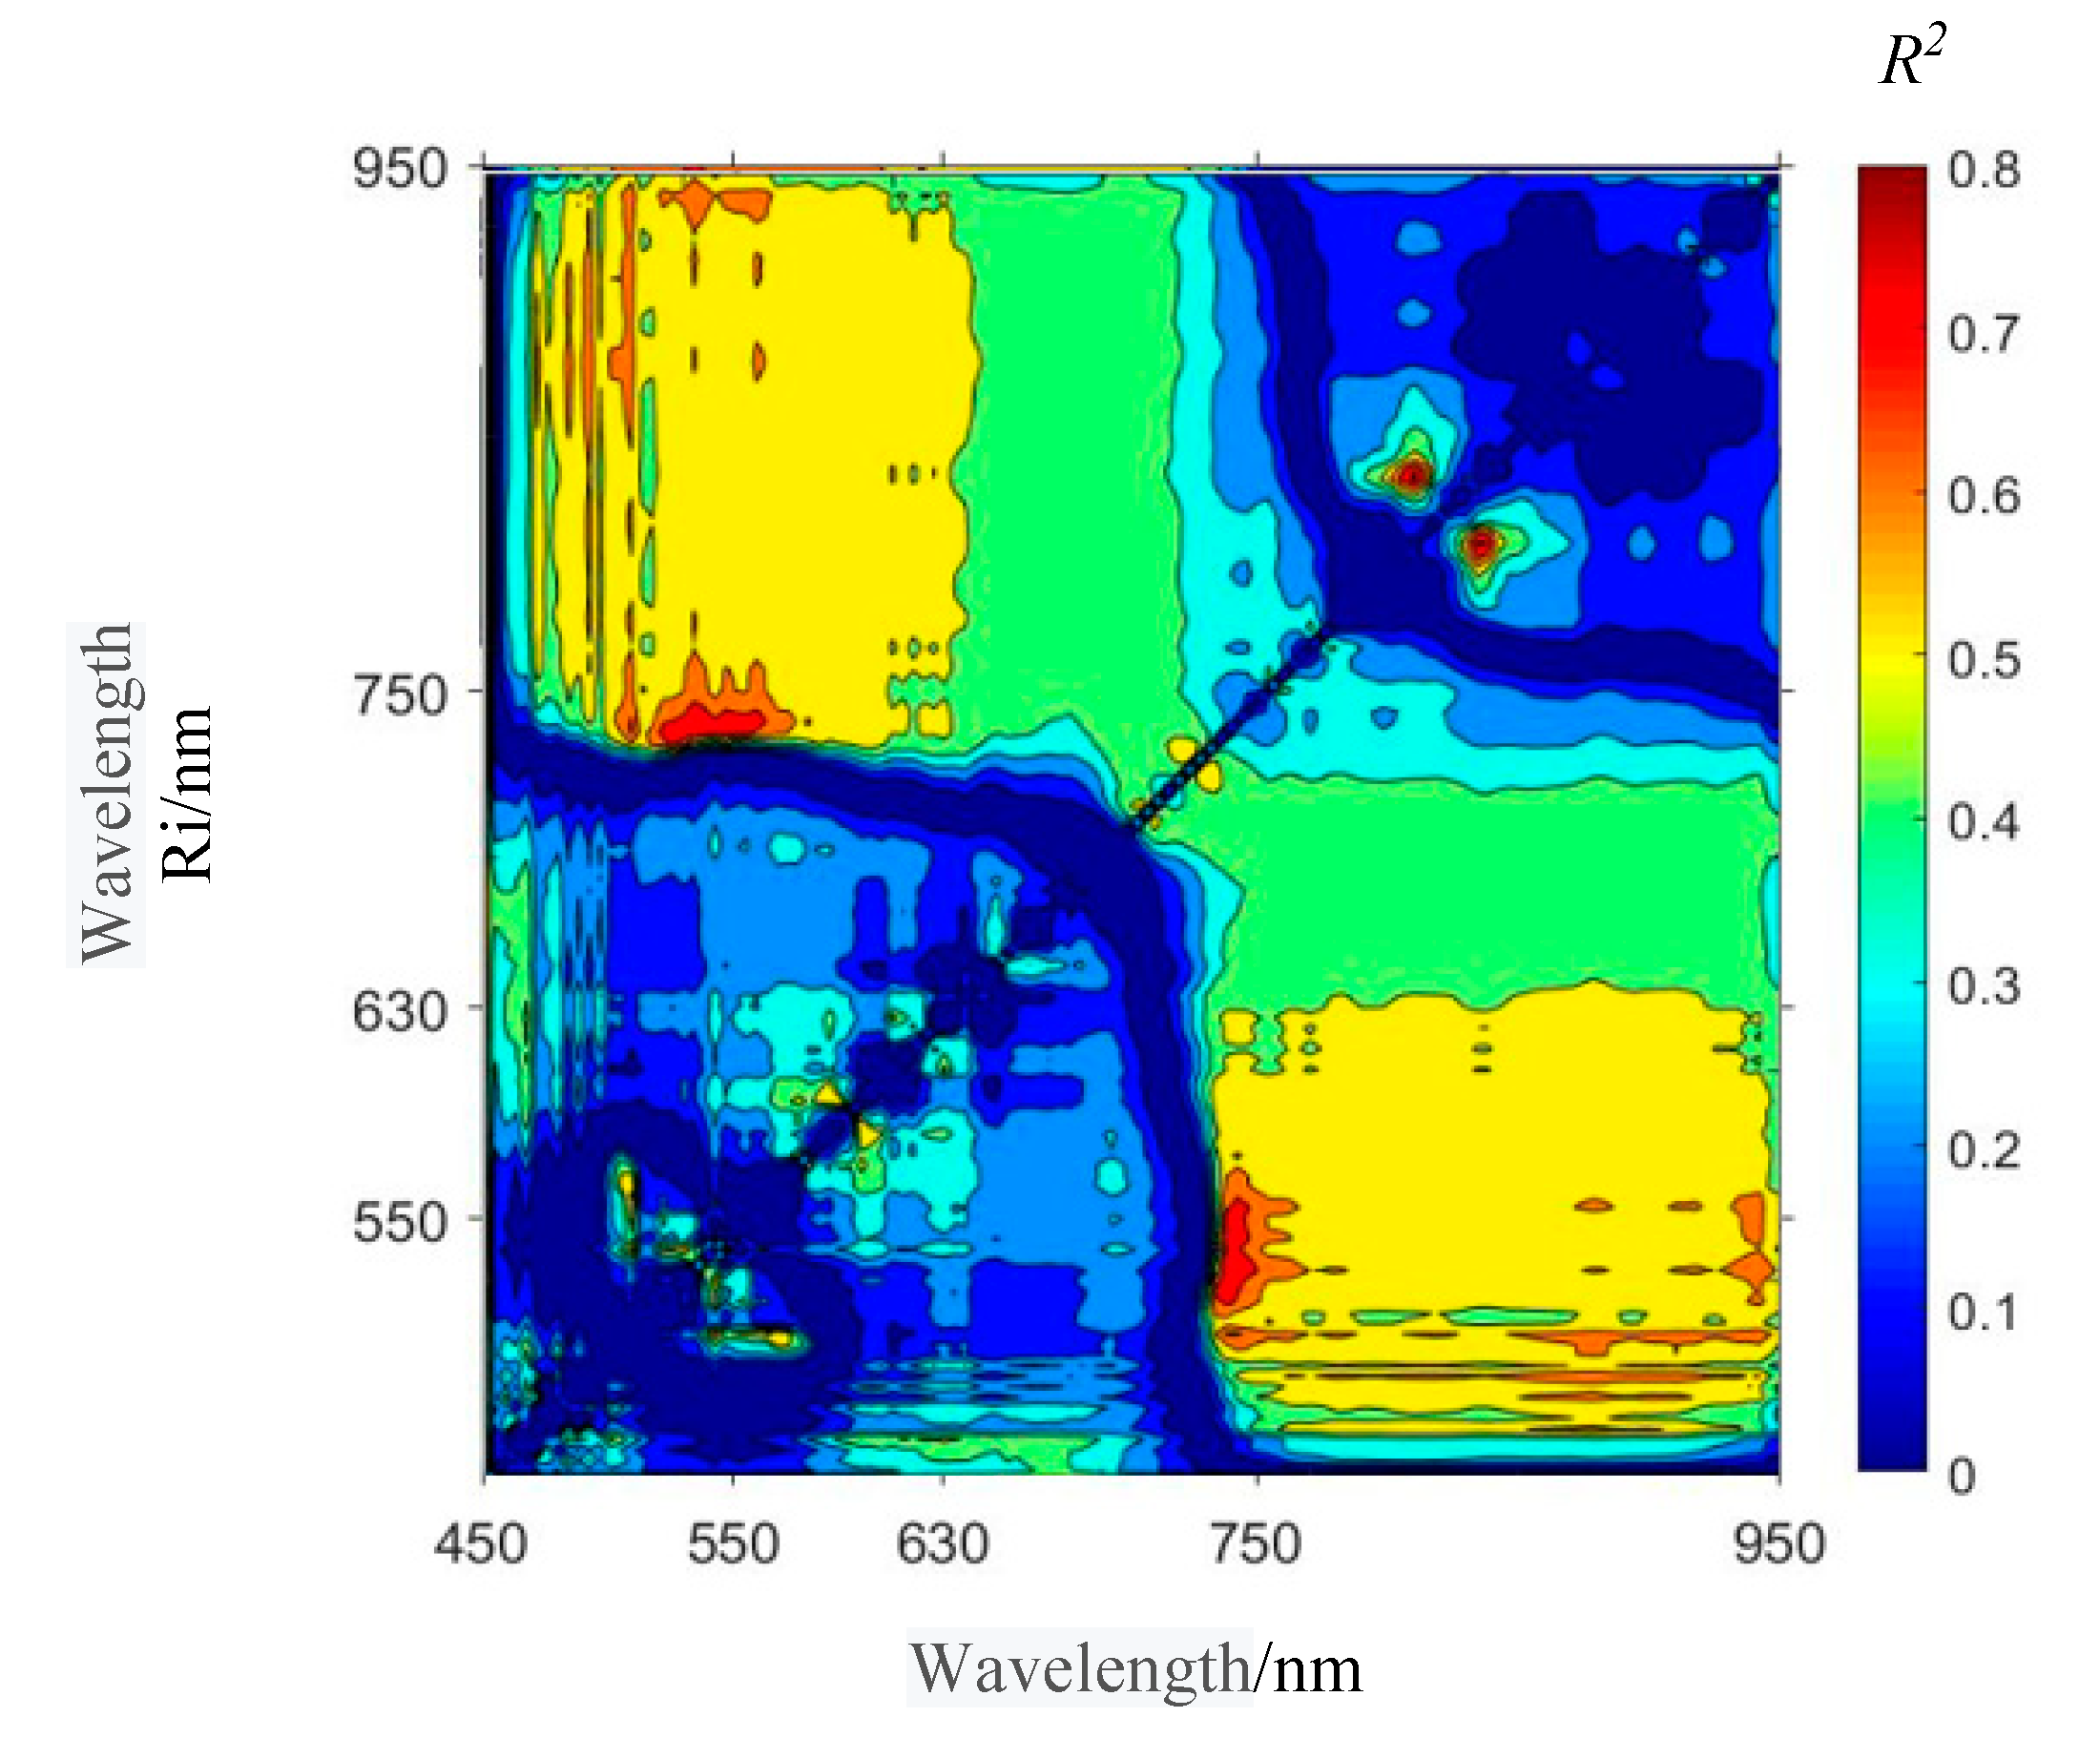
3.1. Selection of Spectral Index Combinations of Winter Wheat Take-All

The 450–700 nm range (visible light) is the strong absorption band of plant leaves. Due to the strong absorption of plant pigments, especially chlorophyll, green light reflection peaks are formed at 550 nm and red absorption valleys are formed at 660 nm, showing unique vegetation pigments Spectral characteristics [32].
It can be seen from the spectral reflectance curves of wheat at different disease levels that healthy wheat shows stronger reflection peaks and absorption valleys at 550 nm and 660 nm than the wheat affected by the disease, as depicted in Figure 3. The reason is that the spectral reflectance of winter wheat canopy decreases with the increase of chlorophyll content in leaves. Due to the increase of chlorophyll level, the photosynthesis of corresponding leaves increases, the absorption capacity of red and blue light is enhanced and the corresponding spectral reflectance is reduced. With the aggravation of wheat total erosion disease, the peak valley appearance gradually tends to be flat, the reflection platform in near-infrared band tends to be smooth, the spectral reflectance at 750–950 nm continues to decrease and the change between different disease grades is the most obvious at 750–950 nm (Figure 3).
The spectral combination range that can effectively estimate the disease index can be roughly observed by the isopotential map of determination coefficient constructed by disease index and spectral index NDSI (Figure 4). The red area shows the highest values of correlation and the blue area shows the lowest value. Figure 3 showed the correlation between wheat take-all disease index and spectral index. Some regions near the red edge at 750 nm showed extremely high correlation and a high correlation at 750–950 nm. The optimal spectral index combination was screened and the autocorrelation between bands was eliminated. The bands were screened by spectral interval.
The determination coefficient equipotential map was divided into 16 intervals according to the spectral ranges of 450, 550, 630 and 750 nm. Due to the symmetry of the equipotential map, four regions including the diagonal and six regions that do not repeat in the symmetric region were selected for the selection of spectral combination of a total of 10 regions. According to the determination coefficient R2 of equipotential map, the highest band combination in the region was selected as the inversion parameter of wheat take-all disease indices and its NDSI was calculated. In order to obtain the optimal disease index inversion model, the spectral index NDSI was constructed by extracting the highest spectral combination in each interval from the calculated results of the above equipotential map data. When the wavelength λ was between 450 nm and 550 nm, it was considered to be in the blue interval. If the wavelengths constituting NDSI are not in the same interval, this interval is named as the combination of their respective wavelength intervals.
The spectral combination information of 10 intervals was summarized in Table 2, among which the near infrared NDSI(R810,R834) had the highest determination coefficient (R2 = 0.828), followed by blue-red NDSI(R534,R742) (R2 = 0.793).

3.2. Wheat Take-All Disease Model Based on Spectral Index

Bands from the same wavelength range tend to have high correlation and accuracy loss could occur when regression model is built using hyperspectral bands without considering the correlation between them. Using the NDSI spectral index composed of bands from different wavelength ranges, binary and ternary variable regression models were constructed based on PLSR method and the results of all range combinations are shown in Table 3. The binary and ternary models with the highest coefficient of determination were selected as the optimal model combinations.
As can be seen from Table 3, the spectral indices combination of cross color band combination has played a good fitting effect. Among them, the combination of G-BR, N-BR, N-GR had a better fitting effect and B-GR-N and G-BR-N had a better fitting effect in the ternary combination. There were 24 combinations of binary and ternary variable models. The first six groups with determination coefficient above 0.75 were selected for further analysis and the PLSR model was used to establish the estimation model of wheat take-all disease indices. The predicted value of the disease indices were obtained and the determination coefficient between it and the measured value was calculated. The fitting formulas of the inversion model of the first six groups of disease indices with high determination coefficient were shown in Table 4.

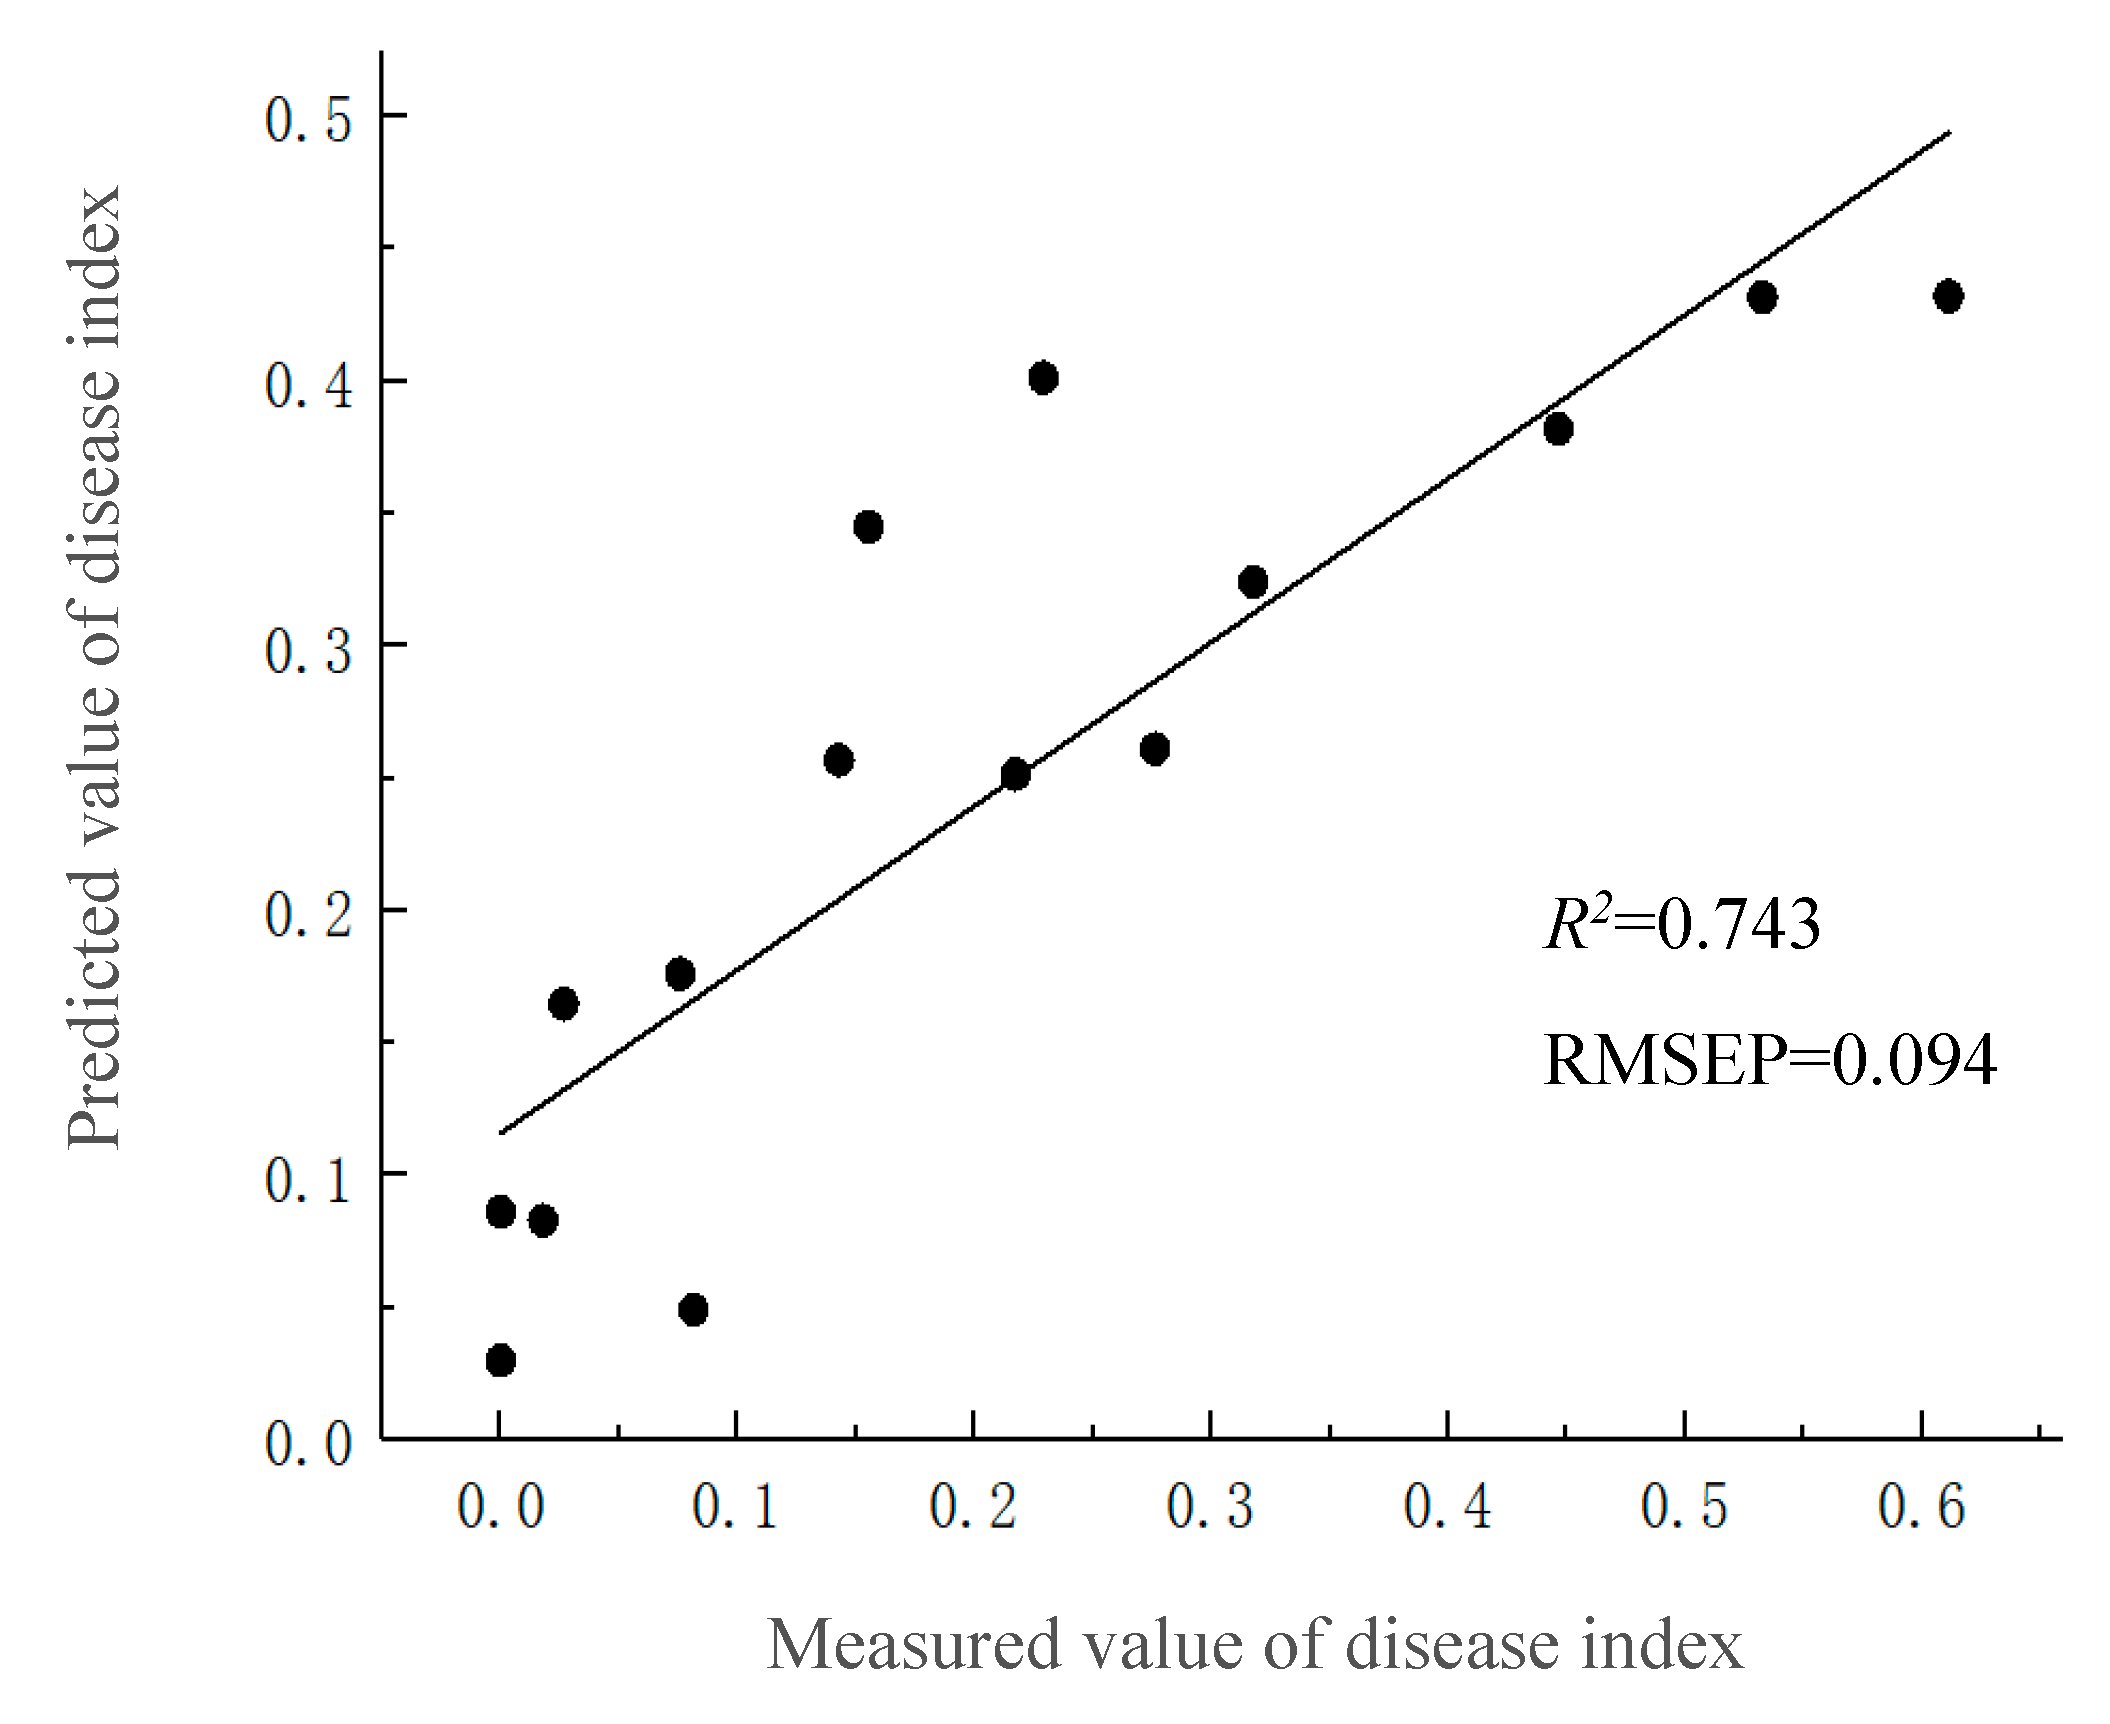
3.3. Validation of Inversion Model of Winter Wheat Take-All Disease Index

Fit test was performed on the 15 sample data in the validation group using the six models selected above and the coefficient of determination, root mean square error and mean absolute error between the estimated value and the measured value of the disease indices were obtained. The optimal disease index estimation model was obtained by comparing the verification accuracy and the three groups with the highest accuracy were selected for summary (Table 5).
The three models with high determination coefficients all contain the green-red composite spectral index NDSI(R534,R742), which has a great influence on the disease index inversion.
Compared with the binary parameter model, the near infrared NDSI(R810,R834) and green NDSI(R590,R598) were combined with NDSI(R534,R742) and it was found that the near infrared was better. Comparing binary variables with ternary variables, adding near infrared NDSI(R810,R834) variable can effectively improve the accuracy of the model, increase R2 and decrease RMSEP of the model. The best estimate model was Y = 134.577 − 70.301 NDSI(R590,R598) – 533 NDSI(R534.R742) + 51.584 NDSI(R810,R834) (R2 = 0.743, RMSEP = 0.094). It was the optimal disease index prediction model and Figure 5 showed the linear fitting results of this model. The following estimate models were Y = 133.059 + 32.751 NDSI(R810,R834) − 219.736 NDSI(R534,R742) (R2 = 0.728, RMSEP = 0.106) and Y = 137.507 − 65.786 NDSI(R590,R598) − 228.808 NDSI(R534,R742) (R2 = 0.726, RMSEP = 0.108).

4. Discussion

In this study, ground measured spectral data were used to select appropriate spectral bands by dividing spectral interval to construct spectral index and multiple spectral indices were used to construct wheat take-all disease index estimation model. The study found that under the stress of take-all disease, wheat leaves would wither due to root death, thus forming the white spike feature. The spectral reflectance of wheat decreased with the increase of disease degree and the change was most obvious in the range of 700–900 nm. The normalized difference spectral index (NDSI) adopted in this study can better reflect the growth status of vegetation, highlight the correlation between spectral bands and disease indices and provide better characteristic parameters for the construction of disease indices estimation model.
The optimal range of spectral index combination was found out by using the determination coefficient equipotential map made by NDSI and the disease index. At the same time, the band combination was selected in different zones and the autocorrelation among bands was fully considered. It was found that near infrared NDSI(R810,R834) had the strongest correlation with the disease index and NDSI(R534,R742) in the cross band combination was the most critical to the establishment of the model, which was included in all three models. This spectral index is composed of R534 and R742, which are located at the blue-green boundary and the red edge, respectively. The spectral response at this position is strong, because the change of cell fluid in plant leaves will affect the change of pigment, thus affecting the spectral reflectance and red edge changes in the visible range [18]. The spectral response of crop diseases and insect pests is related to their symptoms. By comparing G-BR and G-BR-N models, it was found that near-infrared features can effectively increase the accuracy of the model, because the reflectance of NIR band was directly affected by cell structure [2]. The chlorophyll content in wheat cells was decreased due to the wilt of wheat plants caused by take-all and the reflectance of NIR region was decreased. After increasing the NIR spectral index, the R2 of the model was slightly increased. The accuracy of G-BR-N ternary model was slightly higher than that of BR-N binary model. The green light feature was also one of the important characteristics affecting the physiological status of vegetation in this disease [33].
Based on the above characteristic information, a multivariate spectral index combination form with NDSI as variable was established. Using the partial least squares regression model, it was obtained as the optimal disease index estimation model by step-by-step optimization. as is shown in Equation (6), R2 = 0.743, RMSEP = 0.094. This model can be used to estimate the occurrence of wheat take-all in the field.
Y = 134.577 − 70.301 NDSI(R590,R598) − 223.533 NDSI(R534,R742) + 51.584 NDSI(R810,R834)
The method proposed in this study can make full use of the spectral information of different wavebands to construct a high-precision disease level assessment model, which can provide powerful technical support for precision agriculture. However, the experimental samples used in this research are limited. The next step will be to collect more experimental data to quantitatively analyze the disease status of multiple crops. In addition, the disease index estimation model proposed in this study will also be extended and applied to UAV imaging spectral data analysis to further verify its effectiveness.

Author Contributions

Conceptualization, W.G. and H.Z.; methodology, H.Z. and W.G.; validation, W.G. and H.Z.; formal analysis, H.Z.; investigation, H.Z.; writing—original draft preparation, H.Z., Y.Y.; writing—review and editing, H.Z., Y.Y., R.S., W.G. and M.H.A.B.; visualization, P.D. and Q.J.; supervision, Z.L. and Z.Y. All authors have read and agreed to the published version of the manuscript.

Funding

This research was funded by National Key R&D Program of China (2017YFD0201900), Henan Province Science and Technology Research Project (212102110028, 182102110291), Geological Research Project of Hebei Bureau of Geology and Mineral Resources (454-0601-YBN-DONH), National engineering research center for Argo-ecological big data analysis and application: AE202005; and Fundamental Research Funds for the Central Universities (2021YJSDC16).

Conflicts of Interest

The authors declare no conflict of interest.

References

  1. Qiao, H.; Jiao, H.; Wu, X.; Si, H.; Shi, L.; Guo, W.; Ma, X.; Zhou, Y. Remote sensing monitoring of winter wheat take-all damage level based on support vector machine model. J. Triticeae Crop. 2014, 34, 1694–1698. [Google Scholar]
  2. Zhang, L.; Zhao, J.; Jia, K.; Li, X. Plant Spectral Discrimination Based on Phenological Features. Spectrosc. Spectr. Anal. 2015, 35, 2836–2840. [Google Scholar]
  3. Li, W. Advances in application of hyperspectral remote sensing technology in monitoring agricultural pests and diseases. Mod. Agric. Sci. Technol. 2019, 14, 126–128. [Google Scholar]
  4. Tan, C.; Wang, J.; Huang, W.; Liu, L.; Huang, Y.; Yan, W. Application of hyperspectral remote sensing in physicochemical information extraction of vegetation. J. Northwest Agric. For. Univ. 2005, 6, 151–156. [Google Scholar]
  5. Zhao, H.; Yang, C.; Guo, W.; Zhang, L.; Zhang, D. Automatic Estimation of Crop Disease Severity Levels Based on Vegetation Index Normalization. Remote Sens. 2020, 12, 1930. [Google Scholar] [CrossRef]
  6. Guo, J.; Huang, C.; Wang, H.; Sun, Z.; Ma, Z. Inversion of stripe rust disease index of different wheat varieties based on hyperspectral remote sensing technology. Spectrosc. Spectr. Anal. 2009, 29, 3353–3357. [Google Scholar]
  7. Lei, Y.; Han, D.; Zeng, Q.; He, D. Grading method of wheat stripe rust disease degree based on hyperspectral imaging technology. Trans. Chin. Soc. Agric. Mach. 2018, 49, 226–232. [Google Scholar]
  8. Chen, Y.; Jiang, J.; Huang, W.; Wang, Y. Comparative study on severity of stripe rust in winter wheat estimated by principal component Analysis and empirical vegetation index method. Spectrosc. Spectr. Anal. 2009, 29, 2161–2165. [Google Scholar]
  9. Ashourloo, D.; Mobasheri, M.; Huete, A. Evaluating the Effect of Different Wheat Rust Disease Symptoms on Vegetation Indices Using Hyperspectral Measurements. Remote Sens. 2014, 6, 5107–5123. [Google Scholar] [CrossRef] [Green Version]
  10. Zheng, Z.; Qi, L.; Ma, X.; Zhu, X.; Wang, W. Grading method of rice leaf blast disease based on hyperspectral imaging technology. Trans. Chin. Soc. Agric. Eng. 2013, 29, 138–144. [Google Scholar]
  11. Qiao, H.; Shi, Y.; Guo, W.; Shi, L.; Ma, X.; Zhou, Y. Monitoring of wheat take-all by near-earth imaging hyperspectral remote sensing. J. Plant Prot. 2015, 42, 475–476. [Google Scholar]
  12. Guo, W.; Zhu, Y.; Wang, H.; Zhang, J.; Dong, P.; Qiao, H. Study on winter wheat take-all monitoring model based on UAV hyperspectral image. Trans. Chin. Soc. Agric. Mach. 2019, 50, 162–169. [Google Scholar]
  13. Zhang, J.; Yuan, L.; Wang, J.; Luo, J.; Du, S.; Huang, W. Advances in remote sensing monitoring of crop diseases and insect pests. Trans. Chin. Soc. Agric. Eng. 2012, 28, 1–11. [Google Scholar]
  14. Sun, J.; Song, Y.; He, W.; Yang, G. Research on wheat take-all and its pathogens. J. Henan Agric. Sci. 2010, 5, 134–137. [Google Scholar]
  15. Teke, M.; Deveci, H.S.; Haliloglu, O.; Gurbuz, S.Z.; Sakaray, U. A short survey of hyperspectral remote sensing applications in agriculture. In Proceedings of the International Conference on Recent Advances in Space Technologies, Istanbul, Turkey, 12–14 June 2013. [Google Scholar]
  16. Zhang, N.; Yang, G.; Zhao, C.; Zhang, J.; Yang, X.; Pan, Y.; Huang, W.; Xu, B.; Li, M. Progress and prospect of hyperspectral remote sensing for crop pests and diseases. J. Remote. Sens. 2021, 25, 403–422. [Google Scholar]
  17. Fu, K.; Zhang, W.; Cao, H.; Zhu, Y.; Sha, W.; Zhang, W.; Feng, C. Research progress of crop pests and diseases monitoring based on spectral. China Agric. Sci. Technol. Rev. 2014, 16, 90–98. [Google Scholar]
  18. Yuan, L.; Huang, Y.; Loraamm, R.W.; Nie, C.; Wang, J.; Zhang, J. Spectral analysis of winter wheat leaves for detection and differentiation of diseases and insects. Field Crop. Res. 2014, 156, 199–207. [Google Scholar] [CrossRef] [Green Version]
  19. Wu, C.; Niu, Z.; Tang, Q. Modification of leaf photochemical vegetation index (PRI) and its sensitivity analysis. Spectrosc. Spectr. Anal. 2008, 2014, 2018. [Google Scholar]
  20. Lees, K.J.; Artz, R.; Khomik, M.; Clark, J.M.; Ritson, J.; Hancock, M.H.; Cowie, N.R.; Quaife, T. Using Spectral Indices to Estimate Water Content and GPP in Sphagnum Moss and Other Peatland Vegetation. IEEE Trans. Geosci. Remote Sens. 2020, 58, 1–11. [Google Scholar] [CrossRef] [Green Version]
  21. Xu, C.; Zhu, X.; Pan, Y.; Zhu, W.; Lei, Y. Comparative study of rice Information extraction based on NDII and NDVI. Geogr. Geogr. Inf. Sci. 2008, 5, 44–46. [Google Scholar]
  22. Zhang, J.; Wang, S. Spatio-Temporal Evolution and Prediction of Tourism Comprehensive Climate Comfort in Henan Province, China. Atmosphere 2021, 12, 1–19. [Google Scholar]
  23. Yang, K.; Guo, D. Analysis of vegetation hyperspectral characteristics and extraction of disease information. Geogr. Geogr. Inf. Sci. 2006, 13, 31–34. [Google Scholar]
  24. Wang, N.; Feng, Y.; Du, W.; Wang, Y.; Chen, H. Study on pathogenicity of wheat take-all and resistance of wheat varieties. J. Plant Genet. Resour. 2012, 13, 478–483. [Google Scholar]
  25. Zhang, L.; Huo, Z.; Wang, L.; Wu, L.; Zhang, G. Dynamic warning of wheat powdery mildew occurrence by meteorological grade in Hebei Province. J. Ecol. 2015, 34, 2489–2497. [Google Scholar]
  26. Pei, H.; Feng, H.; Li, C.; Jin, X.; Li, Z.; Yang, G. Remote sensing monitoring of winter wheat growth by UAV based on comprehensive indexes. Trans. Chin. Soc. Agric. Eng. 2017, 33, 74–82. [Google Scholar]
  27. Kristin, T.; Harald, M. Analyzing complex mathematical model behavior by partial least squares regression-based multivariate metamodeling. Wiley Interdiscip. Rev. Comput. Stat. 2014, 6, 440–475. [Google Scholar]
  28. Krishna, G.; Sahoo, R.N.; Pargal, S.; Gupta, V.K.; Sinha, P.; Bhagat, S.; Saharan, M.S.; Singh, R.; Chattopadhyay, C. Assessing wheat yellow rust disease through hyperspectral remote sensing. ISPRS-International Archives of the Photogrammetry. Remote Sens. Spat. Inf. Sci. 2014, 8, 1413–1416. [Google Scholar]
  29. Romain, B.; Alexis, C.; Rémi, M.; Vincent, L.; Philippe, V.; Benjamin, D.; Benoit, M. In-field proximal sensing of septoria tritici blotch, stripe rust and brown rust in winter wheat by means of reflectance and textural features from multispectral imagery. Biosyst. Eng. 2020, 197, 257–269. [Google Scholar]
  30. Liu, L.; Dong, Y.; Huang, W.; Du, X.; Ren, B.; Huang, L.; Zheng, Q.; Ma, H. A Disease Index for Efficiently Detecting Wheat Fusarium Head Blight Using Sentinel-2 Multispectral Imagery. IEEE Access 2020, 8, 52181–52191. [Google Scholar] [CrossRef]
  31. Guo, A.; Huang, W.; Ye, H.; Dong, Y.; Ma, H.; Ren, Y.; Ruan, C. Identification of Wheat Yellow Rust using Spectral and Texture Features of Hyperspectral Images. Remote Sens. 2020, 12, 1419. [Google Scholar] [CrossRef]
  32. Yang, K.; Zhang, W.; Wang, X.; Sun, T.; Cheng, L. Classification and degree monitoring of copper and lead pollution in maize leaves based on spatial spectrum. Spectrosc. Spectr. Anal. 2018, 38, 2200–2208. [Google Scholar]
  33. Graeff, S.; Link, J.; Claupein, W. Identification of powdery mildew (Erysiphe graminis sp. tritici) and take-all disease (Gaeumannomyces graminis sp. tritici) in wheat (Triticum aestivum L.) by means of leaf reflectance measurements. Cent. Eur. J. Biol. 2006, 1, 275–288. [Google Scholar] [CrossRef]
Figure 1. The location of the field test area for the take-all wheat disease and the roots of the diseased wheat.
Applsci 11 09230 g001
Figure 2. ASD FieldSpec HandHeld spectrometer (left) field data measured scene (right).
Applsci 11 09230 g002
Figure 3. Spectral curves of wheat with different disease grades.
Applsci 11 09230 g003
Figure 4. Contour maps of R2 between disease index and NDSI.
Applsci 11 09230 g004
Figure 5. Accuracy verification of wheat take-all prediction results.
Applsci 11 09230 g005
Table 1. Grading criteria for wheat take-all.
GradeGrading Standard
0Healthy
1The Root Disease Area Accounted for 1–5% of the Total Root Area
3The Root Disease Area Accounted for 6–20% of the Total Root Area
5The Root Disease Area Accounted for 21–40% of the Total Root Area
7The Root Disease Area Accounted for 41–60% of the Total Root Area
9The Root Disease Area Accounted for more than 60% of the Total Root Area
Table 2. Optimum spectral index and its determination coefficient.
Range NameCodeSpectral IndexR2
BlueBNDSI(R510,R542)0.649
GreenGNDSI(R590,R598)0.590
RedRNDSI(R706,R710)0.556
Near InfraredNNDSI(R810,R834)0.828
Blue-GreenBGNDSI(R510,R562)0.616
Blue-RedBRNDSI(R534,R742)0.793
Blue—Near InfraredBNNDSI(R534,R942)0.677
Green—RedGRNDSI(R554,R742)0.751
Green—Near InfraredGNNDSI(R558,R942)0.636
Red—Near InfraredRNNDSI(R634,R878)0.522
Table 3. Binary and ternary spectral indices combination models and their determinants.
IDRange CombinationR2IDRange CombinationR2
1 *B-GR0.75813B-G0.298
2B-GN0.69114B-R0.362
3B-RN0.64315B-N0.316
4 *G-BR0.75916G-R0.413
5G-BN0.73117G-N0.286
6G-RN0.65818R-N0.372
7R-GB0.35119 *B-GR-N0.762
8R-BN0.73220B-GN-R0.692
9R-GN0.69121B-RN-G0.736
10N-BG0.30022 *G-BR-N0.760
11 *N-BR0.75523G-BN-R0.732
12 *N-GR0.75024R-GB-N0.374
* the optimal model combinations.
Table 4. Optimal band combinations and fitting formulas.
Band CombinationFitting FormulaR2
G-BRY = 137.507 − 65.786 NDSI(R590,R598) − 228.808 NDSI(R534,R742)0.759
N-BRY = 133.059 + 32.751 NDSI(R810,R834) − 219.736 NDSI(R534,R742)0.755
B-GRY = 113.968 + 35.529 NDSI(R590,R598) 211.716 NDSI(R554,R742)0.758
N-GRY = 111.824 + 11.54 NDSI(R810,R834) 193.693 NDSI(R554,R742)0.750
G-BR-NY = 134.577 − 70.301 NDSI(R590,R598) − 223.533 NDSI(R534,R742)
+ 51.584 NDSI(R810,R834)
0.760
B-GR-NY = 107.966 + 53.344 NDSI(R590,R598) − 206.922 NDSI(R534,R742)
+ 51.584 NDSI(R810,R834)
0.762
Table 5. Band combinations with the highest validation accuracy.
Band CombinationSpectral IndexR2RMSEP
G-BRNDSI(R590,R598), NDSI(R534,R742)0.7260.108
N-BRNDSI(R810,R834), NDSI(R534,R742)0.7280.106
G-BR-NNDSI(R590,R598), NDSI(R534,R742)
NDSI(R810,R834)
0.7430.094
Publisher’s Note: MDPI stays neutral with regard to jurisdictional claims in published maps and institutional affiliations.

