Article

Comprehensive Assessment of the Dynamics of Banana Chilling Injury by Advanced Optical Techniques

1
Department of Agricultural Engineering, Leibniz Institute for Agricultural Engineering and Bioeconomy, Max-Eyth-Allee 100, D-14469 Potsdam, Germany
2
Department of Postharvest, Commerce, Supply Chain and Sensory Science, Institute of Food Science and Technology, Hungarian University of Agriculture and Life Sciences, Villányi út 29-43, Building D, H-1118 Budapest, Hungary
*
Author to whom correspondence should be addressed.
Appl. Sci. 2021, 11(23), 11433; https://doi.org/10.3390/app112311433
Submission received: 9 September 2021 / Revised: 16 November 2021 / Accepted: 25 November 2021 / Published: 2 December 2021
(This article belongs to the Special Issue Applications of Optical Spectroscopy in Plant Sciences)

Abstract

:
Green-ripe banana fruit are sensitive to chilling injury (CI) and, thus, prone to postharvest quality losses. Early detection of CI facilitates quality maintenance and extends shelf life. CI affects all metabolic levels, with membranes and, consequently, photosynthesis being primary targets. Optical techniques such as chlorophyll a fluorescence analysis (CFA) and spectroscopy are promising tools to evaluate CI effects in photosynthetically active produce. Results obtained on bananas are, however, largely equivocal. This results from the lack of a rigorous evaluation of chilling impacts on the various aspects of photosynthesis. Continuous and modulated CFA and imaging (CFI), and VIS remission spectroscopy (VRS) were concomitantly applied to noninvasively and comprehensively monitor photosynthetically relevant effects of low temperatures (5 °C, 10 °C, 11.5 °C and 13 °C). Detailed analyses of chilling-related variations in photosynthetic activity and photoprotection, and in contents of relevant pigments in green-ripe bananas, helped to better understand the physiological changes occurring during CI, highlighting that distinct CFA and VRS parameters comprehensively reflect various effects of chilling on fruit photosynthesis. They revealed why not all CFA parameters can be applied meaningfully for early detection of chilling effects. This study provides relevant requisites for improving CI monitoring and prediction.

1. Introduction

After harvest, fresh fruit and vegetables are highly physiologically active and perishable products. Continued metabolic processes such as transpiration or respiration may significantly affect their quality, thus, shortening shelf life. Practically used since long, low, nonfreezing storage temperatures effectively slow down physiological activity, retain quality, and prolong shelf life, although in a produce-specific way [1,2].
Particularly subtropical and/or tropical fruits and vegetables are very sensitive to these low temperatures (<10 °C). Exposed to such chilling stress during storage, sorting, transportation, or shipping, they may suffer serious injuries. The physiological disorders attributed to chilling injury (CI) comprise damages at various metabolic levels, such as membrane integrity, reactive oxygen species or transcriptome [3,4,5]. The manifestation of CI depends on the specific sensitivity of products or cultivars to low temperatures and on intensity, duration, and/or intermittency of exposure to chilling temperatures. It is also a function of the physiological status and the maturity stage of the produce. Symptoms of chilling injury, however, typically become severely visible only in retail after removal from chilled conditions and negatively affect produce quality and marketability [4,6,7]. Various postharvest approaches (chemical treatments, produce-dependent time-temperature management, short-time heat treatments such as hot water dips, hot air or hot vapor treatments) were suggested to reduce and/or alleviate the symptoms of CI [8,9].
Among the economically most important tropical fruit, green-ripe bananas are very chilling-sensitive and develop all CI-associated symptoms when stored below a threshold temperature of approx. 13 °C [10,11,12]. However, in banana, chilling susceptibility highly depends on cultivar [8,13], maturity stage [14,15] and ripeness status (i.e., whether ethylene-treated or not; [14,16]) of the fruit.
Optimal conditions for storage and transport of green-ripe bananas are 13–14 °C and 90 to 95% relative humidity [17], and 15–20 °C for ripening [18]. Although storage at temperatures below the above threshold reduces mass losses, respiration, and ethylene biosynthesis of fruit, it also induces CI. Frequent unique visible symptoms (smoky peel surface discoloration, dark-brown streaked subepidermal tissue discoloration) indicate that CI is mainly but not exclusively a peel disorder [10,19]. In severe cases, the peel can turn dark brown or black [20,21], and only then, the flesh becomes brown, drastically reduces its characteristic fruit flavor [22] and develops off-flavor [23]. In any case, chilling-injured green-ripe fruit are more sensitive to mechanical damage during handling [24] and, in addition, may fail to ripen [20,25]. The latter is, however, valid only if artificial ripening has not been previously induced by application of ethylene [26]. On the other hand, moderate CI may develop after one hour at 10 °C or 72 h at 12.8 °C [24]. Irrespective of green- or full-ripe fruit, CI symptoms may not become apparent before 18 to 24 h after actual damage has occurred [18,24].
During ripening at non-chilling temperatures, the typical color changes from green to yellow result from the breakdown of chlorophyll (Chl), which then unmasks the plastidic carotenoids [26,27,28] without or with only very minor additional synthesis of the latter pigments [25,26,29]. In contrast to some earlier findings [14], some recent reports indicated that chilling conditions did not inhibit but tended to accelerate chlorophyll degradation in green-ripe fruit [16,26]. However, chilling-induced brown and/or black discolorations do not depend on either of these pigments but result from enzymatic oxidation of various phenolics by the concerted action of phenylalanine ammonia lyase (PAL) and polyphenol oxidase (PPO) in combination with non-enzymatic reactions [13,30]. Pongprasert et al. (2011) [16] suggested that membrane degradation due to chilling-enhanced cellular oxidative stress [11,17] results in the loss of cellular compartmentation and the mixing of phenolic substances. Then, PPO might contribute to brown and black discolorations of the peel tissue.
The general finding that symptoms of CI may become visible only after transfer to shelf life conditions (see above) has also been reported for banana [11,12,26]. However, other reports indicated CI occurrence during storage at chilling temperatures [6,8], even if these are moderate [10,31]. The reason(s) for this discrepancy is(are) not clear but may depend on storage or experimental conditions, e.g., temperatures used, on developmental stage or on provenance of fruit. Nevertheless, this issue certainly needs closer examination.
Membrane damage, increased permeability and impaired compartmentation seem to be the basic mechanisms of CI [2,4,32]. This, in turn, renders photosynthesis an early and major target of chilling stress in photosynthetically active fruits and vegetables. Consequently, chlorophyll-fluorescence analysis (CFA) [33,34,35] provides a useful tool to rapidly and noninvasively evaluate the development and the severity of CI symptoms [36]. CFA and particularly the potential maximal photochemical efficiency of PSII (Fv/Fm), has indeed been used widely to monitor the concomitant decline in the efficiency and/or the integrity of photosystem II (PSII) as well as the often-subsequent degradation of chlorophyll molecules [12,36,37,38,39]. As summarized earlier [34,35,40,41], more specific CFA parameters may provide in-depth understanding of chilling-related physiologically regulated and non-regulated changes in the partition of absorbed radiation energy among various photochemical processes (actual photochemical efficiency of PSII, ΦPSII; photochemical quenching, qP and qL [35] and relevant protection mechanisms (quantum yield of regulated and non-regulated non-photochemical energy dissipation in PSII, YNPQ, and YNO, non-photochemical quenching, qN and NPQ [40]). In addition, the detailed evaluation of the polyphasic fluorescence rise [42,43] of the rapid Kautsky kinetics [44] in the OJIP test [45,46] may give additional insight into primary photophysical and photochemical events in PSII [46,47] and can be applied for the rapid evaluation of biotic and abiotic stress effects on the quantum efficiency of PSII photochemistry and the activity of the photosynthetic electron transport chain [48].
Furthermore, non-invasive visible- (VIS-) and near-infrared (NIR) spectroscopy may also reveal important CI-related short- and long-term changes in the contents of relevant photosynthetic (chlorophylls, carotenoids) and non-photosynthetic phenolic pigments [49,50]. For this purpose, both advanced statistical analyses but also classical parameters such as the normalized difference vegetation index (NDVI), the photochemical reflectance index (PRI), and the normalized anthocyanin index (NAI) are useful tools to analyze spectra obtained [51,52,53,54].
In contrast to CFA [11,12], VIS remission spectroscopy has not yet been applied for the analyses of CI effects in bananas. Thus, continuous and modulated CFA and imaging, and VIS-spectroscopy were, for the first time, applied concomitantly to rapidly, noninvasively, and comprehensively monitor the effects of a range of relevant low, nonfreezing temperatures (5 °C, 10 °C, 11.5 °C and 13 °C as control) on various aspects of photosynthetic activity and contents of photosynthetic, photoprotective, and attractive pigments in green-ripe banana fruit. These data provided detailed analyses of the potential dynamics of chilling injury-related variations in photosynthetic activity and photoprotection to better understand these physiological changes during CI development in green-ripe banana. This and the effective early detection and identification and, potentially, the prediction of CI may help to prevent or alleviate chilling stress, facilitate quality maintenance, and extend shelf life of highly chilling-sensitive banana fruit and of other green produce in practice. Furthermore, the parallel application of different fluorometers with very distinct specifications and properties now also allows the direct comparison of the different analytic approaches.

2. Materials and Methods

2.1. Material and Storage Conditions

A full box (18 kg) of untreated green-ripe ‘Cavendish’ bananas (Musa cavendishii L.), uniform in maturity (maturity stage 2; Figure 1) was directly obtained from a banana ripening station (Frucht Express GmbH, Groß Kreutz, Germany). A total of 72 bananas were selected for uniform size and mass, divided into four groups (18 samples, each), representing the different storage temperature treatments (A: 5 ± 0.5 °C; B: 10 ± 0.5 °C, C: 11.5 ± 0.5 °C; D: 13 ± 0.5 °C), placed onto plastic trays and packed in commercially available LDPE bags. Then the samples were stored in darkness in temperature and humidity-controlled climate chambers (WK600, SB222, and VB1014, Weiss Umwelttechnik GmbH, Balingen, Germany) at the respective temperatures and 95 ± 1% relative humidity. After 12 d, samples were further stored at 18 ± 0.5 °C but otherwise the same conditions in the same chambers together with ripe ‘Braeburn’ apples (as a simple but very effective manner to induce ripening) for five days to simulating shelf life conditions.
For spot measurements (fluorometers and spectrometer), six measuring points, three on each side, were marked equally distributed (near stem-end, at the middle part and close to the tip) along the samples. For fluorescence imaging, images were taken for both sides.

2.2. Chlorophyll-Fluorescence Imaging

Chlorophyll-fluorescence imaging was performed with a FluorCam 700MF (PSI, Brno, Czech Republic), consisting of a long-pass (excluding excitation light) filter-equipped CCD camera (spatial resolution, 512 × 512 pixel), two panels of 345 orange LEDs each (peak wavelength 620 nm) providing a pulsed (100 or 30 Hz) weak measuring light (photosynthetic photon flux rates, PPFR < 2 µmol m−2 s−1) and a halogen lamp (250 W, with electronically controlled shutter) for saturation light pulses (1 s; PPFR > 2.0 mmol m−2 s−1). System control, recording, and analyses of fluorescence image and visualization of data was performed using the FluorCam 6.0 software (for detail see [55]).

2.3. Chlorophyll-Fluorescence Analysis—Rapid Light Curves

Rapid light curves (RLC) [35,56,57] were obtained at three positions distributed near stem-end, at the middle part and close to fruit tip with PAM fluorometers (MiniPAM, PAM2000, Heinz Walz GmbH, Effeltrich, Germany). After measuring the basic fluorescence signal, F0, the maximum fluorescence (Fm) was obtained by applying a saturation light pulse (0.8 s; PPFR > 2.5 mmol m−2 s−1). Then, actinic light was provided with a halogen lamp, fitted to the fluorometers, in nine steps for 30 s each (approx. 5, 10, 20, 30, 50, 70, 110, 155, and 235 µmol m−2 s−1). At the end of each illumination period, the semi-steady-state fluorescence signal (Ft) was measured, and a saturation pulse given to induce the maximum fluorescence signal obtained under light conditions (Fm′).
From these parameters, initial Fv/Fm (variable fluorescence Fv = FmF0) was calculated and the respective values of ϕPSII ((Fm′ − Ft)/Fm′), photosynthetic electron transport rates (ETR = ϕPSII × PPFR × a × d; with a (absorption coefficient, assumed as a = 0.84) × PPFR providing the number of absorbed photons and d (distribution coefficient, d = 0.5) reflecting their assumed (equal) distribution between PSI and PSII. From the analysis of the relationship between ETR and PPFR, the maximum photosynthetic quantum yield (α) was obtained as the initial slope and ETRmax, the maximum light saturated electron transport rate obtained by fitting an exponential model [57]. Furthermore, from the above basic parameters, also the photochemical quenching coefficient (qP = (Fm′ − Ft)/(FmF0)), the non-photochemical quenching (NPQ = (FmFm′)/Fm′), and the quantum yields of regulated (YNPQ = Ft/Fm′−Ft/Fm) and non-regulated non-photochemical energy loss in PSII (YNO = Ft/Fm) were calculated for each PPFR step (c.f. [35,58]).

2.4. Chlorophyll-Fluorescence Analysis—OJIP Test

The polyphasic rise of the rapid chlorophyll-fluorescence induction kinetics [42,43] were recorded with a FluorPen FP 100-MAX (PSI, Brno, Czech Republic). Cardinal points (Fo, Fj, Fi, Fm, Fv, Vj, Vi) resulting from the transients were used to analyze relevant parameters of the so-called OJIP test [35,45], i.e., Fv/Fm, the performance index on absorption basis (PIABS) and the maximum primary yield of PSII (Fv/Fo) were evaluated [45,47,48]. The latter parameters were chosen because they showed the most pronounced responses. Following van Heerden et al. (2003) [59], the performance index was calculated as
PI ABS =   1 ( F o / F m ) M o / V j   ×   F m   F o F o   ×   1 V j V j
with M0 being the net rate of PS II closure [4 × (F300µsF50µs)/(FmF50µs)] and Vj the relative variable fluorescence (F) at 2 ms. In particular, PIABS gives overall information on the photosynthetic performance under stress by monitoring the functionality of PSII and PSI [59].

2.5. UV/VIS-Spectroscopy

A portable custom-made UV/VIS mini-spectrometer (tec5 AG, Steinbach, Germany) was used in the remission mode to record fruit spectra at 2.5 nm intervals in the range of 300 nm to 1100 nm at three measuring position on the two opposite sides each (near stem-end, middle part, close to tip). These six spectra were averaged to yield a mean spectrum representative for each fruit. From these spectral data, the normalized difference vegetation index (NDVI = (R530R570)/(R530 + R570)), the photochemical reflectance index (PRI = (R800R520)/(R800 + R695)), the carotenoids index (carI = R800/R520R800/R700) and the chlorophylls-to-carotenoids ratio (chl/car = (R480R678)/R800) were calculated [49,51,52,53,60,61] for the characterization of chlorophyll and carotenoid contents of banana. Data obtained this way were further evaluated as means per treatment.

2.6. CIE L*a*b* Color Parameters

To facilitate the comparison of results presented here with earlier studies, CIE Lab color coordinates (L* = lightness [0 = black; 100 = diffuse white]; a* = green [−a] to red [+a] axis, b* = blue [−b] to yellow [+b] axis) were also measured with a portable CM-2600d spectrophotometer (Konica Minolta Sensing Europe B.V., Nieuwegein, Netherlands) with Ø 8 mm aperture using the D65 illuminant. The reflectance properties were recorded in the visible range (360 nm to 740 nm) at 10 nm steps and results analyzed in the SCE mode using the Konica Minolta SpectraMagicTM NX software.

2.7. Statistical Analysis

Statistical analyses (ANOVA) were performed using WinSTAT (R. Fitch Software, Staufen, Germany). Results were generally presented as means ± standard deviation (SD). Significance of differences between means were evaluated with Duncan’s multiple range test (p < 0.05).

3. Results

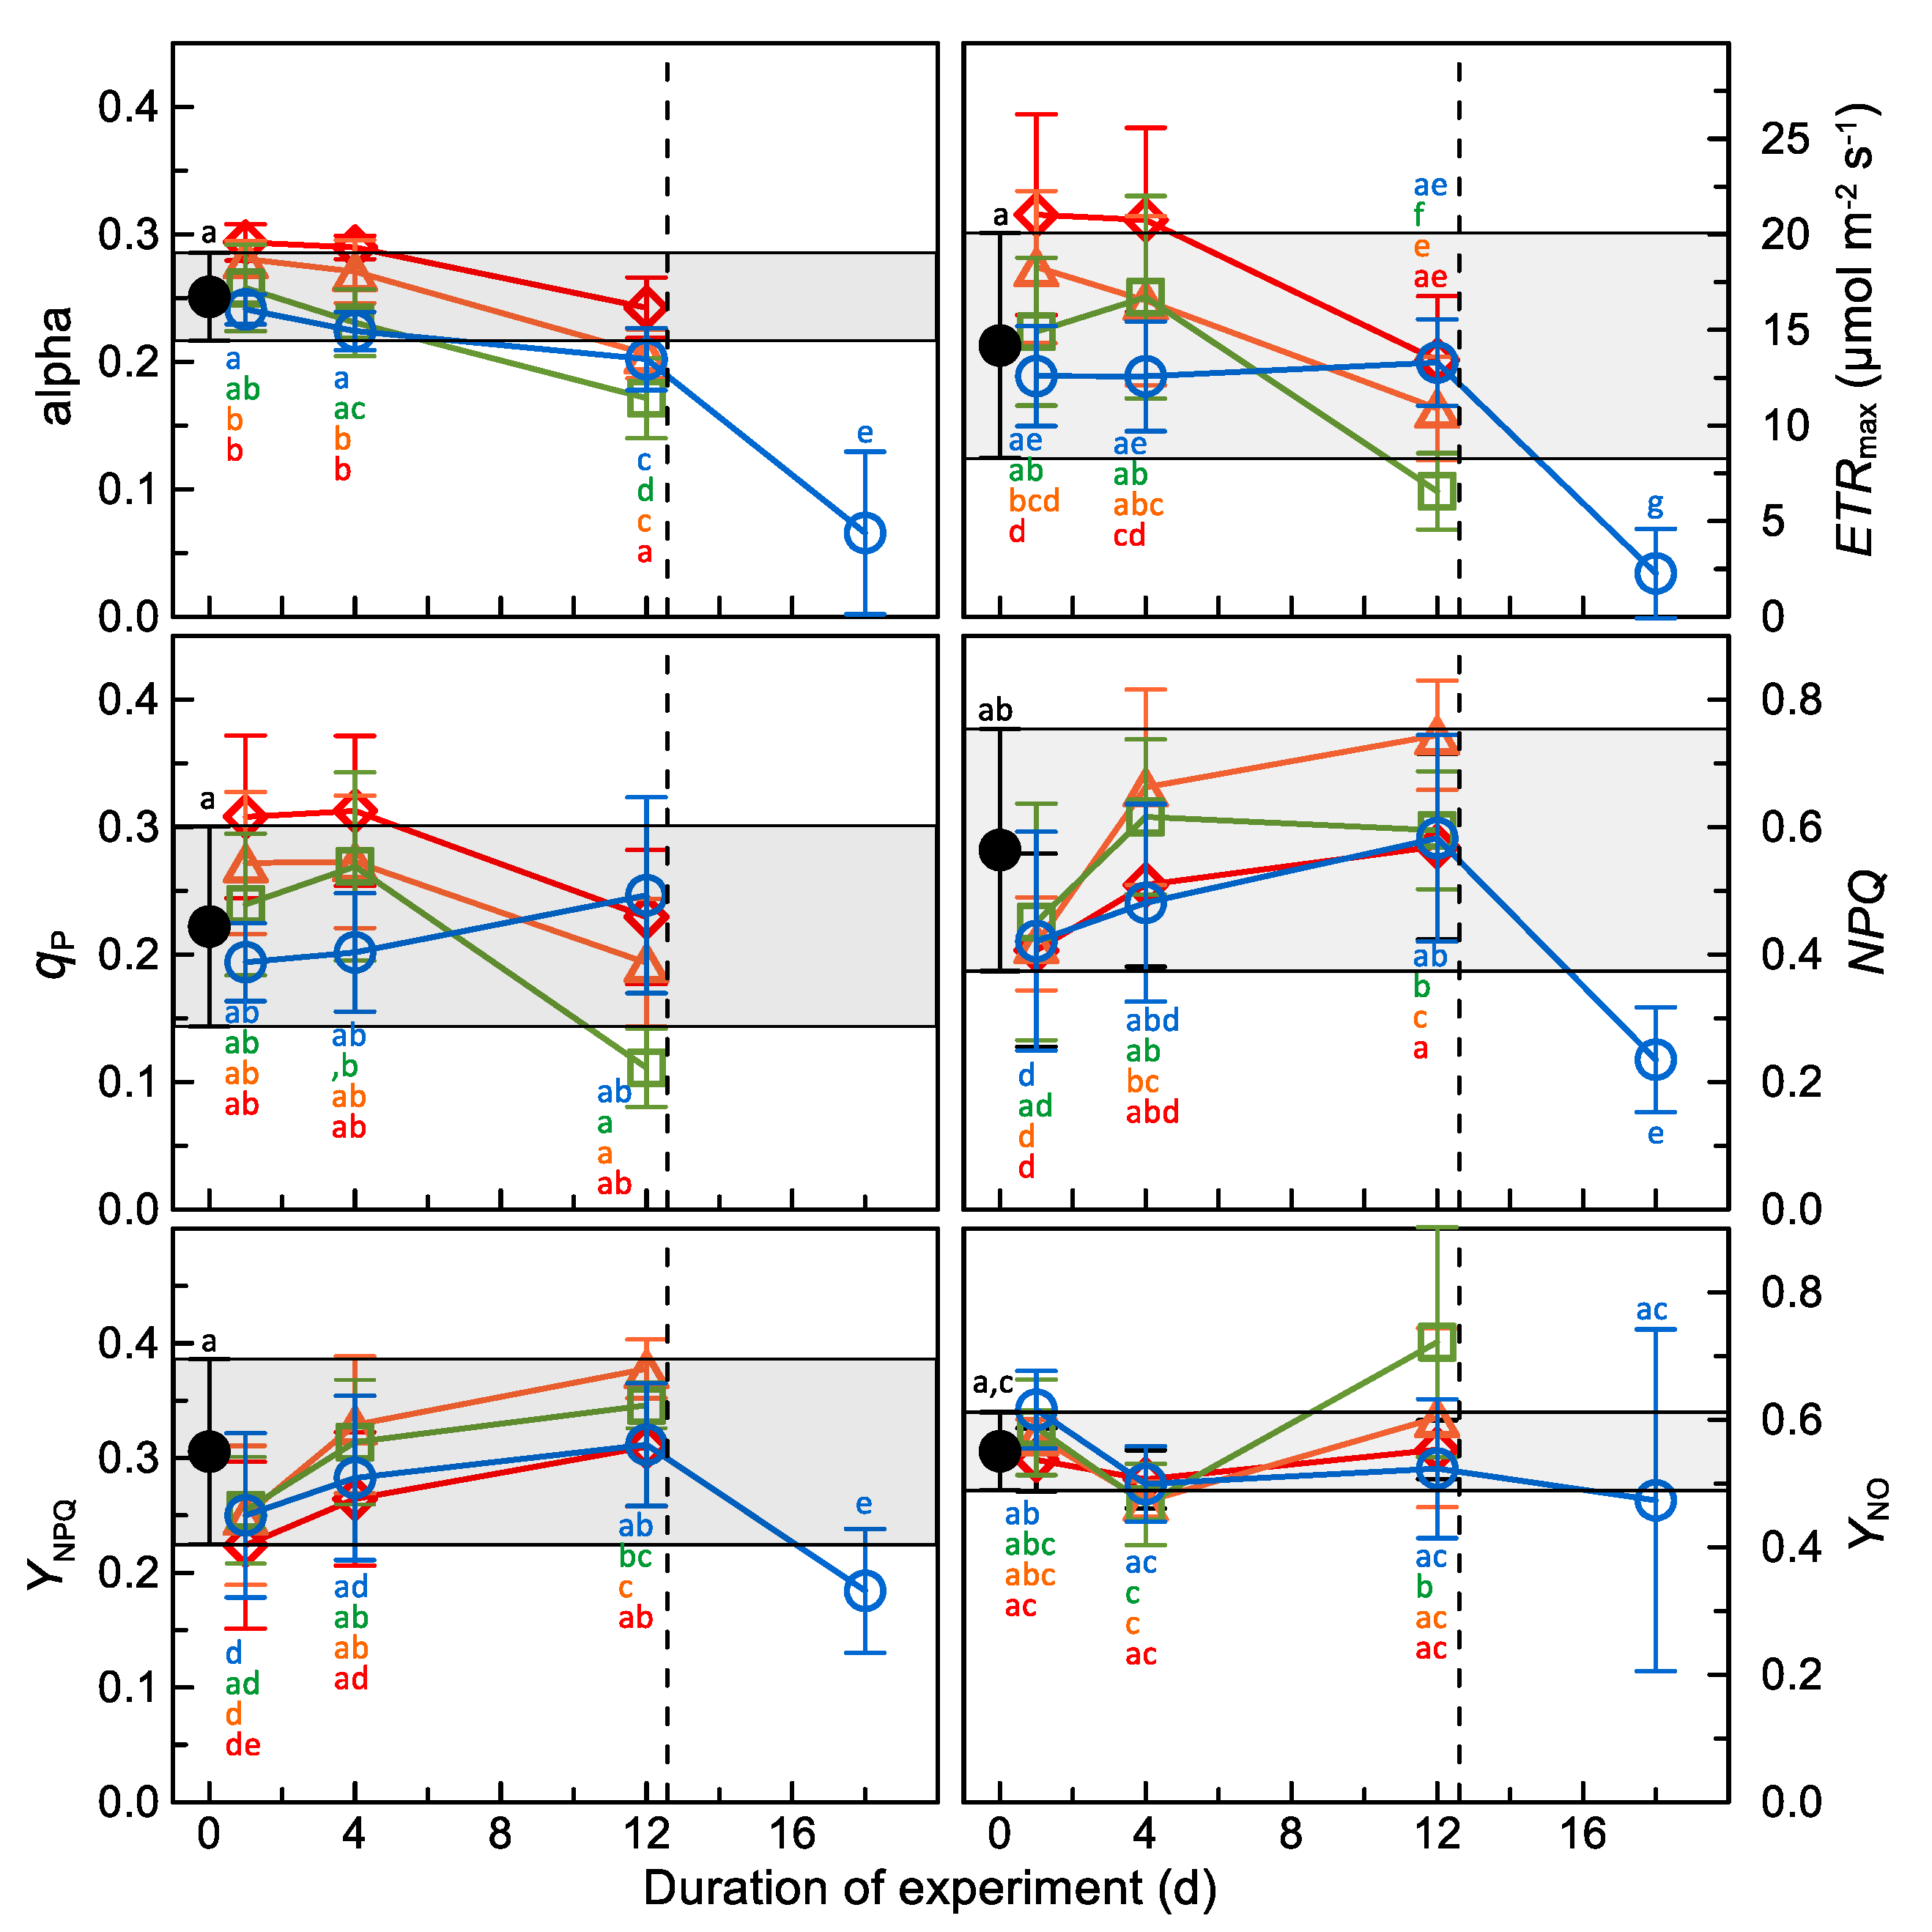
3.1. Chlorophyll-Fluorescence Analyses

Irrespective of the device used, the basic fluorescence parameters Fm and Fv, and especially F0 (therefore data not shown) remained approx. constant during the entire cold storage in controls (13 °C) and in fruit stored at 11.5 °C and rapidly declined completely during simulated shelf-life (Figure 2). At 10 °C and, more pronounced, at 5 °C, these parameters continuously declined during cold storage and, again very rapidly in shelf life, as measured with both CFI and with the FluorPen. Differences in these parameters between low temperature treatments (5 °C and 10 °C) and controls became significant on day 5. Results obtained with the PAM fluorometers differentiated less clearly treatment effects due to highly variable data. Nevertheless, Fm and Fv were also lowest here since day 5.
On the other hand, Fv/Fm did not or only slightly (5 °C on day 12, spot measurements) change in all cold-stored samples. Fv/Fm, however, rapidly declined to very low values within six days of shelf-life at 18 °C.
Obtained from the OJIP test analyses of the polyphasic rise of the rapid chlorophyll-fluorescence induction curve with the FluorPen, the performance index (PIabs) of all samples tended to decline slowly during storage (Figure 3). While this parameter clearly and significantly distinguished between fruit stored at 13 °C and at 5 °C, the differences between controls (13 °C) and bananas kept at 11.5 °C and 10 °C were not significant. PIabs of samples stored at 5 °C were always lowest except on the first day of storage. Anyway, the performance index of all samples became zero during simulated shelf life. Although the maximum primary yield of PSII (Fv/Fo) of bananas stored at 5 °C also continuously declined, that of the other samples did not. Differences in this parameter were significant only at the 12th d of experiment. In shelf life, Fv/Fo also rapidly declined to (almost) zero.
Both the maximum photosynthetic quantum yield (α) and, especially, the maximum light saturated electron transport rates (ETRmax) of samples stored at 13 °C tended to increase during the initial storage compared to “fresh” untreated fruit (Figure 4). Both parameters were almost always higher in optimally stored controls than in all other samples. During prolonged storage at cold temperatures, values of both parameters started to decline slowly, though changes were statistically insignificant. In contrast to the others, particularly that at 10 °C, ETRmax of fruit stored at 5 °C remained constant during cold storage. For technical reasons, only the latter samples could be measured during simulated shelf life. Here, both α and ETRmax obtained values close to zero after additional five days at 18 °C. The photochemical quenching coefficient (qP), the non-photochemical quenching (NPQ) and both the quantum yields of regulated (YNPQ) and non-regulated non-photochemical energy loss in PSII (YNO) of banana fruit were not significantly distinct from untreated fruit. Nevertheless, non-photochemical quenching tended to decline initially but rose again during further storage. It declined during shelf life, while for qP irregularly high values were calculated (therefore not shown). Furthermore, YNO of dark-adapted fruit was approx. the same (data not explicitly shown) in all bananas at relative high values (0.23 ± 0.05) and did not change during cold storage but increased pronouncedly and significantly in shelf life (0.52 ± 0.32). Here, variation between the fruit was very high and values ranged from 0.22 to 0.99. It is worth noting that both YNPQ and YNO rapidly returned to pre-illumination values during dark-relaxation in all samples measured during cold storage irrespective of the temperature regime (data not shown).

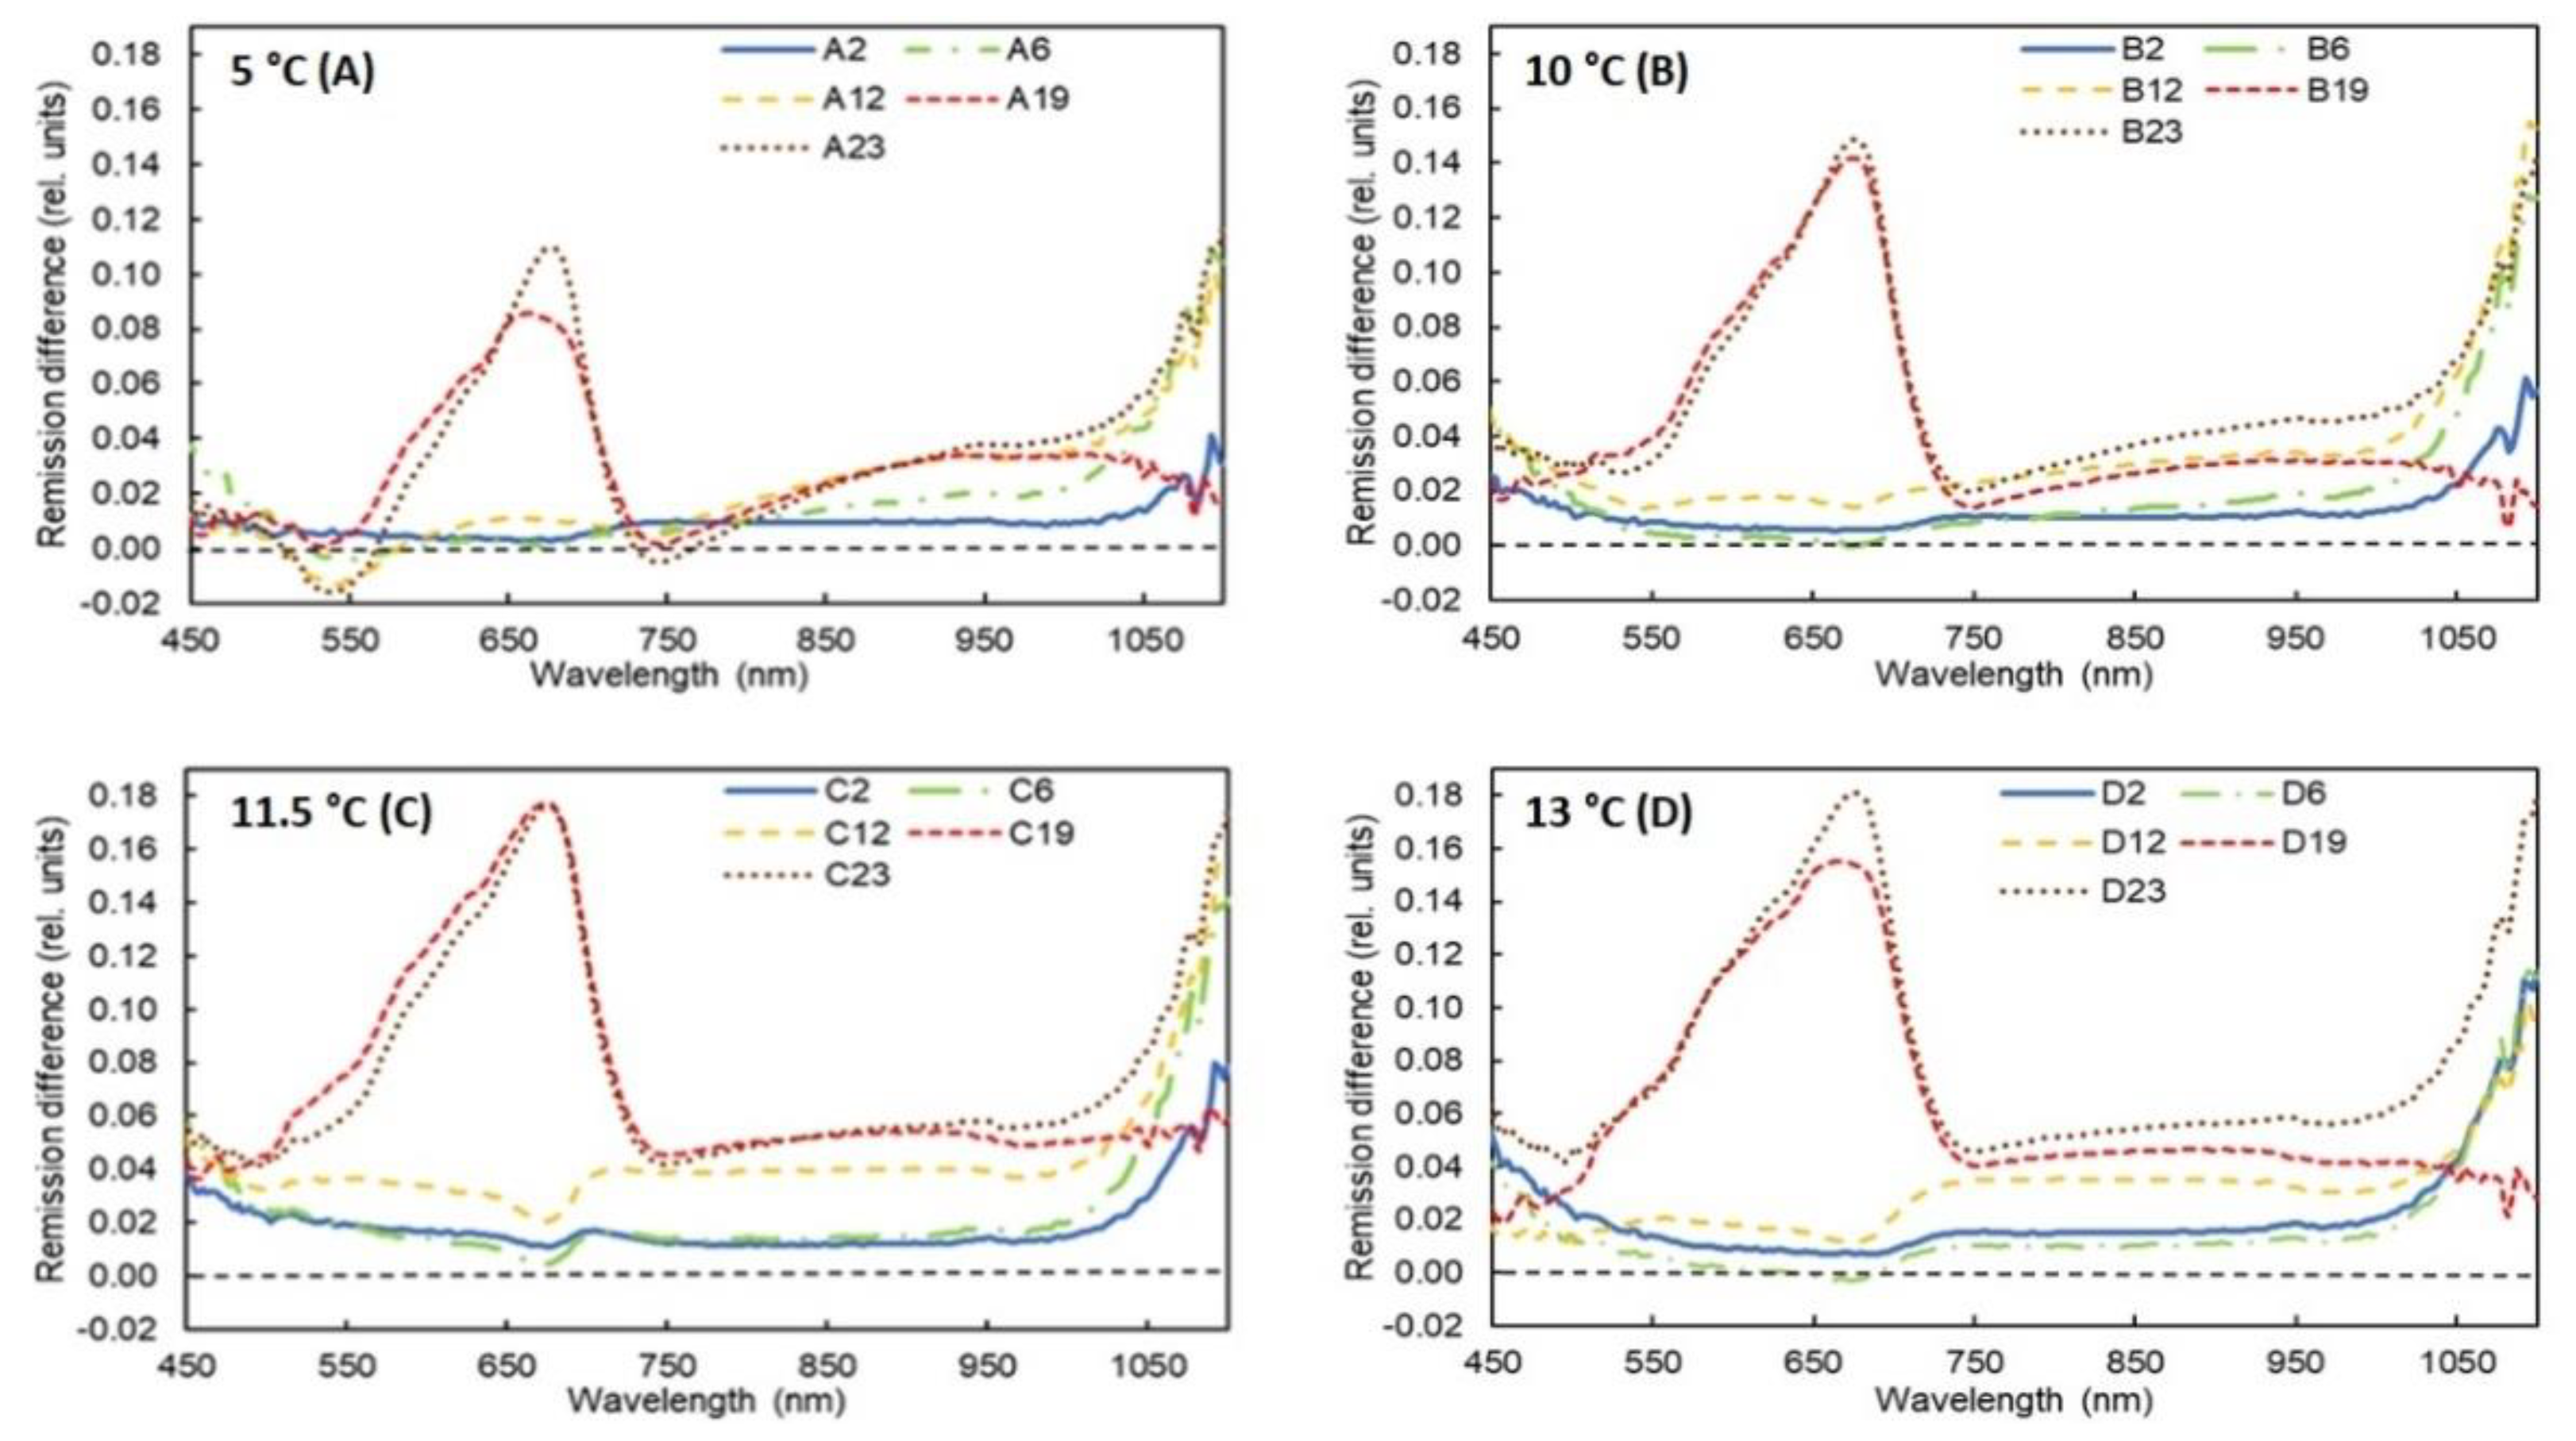
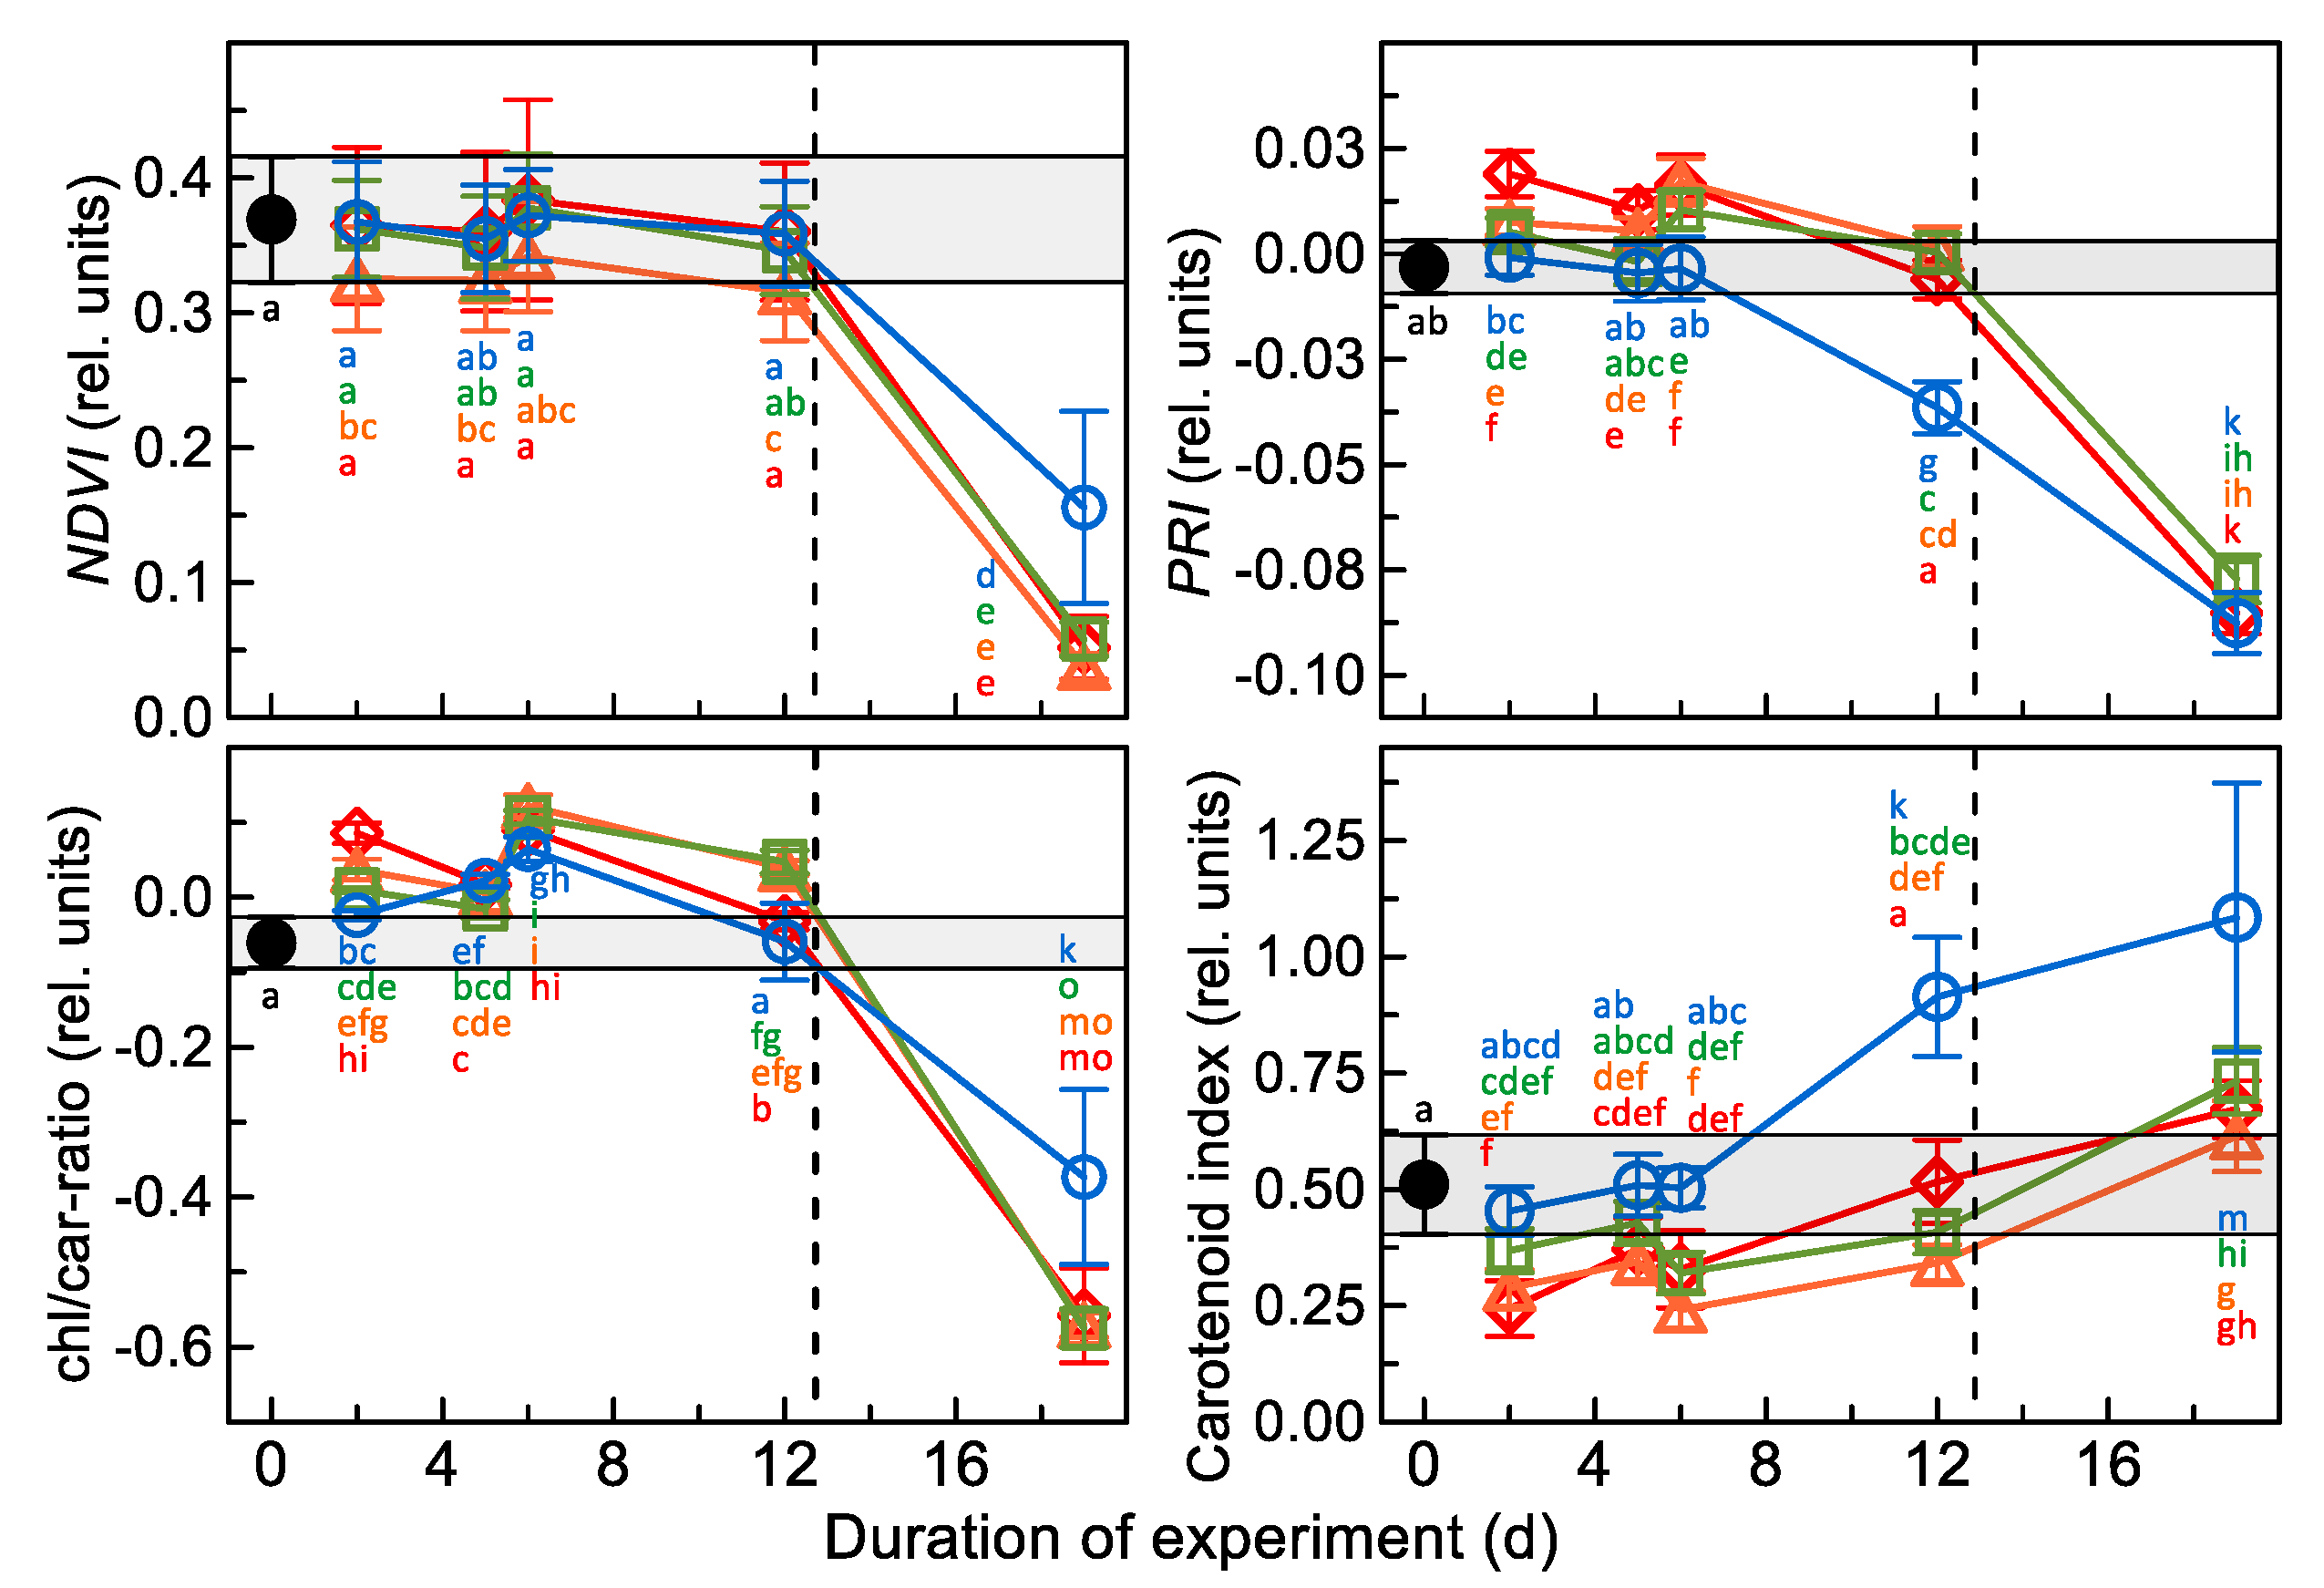
3.2. Results of Spectral Measurements

Remission spectra of all samples pronouncedly differed from that of untreated banana mainly in shelf life but only slightly during storage (Figure 5). Here, changes tended to be the more distinct the higher the temperature during storage, especially at 10 °C and 11.5 °C. Most obviously, remission from fruit increased in the chlorophyll spectral absorption region between 600 and 750 nm, indicating that the concentration of these compounds substantially declined. Nevertheless, during shelf life, shoulders were clearly visible in the range of 585 nm and at approx. 530 nm, at least in spectra of samples stored at 11.5 °C and 13 °C. On the other hand, no marked variation of the remission signals was recorded in the above wavelength ranges.
As could be deduced from the changes in remission spectra differences, the NDVI did not vary during cold storage, irrespective of the storage temperature (Figure 6). However, it rapidly declined close to zero in simulated shelf life in banana previously stored at or above 10 °C but to a significantly smaller extent in those kept at 5 °C. Similarly, L* a* b* color characteristics did not (L*, b*) or only marginally (a*) change during cold storage (Figure S1). During simulated shelf life, these parameters varied much more pronouncedly, especially after storage at moderate temperatures. Until day 6 of the experiment (and of storage), the photochemical reflectance index (PRI) significantly increased above prestorage values in fruit stored at 13 °C but remained constant (at lowest values) at 5 °C. After this time, PRI declined in all samples, most pronouncedly in fruit at 5 °C. The chlorophyll to carotenoid ratio temporarily and slightly increased in most samples, but pronouncedly declined in simulated shelf life. The carotenoid index closely reflected the inverse of the PRI, with initial values lower than the prestorage level, except for bananas kept at 5 °C. On the other hand, at the last day of storage and in simulated shelf life, this index was higher than in prestorage, particularly significant in the latter samples.

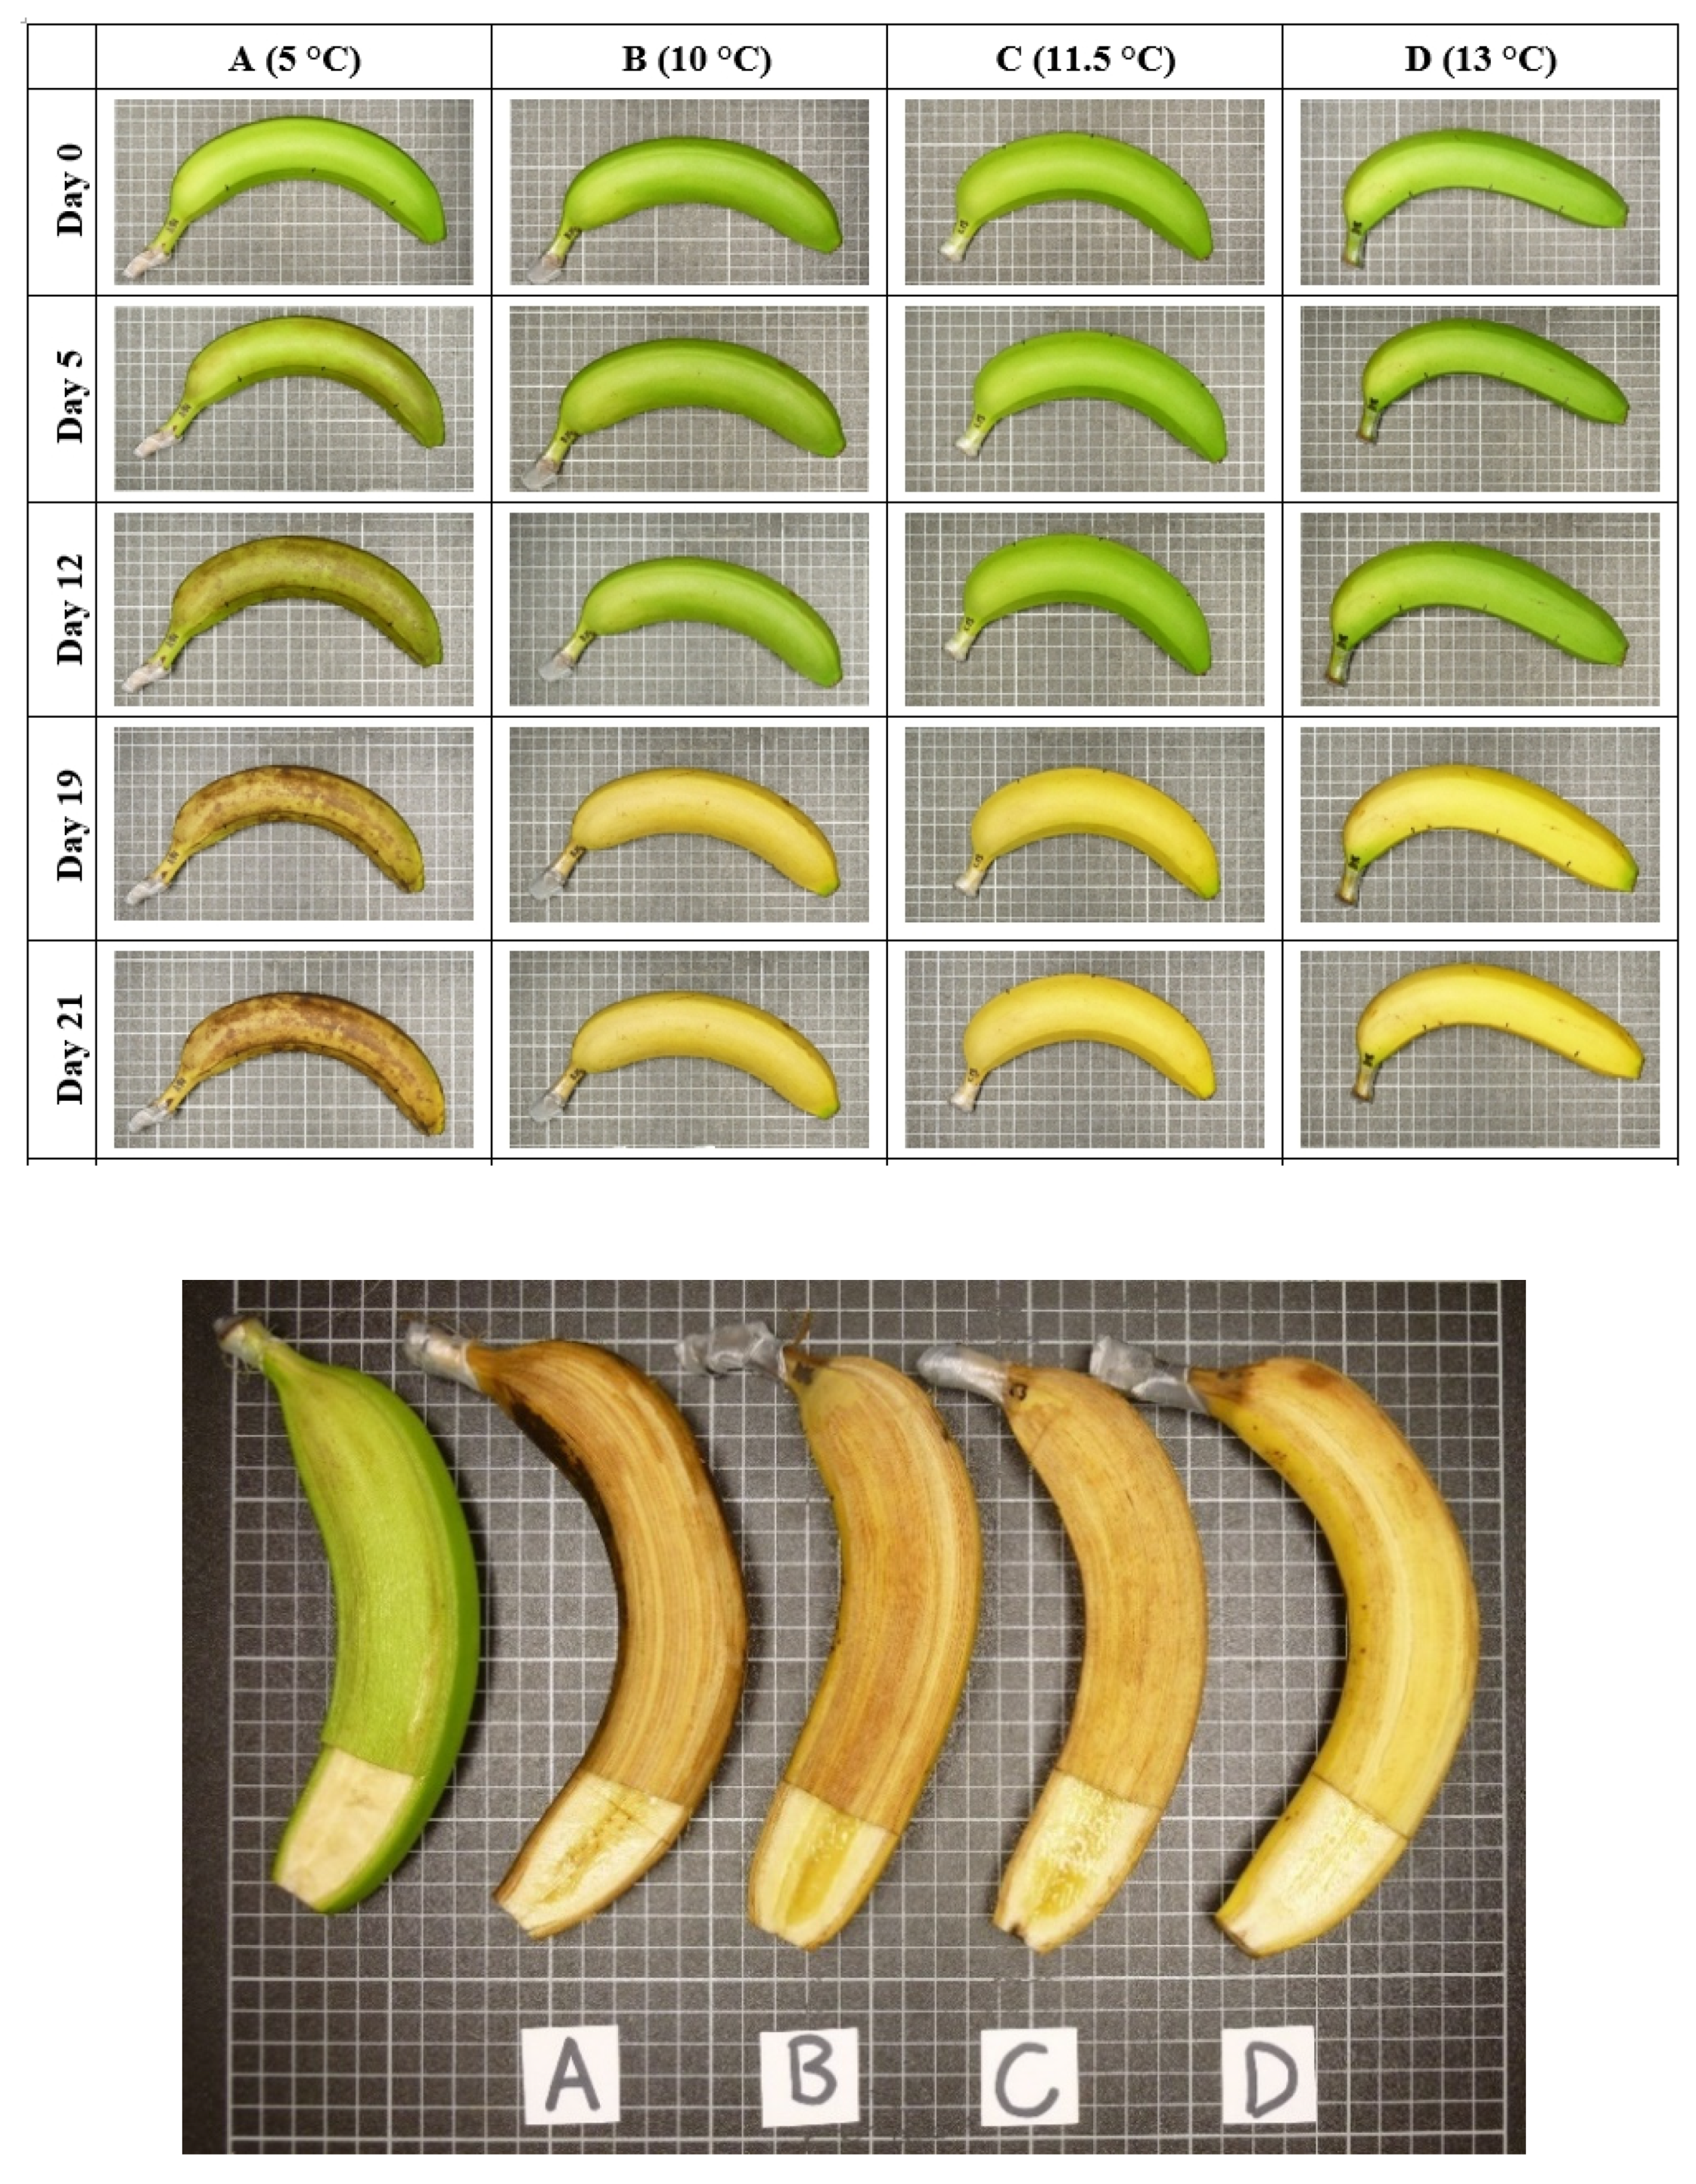
3.3. Chilling Stress Effects on Overall Appearance

From RGB images (Figure 7), it is obvious that pronounced and evenly distributed brown discoloration of peel and, much less so, of pulp occurred only in fruit stored at the lowest temperature of 5 °C. Nevertheless, distinct minor brown spots were also visible to the same degree on the peel of fruit stored at 10 °C and 11.5 °C but not in controls, previously stored at 13 °C. Moderately low temperatures at 10 °C and above did not affect color development in these fruit.

4. Discussion

It is generally accepted that severe symptoms of CI become visible normally in shelf life after removal from chilled conditions [4,6,7]. On the other hand, green-ripe bananas have been shown to develop, within a few hours to a few days [18,24], moderate symptoms associated with CI when stored at temperatures below the 13 °C-threshold [10,11,12]. In the present study, temperatures below 10 °C but less so at and not above, indeed induced some chilling stress to bananas after two days of exposure to the respective storage conditions. These low nonfreezing temperatures very specifically affected various aspects of fruit photosynthesis.
As expected, all chlorophyll fluorometer used obtained very similar results on the basic chlorophyll parameters and can, thus, equally be recommended for such analyses. Mostly notable, chilling at low, nonfreezing temperatures reduces the ability of fruit peel tissue to dissipate radiatively absorbed light energy, i.e., the maximum fluorescence, Fm. In contrast, storage at these temperatures had no effects on the intactness of the photosynthetic apparatus as indicated by the constancy of both the dark fluorescence signal, F0, and the potential maximum photochemical efficiency of PSII (Fv/Fm). These effects were also reported for green bell peppers and tomatoes [36,62].
Generally, it is assumed that any pronounced reduction of Fm may result from increased sustained regulated or non-regulated non-photochemical quenching processes [35,63]. This, however, seems to be valid only for low temperature exposure in the light. In the dark, the mechanisms behind the regulated non-photochemical quenching are deactivated [33,34,64]. Thus, reduction of Fm only results from non-regulated processes. It can be that the prevailing chilling stress may oxidatively inactivate PSII reaction centers alternatively to the before mentioned effects [36,65]. Certainly, it is highly improbable that chloroplastic reactions could be responsible for the production of active oxidative species [37]. Nevertheless, it is well established that chilling stress increased the accumulation of ROS, e.g., H2O2, superoxide anions or hydroxyl and peroxyl radicals at the cellular level [16,50]. Photochemical inactive centers may act also as effective quenchers that non-radiatively dissipate absorbed light energy [59,66,67,68]. According to van Heerden et al. [59], the pronounced inactivation of PSII centers will result in only a minor reduction of Fv/Fm. Nevertheless, ROS-induced inactivation of PSII centers during dark chilling may decrease Fm without any effects on F0. An increase in F0 is particularly indicative of the oxidative damage to the D1 core protein of PSII reaction center [41]. Thus, the overall constancy of Fv/Fm also points out the absence of serious destructions of the potential performance of PSII photochemical efficiency [64].
It might, however, be expected that the above-mentioned potential oxidative effects may affect the non-photochemical efficiency, either the induction of regulated non-photochemical quenching in the light (NPQ, YNPQ) or the non-regulated in light or dark (YNO). However, none of these parameters showed clear-cut systematic changes but remained constant during storage at all tested temperatures. Increased contribution of the quantum yield of non–light-induced quenching [64], YNO, an indicator of the sum of non-regulated heat dissipation and fluorescence emission mainly due to closed PS II reaction centers [40], could have been expected (but was not evident), if a sustained contribution of non-photochemical quenching [63] was active. Consequently, it can be assumed that there is no measurable chilling effect on the total efficacy of the non-photochemical protection mechanisms and, thus, on the ability of the fruit to potentially use the non-photochemical dissipation of absorbed light energy. This is further substantiated by the full and rapid relaxation of light-induced increases in both regulated and non-regulated non-photochemical quenching upon return to dark conditions in all samples irrespective of storage temperature. This, in addition, convincingly highlights that chilling does not impair the overall photosynthetic competence of the banana fruit.
It has been stressed that for the correct and detailed mechanistic interpretation of any variation of Fv/Fm and other CFA parameters, the potential changes in the optical properties of the produce need to be assessed [64], as carefully done in the presented study. In this context, the fact that the remission spectra of bananas were not affected during cold storage, irrespective of the prevailing temperature, ruled out any influence on the measurement and the evaluation of the above fluorescence parameters.
Thus, the decline in Fm may highlight the reduction of the functional efficiency of PSII RC [59]. The pronounced and very specific changes of the performance index, PIABS [45,48], of fruit stored at the respective low temperatures further substantiated this notion. Van Heerden et al. [59] regarded the performance index “as the most reliable criterion for the evaluation of dark chilling stress”, assuming that this parameter “expresses the accumulation of all responses of the photosynthetic apparatus”. The above authors also assumed that during dark storage, chilling temperatures negatively affect the intrinsic function of the photosynthetic electron transport chain. This effect might be mediated by the reduction of the fluidity of the thylakoid membrane, which, in turn, affects the mobility of plastoquinones and plastocyanines below the known temperature threshold. As a result, the overall potential photosynthetic performance is impaired without a destruction of the photosynthetic apparatus. The former is indicated by the concomitant decline in PIABS and Fm, while the constancy of Fv/Fm highlighted the latter.
Besides the above-mentioned mechanisms, Fm may, of course, also decline simply due the reduction of the chlorophyll content, i.e., the overall the ability to fluoresce [35,64]. This could be expected if the chilling-induced oxidative stress resulted in a gradual destruction of the PSII core protein complexes concomitantly leading to the release and the final degradation of chlorophylls as assumed by Tijskens et al. [36] for cucumbers stored at low temperatures in darkness. Any decrease in the contents of chlorophylls, however, is ruled out by the constancy of NDVI in all samples irrespective of the prevailing storage temperature. It was shown manifold that NDVI indeed closely reflected changes in the chlorophyll contents of fruit and leaves [49,51,52,60], and, thus, clearly substitutes chemical analysis of these pigments. Anyway, the presented results rule out any possible effect of a decreased chlorophyll content on Fm but may further support the view that chilling does not impair the structural intactness of the photosystems.
The constancy of the chlorophyll content as observed in the present study also nicely fits to findings of earlier investigations on the chilling effects in banana [14] but contradicts recent reports indicating that chilling conditions tended to accelerate chlorophyll degradation in green-ripe fruit [16,26]. This discrepancy may be explained by different physiological stages of the fruit used for experimentation. Although in the present study (and by [14]), ripening of fruit was induced only during shelf life simulation, the bananas used in the other mentioned studies may have been ethylene-treated before as could be deduced form the speed of the reported color changes. On the other hand, full-ripe banana fruit are described as less susceptible to CI [32]. Hence, the rapid color changes observed, e.g., in the short-term (two days of chilling treatment + one day of shelf life) study of Hashim et al. (2013) [26] may have resulted from advanced ripening but not from chilling stress.
During simulated shelf life, fluorescence signals, photosynthetic competence and chlorophyll contents rapidly decreased, irrespective of the temperature conditions during storage. This decline is directly related to postharvest ripening and was obviously not affected by the temperature regime during chilled storage. Only under shelf life conditions at room temperature, the complete destruction of the photosynthetic apparatus occurred as indicated by the utterly decline in PIABS, Fm and Fv/Fm. This is then followed by the degradation of chlorophyll molecules indicated by the pronounce decrease in NDVI. This decrease in chlorophyll content typically unmasks the plastidic carotenoids, changing the peel color from green to yellow [26,27,28]. Several studies reported that no or only very minor synthesis of carotenoids accompanied this “degreening” [25,26,29]. The low increase in the carotenoid index observed in most samples but not in those chilled at 5 °C may confirm these findings.

5. Conclusions

The results of this investigation comprehensively and rigorously point out the temporal dynamic and the temperature dependence of chilling effects on the photosynthetic competence of green-ripe banana fruit. These effects specifically target the still insufficiently explored non-regulated non-photochemical quenching mechanisms. Chilling stress does not impair regulated non-photochemical energy dissipation or the structural and, partially, functional intactness of the cores of the photosystems II. This easily explains why parameters such as Fv/Fm, F0 and others, which are closely related to these properties are no good indicators or predictors of chilling stress in green produce. In contrast, rapid CF analyses such as the measurements of Fm or Fv, or the OJIP test parameter PIABS, all evaluating the overall photosynthetic performance are much better suited. As another consequence of the above, chilling stress does not induce chlorophyll degradation in non-ethylene-treated green-ripe banana as this would require the damage to the photosystems. Hence, spectral analyses or color measurements are not highly sensitive in such fruit but could better indicate ripening related metabolic changes. Thus, the presented results highlight that and why not all the above-mentioned parameters can be applied meaningfully in practice for monitoring and early prediction of chilling effects in green produce.

Supplementary Materials

The following are available online at https://www.mdpi.com/article/10.3390/app112311433/s1, Figure S1: Lab color characteristics.

Author Contributions

Conceptualization, T.Z. and W.B.H.; methodology T.Z. and W.B.H.; validation, W.B.H. and T.Z.; formal analysis, T.Z. and W.B.H.; investigation, T.Z. and W.B.H.; resources, W.B.H.; data curation, T.Z.; writing—original draft preparation, W.B.H.; writing—review and editing, W.B.H. and T.Z.; visualization, W.B.H. and T.Z.; funding acquisition, T.Z. and W.B.H. All authors have read and agreed to the published version of the manuscript.

Funding

This research was funded by DAAD, grant number A/13/03594.

Institutional Review Board Statement

Not applicable.

Informed Consent Statement

Not applicable.

Data Availability Statement

Not applicable.

Acknowledgments

The authors thank G. Wegner and C. Rolleczek for the excellent help in the lab, A. Gabbert for administrative support and C.E. Martin for checking the English.

Conflicts of Interest

The authors declare no conflict of interest.

References

  1. Billiard, F. Fruit cold storage: Techniques and equipment. Acta Hortic. 1999, 485, 61–70. [Google Scholar] [CrossRef]
  2. USDA. The Commercial Storage of Fruits, Vegetables, and Florist and Nursery Stocks. In Agriculture Handbook 66; Gross, K.C., Wang, C.Y., Saltveit, M., Eds.; U.S. Department of Agriculture, Agricultural Research Service: Washington, DC, USA, 2016; p. 794. [Google Scholar]
  3. Parkin, K.L.; Marangoni, A.; Jackman, R.; Yada, R.; Stanley, D. Chilling injury. A review of possible mechanisms. J. Food Biochem. 1989, 13, 127–153. [Google Scholar] [CrossRef]
  4. Sevillano, L.; Sanchez-Ballesta, M.T.; Romojaro, F.; Flores, F.B. Physiological, hormonal and molecular mechanisms regulating chilling injury in horticultural species. Postharvest technologies applied to reduce its impact. J. Sci. Food Agric. 2009, 89, 555–573. [Google Scholar] [CrossRef]
  5. Lukatkin, A.; Brazaitytė, A.; Duchovskis, P. Chilling injury in chilling-sensitive plants: A review. Zemdirb. Agric. 2012, 99, 111–124. [Google Scholar]
  6. Murata, T. Physiological and biochemical studies of chilling injury in bananas. Physiol. Plant. 1969, 22, 401–411. [Google Scholar] [CrossRef]
  7. Aghdam, M.S.; Bodbodak, S. Postharvest heat treatment for mitigation of chilling injury in fruits and vegetables. Food Bioprocess Technol. 2014, 7, 37–53. [Google Scholar] [CrossRef]
  8. Promyou, S.; Ketsa, S.; van Doorn, W.G. Hot water treatments delay cold-induced banana peel blackening. Postharvest Biol. Technol. 2008, 48, 132–138. [Google Scholar] [CrossRef]
  9. Khademia, O.; Ashtaria, M.; Razavi, F. Effects of salicylic acid and ultrasound treatments on chilling injury control and quality preservation in banana fruit during cold storage. Sci. Hortic. 2019, 249, 334–339. [Google Scholar] [CrossRef]
  10. Gemma, H.; Matsuyama, Y.; Wang, H.-G. Ripening characteristics and chilling injury of banana fruit. I. Effect of storage temperature on respiration, ethylene production and membrane permeability of peel and pulp tissues. Jpn. J. Trop. Agric. 1994, 38, 216–220. [Google Scholar] [CrossRef]
  11. Chaiprasart, P.; Gemma, H.; Iwahori, S. Changes in chlorophyll fluorescence and enzyme activity for scavenging of free radicals in banana fruits stored at low temperatures. Jpn. J. Trop. Agric. 2001, 45, 181–191. [Google Scholar] [CrossRef]
  12. Zsom, T.; Strohmayer, E.; Nguyen, L.G.L.; Hitka, G.; Zsom-Muha, V. Chilling injury investigation by non-destructive measuring methods during banana cold storage. Prog. Agric. Eng. Sci. 2018, 14, 147–158. [Google Scholar] [CrossRef]
  13. Nguyen, T.B.T.; Ketsa, S.; van Doorn, W.G. Relationship between browning and the activities of polyphenol oxidase and phenylalanine ammonia lyase in banana peel during low temperature storage. Postharvest Biol. Technol. 2003, 30, 187–193. [Google Scholar] [CrossRef]
  14. Olorunda, A.O.; Meheriuk, M.; Looney, N.E. Some postharvest factors associated with the occurrence of chilling injury in banana. J. Sci. Food Agric. 1978, 29, 213–218. [Google Scholar] [CrossRef]
  15. Wang, N.-N.; Yang, Y.-C.; Sun, D.-W.; Pu, H.; Zhu, Z. Shelf-life prediction of ‘Gros Michel’ bananas with different browning levels using hyperspectral reflectance imaging. Food Anal. Methods 2015, 8, 1173–1184. [Google Scholar] [CrossRef]
  16. Pongprasert, N.; Sekozawa, Y.; Sugaya, S.; Gemma, H. A novel postharvest UV-C treatment to reduce chilling injury (membrane damage, browning and chlorophyll degradation) in banana peel. Sci. Hortic. 2011, 130, 73–77. [Google Scholar] [CrossRef]
  17. Elbagoury, M.M.; Turoop, L.; Runo, S.; Sila, D.N. Regulatory influences of methyl jasmonate and calcium chloride on chilling injury of banana fruit during cold storage and ripening. Food Sci. Nutr. 2020, 9, 929–942. [Google Scholar] [CrossRef] [PubMed]
  18. Kerbel, E. Banana and Plantain. In The Commercial Storage of Fruits, Vegetables, and Florist and Nursery Stocks. Agriculture Handbook Number 66; Gross, K., Wang, C.Y., Saltveit, M., Eds.; USDA, Agricultural Research Center, Agricultural Research Service: Beltsville, MD, USA, 2016. Available online: https://www.ars.usda.gov/northeast-area/beltsville-md-barc/beltsville-agricultural-research-center/food-quality-laboratory/docs/ah66/ (accessed on 17 March 2021).
  19. Luyckx, A.; Lechaudel, M.; Hubert, O.; Salmon, F.; Brat, P. Banana physiological post-harvest disorders: A review. MOJ Food Process. Technol. 2016, 3, 226–231. [Google Scholar] [CrossRef] [Green Version]
  20. Mootoo, A.; Murr, D.P. Quality attributes of banana fruit as affected by chilling and non-chilling temperatures. In Proceedings of 21st Annual Meeting, 8–13 September 1985, Port of Spain, Trinidad and Tobago, Caribbean Food Crops Society, Puerto Rico, 8 September 1985; No 261454, p. 8. Available online: https://ageconsearch.umn.edu/record/261454/ (accessed on 17 March 2021).
  21. Hashim, N.; Janius, R.B.; Baranyai, L.; Rahman, R.; Osman, A.; Zude, M. Kinetic model for colour changes in bananas during the appearance of chilling injury symptoms. Food Bioprocess Technol. 2012, 5, 2952–2963. [Google Scholar] [CrossRef]
  22. Zhu, X.; Luo, J.; Li, Q.; Li, J.; Tonxin Liu, T.; Wang, R.; Chen, W.; Li, X. Low temperature storage reduces aroma-related volatiles production during shelf-life of banana fruit mainly by regulating key genes involved in volatile biosynthetic pathways. Postharvest Biol. Technol. 2018, 146, 68–78. [Google Scholar] [CrossRef]
  23. Jackman, R.L.; Yada, R.Y.; Marangoni, A.; Parkin, K.L.; Stanley, D.W. Chilling injury. A review of qualitative aspects. J. Food Qual. 1988, 11, 253–278. [Google Scholar] [CrossRef]
  24. Kader, A.A. Banana. Recommendations for Maintaining Postharvest Quality; University of California (UC): Davis, CA, USA, 1996; Available online: http://postharvest.ucdavis.edu/Commodity_Resources/Fact_Sheets/Datastores/Fruit_English/?uid=9&ds=798 (accessed on 17 March 2021).
  25. Facundo, H.V.D.V.; Gurak, P.D.; Zerlotti Mercadante, A.; Lajolo, F.M.; Cordenunsi, B.R. Storage at low temperature differentially affects the colour and carotenoid composition of two cultivars of banana. Food Chem. 2015, 170, 102–109. [Google Scholar] [CrossRef] [PubMed]
  26. Hashim, N.; Pflanz, M.; Regen, C.; Janius, R.B.; Rahman, R.A.; Osman, A.; Shitan, M.; Zude, M. An approach for monitoring the chilling injury appearance in bananas by means of backscattering imaging. J. Food Eng. 2013, 116, 28–36. [Google Scholar] [CrossRef]
  27. Seymour, G.B.; John, P.; Thompson, A.K. Inhibition of degreening in the peel of bananas ripened at tropical temperatures. II. Role of ethylene, oxygen and carbon dioxide. Ann. Appl. Biol. 1987, 110, 153–161. [Google Scholar] [CrossRef]
  28. Yang, X.; Song, J.; Fillmore, S.; Pang, X.; Zhang, Z. Effect of high temperature on color, chlorophyll fluorescence and volatile biosynthesis in green-ripe banana fruit. Postharvest Biol. Technol. 2011, 62, 246–257. [Google Scholar] [CrossRef]
  29. Thomas, P.; Janave, M.T. Effect of temperature on chlorophyllase activity, chlorophyll degradation and carotenoids of Cavendish bananas during ripening. Int. J. Food Sci. Technol. 1992, 27, 57–63. [Google Scholar] [CrossRef]
  30. Abd El-Wahab, F.K.; Nawwar, M.A.M. Physiological and biochemical studies on chilling-injury of banana. Sci. Hortic. 1977, 7, 373–376. [Google Scholar] [CrossRef]
  31. Jiang, Y.; Joyce, D.C.; Jiang, W.; Lu, W. Effects of chilling temperatures on ethylene binding by banana fruit. Plant Growth Regul. 2004, 43, 109–115. [Google Scholar] [CrossRef]
  32. Lyons, J.M. Chilling injury in plants. Annu. Rev. Plant Physiol. 1973, 24, 445–466. [Google Scholar] [CrossRef]
  33. von Willert, D.J.; Matyssek, R.; Herppich, W.B. Experimentelle Pflanzenökologie, Grundlagen und Anwendungen; Georg Thieme Verlag: Stuttgart, Germany, 1995; p. 344. ISBN 9783662534632. [Google Scholar]
  34. Maxwell, K.; Johnson, G.N. Chlorophyll fluorescence—A practical guide. J. Exp. Bot. 2000, 51, 659–668. [Google Scholar] [CrossRef] [PubMed]
  35. Matyssek, R.; Herppich, W.B. Experimentelle Pflanzenökologie, Grundlagen und Anwendungen. Springer Reference Naturwissenschaften; Springer Spektrum: Berlin/Heidelberg, Germany, 2020; p. 551. ISBN1 978-3-662-53465-6. (eBook); ISBN2 978-3-662-53463-2. (print); ISBN3 978-3-662-53464-9. (combined). [Google Scholar] [CrossRef]
  36. Tijskens, L.M.M.; Otma, O.; van Kooten, E.C. Photosystem II quantum yield as a measure of radical scavengers in chilling injury in cucumber fruits and bell peppers. A static, dynamic and statistical model. Planta 1994, 194, 478–486. [Google Scholar] [CrossRef]
  37. Purvis, A.C. Diphenylamine reduces chilling injury of green bell pepper fruit. Postharvest Biol. Technol. 2002, 25, 41–48. [Google Scholar] [CrossRef]
  38. Kosson, R. Chlorophyll fluorescence and chilling injury of green pepper as affected by storage conditions. Acta Hortic. 2003, 628, 379–385. [Google Scholar] [CrossRef]
  39. Oseko, J.; East, A.; Heyes, J. Can changes in chlorophyll fluorescence be used to determine chilling injury of cold stored feijoa? Acta Hortic. 2020, 1275, 125–132. [Google Scholar] [CrossRef]
  40. Klughammer, C.; Schreiber, U. Complementary PS II quantum yields calculated from simple fluorescence parameters measured by PAM fluorometry and the Saturation Pulse method. PAM Appl. Notes 2008, 1, 27–35. Available online: https://www.walz.com/products/chl_p700/pan/overview.html (accessed on 28 August 2021).
  41. Murchie, E.H.; Lawson, T. Chlorophyll fluorescence analysis: A guide to good practice and understanding some new applications. J. Exp. Bot. 2013, 64, 3983–3998. [Google Scholar] [CrossRef] [PubMed] [Green Version]
  42. Neubauer, C.; Schreiber, U. The polyphasic rise of chlorophyll fluorescence upon onset of strong continuous illumination: I. Saturation characteristics and partial control by the photosystem II acceptor side. Z. Naturforsch. 1987, 42c, 1246–1254. [Google Scholar] [CrossRef] [Green Version]
  43. Schreiber, U.; Neubauer, C. The polyphasic rise of chlorophyll fluorescence upon onset of strong continuous illumination: II. Partial control by the photosystem II donor side and possible ways of interpretation. Z. Naturforsch. 1987, 42c, 1255–1264. [Google Scholar] [CrossRef]
  44. Krause, G.H.; Weis, E. Chlorophyll fluorescence and photosynthesis: The basics. Annu. Rev. Plant Physiol. Plant Molec. Biol. 1991, 42, 313–349. [Google Scholar] [CrossRef]
  45. Strasser, R.J.; Srivastava, A.; Govindjee. Polyphasic chlorophyll a fluorescence transient in plants and cyanobacteria. Photochem. Photobiol. 1995, 61, 32–42. [Google Scholar] [CrossRef]
  46. Lazár, D. The polyphasic chlorophyll a fluorescence rise measured under high intensity of exciting light. Funct. Plant Biol. 2006, 33, 9–30. [Google Scholar] [CrossRef] [PubMed]
  47. Stirbet, A.; Govindjee. On the relation between the Kautsky effect (chlorophyll a fluorescence induction) and Photosystem II: Basics and applications of the OJIP fluorescence transient. J. Photochem. Photobiol. B Biol. 2011, 104, 236–257. [Google Scholar] [CrossRef] [PubMed]
  48. Brestic, M.; Zivcak, M. PSII fluorescence techniques for measurement of drought and high temperature stress signal in crop plants: Protocols and applications. In Molecular Stress Physiology of Plants; Rout, G.R., Das, A.B., Eds.; Springer: New Delhi, India, 2013; pp. 87–131. [Google Scholar] [CrossRef]
  49. Merzlyak, M.N.; Solovchenko, A.E.; Gitelson, A.A. Reflectance spectral features and non-destructive estimation of chlorophyll, carotenoid and anthocyanin content in apple fruit. Postharvest Biol. Technol. 2003, 27, 197–211. [Google Scholar] [CrossRef]
  50. Wang, Y.; Luo, Z.; Du, R. Nitric oxide delays chlorophyll degradation and enhances antioxidant activity in banana fruits after cold storage. Acta Physiol. Plant. 2015, 37, 74. [Google Scholar] [CrossRef]
  51. Zude, M. Comparison of indices and multivariate models to nondestructively predict the fruit chlorophyll by means of visible spectrometry in apple fruit. Anal. Chim. Acta 2003, 481, 119–126. [Google Scholar] [CrossRef]
  52. Zude, M. Non-destructive prediction of banana fruit quality using VIS/NIR spectroscopy. Fruits 2003, 58, 135–142. [Google Scholar] [CrossRef] [Green Version]
  53. Herold, B.; Truppel, I.; Zude, M.; Geyer, M. Spectral measurements on ‘Elstar’ apples during fruit development on the tree. Biosyst. Eng. 2005, 91, 173–182. [Google Scholar] [CrossRef]
  54. Hellebrand, H.J.; Herppich, W.B.; Beuche, H.; Dammer, K.-H.; Linke, M.; Flath, K. Investigations of plant infections by thermal vision and NIR imaging. Int. Agrophys. 2006, 20, 1–10. Available online: http://www.international-agrophysics.org/Investigations-of-plant-infections-by-thermal-vision-and-NIR-imaging,106576,0,2.html (accessed on 17 March 2021).
  55. Schlüter, O.; Foerster, J.; Geyer, M.; Knorr, D.; Herppich, W.B. Characterization of high hydrostatic pressure effects on fresh produce using chlorophyll fluorescence image analysis. Food Bioprocess Technol. 2009, 2, 291–299. [Google Scholar] [CrossRef]
  56. Rascher, U.; Liebig, M.; Lüttge, U. Evaluation of instant light-response curves of chlorophyll fluorescence parameters obtained with a portable chlorophyll fluorometer on site in the field. Plant Cell Environ. 2000, 23, 1397–1405. [Google Scholar] [CrossRef]
  57. Ralph, P.J.; Gademann, R. Rapid light curves: A powerful tool to assess photosynthetic activity. Aquat. Bot. 2005, 82, 222–237. [Google Scholar] [CrossRef]
  58. Herppich, W.B. Chlorophyll Fluorescence Imaging for process optimisation in horticulture and fresh food production. Photosynthetica 2021, 59, 422–437. [Google Scholar] [CrossRef]
  59. van Heerden, P.D.R.; Tsimilli-Michael, M.; Krüger, G.H.J.; Strasser, R.J. Dark chilling effects on soybean genotypes during vegetative development: Parallel studies of CO2 assimilation, chlorophyll a fluorescence kinetics O-J-I-P and nitrogen fixation. Physiol. Plant. 2003, 117, 476–491. [Google Scholar] [CrossRef] [PubMed]
  60. Gamon, J.A.; Surfus, J.S. Assessing leaf pigment content and activity with a reflectometer. New Phytol. 1999, 143, 105–117. [Google Scholar] [CrossRef]
  61. Rutkowski, K.P.; Michalczuk, B.; Konopacki, P. Nondestructive determination of ‘Golden Delicious’ apple quality and harvest maturity. J. Fruit Ornam. Plant Res. 2008, 16, 39–52. Available online: http://www.inhort.pl/files/journal_pdf/journal_2008/full5%202008.pdf (accessed on 17 March 2021).
  62. Zsom, T.; Zsom-Muha, V.; Nguyen, L.P.L.; Nagy, D.; Hitka, G.; Polgári, P.; Baranya, L. Nondestructive detection of low temperature induced stress on postharvest quality of kápia type sweet pepper. Prog. Agric. Eng. Sci. 2020, 16, 173–186. [Google Scholar] [CrossRef]
  63. Demmig-Adams, B.; Adams, W.W., III. Photoprotection in an ecological context: The remarkable complexity of thermal energy dissipation. New Phytol. 2006, 172, 11–21. [Google Scholar] [CrossRef] [PubMed]
  64. Baker, N.R. Chlorophyll fluorescence: A probe of photosynthesis in vivo. Annu. Rev. Plant Biol. 2008, 59, 89–113. [Google Scholar] [CrossRef] [PubMed] [Green Version]
  65. Sonoike, K. Various aspects of inhibition of photosynthesis under light/chilling stress: “Photoinhibition at chilling temperatures” versus “chilling damage in the light”. J. Plant Res. 1998, 111, 121–129. [Google Scholar] [CrossRef]
  66. Critchley, C.; Russel, W. Photoinhibition of photosynthesis in vivo: The role of protein turnover in photosystem II. Physiol. Plant. 1994, 92, 188–196. [Google Scholar] [CrossRef]
  67. Herppich, W.B.; Flach, M.-T.; von Willert, D.J.; Herppich, M. Field investigations in Welwitschia mirabilis during a severe drought. II. Influence of leaf age, leaf temperature and irradiance on photosynthesis and photoinhibition. Flora 1997, 192, 165–174. [Google Scholar] [CrossRef]
  68. Henriques, F.S. Leaf chlorophyll fluorescence: Background and fundamentals for plant biologists. Bot. Rev. 2009, 75, 249–270. [Google Scholar] [CrossRef]
Figure 1. Samples of untreated green-ripe ‘Cavendish’ bananas (Musa cavendishii L.), prepared for sorting and grouping.
Applsci 11 11433 g001
Figure 2. Means (±SD; n > 6) of maximum (Fm) and variable (Fv) fluorescence and of the potential maximum photochemical efficiency of PSII (Fv/Fm) of banana fruit measured with FluorCam (left column; pixel means of the entire fruit), FluorPen (mid column) and with PAM-fluorometer (right column) during cold storage (◯ circles: 5 °C; ☐ squares: 10 °C; Δ triangles: 11.5 °C; ⃟ diamonds: 13 °C) and shelf life. The vertical dashed line indicates the end of cold storage on day 12 of the experiment. The filled circles reflect the means (the grey horizontal bar shows the respective SD) of all bananas (n = 76), measured before storage. Different small letters indicate significant (p < 0.05) differences between means.
Applsci 11 11433 g002
Figure 3. Means (±SD, n = 6) of the performance index (PIABS) and the maximum primary yield of PSII (Fv/Fo) of banana fruit obtained from the polyphasic rise of the rapid chlorophyll-fluorescence induction curve measured with the OJIP test (FluorPen) during cold storage (◯ circles: 5 °C; ☐ squares: 10 °C; Δ triangles: 11.5 °C; ⃟ diamonds: 13 °C) and shelf life. The vertical dashed line indicates the end of cold storage on day 12 of the experiment. The filled circles reflect the means (the grey horizontal bar shows the respective SD) of all bananas (n = 76), measured before storage. Different small letters indicate significant (p < 0.05) differences between means.
Applsci 11 11433 g003
Figure 4. Means (±SD, n = 6) of the maximum photosynthetic quantum yield (α), the maximum light saturated electron transport rate (ETRmax), the photochemical quenching coefficient (qP), the non-photochemical quenching (NPQ), and the quantum yields of regulated (YNPQ) and non-regulated non-photochemical energy loss in PSII (YNO) of banana fruit measured by rapid light curves (maxPFR = 235 µmol m−2 s−1) with PAM fluorometers during cold storage (◯ circles: 5 °C; ☐ squares: 10 °C; Δ triangles: 11.5 °C; ⃟ diamonds: 13 °C) and shelf life. The vertical dashed line indicates the end of cold storage on day 12 of the experiment. The filled circles reflect the means (the grey horizontal bar shows the respective SD) of all bananas (n = 76), measured before storage. Different small letters indicate significant (p < 0.05) differences between means.
Applsci 11 11433 g004
Figure 5. Differences of averaged remittance spectra (tec5 spectrometer) of the banana stored at the different temperatures (A: 5 °C; B: 10 °C; C: 11.5 °C; D: 13 °C; measured on days 2, 6, 12) and in shelf life (days 19, 23), and those of the untreated fruit on day 0.
Applsci 11 11433 g005
Figure 6. Means (±SD, n = 6) of the normalized difference vegetation index (NDVI), the photochemical reflectance index (PRI), the chlorophyll to carotenoid ratio, and the carotenoid index of banana fruit measured during cold storage (◯ circles: 5 °C; ☐ squares: 10 °C; Δ triangles: 11.5 °C; ⃟ diamonds: 13 °C) and shelf life. The vertical dashed line indicates the end of cold storage on day 12 of the experiment. The filled circles reflect the means (the grey horizontal bar shows the respective SD) of all bananas (n = 76), measured before storage. Different small letters indicate significant (p < 0.05) differences between means.
Applsci 11 11433 g006
Figure 7. (Upper figure) Comparison of the external appearance of untreated green-ripe bananas and samples stored at (A) 5 °C, (B) 10 °C, (C) 11.5 °C and (D) 13 °C, and, after ethylene exposed, in shelf life for eight days at 18 °C. (Lower figure) Samples (day 21) treated that way after gentle removal of a minor peel layer. In addition, the pulp was exposed by longitudinal cutting the fruit body close to the tips of these samples.
Applsci 11 11433 g007
Publisher’s Note: MDPI stays neutral with regard to jurisdictional claims in published maps and institutional affiliations.

