1. Introduction
The use of interim restoration is intended for a short period; however, understanding the surface property of the material is necessary for optimal esthetics, strength, and functioning [
1,
2]. In certain cases, such as implant loading and orthodontic and endodontic therapies, prolonged use of interim materials is required, which increases the need for optimal material surface strength and integrity while considering the influence of a complex oral environment [
3,
4].
Some clinical studies have suggested that interim restoration loses balanced occlusal contacts following the wear process, which causes an over eruption of teeth and loss of the occlusal clearance and vertical dimension of occlusion [
5,
6]. In addition, surface roughness enhances plaque retention, promoting bacterial colonization, especially at the restorative margins, resulting in periodontal inflammation and infection. These drastic changes contribute to pulpal sensitivity, gingival recession, and tissue inflammation [
7,
8]. Furthermore, inflamed soft tissues complicate the challenge of restorative rehabilitation. Thus, to prevent interference with the vertical dimension of occlusion of definitive restoration and to preserve the periodontal restorative interface oral health, an optimal quality of interim restoration is desired.
One essential property of resin-based interim restorations is marginal integrity and adaptation, which influences the restorative retention, function, occlusion, and preservation of tooth structure. The accuracy of restorative marginal fit is critical for the long-term survival and prognosis of definitive restorations [
9]. These crowns are not only valuable in terms of aesthetics and function but act as a blueprint for definitive restoration [
9,
10]. Hence, the accuracy of the margins influences the success of the definitive restorations along with gingival health [
11]. Moreover, any marginal misfit and disruption in crown adaptation in interim restorations will affect definitive restorative procedures and placement.
Literature suggests that custom-made interim crowns produce a better result in terms of marginal integrity, particularly when employing the direct technique with resin polymers [
12]. However, these custom-made techniques impose certain risks, such as the distortion of margins in early removal, delayed setting, irregular margins, and polymerization exotherm and shrinkage [
13]. Hence, to overcome these drawbacks, operators have employed advanced technology that indirectly designs a precise and accurate interim crown, enhancing the outcome while restoring the prepared tooth with a definitive prosthesis. These contemporary methods include CAD-CAM, subtractive manufacturing techniques, and additive manufacturing methods, including 3D printing.
It is considered that materials are not the only factor that influences the surface property and mechanical strength of the restoration [
14,
15]. Fabrication techniques were also assumed to equally influence the surface characteristics and marginal integrity of the interim crown [
16]. Contemporary digital technology interventions such as CAD/CAM and 3D printing have eased the revolutionized fabrication of interim restorations chairside in clinics [
17]. These modern technologies efficiently use the digital image of the prepared tooth to design and fabricate the resin-based interim restoration. However, limited data is present to differentiate the critical properties of 3D-printed interim restorations compared to conventional and CAD-CAM methods. Thus, the present study aims to assess the influence of the fabrication techniques (CAD-CAM, conventional, and 3D printing) on the surface roughness, surface wear, and marginal misfit of interim crowns.
2. Materials and Methods
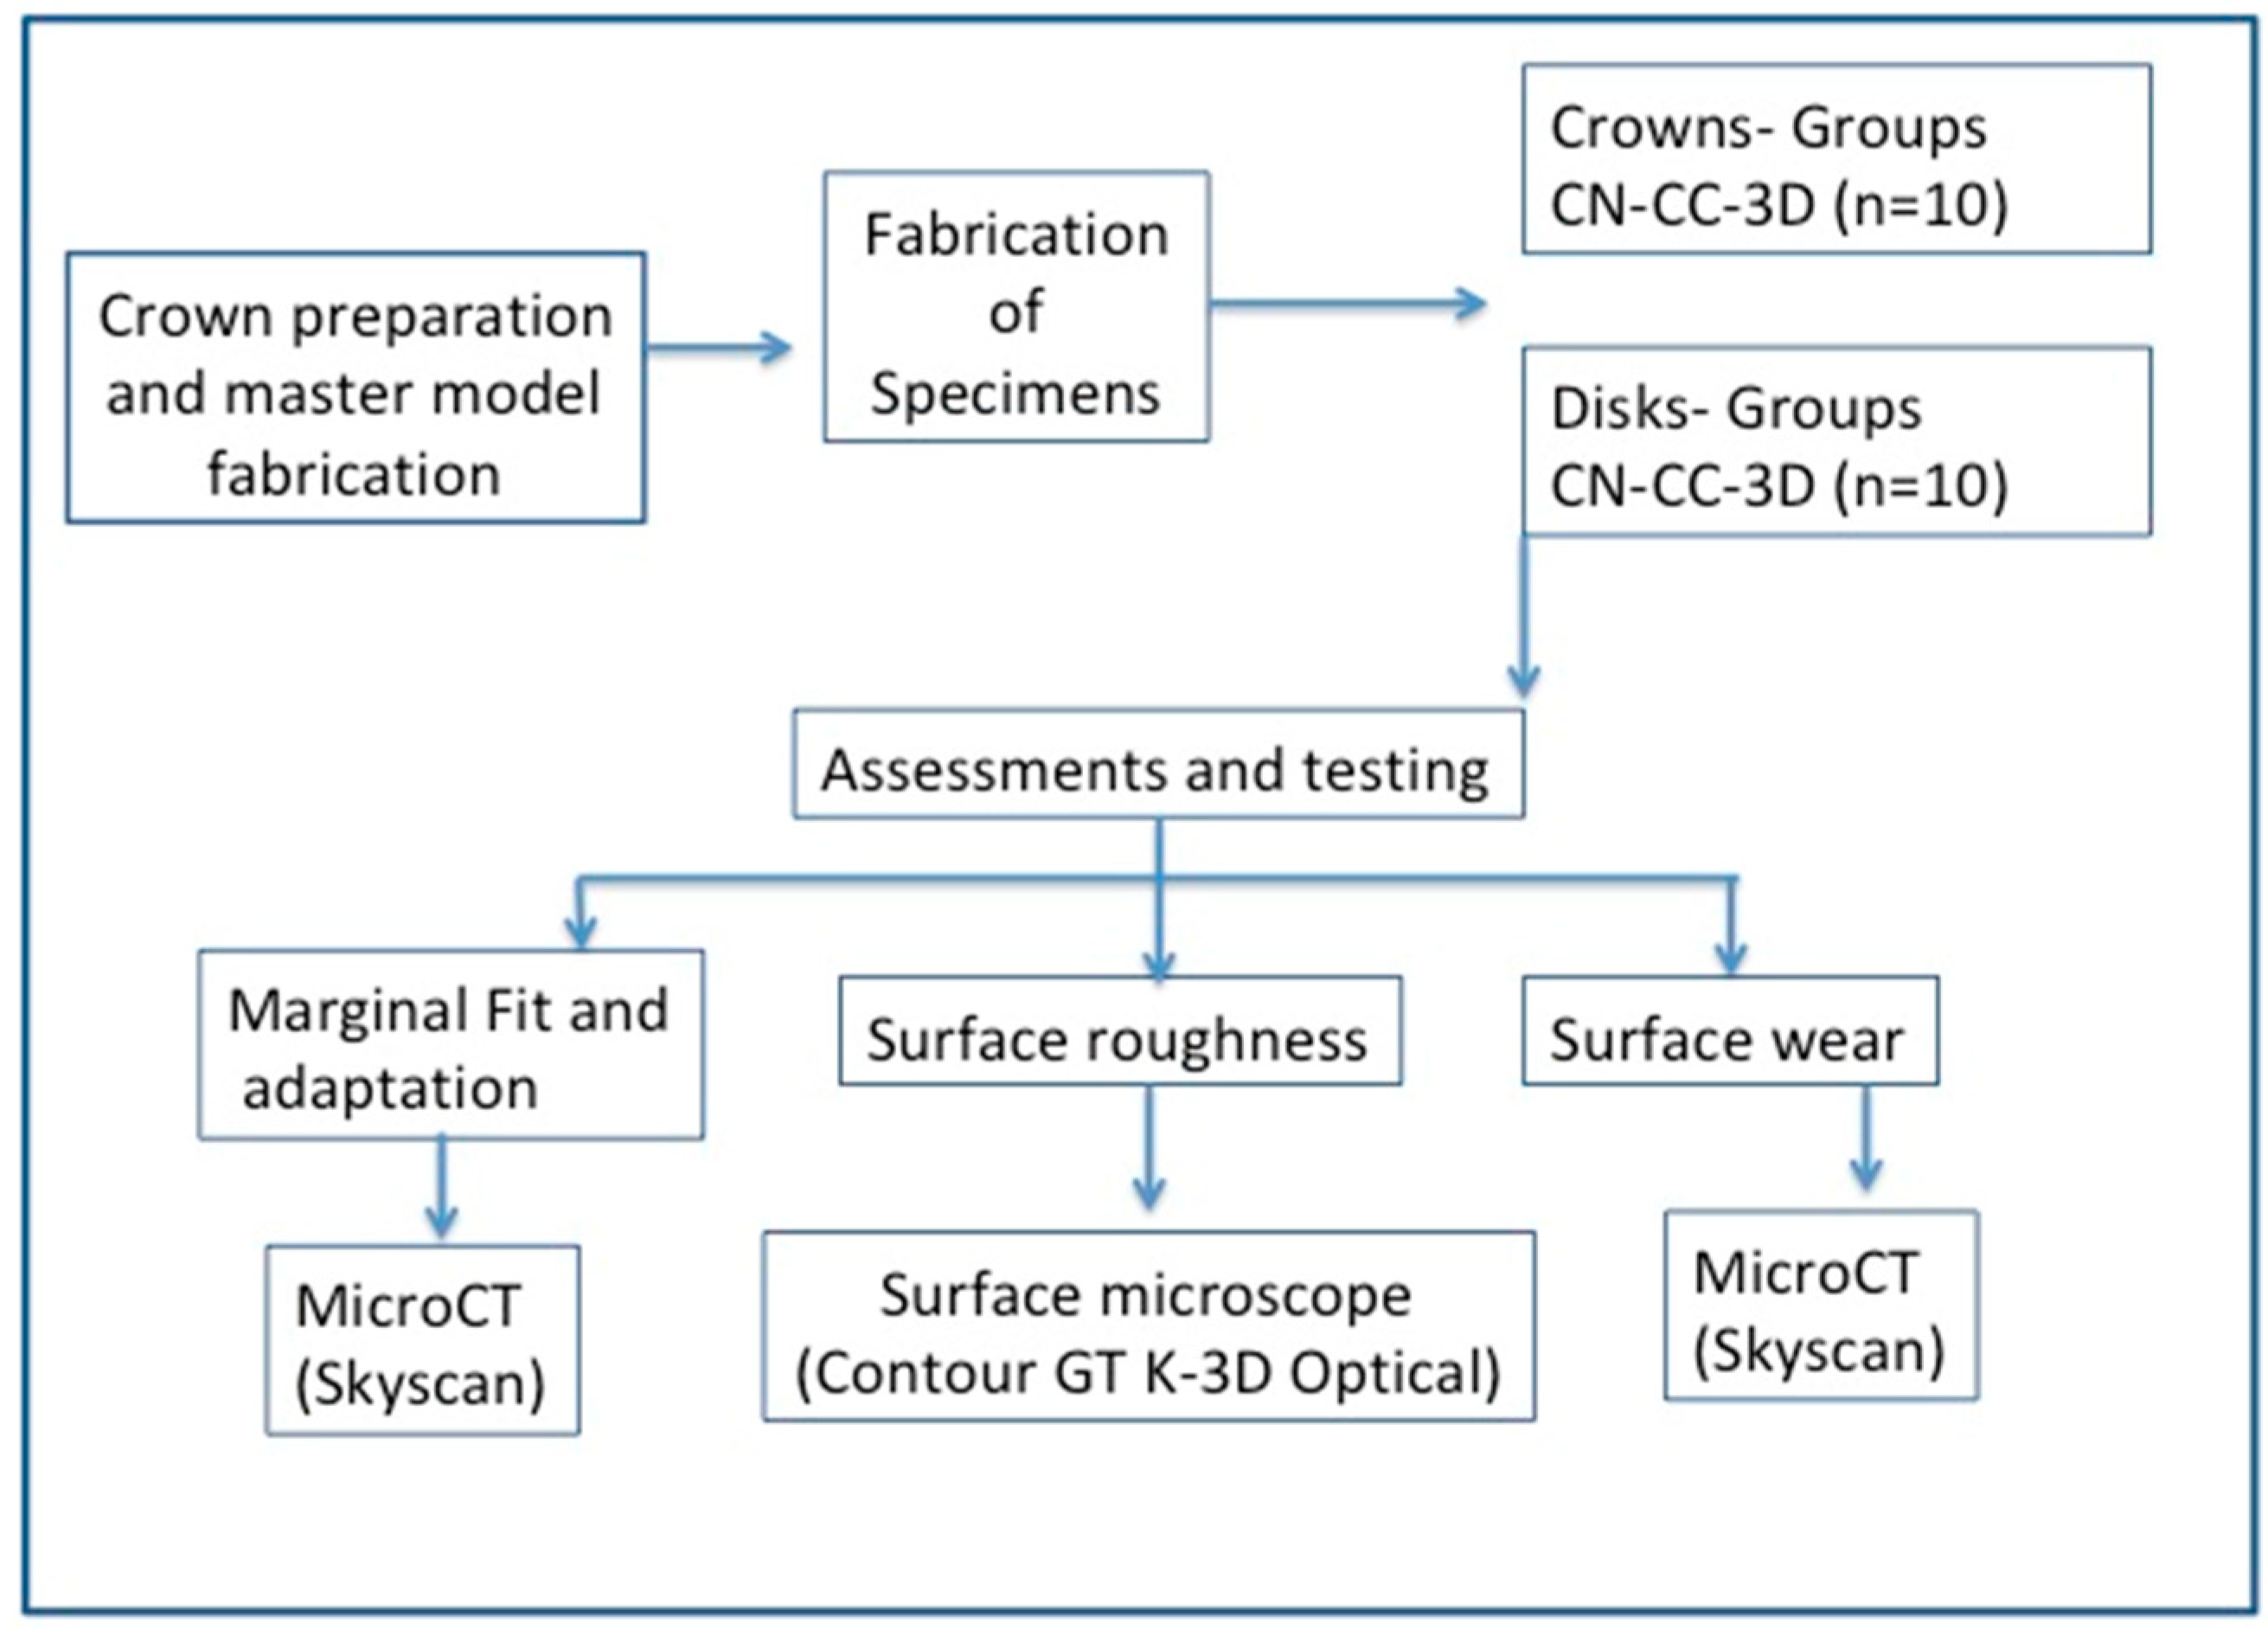
The present study was performed in accordance with standard protocols to analyze the surface properties of crowns, including surface wear, surface roughness, and marginal misfit and adaptation of interim restorations using conventional and CAD-CAM technology and 3D printing. A brief outline of the study methodology is presented in
Figure 1.
2.1. Study Groups
The properties assessed in the study included interim crown adaptation and marginal misfit, surface roughness and surface wear using disc specimens, and correlation of marginal fit and adaptation with surface roughness. Ten samples were included in each group, which were adopted from similar previous studies [
18,
19]. Thirty interim crowns were fabricated using CN, CC, and 3D techniques. Sixty discs were fabricated to evaluate surface wear and surface roughness properties with 10 disc samples in each group. The major variable in the study was the technique of fabrication and processing of interim restorative material, which included conventional technique (CN) as the control group, CAD-CAM (CC), and 3D printing (3D). The following groups were included in the study.
A—Adaptation and Marginal fit. Conventional interim crowns (CN) (n = 10): crowns fabricated using a conventional technique. CAD-CAM interim crowns (CC) (n = 10): crowns fabricated using the CAD-CAM technique. 3D-printed interim crowns (3D) (n = 10): crowns fabricated using a 3D printing technique.
B—Surface Wear. Conventional discs (CN) (n = 10): specimens fabricated using a conventional technique. CAD-CAM discs (CC) (n = 10): specimens fabricated using a CAD-CAM technique. 3D-printed discs (3D) (n = 10): specimens fabricated using a 3D printing technique.
C—Surface Roughness. Conventional discs (CN) (n = 10): specimens fabricated using a conventional technique. CAD-CAM discs (CC) (n = 10): specimens fabricated using a CAD-CAM technique. 3D-printed discs (3D) (n = 10): specimens fabricated using a 3D printing technique.
2.2. Master Model Preparation
A master model was prepared to facilitate the preparation of 30 interim restorative crowns. A plastic (typodont) mandibular first molar on the master model was prepared for an all-ceramic restoration (crown) with a 1.5 mm occlusal reduction, a 1 mm chamfer finish line, and a 6-degree convergence angle. An initial impression of the master model was taken as a reference to fabricate a putty index used to guide the precise reductions in tooth preparation. After preparing the tooth, the model was embedded in an orthodontic epoxy resin (Tri-Epoxy; Keystone Industries) base. Following resin polymerization, a polyvinylsiloxane (PVS) impression (Hydrorise; Zhermack) of the prepared tooth was recorded and poured with a dental stone (dental stone IV) to fabricate stone dies for the preparation of the interim crown restorations as study samples. These fabricated crowns were divided into three groups based on the types of fabrication technique (n = 10) employed in order to evaluate the adaptation and marginal misfit.
2.3. Specimen Fabrication Technique
Conventional technique. One crown fabricated with the CAD-CAM technique was secured on the prepared cast, and a silicone impression using light and putty PVS impression material (3M Express Putty, 3M ESPE, MN USA) was recorded to form a mold to make interim crowns using the conventional technique. Two location grooves were placed on the buccal and lingual surface of the master model to replicate the positioning of the mold. The prepared teeth surface on the models were layered with a 0.1 mm layer of die spacer (Durolan die spacer, DFS Diamon, Shanghai, China). The prepared stone model was covered with a thin layer of petroleum jelly (Vaseline, Janssen, Surrey, UK) and thinned with air under pressure. An auto polymerizing resin material (Jet Tooth Shade™ Self-Curing Acrylic Resin 6/1 Kit, Lang Dental Manufacturing Co Inc., MN, USA) was mixed according to the instructions from the manufacturer and poured into the impression mold with a powder/liquid ratio of 1 gm/0.5 mL. The model was immediately seated in the impression mold with firm force and secured with bands. The resin was allowed to polymerize for 10 min and placed in a warm water bath at 55 °C for 10 min.
The mold was separated carefully from the model without damaging the restoration. Excess material was removed, and the final interim restoration was finished (slow speed airotor and carbide bur) and polished (pumice). Ten crowns were fabricated using the above-mentioned technique (n = 10). A metal mold of 10 mm diameter and 3 mm thickness was prepared. An auto polymerizing resin material (Jet Tooth Shade™ Self-Curing Acrylic Resin, 6/1 Kit, Lang Dental Manufacturing Co Inc) was mixed according to the instructions from the manufacturer and poured into the metal mold. The resin was allowed to polymerize for 10 min and placed in a warm water bath at 55 °C for 10 min. The mold was separated carefully from the disc without damage. Twenty disc specimens were fabricated using the above-mentioned technique.
CAD-CAM. Ten interim crowns were fabricated using the CAD-CAM technique (n = 10). The prepared master die was scanned (S 50 Zenotec CAD; Wieland Dental, Pforzheim, Germany) to produce a model specimen for the prepared molar. The interim crown was designed using a software program (AUTODESK FUSION 360, Kilsyth, Victoria, Australia) with standard occlusal anatomy and contours. The prepared design of the scan and the interim crown were stored as an STL file. The PMMA prefabricated blocks (Cercon base PMMA blocks; DeguDent GmbH, Hanau, Germany) in shade A1 were milled using a wet CAD-CAM milling machine (Versamill; Axsys Dental Solutions, Wixom, MI, USA). The parameters were adjusted accordingly: 5 axes; 6.0 mm shaft tool; 60,000 rpm spindle. The milling machine noted that all the prescribed parameters were delivered accurately using a CAD-CAM PMMA block (Cercon base PMMA blocks; DeguDent GmbH, Hanau, Germany). For surface wear and roughness assessment, ten discs, each with a 10 mm diameter and 3 mm thickness, were fabricated using the CAD-CAM system (AUTODESK FUSION 360, Kilsyth, Victoria, Australia). The discs were designed, and the PMMA prefabricated blocks (Cercon base PMMA blocks; DeguDent GmbH, Hanau, Germany) in shade A1 were milled using a wet CAD/CAM milling machine (Versamill; Axsys Dental Solutions, Wixom, MI, USA).
3D Printing. For designing and fabricating 3D printed interims, a stereolithography-based 3D printer (MiiCraft 125; MiiCraft, Jena, Germany) was employed with a light-cure biocompatible resin (Freeprint Temp; DETAX GmbH & Co. KG, Ettlingen, Germany). The printer settings were adjusted accordingly: 50 µm layer thickness, 405 nm wavelength, shade A1, curing time of 2.40 s per layer, and orientation at zero. Ten interim crowns and 30 FPDs (2 × 2, 3 × 3, and 4 × 4 mm) were fabricated using the STL file created using CAD-CAM software (as explained in a previous section) and the 3D printer. After printing, each interim restoration (crown and FPDs) was soaked in 99% isopropyl alcohol for 60 s, followed by drying with compressed air. Subsequently, the interim restoration was cured with the help of UV light for 90 s in a curing chamber (220 V; Paul H. Gesswein & Co., Inc., Bridgeport, CT, USA). Polishing and finishing were performed (Palaseal; Kulzer, Hanau, Germany), and the specimens (crown and FPDs) were submitted for an evaluation of properties.
Twenty 3D printed disc specimens were prepared using a stereolithography-based 3D printer (MiiCraft 125; MiiCraft, Jena, Germany) and a light-cure biocompatible resin (Freeprint Temp; DETAX GmbH & Co. KG, Ettlingen, Germany). The STL file created previously in the CAD-CAM procedure was utilized to design the disc in accordance with the required dimensions (10 mm diameter and 3 mm thickness).
2.4. Adaptation and Marginal Integrity Assessment
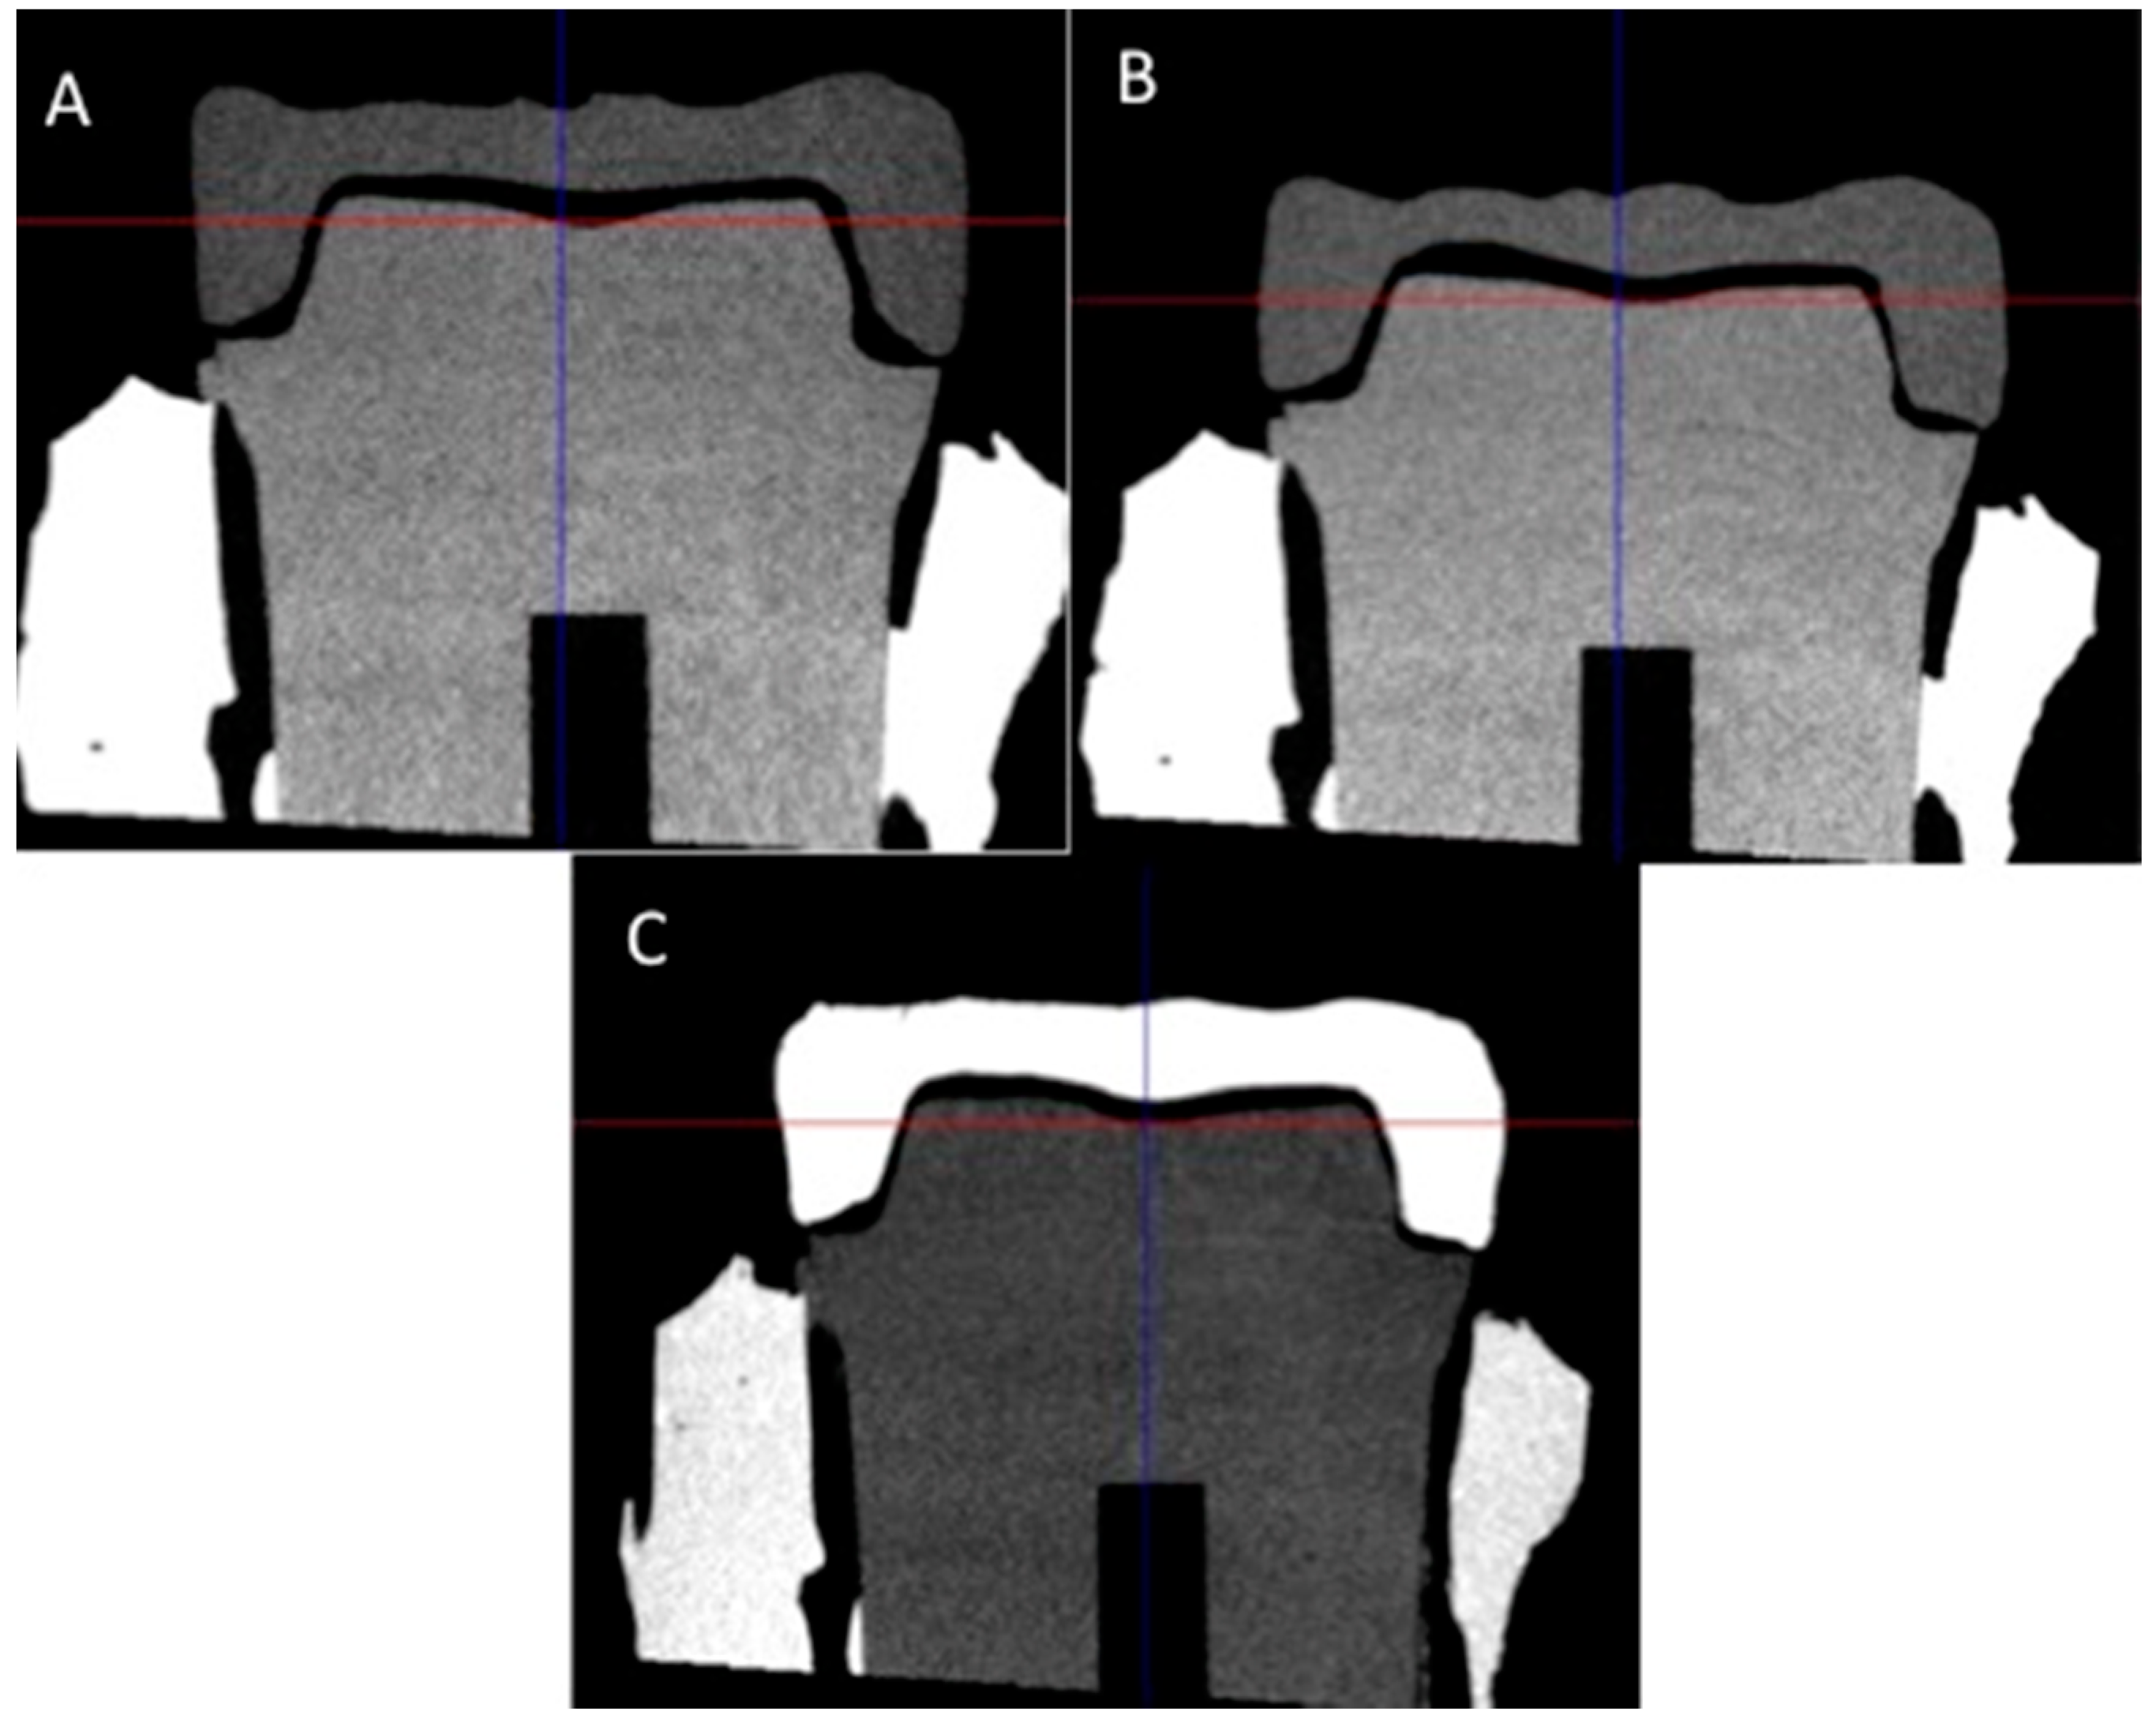
The crown adaptation and marginal misfit were assessed in micrometer (μm). Internal adaptation and marginal integrity of interim crowns were analyzed on the master die with Bruker micro CT (Skyscan 1173 high-energy spiral scan micro-CT; Skyscan NV, Kontich, Belgium) to detect microgaps at selected points. Microgaps were detected at buccal, mesial, distal, and lingual locations between the tooth preparation for the adaptation and CEJ points at the margin of 4 different surfaces. Each sample was mounted and positioned inside the specimen chamber with the following scanning parameters: 130 kV of X-ray source energy, 60 µA of source current, and 300 ms of exposure time using a brass 0.25 mm filter with 0.2° rotation step for a 360° angle; the amount of frame averaging was 4 to create a good image of the structure. The specimen-tooth complex was placed in a fabricated mold to keep the position constant for optimum outcomes. The average time for a scan was 1.5 h. A 3D reconstruction of images was performed after scanning using N-Recon® software (program version 1.6.1.3, Bruker Skyscan, Kontich, Belgium). Parameters were adjusted to enhance image quality, as follows: post-alignment compensation, 6% of artifact reduction, 25% of hardening correction, and smoothing of 2 with a Gaussian kernel. A slice thickness of 14 µm with 10,890 slices was used to ensure that the specimen would be included. A 16 bit tagged image file format was selected for saving the images.
Images were loaded into Dataviewer® software (Bruker Skyscan, Kontich, Belgium) to determine image quality, resizing, correct positioning, and visual inspection. Each scanned image of a sample was opened in the software, and measurements were taken at standardized location points. The measurements were preformed between the surface of the tooth preparation and the inner surface of the interim crown.
2.5. Cyclic Loading
Twenty disc samples from each of the three fabrication technique groups (CN, CC, and 3D) were exposed to cyclic loading using a chewing simulator machine CS4 (SD Mechatronic, Feldkirchen, Westerham, Germany). The disc samples were mounted in a Teflon-lined metal jig for securing the samples in the simulator. For all assemblies, loads of 50 N were applied, with exposure to 20,000 cycles. The dynamic chewing was initiated with 0.5 mm eccentric sliding at a frequency of 1.2 Hz in continuous contact. The antagonists were fabricated using a composite (filtek Z350 XT, 3M ESPE, St. Paul, MN, USA) with a 4 mm diameter and positioned 3 mm away from the center of specimens; distilled water was filled up to 2 mm above the platform. For each group, the exposure to cyclic loading was completed in 1 week. The process replicated oral conditions at 37 °C for comparable in vivo outcomes.
2.6. Surface Micro-Roughness
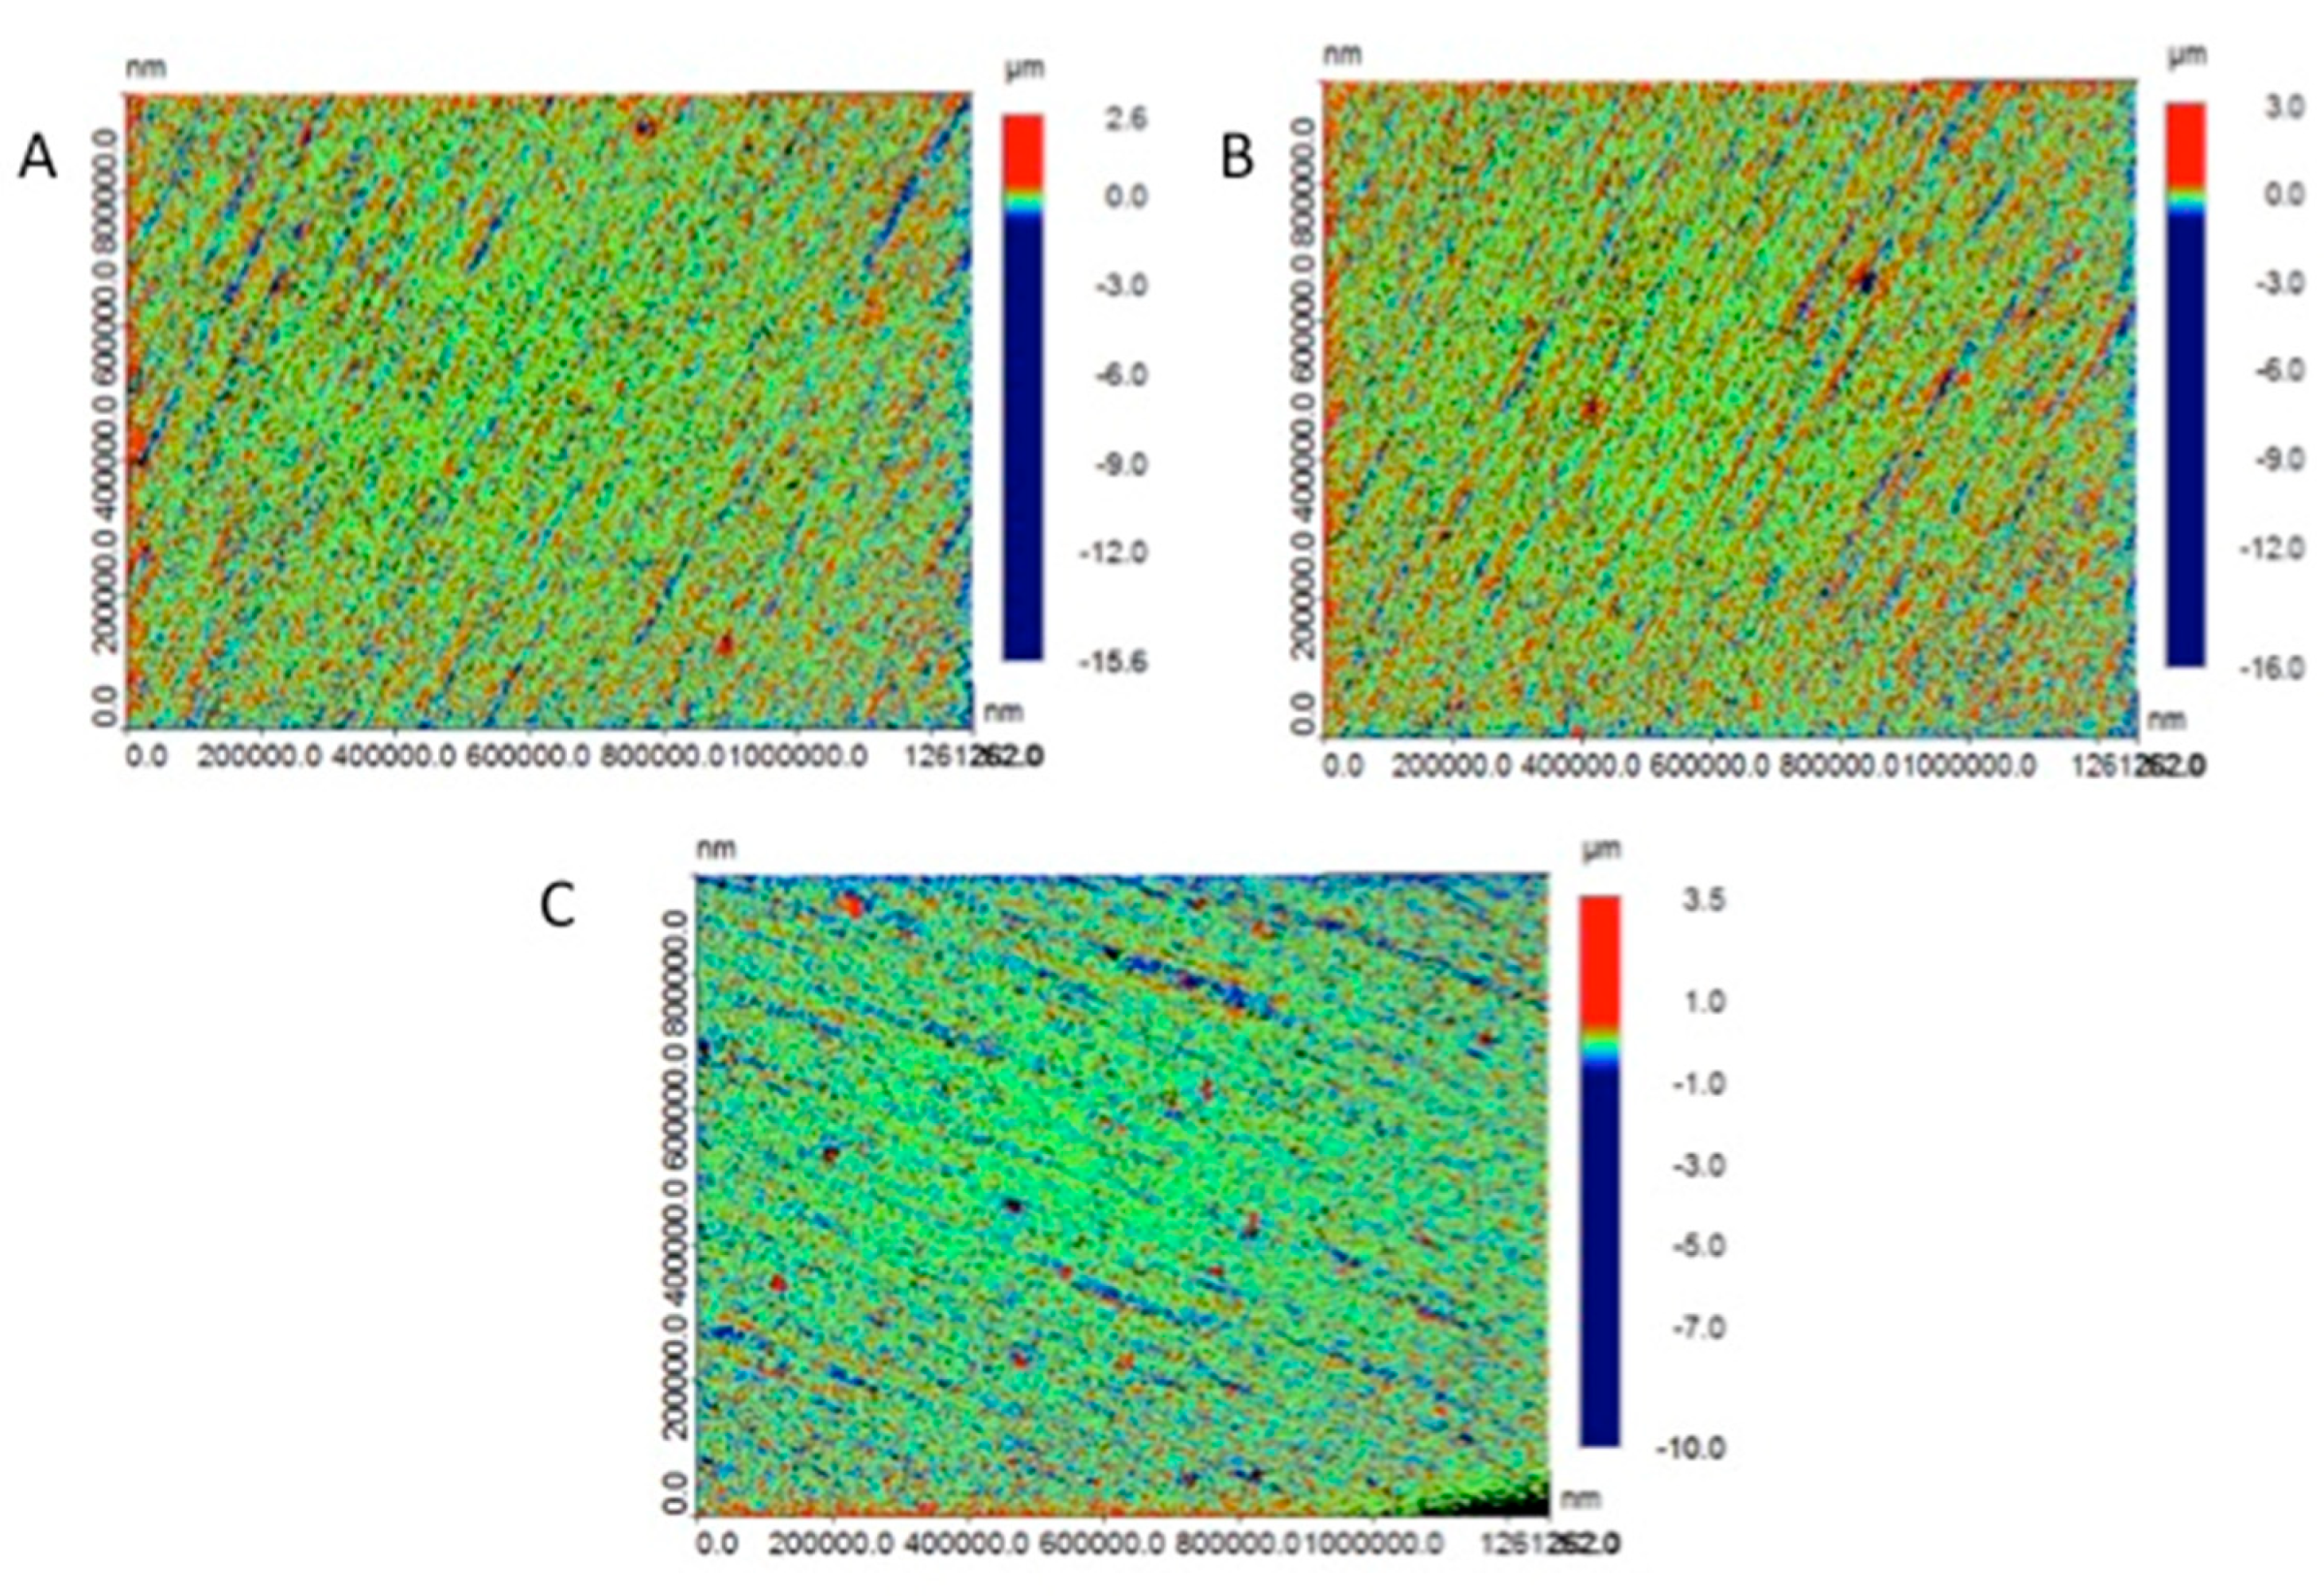
The average surface micro-roughness (Ra) was calculated in micrometers (μm) after exposing the disc samples to cyclic loading. Employing a 3D optical non-contact surface microscope (Contour GT-K 3D Optical Microscope, Bruker®, Tucson, AZ, USA
), the surface micro-roughness of the specimens was measured. The instrument is based on the principle of white light interferometry to evaluate the surface configuration and roughness of the specimen surface. An objective standard camera with 1× magnification and a 5× lens with a single window of 1 × 1 mm, 1× scan speed, and 3% thresholding was used. For each disc specimen, 5 scans at standardized points were performed, and the surface roughness values with the micrograph were recorded.
The device used a light source with a laser beam of 2 μm and a vertical resolution of 10 nm. The machine was kept in a temperature-controlled room (22.0 °C) with a controlled vibration system. When the laser was emitted, the light reflected on the interim surface and constructed an image to view the surface alteration. Previous studies have recommended repeated measurements of 1 nm to measure the Ra roughness of the polished surface before and after the dynamic chewing examination. The collected images were compared and analyzed using the software to display the surface roughness.
2.7. Surface Wear Assessment
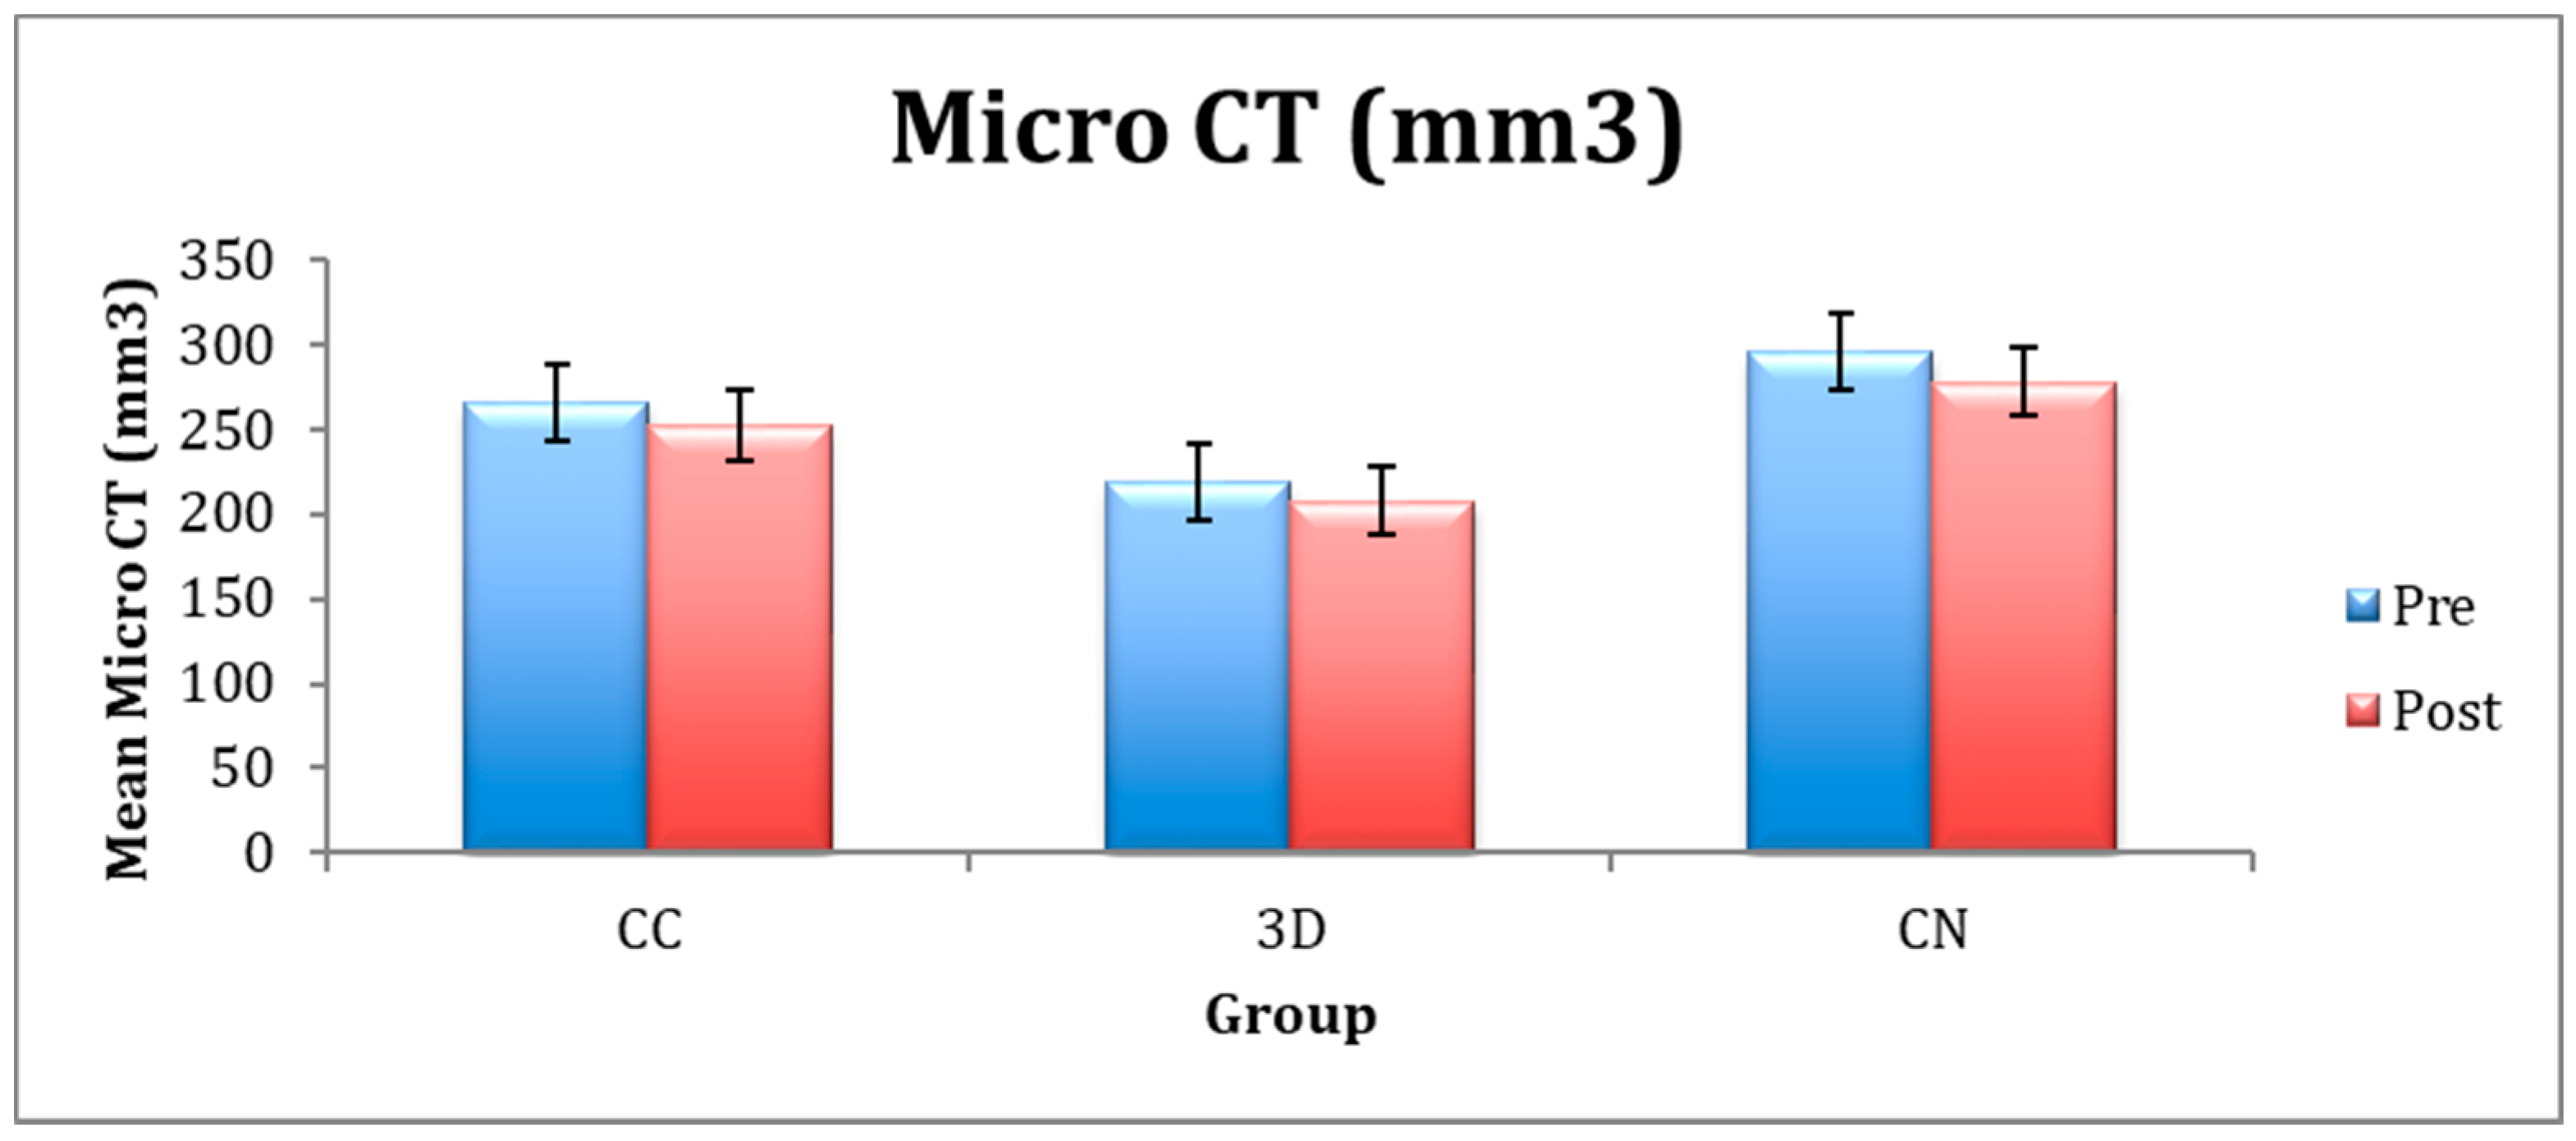
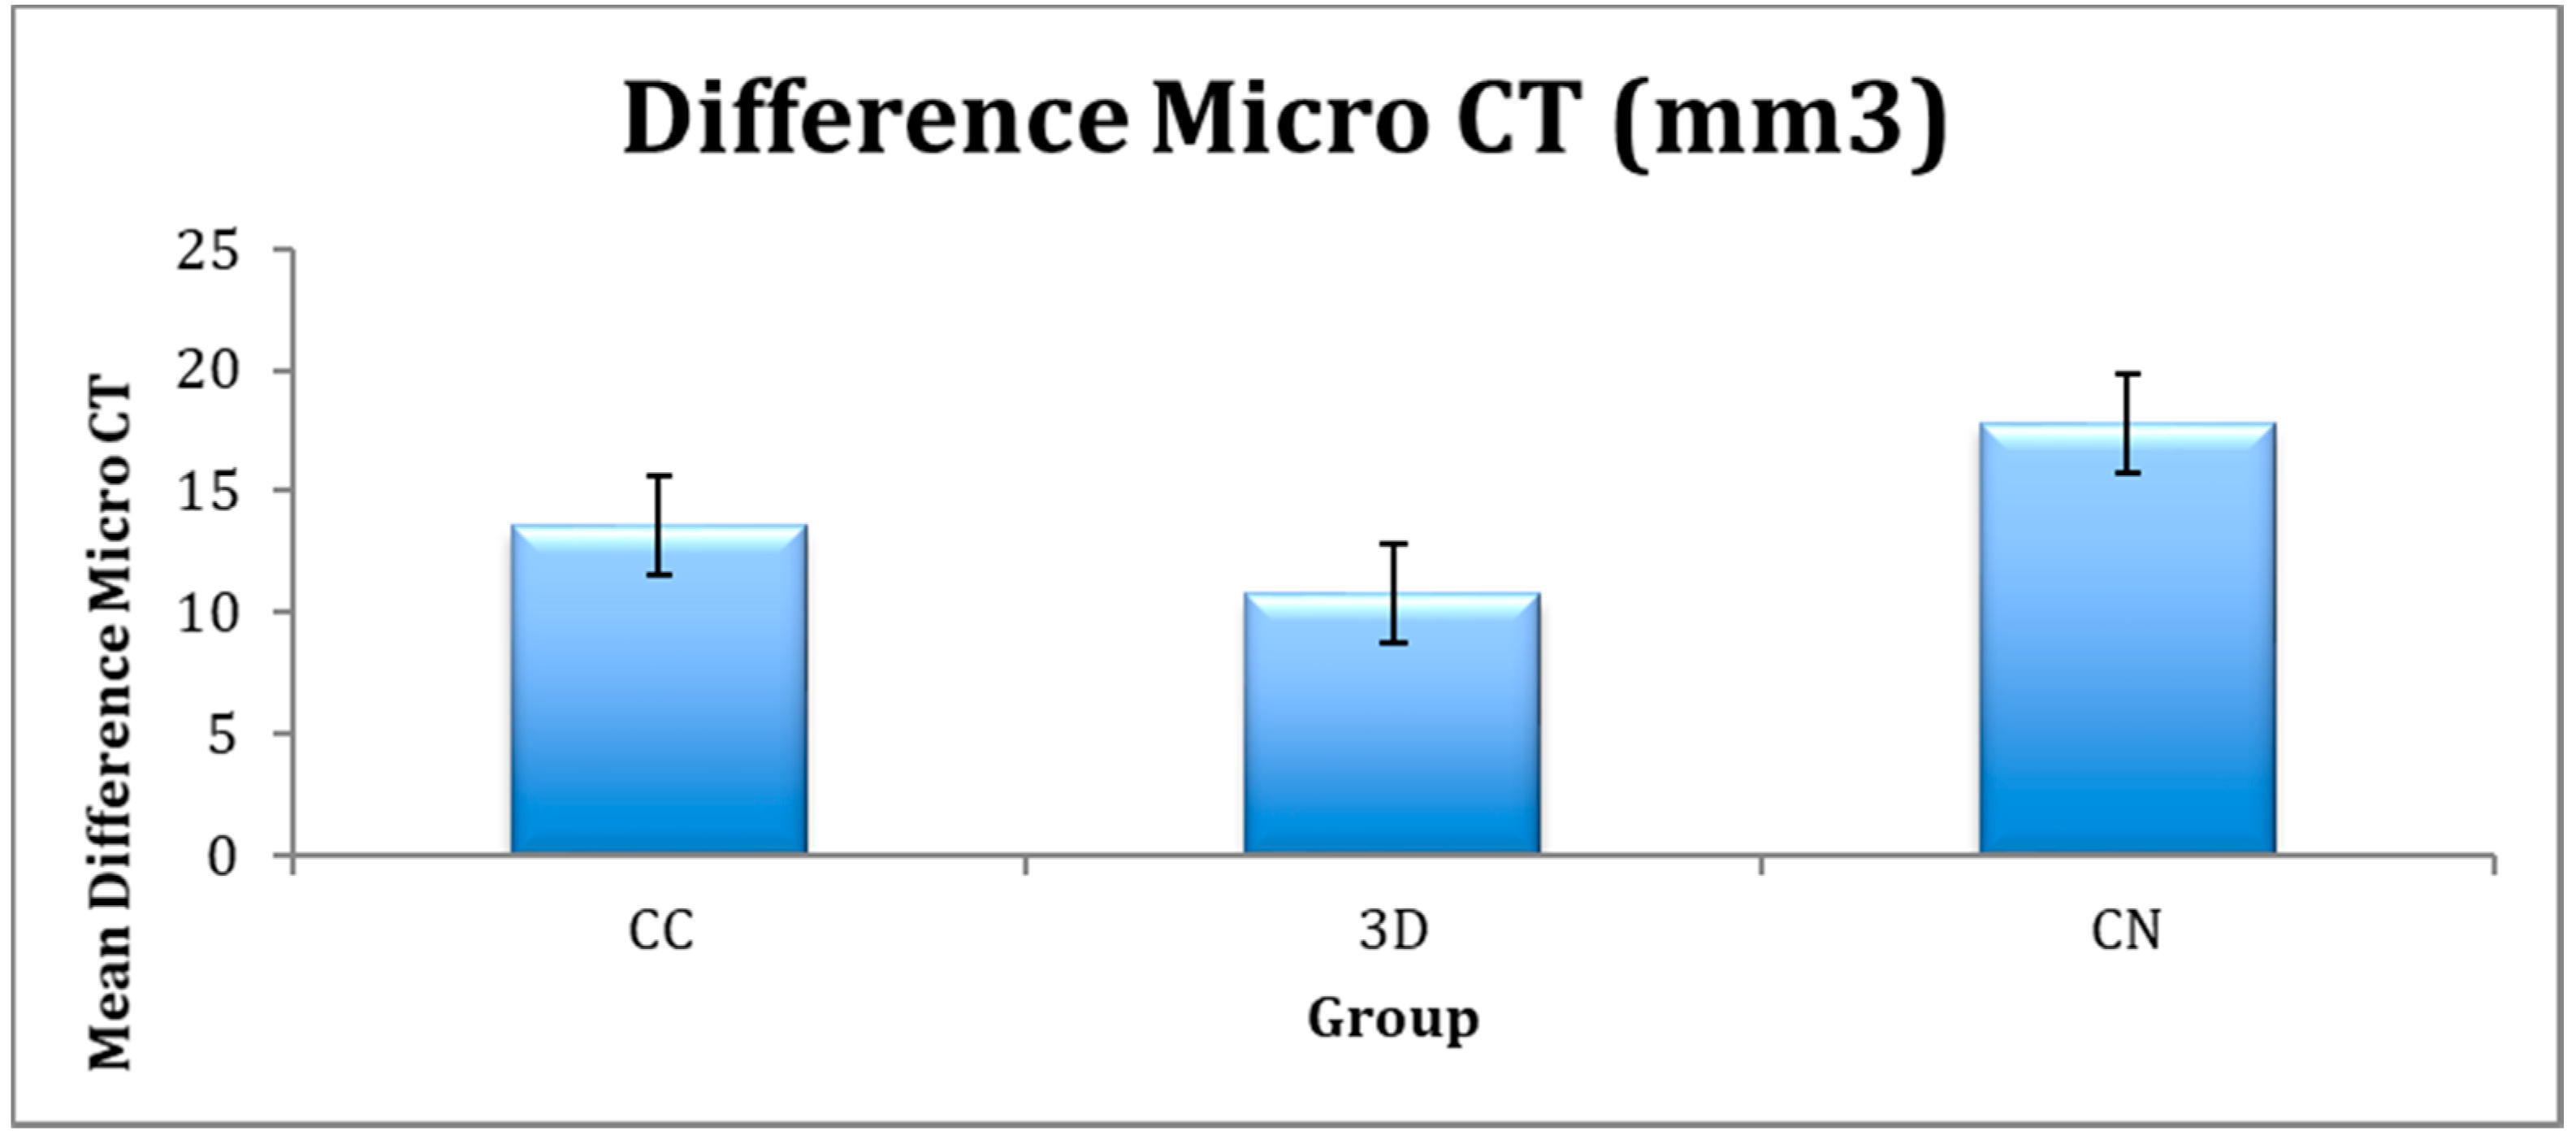
To evaluate the surface wear of the interim restorative material discs among the study groups, surface area measurements in cubic millimeters (mm3) were performed using a micro CT (Skyscan 1173 high-energy spiral scan micro-CT; Skyscan NV, Kontich, Belgium). Measurements of each sample were performed before and after cyclic loading exposure, and surface loss was assessed. To analyze surface wear, the before and after images were subtracted, and wear was calculated. The device slices the object slice by slice to have a closer look internally at different points. Thus, at a small scale, a higher resolution image is observed. The sample image ranges from 100 nanometers to 200 millimeters in diameter. The X-ray source transmits the X-ray beam across the samples and captures a series of 2D images while the samples rotate. The cross-sectional slices are reconstructed and viewed as a 3D image.
2.8. Statistical Analysis
The data were analyzed using Statistical Program for Social Sciences software (SPSS, Version 23 IBM, NY, USA). Normality distribution of the data was assessed using Levene’s test. All parameters were assessed using parametric tests. Means and standard deviations of the study groups for the three properties (adaptation, surface micro-roughness, and surface wear) were compared using an analysis of variance (ANOVA) and Tukey’s post hoc comparison tests. A p-value of <0.05 was considered statistically significant among the group comparisons. Pearson correlation was used to assess the dependence between the independent variable (surface roughness) and the dependent variables (crown adaptation and FPD fracture loads). The correlation coefficient was calculated to assess a statistical relationship between the variables r = ±1.
4. Discussion
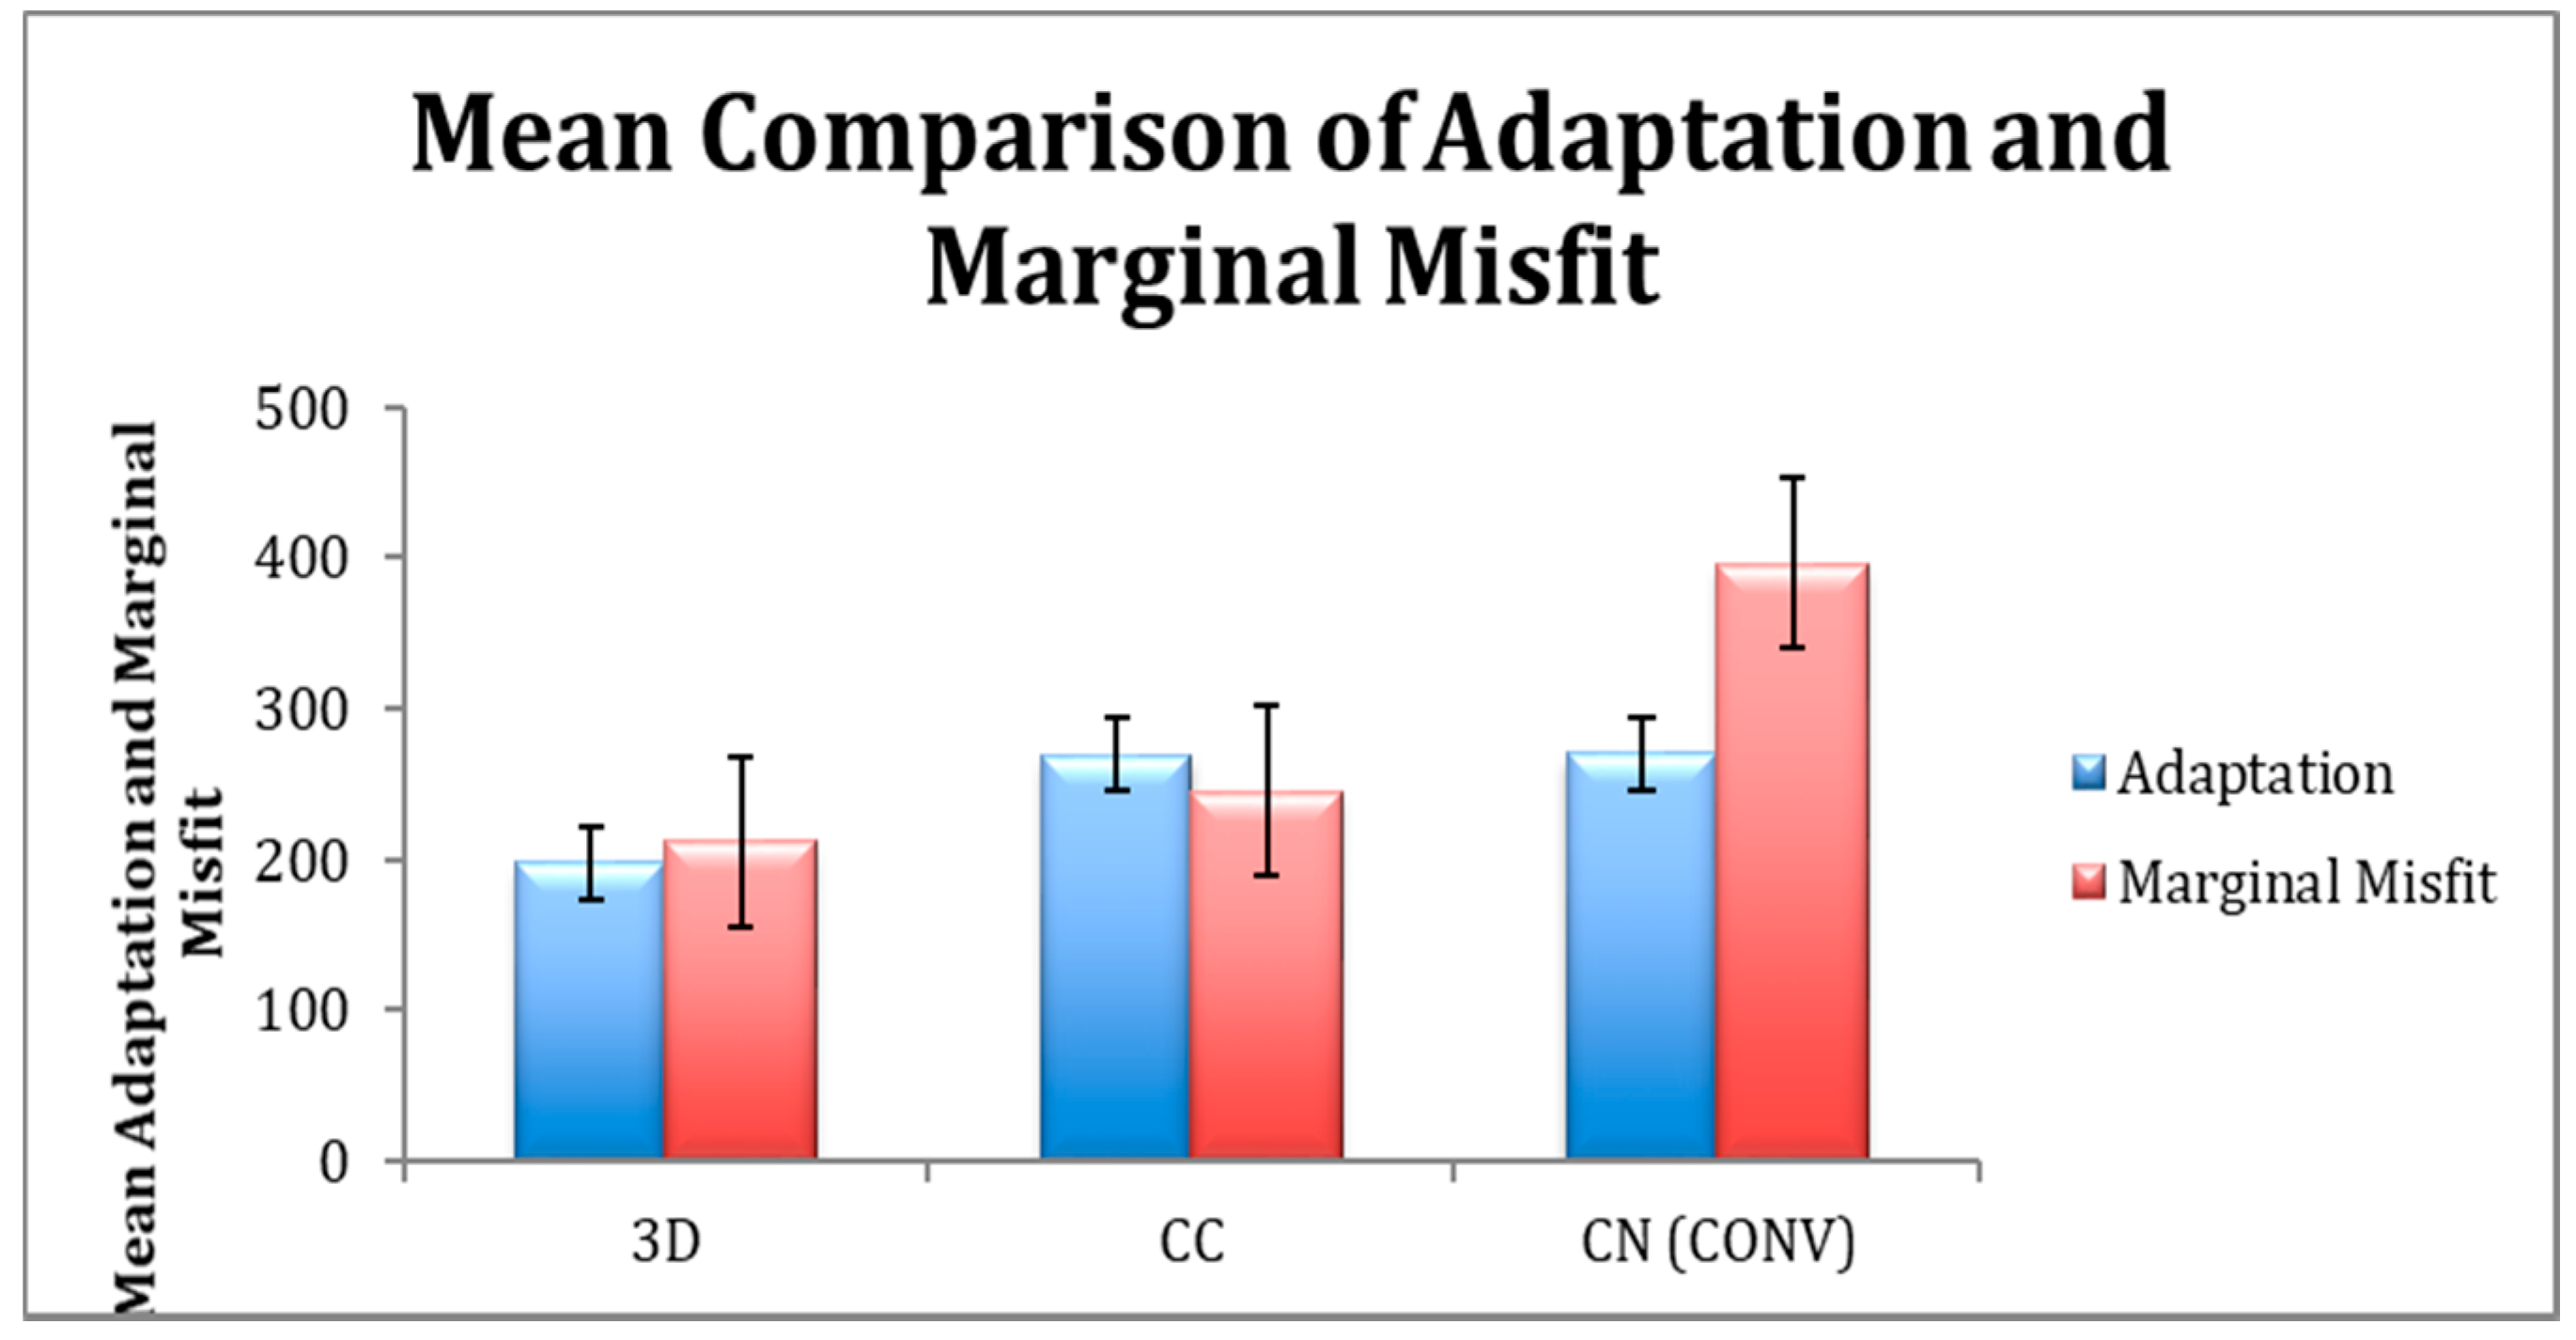
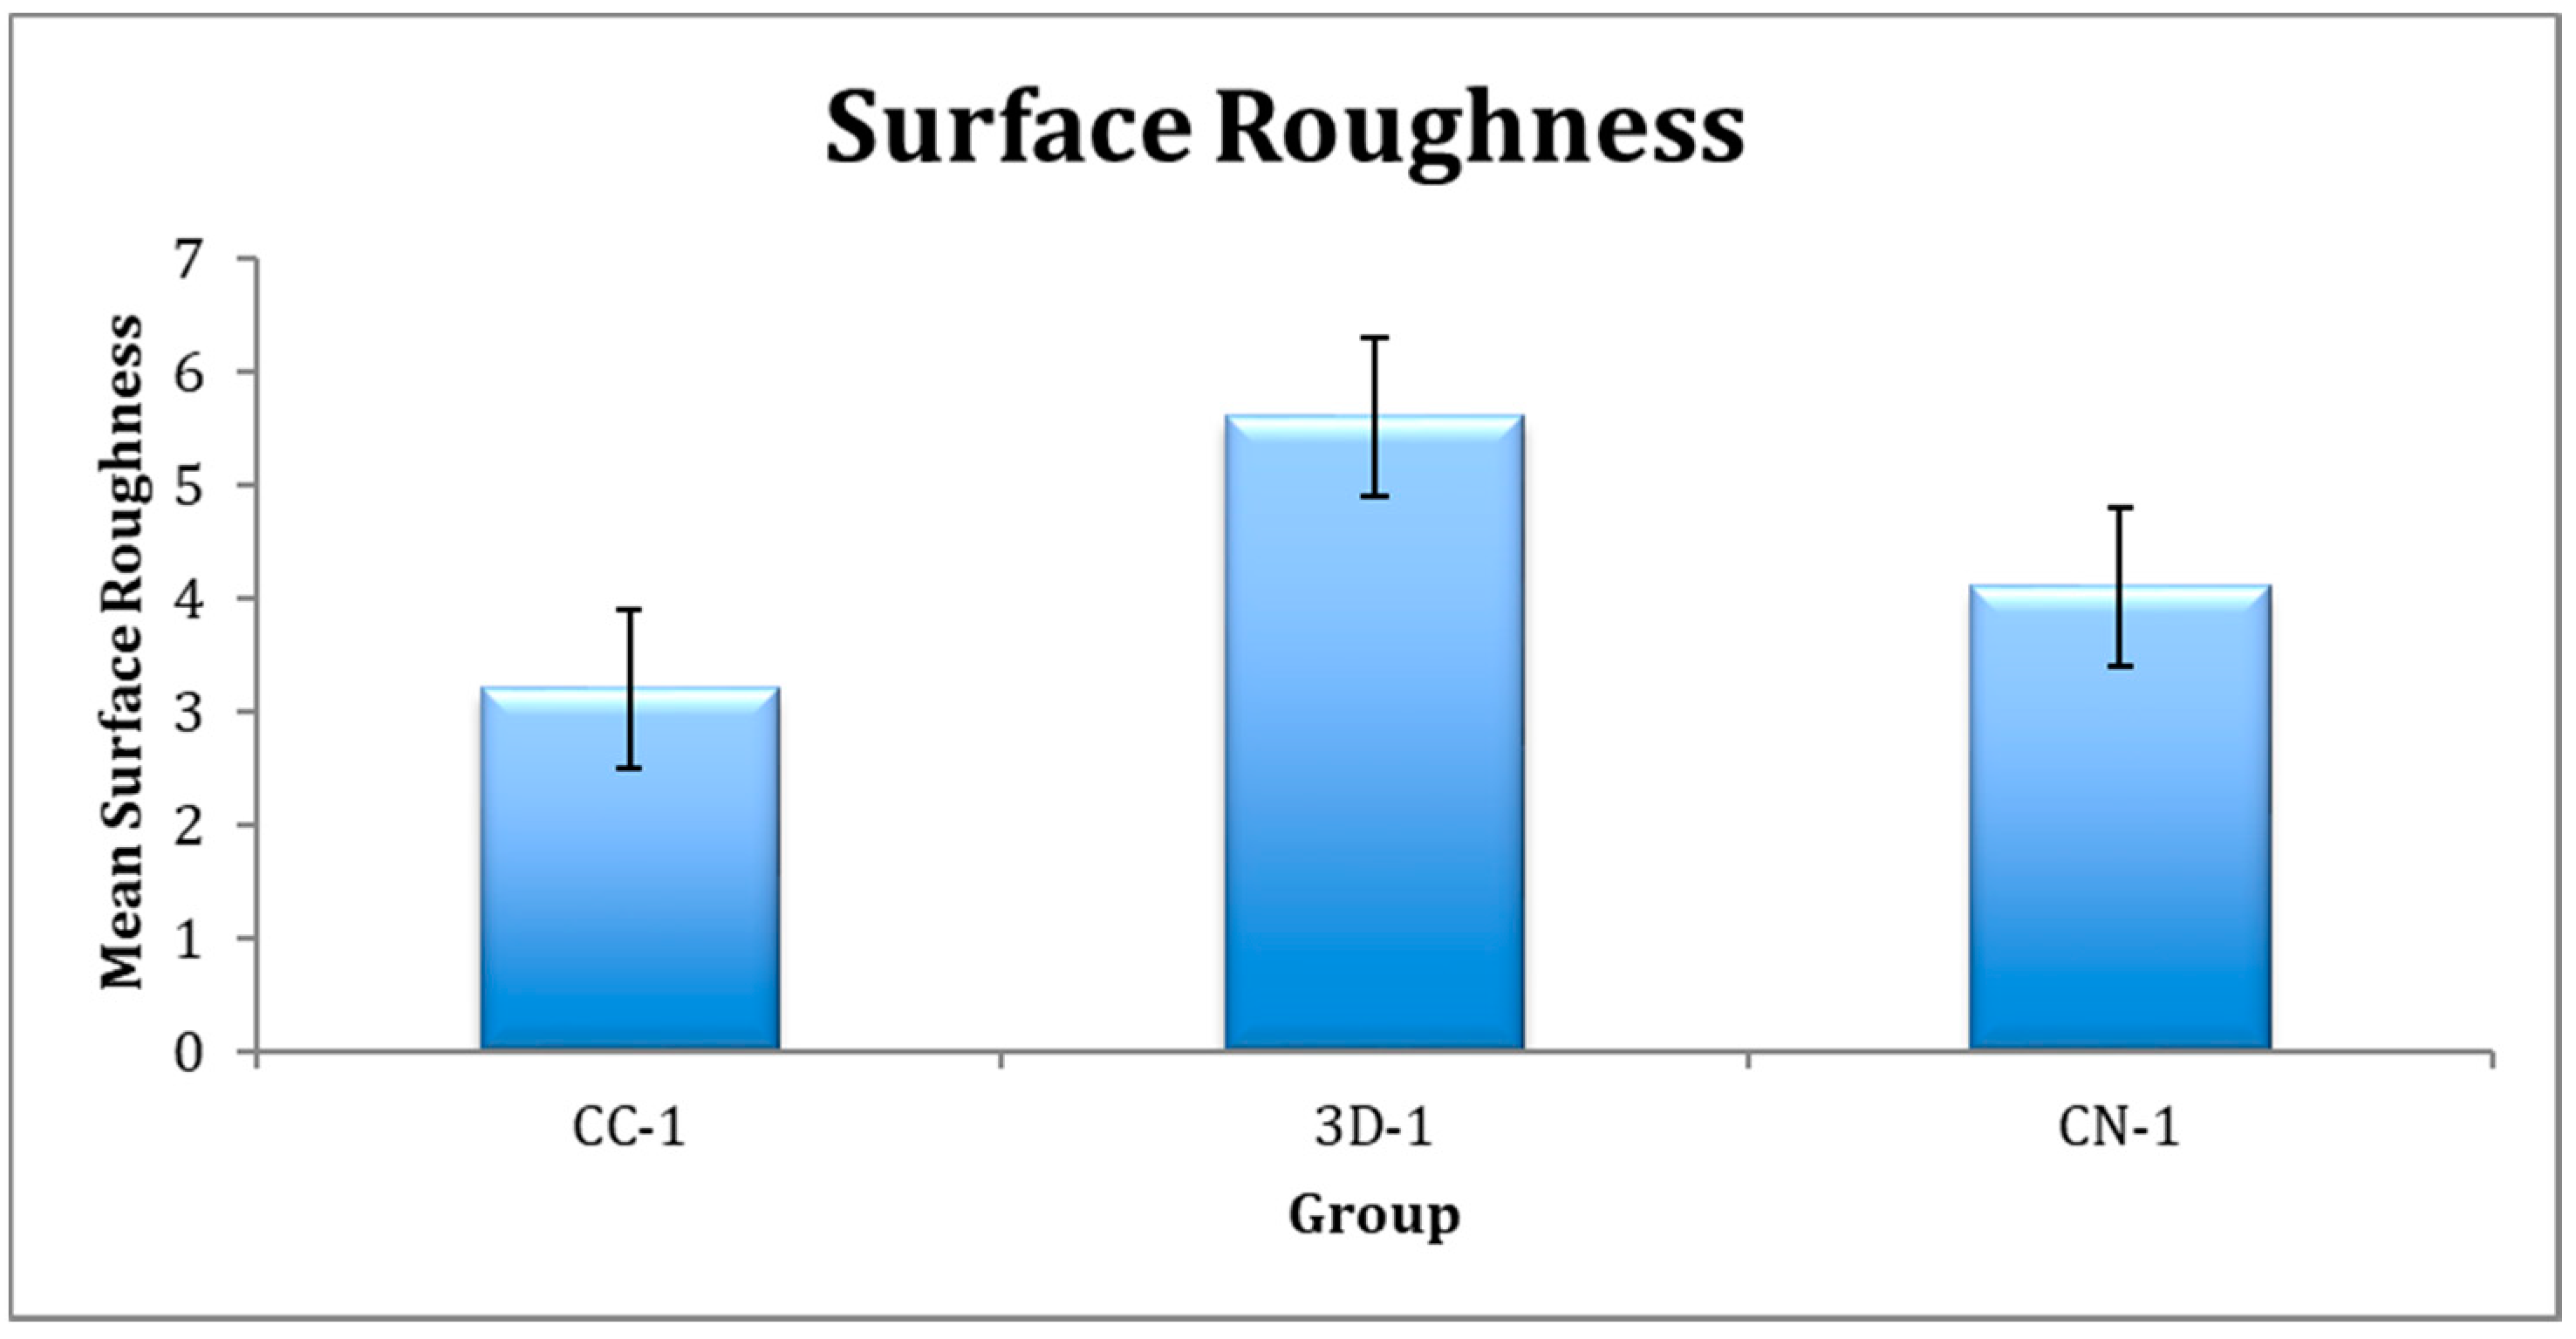
The present study investigates the influence of fabrication techniques—CAD-CAM, conventional, and 3D printing—on the surface property and marginal integrity of interim crowns. These samples were evaluated for three different physical properties: surface roughness, marginal misfit, and adaptation and surface wear. The techniques were compared to establish the superior efficacy of the techniques and their influence on interim restoration’s long-term success. It was hypothesized that fabrication techniques have an influence on marginal fit and adaptation, surface roughness, and wear properties. Nevertheless, the outcome presented that 3D printing showed superior efficacy to CAD-CAM and conventional techniques in terms of marginal fit and adaptation and surface wear. However, the highest surface roughness was observed in 3D-printed specimens, followed by conventional and CAD-CAM specimens. Hence, the null hypothesis was rejected.
The present study further demonstrated that the conventional technique and CAD-CAM produced comparable outcomes for crown adaptation to the tooth’s surface, and 3D printing produced superior adaptability. However, 3D printers and CAD-CAM showed similar results compared to the higher conventional crown misfit. In light of medical literature, the manual preparation of the interim restoration, trimming off the excess and removal during the setting time, is the main reason for the distortion and misfit of the crown [
18]. Thus, modern technology such as CAD-CAM and 3D printing produces a better marginal fit and adaptation due to precise milling and software designing. Compared to the previous in vitro studies, other factors that influence the marginal adaptation of the interim crown include the finishing margin of the crown after the curing process, force applied to facilitate during the cementation, and repeated measurements using a microscope [
2]. As stated by Amin et al. (2015), the increased application of cement increases the risk of a marginal gap. Hence, in the present study, we did not employ cement in order to eliminate the influence of cement [
2]. Nevertheless, the outcome of the study cannot be directly compared with previous findings because of the difference in sample size and the fabrication techniques employed. It is reported that a minimum marginal discrepancy for interim restoration is between 50 and 120 μm [
3]. In contrast, in the present study, the mean value for the three fabrication techniques ranged from 200 to 300 μm, with a minimum value of approximately 180 μm. A study by Al-Rifaiy (2017) showed that the high discrepancy was mainly due to the difference in tooth surface preparation, with an average difference of 120 μm [
3]. Thus, it was concluded that material and fabrication techniques play an important role in influencing marginal misfit. Nevertheless, despite the effort, over time, the interim crown tends to wear off, leading to marginal misfits.
Furthermore, in the present study, micro CT was employed to assess marginal integrity and internal adaptation. This is a noninvasive and reliable method to establish a nominal marginal gap. The technique produces a high-resolution product without disturbing the integrity of the restoration; its fabrication is uncomplicated, and no sample preparation, as a replica technique with assembly is being sectioned, is required [
4,
19]. In addition, this is the only method to reconstruct a master model die and its suprastructure three-dimensionally [
20]. The technique is integrated with a system that slices the specimen to overview each slice for a uniform understanding of fitting and marginal gap presences [
5]. Regardless, studies showed that no significant difference was found between the two techniques—micro CT and replica technique—in assessing the marginal misfit [
4,
5]. Nonetheless, few authors have pointed out a lesser risk of errors compared to the replica technique [
6,
7].
The material type used also plays an important role in producing a better marginal fit and enhances surface properties [
8]. In the present study, we used dimethacrylates in 3D printing, PMMA blocks in the CAD-CAM technique, and powder liquid PMMA resins in the conventional technique. According to Zandparsa (2009), polyfunctional methacrylates, multifunctional methacrylates, and PMMA resins produce optimum marginal fit and better surface property because difunctional monomers permit the additional attachment of excess monomers that lead to a better mechanical property [
9]. For conventional techniques, studies have reported that it is necessary to allow the resin-based material (PMMA) to properly mix under the standard powder and liquid ratio until a consistent mixture is reached and allowed to set on the prepared tooth [
8,
9]. The discrepancy is associated with the polymerization shrinkage of PMMA loose material compared to a condensed block of PMMA, which reduces the problem of shrinkage as these milled blocks are pre polymerized and dense [
8,
9,
21]. For a better fit, the authors emphasized removing the crown at a suggested duration to limit the distortion of the interim restoration. Lee and Lee (2015), on the other hand, showed that the composite material used is far more superior to the auto polymerizing PMMA because of low polymerizing shrinkage capability and no exothermic reaction [
10,
11]. Hence, following up with the previous study findings, 3D printing produced better outcomes comparable to the conventional technique but similar to CAD-CAM.
Certain studies have pointed out that the length, width, and thickness of the samples are equally important for accurate fitting restoration [
10,
11]. Tahayeri et al. (2018) observed that the average error noted in length was lower when the machine settings of 3D printers were at white and flex resins [
13]. The outcome of the white resin setting showed a significantly lower error compared to the castable resin setting group. Furthermore, the width of the restoration showed a significant impact in resin settings, where the correct settings offered a lower error than all other groups except the flex resin, which proved a lower error in marginal accuracy [
13].
The surface roughness of a restoration alters under the influence of multiple factors, which include the fabrication technique, oral conditions, opposite dentition load, diet, material composition, and polishing techniques [
12]. In the present study, the surface roughness was assessed based on the fabrication technique—CAD-CAM, 3D printing, and the conventional technique. The highest surface roughness was observed in 3D printing, with a similar outcome to the conventional technique. Nevertheless, the least surface roughness was observed using a CAD-CAM technique. This indicated that CAD-CAM produced a better milled interim crown, favorable for use in the long term.
Haselton et al. (2004), in contrast to the present study, emphasized the effect of oral conditions on the restoration surface [
14]. The author replicated storage conditions to identify the impact of saliva on the restoration. He pointed out that changes in the pH (acidic to alkaline) contribute mainly to surface changes of the restoration, especially interim crowns. In addition, literature has shown that upon exposure to a moist environment, the degree of surface roughness increases [
15,
16]. This signifies that if the produced interim restoration has surface defects, then the risk for surface roughness greatly increases upon exposure to oral conditions. Hence, a better selection of fabrication is important to reduce the risk of surface change over time under the influence of an altered oral environment.
The present study revealed a significant difference in surface property, irrespective of the oral conditions present. This suggested that the difference in material composition acted as a major factor for affecting surface smoothness [
22,
23]. Methacrylate material was shown to produce a smoother surface due to its composition compared to bisacrylates. These materials are composed of smaller filler, which influences the polishability of the material to produce a smooth surface [
8]. Hence, using methacrylates for interim restoration is a safer option because these materials do not contain filler particles, which do not correlate with surface smoothness. In addition, these materials respond better to the polishing techniques, resulting in homogenous and void-free surfaces [
10].
Furthermore, the difference in the process of each technique greatly influenced the surface roughness of the restoration. Conventionally, hand mixing involves human error and lack of precision due to defects in the model impression [
8,
24]. This causes uneven and increased surface roughness. In contrast, using a milling machine and 3D printer enhances the output because of the accuracy and precision of the software [
25,
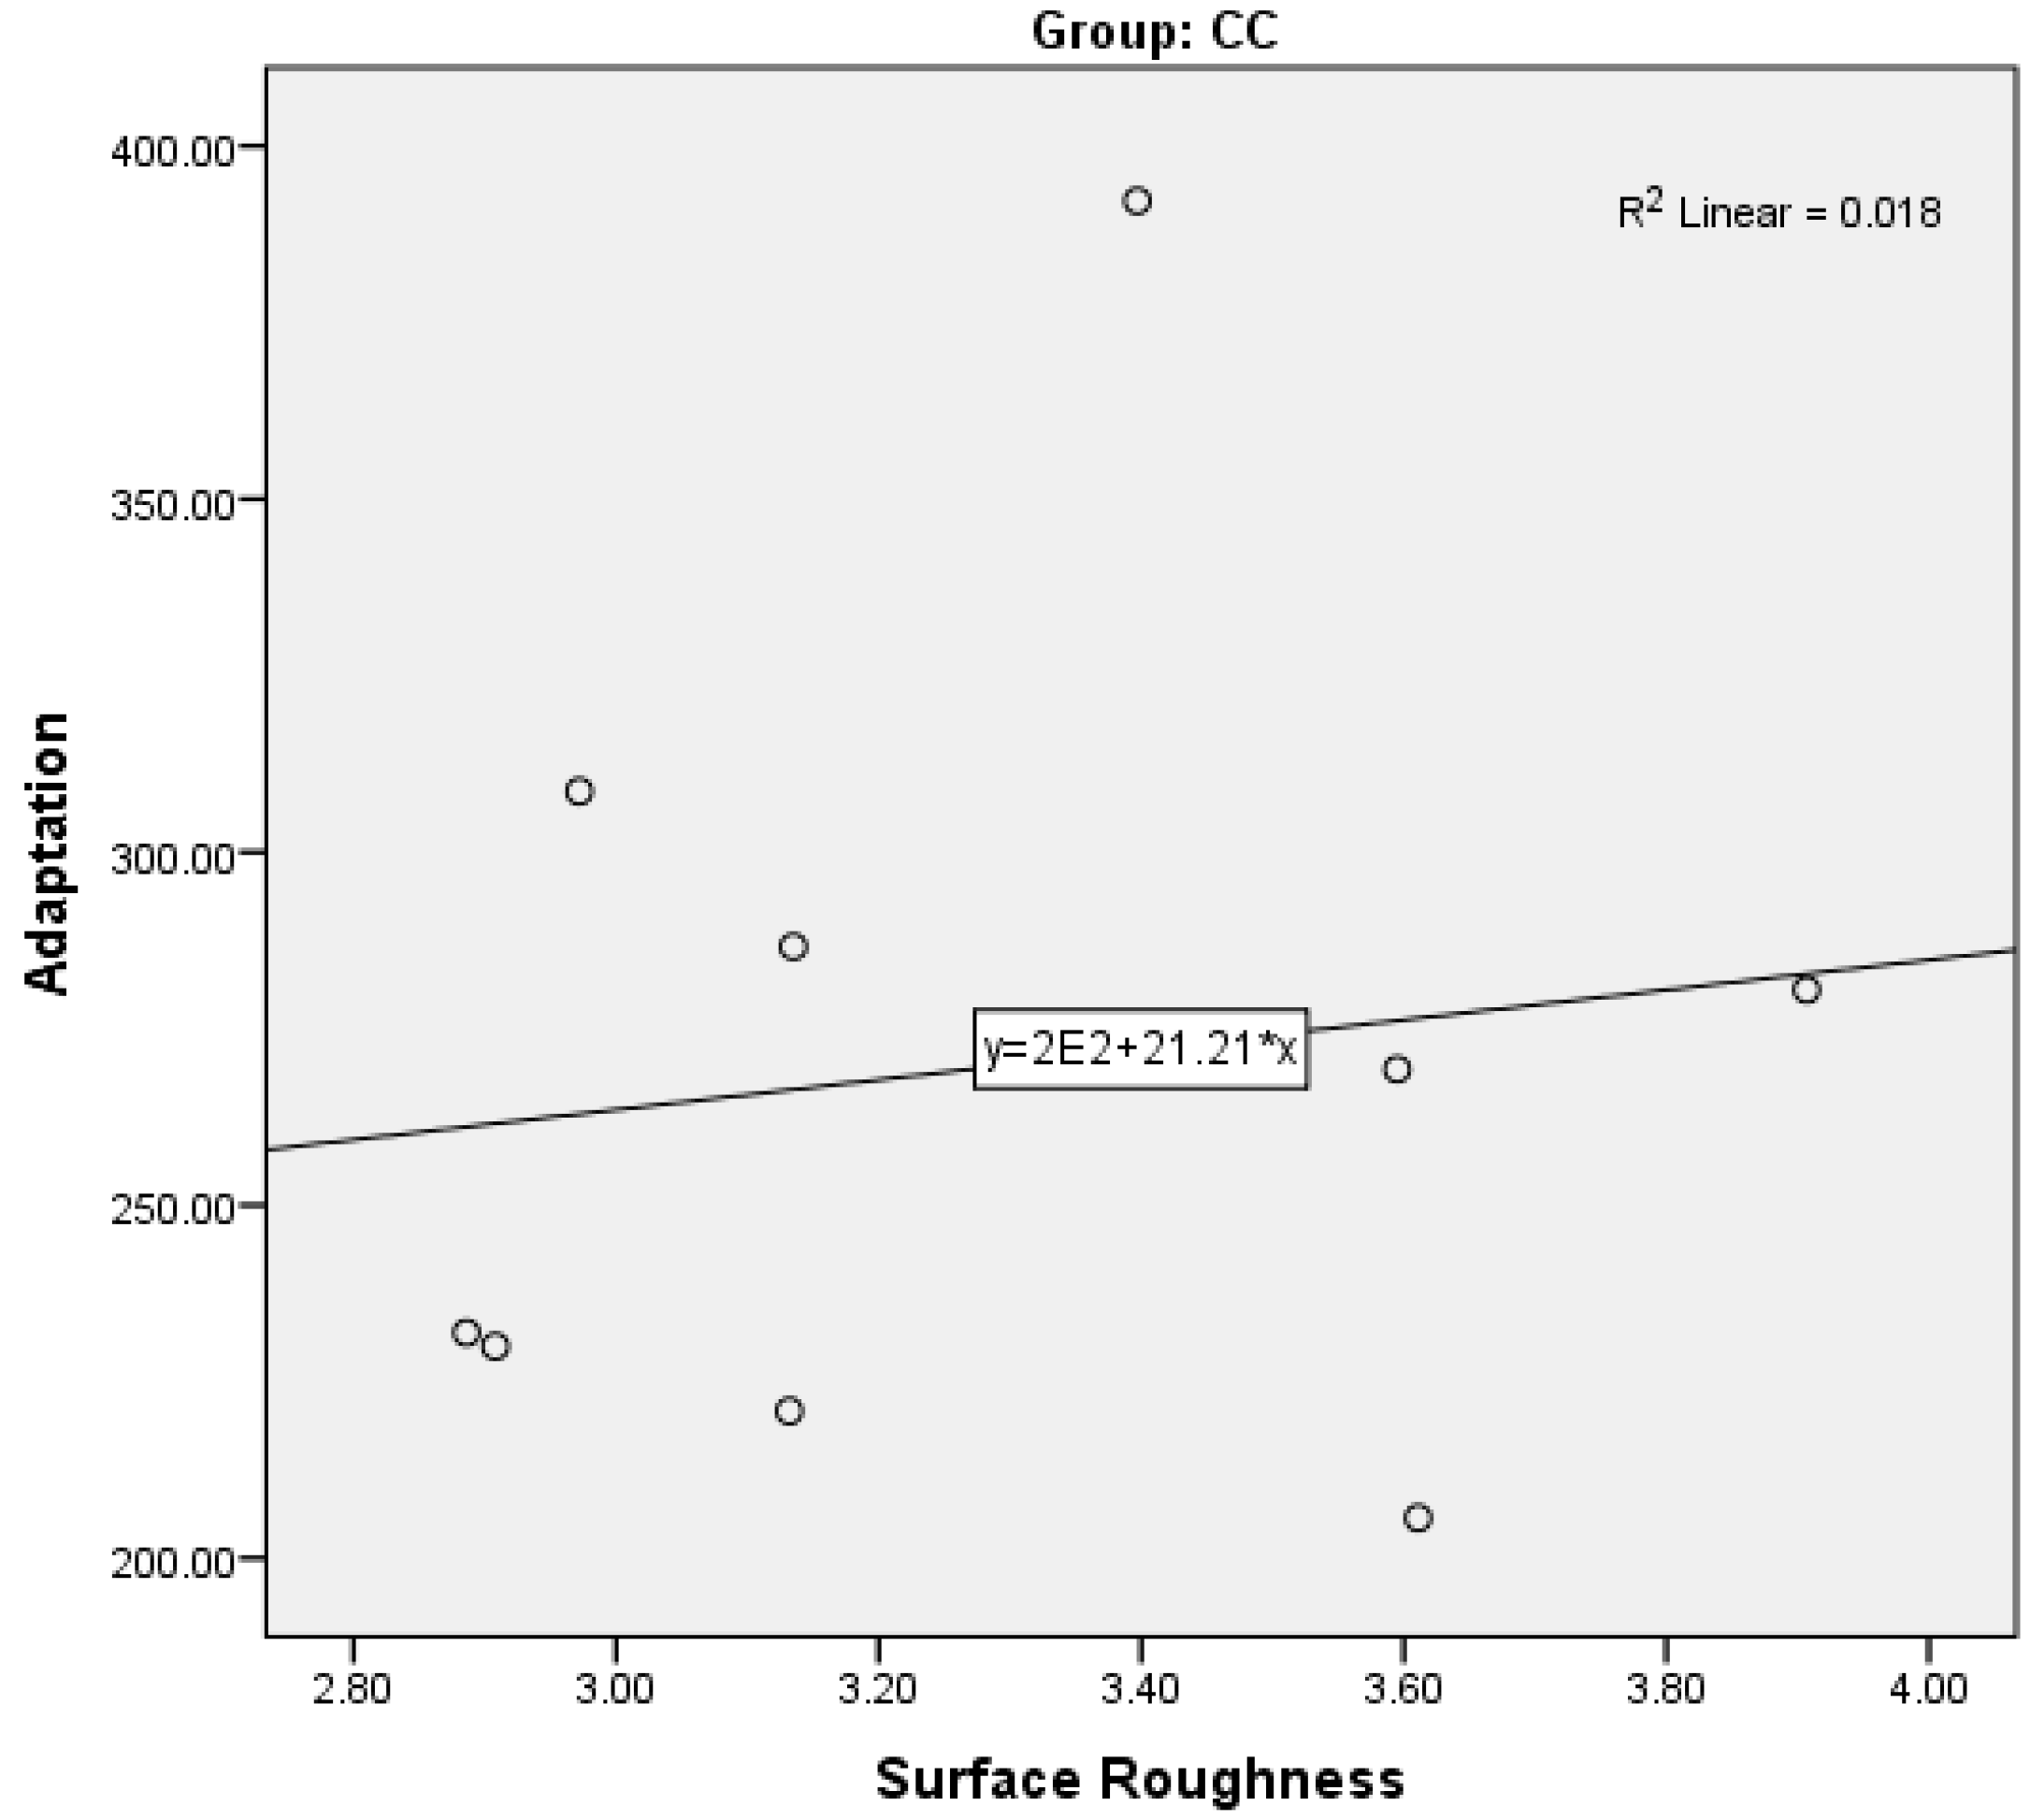
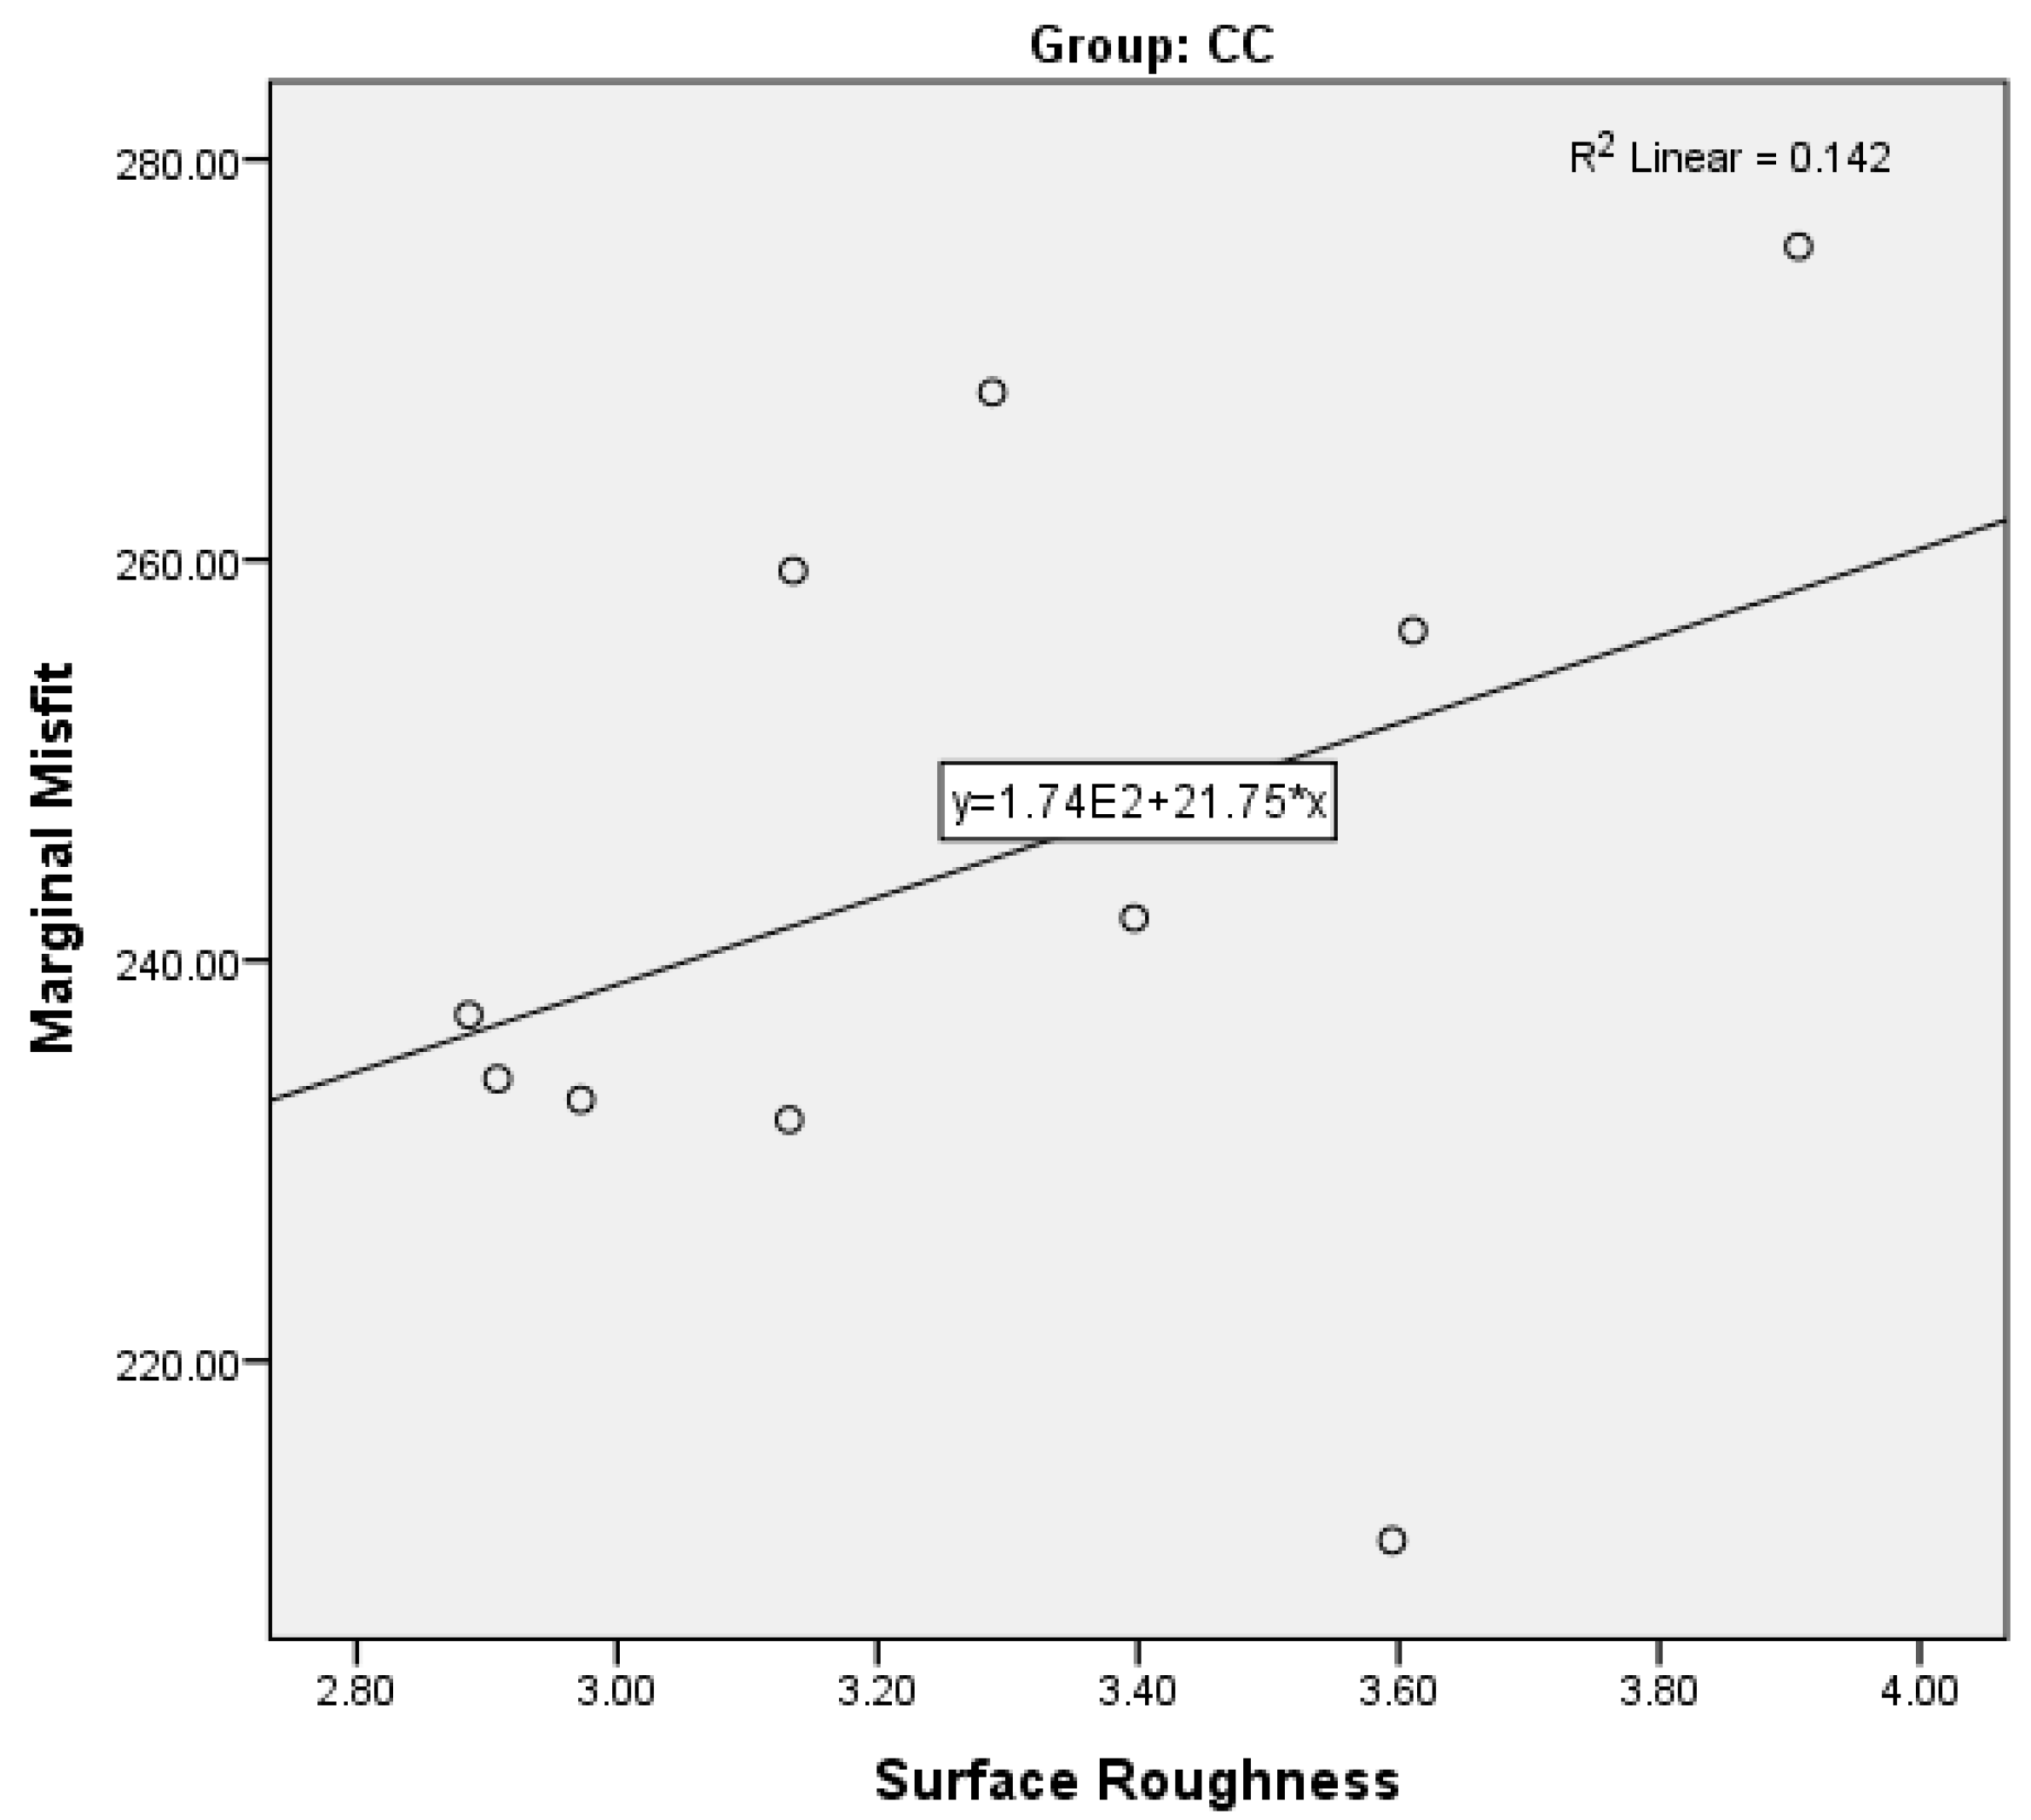
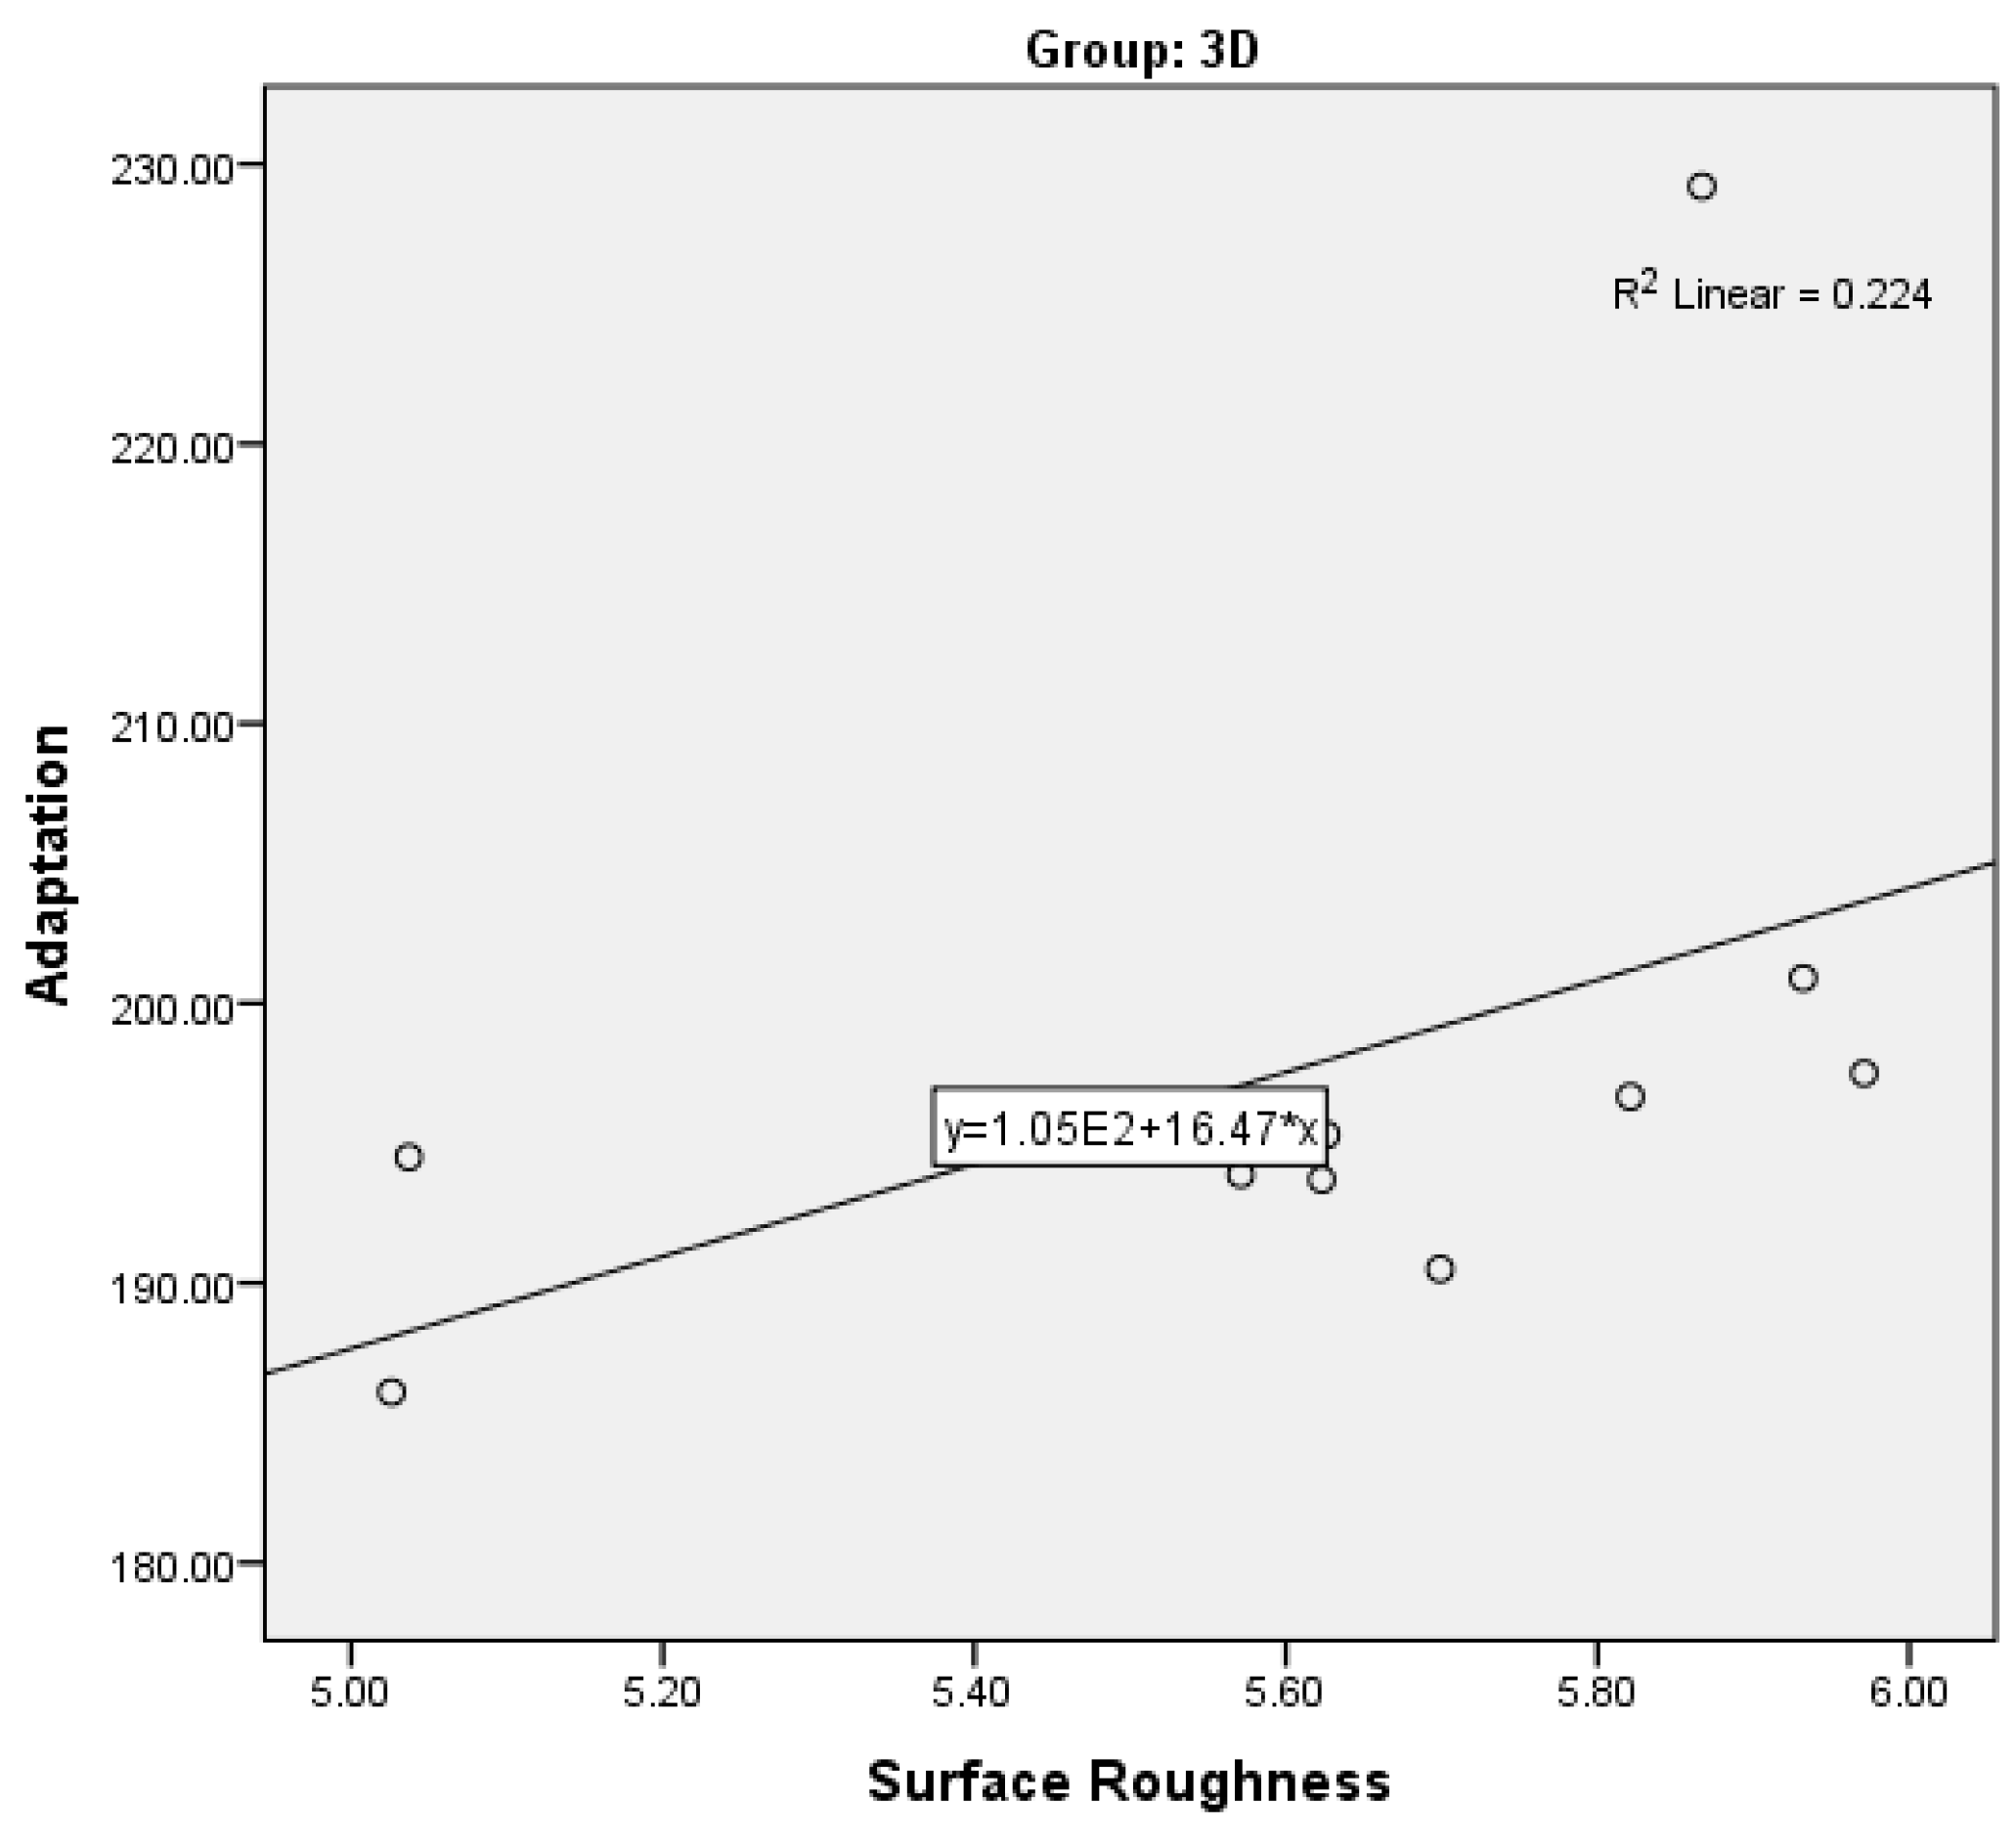
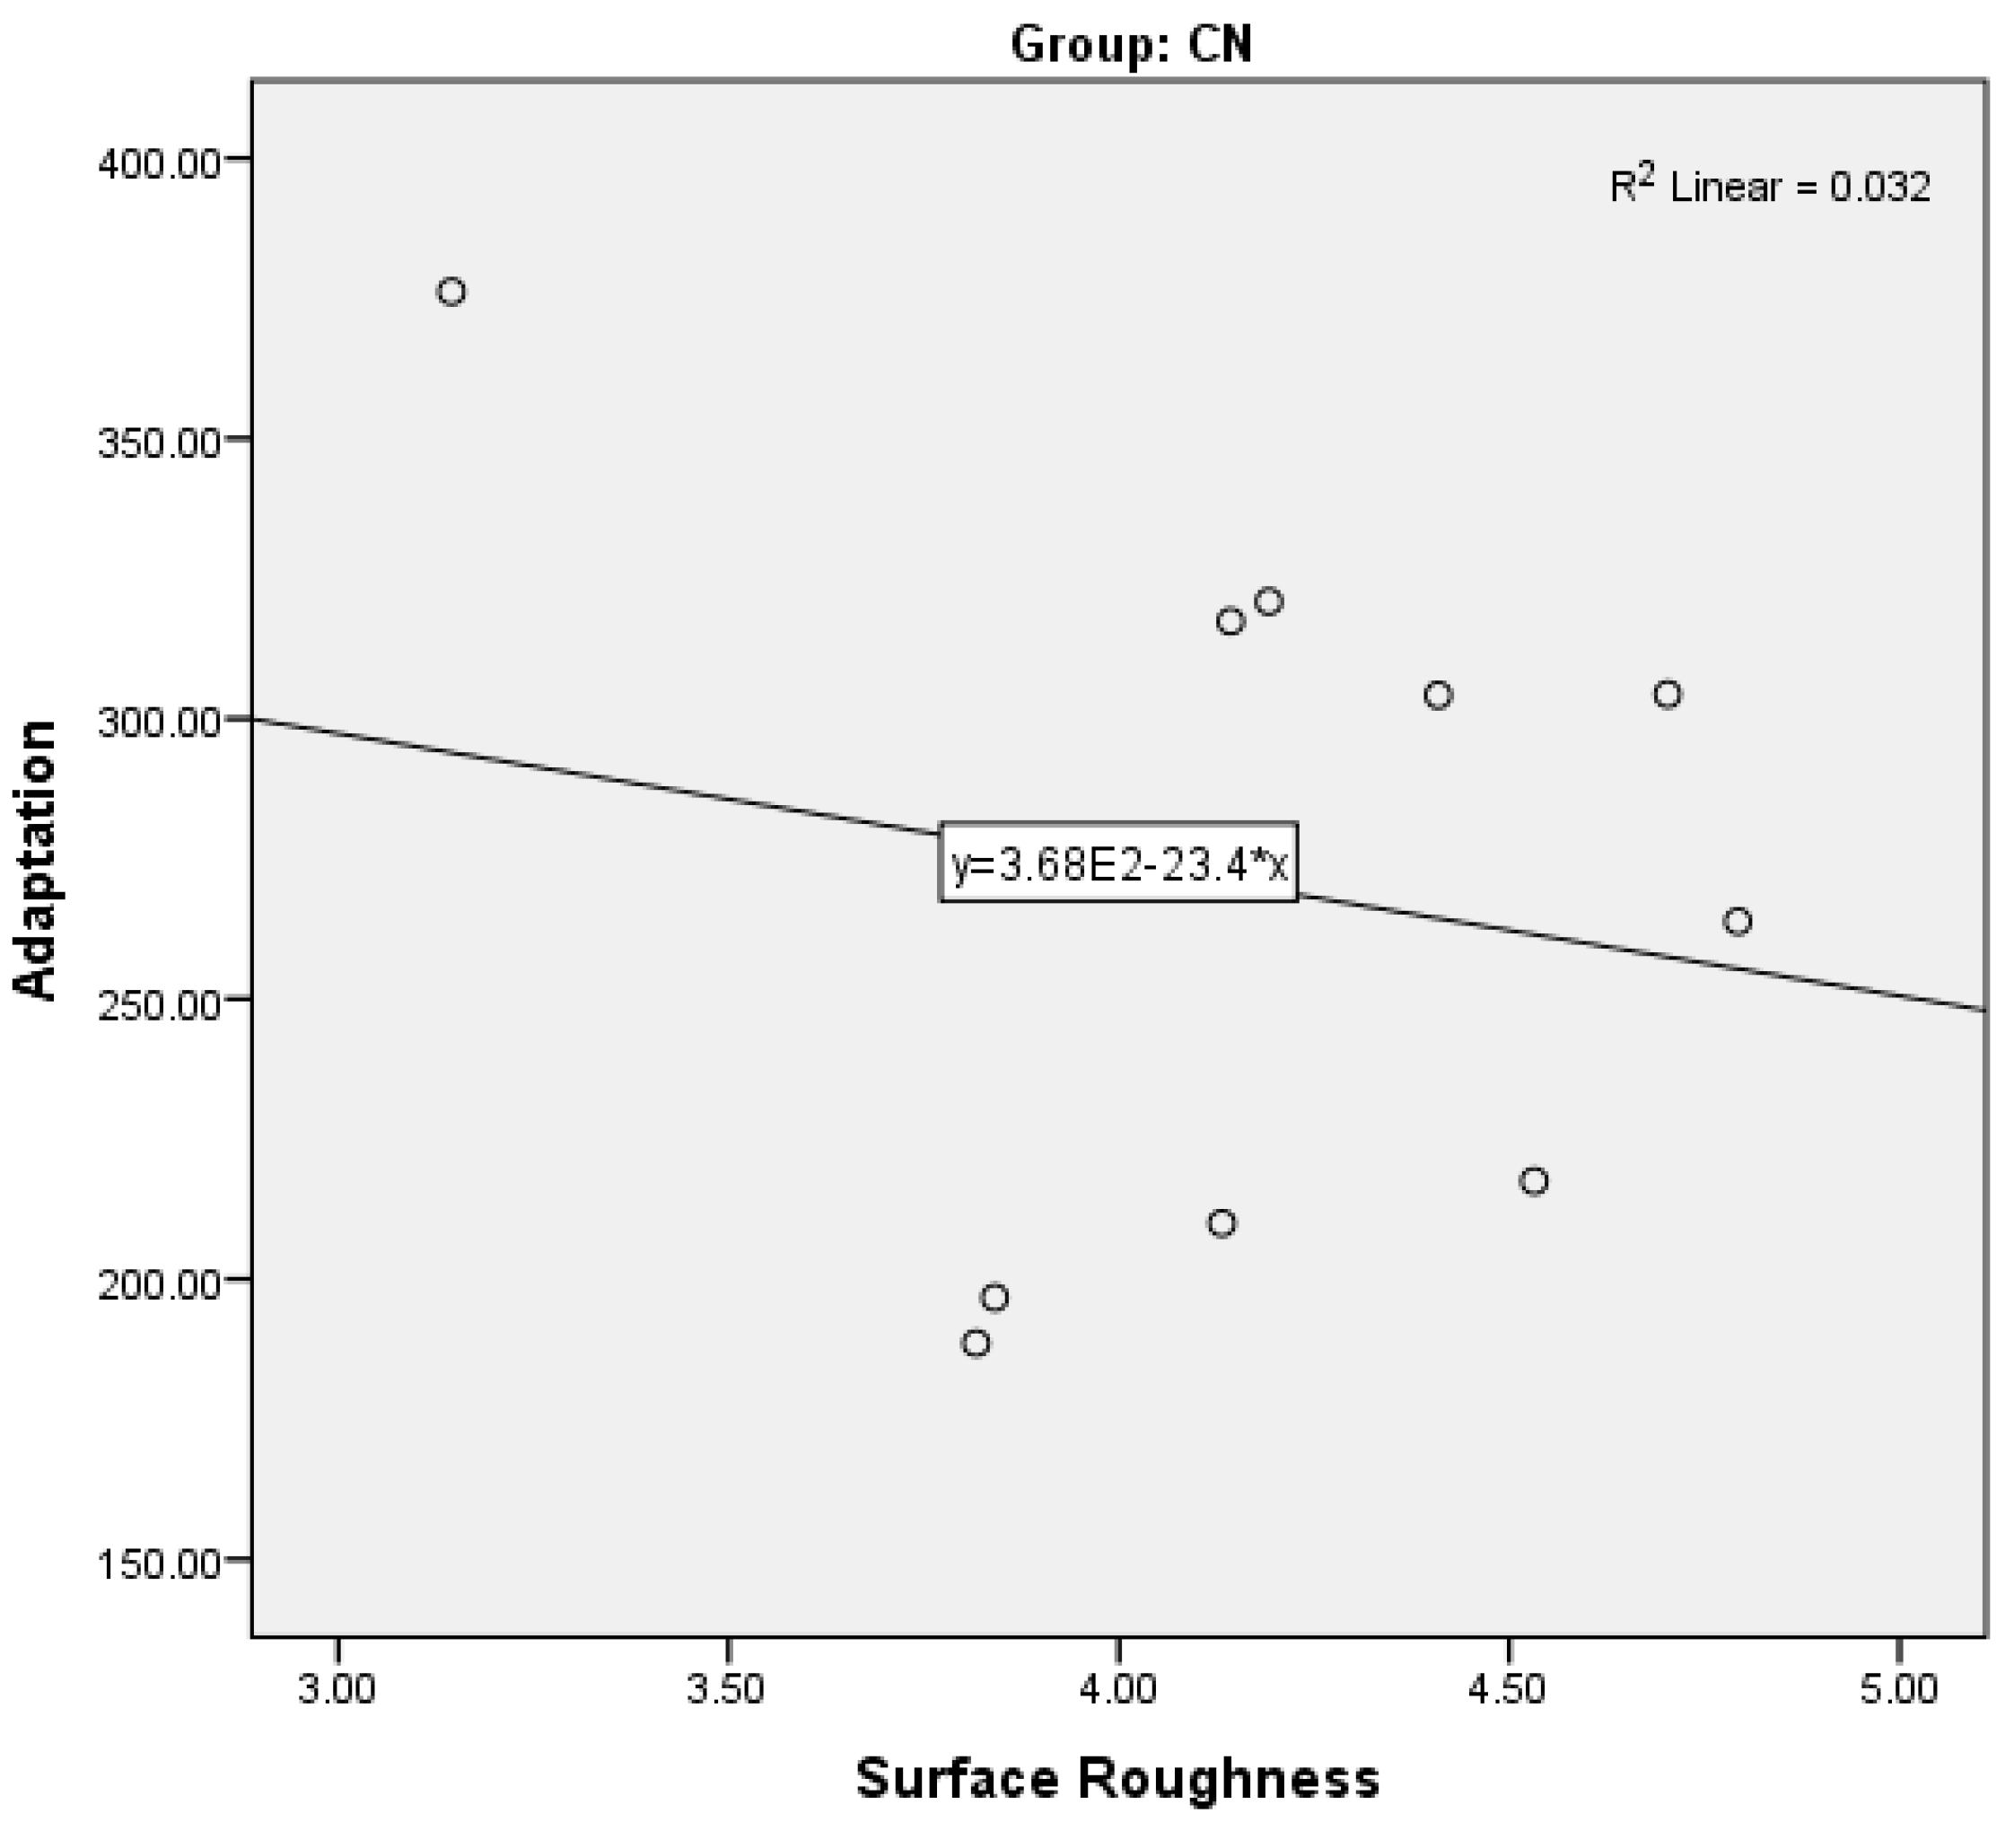
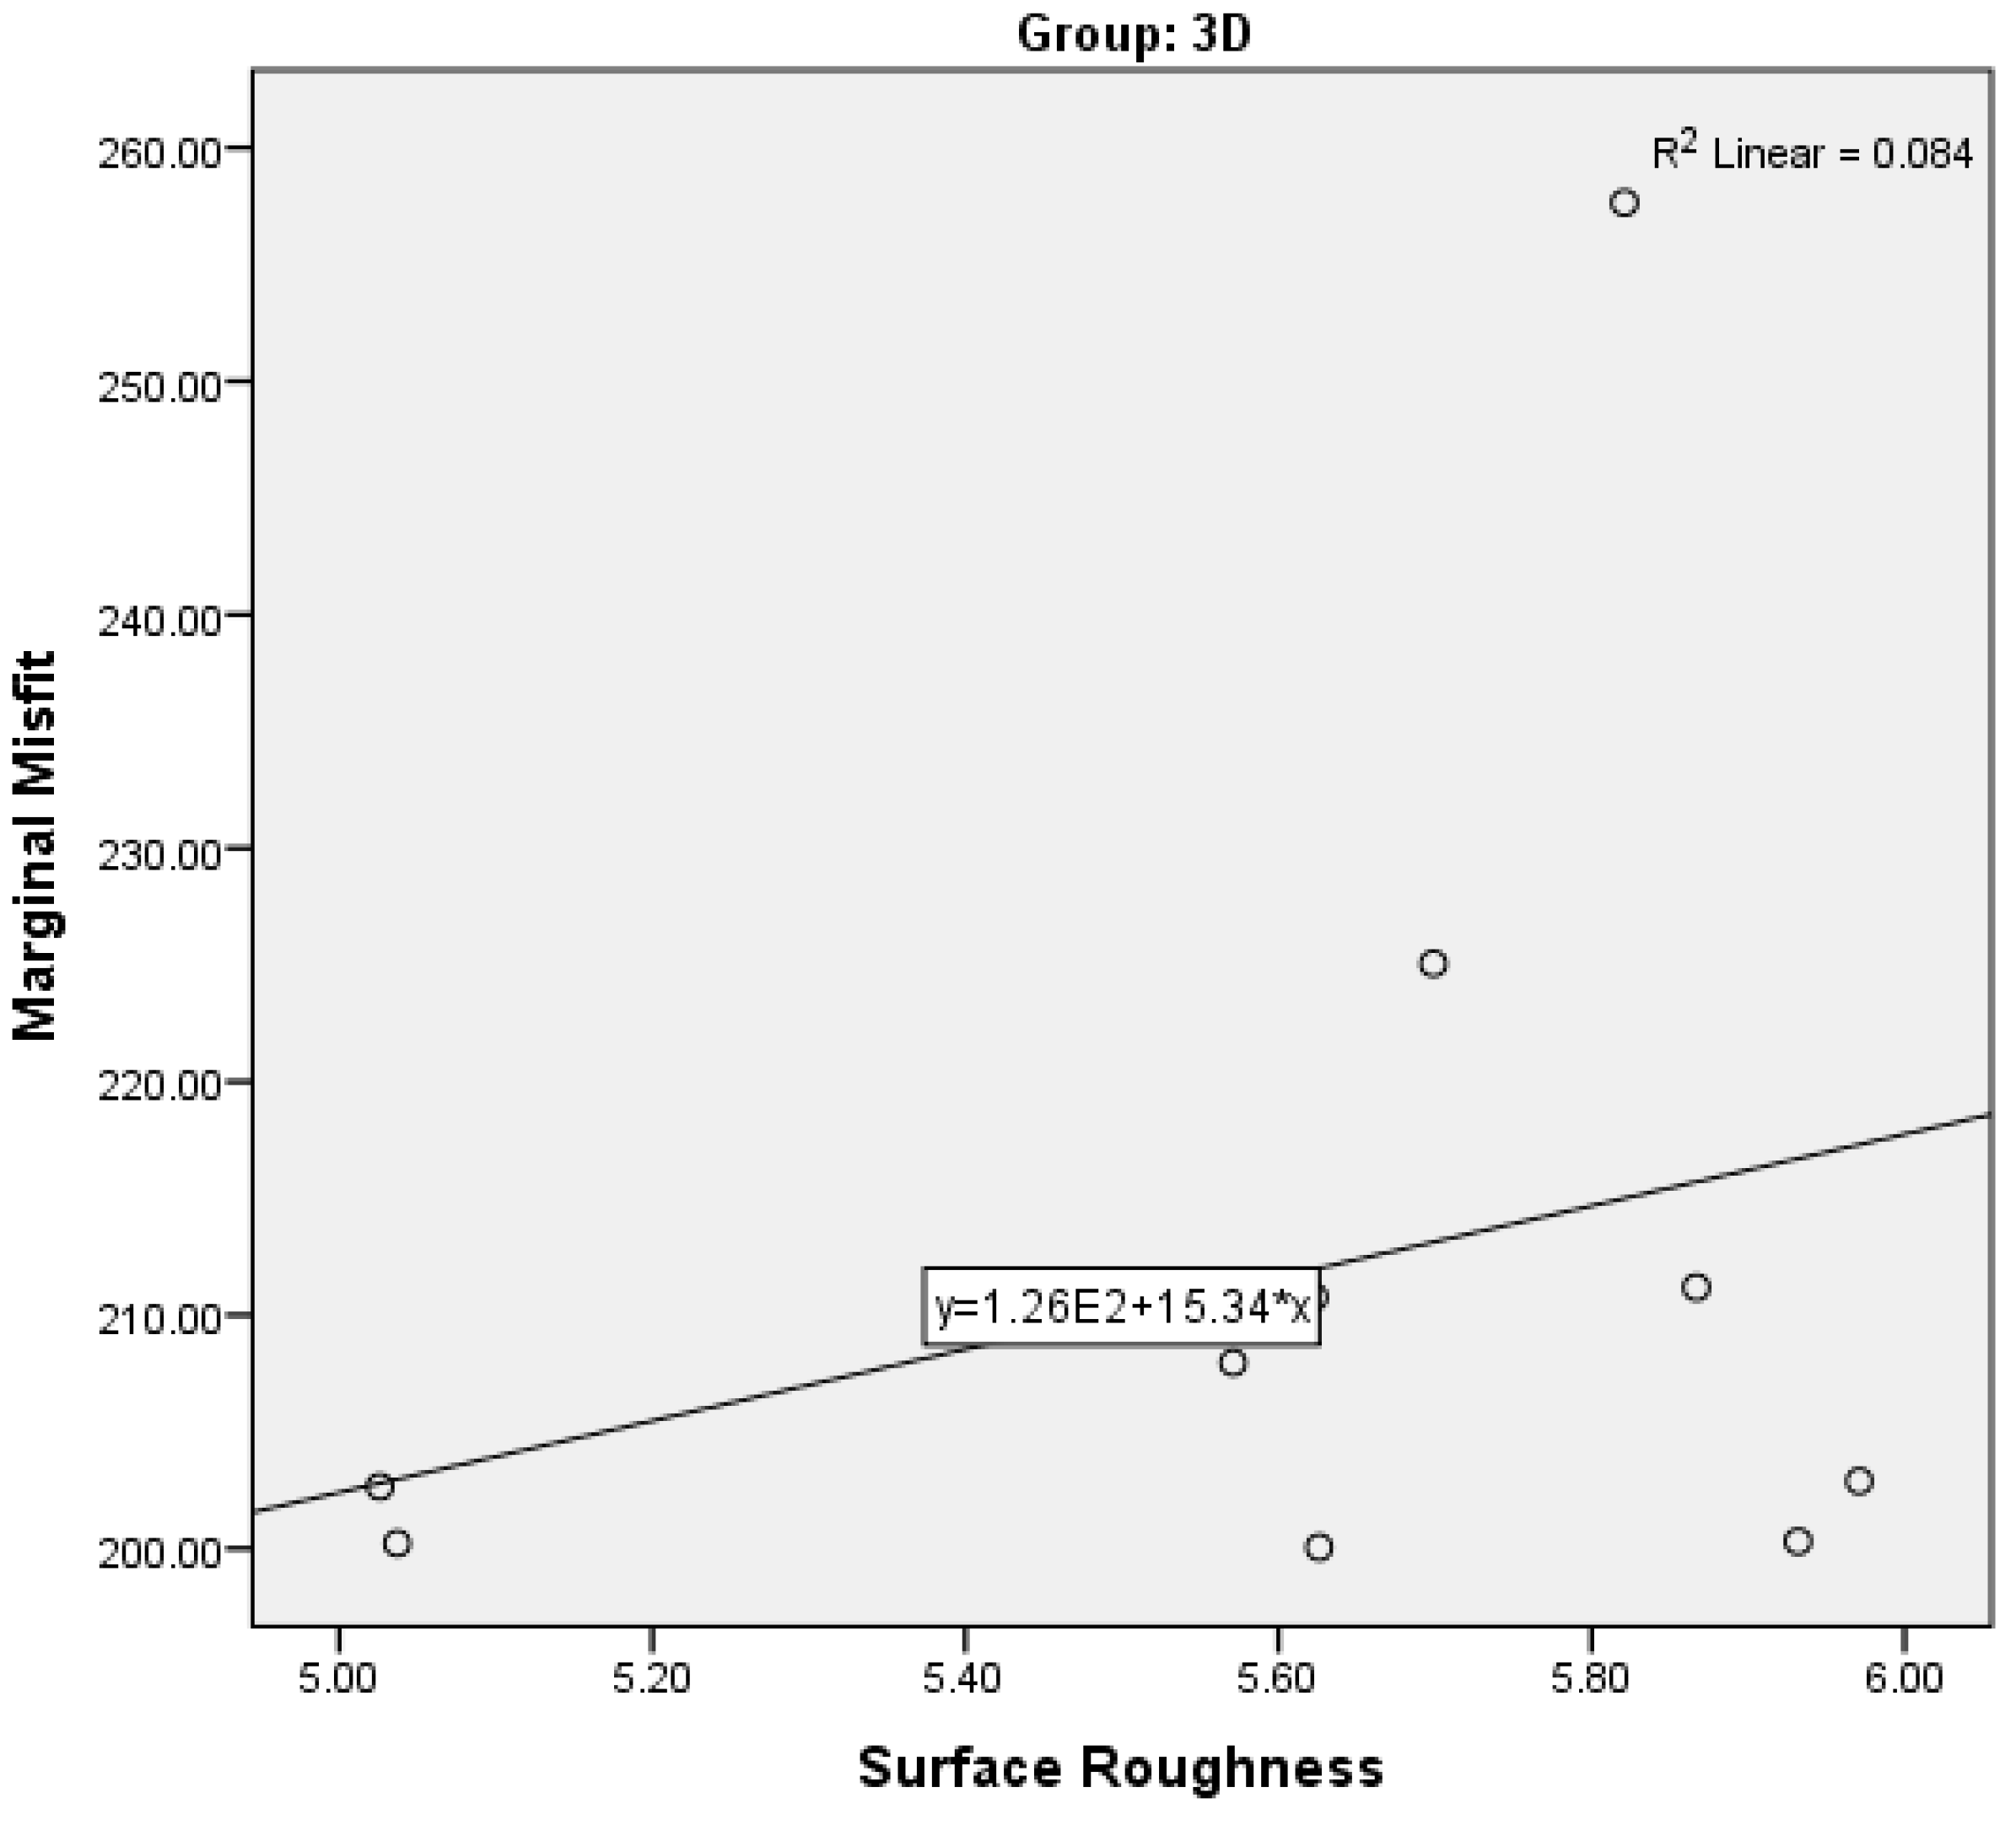
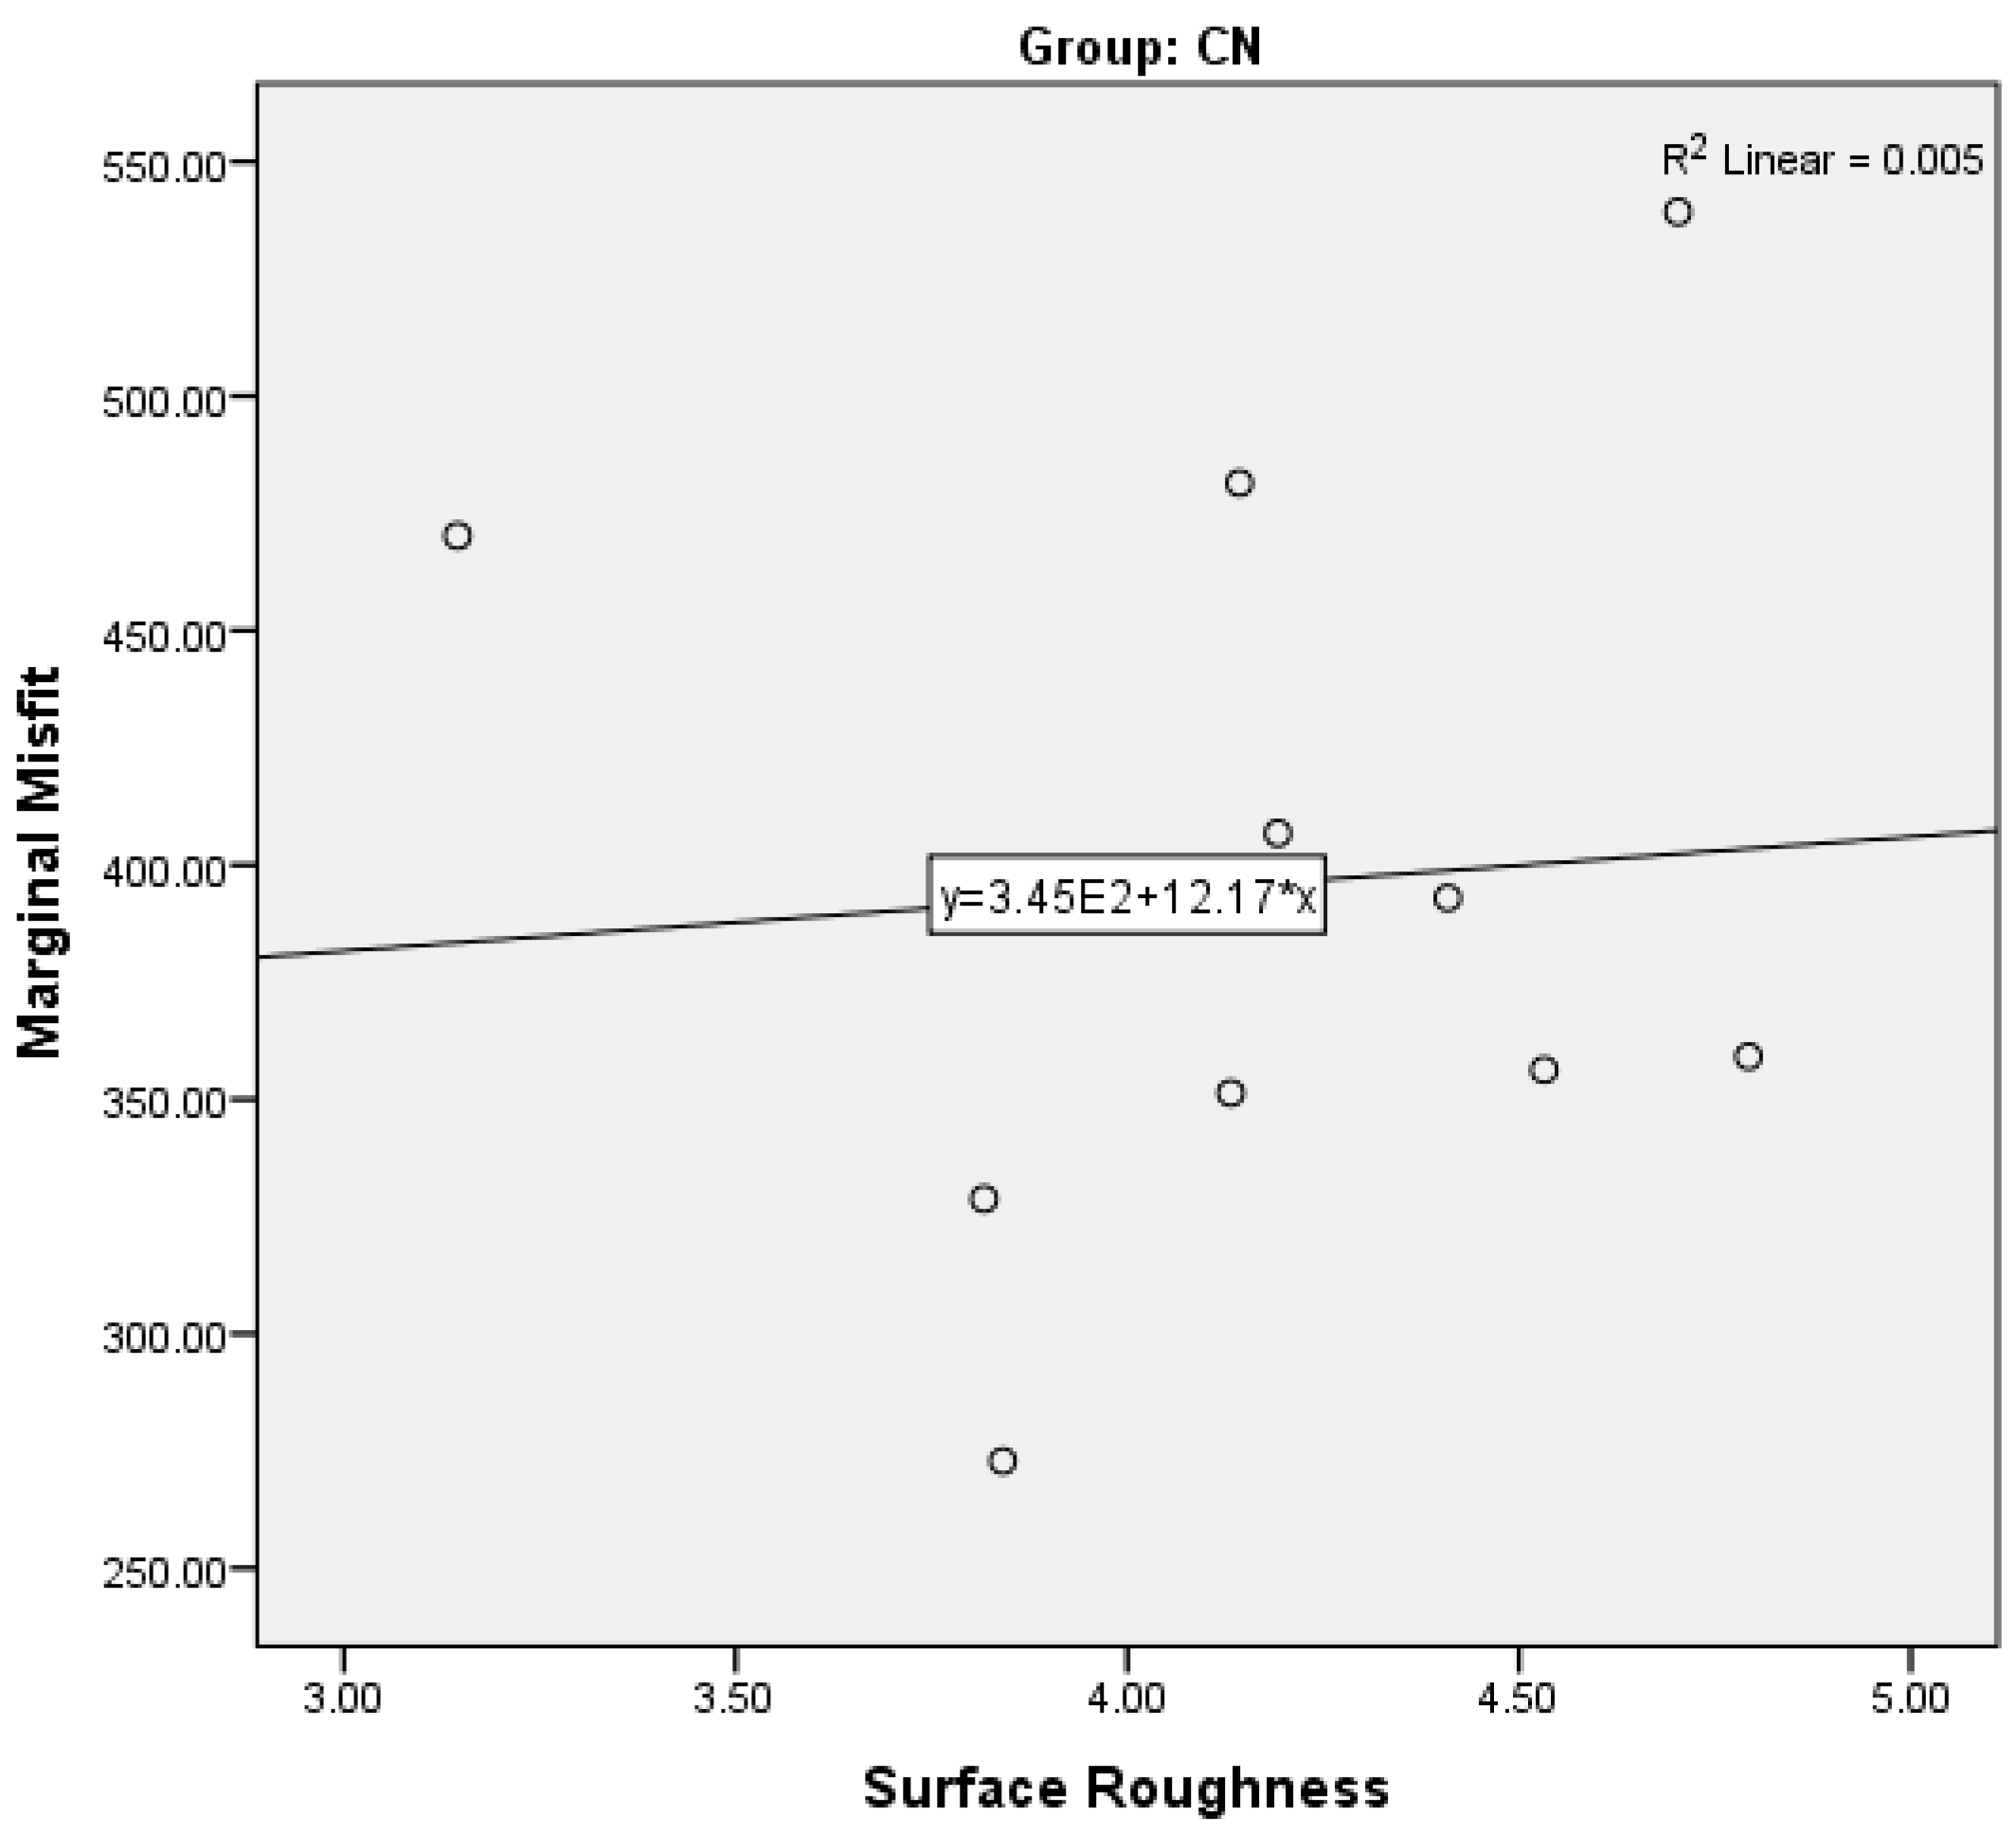
26]. However, the present study showed a comparable outcome for the conventional and 3D-printed specimens, while CAD-CAM presented with the least surface roughness. Tahayeri et al. (2018) showed that using the layering technique in 3D printing leads to defects in the surface as the 3D printer only uses one bar at a time (as several bars do not adhere during the process), which leaves laminated lines and lower reproducibility, thus indicating the technique to process plays an important role in the smoothness of the surface rather than the material used. Moreover, a positive correlation was observed in the present study between adaptation and surface roughness except through the conventional method and marginal misfit.
According to Tahayeri et al. (2018), the accuracy of a 3D printer depends upon proper printing orientation [
13]. The distance, maintained at 25 mm, was identified to reduce the risk of error in the perfect dimensions of the restoration. The outcomes of Tahayeri et al.’s (2018) study suggested that orientation at 90° had the lowest percent error, followed by those printed at 0°, 15°, and 45° (
p < 0.05) [
13]. Hence, a higher change in dimension at 0-degree orientation significantly decreased with a change in the 15°, 45°, and 90° orientation groups accordingly. In contrast, a study by Jasim et al. (2019) showed that the orientation has a positive effect on the final performance of the restoration because of its anisotropic nature [
27]. He assumed that the same layer produces more adhesion compared to different layers; however, other studies have opposed the idea with the theory of suggestive polymerization [
27]. Hence, maximum polymerization at a 90-degree orientation improves the mechanical strength far more than a 0-degree orientation.
In the oral cavity, the process of material setting and hardness value varies under the influence of multiple factors, including mechanical, thermal, and chemical reactions [
28]. Many authors have reported that opposite dentition load, surrounding medium, and material composition play a vital role in the surface wear of the restoration [
28,
29]. In the present study, before the cyclic loading, the highest surface roughness was observed in the conventional technique, followed by CAD-CAM and 3D printing techniques. After performing the cyclic loading, a greater amount of wear was apparent in the conventional and CAD-CAM techniques, whereas the 3D-printed specimens showed no significant changes in surface wear. This indicates the superior efficacy of the fabrication technique in producing a smooth and fine surface for the interim restoration.
Moreover, some authors believed that material composition was the main variable affecting the quality of surface wear rather than technique [
14,
30]. Savabi et al. demonstrated that toothbrush abrasion was more apparent in methyl methacrylate restorations rather than bisacryl restorations [
16]. However, the presence of a glycoprotein layer over the restorations prevented the tooth abrasion action and preserved the surface texture [
30]. It is suggested that the properties of resin material are greatly influenced by the degree of polymerization and the concentration of cross-linking agents [
31,
32]. Thus, more conversion of the monomers and cross-linking can enhance material strength and improve wear resistance, especially under oral conditions.
From the present study, it is evident that bis acryl (3D printing) demonstrates better surface resistance compared to conventional methacrylate materials (conventional and CAD-CAM blocks). According to Lee et al., bisacryl has a multifunctional monomer, bisphenol A-glycidyl methacrylate (Bis-GMA) or triethylene glycol dimethacrylate (TEGDEMA), which enables better cross-linking among the monomers [
10]. Nevertheless, despite the wide use of methacrylate resins, the materials show inferior properties due to low molecular weight monofunctional monomers, with linear molecules that decrease strength and rigidity [
33,
34,
35,
36]. Thus, a modified version of methacrylate materials that demonstrates improved cross-linking and surface resistance of the interim crown is employed, such as in CAD-CAM.
Studies have shown that thermocycling, performed for 10,000 cycles, simulates the restoration state under one year of clinical use. The effect of thermocycling is equivalent to the simulated clinical environment, which influences the surface property. However, one of the limitations of the study was that the evaluation of the restoration was not performed under any artificial environment or thermocycled to compare the impact of the techniques over a long period of use. In addition, in the present study, dies were trimmed to uniform dimensions. Trimming a die into a conical shape with a mechanical device demonstrates less realistic production compared to clinical settings as natural teeth are not uniform and conical; rather, they have an irregular surface. Moreover, the inherent inaccuracy and repeatability of the scanner used and the tolerance of both the CAD-CAM instrumentation and the 3D printer can introduce errors, resulting in compromised restorative outcomes. Lastly, polishing was not performed on specimens, as the study was meant to assess the influence of fabrication techniques on the surface properties of interim restorations. Therefore, further studies with closer simulations of the oral environment and different preparation designs are warranted to assess its influence on the fit, adaptation, and surface properties of interim restorations.


