
Radiobiological Outcomes, Microdosimetric Evaluations and Monte Carlo Predictions in Eye Proton Therapy

 ,
,  , , ,
, , ,  ,
,  , ,
, ,  , ,
, ,  ,
,  , , , ,
  and
and
Abstract
:1. Introduction
2. Material and Methods
2.1. CATANA Proton Therapy Facility
2.2. Experimental Set-Up
2.3. Cell Culture and Clonogenic Assay
2.4. Micorodosimetric Spectra
2.5. Monte Carlo Simulations and LEM II Calculations
3. Results and Discussion
4. Conclusions and Perspectives
Author Contributions
Funding
Institutional Review Board Statement
Informed Consent Statement
Data Availability Statement
Conflicts of Interest
References
- Liu, H.; Chang, J.Y. Proton therapy in clinical practice. Chin. J. Cancer 2011, 30, 315–326. [Google Scholar] [CrossRef] [PubMed]
- Lühr, A.; von Neubeck, C.; Krause, M.; Troost, E.G.C. Relative biological effectiveness in proton beam therapy - Current knowledge and future challenges. Clin. Transl. Radiat. Oncol. 2018, 9, 35–41. [Google Scholar] [CrossRef] [Green Version]
- Underwood, T.S.; McMahon, S.J. Proton relative biological effectiveness (RBE): A multiscale problem. Br. J. Radiol. 2019, 92, 20180004. [Google Scholar] [CrossRef] [PubMed] [Green Version]
- Giovannini, G.; Böhlen, T.; Cabal, G.; Bauer, J.; Tessonnier, T.; Frey, K.; Debus, J.; Mairani, A.; Parodi, K. Variable RBE in proton therapy: Comparison of different model predictions and their influence on clinical-like scenarios. Radiat. Oncol. 2016, 11, 2718503. [Google Scholar] [CrossRef] [PubMed] [Green Version]
- Paganetti, H. Relating the proton relative biological effectiveness to tumor control and normal tissue complication probabilities assuming interpatient variability in α/β. Acta Oncol. 2017, 56, 1379–1386. [Google Scholar] [CrossRef] [PubMed]
- Chaudhary, P.; Marshall, T.; Manti, L.; Currell, F.J.; McMahon, S.J.; Kavanagh, J.N.; Cirrone, G.A.P.; Romano, F.; Prise, K.M.; Schettino, G. Relative Biological Effectiveness variation along monoenergetic and modulated Bragg peaks of a 62 MeV therapeutic proton beam: A pre-clinical assessment. Int. J. Radiat. Oncol. Biol. Phys. 2014, 90, 27–35. [Google Scholar] [CrossRef] [Green Version]
- Cuaron, J.J.; Chang, C.; Lovelock, M.; Higginson, D.S.; Mah, D.; Cahlon, O.; Powell, S. Exponential Increase in Relative Biological Effectiveness Along Distal Edge of a Proton Bragg Peak as Measured by Deoxyribonucleic Acid Double-Strand Breaks. Int. J. Radiat. Oncol. Biol. Phys. 2016, 95, 62–69. [Google Scholar] [CrossRef] [Green Version]
- Willers, H.; Allen, A.; Grosshans, D.; McMahon, S.J.; von Neubeck, C.; Wiese, C.; Vikram, B. Toward A variable RBE for proton beam therapy. Radiother. Oncol. 2018, 42 128, 68–75. [Google Scholar] [CrossRef]
- Vitti, E.T.; Parsons, J.L. The Radiobiological Effects of Proton Beam Therapy: Impact on DNA Damage and Repair. Cancers 2019, 11, 946. [Google Scholar] [CrossRef] [PubMed] [Green Version]
- Vanderwaeren, L.; Dok, R.; Verstrepen, K.; Nuyts, S. Clinical Progress in Proton Radiotherapy: Biological Unknowns. Cancers 2021, 13, 604. [Google Scholar] [CrossRef]
- Friedrich, T.; Scholz, U.; Elsässer, T.; Durante, M.; Scholz, M. Systematic analysis of RBE and related quantities using a database of cell survival experiments with ion beam irradiation. J. Radiat. Res. 2013, 54, 494–514. [Google Scholar] [CrossRef] [Green Version]
- Keshazare, S.; Masoudi, S.F.; Rasouli, F.S. Effects of defining realistic compositions of the ocular melanoma on proton therapy. J. Biomed. Phys. Eng. 2014, 4, 141–150. [Google Scholar] [PubMed]
- Verma, V.; Mehta, M.P. Clinical Outcomes of Proton Radiotherapy for Uveal Melanoma. Clin. Oncol. (R. Coll. Radiol.) 2016, 28, e17–e27. [Google Scholar] [CrossRef] [PubMed]
- Mishra, K.K.; Daftari, I.K. Proton therapy for the management of uveal melanoma and other ocular tumors. Chin. Clin. Oncol. 2016, 5, 50. [Google Scholar] [CrossRef] [PubMed]
- Spatola, C.; Liardo, R.L.E.; Milazzotto, R.; Raffaele, L.; Salamone, V.; Basile, A.; Foti, P.V.; Palmucci, S.; Cirrone, G.A.P.; Cuttone, G.; et al. Radiotherapy of Conjunctival Melanoma: Role and Challenges of Brachytherapy. Appl. Sci. 2020, 10, 9071. [Google Scholar] [CrossRef]
- Messineo, D.; Barile, G.; Morrone, S.; La Torre, G.; Turchetti, P.; Accetta, L.; Trovato Battagliola, E.; Agostinelli, E.; Pacella, F. Meta-analysis on the utility of radiotherapy for the treatment of Ocular Melanoma. Clin. Ther. 2020, 170, e89–e98. [Google Scholar]
- Courdi, A.; Brassart, N.; Hérault, J.; Chauvel, P. The depth-dependent radiation response of human melanoma cells exposed to 65 MeV protons. Br. J. Radiol. 1994, 67, 800–804. [Google Scholar] [CrossRef]
- Petrović, I.; Ristić-Fira, A.; Todorović, D.; Korićanac, L.; Valastro, L.; Cirrone, P.; Cuttone, G. Response of a radioresistant human melanoma cell line along the proton spread-out Bragg peak. Int. J. Radiat. Biol. 2010, 86, 742–751. [Google Scholar] [CrossRef]
- Petrović, I.M.; Ristić Fira, A.M.; Keta, O.D.; Petković, V.D.; Petringa, G.; Cirrone, P.; Cuttone, G. A radiobiological study of carbon ions of different linear energy transfer in resistant human malignant cell lines. Int. J. Radiat. Biol. 2020, 96, 1400–1412. [Google Scholar] [CrossRef]
- Jasińska-Konior, K.; Pochylczuk, K.; Czajka, E.; Michalik, M.; Romanowska-Dixon, B.; Swakoń, J.; Urbańska, K.; Elas, M. Proton beam irradiation inhibits the migration of melanoma cells. PLoS ONE 2017, 12, e0186002. [Google Scholar]
- Scholz, M.; Kellerer, A.M.; Kraft-Weyrather, W.; Kraft, G. Computation of cell survival in heavy ion beams for therapy. The model and its approximation. Radiat. Environ. Biophys. 1997, 36, 59–66. [Google Scholar] [CrossRef] [PubMed]
- Petringa, G.; Romano, F.; Manti, L.; Pandola, L.; Attili, A.; Cammarata, F.; Cuttone, G.; Forte, G.; Manganaro, L.; Pipek, J.; et al. Radiobiological quantities in proton-therapy: Estimation and validation using Geant4-based Monte Carlo simulations. Phys. Med. 2019, 58, 72–80. [Google Scholar] [CrossRef] [PubMed] [Green Version]
- Conte, V.; Agosteo, S.; Bianchi, A.; Bolst, D.; Bortot, D.; Catalano, R.; Cirrone, G.A.P.; Colautti, P.; Cuttone, G.; Guatelli, S.; et al. Microdosimetry of a therapeutic proton beam with a mini-TEPC and a MicroPlus-Bridge detector for RBE assessment. Phys. Med. Biol. 2020, 65, 245018. [Google Scholar] [CrossRef]
- De Nardo, L.; Cesari, V.; Donà, G.; Magrin, G.; Colautti, P.; Conte, V.; Tornielli, G. Mini-TEPCs for radiation therapy. Radiat. Prot. Dosim. 2004, 108, 345–352. [Google Scholar] [CrossRef] [PubMed]
- Conte, V.; Bianchi, A.; Selva, A.; Petringa, G.; Cirrone, G.A.P.; Parisi, A.; Vanhavere, F.; Colautti, P. Microdosimetry at the CATANA 62 MeV proton beam with a sealed miniaturized TEPC. Phys. Med. 2020, 64, 114–122. [Google Scholar] [CrossRef] [PubMed]
- Rosenfeld, A.B. Novel detectors for silicon based microdosimetry, their concepts and applications. Nucl. Instrum. Methods Phys. Res. Sect. Accel. Spectrometers Detect. Assoc. Equip. 2016, 809, 156–170. [Google Scholar] [CrossRef]
- Petringa, G.; Pandola, L.; Agosteo, S.; Catalano, R.; Colautti, P.; Conte, V.; Cuttone, G.; Fan, K.; Mei, Z.; Rosenfeld, A.B.; et al. Monte Carlo implementation of new algorithms for the averaged-dose and -track linear energy transfer evaluation in 62 MeV clinical proton beams. Phys. Med. Biol. 2020, 65, 235043. [Google Scholar] [CrossRef]
- Cirrone, G.A.; Cuttone, G.; Raffaele, L.; Salamone, V.; Avitabile, T.; Privitera, G.; Spatola, C.; Amico, A.G.; Larosa, G.; Leanza, R.; et al. Clinical and Research Activities at the CATANA Facility of INFN-LNS: From the Conventional Hadrontherapy to the Laser-Driven Approach. Front. Oncol. 2017, 7, 223. [Google Scholar] [CrossRef] [Green Version]
- Development of procedures for in vivo dosimetry in radiotherapy. In Technical Report Series n. 8; International Atomic Energy Agency: Wien, Austria, 2013.
- Bravatà, V.; Cammarata, F.P.; Minafra, L.; Pisciotta, P.; Scazzone, C.; Manti, L.; Savoca, G.; Petringa, G.; Cirrone, G.A.P.; Cuttone, G.; et al. Proton-irradiated breast cells: Molecular points of view. J. Radiat. Res. 2019, 60, 451–465. [Google Scholar] [CrossRef]
- Cammarata, F.P.; Torrisi, F.; Forte, G.I.; Minafra, L.; Bravatà, V.; Pisciotta, P.; Savoca, G.; Calvaruso, M.; Petringa, G.; Cirrone, G.A.P.; et al. Proton Therapy and Src Family Kinase Inhibitor Combined Treatments on U87 Human Glioblastoma Multiforme Cell Line. Int. J. Mol. Sci. 2019, 20, 4745. [Google Scholar] [CrossRef] [Green Version]
- Anfuso, C.D.; Longo, A.; Distefano, A.; Amorini, A.M.; Salmeri, M.; Zanghì, G.; Giallongo, C.; Giurdanella, G.; Lupo, G. Uveal Melanoma Cells Elicit Retinal Pericyte Phenotypical and Biochemical Changes in an in Vitro Model of Coculture. Int. J. Mol. Sci. 2020, 21, 5557. [Google Scholar] [CrossRef] [PubMed]
- Franken, N.; Rodermond, H.; Stap, J.; Haveman, J.; Bree, C. Clonogenic assay of cells in vitro. Nat. Protocols 2006, 1, 2315–2319. [Google Scholar] [CrossRef]
- Menzel, H.G. International Commission on Radiation Units and Measurements. J. Int. Comm. Radiat. Units Meas. 2014, 14, 1–2. [Google Scholar]
- Paganetti, H.; Olko, P.; Kobus, H.; Becker, R. Calculation of relative biological effectiveness for proton beams using biological weighting functions. Int. J. Radiat. Oncol. Biol. Phys. 1997, 37, 719–729. [Google Scholar] [CrossRef]
- Loncol, T.; Cosgrove, V.; Denis, J.M.; Gueulette, J.; Mazal, A.; Menzel, H.G.; Pihet, P.; Sabattier, R. Radiobiological Effectiveness of Radiation Beams with Broad LET Spectra: Microdosimetric Analysis Using Biological Weighting Functions. Radiat. Prot. Dosim. 1994, 52, 347–352. [Google Scholar] [CrossRef]
- Manganaro, L.; Russo, G.; Bourhaleb, F.; Fausti, F.; Giordanengo, S.; Monaco, V.; Sacchi, R.; Vignati, A.; Cirio, R.; Attili, A. Survival’: A simulation toolkit introducing a modular approach for radiobiological evaluations in ion beam therapy. Phys. Med. Biol. 2018, 63, 08NT01. [Google Scholar] [CrossRef] [PubMed] [Green Version]
- Cirrone, G.P.; Cuttone, G.; Guatelli, S.; Nigro, S.L.; Mascialino, B.; Pia, M.G.; Raffaele, L.; Russo, G.; Sabini, M.G. Implementation of a new Monte Carlo GEANT4 simulation tool for the development of a proton therapy beam line and verification of the related dose distributions. IEEE Trans. Nucl. Sci. 2005, 52, 1756–1758. [Google Scholar] [CrossRef]
- Cirrone, G.A.P.; Cuttone, G.; Mazzaglia, E.S.; Romano, F.; Sardina, D.; Agodi, C.; Attili, A.; Blancato, A.A.; De Napoli, M.; Di Rosa, F.; et al. Hadrontherapy: A 4-based tool for proton/ion-therapy studies. Prog. Nucl. Sci. Technol. 2011, 2, 207–212. [Google Scholar] [CrossRef]
- Allison, J.; Amako, K.; Apostolakis, J.; Arce, P.; Asai, M.; Aso, T.; Bagli, E.; Bagulya, A.; Banerjee, S.; Barrand, G.J.N.I.; et al. Recent Developments in Geant4. Nucl. Instrum. Methods 2016, 835, 186–225. [Google Scholar] [CrossRef]
- Allison, J.; Amako, K.; Apostolakis, J.E.A.; Araujo, H.A.A.H.; Dubois, P.A.; Asai, M.A.A.M.; Barrand, G.A.B.G.; Capra, R.A.C.R.; Chauvie, S.A.C.S.; Chytracek, R.A.C.R.; et al. Geant4 Developments and Applications. IEEE Trans. Nucl. Sci. 2006, 53, 270–278. [Google Scholar] [CrossRef] [Green Version]
- Calipel, A.; Lux, A.L.; Guérin, S.; Lefaix, J.L.; Laurent, C.; Bernaudin, M.; Mouriaux, F. Geant4 Developments and Applications. Investig. Ophthalmol. Vis. Sci. 2015, 56, 3085–3094. [Google Scholar] [CrossRef]
- McMahon, S.J. The linear quadratic model: Usage, interpretation and challenges. Phys. Med. Biol. 2019, 64, 01TR01. [Google Scholar] [CrossRef] [PubMed]
- Savoca, G.; Calvaruso, M.; Minafra, L.; Bravatà, V.; Cammarata, F.P.; Iacoviello, G.; Abbate, B.; Evangelista, G.; Spada, M.; Forte, G.I.; et al. Local Disease-Free Survival Rate (LSR) Application to Personalize Radiation Therapy Treatments in Breast Cancer Models. J. Pers. Med. 2020, 10, 177. [Google Scholar] [CrossRef] [PubMed]
- Williams, M.V.; Denekamp, J.; Fowler, J.F. A review of alpha/beta ratios for experimental tumors: Implications for clinical studies of altered fractionation. Int. J. Radiat. Oncol. Biol. Phys. 1985, 11, 87–96. [Google Scholar] [CrossRef]

| Irr. Type | (Gy) | (Gy) | Fit. Std. Err. | |||
|---|---|---|---|---|---|---|
| 92.1 | -rays | 0.20 ± 0.03 | 0.076 ± 0.004 | 2.68 | 0.02 | 1.4 |
| protons | 0.40 ± 0.02 | 0.095 ± 0.003 | 4.25 | 0.007 | ||
| ARPE19 | -rays | 0.34 ± 0.14 | 0.03 ± 0.02 | 11.33 | 0.02 | 1.2 |
| protons | 0.43 ± 0.01 | 0.041 ± 0.003 | 10.49 | 0.04 |
| Cell Type | -TEPC | -MicroPlus | TEPC | MicroPlus |
|---|---|---|---|---|
| 92.1 | 1.29 | 1.24 | 0.35 ± 0.03 | 0.31 ± 0.02 |
| ARPE19 | 1.29 | 1.24 | 0.45 ± 0.04 | 0.41 ± 0.04 |
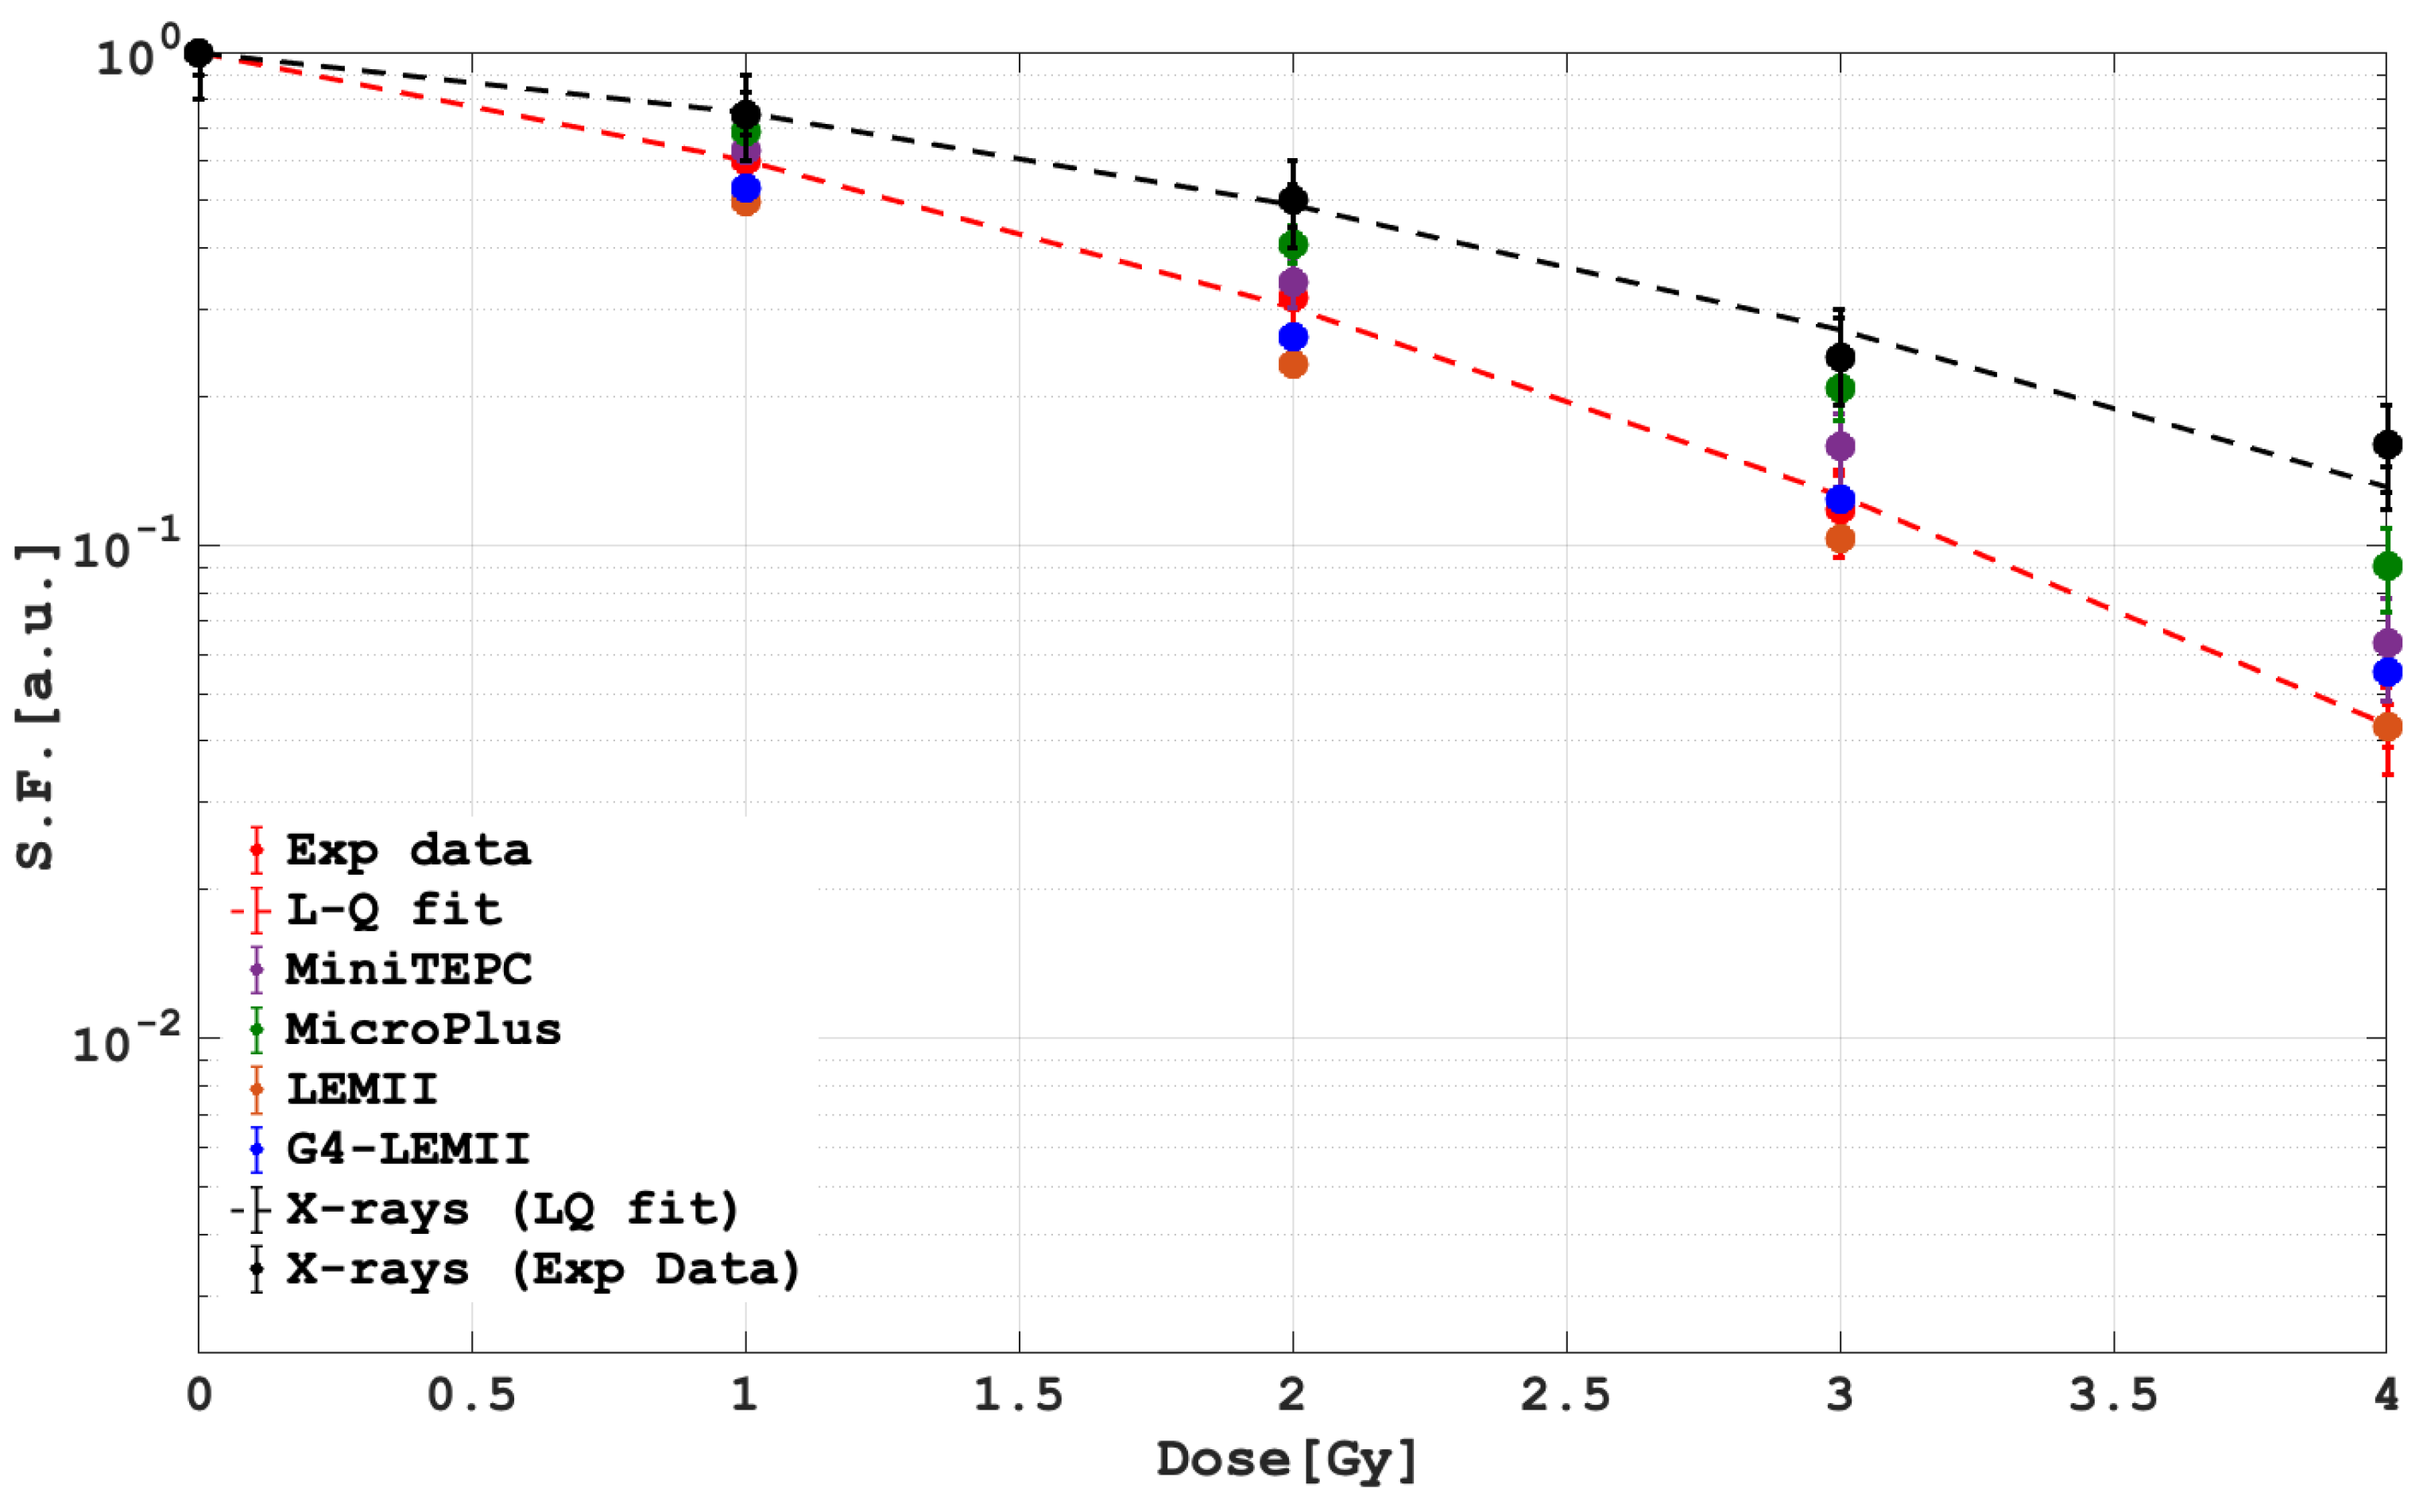
| Dose [Gy] | Exp Data | LEMII | G4-LEMII | mini-TEPC | MicroPlus |
|---|---|---|---|---|---|
| 1 | 0.606 ± 0.121 | 0.496 ± 0.009 | 0.528 ± 0.011 | 0.62 ± 0.03 | 0.68 ± 0.02 |
| 2 | 0.304 ± 0.061 | 0.232 ± 0.004 | 0.263 ± 0.005 | 0.34 ± 0.03 | 0.41 ± 0.02 |
| 3 | 0.126 ± 0.025 | 0.102 ± 0.002 | 0.124 ± 0.002 | 0.15 ± 0.02 | 0.03 ± 0.20 |
| 4 | 0.043 ± 0.008 | 0.042 ± 0.001 | 0.055 ± 0.001 | 0.06 ± 0.01 | 0.09 ± 0.01 |
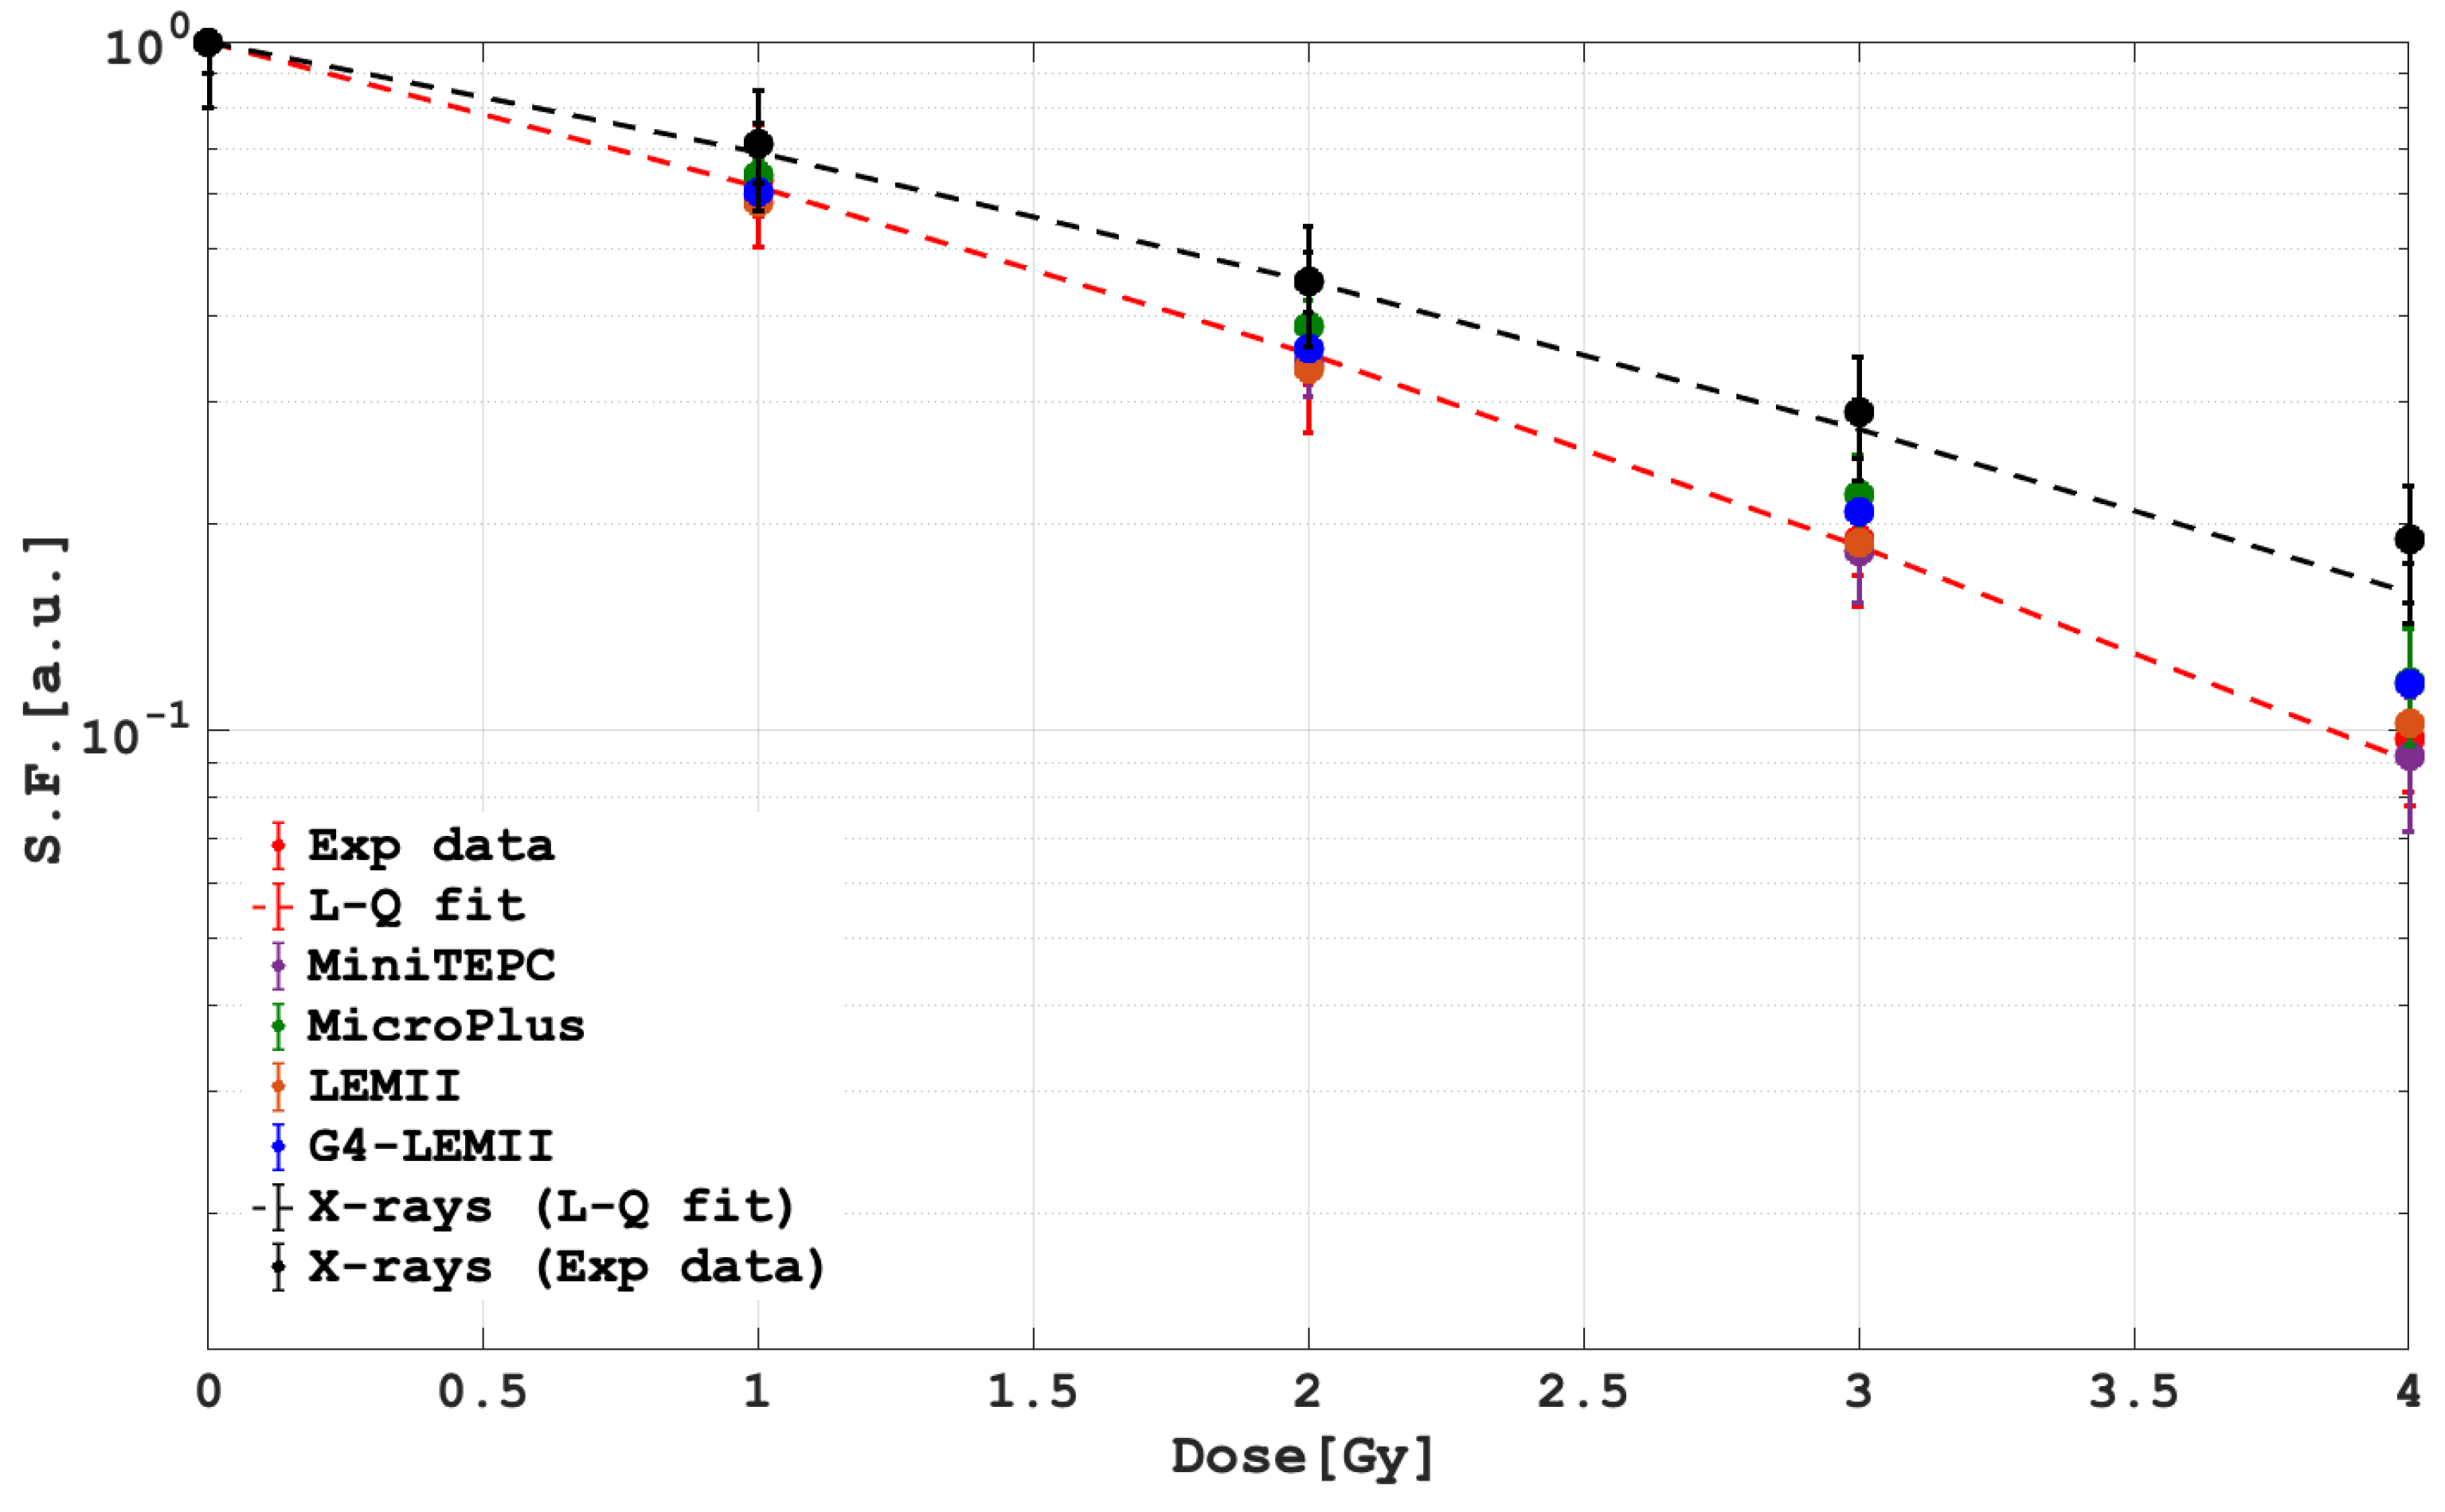
| Dose [Gy] | Exp Data | LEMII | G4-LEMII | mini-TEPC | MicroPlus |
|---|---|---|---|---|---|
| 1 | 0.618 ± 0.123 | 0.584 ± 0.011 | 0.605 ± 0.012 | 0.60 ± 0.03 | 0.64 ± 0.02 |
| 2 | 0.353 ± 0.071 | 0.334 ± 0.006 | 0.358 ± 0.007 | 0.34 ± 0.03 | 0.38 ± 0.03 |
| 3 | 0.186 ± 0.037 | 0.187 ± 0.003 | 0.207 ± 0.004 | 0.18 ± 0.02 | 0.22 ± 0.03 |
| 4 | 0.091 ± 0.018 | 0.102 ± 0.002 | 0.117 ± 0.002 | 0.09 ± 0.01 | 0.11 ± 0.02 |
| 92.1 | ||
|---|---|---|
| p-Value | ||
| LEM2 | 3.06 | 0.38 |
| LEM2-G4 | 2.70 | 0.44 |
| MicroPlus | 12.87 | 0.004 |
| MiniTEPC | 2.34 | 0.50 |
| ARPE19 | ||
|---|---|---|
| p-Value | ||
| LEM2 | 0.54 | 0.91 |
| LEM2-G4 | 2.42 | 0.49 |
| MicroPlus | 1.56 | 0.67 |
| MiniTEPC | 0.04 | 0.99 |
Publisher’s Note: MDPI stays neutral with regard to jurisdictional claims in published maps and institutional affiliations. |
© 2021 by the authors. Licensee MDPI, Basel, Switzerland. This article is an open access article distributed under the terms and conditions of the Creative Commons Attribution (CC BY) license (https://creativecommons.org/licenses/by/4.0/).
Share and Cite
Petringa, G.; Calvaruso, M.; Conte, V.; Bláha, P.; Bravatà, V.; Cammarata, F.P.; Cuttone, G.; Forte, G.I.; Keta, O.; Manti, L.; et al. Radiobiological Outcomes, Microdosimetric Evaluations and Monte Carlo Predictions in Eye Proton Therapy. Appl. Sci. 2021, 11, 8822. https://doi.org/10.3390/app11198822
Petringa G, Calvaruso M, Conte V, Bláha P, Bravatà V, Cammarata FP, Cuttone G, Forte GI, Keta O, Manti L, et al. Radiobiological Outcomes, Microdosimetric Evaluations and Monte Carlo Predictions in Eye Proton Therapy. Applied Sciences. 2021; 11(19):8822. https://doi.org/10.3390/app11198822
Chicago/Turabian StylePetringa, Giada, Marco Calvaruso, Valeria Conte, Pavel Bláha, Valentina Bravatà, Francesco Paolo Cammarata, Giacomo Cuttone, Giusi Irma Forte, Otilija Keta, Lorenzo Manti, and et al. 2021. "Radiobiological Outcomes, Microdosimetric Evaluations and Monte Carlo Predictions in Eye Proton Therapy" Applied Sciences 11, no. 19: 8822. https://doi.org/10.3390/app11198822
APA StylePetringa, G., Calvaruso, M., Conte, V., Bláha, P., Bravatà, V., Cammarata, F. P., Cuttone, G., Forte, G. I., Keta, O., Manti, L., Minafra, L., Petković, V., Petrović, I., Richiusa, S., Fira, A. R., Russo, G., & Cirrone, G. A. P. (2021). Radiobiological Outcomes, Microdosimetric Evaluations and Monte Carlo Predictions in Eye Proton Therapy. Applied Sciences, 11(19), 8822. https://doi.org/10.3390/app11198822