Article

Health Promoting Effect of Phyllanthus emblica and Azadiractha indica against Advanced Glycation End Products Formation

by
Mohammed A. Alsahli
1,
Shehwaz Anwar
1,
Faisal M. Alzahrani
2,
Ahmad Almatroudi
1,
Hani Alfheeaid
3,
Amjad A. Khan
4,
Khaled S. Allemailem
1,
Saleh A. Almatroodi
1 and
Arshad Husain Rahmani
1,*
1
Department of Medical Laboratories, College of Applied Medical Sciences, Qassim University, Buraydah 51452, Saudi Arabia
2
Department of Clinical Laboratory Sciences, College of Applied Medical Sciences, Imam Abdulrahman Bin Faisal University, Dammam 31441, Saudi Arabia
3
Department of Food Science and Human Nutrition, College of Agriculture and Veterinary Medicine, Qassim University, Buraydah 51452, Saudi Arabia
4
Department of Basic Health Sciences, College of Applied Medical Sciences, Qassim University, Buraydah 51452, Saudi Arabia
*
Author to whom correspondence should be addressed.
Appl. Sci. 2021, 11(19), 8819; https://doi.org/10.3390/app11198819
Submission received: 17 July 2021 / Revised: 14 September 2021 / Accepted: 19 September 2021 / Published: 23 September 2021

Abstract

:
Oxidative stress is linked with inflammation, diabetic complications, and advanced glycation end products formation. Intake of flavonoid-rich foods has been reported to have a beneficial effect on human health. The aim of this study was to verify the therapeutic potential of Phyllanthus emblica and Azadiractha indica against glycation and other oxidative stress-induced complications such as inflammation using in vitro study. Ethanol extracts of Phyllanthus emblica fruit pulp and dried leaf of Azadiractha indica were prepared to investigate in vitro anti-inflammatory and anti-glycating potentials. In a DPPH assay, the EC50 value of extract of P. emblica and A. indica was found to be 1532.36 ± 0.17 and 1380.61 ± 0.27 µg/mL, respectively. The FRAP value of P. emblica and A. indica extract was 86.6 and 32.12 µg ascorbic acid/100 mg dry weight of the extract. The maximum percentage of H2O2 scavenging activity was 71.30% and 67.38%, respectively. Extracts of P. emblica and A. indica showed maximum inhibition of heat-induced BSA denaturation by 62.42% and 53.00%, heat-induced denaturation of egg albumin, by 50.84%% and 44.31%, and heat-induced hemolysis by 54.44% and 50.21%. Both extracts (600 µg/mL) significantly reduced the browning, structural changes, aggregation, and AGEs formation. Our biophysical studies confirmed the AGEs formation was inhibiting the potential of extracts. Thus, our findings confirm that these extracts are a rich source of antioxidants and may be utilized to prevent the oxidative stress-induced destruction of biomolecules, glycation, and in the therapy of a variety of health problems, including inflammation. Further, a combination of extracts of P. emblica and A. indica may be extremely useful in preventing and treating health problems.

1. Introduction

Reactive oxygen species (ROS) are continuously released in aerobic organisms during cell metabolic reactions. ROS are very crucial in receptor activation, signal transduction, and gene expression [1]. The excessive production and insufficient removal of ROS result in oxidative stress that works as a significant risk factor in the pathogenesis of various diseases, including diabetes and cancer [2]. Oxidative stress results in the damage of various biomolecules such as DNA and RNA. Thus, ROS plays a very important role in the commencement of cancer [3]. The low concentration of ROS can result in tumor cell proliferation, survival, and tumor progression via the initiation of cellular signaling pathways that may lead to metastasis. However, the high concentrations of ROS have been reported to initiate cellular signaling pathways that may mediate the tumor cell death, as well as the formation of cancer stem cells. The formation of cancer stem cells may contribute to the recurrence of cancer [4].
Inflammation has been known to be linked with protein denaturation, membrane alteration, increased vascular permeability, and pain. However, chronic inflammation has been emphasized in tumor progression. The enhanced production of ROS at the site of inflammation results in tissue injury and endothelial dysfunction, resulting in inflammatory disorders [5]. The microenvironment of the tumor cells is mostly organized by inflammatory cells and is a crucial part of the neoplastic strategy that promotes proliferation, survival, and migration. Most of the signaling molecules associated with innate immune such as chemokines, selectins, and their specific receptors for invasion, migration, and metastases, have been co-opted by tumor cells [6].
The advanced glycation end products (AGEs) are diverse and highly reactive heterogenous formed due to the condensation of proteins with reducing sugars [7,8,9,10,11,12]. The excessive accumulation of AGEs designates the state of total metabolic burden, chronic hyperglycemia, oxidative stress, and inflammation [9]. AGEs interact with specific receptors or bind proteins and activate a series of signaling pathways that are involved in diabetes-related complications such as diabetic nephropathy, cataract, Alzheimer’s, atherosclerosis, etc. [13]. Besides, the cross-linking of proteins induced by AGEs leads to the formation of detergent-insoluble and proteinase-resistant aggregates. The presence of these aggregation products has been reported to the formation of autoantibodies in plasma and tissues of diabetic patients [14]. Besides, the relationship between accumulation of AGEs and development of vascular complications [15] and increased inflammation has been well documented. Chronic inflammation is an important cause of the development of cancer [16]. The increased level of AGEs in tumor cells has suggested its possible role in cancer progression [17]. The increased production of ROS and damaging of cell membranes are particularly common due to AGEs accumulation and are highlighted in gene mutations. Gene mutations are often associated with malignant cell transformation [18]. Many compounds and molecules have been reported to inhibit the formation of AGEs [19].
Several studies have reported that the use of natural products rich in compounds with strong antioxidant potential can be beneficial in the inhibition of protein modifications and AGEs formation [2] and in the reduction and prevention of several diabetic vascular complications. Recent research reported that plant-derived products could provide a better strategy for the treatment and prevention of many diseases. Various anticancer drugs such as vincristine, vinblastine, and camptothecin have been derived from plants [20]. Phyllanthus emblica Linn. (P. emblica) (family Euphorbiaceae) is commonly called gooseberry, and its fruit has been especially used as a traditional medicinal ingredient and in food items for several health-promoting effects and to treat a wide range of diseases [21]. Azadiractha indica (A. indica) Linn. (family Meliaceae) has been utilized for the treatment of various health ailments since ancient times. All parts of the A. indica tree are consumed as traditional medicine systems for the treatment and prevention of different diseases [22].
The goal of our study involves the evaluation of in vitro comparative antioxidant, anti-inflammation, anti-arthritic, anti-glycation, and anti-AGEs formation capabilities of P. emblica Linn. and A. indica Linn.

2. Material and Methods

2.1. Materials

Folin–Ciocalteau reagent, ferric chloride, 2,2-diphenyl-1-picrylhydrazyl (DPPH), gallic acid, potassium ferricyanide, ascorbic acid, trichloroacetic acid, trypsin, quercetin, and Congo red were acquired from Sigma Co. St. Louis, Missouri, USA. The organic solvents, acids, and other supporting chemicals such as ethanol, DMSO, hydrochloric acid aluminum chloride, methanol, monosodium dihydrogen phosphate, sodium carbonate, disodium hydrogen phosphate, sodium hydrogen peroxide were purchased from Merck, Darmstadt, Germany. All other supporting reagents and chemicals were of analytical grade, and the organic solvents used were of HPLC grade.

2.2. Preparation of Extracts

Our standardized protocol was used to prepare the ethanol plant extracts. In short, we placed dried plant powder (100 g) of P. emblica fruit pulp and powder of A. indica dried leaves were in ethanol (97%; 1 L) in separate flasks with intermittent shaking for 3 days. Later, the raw extracts were passed through the Whatman filter paper No. 1 (Whatman Ltd., England). To obtain crude extract with minimum loss of bioactive compounds, the filtrate was evaporated to remove ethanol using a rotary evaporator at decreased pressure and 40 °C temperature. The concentrated chemical remained in the flask after the solvent was removed. A rotating evaporator removed the solvent faster and at lower temperatures (to minimize breakdown) and with less energy than boiling with a heat source. Because it used low pressure, a rotary evaporator was also very effective at extracting the final vestiges of residual solvent from a solution. Furthermore, to obtain the highest flavonoid and polyphenolic content in the extracts, the extraction temperature (40 °C) and period of extraction were preliminarily optimized. The concentrated filtrate was kept at 4 °C for further use. The desired amount of 1% DMSO was used to reconstitute the filtrate according to our need in sterilized tubes to prepare the ethanol extracts of predetermined concentrations. The following equation was used to determine the percentage of yield of extract.
Yield (%) = [Weight of sample extract/Initial weight of sample] × 100.

2.3. Tests for Flavonoids (Alkaline Reagent Test) and Phenolics (FeCl3 Test) Confirmation

The occurrence of flavonoids in some plant extracts was confirmed by applying an alkaline reagent test. In this assay, an intense yellow color was formed and finally became colorless by the addition of dilute HCl dropwise. After 2 mL of 2.0% NaOH mixture was treated with 1 mL crude extract, an intense yellow color was formed, which turned colorless when 2 drops of diluted acid were added to the mixture. This subsequent appearance and disappearance of yellow color indicate the presence of flavonoids.
The FeCl3 test was used to assure the presence of phenolic contents. Phenols with ferric ions create a compound. The color of this complex varies depending on the type of phenol used. It might be blue, green, or even red. A total of 3–4 drops of neutral 5% aqueous ferric chloride solution were added to a 1 mL aliquot of each of the extracts. The appearance of blue, red, purple, and green color indicates further the occurrence of phenolic compounds in the extracts.

2.4. Total Phenol Content

Folin–Ciocalteu reagent was used to measure total phenol content. In this test, ethanol extracts of P. emblica and A. indica (500 µL, 1 mg/mL) were separately added to different test tubes having Folin–Ciocalteu’s reagent (2500 µL, 10%). Eventually, sodium carbonate (2 mL, 7.5%) was added to each tube. After proper mixing, the tubes were kept in the absence of light at 37 °C for half an hour. Just after the incubation, the absorbance of respective solutions was determined at 760 nm by a spectrophotometer (Schimadzu 1240 UV mini spectrophotometer). Various concentrations of gallic acid (50–250 μg/mL) were used to make a standard calibration plot. This calibration plot was used to determine the concentration of total phenolic content in the ethanol extracts. The total phenolic contents were stated as mg gallic acid equivalents (GAE). All tests were carried out in triplicates. The findings were shown as mg gallic acid equivalents per g of sample extract. The following formula was applied to calculate the total concentration of phenolic content.
Total phenolic content = X × V/m
where X is represented as gallic acid concentration in mg/mL; V is volume (mL) of the sample used in the extraction; m is the weight of pure dried sample used (g).

2.5. Total Flavonoid Content

The aluminum chloride (AlCl3) assay was used to estimate the total flavonoid contents of P. emblica and A. indica extract [23,24]. In this assay, 500 μL of extract (50 µg/mL) or standard quercetin solution (500 μL, 20–250 µg/mL) was added to test tubes containing AlCl3 (500 μL, 2% in ethanol solution). The solutions were mixed properly, and tubes were kept at room temperature for 1 hour. The appearance of yellow color indicates the presence of flavonoids. After 60 min at room temperature, the absorbance was calculated at 430 nm against methanol as a blank. The total flavonoid contents were estimated as the quercetin equivalent (mg/g) (mg QUE/g) by the equation below to estimate the total flavonoid content (TFC).
TFC = Z × V/m
where Z represents quercetin concentration (mg/mL); V is the volume (mL) of sample used in the extraction; m represents the weight of pure dried sample used (g).

2.6. In Vitro Antioxidant Activity- Reducing Power

The capacity of extracts to reduce Fe3+ was assessed by the ferric reducing antioxidant power (FRAP) method with minor modifications [25]. In separate test tubes, 1 mL of aliquots of various concentrations of ascorbic acid or 1 mL of P. emblica or A. indica extract (100 to 600 µg/mL) was added with 2.5 mL of phosphate buffer (0.1 M, pH 6.6) and 1% of 2.5 mL potassium ferricyanide. Later, the solutions were heated for 20 min at 50 °C. This step was necessary to reduce ferricyanide into ferrocyanide. This step was followed by the addition of 2.5 mL of 10% trichloroacetic acid to each test solution to stop the reaction. All the reaction mixtures were centrifuged at 3000 rpm for 10 min. Finally, supernatant from each tube was isolated, and the rest was discarded. The next step was followed by using 2.5 mL of supernatant and mixed with an equal amount of distilled water, and the resultant mixture was vortexed accordingly. Ferric chloride (0.5 mL, 0.5%) solution that was freshly prepared was added to the mixture. The absorbance of ascorbic acid (reference) and test samples was recorded at 700 nm. All the samples were run in triplicate. The blank solution had phosphate buffer (pH 6.6) only. Higher absorbance meant higher reducing power.
Percent reducing power = [(Ac − As)/Ac] × 100
where Ac represents the control solution absorbance; and As represents the absorbance in presence of extract.

2.7. Evaluation of Antioxidant Activity of Extracts by Hydrogen Peroxide (H2O2) Radical Scavenging Activity

The ability of P. emblica and A. indica extract to reduce H2O2 s was explored to confirm the antioxidant activity [26]. For this purpose, 40 mM H2O2 prepared in 50 mM PBS (pH 7.4) and 1.0 mL of this solution was mixed to different tubes containing various concentrations of ethanol P. emblica and A. indica extract (50–600 µg/mL) that were kept in the absence of light. The solutions were well mixed, and the absorbance of H2O2 was checked after 10 min at 230 nm against phosphate buffer devoid of H2O2 as the blank solution. The samples were run in triplicates, and the scavenged H2O2 percentage was calculated by the following equation.
H2O2 scavenging ability (%) = [(Mc − Ms)/Mc] × 100
where Mc represents the absorbance of H2O2 solution; and Ms means the extract and H2O2 solution absorbance.

2.8. Estimation of DPPH Mediated Free Radical Scavenging Activity

The antioxidant assay was explored by using 1,1 difenyl-2-picryl-hydrazyl (DPPH) radical assay for both P. emblica and A. indica extract. In brief, stock solution (1mg/mL) of P. emblica or A. indica extract was diluted to different concentrations (50–600 μg/mL) by serial dilution in methanol. Now, 0.3 mM DPPH was prepared in analytical grade methanol, and 1 mL of this solution was mixed with different dilutions (2500 μL) of extracts. The reaction mixtures were mixed well manually. The tubes were kept away from the light for half an hour at room temperature. After completion of incubation, the absorbance of samples was recorded spectrophotometerically at 517 nm. DPPH is completely soluble in MeOH. DPPH in methanol solution was used as a control. Hence, methanol was used as a blank to set the spectrophotometer to zero before measuring absorbance of our control and samples. The percentage of free radical reduced of P. emblica or A. indica extract was calculated in accordance with the following equation.
Percentage of free radical reduced= [(Nc − Ns)/Nc] × 100
where Nc means the control absorbance, and Ns denotes the sample solution absorbance.

2.9. Investigation of Anti-Inflammatory In Vitro Activity by Inhibition of Protein Denaturation

Albumin denaturation inhibition activity of different extracts was investigated to explore the anti-inflammatory action [27,28]. A strong anti-inflammatory non-steroidal drug, i.e., ibuprofen, was used as a reference drug in this test. The tubes containing bovine serum albumin (BSA) (500 μL, 1% aqueous solution) and 100–600 μL of different dilutions of P. emblica or A. indica extract or 200 µg/mL of ibuprofen, were incubated at normal temperature for 20 min. Denaturation of BSA was carried out for 30 min by wet heating the samples at 70 °C. The absorbance of different samples was recorded at 660 nm just after cooling the samples. In this test, blank contained simple distil water. The experiment was run in triplicates, and the average absorbance was taken. The inhibition of protein denaturation percentage was calculated as per the following equation.
Inhibition of albumin denaturation (%) = [(Oc − Os/Oc] × 100
where Oc = denotes the absorbance of the control, and Os denotes the absorbance in the presence of extract/ibuprofen.

2.10. Anti-Proteinase Action

For further confirmation of the anti-inflammatory action of P. emblica and A. indica extract, the proteinase enzyme inhibition activity was explored [28,29]. In this experiment, 2 mL reaction mixtures having 1 mL of 20 mM Tris HCl buffer (pH 7.4), 1.0 mL of P. emblica, and A. indica extract (100–600 μg/mL) or 1 mL of diclofenac sodium (200 μg/mL), along with 0.06 mg trypsin, were incubated in separate test tubes. The reaction mixtures were incubated for 5 min. At the end of incubation, 1 mL of casein (0.8% w/v) was mixed in each reaction mixture, and the tubes were further incubated for 20 min at 37 °C. The reaction was stopped by adding 70% of 2 mL perchloric acid resulting in cloudy suspension formation. The reaction mixture was centrifuged for 5 min at 2500 rpm. The resulting supernatant absorbance was checked at 210 nm against the buffer. All the samples were run in triplicates. The proteinase inhibition activity (%) was calculated as:
Percentage inhibition (%) = [(Pc − Ps)/Pc] × 100
where Pc represents the absorbance of control; Ps denotes the absorbance of the sample having extract/diclofenac.

2.11. Inhibition of Egg Albumin Denaturation: To Evaluate Anti-Arthritic Activity by In Vitro Assay

The possible mechanism of anti-arthritic assay of both extracts was investigated by inhibition of heat-induced egg albumin denaturation. Reaction mixtures containing fresh phosphate buffer (2.8 mL, pH 6.4), hen’s egg albumin (0.2 mL), and 2 mL of different concentrations (50–600 µg/mL) of extracts or diclofenac sodium (standard anti-inflammatory drug), were first allowed to stand for 15 min at 37 ± 2 °C. After the completion of incubation time, the tubes having various reaction mixtures were placed in a water bath at 70 °C for 5 min. The absorbance of all solutions was assessed at 660 nm. Phosphate buffer was taken as blank. The inhibition percentage of egg albumin denaturation was figured out using the following equation.
Inhibition of denaturation (%) = [(Kc − Ks)/Kc] × 100
where Kc denotes the absorbance of the control, and Ks represents the absorbance of solutions having either extract or diclofenac sodium added.

2.12. Membrane Stabilization Ability

2.12.1. Red Blood Cell (RBC) Suspension Preparation

Fresh blood was obtained from healthy volunteers. Before collecting the blood, it was made sure that administration of any anti-inflammatory and anti-contraceptive drug was not taken at least for a week before donating blood. The collected blood was transferred to the tubes, having sterilized Alsever’s solution in an equal amount. The tubes containing resultant blood solution were centrifuged for 10 min at 3000 rpm. The supernatant was discarded, and erythrocytes were washed three times. Normal saline in equal volume was added to wash erythrocyte sediments. The contents were reconstituted with isotonic phosphate buffer [30].

2.12.2. Hemolysis by Heat Induction

The 2 mL reaction mixture was prepared by taking 1 mL of P. emblica or A. indica extract of differential concentrations (100–600 μg/mL) or aspirin and 1 mL human RBC suspension (10% v/v). In the control solution, normal saline replaced extract or aspirin. Aspirin (200 μg/mL) was taken as a reference drug. The tubes were gently inverted to mix the contents and were incubated at 56 °C for half an hour. After cooling, the reaction mixtures were centrifuged at 2500 rpm for 5 min at room temperature. The supernatants were collected, and its absorbance was recorded at 560 nm. Blank had only phosphate buffer [28]. The percentage of membrane stabilization activity or percentage protection from heat-induced denaturation of RBC membrane was calculated by the formula mentioned below.
Percentage protection = [(Bc − Bs)/Bc] × 100
where Bc denotes the absorbance of the control, and Bs denotes the absorbance of sample in the presence of extract/aspirin.

2.12.3. Hypotonicity Induced Hemolysis

In this assay, the inhibitory action of P. emblica or A. indica extract on hemolysis induced by hypotonicity was performed according to the modified method of Chanda and Juvekar [30]. HRBC suspension (0.5 mL, 10% v/v), 0.1 M phosphate buffer pH 7.4, hyposaline 2 mL, and 1 mL of either extracts with concentrations from 100–600 μg/mL taken in various tubes. The reference drug, diclofenac (200 μg/mL) was used dissolved in distilled water. The control was made from distilled water. All the reaction mixtures were incubated at 37 °C for 30 min and centrifuged for 10 min at 3000 rpm to separate the supernatant. The supernatant absorbance was checked at 540 nm. The percent hyposalinity-induced hemolysis was calculated by supposing the 100% hemolysis in control.
% protection = 100 − [(Ds/Dc) × 100]
where Dc denotes the absorbance of the control, and Ds represents the absorbance in the presence of sample/diclofenac sodium

2.13. Investigation of Antiglycating and AGEs Inhibiting Property through Screening of Glycation Biomarkers

2.13.1. Incubation of P. emblica and A. indica Extracts with In Vitro Glycation System

The BSA and glucose model was used for in vitro glycation and the analysis of AGEs formation [31]. Ethanol extracts were used as antiglycating agents and AGEs formation inhibitors. In short, 0.5 M glucose prepared in 0.1 M phosphate buffer (pH 7.4) was incubated with an aqueous solution of BSA (10 mg/mL) with or without ethanol extracts (100–600 µg/mL) at room temperature for 15 days in the dark with gentle shaking. The incubation was performed in closed capped glass vials. The reaction mixtures were filter-sterilized through a 0.2 µm membrane. The reaction mixtures were dialyzed to remove unbound and bound glucose at 37 °C against 50 mM phosphate buffer (pH 7.4) overnight. After dialysis, the molar extinction coefficient method was used to determine the protein concentration. An addition of 3 mM/L sodium azide in each sample prevented any bacterial contamination. All experiments were run in triplicate. Browning, aggregation index and Congo red assays have been investigated as preliminary screening of glycation inhibition and anti0-AGEs formation inhibition potential of extracts.

2.13.2. Measurement of Browning in Glycated Samples

Glycation reaction is a non-enzymatic reaction, and glycation may induce the denaturation of BSA. Therefore, it has been assumed that browning intensity is an important indicator of glycation. The degree of glycated samples browning was investigated by measuring the absorbance at 420 nm [32] using a cuvette (1 cm path length) after being diluted with distilled water. The dilution factor for each sample was the same. All the experiments were run in triplicates. The following formula was applied to calculate the percentage of protection from browning.
Percentage protection from browning = [(Gc − Gs)/Gc] × 100
where Gc denotes the absorbance of glucose and BSA reaction system, and Gs denotes the absorbance of samples having glucose and BSA reaction mixture incubated with the extract.

2.13.3. Effect of P. emblica and A. indica Extract on Protein Aggregation Index

Glycation has been reported to be an important driving cause to induce the structural alterations in biomolecules such as proteins that result in the formation of aggregates. The inhibitory effect of P. emblica and A. indica extracts on protein aggregate formation was investigated by the estimation of absorbance of glycated samples in the absence and presence of P. emblica or A. indica extract [32]. The following formula was used to calculate the aggregation index.
Percentage of protein aggregation index = [S340/(S280 − S340)] × 100
where S340 denotes the absorbance at 340 nm, and S280 denotes the absorbance at 280 nm.

2.13.4. Determination of Fibrillar State by Congo Red Assay

The glycation facilitated fibrillation inhibition of BSA was investigated, and it was established on amyloid-specific dyes binding such as Congo red (CR), as described by Klunk and colleagues [33]. The CR binding activity was carried out to estimate the AGE-BSA absorbance and BSA (control) separately, in addition to the Congo red background. As discussed by previous researchers, 500 μL of 100 μM glycated protein solution was incubated with of CR (100 μL, 100 μM) in 10% v/v PBS in ethanol) for 10 min at room temperature. The absorbance was checked at 530 nm, and the results were expressed as the amyloid formation inhibition percent.
% inhibition of amyloid formation = [(Uc − Us)/Uc] × 100
where Uc denotes the absorbance of glucose and BSA reaction system, and Us represents the absorbance of extract incubated glucose and BSA reaction system.

2.14. Biophysical Studies: AGEs Formation Inhibiting Properties of Extracts

Sodium phosphate buffer (pH 7.4, 20 mM) was used to make stock of BSA (1 mg/mL), and this stock was then stored at −20 °C for future use. In order to induce glycation, BSA (0.2 mg/mL) was incubated with glucose (0.5 M) in 20 mM sodium phosphate buffer pH 7.4 in autoclaved tubes in order to maintain sterile conditions, and the tubes were placed in a shaking water bath at 37 °C for 10 days. BSA incubated with phosphate buffer (20 mM, pH 7.4) alone was considered as the control or the reference sample. Bacterial contamination was prevented by sodium azide (3 mM). After completion of incubation, the samples were dialyzed with sodium phosphate buffer (0.1 M, pH 7.4) at 4 °C. To study the protection by extracts against glycation and AGEs formation inhibition, BSA (0.2 mg/mL) was incubated with glucose (0.5 M), in 20 mM sodium phosphate buffer pH 7.4 in autoclaved tubes in the presence of 100–600 µg/mL of either P. emblica or A. indica. The protection against glycation and AGEs formation was assessed by UV absorption, AGEs specific fluorescence, and ThT fluorescence.

2.14.1. UV Absorption

A double beam Perkin Elmer spectrophotometer (Lambda 25) was used for UV absorption measurements. The UV spectra of BSA (0.2 mg/mL) in the absence/presence of glucose and the absence/presence of P. emblica or A. indica were measured in the wavelength range of 240–500 nm. The absorbance intensity of each sample was recorded at 280 nm.

2.14.2. AGEs Specific Fluorescence Study

Shimadzu spectrofluorometer (model RF-5301PC) was used for all fluorescence measurements. However, protection from the formation of fluorescent AGE products was studied with excitation at 350 nm and emission in the range 400–480 nm. The slit widths were 3 nm for both excitation and emission [11].

2.14.3. Fibrillar Inhibition Study by Thioflavin T Specific Fluorescence Study

For the confirmation of fibrillar state inhibition properties of extracts, 6 µM Thioflavin T reagent was added in each sample [7]. The fluorescence spectra of each sample was monitored at an excitation wavelength of 440 nm and the emission in the range 450–600 nm. The slit widths were 10 nm for both excitation and emission.

2.14.4. Statistical Analysis

All the experiments were run in triplicate and were expressed by mean ± Standard Error Mean (SEM). The statistical analysis was implemented by using the data entry as ANOVA.

3. Results

3.1. The Initial Screening of Phenolic and Flavonoid Contents

In Table 1, the yield, odor, color, and texture of the percentage yield of ethanol extracts of P. emblica and A. indica extract are shown (Table 1). The yield of P. emblica and A. indica extract were found to be 8.79% (8.79 g final concentration) and 7.19% (7.19 g final concentration), respectively. However, the odor was noticed to be nonspecific for both extracts. The color of P. emblica extract was reddish-brown. Ethanol extract of A. indica was brown, respectively. The texture of P. emblica extract was sticky. While A. indica was powdery in texture. Further, total phenolic compounds in ethanol extracts of P. emblica and A. indica were found to be 39.54 ± 0.046 and 61.30 ± 0.046 mg gallic acid equivalent/g dry weight of extract, respectively. It is remarkable to highlight that the products of defense against stress or pathogens present in the environment is indicated by the total phenolic contents. Therefore, total phenolic content can be varied according to environmental conditions and stress, and the growth functions and development of plant tissues does not correlate with total phenolic content [34].
Quercetin was used as a standard in AlCl3 colorimetric assay. The fraction of total flavonoid in ethanol extracts of P. emblica and A. indica was 33.58 ± 0.01 and 15.28 ± 0.18 mg quercetin equivalents/g dried weight of extract.

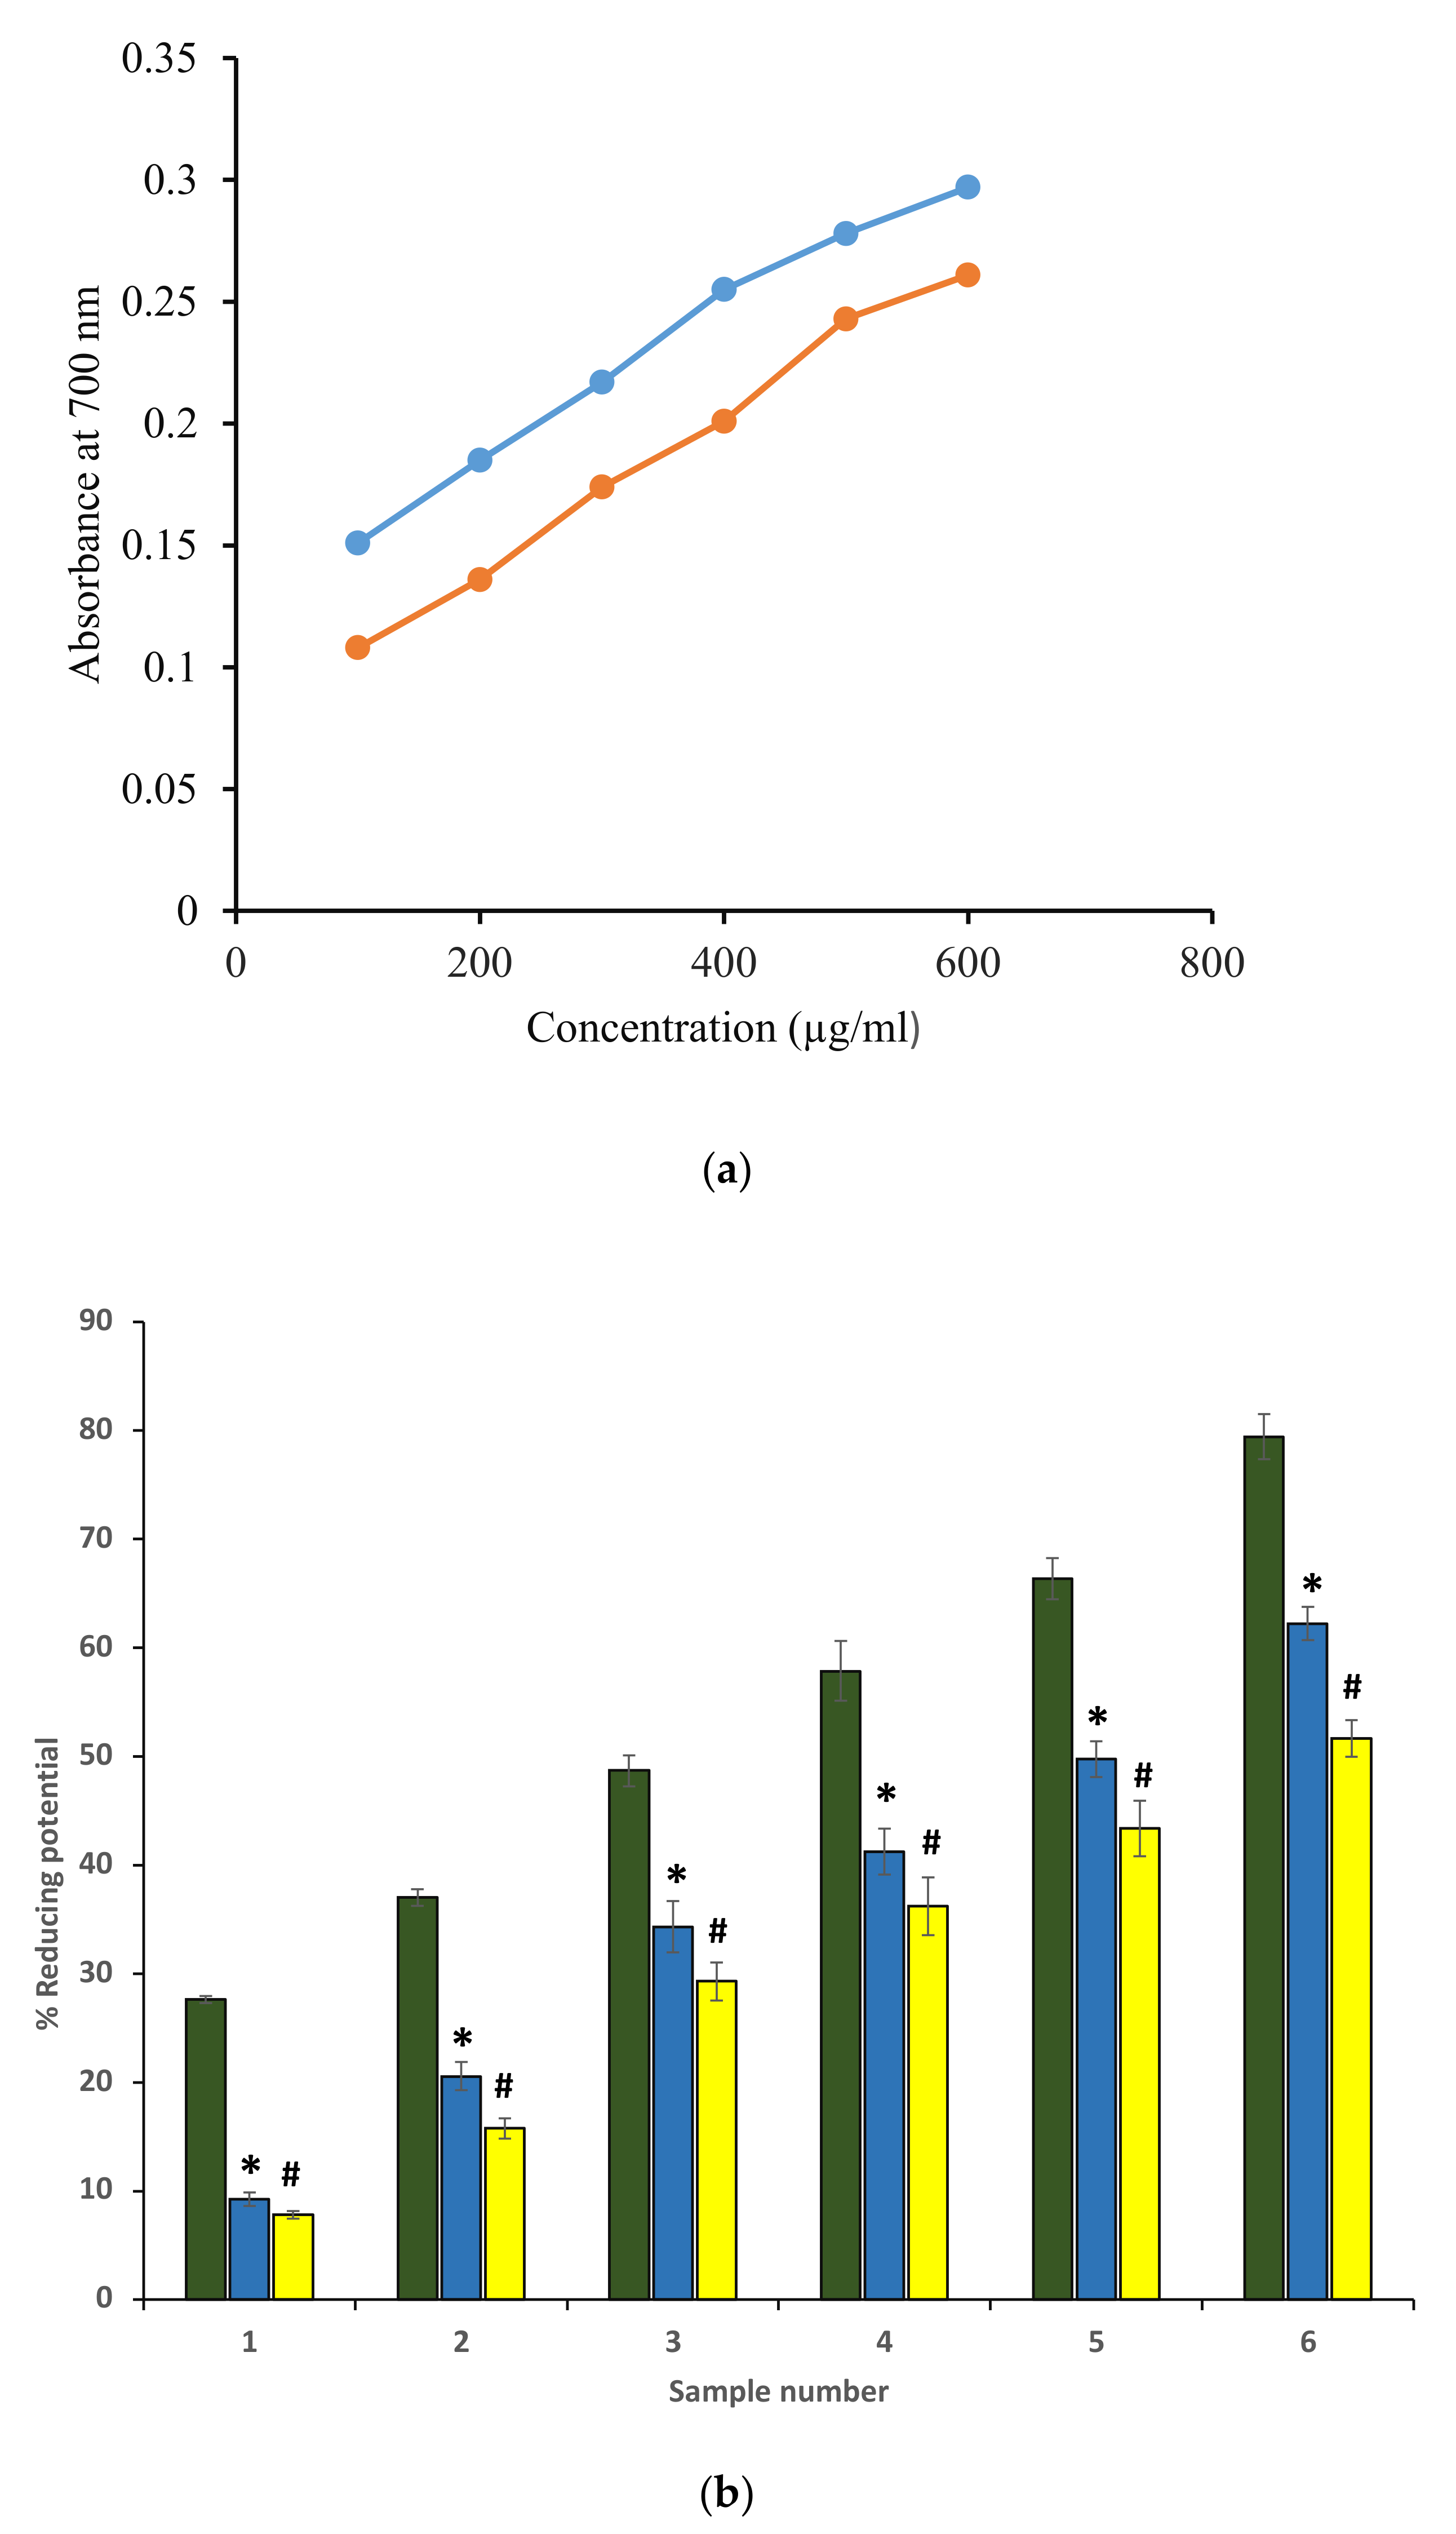
3.2. Ferric Reducing Power as In Vitro Antioxidant Assay

Antioxidant potential for ethanol extracts was investigated by determining the reducing ability using the ferric reducing antioxidant power method (FRAP). The standard was ascorbic acid because it is a well-known antioxidant (Figure 1). FRAP is a reproducible, rapid result-giving, and simple method that is known to provide an estimate of total antioxidant concentration. The extracts reduced Fe+3 to Fe+2 quite efficiently. The ascorbic acid solution (50–250 μg/mL) was found to be conformed to Beer’s Law at 700 nm and showed a slope m = 0.0029, regression coefficient (R2) as 0.9966, and intercept as 0.0226. The standard curve equation is represented as y = 0.0029x + 0.0226. The FRAP value of ethanol extract of P. emblica and A. indica was found to be 86.6 ± 0.031 and 52.12 ± 0.071 µg ascorbic acid/100 mg dry weight of the extract. Further, the reducing potential of both extracts was found to be comparable to the ascorbic acid standard. Figure 1a,b shows the reducing potentials of both extracts in terms of absorbance at 700 nm, and absorbance was found to be increased with an increase in concentration. Values were in mean ± SEM. The standard error of the mean (SEM) was only used to show the accuracy of an estimated mean. Our FRAP value of A. indica was close to 26.42 ± 2.14 Ascorbic Acid (mg/g).

3.3. Hydrogen Peroxide (H2O2) Radical Scavenging Ability

The percentage of H2O2 scavenging activity for different concentrations of P. emblica and A. indica was determined according to Ruch et al. [26]. Concentration-dependent H2O2 scavenging activity was found in P. emblica and A. indica extract, and 600 µg/mL of ethanol extracts of both plants displayed the maximum percentage of scavenging activity. As discussed earlier, this antioxidant nature of extracts correlates with the higher content of polyphenolic compounds present in the extract. Figure 2 represents the H2O2 scavenging activity percentage of P. emblica (blue columns) and A. indica (yellow column) (Figure 2).

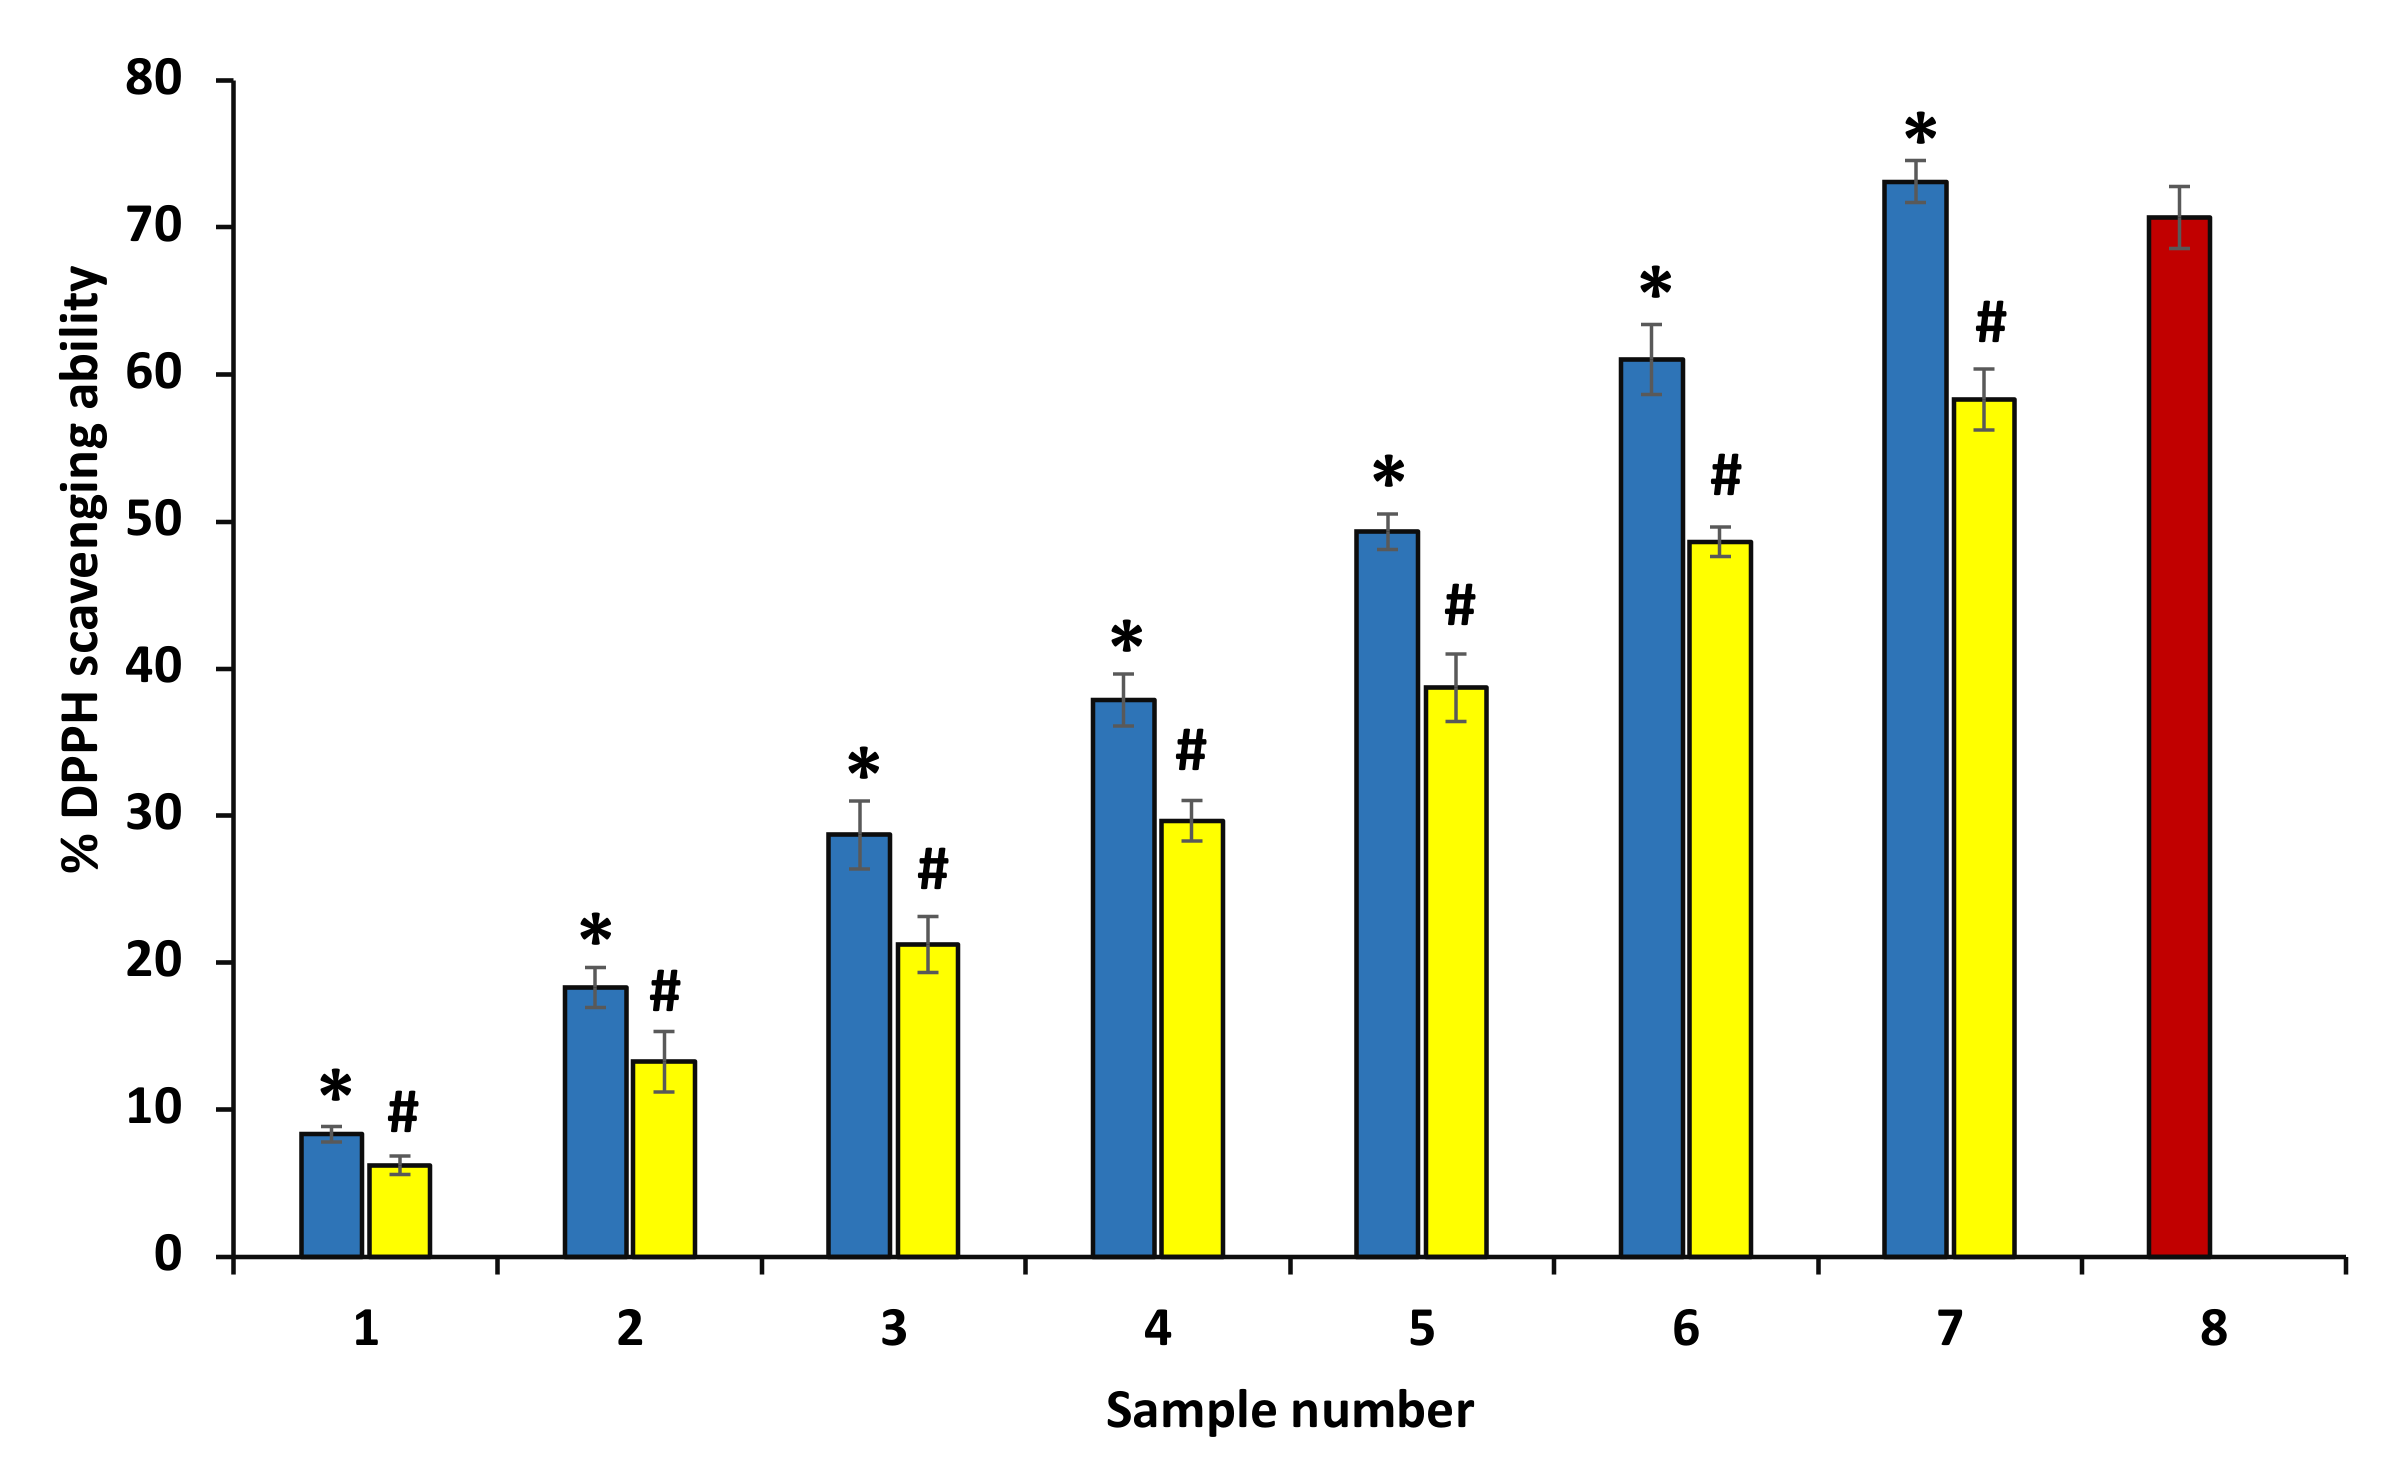
3.4. DPPH Radical Scavenging Assay

DPPH as a free radical accepts electrons or hydrogen radicals from an antioxidant and thus is reduced and forms diphenyl-picryl hydrazine, a yellow-colored compound. The decrease in absorbance at 517 nm is used to check the reduction of DPPH by antioxidants. The antioxidant nature of ethanolic extract represents a significant increase in the DPPH free radical scavenging (Figure 3). The EC50 value of ethanol extracts of P. emblica and A. indica was found to be 1532.36 ± 0.17 and 1380.61 ± 0.27 µg/mL by plot between percent free radical scavenging activity and concentration of ethanol extracts, separately and intercept = 2.71 and 2.32. The equation of extracts curve is y = 0.1846x + 2.71 and y= 0.1357x + 2.32. Figure 3 shows the comparison of % free radical scavenging activity of P. emblica and A. indica in the bar graph (Figure 3).

3.5. Protein Denaturation Inhibition—An Evaluation of Anti-Inflammatory Activity

Some external factors, including stress or chemicals, induce the denaturation of protein. Denaturation results in the loss of quaternary, tertiary, and secondary structures of protein and it is one of the significant characteristics of inflammation. Therefore, the anti-inflammatory activity of extract of P. emblica and A. indica was investigated by searching their potential to protect from protein denaturation. The data suggest that ethanol extracts of P. emblica and A. indica protect from heat-induced albumin denaturation. Further, it was found that an increase in the concentration of P. emblica and A. indica. increases the percent inhibition of denaturation. The extracts at 600 µg/mL concentration showed high anti-inflammatory potential by inhibiting the heat-induced albumin denaturation by 62.421% and 53.002%, respectively (Figure 4). Ibuprofen, as a standard anti-inflammatory medicine and it displayed the maximum inhibition, 63.01 ± 0.48% at the concentration of 200 µg/mL (data are not shown in the graph).

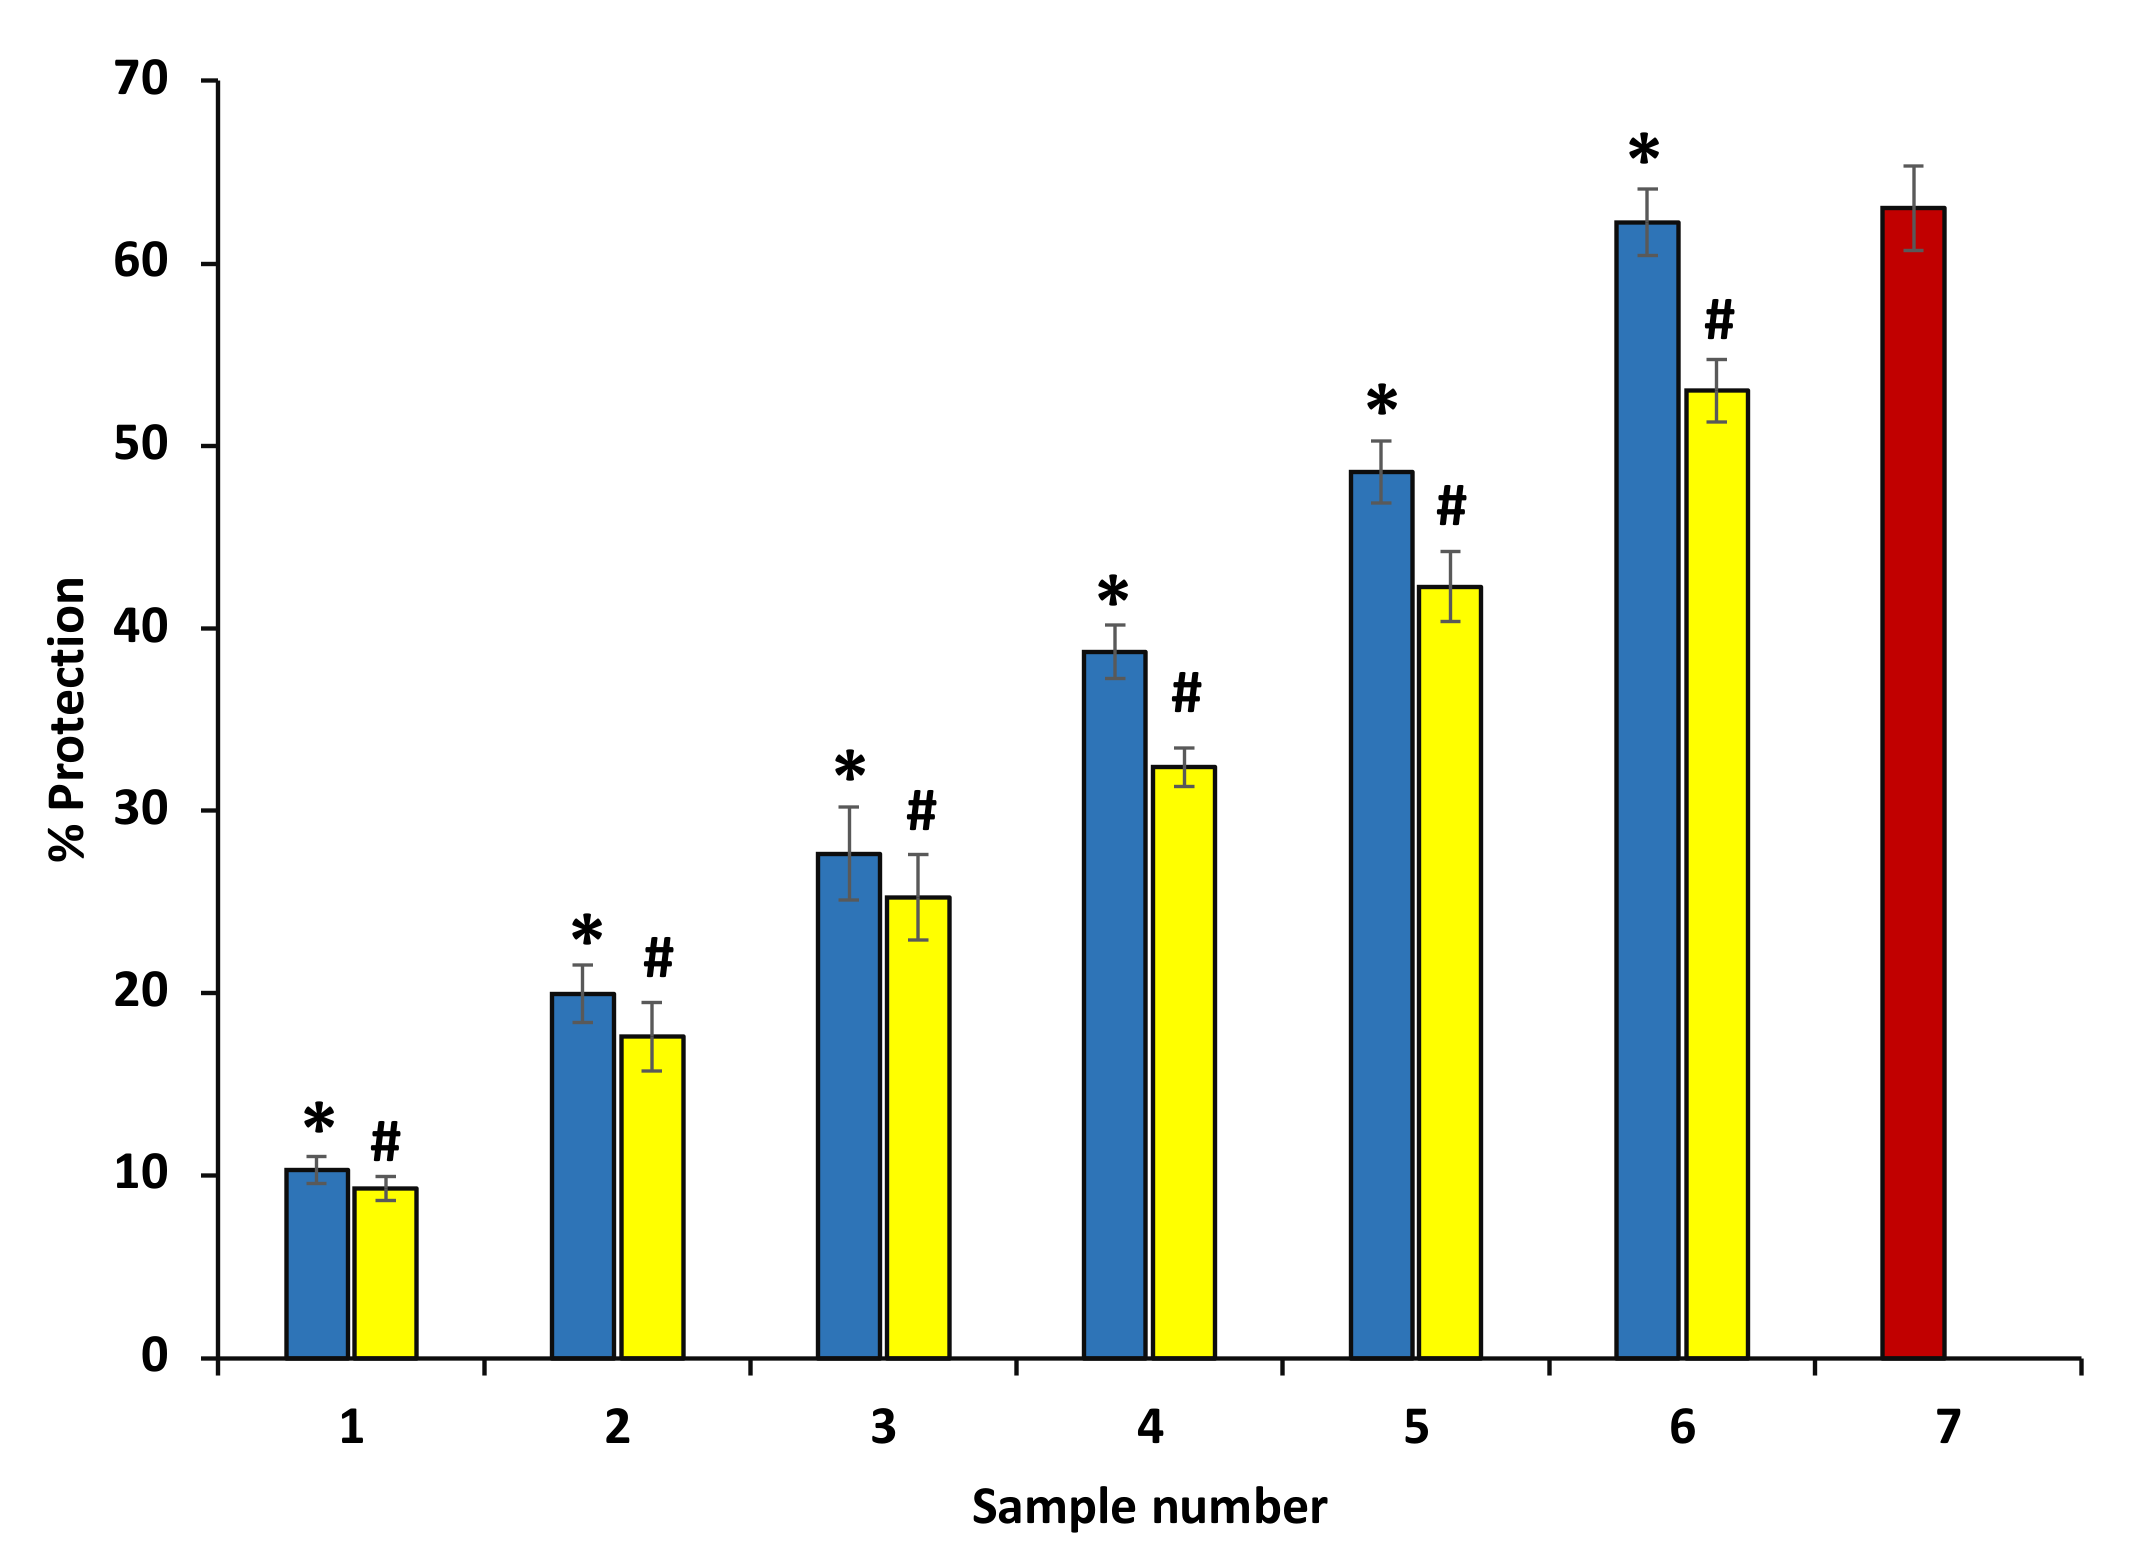
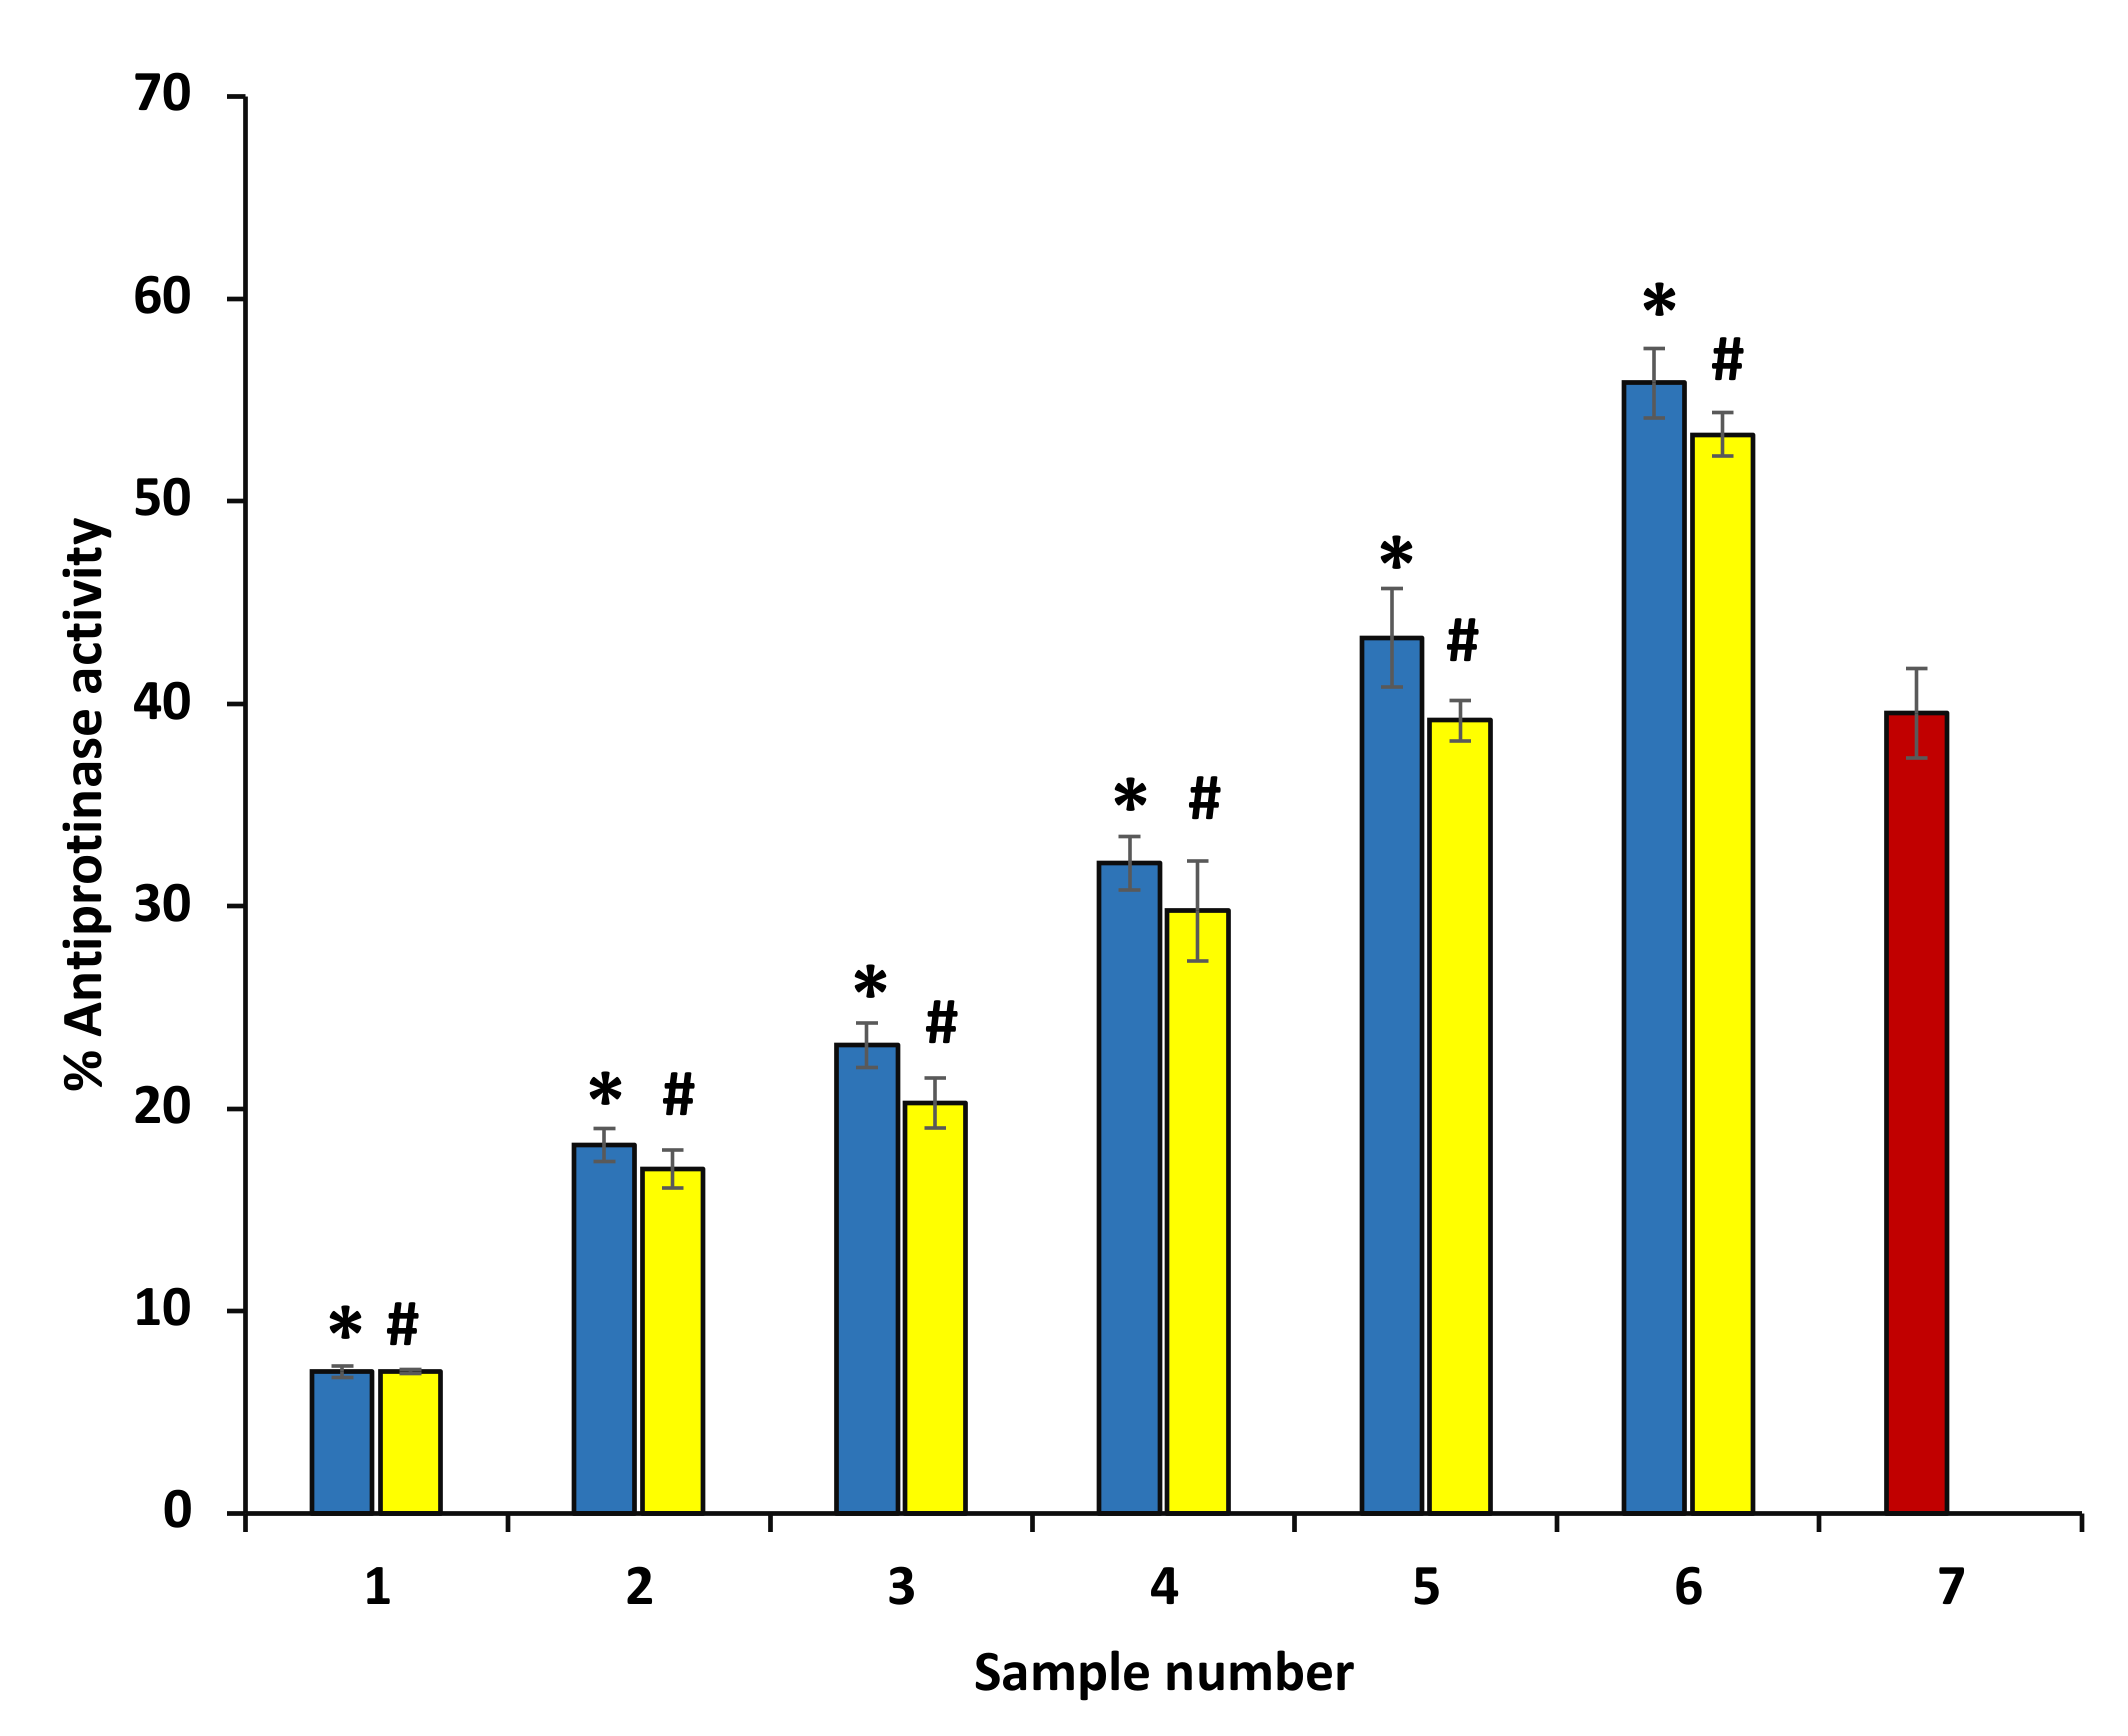
3.6. Anti-Proteinase Activity

The arthritic reactions have been implicated with high proteinases. Neutrophils have a significant amount of proteinases, and proteinases are known to be involved in the damage of tissues in inflammatory reactions. Significant anti-proteinase activity was exhibited by both ethanol extracts of P. emblica and A. indica, and anti-proteinase activity of ethanol extracts of P. emblica and A. indica was comparable with diclofenac. The percent inhibition of proteinase activity of P. emblica and A. indica was concentration-dependent. The ethanol extract of P. emblica and A. indica at 600 µg/mL showed maximum inhibition activity (63.67 and 55.27%, respectively) (Figure 5). However, the maximum percent inhibition of proteinase activity was displayed by diclofenac sodium at 200 µg/mL (71.59 ± 0.075) (data are not shown in the graph).

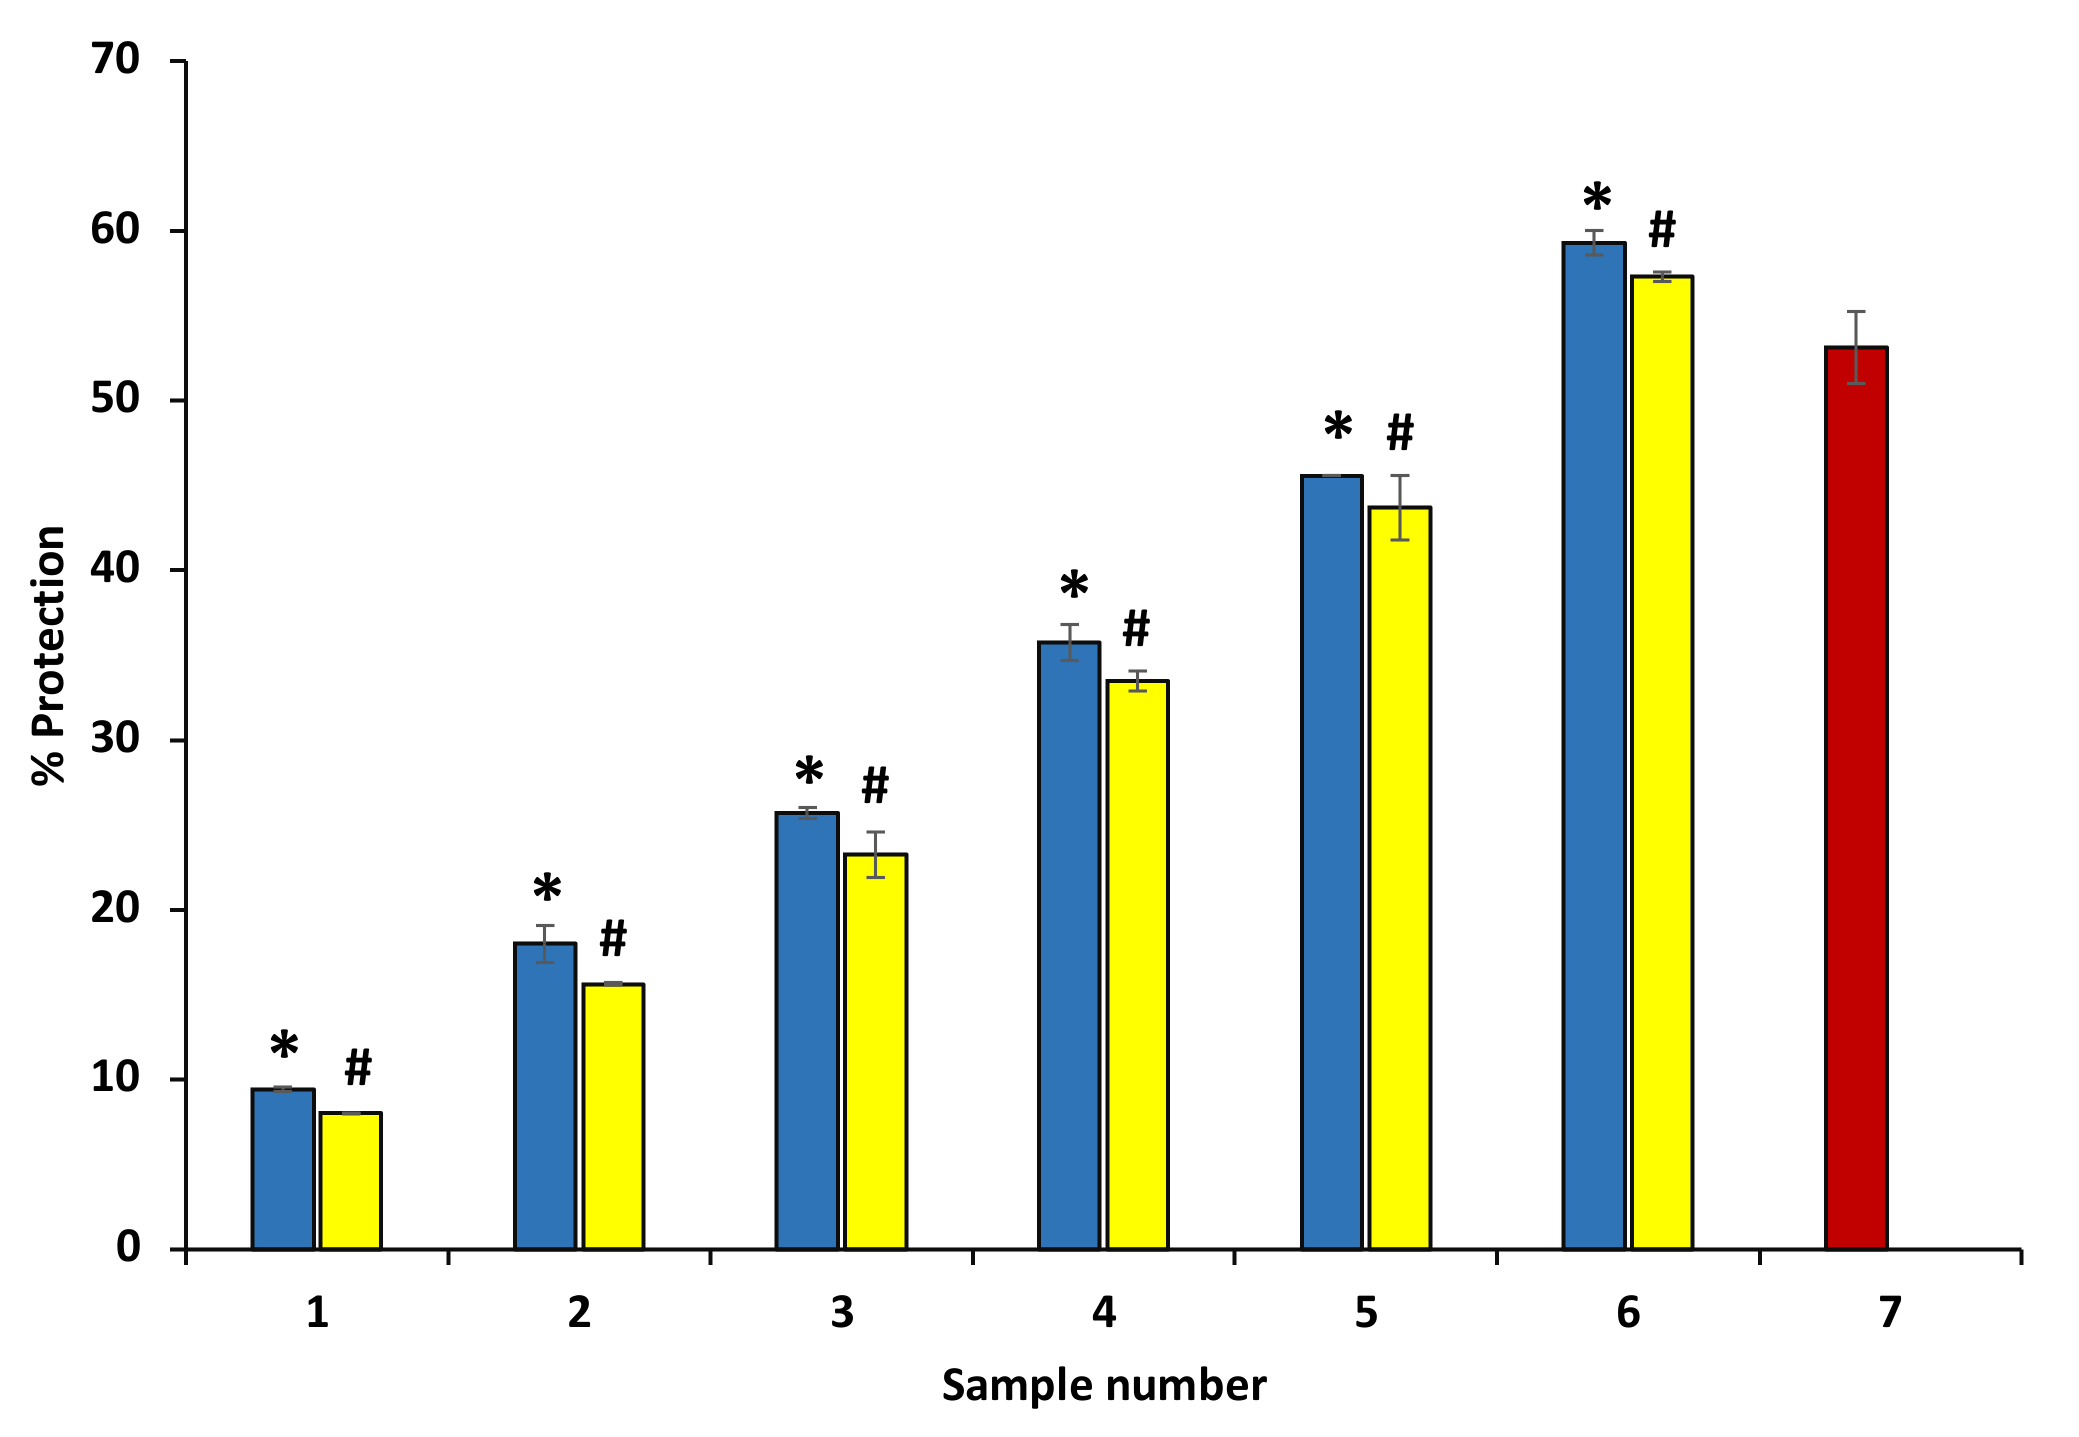
3.7. Inhibition of Egg Albumin Denaturation Inhibition to Evaluate In Vitro Anti-Arthritic Activity of P. emblica and A. indica Extract

The anti-arthritic effect of ethanol extract was appraised against egg albumin denaturation (Figure 6). Plant extracts showed concentration-dependent egg albumin denaturation inhibition activities compared with the standard diclofenac (100–600 μg/mL). This result shows that ethanol extracts are highly effective against heat-induced egg albumin denaturation. Thus, it can be suggested that anti-arthritic potential might be possibly due to their capability to inhibit the heat-induced egg albumin denaturation, and it may be linked with the presence of some antioxidant polyphenolic compounds in extracts. Diclofenac was used as a standard drug in this experiment that displayed maximum inhibition 63.01 ± 0.48%, at the concentration of 200 µg/mL (data are not shown in the graph).

3.8. Membrane Stabilization Test

To establish the mechanism of anti-inflammatory action of P. emblica and A. indica, the stabilization of the RBCs membrane in the presence of extracts was investigated.

3.8.1. Heat-Induced Hemolysis

Ethanol extracts of P. emblica and A. indica were found to have protective effects against heat-induced hemolysis at all concentrations. At the site of inflammation, the mechanism behind the protection from heat-induced hemolysis most probably involves the inhibition of the lysosomal content release within the neutrophils. The inhibition of heat-induced hemolysis was found to increase significantly with an increase in the concentration. The extracts showed the maximum inhibition 54.44 ± 0.31% and 50.21 ± 0.63% at 600 µg/mL (Figure 7) (Table 2). The standard drug aspirin was used as a standard, and it showed significant protection (73.64 ± 0.117%) at a concentration of 200 µg/mL (data are not shown in the graph).
The ethanol extract of P. emblica and A. indica exhibited significant protection ability against hyposaline-induced hemolysis at various concentrations. The osmotic loss has been reported to be caused by hemolysis induced by hypotonicity. Both extracts inhibited the hemolysis mediated by hypotonicity and protected from concentration variable osmotic loss. The data show that these extracts have the potential to stabilize the RBC membrane and are effective membrane stabilizers even at higher concentrations (600 µg/mL) (Figure 8) (Table 3). Diclofenac sodium showed maximum protection of 69.34 ± 0.27% at 200 µg/mL (data are not shown in the graph).

3.8.2. Effect of P. emblica and A. indica Extract on Browning

To understand the mechanism of anti-glycating and AGEs formation inhibition activity, BSA and glucose were incubated together at 37 °C for 15 days in the absence and presence P. emblica and A. indica ethanolic extracts. It was reported that browning intensity was the initial indicator for glycation [35]. Thus, the browning ratio was estimated at 420 nm. The data show that ethanol extract of P. emblica and A. indica inhibited browning (hence, glycation) in a dose-dependent manner. BSA incubated without glucose showed the least browning. It can be suggested that time-variable structural modifications in BSA (incubated in the absence of glucose and extract) might be responsible for the browning in this sample. The ethanol extracts of P. emblica and A. indica extract exhibited 61.29 ± 0.31% and 71.291 ± 0.% at 600 µg/mL browning as matched to glycated BSA incubated in the absence of extract but was incubated with glucose (100% browning) (Figure 9). These results show that the reduction in browning intensity in the existence of extracts was correlated with the lesser development of glycated brown products.

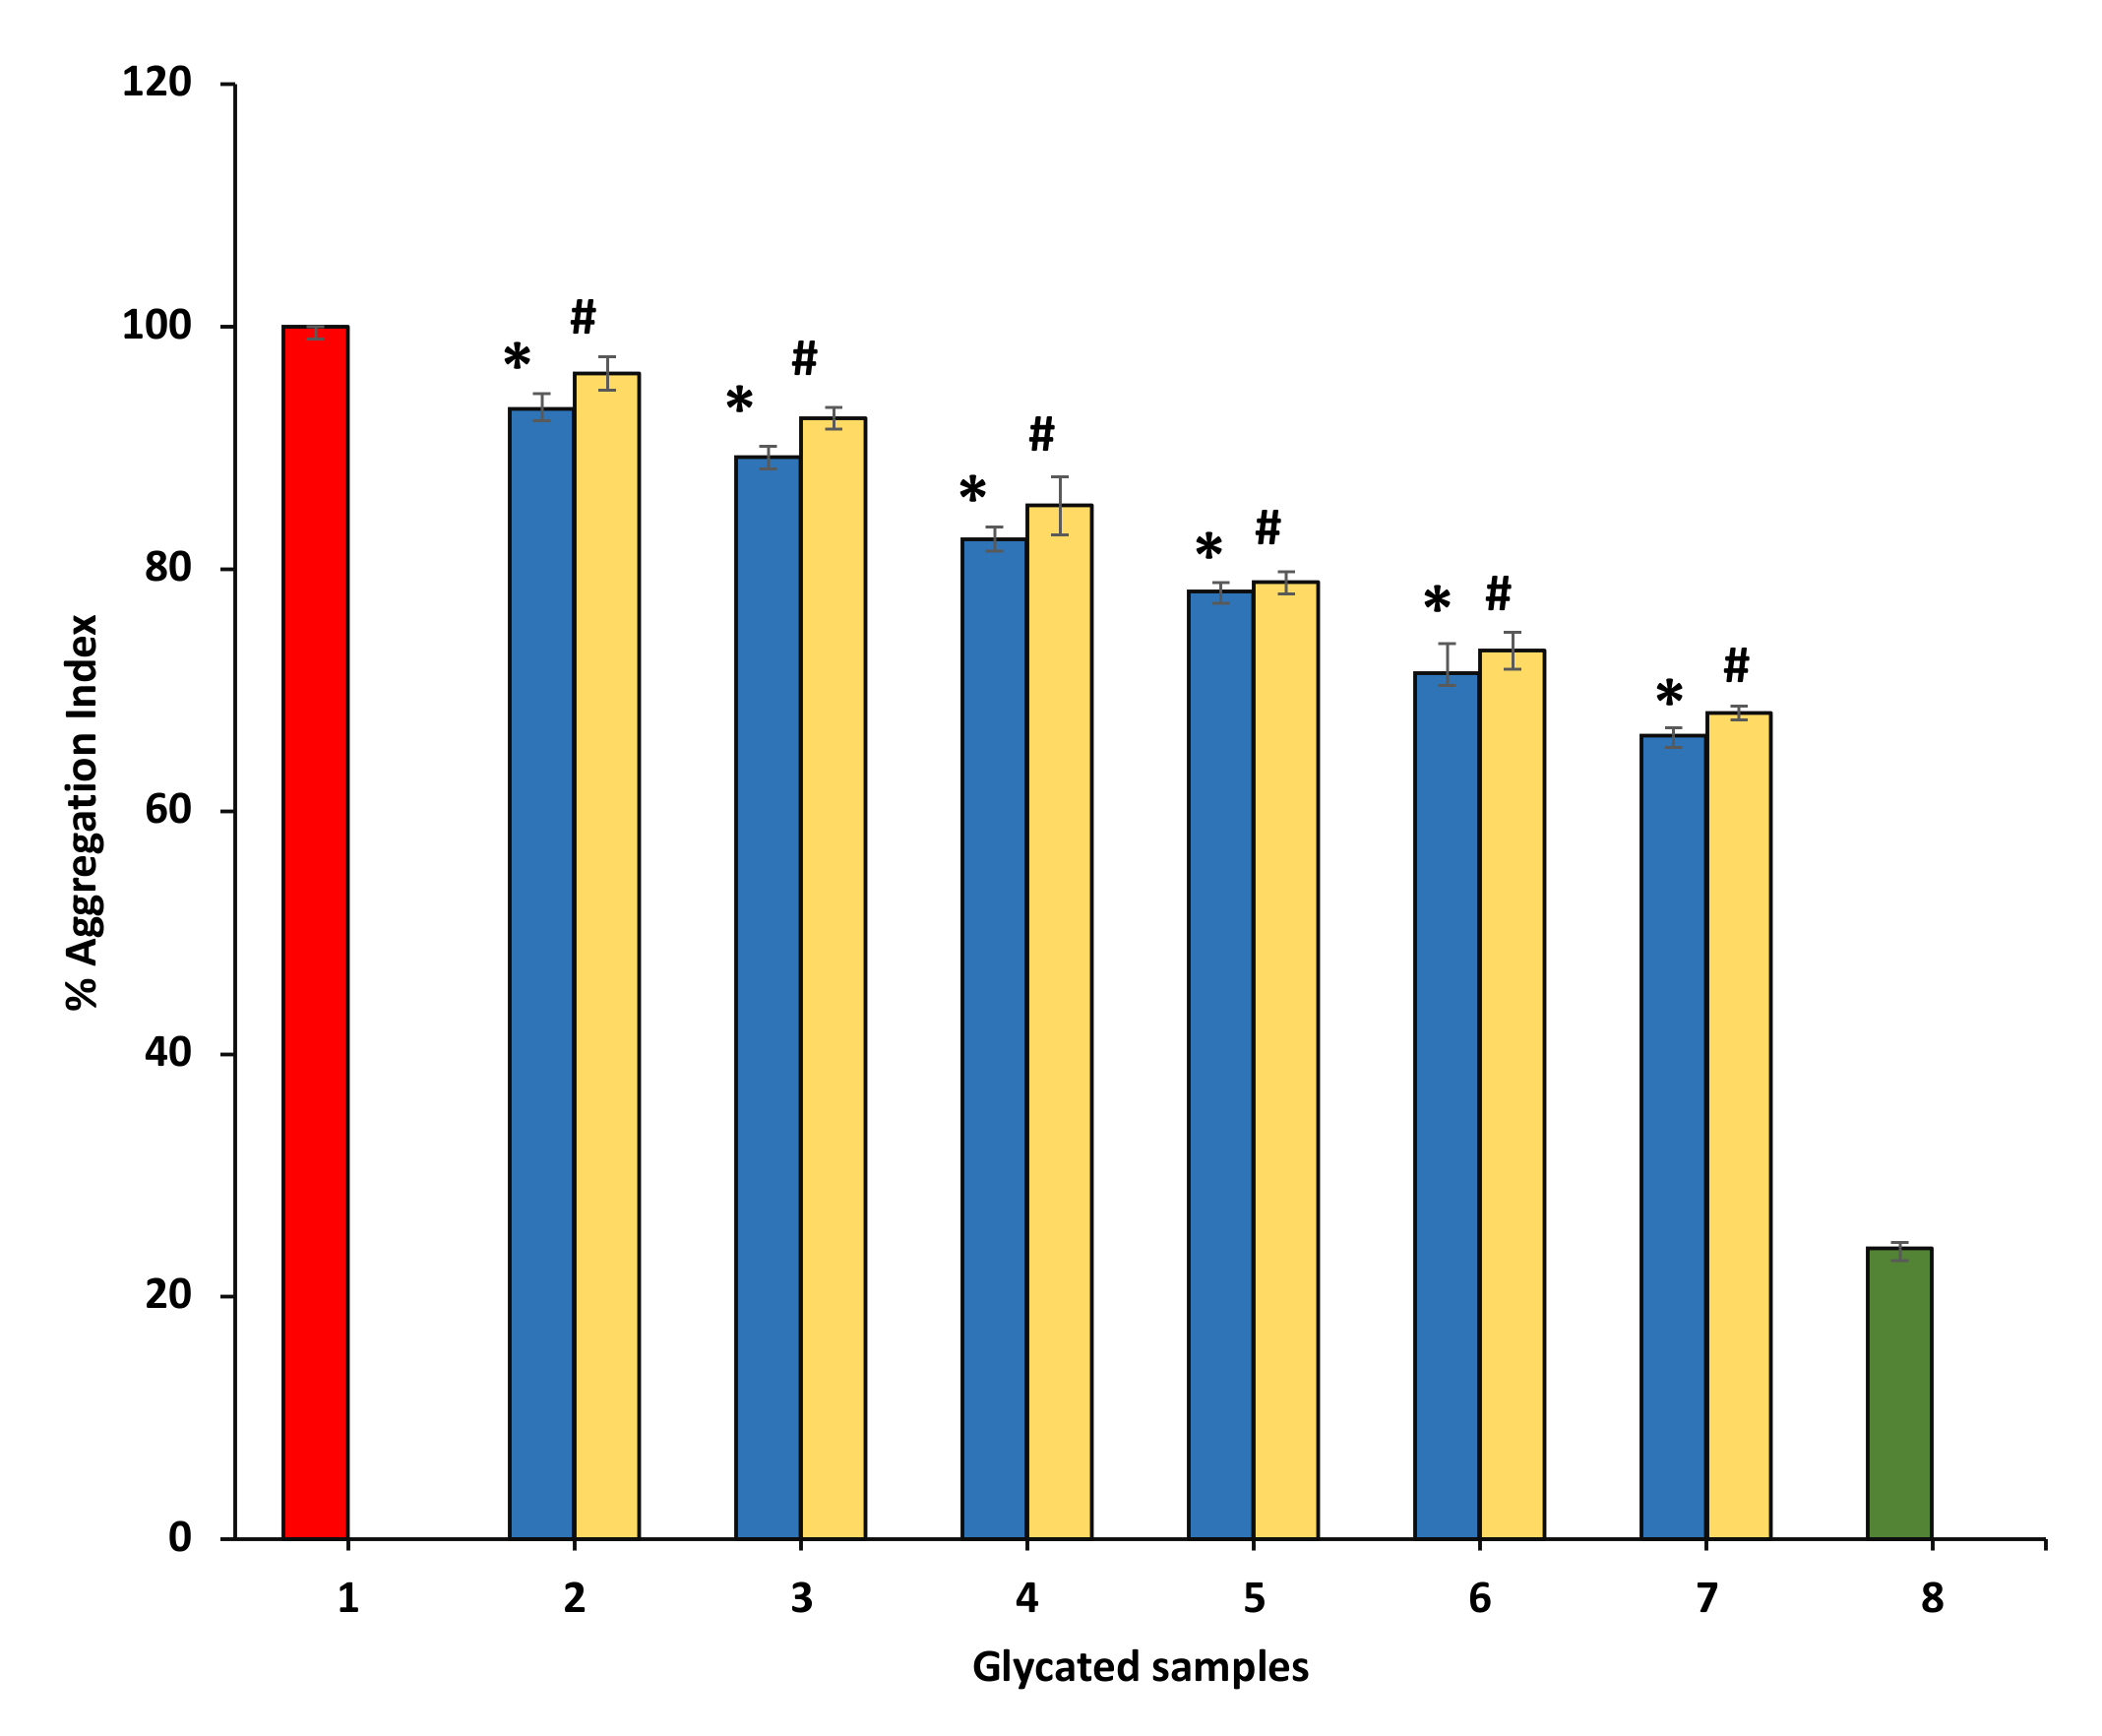
3.8.3. Effect of Ethanol P. emblica and A. indica on Protein Aggregation Index

Many studies have displayed that aggregation of protein might be a significant result of glycation because clusters become formed in glycated proteins samples due to the binding of carbonyl groups with protein. All BSA samples having P. emblica or A. indica extract showed a concentration-dependent significant reduction in aggregation index as compared with glycated BSA (100%) (Figure 10).

3.9. Congo Red Assay

To evaluate the protective potential of P. emblica and A. indica extract on the advance of the fibrillar state, Congo red (CR) was used, which is an amyloid-specific dye. CR binds specifically to the β-sheets of proteins and fixes to the amyloid-beta fibrils. The CR binding is determined by absorbance change at 530 nm. The degree of modifications within the protein secondary structures is evaluated by CR binding assay. The dye binds between the antiparallel β-strands hydrophobic clefts. The CR binding assay is presented in Figure 11. P. emblica (blue column) and A. indica (yellow column) represent a decrease in BSA fibrillation in concentration-dependent manner.

3.10. UV-Absorption Studies

Non-enzymatic glycation of proteins leads to conformational changes in proteins. The absorption peak of BSA incubated with glucose (in the absence of extracts) was very significant at 280 nm as compared to the native BSA (incubated alone). It indicates considerable hyperchromicity (structural changes) as compared to the native structure. The change in microenvironment of amino acid residues, and modification of aromatic residues might be responsible for the observed hyperchromicity at 280 nm of glycated samples [12]. The samples incubated with extracts as well as glucose showed a significant decrease in hyperchromicity with an increase in the concentration of extracts (Figure 12).

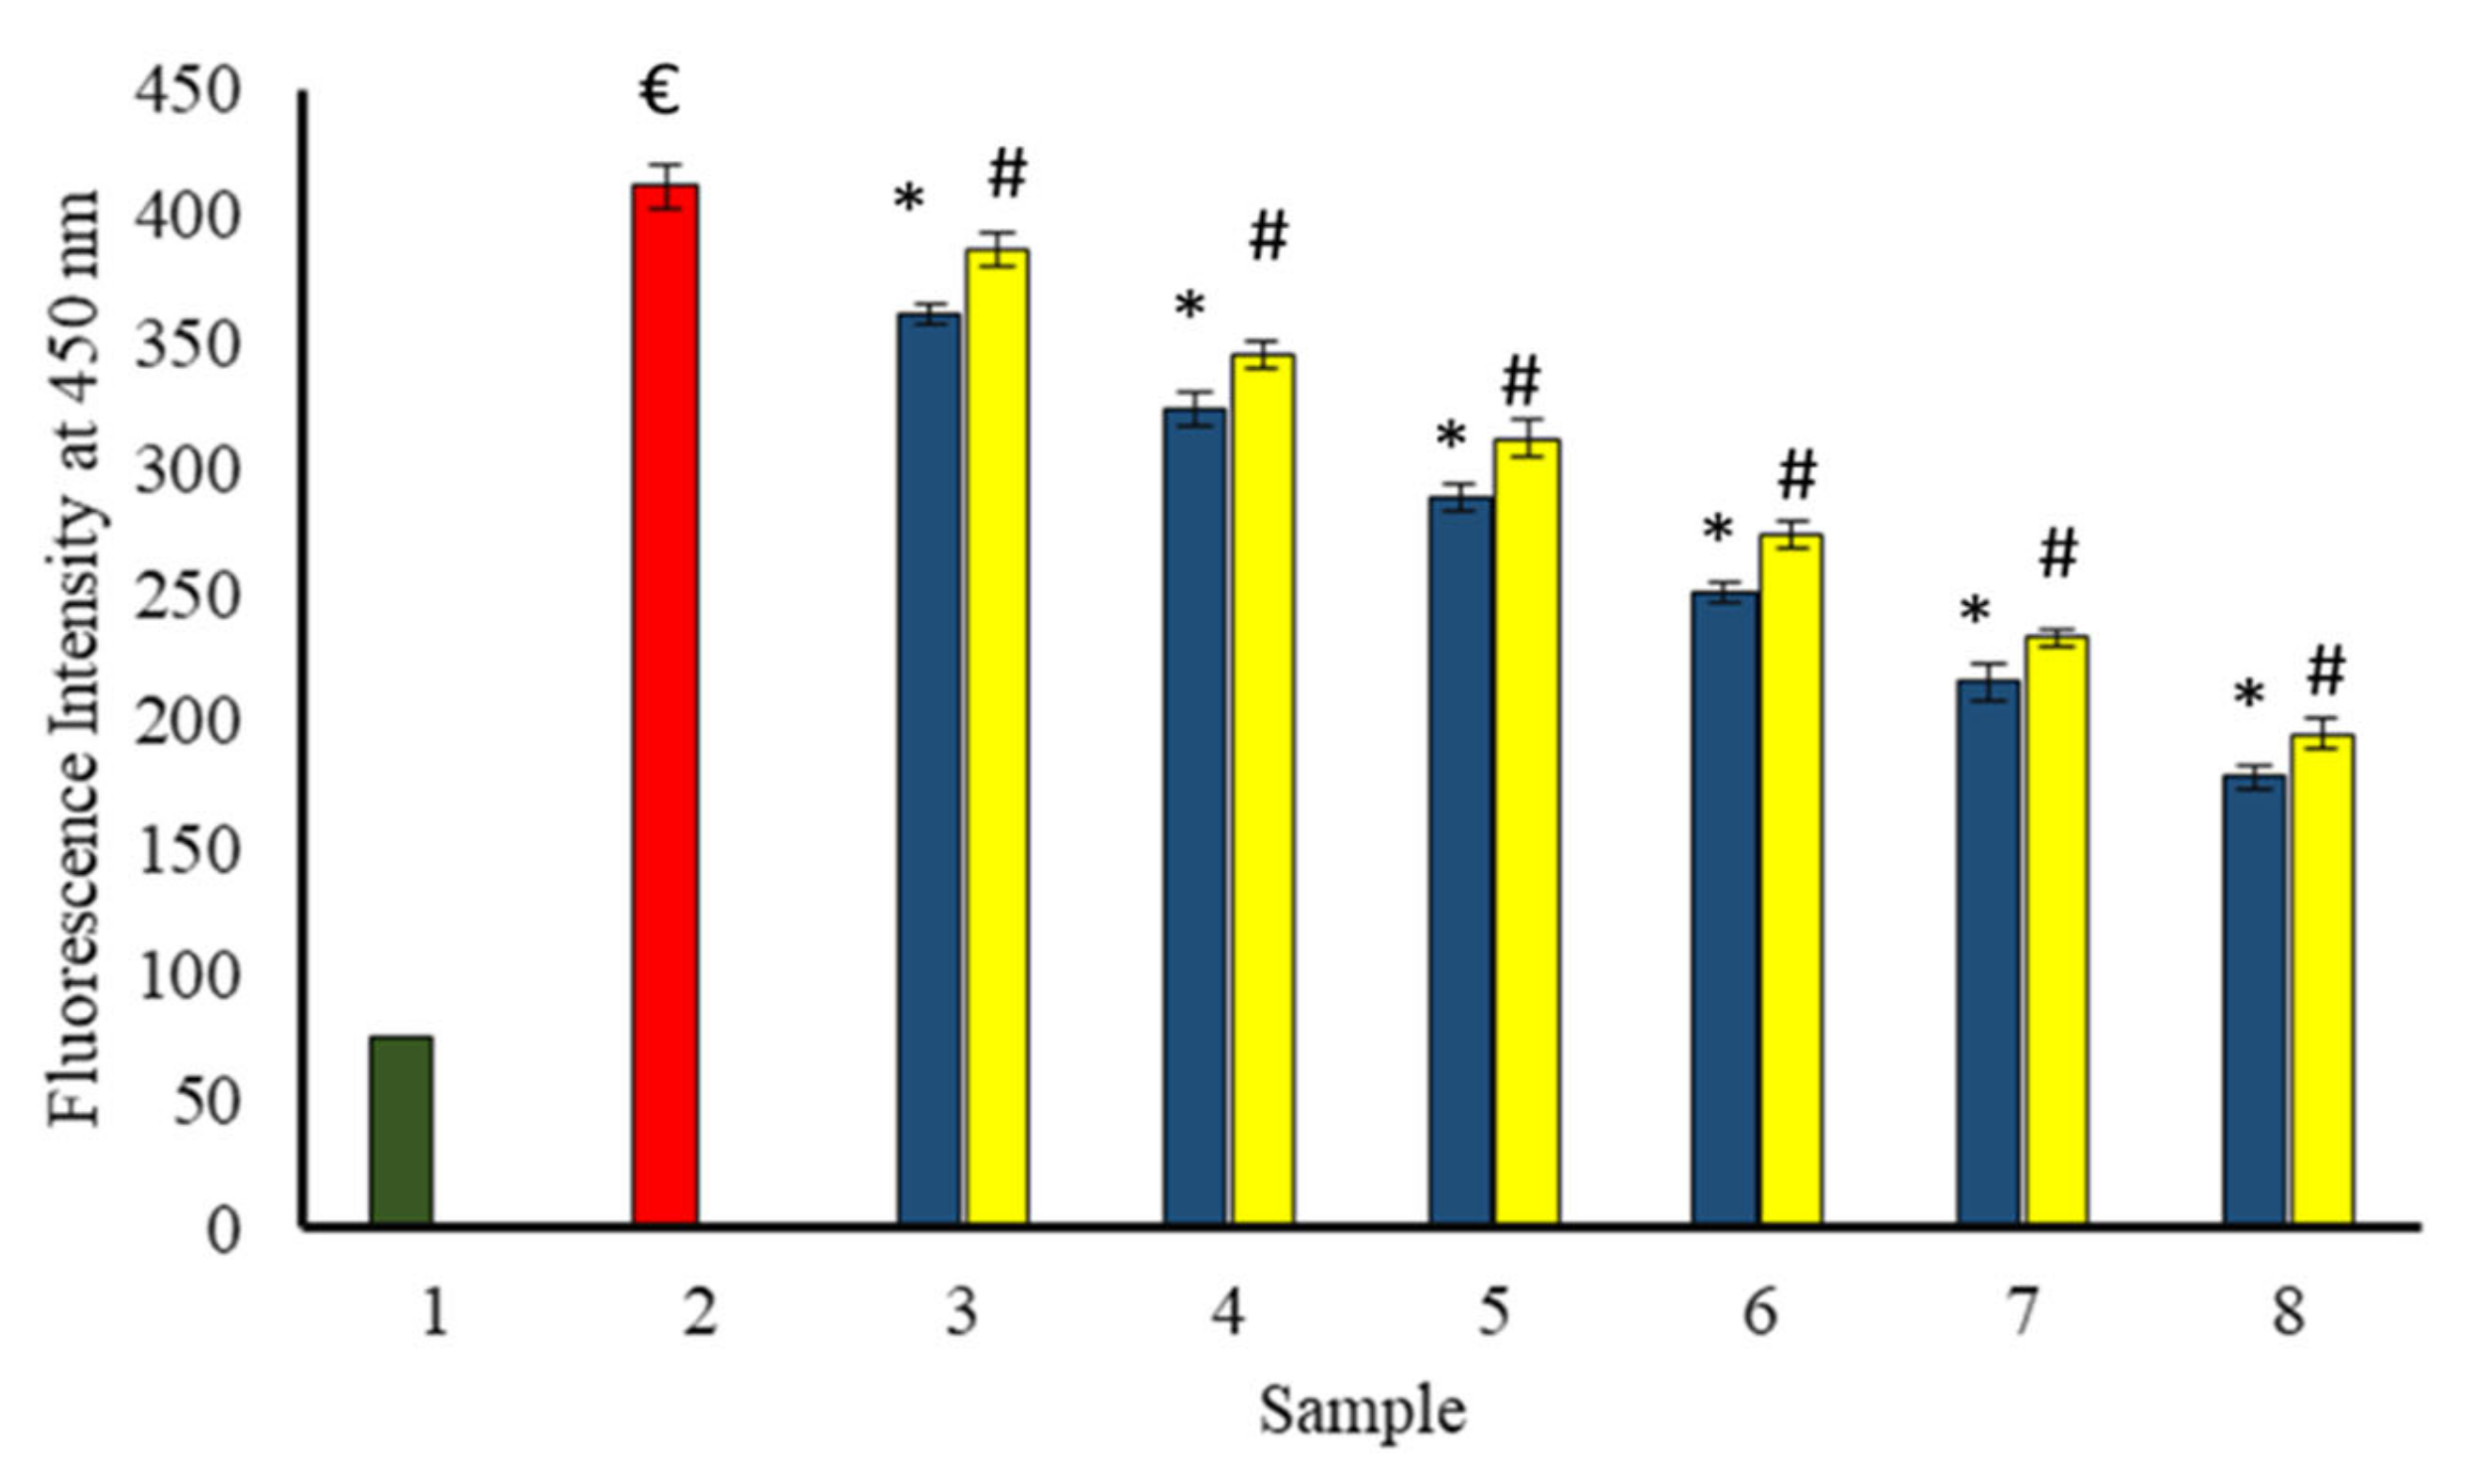
3.11. Effect of Extracts on the Formation of Fluorescent AGEs

We have followed the formation of AGEs in the samples via autofluorescence (Anwar et al. 2017 b). AGEs specific fluorescence of all samples (native or glycated) was measured by exciting at 350 nm using Shimadzu spectrofluorometer (model RF-5301PC). AGEs specific fluorescence was found to be in the wavelength range of 400–480 nm for each sample. The spectra of fluorescence intensity versus wavelength (400–480 nm) were found to be rather broad (data not shown), and that may be due to the presence of a number of different fluorescent compounds being formed during glycation.
A progressive decrease in AGEs specific fluorescence at 450 nm with increasing concentration of extracts was observed in all the samples incubated in the presence of the extracts (Figure 13). BSA incubated with glucose exhibited the highest fluorescence intensity at 450 nm. Therefore, both extracts protected against the formation of AGEs induced by glycation, and the protection increased with increasing concentration of extracts.

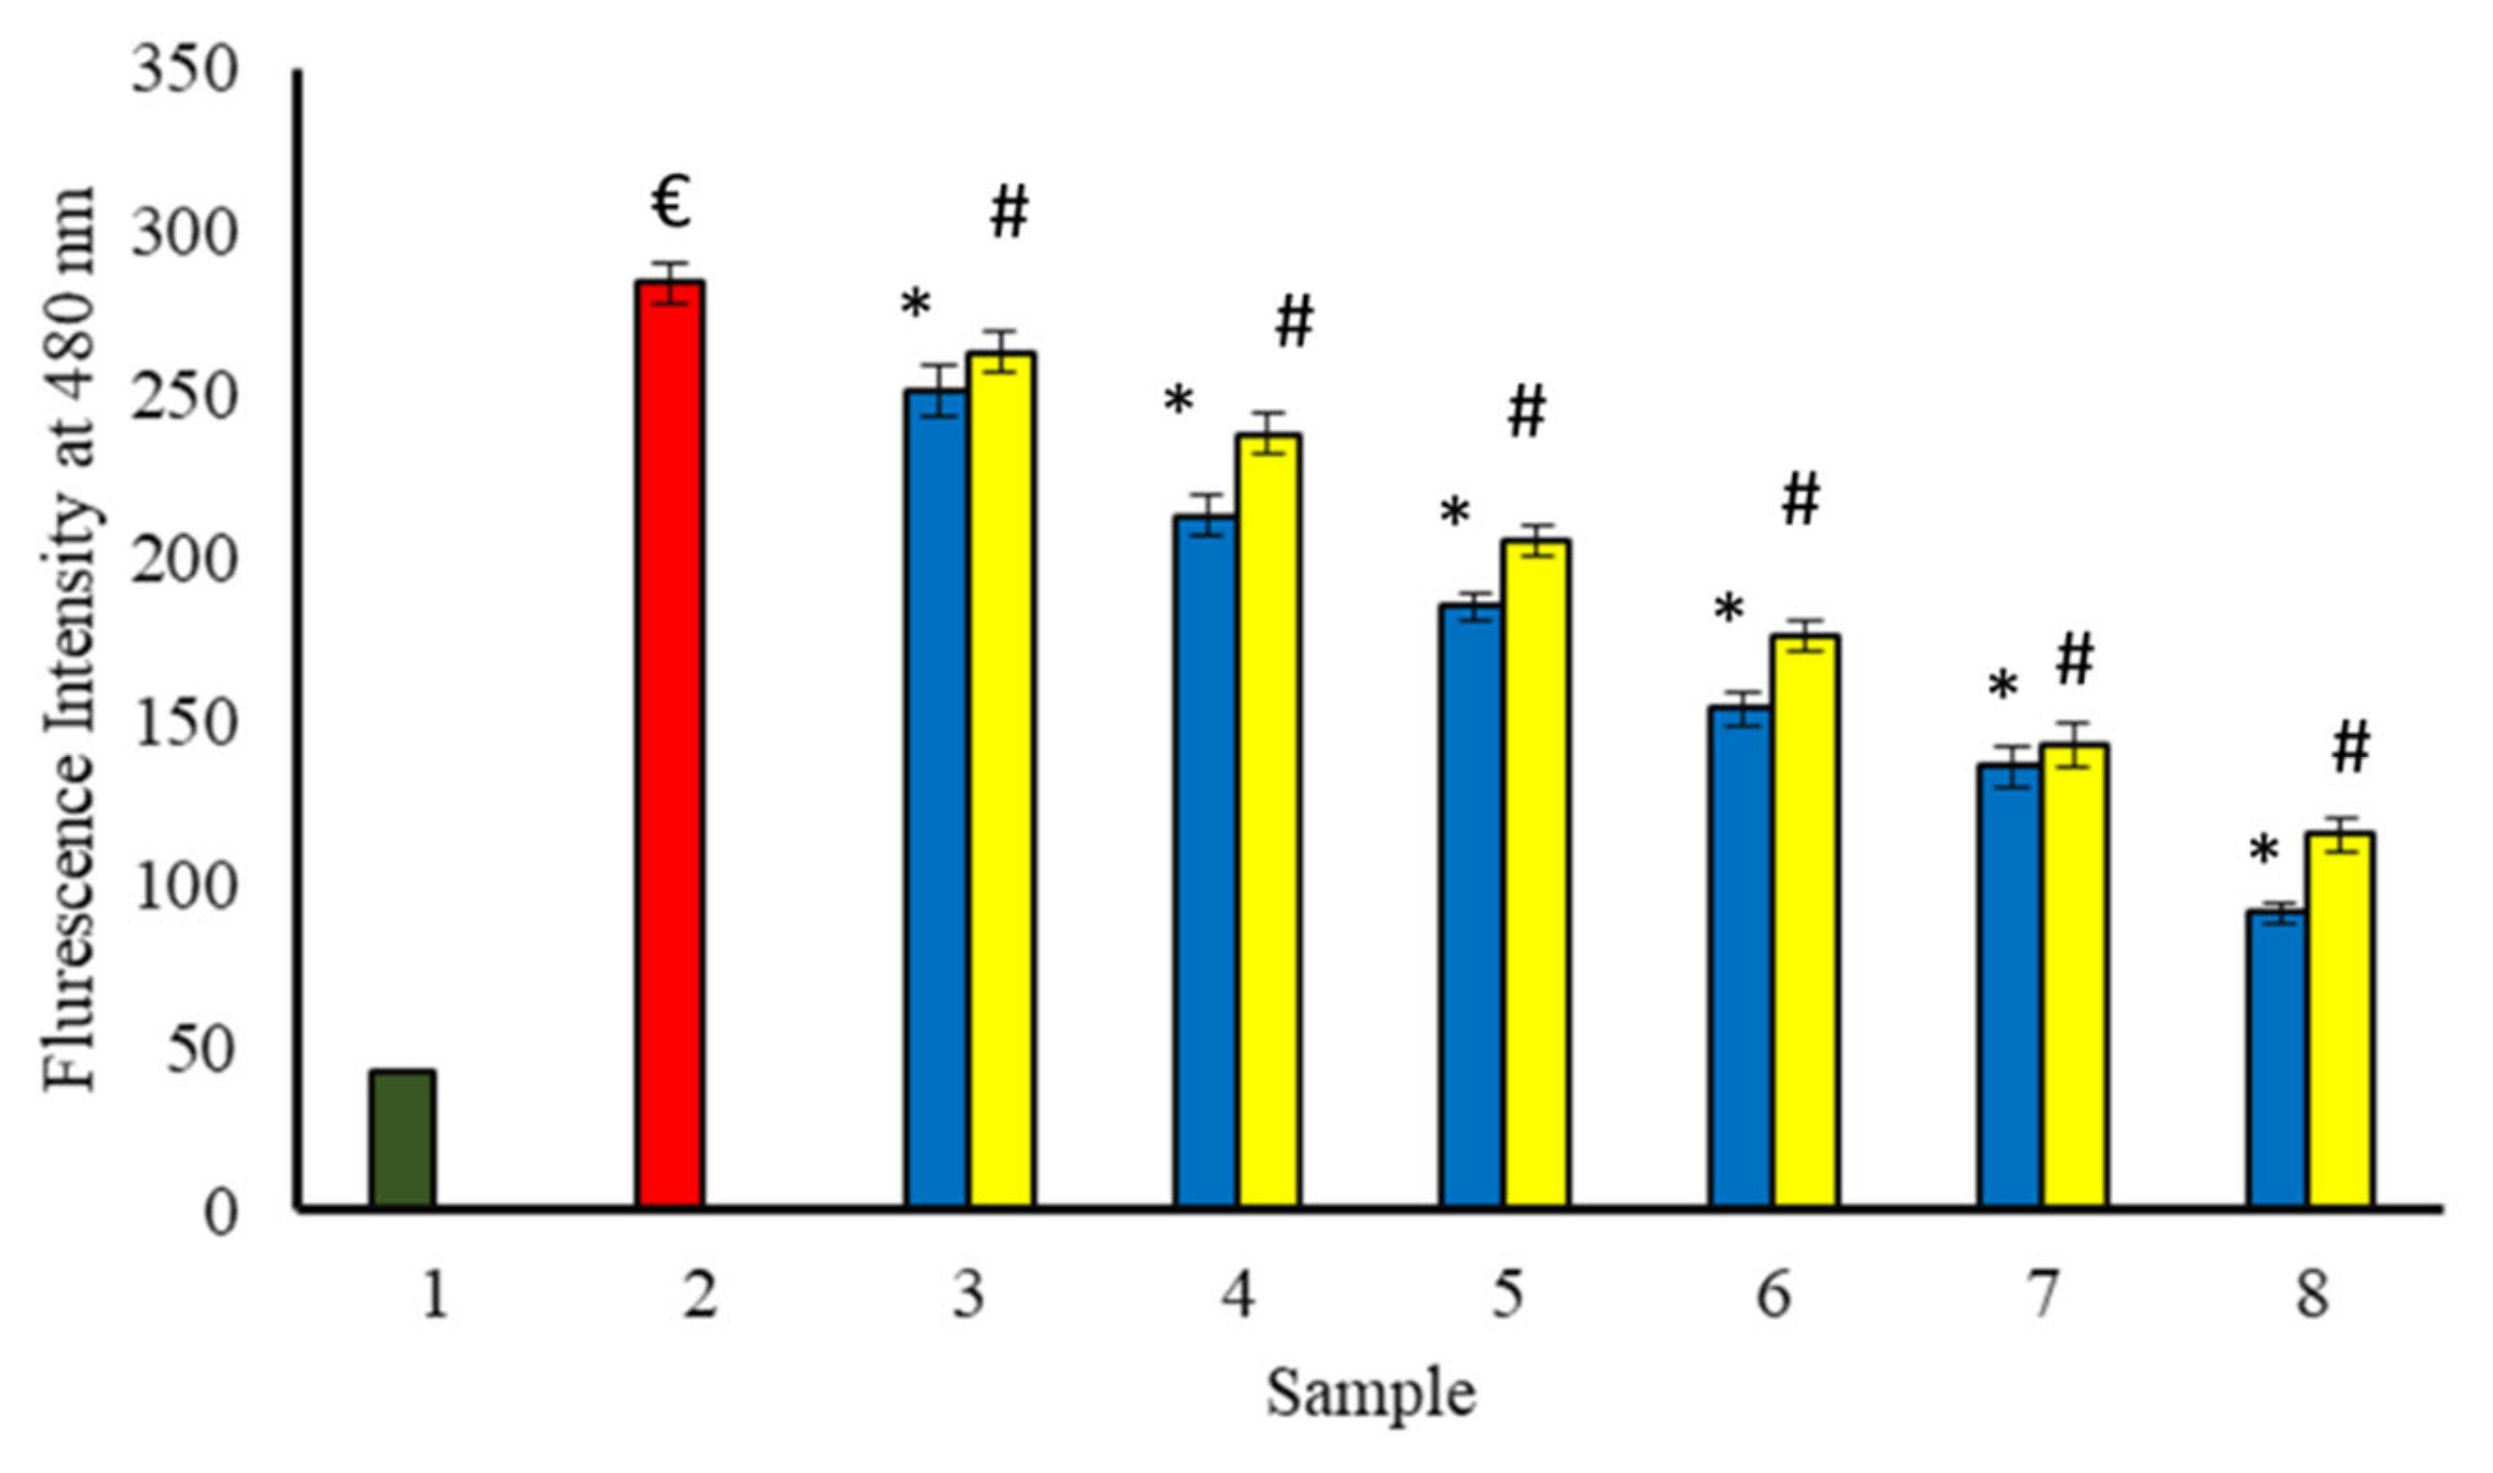
3.12. Effect of Extracts on the Formation of Glycation Induced Fibrils

The fluorescence of benzothiazole dye, i.e., thioflavin T (ThT) was used for the test of amyloid fibrils formation as well as the treatment of amyloid diseases [7]. It has been reported that the interaction of ThT, with the fibrillar structure of proteins, intensifies its fluorescence. However, it is only weakly fluorescent in its free form. Glycation of BSA by glucose leads to ThT enhancement in fluorescence at 480 nm, indicating the formation of fibrils. When BSA is incubated for 15 days at 37 °C with glucose and increasing concentration of extracts (Figure 14), a progressive decrease in ThT fluorescence has been observed. Therefore, extracts might be beneficial in the protection of BSA against glycation-induced fibrils formation.

4. Discussion

P. emblica and A. indica are a rich source of various biologically active compounds. Almost 15 biologically active compounds were reported in P. emblica through Gas Chromatography-Mass Spectrometry (GC-MS) studies. Among these secondary metabolites present were 1,2,3 Benzenetriol, hexadecanoic acid, 9-octadecenoic acid, octadecenoic acid, tetratetracontane, and nonacosane [36]. In addition, several compounds were identified by ethyl acetate extract of phylnthus emblica fruit using GC-MS analysis as having enormous medicinal potentialities [37]. These compounds include Citronellyl propionate, Citronellyl acetate, Capric acid methyl ester, 8-Amino-5-benzyloxy-6-methoxy-4-methylquinoline, Aciphyllene, Beta. –sitosterol, Hexacontanoic acid, 1-pentacontanol, N-Hexadecane, N-Pentadecane, Oleyl alcohol, Beta-sitostero acetate, Campesterol are active component of P emblica [37]. Moreover, several compounds are identified by ethyl acetate extract of phylnthus emblica fruit using GC-MS as Citronellyl propionate, Citronellyl acetate, Capric acid methyl ester, 8-Amino-5-benzyloxy-6-methoxy-4-methylquinoline, Aciphyllene, Beta. –sitosterol, Hexacontanoic acid, 1-pentacontanol, N-Hexadecane, N-Pentadecane, Oleyl alcohol, Beta-sitostero acetate, Campesterol, active components of P emblica [37].
The methanolic extract of the leaves of Azadirachta indica was subjected to GC-MS analysis and different compounds were reported, such as 3,7,11,15-tetramethyl-2-hexadecen-1-ol; 9,12,15-Octadecatrienoic acid; α-Linolenic acid), 8, 11, 14-Eicosatrienoic acid; N-Hexadecanoic acid, and Tridecanoic acid, the major components in the extract. Moreover, the methanolic extract of the leaves of Azadirachta indica by GC-MS analysis reported the compounds such as Phytol, Linolenic acid, Homo-γ-linolenic acid, Palmitic acid, and Tridecylic acid [38].
P. emblica and A. indica have various important medicinal properties and have been extensively studied previously, but there are gaps that still exist, such as examining the properties of these plants in a comprehensive manner and correlating the results about the special properties which it might possess. In this study, our focus was to investigate the anti-proteinase activity, membrane stabilizing potentials, antiglycating properties, and AGEs inhibition properties of these plants. As per our best knowledge, the properties of these plants have not been investigated earlier. However, we found a similarity in the results of our investigated properties of these plants with the reports of previous investigations. In earlier studies, researchers investigated different properties and found a concentration-dependent increase in the biological activities of extract of these plants. Similarly, we found that anti-inflammatory properties such as antihemolytic and anti-proteinase action, inhibition of protein denaturation, antiglycating, and anti-AGEs formation properties were found to be increased in a dose-dependent manner.
Oxidative stress and ROS induce the oxidative destruction of nucleic acids, protein, lipids, lipoproteins, carbohydrates, and connective tissue macromolecules [39]. The imbalance in the cellular oxidants production and their removal imposes oxidative stress. Several human diseases, especially heart disease, aging, arteriosclerosis, stroke, cancer, diabetes, inflammation, cataract, arthritis, muscular degeneration, and impaired wound healing, etc., are known to be associated with this damage [29]. It has been suggested that antioxidants can be better therapy for cancer prevention and treatment because of their ability to modulate the intracellular ROS levels [4]. Natural products containing phenolic compounds are very beneficial for human health because they can reduce and scavenge free radicals such as ROS [40]. There are several incidences demonstrating the free radical scavenging ability of flavonoids as well as their ability to increase the antioxidant enzyme activities significantly [41]. Our study has confirmed the presence of polyphenolic compounds and flavonoids in P. emblica and A. indica. In our investigation, the extracts of P. emblica and A. indica showed strong antioxidant activity by reduction of hydrogen peroxide, and by DPPH assay. Thus, the present study can suggest that the antioxidant potential of P. emblica and A. indica might be due to the presence of flavonoids and other polyphenolic compounds. Besides, ROS and oxidative stress have been proven to have a vital role in the pathophysiology of various diseases. Therefore, we further propose that the antioxidant potential of P. emblica and A. indica extracts might be beneficial against the treatment and management of various health ailments.
Hydroxyl free radicals are one of the leading ROS and are found to be involved in various deadly diseases such as cancer. It has already been reported that the formation of hydroxyl free radicals due to the disintegration of H2O2 in the blood results in DNA damage and induction of carcinogenesis. Besides, hydroxyl radicals are also capable of activating oncogenes, including C-Raf-1 and K-ras [42]. In our study, P. emblica and A. indica extracts displayed strong H2O2 scavenging activity, which may be due to the presence of polyphenolic compounds. Based on our data, it can be suggested that these plant extracts can be used as a therapeutic strategy against hydroxyl radical-induced oncogenesis. Inflammation progression is a primary physiologic defense mechanism against different factors such as burn, infection, allergens, toxic chemicals, and other stimuli [43]. However, inflammation has been known to be involved in liver tissue damage, and severe fibrinogenesis, non-alcoholic fatty liver diseases, and hepatocellular carcinoma. Hence, anti-inflammatory approaches can be therapeutic strategies for tumor prevention and treatment [6]. One of the significant causes for the development of inflammatory response is the denaturation of biological proteins and subsequent inactivation [27]. Besides, inflammation is also caused by the destruction of adjacent healthy tissues due to the release of histamine by damaged tissues. Thus, the protecting ability of a drug against heat-induced hemolysis and its potential to stabilize the human red blood cell membrane can be suggested to be linked with their anti-inflammatory activity [2,44]. Besides, there are some enzymes called proteinase that is capable of inducing tissue damage. The anti-proteinase activity can be included as the anti-inflammatory property of a drug [2,45]. Our study shows that P. emblica and A. indica extracts have excellent anti-inflammatory properties at 600 µg/mL concentration. Moreover, the anti-inflammatory ability of P. emblica and A. indica extract may be attributed to the presence of medicinally active flavonoids, as suggested by Havsteen [46].
The matrix metalloproteins activation by ROS leads to severe damage to tissues such as collagen, as found in various arthritic reactions [28]. Denaturation of proteins results in the formation of autoantibodies in rheumatoid arthritis (RA), auto-antigens become accumulated in synovial joints leading to inflammation of the joint [47]. To investigate the anti-arthritic activity of P. emblica and A. indica extract, we induced the denaturation of egg albumin in the absence and presence of extracts separately. Our data showed that P. emblica and A. indica extract inhibited the heat-induced denaturation of egg albumin. The ability of these extracts to scavenge ROS might be responsible for the protection against heat-induced denaturation of egg albumin and the production of autoantibodies. This suggests that P. emblica and A. indica are anti-arthritic in nature, and the inclusion of these plants as a supplement can reduce pain and inflammation occurring in patients suffering from rheumatoid arthritis.
Glycation is a chief contributor to AGEs formation [13] and diabetic complications [7]. It has already been shown that the structure, biological function, and stability of a protein are severely affected by glycation and aggregation induced by glycation [19]. In addition, severe erythrocyte damage induced by the accumulation of AGEs, oxidative stress, and hyperglycemia further leads towards hemolysis [39]. It may pursue the destruction of the membrane and lipid peroxidation. It further induces tissue damage and inflammatory response. Inflammatory processes and diabetes mellitus and its complications are interlinked [48]. The formation of AGEs, increased production of ROS, oxidative stress, and damaging of cell membranes are attributed to diabetes, and its complications [49]. Additionally, many reports indicate the role of AGEs in cell survival, proliferation, invasion, and metastasis of tumor cells, as well as genotoxicity. Henceforth, any strategy emphasizing the inhibition of glycation and AGEs formation can be beneficial in the prevention and treatment of diabetic complications [9], and cancer [17]. In the current investigation, P. emblica and A. indica extract were found to inhibit AGEs formation and glycation in a dose-dependent manner.
BSA incubated with glucose had significantly higher absorbance at 280 nm than BSA incubated alone. However, when BSA was incubated with glucose and extracts, the absorbance dropped, and this absorbance was shown to decrease progressively as the quantity of extracts increased. As a result, extracts shielded the protein from structural changes to some extent. Moreover, when extract concentration increased, the specific fluorescence of AGEs at 450 nm decreased. When compared to BSA incubated with glucose, the control (BSA incubated alone) displayed negligible AGEs specific fluorescence intensity at 450 nm. As a result, extracts protected the enzyme against the production of AGEs caused by glycation with glucose, and the level of protection increased. Our ThT specific fluorescence investigation revealed that extracts protected the BSA somewhat to an extent against fibril formation caused by glycation with glucose and that the protection improved with increasing extract content. As a result, a biophysical study once again demonstrates that extracts protected the protein against structural alterations and AGEs formation caused by glycation with glucose, and the protection increased with an increase in the concentration of the extracts.
Perhaps, the presence of polyphenolic compounds might be responsible for the anti-glycating and anti-AGEs formation activities of these extracts, and there is a good correlation between antioxidant activity, polyphenolic content, and inhibition of AGEs development [2]. In 2004, Lieu suggested the preventive role of flavonoids and other polyphenolic compounds against cancer development [50]. Similar to these reports, our study suggests that P. emblica and A. indica are rich in flavonoids and other polyphenolic compounds that might be a possible contributor to the therapeutic capacity of these extracts. Thus, the present study proposes that P. emblica and A. indica extract can be utilized in the development of several herbal formulations for the prevention and treatment of different health disorders such as inflammation, arthritis, diabetes, and other oxidative stress-induced disorders such as cancer.

5. Conclusions

Medicinal herbs have a prominent influence on the prevention of disease and its development. The administration of these plants and their natural products could be included in any current prevention and treatment strategy. Our in vitro study demonstrated the high phenolic and flavonoid content, excellent free radical scavenging potential, and antioxidant activity of ethanol extracts of P. emblica and A. indica. Further, P. emblica and A. indica exhibited high anti-inflammatory, anti-arthritic, membrane stabilizing, anti-glycating, and anti-AGE formation activities. The biophysical study, including UV-absorption study, AGEs specific fluorescence, and ThT fluorescence study, confirmed the AGEs formation was inhibiting properties of both extracts. As a result, it may be inferred that both plants may be a substantial source of various active chemicals, all of which may contribute to their synergistic effects. To effectively analyze and quantify these impacts, a different research approach is required. We can suggest that natural chemicals with high antioxidant capacity may contribute to the therapeutic qualities of these plants and may act as key-feature of modern multi-potent remedies. For this purpose, well-designed animal and clinical studies are needed for the verification of the clinical benefits of combinations of these plants extract for better quality control of a combination of these plants.

Author Contributions

Conceptualization, S.A. and A.H.R.; Funding acquisition, F.M.A., A.A. and S.A.A.; Investigation, M.A.A.; Methodology, M.A.A. and S.A.; Supervision, M.A.A., A.A., A.A.K. and K.S.A.; Writing—original draft, S.A. and A.H.R.; Writing—review & editing, M.A.A., F.M.A., H.A., A.A., A.A.K., K.S.A., S.A.A. and A.H.R. All authors have read and agreed to the published version of the manuscript.

Funding

This research received no external funding.

Institutional Review Board Statement

Not applicable.

Informed Consent Statement

Not applicable.

Data Availability Statement

The data used to support the findings of this study are included within the article.

Acknowledgments

The researchers would like to thank the Deanship of Scientific Research, Qassim University for funding the publication of this project.

Conflicts of Interest

The authors declare no conflict of interest for this work.

References

  1. Ajith, T.A.; Janardhanan, K.K. Indian medicinal mushrooms as a source of antioxidant and antitumor agents. J. Clin. Biochem. Nutr. 2007, 40, 157–162. [Google Scholar] [CrossRef] [Green Version]
  2. Anwar, S.; Almatroudi, A.; Allemailem, K.S.; Jacob Joseph, R.; Khan, A.A.; Rahmani, A.H. Protective Effects of Ginger Extract against Glycation and Oxidative Stress-Induced Health Complications: An In Vitro Study. Processes 2020, 8, 468. [Google Scholar] [CrossRef]
  3. Saha, S.K.; Lee, S.B.; Won, J.; Choi, H.Y.; Kim, K.; Yang, G.M.; Dayem, A.A.; Cho, S.G. Correlation between Oxidative Stress, Nutrition, and Cancer Initiation. Int. J. Mol. Sci. 2017, 18, 1544. [Google Scholar] [CrossRef] [PubMed] [Green Version]
  4. Storz, P. Oxidative Stress in Cancer. In Oxidative Stress and Redox Regulation; Jakob, U., Reichmann, D., Eds.; Springer: Berlin/Heidelberg, Germany, 2013; pp. 427–448. [Google Scholar]
  5. Mittal, M.; Siddiqui, M.R.; Tran, K.; Reddy, S.P.; Malik, A.B. Reactive oxygen species in inflammation and tissue injury. Antiox Redox Signal. 2014, 20, 1126–1167. [Google Scholar] [CrossRef] [PubMed] [Green Version]
  6. Coussens, L.M.; Werb, Z. Inflammation and cancer. Nature 2002, 420, 860–867. [Google Scholar] [CrossRef] [PubMed]
  7. Anwar, S.; Khan, M.A.; Sadaf, A.; Younus, H. A structural study on the protection of glycation of superoxide dismutase by thymoquinone. Int. J. Biol. Macromol. 2014, 69, 476–481. [Google Scholar] [CrossRef]
  8. Khan, M.A.; Anwar, S.; Alijarbou, A.A.; Al-Orainy, M.; Aldebasi, Y.H.; Islam, S.; Younus, H. Protective effect of thymoquinone on glucose or methylglyoxal-induced glycation of superoxide dismutase. Int J Biol Macromol. 2014, 65, 16–20. [Google Scholar] [CrossRef]
  9. Younus, H.; Anwar, S. Prevention of non-enzymatic glycosylation (glycation): Implication in the treatment of diabetic complication. Int. J. Health Sci. 2016, 10, 261–277. [Google Scholar] [CrossRef]
  10. Younus, H.; Anwar, S. Antiglycating activity of Aloe vera gel extract and its active component aloin. Proteins Proteom. 2018, 9, 115–125. [Google Scholar]
  11. Anwar, S.; Younus, H. Inhibitory effect of alliin from Allium sativum on the glycation of superoxide dismutase. Int. J. Biol. Macromol. 2017, 103, 182–193. [Google Scholar] [CrossRef]
  12. Anwar, S.; Younus, H. Antiglycating potential of ellagic acid against glucose and methylglyoxal induced glycation of superoxide dismutase. J. Protein Proteom. 2017, 8, 1–12. [Google Scholar]
  13. Anwar, S.; Khan, S.; Almatroudi, A.; Khan, A.A.; Alsahli, M.A.; Almatroodi, S.A.; Rahmani, A.H. A review on mechanism of inhibition of advanced glycation end products formation by plant derived polyphenolic compounds. Mol. Biol. Rep. 2021, 48, 787–805. [Google Scholar] [CrossRef] [PubMed]
  14. Ansari, N.A.; Rasheed, Z. Non-Enzymatic glycation of proteins: From Diabetes and cancer. Biochem. Suppl. Ser. B Biomed. Chem. 2009, 56, 168–178. [Google Scholar] [CrossRef]
  15. Harris, C.S.; Beaulieu, L.-P.; Fraser, M.-H.; McIntyre, K.L.; Owen, P.L.; Martineau, L.C.; Cuerrier, A.; Johns, T.; Haddad, P.S.; Bennett, S.A.L.; et al. Inhibition of advanced glycation end product formation by medicinal plant extracts correlates with phenolic metabolites and antioxidant activity. Planta Med. 2011, 77, 196–204. [Google Scholar] [CrossRef] [PubMed]
  16. Schröter, D.; Höhn, A. Role of Advanced Glycation End Products in Carcinogenesis and their Therapeutic Implications. Curr. Pharm. Des. 2018, 24, 5245–5251. [Google Scholar] [CrossRef]
  17. Turner, D.P. Advanced glycation end-products: A biological consequence of lifestyle contributing to cancer disparity. Cancer Res. 2015, 75, 1925–1929. [Google Scholar] [CrossRef] [Green Version]
  18. Gangemi, S.; Allegra, A.; Aguennouz, M.; Alonci, A.; Speciale, A.; Cannavò, A.; Cristani, M.; Russo, S.; Spatari, G.; Alibrandi, A.; et al. Musolino, relationship between advanced oxidation protein products, advanced glycation end products, and S-nitrosylated proteins with biological risk and MDR-1 polymorphisms in patients affected by B-chronic lymphocytic leukemia. Cancer Investig. 2012, 30, 20–26. [Google Scholar] [CrossRef]
  19. Khan, M.S.; Tabrez, S.; Al-Okail, M.S.; Shaik, G.M.; Bhat, S.A.; Rehman, T.M.; Husain, F.M.; Al Ajmi, M.F. Non-enzymatic glycation of protein induces cancer cell proliferation and its inhibition by quercetin: Spectroscopic, cytotoxicity and molecular docking studies. J. Biomol. Struct. Dyn. 2020, 39, 777–786. [Google Scholar] [CrossRef]
  20. Cragg GM, Newman DJ. Plants as a source of anti-cancer agents. J. Ethnopharmacol. 2005, 100, 72–79. [CrossRef] [Green Version]
  21. Sripanidkulchai, B.; Fangkrathok, N. Antioxidant, antimutagenic and antibacterial activities of extracts from Phyllanthus emblica branches. Songklanakarin J. Sci. Technol. 2014, 36, 669–674. [Google Scholar]
  22. Kumar, V.S.; Navaratnam, V. Neem (Azadirachta indica): Prehistory to contemporary medicinal uses to humankind. Asian Pac. J. Trop. Biomed. 2013, 3, 505–514. [Google Scholar] [CrossRef] [Green Version]
  23. Ordonez, A.; Gomez, J.; Vattuone, M. Antioxidant activities of Sechium edule (Jacq.) Swartz extracts. Food Chem. 2006, 97, 452–458. [Google Scholar] [CrossRef]
  24. Taie, H.A.A.; Salama, Z.A.-E.R.; Radwan, S. Potential activity of basil plants as a source of antioxidants and anticancer agents as affected by organic and bio-organic fertilization. Not. Bot. Horti. Agrobo. 2010, 38, 119127. [Google Scholar]
  25. Bhalodia, N.R.; Nariya, P.B.; Acharya, R.N.; Shukla, V.J. In vitro antioxidant activity of hydro alcoholic extract from the fruit pulp of Cassia fistula Linn. Ayu 2013, 34, 209–214. [Google Scholar] [CrossRef] [Green Version]
  26. Ruch, R.J.; Cheng, S.J.; Klaunig, J.E. Prevention of cytotoxicity and inhibition of intercellular communication by antioxidant catechins isolated from Chinese green tea. Carcinogeesis 1989, 10, 1003–1008. [Google Scholar] [CrossRef]
  27. Mizushima, Y.; Kobayashi, M. Interaction of anti-inflammatory drugs with serum preoteins, especially with some biologically active proteins. J. Pharma. Pharmacol. 1968, 20, 169–173. [Google Scholar] [CrossRef]
  28. Sakat, S.S.; Juvekar, A.R.; Gambhire, M.N. In Vitro antioxidant and anti-inflammatory activity of methanol extract of Oxalis corniculata linn. Int. J. Pharm. Pharmaceut. Sci. 2010, 2, 146–155. [Google Scholar]
  29. Oyedepo, O.O.; Femurewa, A.J. Anti-protease and membrane stabilizing activities of extracts of Fagra zanthoxiloides, Olax subscorpioides and Tetrapleura tetraptera. Int. J. Pharmacong. 1995, 33, 65–69. [Google Scholar]
  30. Chanda, S.; Juvekar, A. In vitro anti-inflammatory activity of syringic acid. Int J Pharm Pharm Sci. 2019, 11, 71–73. [Google Scholar] [CrossRef]
  31. Brownlee, M.; Vlassara, H.; Kooney, A.; Ulrich, P.; Cerami, A. Aminoguanidine prevents diabetes induced arterial wall protein cross-linking. Science 1968, 232, 1629–1632. [Google Scholar] [CrossRef]
  32. Kumar, D.; Ali, A. Antiglycation and antiaggregation potential of thymoquinone. Nat. Volatiles Essent. Oils. 2019, 6, 25–33. [Google Scholar]
  33. Klunk, W.E.; Jacob, R.F.; Mason, R.P. Quantifying amyloid beta-peptide (Abeta) aggregation using the Congo red-Abeta (CR-abeta) spectrophotometric assay. Anal Biochem. 1999, 266, 66–76. [Google Scholar] [CrossRef]
  34. Dias, M.I.; Sousa, M.J.; Alves, R.C.; Ferreira, I.C.F.R. Exploring plant tissue culture to improve the production of phenolic compounds: A review. Ind. Crop. Prod. 2016, 82, 9–12. [Google Scholar] [CrossRef] [Green Version]
  35. Ajandouz, E.H.; Tchiakpe, L.S.; Ore, F.D.; Benajiba, A.; Puigserver, A. Effect of pH on caramelization and Maillard reaction kinetics in fructose-lysine model systems. J. Food Sci. 2011, 66, 926–931. [Google Scholar] [CrossRef]
  36. Nair, A.; Balasaravanan, T.; Jadhav, S.; Mohan, V.; Kumar, C. Harnessing the antibacterial activity of Quercus infectoria and Phyllanthus emblica against antibiotic-resistant Salmonella Typhi and Salmonella Enteritidis of poultry origin. Vet. World 2020, 13, 1388–1396. [Google Scholar] [CrossRef] [PubMed]
  37. Acharya, C.K. Ethnicity and Scientific validation of West Bengal Amla (Phyllanthus emblica L.) with special reference to GC-MS screening. Int. J. Exp. Res. Rev. 2016, 3, 51–59. [Google Scholar]
  38. Balasubramanian, S.; Ganesh, D.; Surya Narayana, V.V.S. Gc-Ms Analysis of Phytocomponents in the Methanolic Extract of Azadirachta Indica (Neem). Int. J. Pharm. Bio. Sci. 2014, 5, 258–262. [Google Scholar]
  39. Marar, T. Amelioration of glucose induced hemolysis human erythrocytes by vitamin E. Chem. -Biol. Interact. 2011, 193, 149–153. [Google Scholar] [CrossRef] [PubMed]
  40. Kähkönen, M.P.; Hopia, A.I.; Vuorela, H.J.; Rauha, J.P.; Pihlaja, K.; Kujala, T.S.; Heinonen, M. Antioxidant activity of plant extracts containing phenolic compounds. J. Agric. Food Chem. 1999, 47, 3954–3962. [Google Scholar] [CrossRef] [PubMed]
  41. Toyokuni, S.; Tanaka, T.; Kawaguchi, W.; Fang, N.R.; Ozeki, M.; Akatsuka, S.; Hiai, H.; Arouma, O.I.; Bahorun, T. Effects of the phenolic contents of Mauritian endemic plant extracts on promoter activities of antioxidant enzymes. Free Radic. Res. 2003, 37, 1215–1224. [Google Scholar] [CrossRef]
  42. Pourahmad, J.; Salimi, A.; Seydi, E. Role of Oxygen Free Radicals in Cancer Development and Treatment. Free Rad. Dis. Intech Open 2016. [Google Scholar] [CrossRef] [Green Version]
  43. El Abed, H.; Chakroun, M.; Abdelkafi-Koubaa, Z.; Drira, N.; Marrakchi, N.; Mejdoub, H.; Khemakhem, B. Antioxidant, Anti-Inflammatory, and Antitumoral Effects of Aqueous Ethanolic Extract from Phoenix dactylifera L. Parthenocarpic Dates. Biomed. Res. Int. 2018. [Google Scholar] [CrossRef] [Green Version]
  44. Scanlon, V.C.; Sanders, T. Essentials of Anatomy and Physiology, 6th ed.; F.A. Davis Company: Philadelphia, PA, USA, 2010; p. 287. [Google Scholar]
  45. Brown, J.H.; Mackey, H.K. Inhibition of heat-induced denaturation of serum proteins by mixtures of non-steroidal anti-inflammatory agents and amino acids. Proc. Soc. Exp. Biol. Med. 1968, 128, 225–228. [Google Scholar] [CrossRef] [PubMed]
  46. Havsteen, B.H. The biochemistry and medical significance of the flavonoids. Pharmacol. Ther. 2002, 96, 67–202. [Google Scholar] [CrossRef]
  47. Srividya, S.; Sridevi, G. Anti-arthritic and anti-inflammatory activity of ethanolic leaf extract of Ormocarpum Sennoides. Int. J. Pharm. Pharm. Sci. 2016, 8, 117–121. [Google Scholar]
  48. Xie, W.; Du, L. Diabetes is an inflammatory disease: Evidence from traditional Chinese medicines. Diabetes Obes. Metabol. 2011, 13, 289–301. [Google Scholar] [CrossRef]
  49. Volpe, C.M.O.; Villar-Delfino, P.H.; Dos Anjos, P.M.F.; Nogueira-Machado, J.A. Cellular death, reactive oxygen species (ROS) and diabetic complications. Cell Death Dis. 2018, 9, 119. [Google Scholar] [CrossRef]
  50. Liu, R.H. Potential synergy of phytochemicals in cancer prevention: Mechanism of action. J. Nutr. 2004, 134, 3479S–3485S. [Google Scholar] [CrossRef] [Green Version]
Figure 1. (a) Reducing potentials of P. emblica (blue curve) and A. indica (red curve) extract in terms of absorbance at 700 nm. The x-axis denotes different concentrations of ethanol extract. The y-axis represents the corresponding absorbance measured at 700 nm. (b) Percentage of reducing potentials of ascorbic acid (green column) and ethanol extract of P. emblica (blue column) and A. indica (yellow column). Samples 1 to 6 correspond to various concentrations of ascorbic acid and extracts (100–600 µg/mL). The results are presented as means ± SEM (n = 3). The statistical differences are denoted with asterisk (*) for P. emblica indicating significance at p < 0.05 in comparison with the reference sample, and a hashtag (#), signifying p < 0.05 for A. indica in comparison with the reference sample.
Applsci 11 08819 g001
Figure 2. Percentage of H2O2 scavenging activity of ethanol extract of P. emblica (blue column) and A. indica (yellow column). Samples 1 to 6 correspond to various concentrations of extracts (100–600 µg/mL). The results are presented as means ± SEM (n = 3). Sample 8 denotes samples having ascorbic acid with a concentration 300 µg/mL. The statistical differences are denoted with asterisk (*) for P. emblica, indicating significance at p < 0.05 in comparison with the reference sample, and a hashtag (#), signifying p < 0.05 for A. indica in comparison with the reference sample.
Applsci 11 08819 g002
Figure 3. Percentage free radical reducing ability. Percentage DPPH scavenging activity of ethanol extract of P. emblica (blue column) and A. indica (yellow column). Samples 1 to 7 correspond to various concentrations of extracts (50, 100–600 µg/mL). The results are presented as means ± SEM (n = 3). Sample 8 denotes samples having ascorbic acid with a concentration of 200 µg/mL. The statistical differences are denoted with asterisk (*) for P. emblica, indicating significance at p < 0.05 in comparison with the reference sample, and a hashtag (#), signifying p < 0.05 for A. indica in comparison with the reference sample.
Applsci 11 08819 g003
Figure 4. Percentage protection of heat-persuaded denaturation of protein. The blue columns (from 1–6) at the x-axis denotes the concentration of 100–600 µg/mL of P. emblica extract. The yellow columns (from 1–6) at the x-axis denotes the concentration of 100–600 µg/mL of A. indica extract. Sample 7 denotes the sample having ibuprofen with a concentration of 200 µg/mL. The results are denoted as means ± SEM (n = 3). The statistical differences are denoted with asterisk (*) for P. emblica, indicating significance at p < 0.05 in comparison with the reference sample, and a hashtag (#), signifying p < 0.05 for A. indica in comparison with the reference sample.
Applsci 11 08819 g004
Figure 5. Anti-proteinase activity of ethanol extracts of P. emblica and A. indica. The blue columns (from 1–6) at the x-axis represent a concentration of 100–600 µg/mL of P. emblica extract. The yellow columns (from 1–6) at the x-axis represent a concentration of 100–600 µg/mL of A. indica extract. Sample 7 denotes samples having ibuprofen with a concentration of 50 µg/mL. The results are presented as means ± SEM (n = 3). The statistical differences are denoted with asterisk (*) for P. emblica, indicating significance at p < 0.05 in comparison with the reference sample, and a hashtag (#), signifying p < 0.05 for A. indica in comparison with the reference sample.
Applsci 11 08819 g005
Figure 6. Percentage protection of heat-induced denaturation of egg albumin. The blue columns (from 1–6) at the x-axis denotes a concentration of 100–600 µg/mL of P. emblica extract. The yellow columns (from 1–6) at the x-axis denotes concentration 100–600 µg/mL of A. indica extract. The results are displayed as means ± SEM (n = 3). The statistical differences are denoted with asterisk (*) for P. emblica, indicating significance at p < 0.05 in comparison with the reference sample, and a hashtag (#), signifying p < 0.05 for A. indica in comparison with the reference sample.
Applsci 11 08819 g006
Figure 7. Percentage protection from heat-induced hemolysis. The blue columns (from 1–6) at the x-axis denotes concentration 100–600 µg/mL of P. emblica extract. The yellow columns (from 1–6) at the x-axis denotes the concentration of 100–600 µg/mL of A. indica extract. Sample 7 denotes samples having aspirin with a concentration of 50 µg/mL. The results are presented as means ± SEM (n = 3). The statistical differences are denoted with asterisk (*) for P. emblica, indicating significance at p < 0.05 in comparison with the reference sample, and a hashtag (#), signifying p < 0.05 for A. indica in comparison with 7.2. Protection from hyposaline-induced hemolysis the reference sample.
Applsci 11 08819 g007
Figure 8. Protection from hyposalinity-induced hemolysis. The figure shows that ethanol extract of P. emblica and A. indica protects against hyposalinity-induced hemolysis in a concentration-dependent manner. The blue columns (from 1–6) at the x-axis denotes concentration 100–600 µg/mL of P. emblica extract. The yellow columns (from 1–6) at the x-axis denotes the concentration of 100–600 µg/mL of A. indica extract. Sample 7 denotes samples having diclofenac sodium with a concentration of 50 µg/mL. The results are displayed as means ± SEM (n = 3). The statistical differences are denoted with asterisk (*) for P. emblica, indicating significance at p < 0.05 in comparison with the reference sample, and a hashtag (#), signifying p < 0.05 for A. indica in comparison with the reference sample.
Applsci 11 08819 g008
Figure 9. The decrease in browning intensity in the presence of P. emblica and A. indica. Sample 1 represents BSA incubation in the presence of glucose for 15 days and is denoted to show 100% glycation (browning). Samples 2–7 contain 100–600 µg/mL of P. emblica (blue columns) and A. indica (yellow columns), and browning (the degree of glycation) is shown to be decreasing with an increase in the concentration of P. emblica and A. indica. Sample 8 contains BSA incubated in glucose absence and any extract and showed the least glycation. The results are denoted as means ± SEM (n = 3). The statistical differences are denoted with asterisk (*) for P. emblica, indicating significance at p < 0.05 in comparison with the reference sample, and a hashtag (#), signifying p < 0.05 for A. indica in comparison with the reference sample.
Applsci 11 08819 g009
Figure 10. The reduction in aggregation index in the presence of P. emblica and A. indica ethanol extract. Sample 1 represents BSA and glucose incubated for 15 days and is supposed to have a maximum glycation aggregation index. Samples 2–7 contain 100–600 µg/mL of P. emblica (blue column) and A. indica (yellow column) ethanol extracts and the aggregation index is shown to diminish with increasing concentration of P. emblica (blue column) and A. indica (yellow column). Sample 8 (green column) contained BSA incubated in the absence of glucose and P. emblica or A. indica and shows the minimum aggregation index. The results are denoted as means ± SEM (n = 3). The statistical differences are denoted with asterisk (*) for P. emblica, indicating significance at p < 0.05 in comparison with the reference sample, and a hashtag (#), signifying p < 0.05 for A. indica in comparison with the reference sample.
Applsci 11 08819 g010
Figure 11. The reduction in cross amyloid structures in the existence of P. emblica (blue column) and A. indica (yellow column). Sample 1 denotes BSA and glucose incubation for 15 days and is supposed to represent maximum structural modifications, thus considered to be 100%. Samples 2–7 contain 100–600 µg/mL of P. emblica (blue column) and A. indica (yellow column), respectively, and cross amyloid structures are shown to decrease with an increase in the concentration of P. emblica (blue column) and A. indica (yellow column). Sample 8 (green column) contains BSA incubated without glucose and any extract and displayed the least cross amyloid structures. The results are denoted as means ± SEM (n = 3). The statistical differences are denoted with asterisk (*) for P. emblica, indicating significance at p < 0.05 in comparison with the reference sample, and a hashtag (#), signifying p < 0.05 for A. indica in comparison with the reference sample.
Applsci 11 08819 g011
Figure 12. The reduction in absorption intensity of glycated BSA in the presence of P. emblica and A. indica ethanol extract. Sample 1 (green column) contains BSA incubated without glucose and any extract and displayed the least absorbance at 280 nm. Sample 2 represents BSA and glucose incubation for 15 days and shows maximum absorbance, indicating the maximum structural changes due to glycation. Samples 3–8 contain 100–600 µg/mL of P. emblica (blue column) and A. indica (yellow column), respectively, and is shown to decrease absorbance with an increase in the concentration of P. emblica (blue column) and A. indica (yellow column). The results are denoted as means ± SEM (n = 3). The statistical differences are denoted with (€) for BSA incubated with glucose for 15 days signifying p < 0.05 in comparison with the reference sample, asterisk (*) for P. emblica, indicating significance at p < 0.05 in comparison with the reference sample, and a hashtag (#), signifying p < 0.05 for A. indica in comparison with the reference sample.
Applsci 11 08819 g012
Figure 13. The reduction in fluorescent AGEs formed in the existence of P. emblica (blue column) and A. indica (yellow column). Sample 1 (green column) contains BSA incubated without glucose and any extract and displayed the least fluorescent AGEs intensity. Sample 2 represents BSA and glucose incubation for 15 days and shows maximum fluorescence AGEs intensity. Samples 3–8 contain 100–600 µg/mL of P. emblica (blue column) and A. indica (yellow column), respectively, and showed a decrease in fluorescent AGEs intensity with an increase in the concentration of P. emblica (blue column) and A. indica (yellow column). The results are denoted as means ± SEM (n = 3). The statistical differences are denoted with (€) for BSA incubated with glucose for 15 days signifying p < 0.05 in comparison with the reference sample, asterisk (*) for P. emblica, indicating significance at p < 0.05 in comparison with the reference sample, and a hashtag (#), signifying p < 0.05 for A. indica in comparison with the reference sample.
Applsci 11 08819 g013
Figure 14. The reduction in fibrils formed in the existence of P. emblica (blue column) and A. indica (yellow column). Sample 1 (green column) contains BSA incubated without glucose and any extract and displayed the least ThT specific fluorescent intensity. Sample 2 represents BSA and glucose incubation for 15 days and shows maximum ThT specific fluorescence intensity. Samples 3–8 contain 100–600 µg/mL of P. emblica (blue column) and A. indica (yellow column), respectively, and show a reduction in ThT specific fluorescence intensity with an increase in the concentration of P. emblica (blue column) and A. indica (yellow column). The results are denoted as means ± SEM (n = 3). The statistical differences are denoted with (€) for BSA incubated with glucose for 15 days signifying p < 0.05 in comparison with the reference sample, asterisk (*) for P. emblica, indicating significance at p < 0.05 in comparison with the reference sample, and a hashtag (#), signifying p < 0.05 for A. indica in comparison with the reference sample.
Applsci 11 08819 g014
Table 1. Preliminary screening of P. emblica and A. indica.
Preliminary ScreeningP. emblicaA. indica
Weight of dry powder 100 g100 g
Yield8.79%7.19%
ExtractEthanolEthanol
ColorReddish brownBrown
OdorNo specific No specific
TextureStickyPowder
Flavonoid (alkaline reagent test)++
Phenolic compounds (FeCl3 test)++
Table 2. Percentage protection from heat-induced hemolysis.
Concentration (µg/mL)P. emblicaA. indica
Percentage ProtectionS. E. M.Percentage ProtectionS. E. M.
1009.130.17.210.003
20015.91111.680.07
30024.621.32118.470.256
40030.730.03825.471.18
50045.561.02844.160.76
60054.4410.63150.2170.313
Table 3. Protection from hyposalinity-induced hemolysis.
Concentration (µg/mL)P. emblicaA. indica
Percentage ProtectionS. E. M.Percentage ProtectionS. E. M.
1009.430.1338.010.033
20017.981.07915.630.078
30025.690.32123.241.346
40035.731.05833.470.588
50045.560.00343.161.903
60059.280.71157.270.283
Publisher’s Note: MDPI stays neutral with regard to jurisdictional claims in published maps and institutional affiliations.

