1. Introduction
The machinery industry must move toward higher efficiency, precision, and customization, as well as greater intelligence and the integration of complete plants. In addition to developing key technologies and products, intelligent technologies, such as the Internet of things (IoT), smart robots, and big data analysis, should also be introduced. Intelligent machinery and manufacturing application solutions, such as smart machinery, smart manufacturing systems, whole-line applications, and smart factories, should be promoted for technology applications [
1].
Networked applications are important for smart manufacturing. The architecture for manufacturing IoT includes three layers: sensing, network, and application. The sensing layer mainly includes motion orientation sensing, optical image sensing, and environmental monitoring. The sensing information is stored and analyzed through the cloud platform and network environment of the network layer, whereas the supply layer is used for decision-making and actuation control [
2].
Tao et al. [
3] presented advances in the IoT, big data, and artificial intelligence which have impacted manufacturing. The volume of data in manufacturing has continuously increased. Kusiak [
4] indicated that manufacturing has become smarter, and such intelligence will continue to grow. Companies are increasingly using sensor technologies to capture data during the lifetime of a product. O’Donovan et al. [
5] noted that the objective of smart manufacturing is to convert data into manufacturing intelligence to positively impact manufacturing. Fujishima et al. [
6] described the sensing technologies that can be practically used in machine tools. The sensing system used in their study was developed to collect data from the cutting conditions. In addition, Lee et al. [
7] presented advanced information analytics which can be used to increase the performance of networked machines. Babiceanu et al. [
8] also indicated that cyber-physical systems (CPS) are expected to benefit from cloud computing, the IoT, and big data. Moreover, Lee et al. [
9,
10] presented industrial big data and smart analytics to reveal invisible problems in decision-making. Cyber manufacturing involves the translation of data from interconnected systems to prescriptive operations to predict production. LaCasse et al. [
11] presented a connected manufacturing enterprise, characterized by a data environment that allowed software and database tools to effectively capture, store, manage, and analyze such data. In addition, Xu et al. [
12] presented a neural network for defect inspection using an ensemble method for data preprocessing. Moreover, Bi et al. [
13] presented a model and validated the fatigue life of a type of linear actuator. The concept of the asperity contact was introduced, and the model was adopted to quantify wear under the specified working conditions. The analysis results were used to predict the fatigue lives of lead-screw actuators. Chen et al. [
14] also presented an intelligent manufacturing control with specific applications to operate rail-guided vehicle systems. In addition, Farid et al. [
15] provided measures for the key characteristics of reconfigurability, i.e., integrability and customization, which have driven the intuitive design of these technological advances. These measures were demonstrated for reconfigurability measurements in automated and intelligent manufacturing systems. Tian et al. [
16] indicated that processing is an important challenge in an internet-based environment and must facilitate distribution, autonomy, and cooperation. Kozjek et al. [
17] presented a study defining a new stepwise procedure. The procedure identifies what software and hardware tools are needed for the implementation of data analytics solutions in manufacturing systems.
The crux of CPS is the integrated calculation of people, machines, and objects. Three important steps are required to achieve smart manufacturing: (1) digitalized production, (2) the development of a predictive model, and (3) the development of a software model. Therefore, industries around the world must focus on smart technologies, high customization, and the integration of these solutions in their factories. Therefore, this research uses three small five-axis machine tools as objects to present an example of an intelligent diagnosis.
2. Smart Machine Systems
Smart machine systems cover two levels: component parts and the machine itself. These levels are discussed in detail in the following sections.
2.1. Smart Component Parts Level
The sensing technique, applied to the component parts, enables the sensing of their temperature and vibration, thereby improving the machine’s reliability and service life. For example, a spindle is the most crucial machine tool. When designing a spindle for high efficiency and high precision machining, the requirements for the spindle performance will continue to increase over time, consequently increasing the risk of spindle failure. The spindle speed and accuracy requirements are continuously increasing. Therefore, improving the spindle performance is of critical importance.
There are many sensing components of a spindle, such as the motor temperature monitor, current detector, and encoder and proximity switches. In addition, spindles have several re-installation features, including the thermometer, displacement sensor, and accelerometer. Using these functions, the signal is captured, and the data are displayed. Occasionally, the data are recalculated, and provide an accurate spindle status before being displayed.
To provide the current health status of the spindle, a spindle status monitoring program is used to inform the user regarding whether the spindle is performing under normal conditions each time the machine is turned on, avoiding poor machining or damage to the machine because of abnormal spindle conditions. Recording and displaying the long-term trend of a spindle requires the use of big data processing. Thus, warnings regarding the spindle operating rate or fault prediction can be provided, allowing users to pre-arrange the maintenance or re-plan the production process.
2.2. Smart Machine Level
Information regarding the operating status of various parts of a machine can be used in a big data analysis to detect abnormalities as early as possible and eliminate them to maintain a smooth operation of the machine and ensure the product quality. Sensors for detecting vibrations and temperature are installed on a spindle, and the measured data are sent to the cloud or computer network for the big data comparison analysis. In the case of an abnormality, a warning is sent to notify the personnel so that they can undertake maintenance. During processing, the machine table is deformed because of the thermal expansion and contraction of the machine equipment.
The data are sent to a cloud network to analyze and predict the degree of deformation, and the operation result is sent back to the controller through the machine networking function. The tool feed amount is then controlled to ensure a consistent precision.
An accelerometer sensor is installed on the spindle head of the device to measure the frequency generated by the spindle. After a comparison of the software operation, the feed amount or the spindle speed is controlled to avoid abnormal vibrations of the machine, resulting in poor processing quality.
2.3. Digital Production
Smart manufacturing must enable all manufacturing equipment to have networking and communication capabilities. Furthermore, it must achieve highly productive smart manufacturing goals through the machine information link and network transmission.
Future networking functions must also be connected to international standards. It is necessary to develop communication networking systems and related infrastructure between machines.
In response to the networking requirements of various machinery industries, it is necessary to further establish a networking platform, as well as to integrate the related network function modules to be used by the machinery and related application industries. Because the demand for networked communications will constantly increase, the industry must build relevant service and application teams for machine-to-machine communication applications.
The manufacturing industry generally involves the stage of automation in smart manufacturing. In moving toward smart manufacturing, information on effective use can greatly reduce the manufacturing costs. Thus, a common platform is required for integration to improve the production efficiency. Three issues remain to be addressed: integrating the standardized communication interface, improving the intelligence of equipment, and improving the degree of system information. To achieve this, a public networking service platform must be established, and the adoption of smart manufacturing by the industry must be accelerated.
3. Major Processes of Machine Tools Health Diagnosis Case Studies
Smart manufacturing can follow the process of instant monitoring of the mean time prior to degradation. The PCA method can determine the main basis vector of the data features. As shown in
Figure 1, the data projected onto the first and second principal component basis vector will have the largest and second largest amount of variation, respectively.
The calculation process of the PCA method consists of first obtaining the covariance matrix of the input data. The eigenvector corresponding to the largest eigenvalue in the covariance matrix is the direction with the largest variation, the second largest eigenvalue corresponds to the eigenvector, and the vector perpendicular to the eigenvector dimension and the largest eigenvector is the direction with the highest variation. The calculation steps are as follows:
Suppose a dataset
X with a size of
m ×
n, in which there are
m pieces of data, each piece of which has a dimension of
n. The representation of this dataset is given in Equation (1):
Among them,
,
…
can form a vector
A(1);
,
…
can form a vector
A(2), …; and
,
…
can form a vector
A(
n). The dataset then consists of a vector
A(
i),
i = 1, …,
n. In Equation (2),
a represents the average value the
n row vectors of dataset
X:
where
n is the number of vectors in the dataset
X,
A(
i) is the value of the row vector, and
i = 1, 2, …,
n. In a sequence, the co-mutation matrix
W is obtained:
The eigenvector , j = 1, 2, …, s corresponding to the large eigenvalue of the first s in W is obtained. The transformed data are y = X, j = 1, 2, …, s, and the primary elements of the first s groups are then determined, which are evident feature points that can effectively represent the original data.
After the feature extraction, the data were used for a dimensionality reduction through a PCA. When processing high-dimensional data, there will be a considerable amount of data, some of which may be generated by noise, which may hinder the data processing. To avoid such problems, it is necessary to reduce the number of dimensions to filter out unimportant data. Among the various data dimensionality reduction methods, a PCA is the most used.
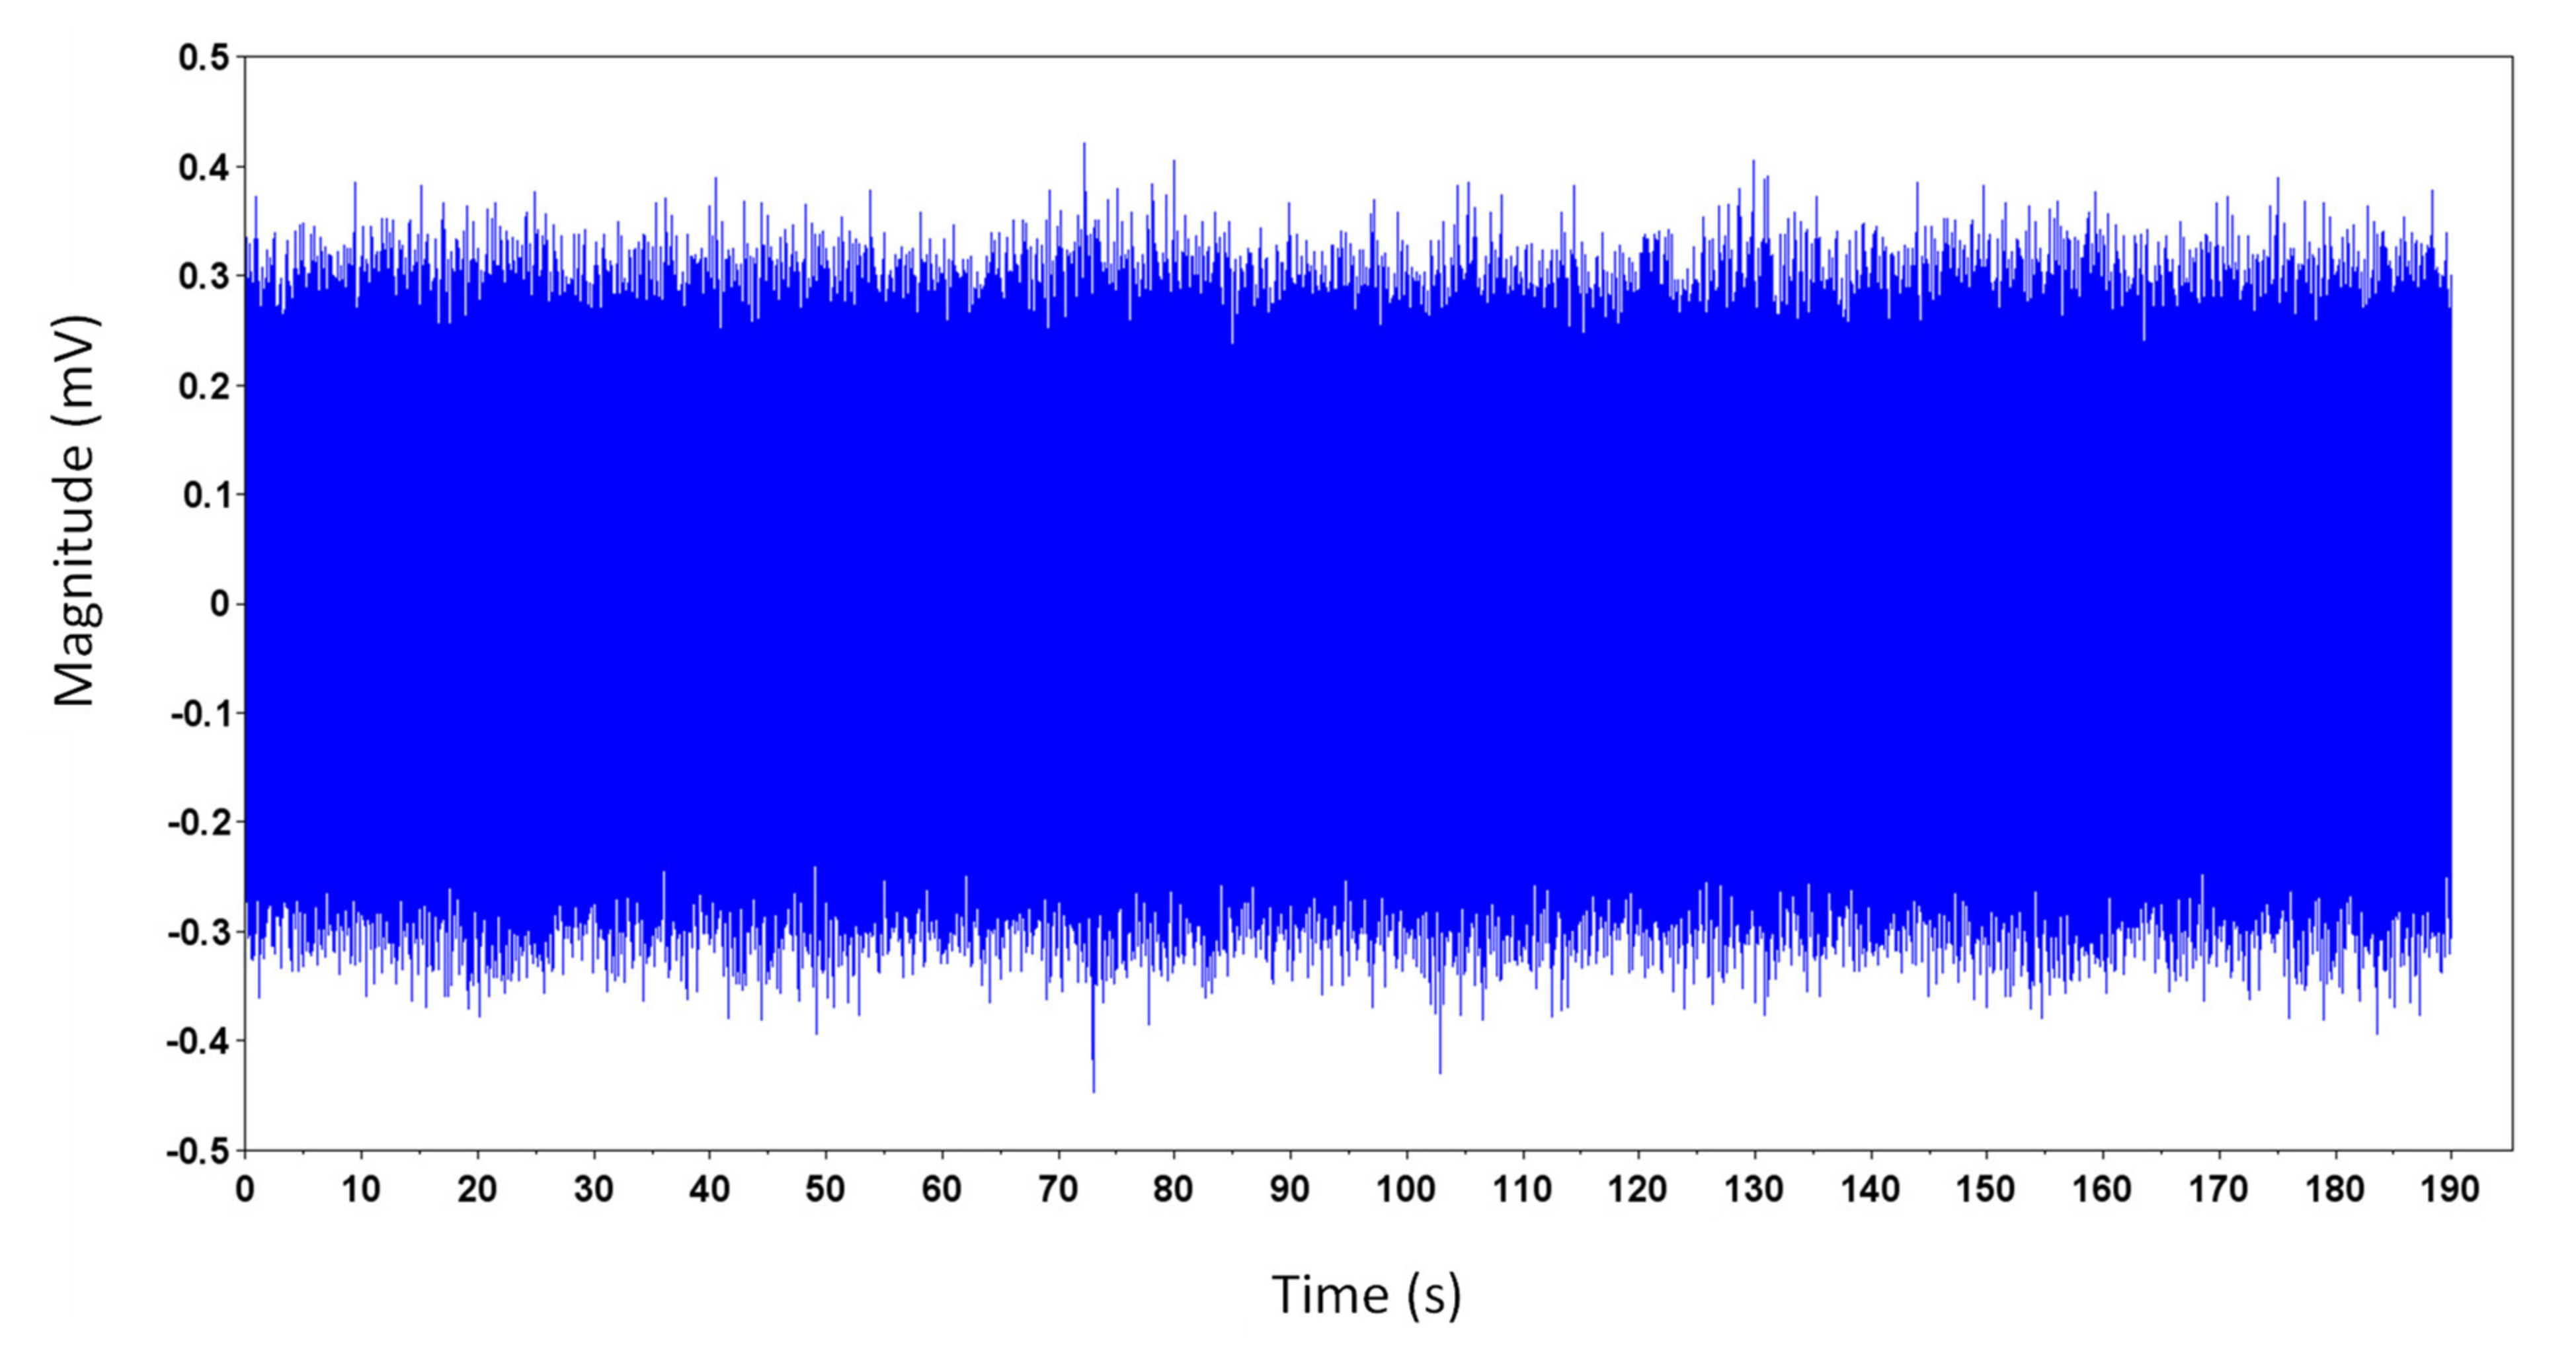
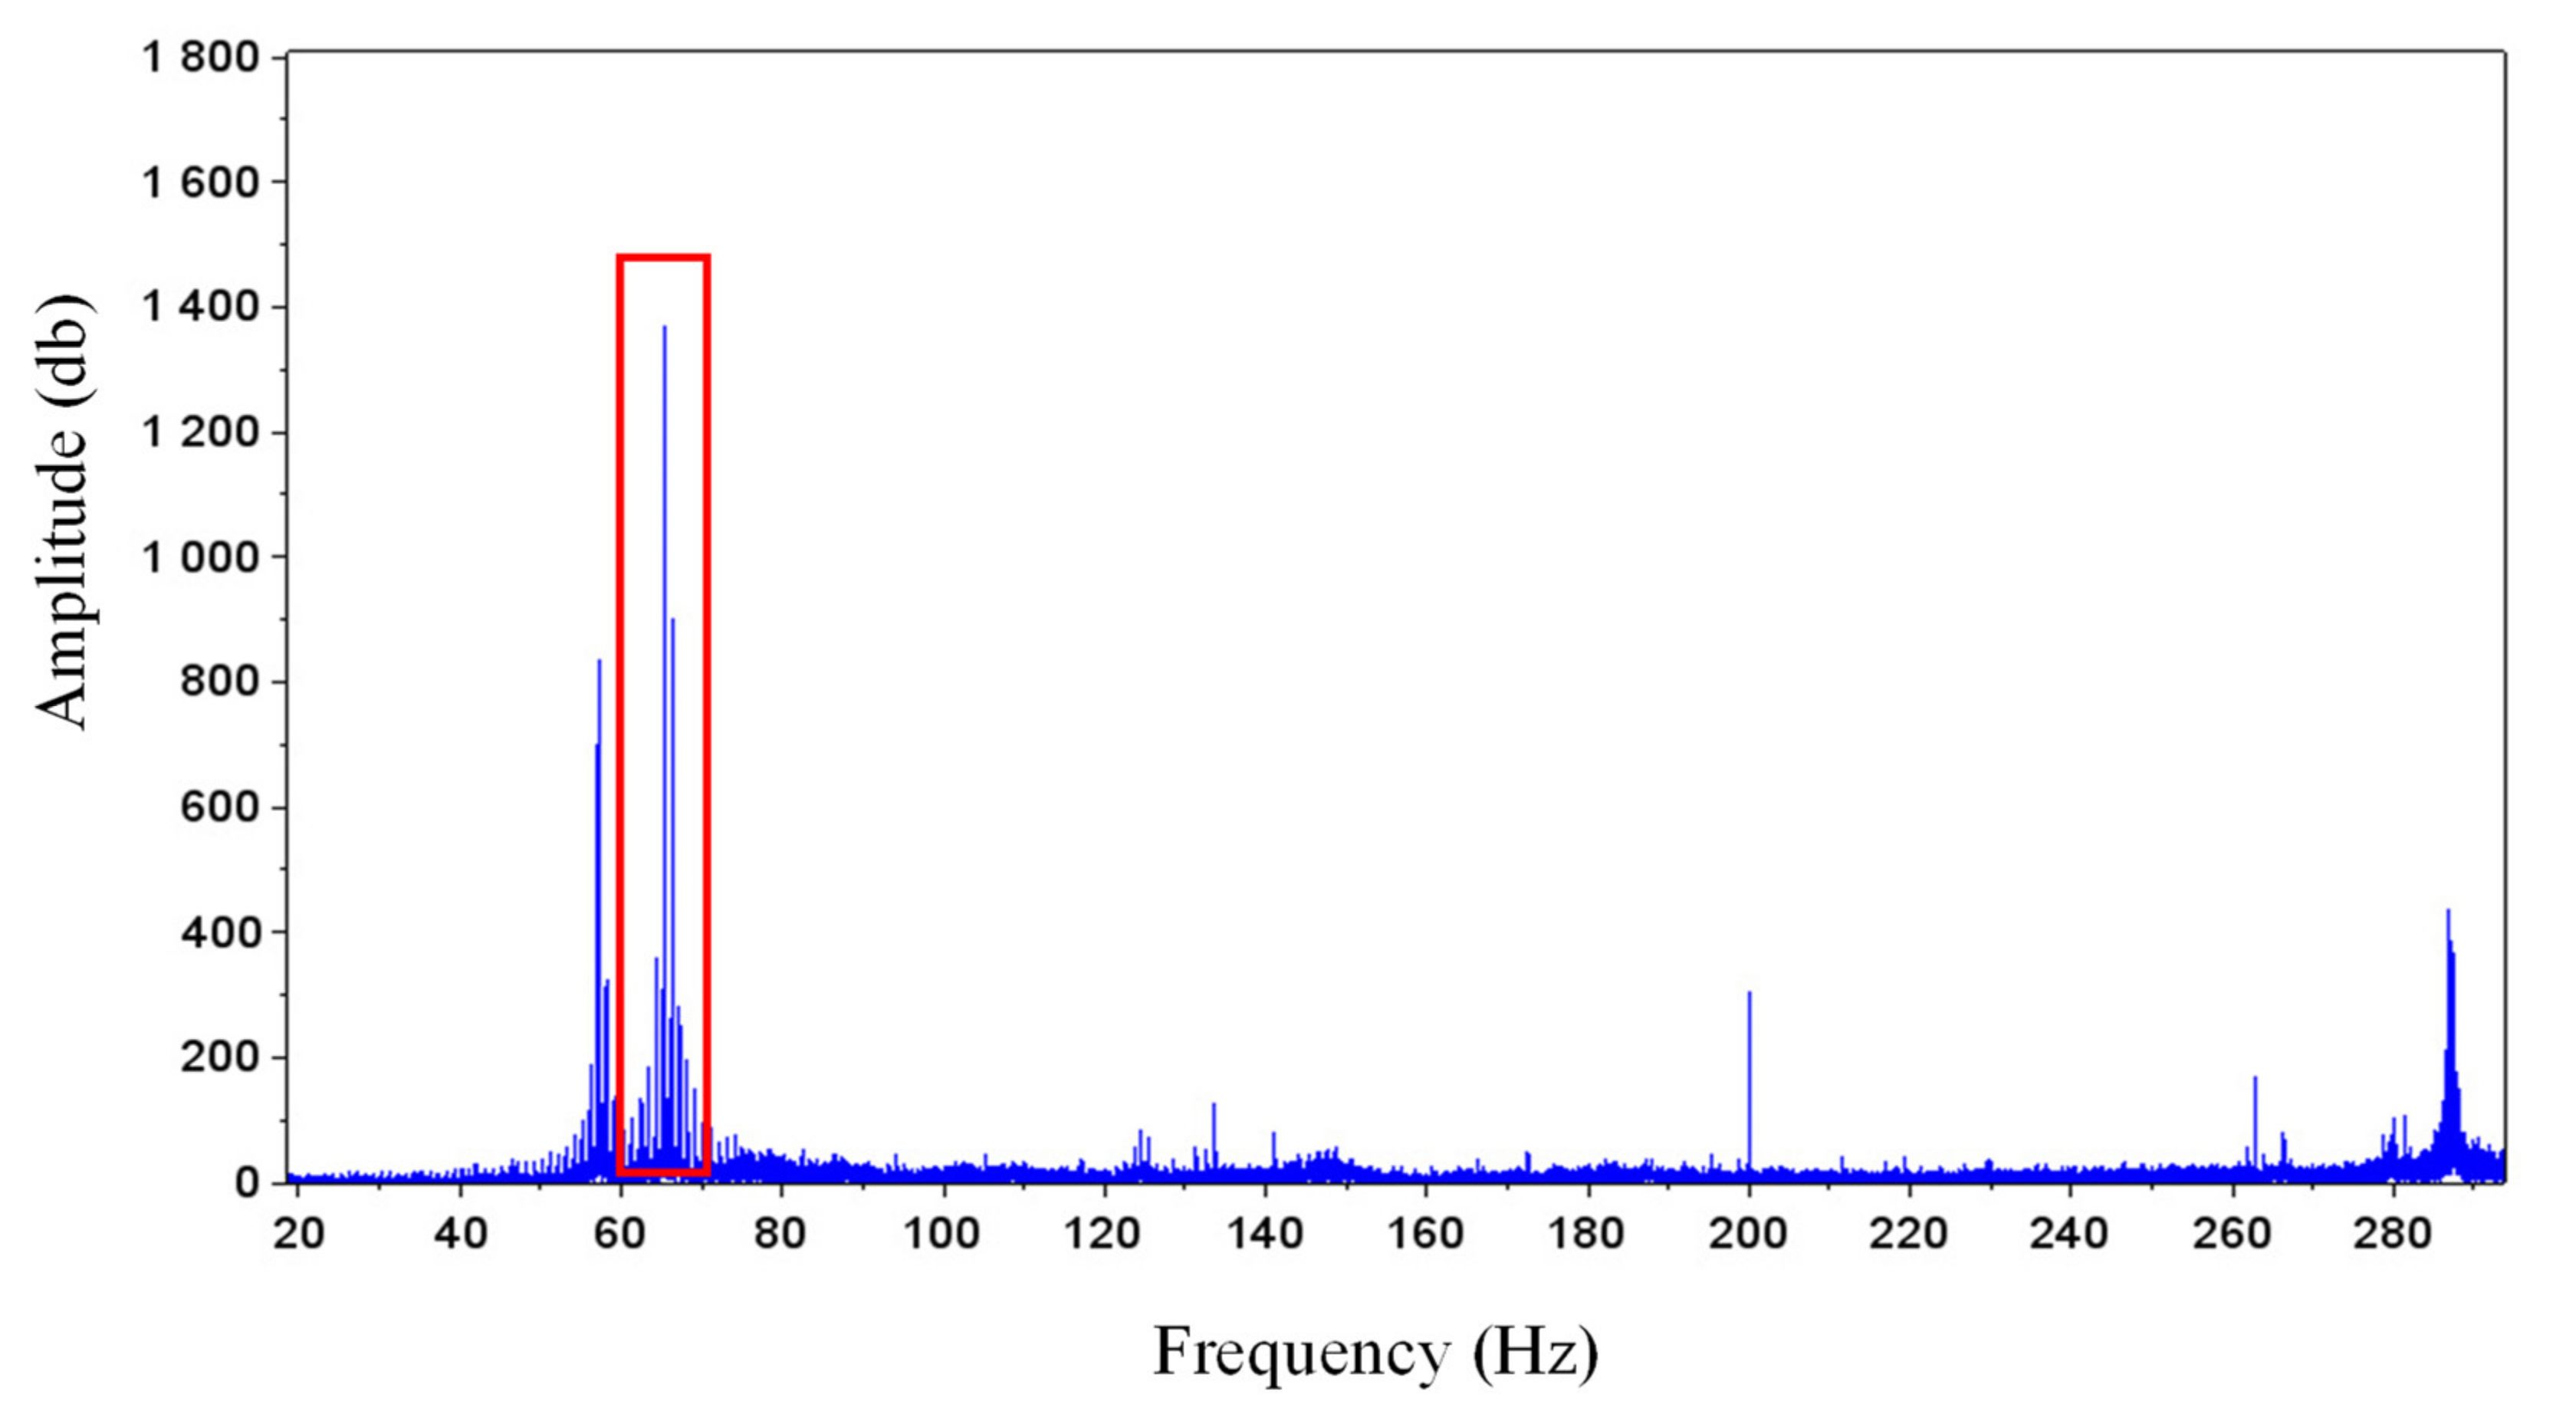
4. Vibration Signal Inspection
The vibration signal was converted into a frequency domain signal using fast Fourier. The rotation speed was 4000 rpm, and the rotation frequency was approximately 66.7 Hz. The frequency domain signal was checked to confirm whether the vibration signal was correct. In the frequency domain signal graphs shown in
Figure 2 and
Figure 3, frequency of the red box matched the calculated speed frequency at approximately 66.7 Hz. Thus, the accuracy of the signal was confirmed.
Feature extraction software was used to extract the features of each vibration signal. As shown in
Figure 4, a total of 35 feature attributes was obtained. The feature attributes can be divided into time-domain attributes, edge frequency, fast Fourier transform (FFT) frequency domain attributes, envelope spectrum (HT) characteristics, power spectral density (PSD) characteristics, energy amplitude, and shape statistics.
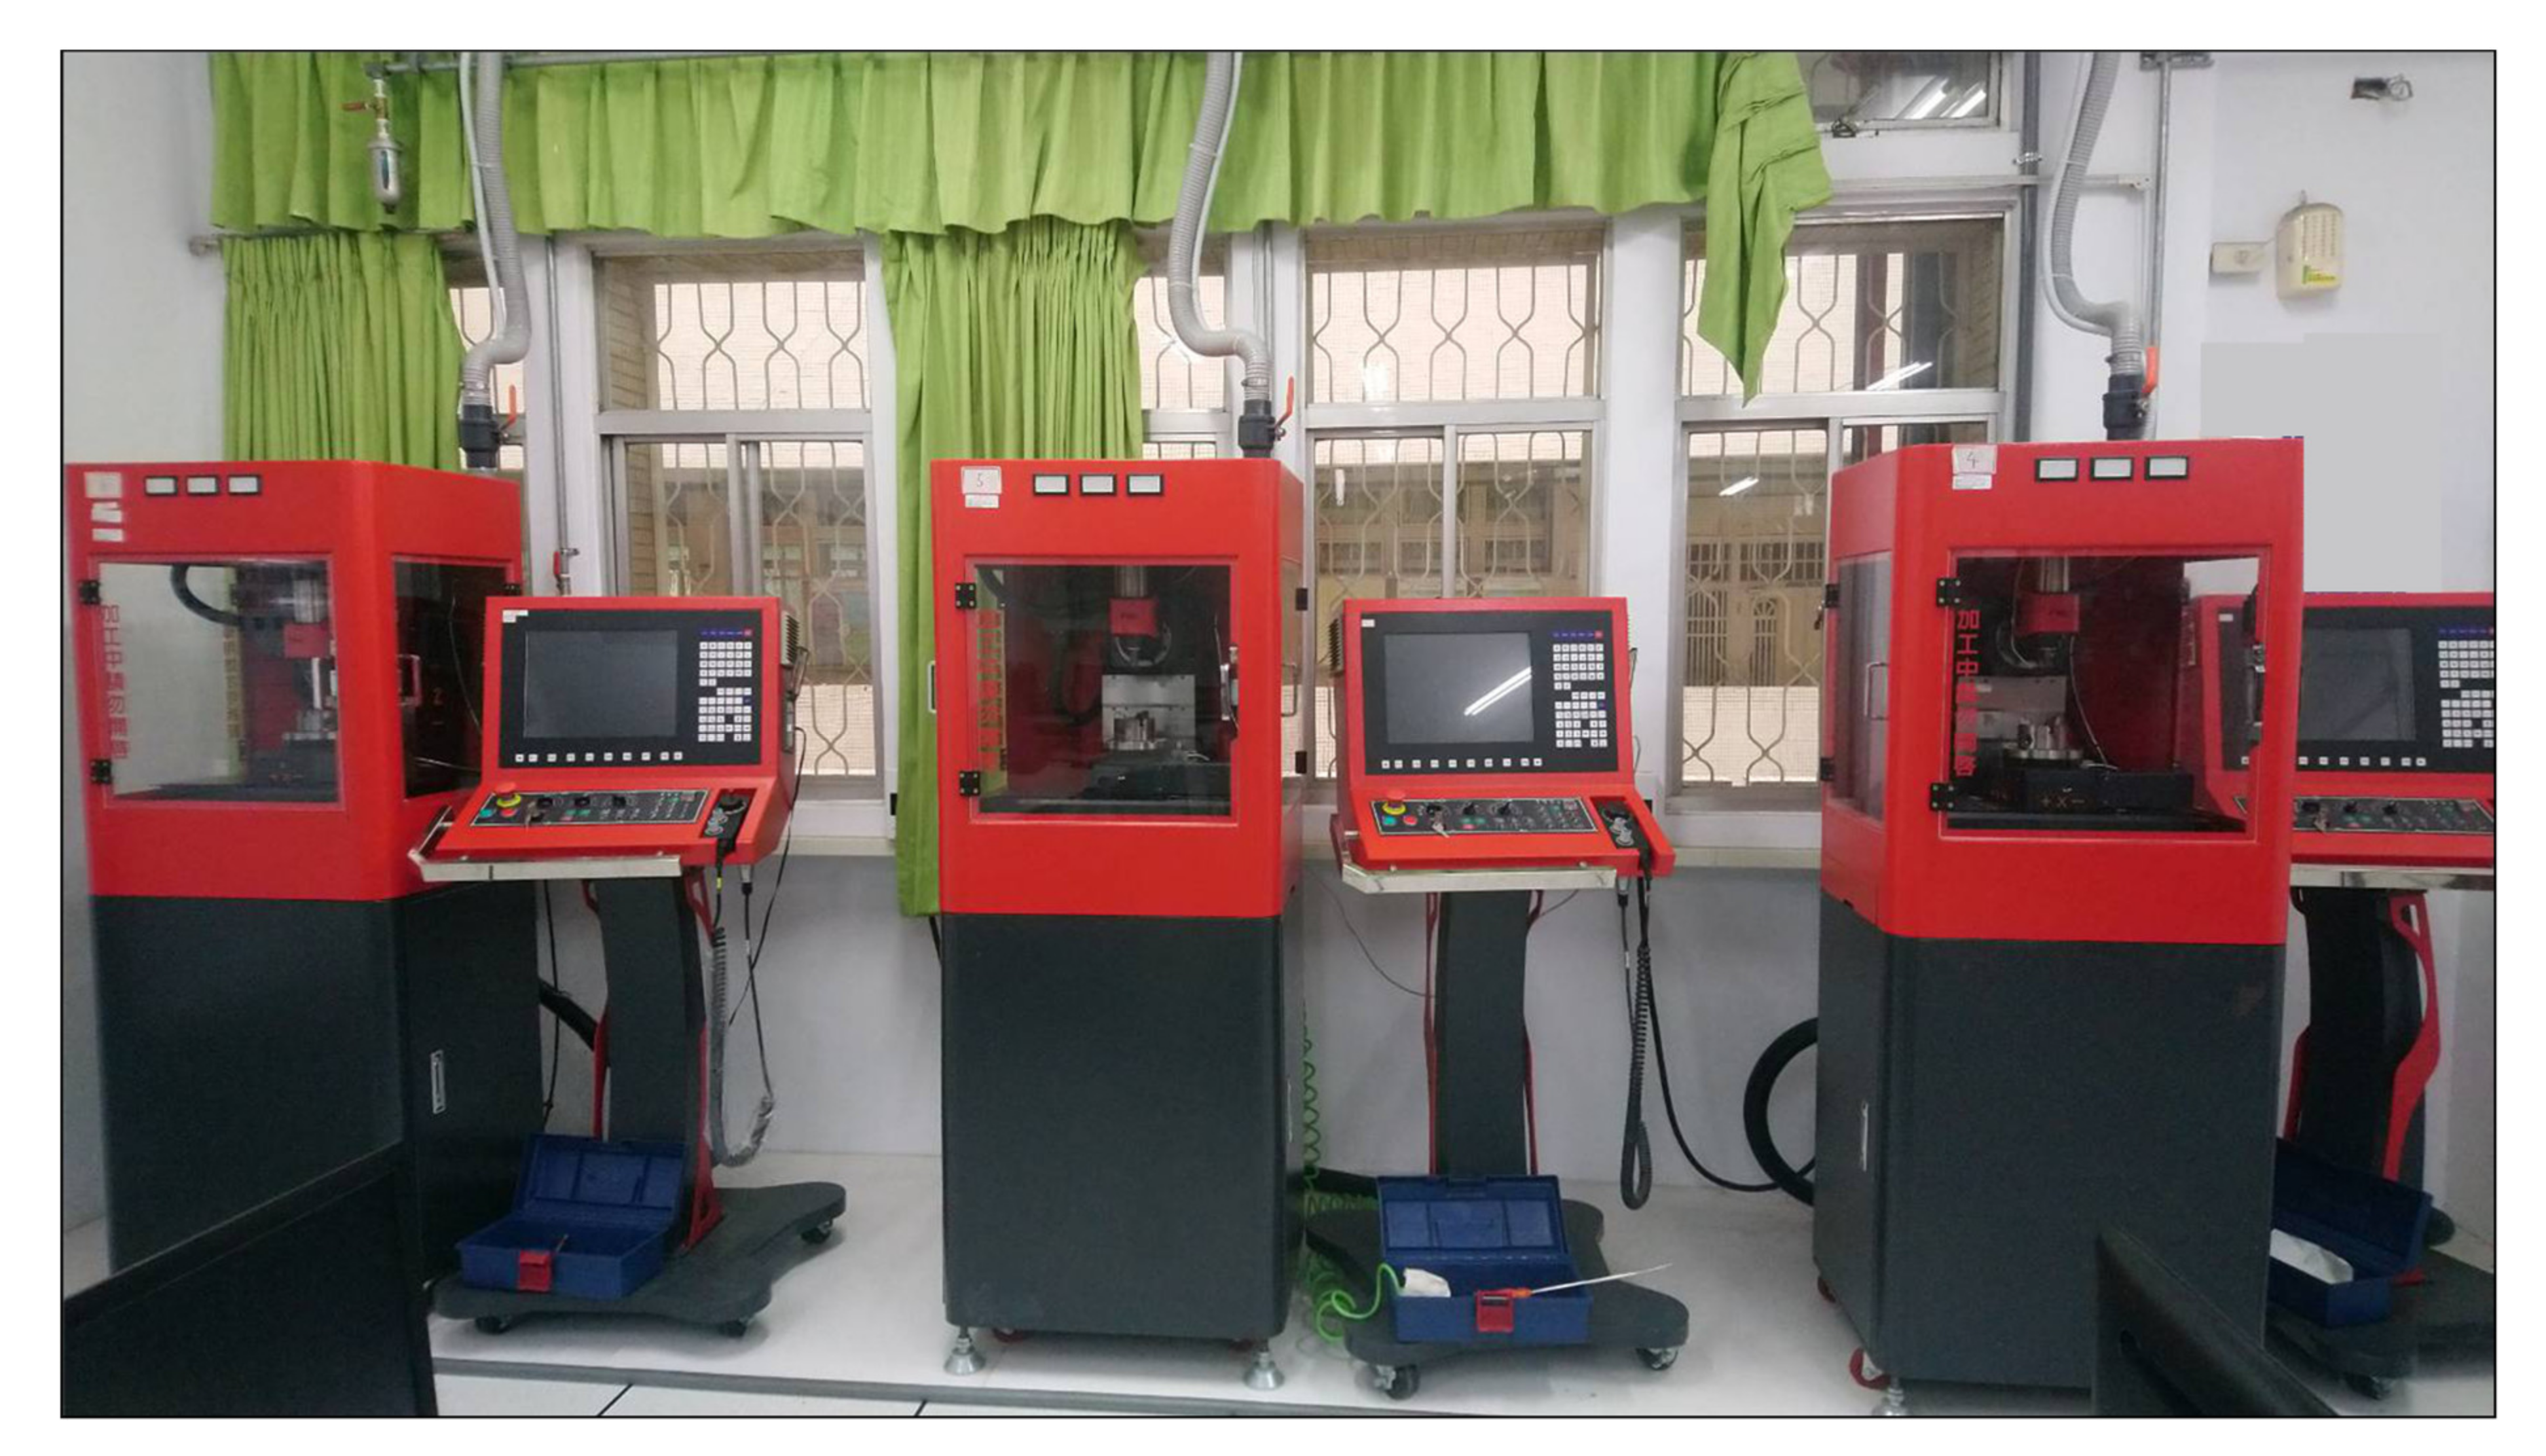
This paper used machine tools as examples to conduct the instant monitoring of the mean time prior to degradation. The system can sense the spindle vibration, spindle current, and temperature to obtain a model for the instantaneous monitoring of the machine tool performance, as shown in
Figure 5. This study also compared the statuses of three machines with the exact same specifications, as indicated in
Figure 6. By comparing the characteristics of their health and abnormalities, and using a principal component analysis, the health status of the machine can be accurately determined, as shown in
Figure 7.
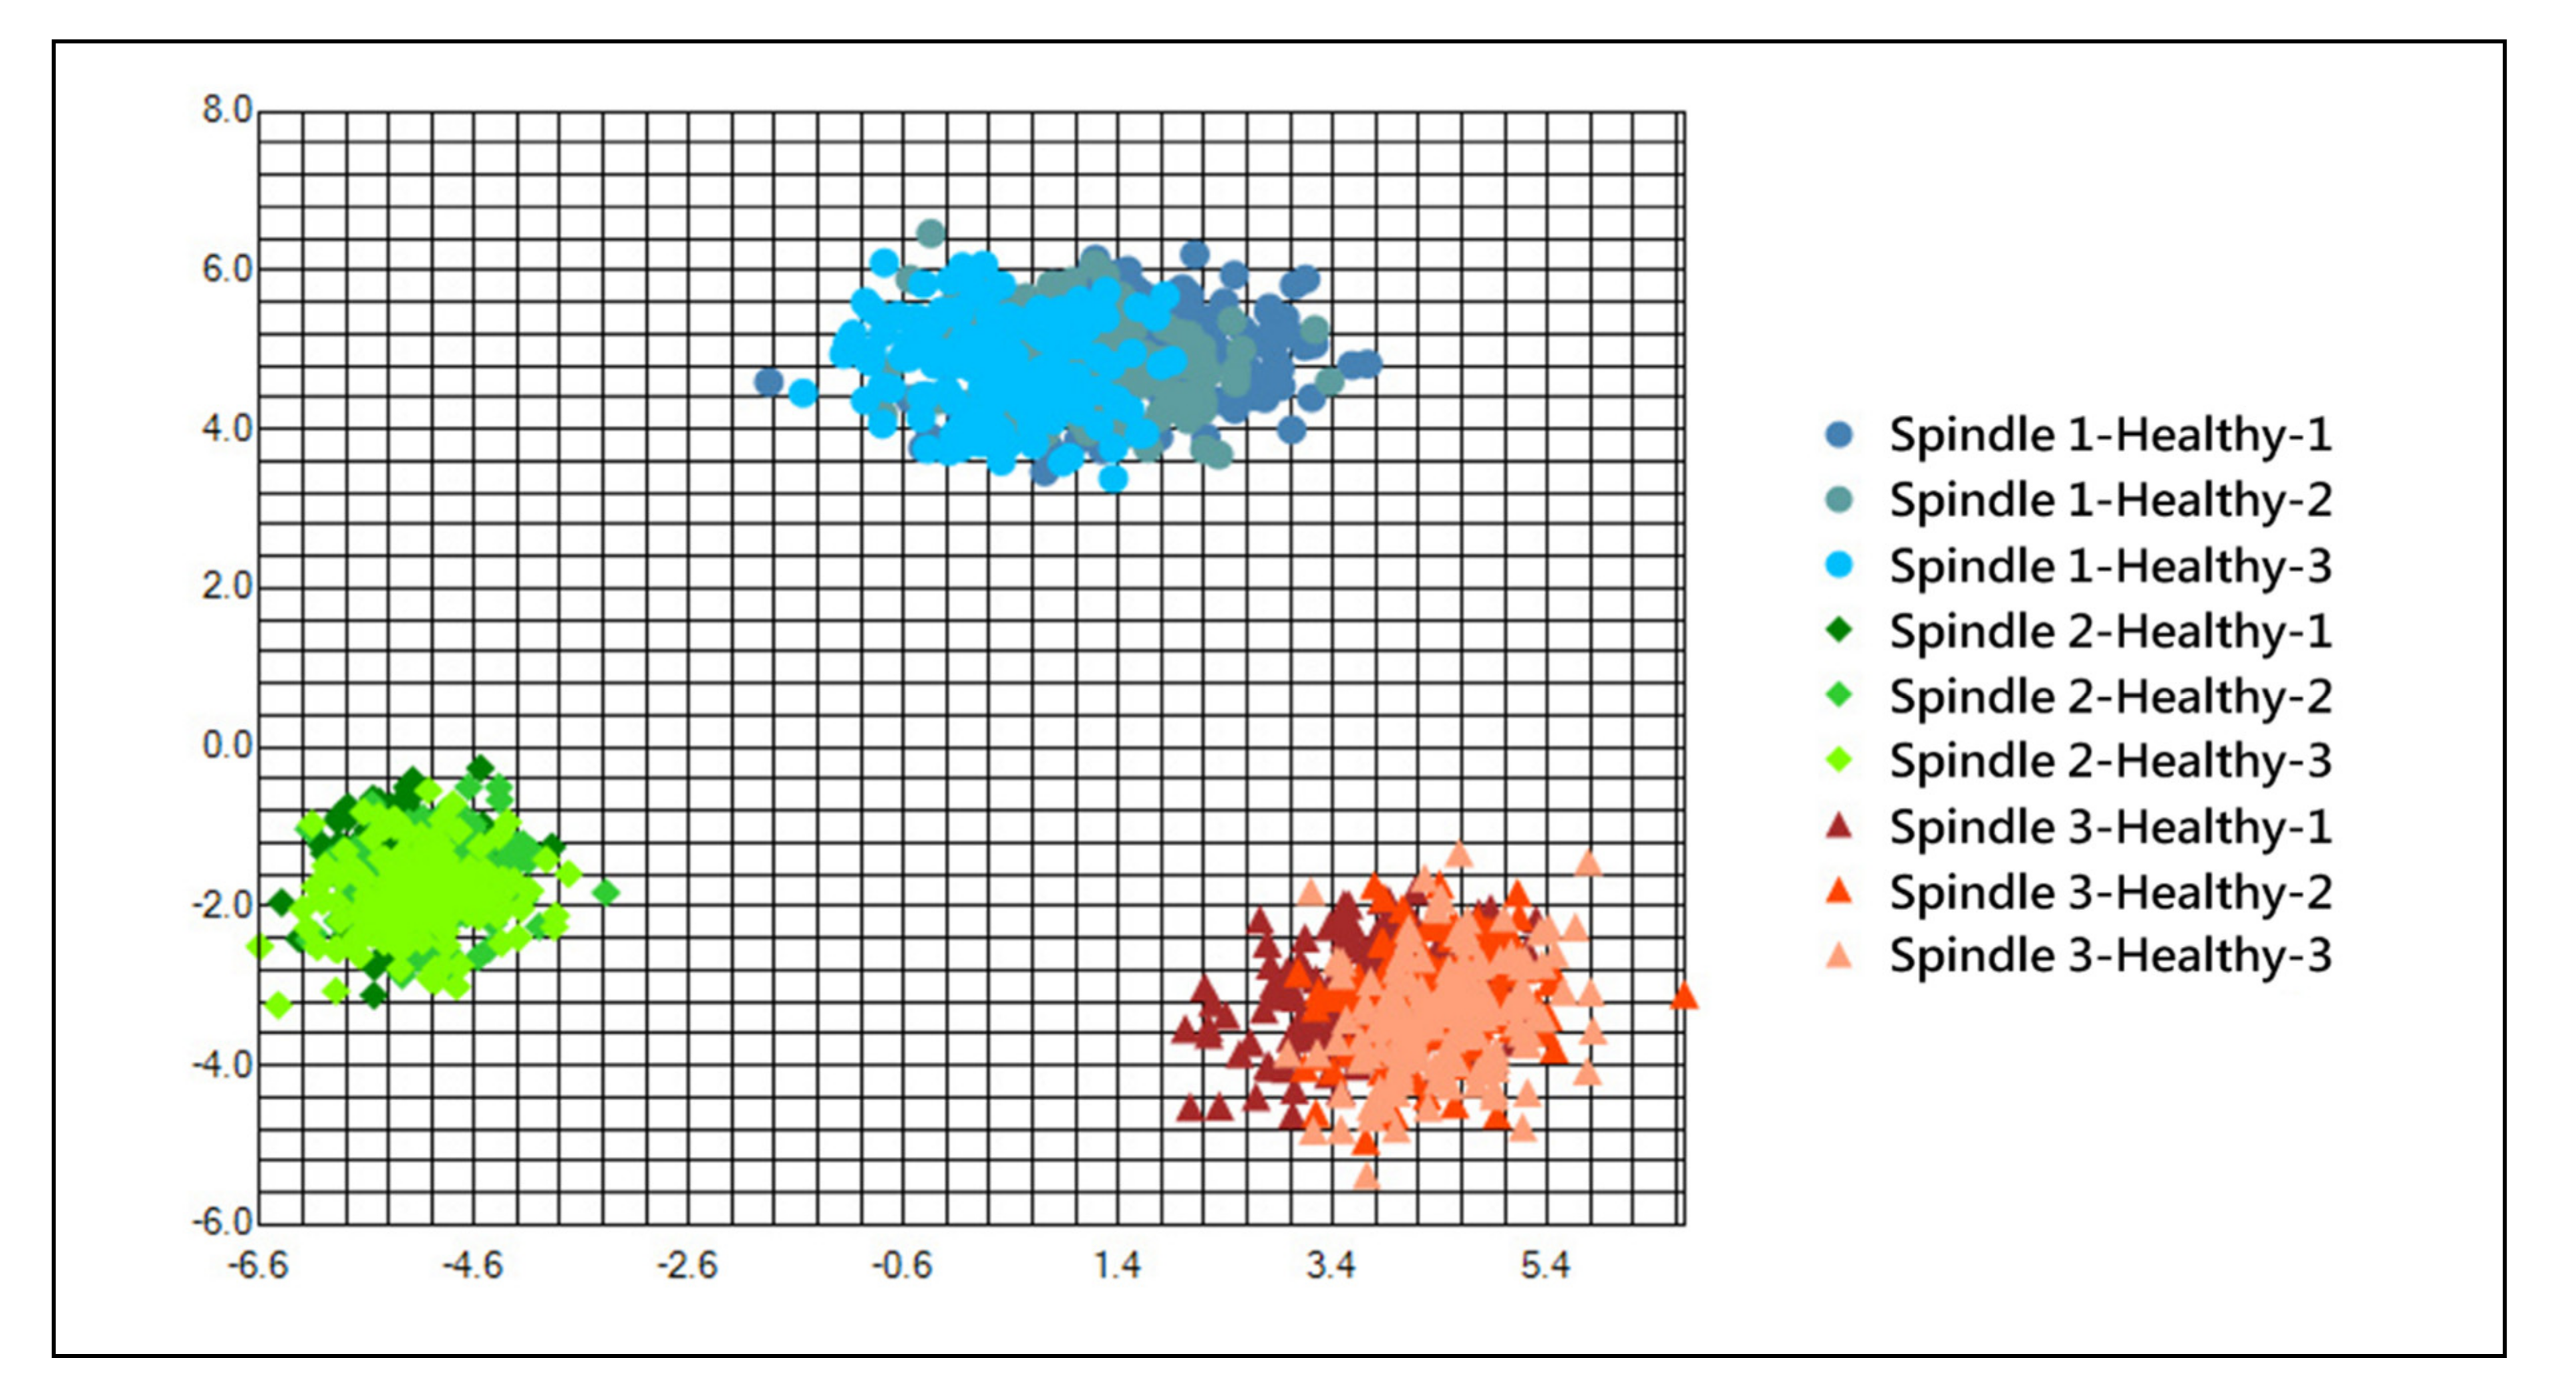
5. Comparison of Analysis Results of Multi-Machine Spindles
The analysis results of the three spindles were combined and compared. From the combined results, the data of the three spindles were compared with the data of the whole machine. Observing the normal and abnormal data of the spindles, the three sets of data were scattered in the distribution but were normal. After the merging and a comparison with the abnormal data, the normal data of the three machines were distributed extremely close on the horizontal axis of the first principal component, but there was a large deviation on the vertical axis of the second principal component, which was normal as a whole. A good degree of identification still occurred with the abnormal data, as shown in
Figure 8,
Figure 9 and
Figure 10.
In a multivariate statistical analysis, a PCA is a method of statistical analysis to simplify the datasets. It uses an orthogonal transformation to linearly transform the observations of a series of possibly related variables, thereby projecting the values of a series of linearly unrelated variables. These unrelated variables are called principal components. Specifically, a principal component can be regarded as a linear equation which contains a series of linear coefficients to indicate the projection direction. A PCA is sensitive to the regularization or preprocessing of raw data.
We studied the relationship between the dynamic characteristics and the vibration of miniature five-axis processing machines for the processing of vibration signals. Three small five-axis processing machines were operated with the same parameters and motion programs, and a prediction diagnosis performance system (PDPS) was used to collect the machine vibration signals. Subsequently, the vibration signals were analyzed and processed. Using a PCA, the vibration signal analysis extracted six time-domain features (root mean square, kurtosis, variance, crest factor, standard deviation, and skewness value) and 17 frequency domain features (where each 256 Hz bandwidth was cut into 17 segments, and each segment extracted the average frequency domain signal as a feature). An orthogonal transformation was used in the PCA to linearly transform the observations of the data-related variables. Therefore, the projection is the value of a series of linearly uncorrelated variables, which are called principal components. This was applied for feature selection, and the data were presented in a 2D scatter diagram after the feature signals were filtered. The miniature machine tool was used in an actual test and application, by which we attempted to monitor the machine health in real time.
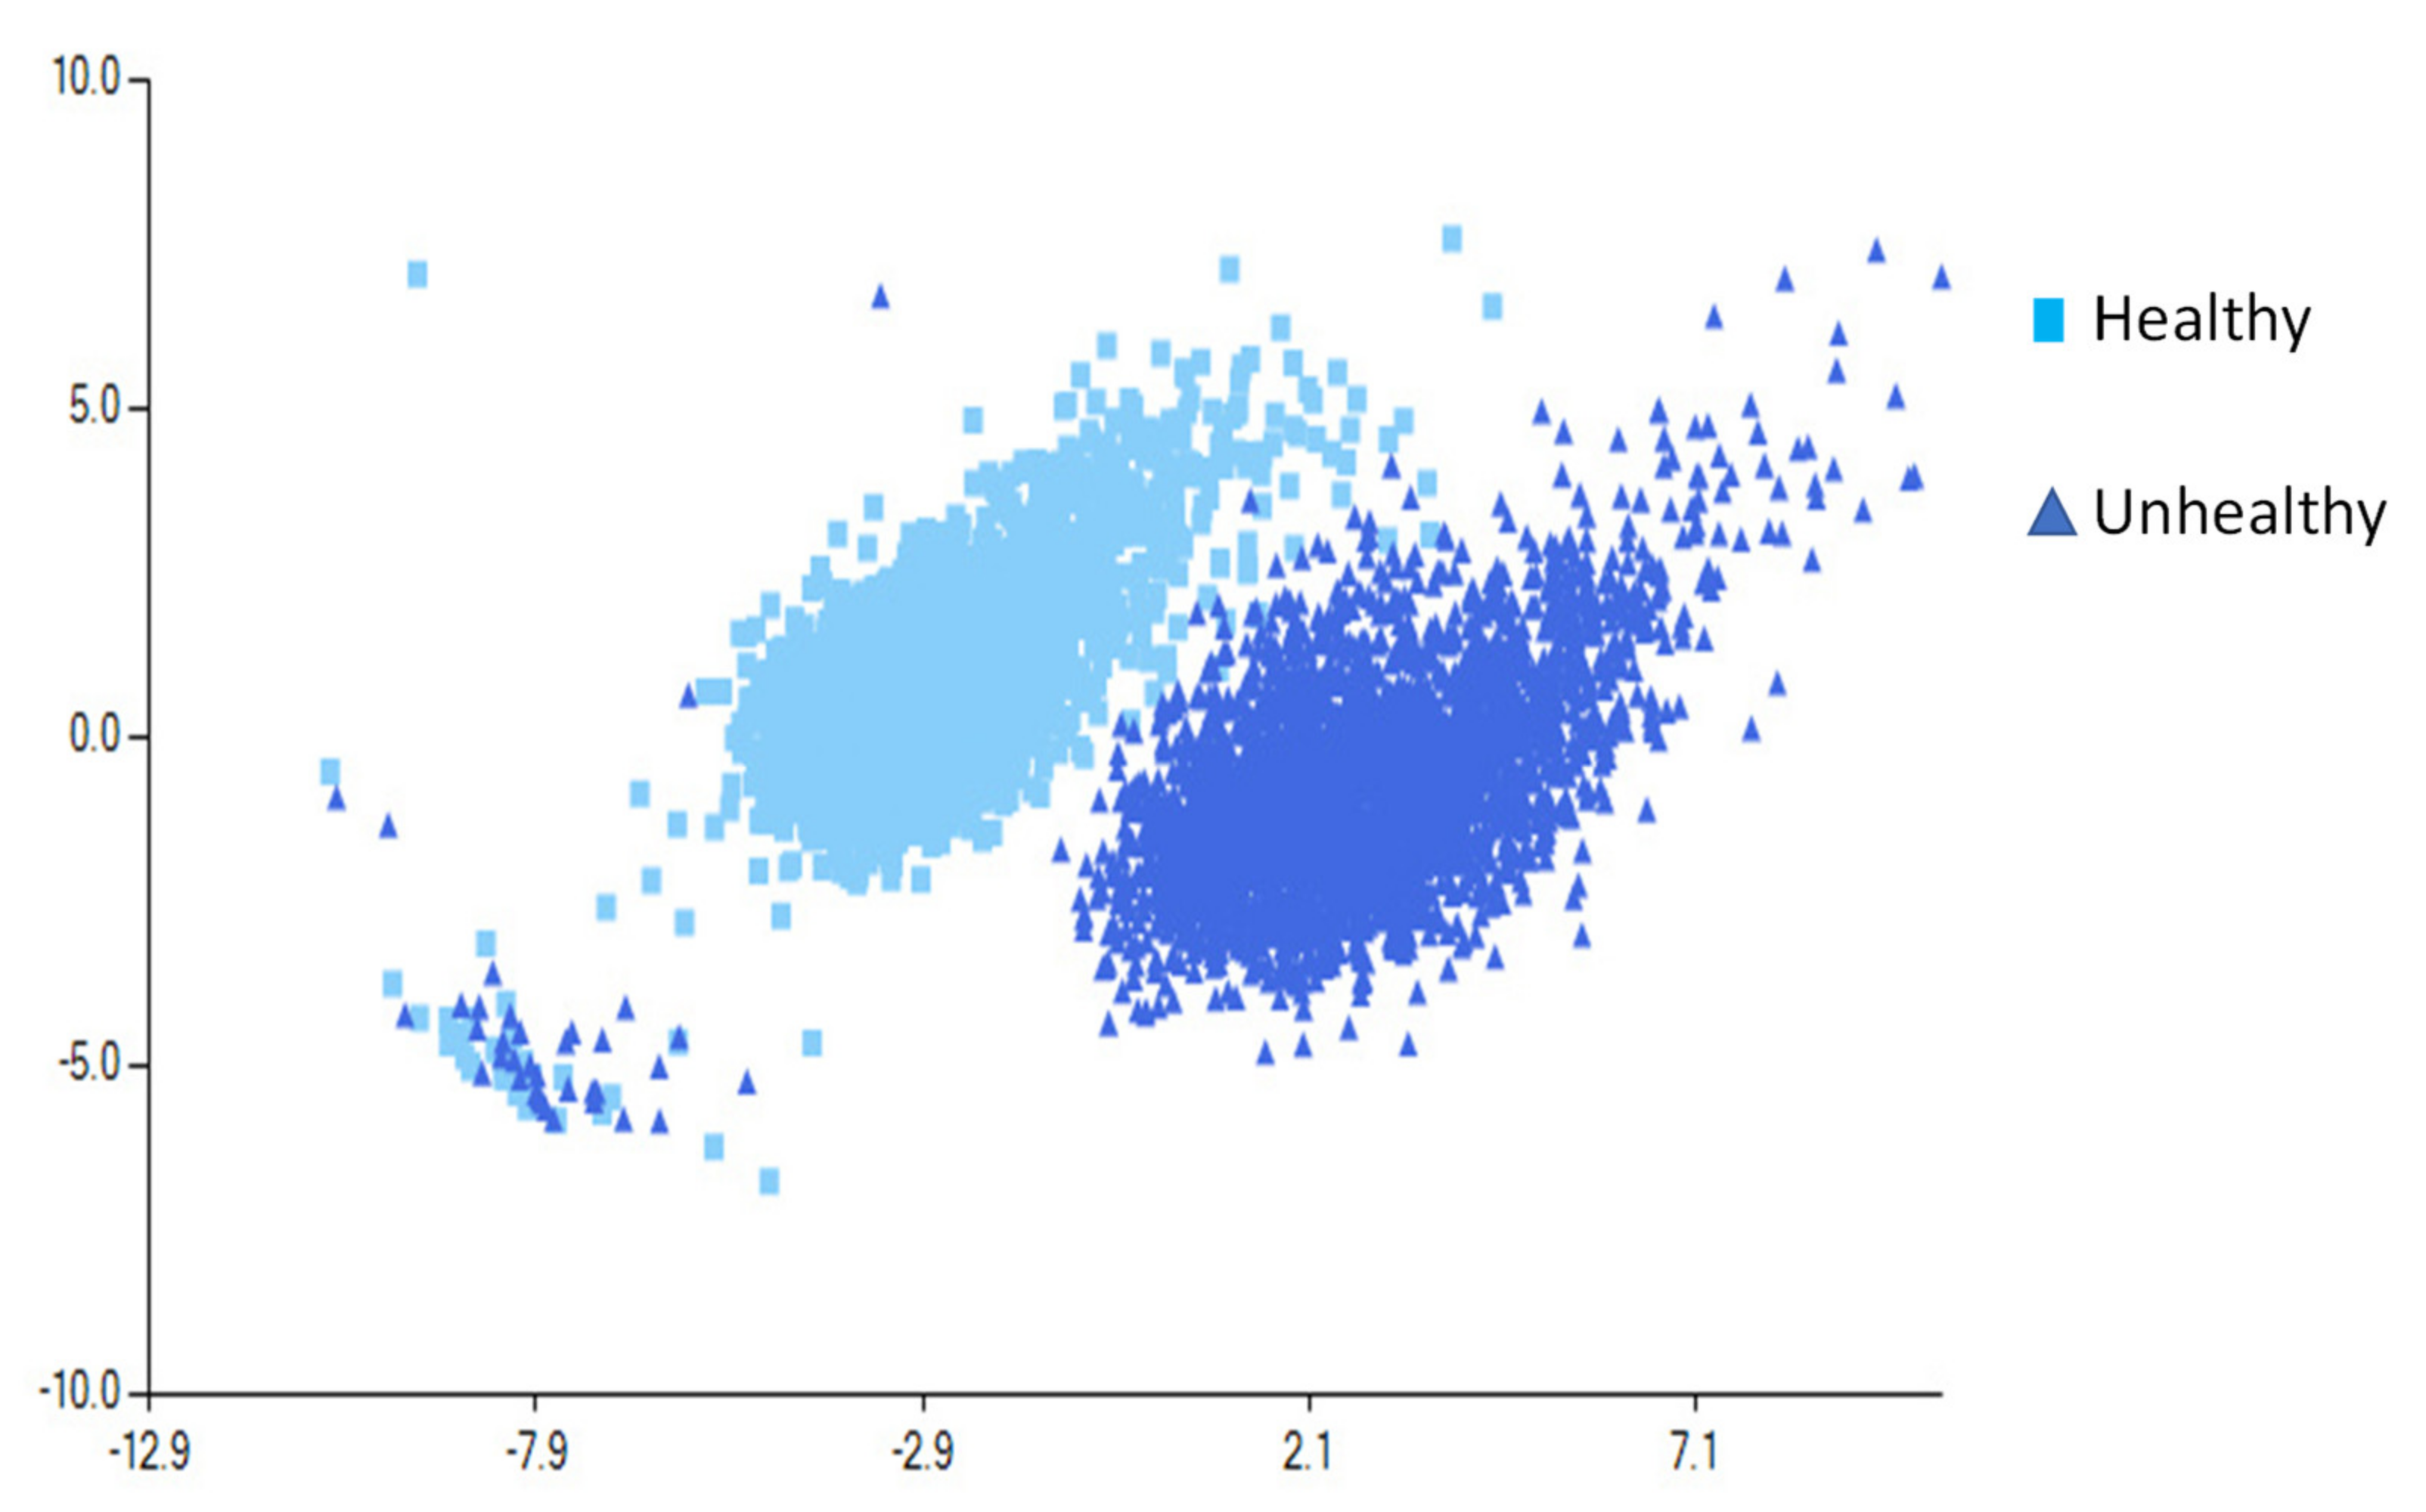
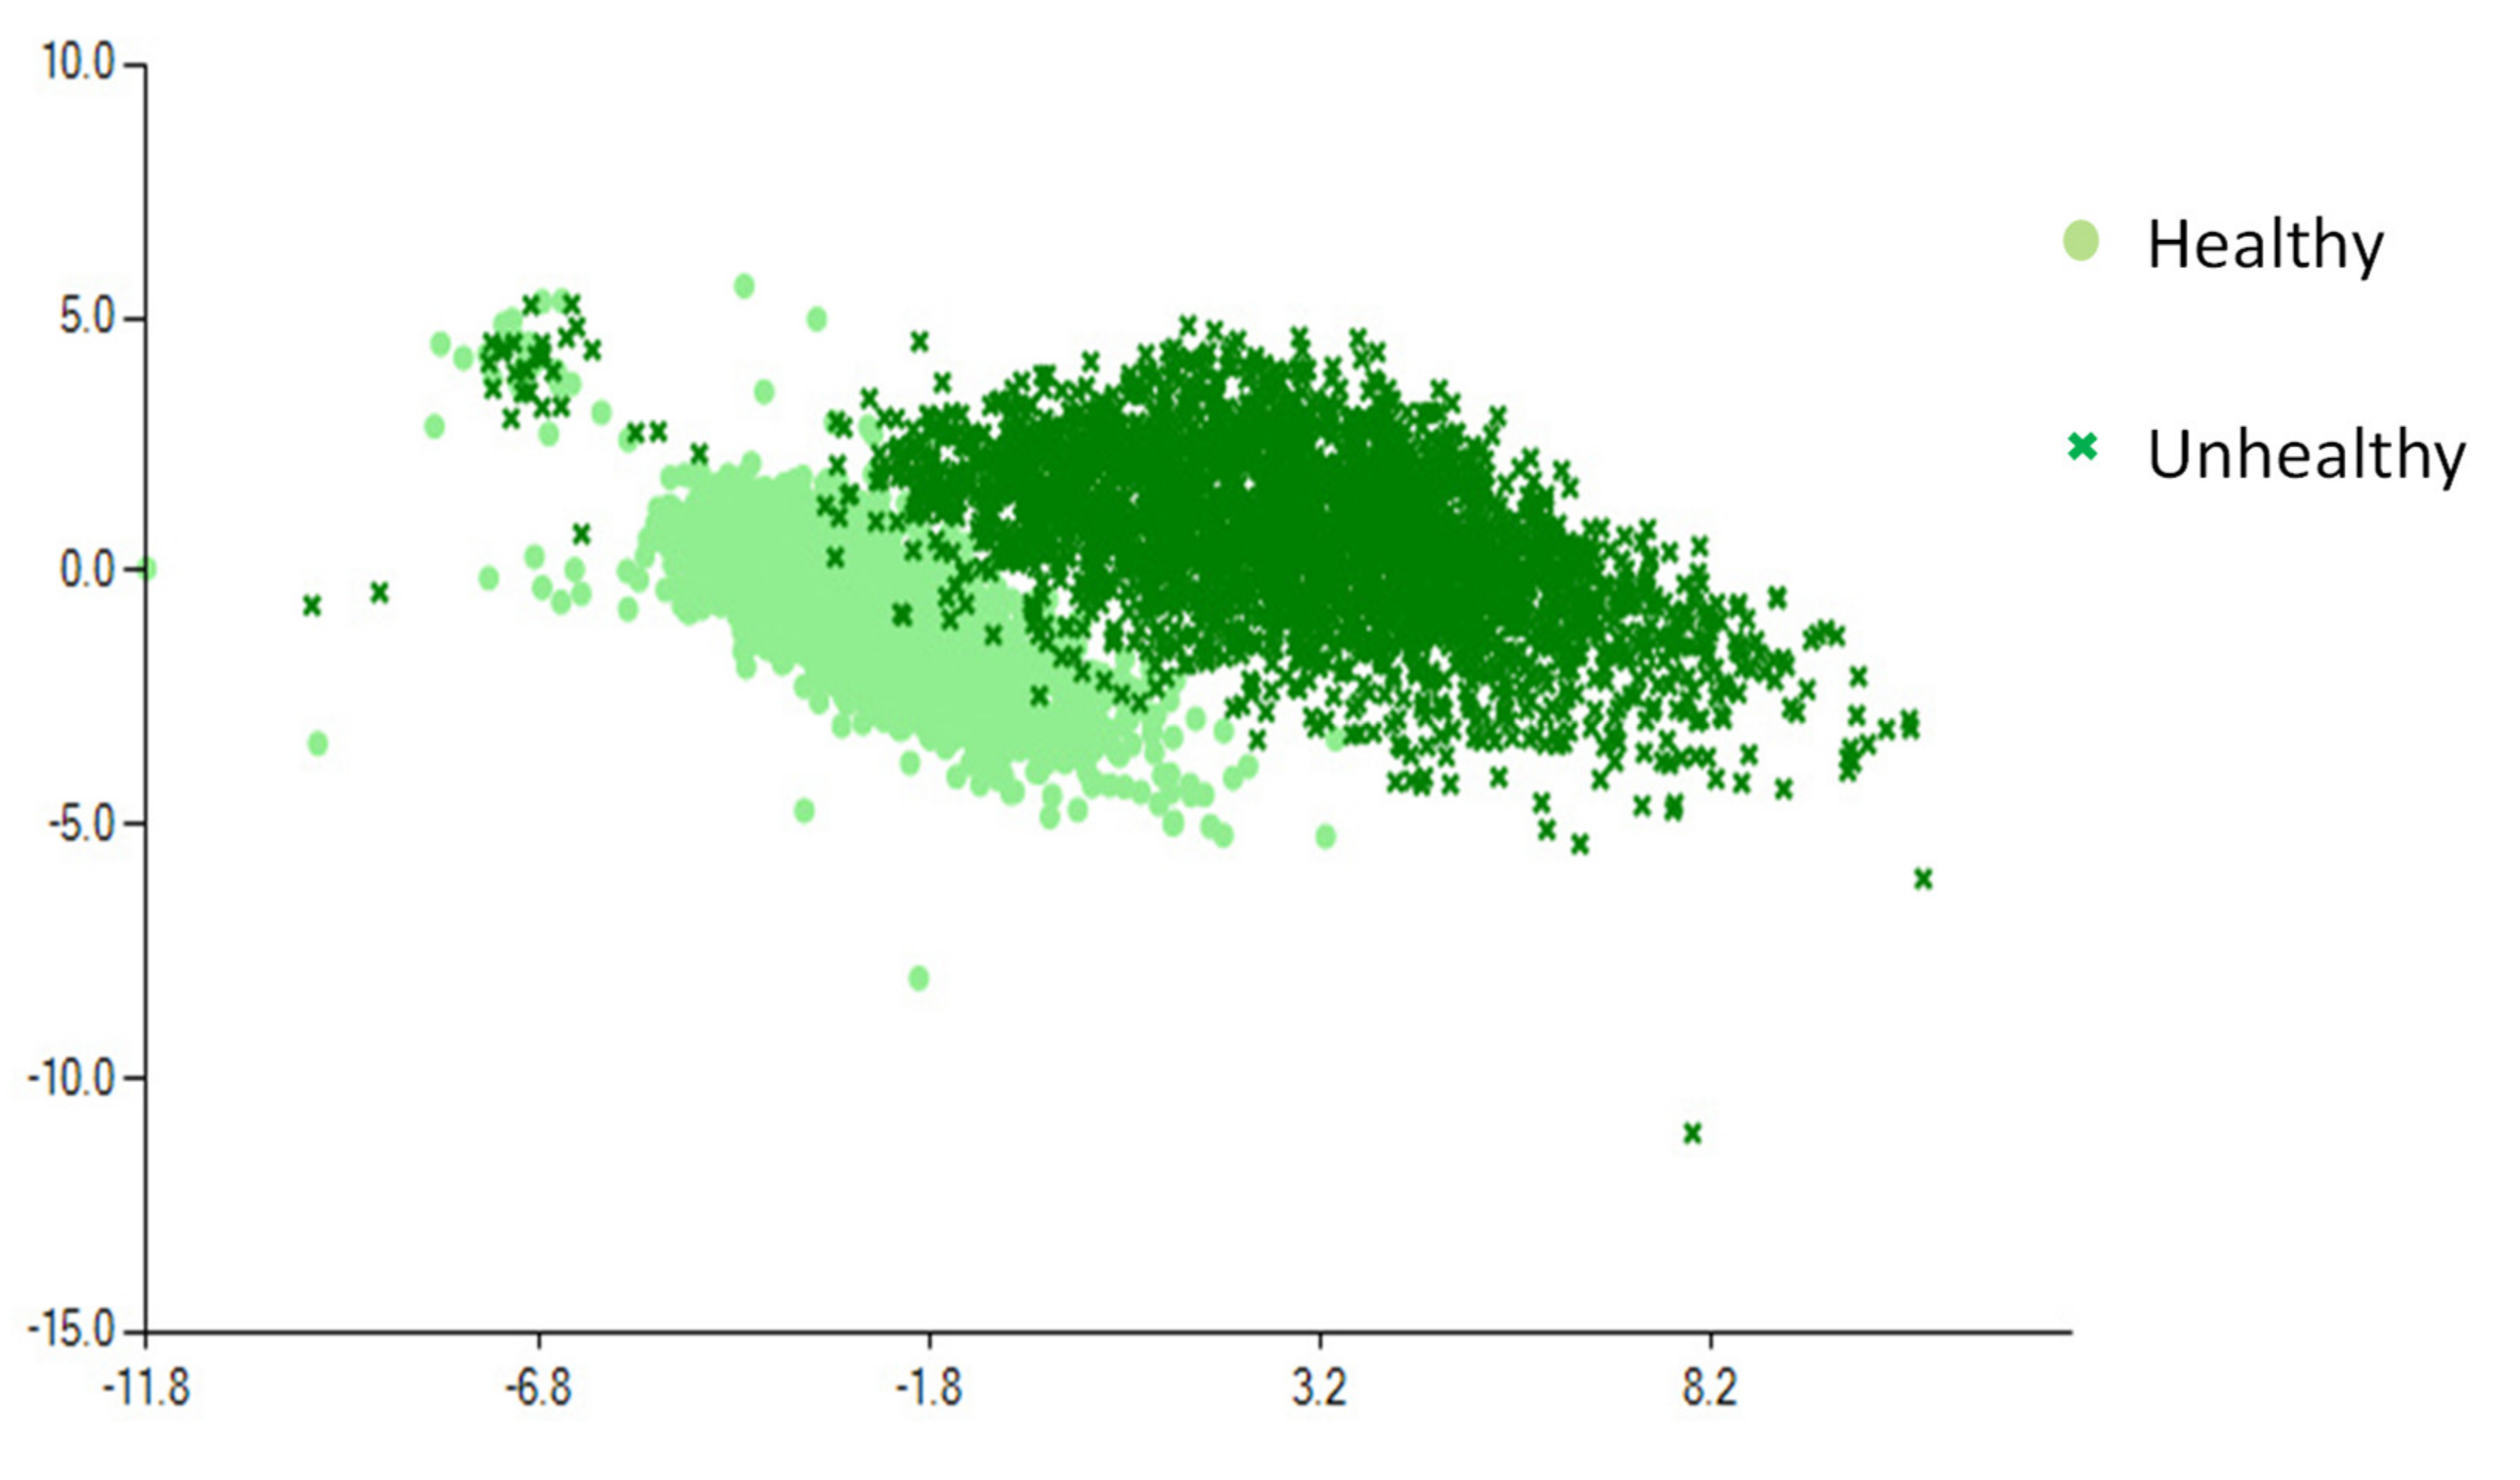
In the experiment, three small five-axis tools were run with the same motion program at the same speed of 4000 rpm. The data on the normal and abnormal states of the spindle eccentricity were collected. The differences under the normal and abnormal eccentricity states are shown based on a comparison of the three five-axis machine tool data, as indicated in
Figure 11,
Figure 12 and
Figure 13.
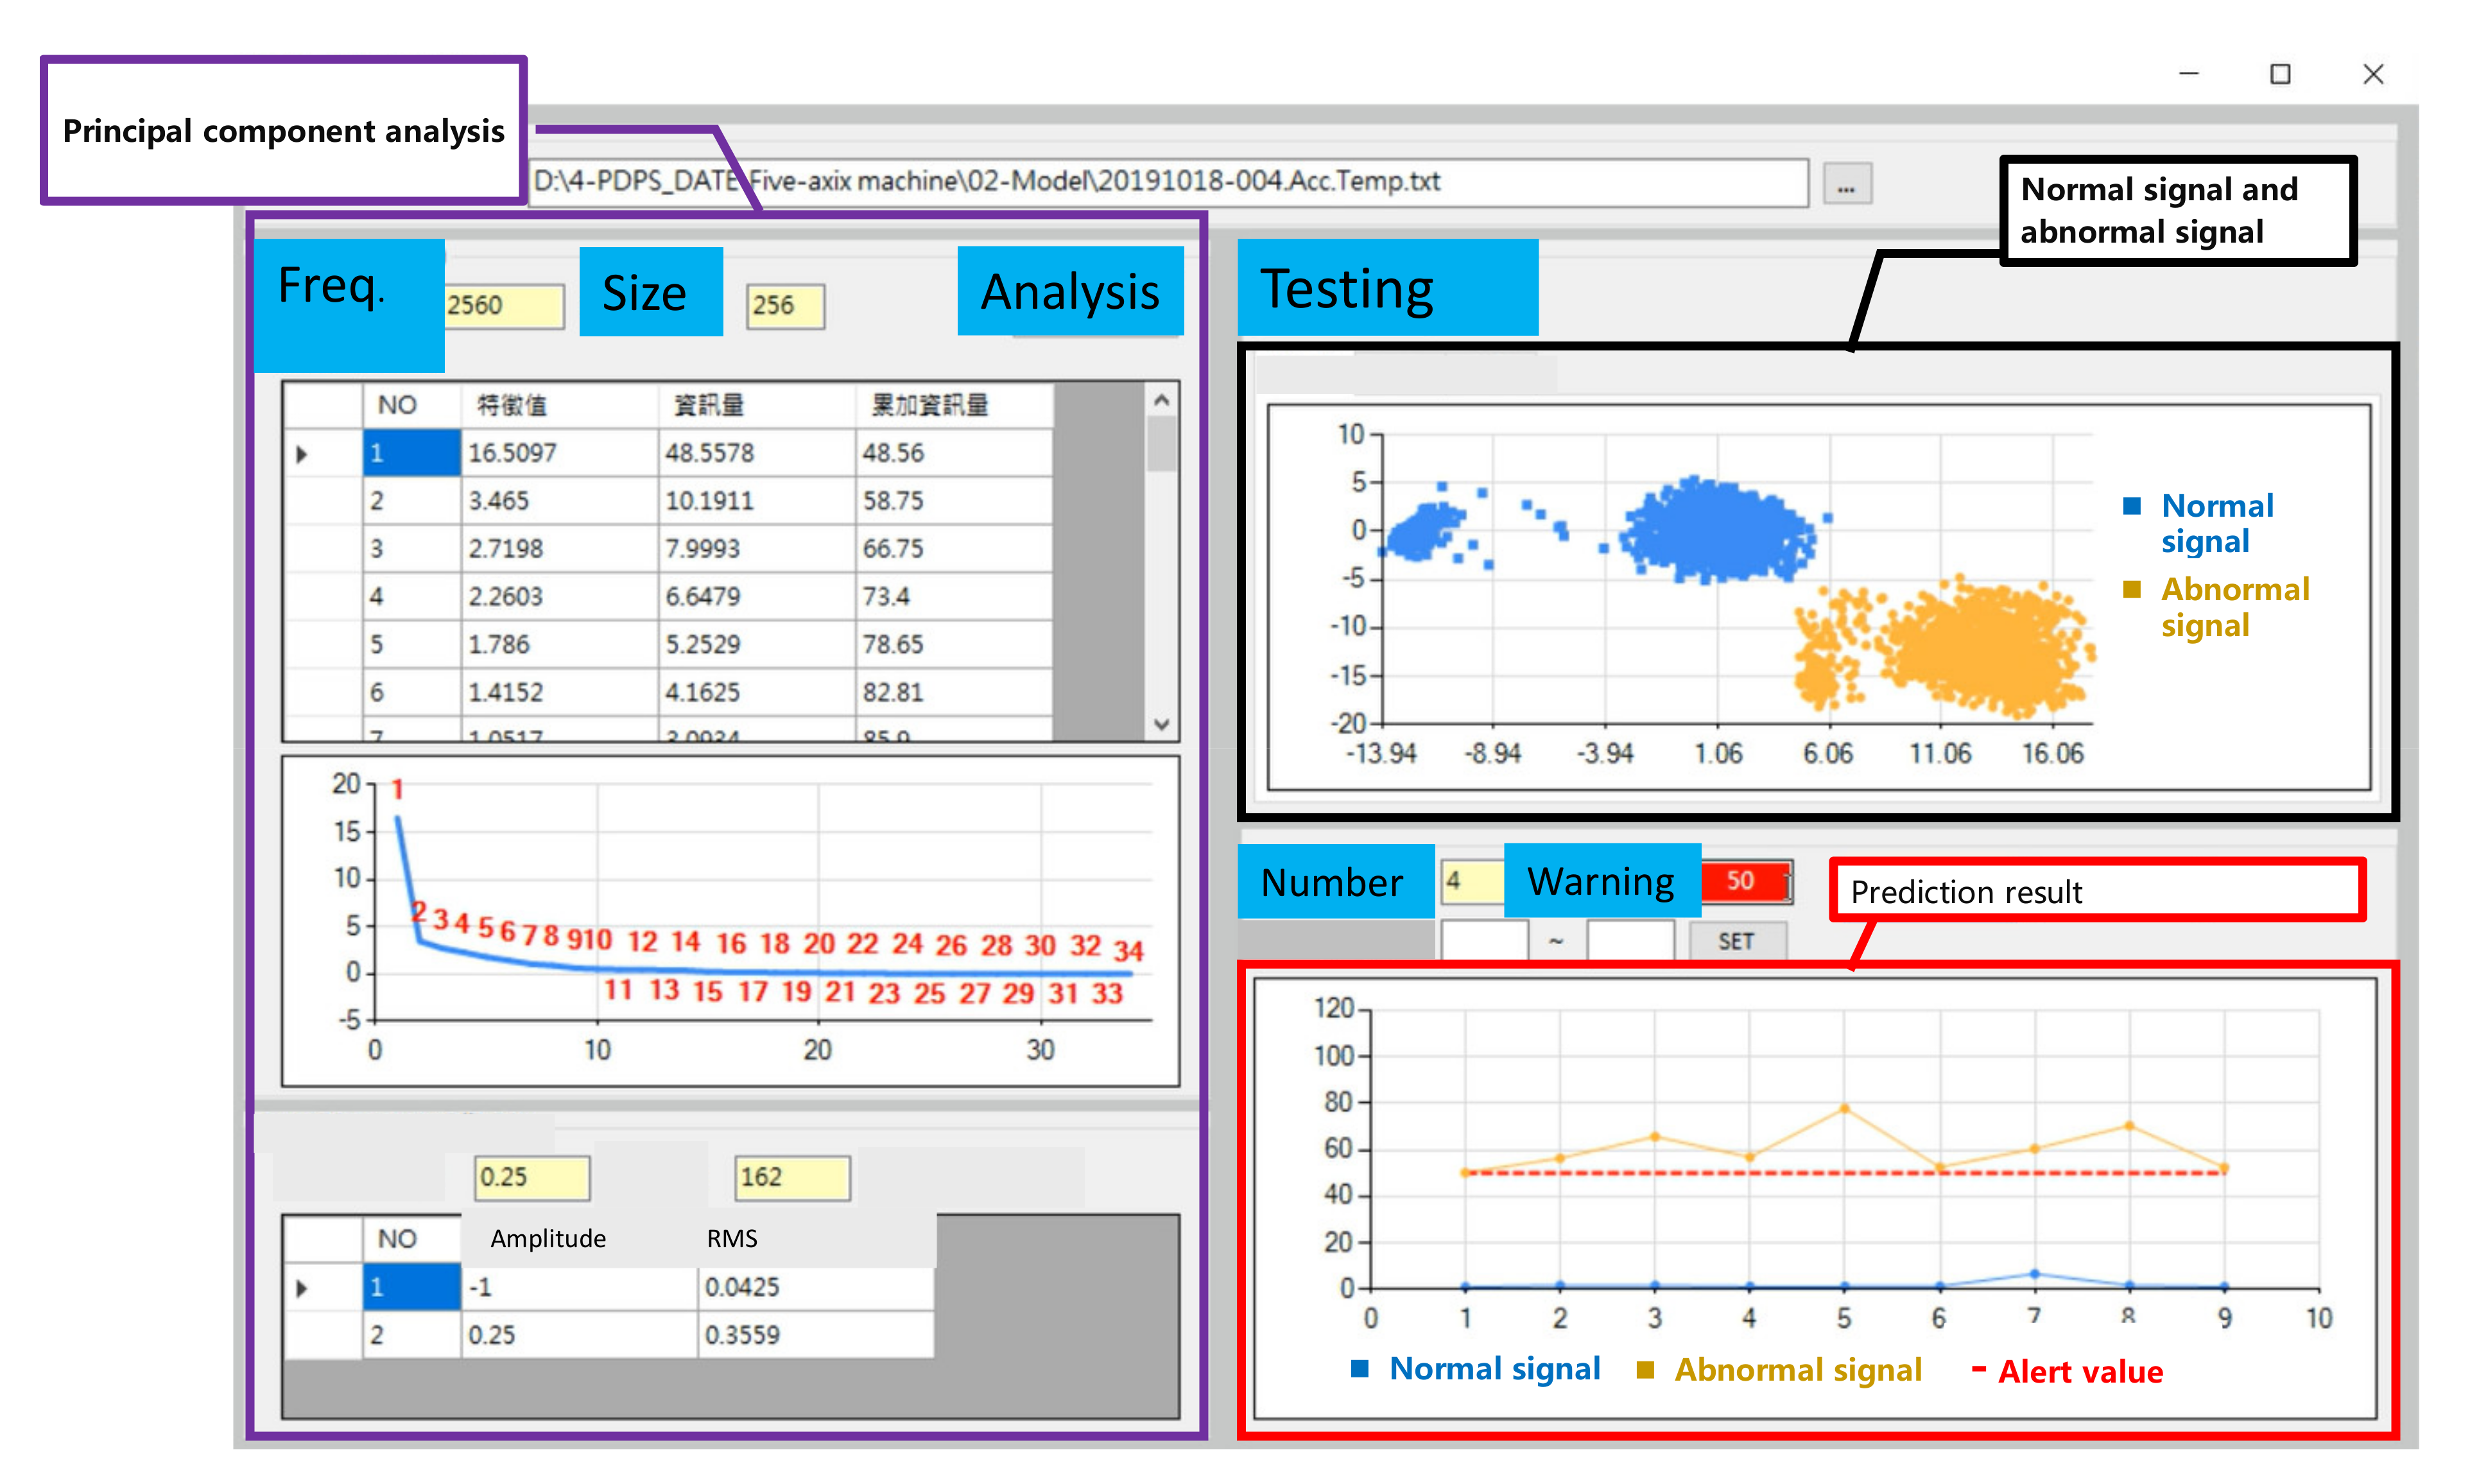
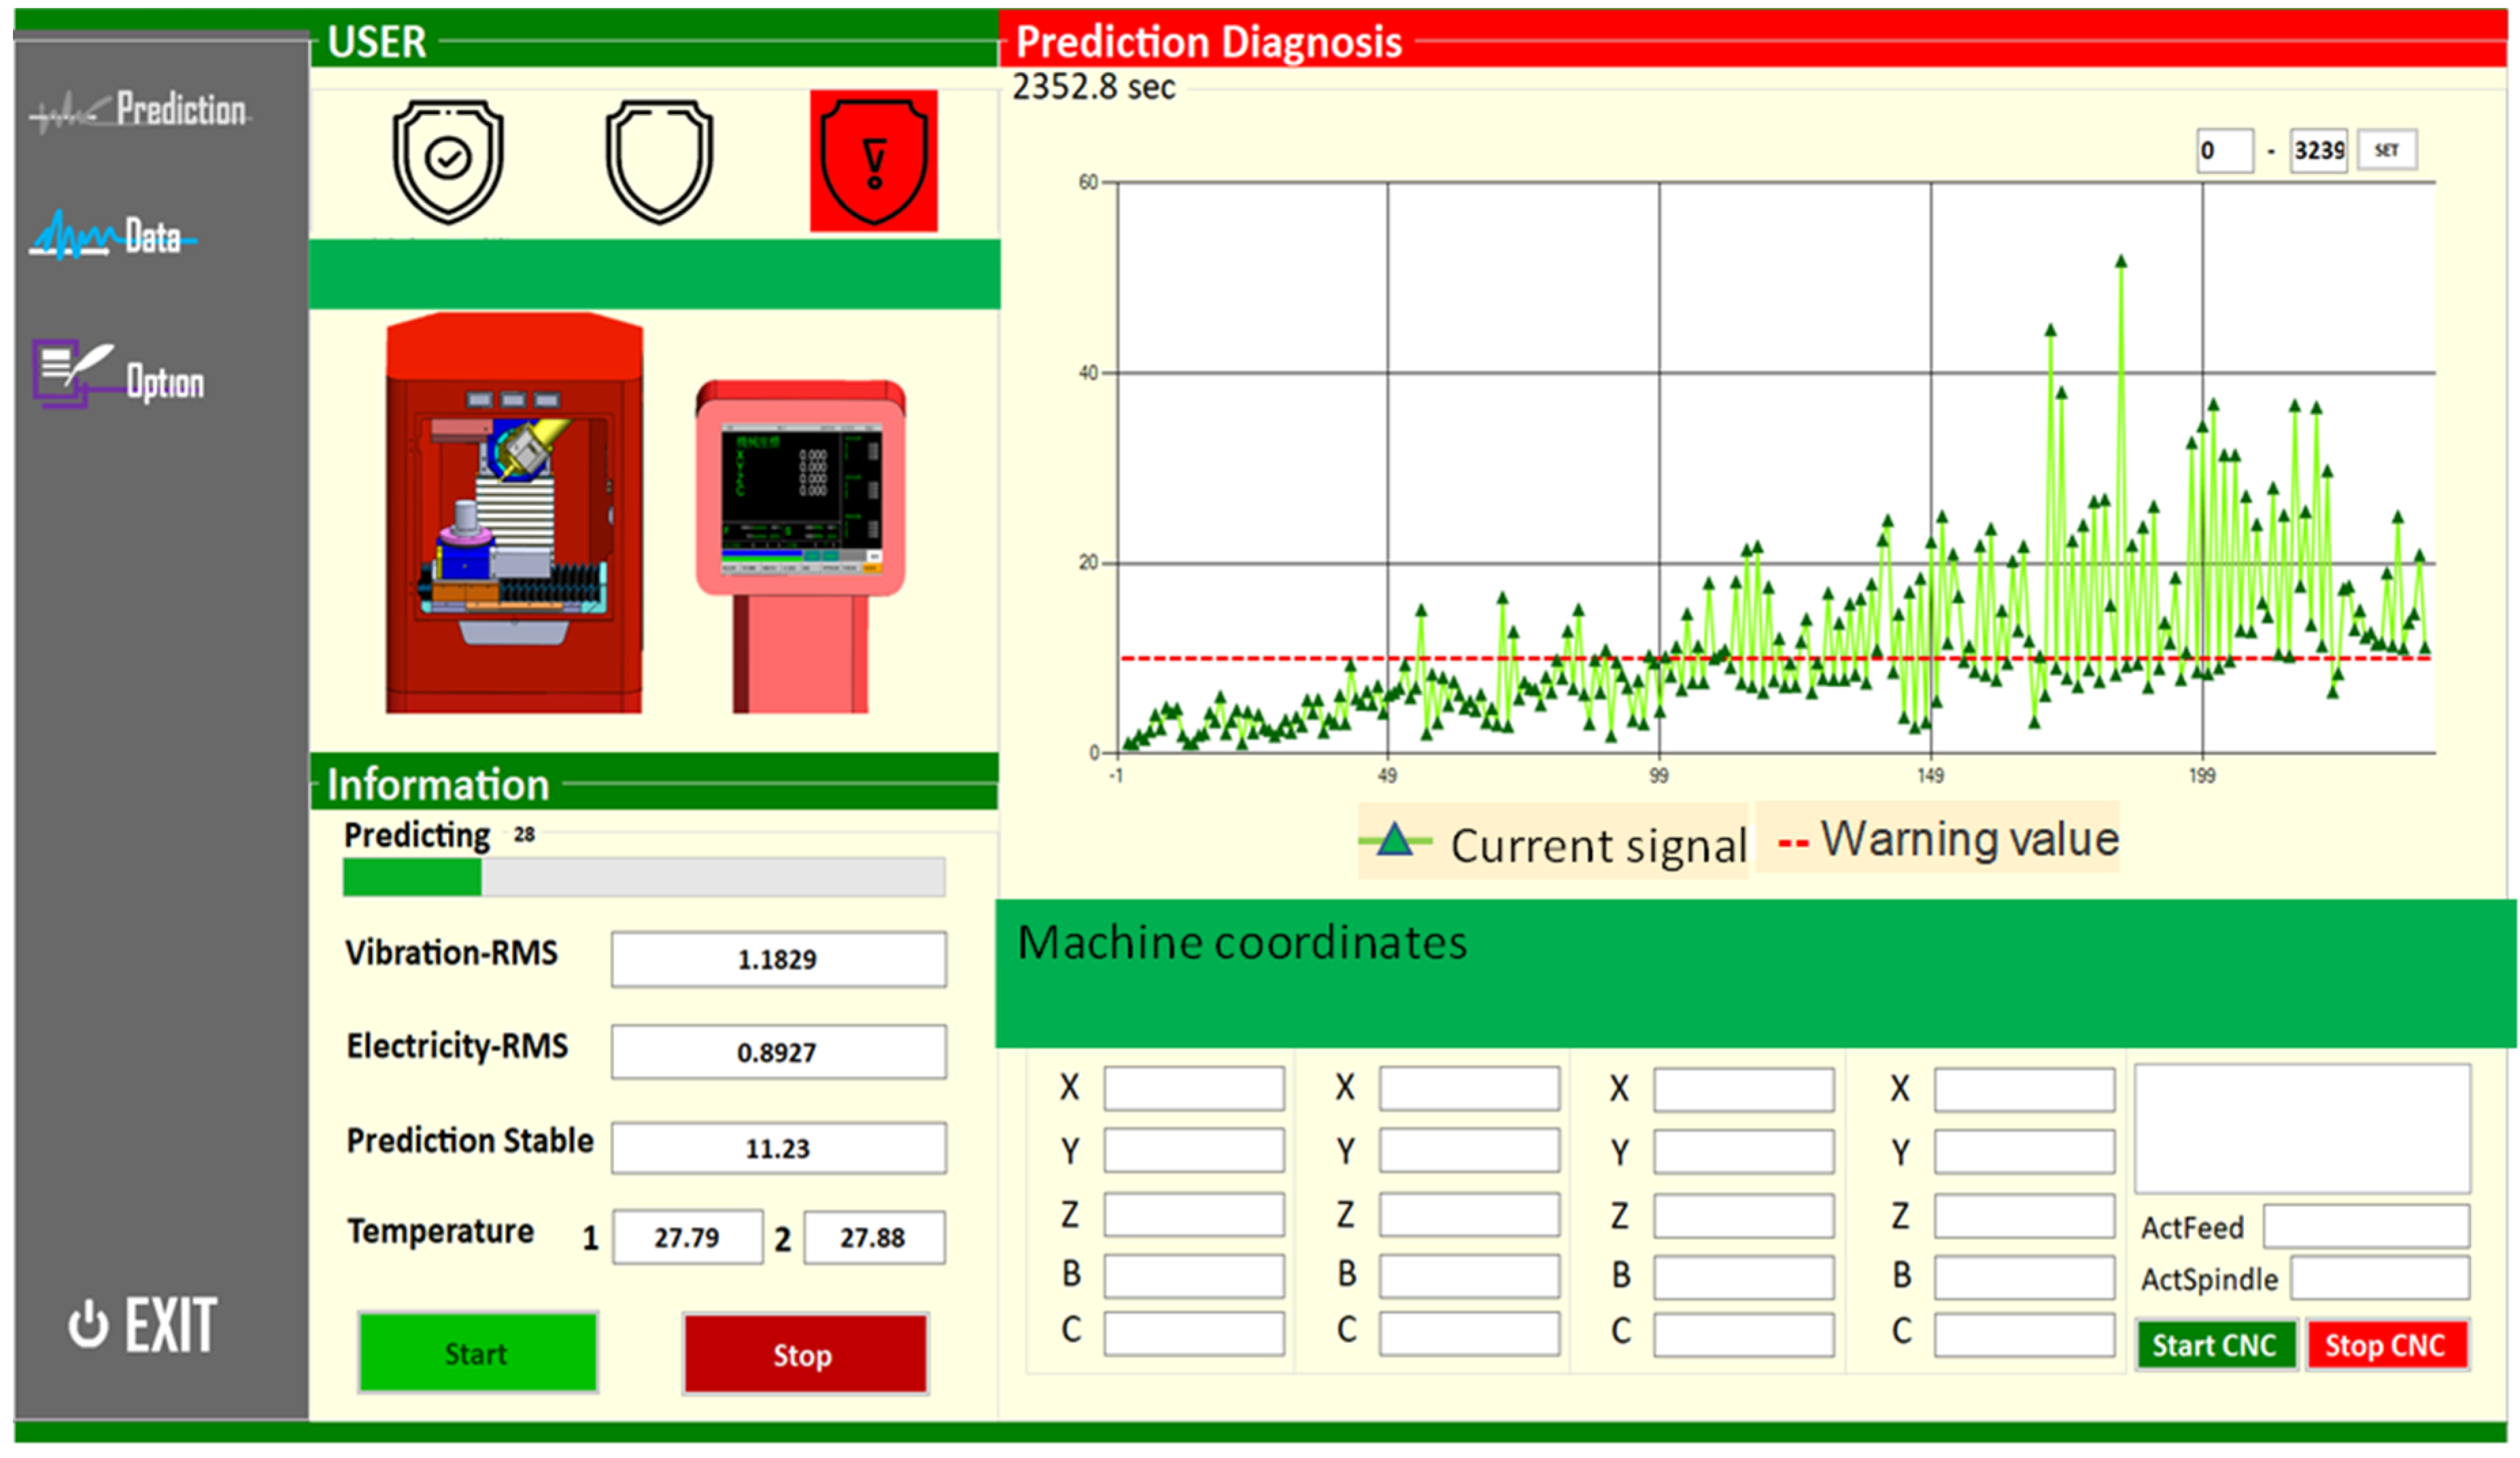
Through the mathematical modeling of a PCA, we identified the health status and abnormal characteristics of the machine, and a predictive value was generated within 10 s. This predictive value can be used to monitor the trend of changes in the health status of the machine during long-term processing to predict the level of production.
Figure 14 shows the case and interface of the real-time monitoring software used by the machine tools. The machine started to operate normally. However, after a period of operation, the health of the machine gradually declined. The predicted value grew closer to the red alert value and eventually exceeded the development trend.
The manufacturing industry is currently facing four major challenges: a lack of flexibility in manufacturing, shorter delivery times, a lack of adequate workers, and an insufficient production efficiency.
To assist enterprises, a change is required in the factory management. Enterprises must digitize their data, use networking platforms, and develop application service modules.
The following three main steps can transform smart manufacturing: (1) the digitalization of the production processes and production management, which will help the industry adopt a manufacturing execution system and engage in enterprise resource planning; (2) the development of a network services platform, i.e., a platform as a service, for enterprises; (3) the development of software models for different industries, i.e., software as a service. These models should be flexible and can be combined with each other. Furthermore, integrating the knowledge from different industries and creating different service models is necessary.
The smart manufacturing case for the machine tools industry is shown in
Figure 11. Smart platform technologies include automatic scheduling, simulation analysis, intelligent equipment, automatic parameter adjustment, and production line visualization. Furthermore, the application service module is based on digital production and a networking platform.
By integrating software and hardware technologies, the value of machines can be increased. Developing software can help consolidate the innovative capabilities of the industry and create smart machinery services based on the market demand. Furthermore, total solutions developed for smart manufacturing and increased competitiveness are required. For example, some machine tool software packages will be designed using edge computing for necessary real-time applications, while other packages will be designed for the cloud for more extensive applications. Some packages can use both edge computing and the cloud.
6. Conclusions
Through smart manufacturing, companies can improve their working environment, and enhance the productivity and competitiveness of related industries. This study proposed a digital intelligent diagnosis of miniature machine tools.
Developing a solution-based ecological system of smart machinery products for the machine tool industry is therefore necessary. In addition, it is essential to reduce the pressure on structural variations in labor and accelerate the accumulation of capital manpower. Developing innovative industrial production processes will greatly enhance productivity. The objective of this study was to help manufacturers in need of equipment/production line upgrade and to assist suppliers in integrating hardware and software. This study introduced the main technology processes and cases for industrial smart manufacturing applications for machine tools. Furthermore, a miniature machine tool health monitoring application was developed to avoid time delays and loss from damage. Therefore, in addition to explaining the key framework of intelligent manufacturing of machine tools, this research can be used in an online diagnosis of such tools through modeling technology, allowing the user to monitor the machine health. This research can also be a reference for the advancement of intelligent manufacturing in the machine tool industry, providing a feasible method that allows the intelligent functions of machine tools to continue increasing in the future. In the future, relevant research can be extended to the application of health diagnosis technology for the production line and smart factory.

