
Need-Based and Optimized Health Insurance Package Using Clustering Algorithm

 , and
, and
Abstract
:1. Introduction
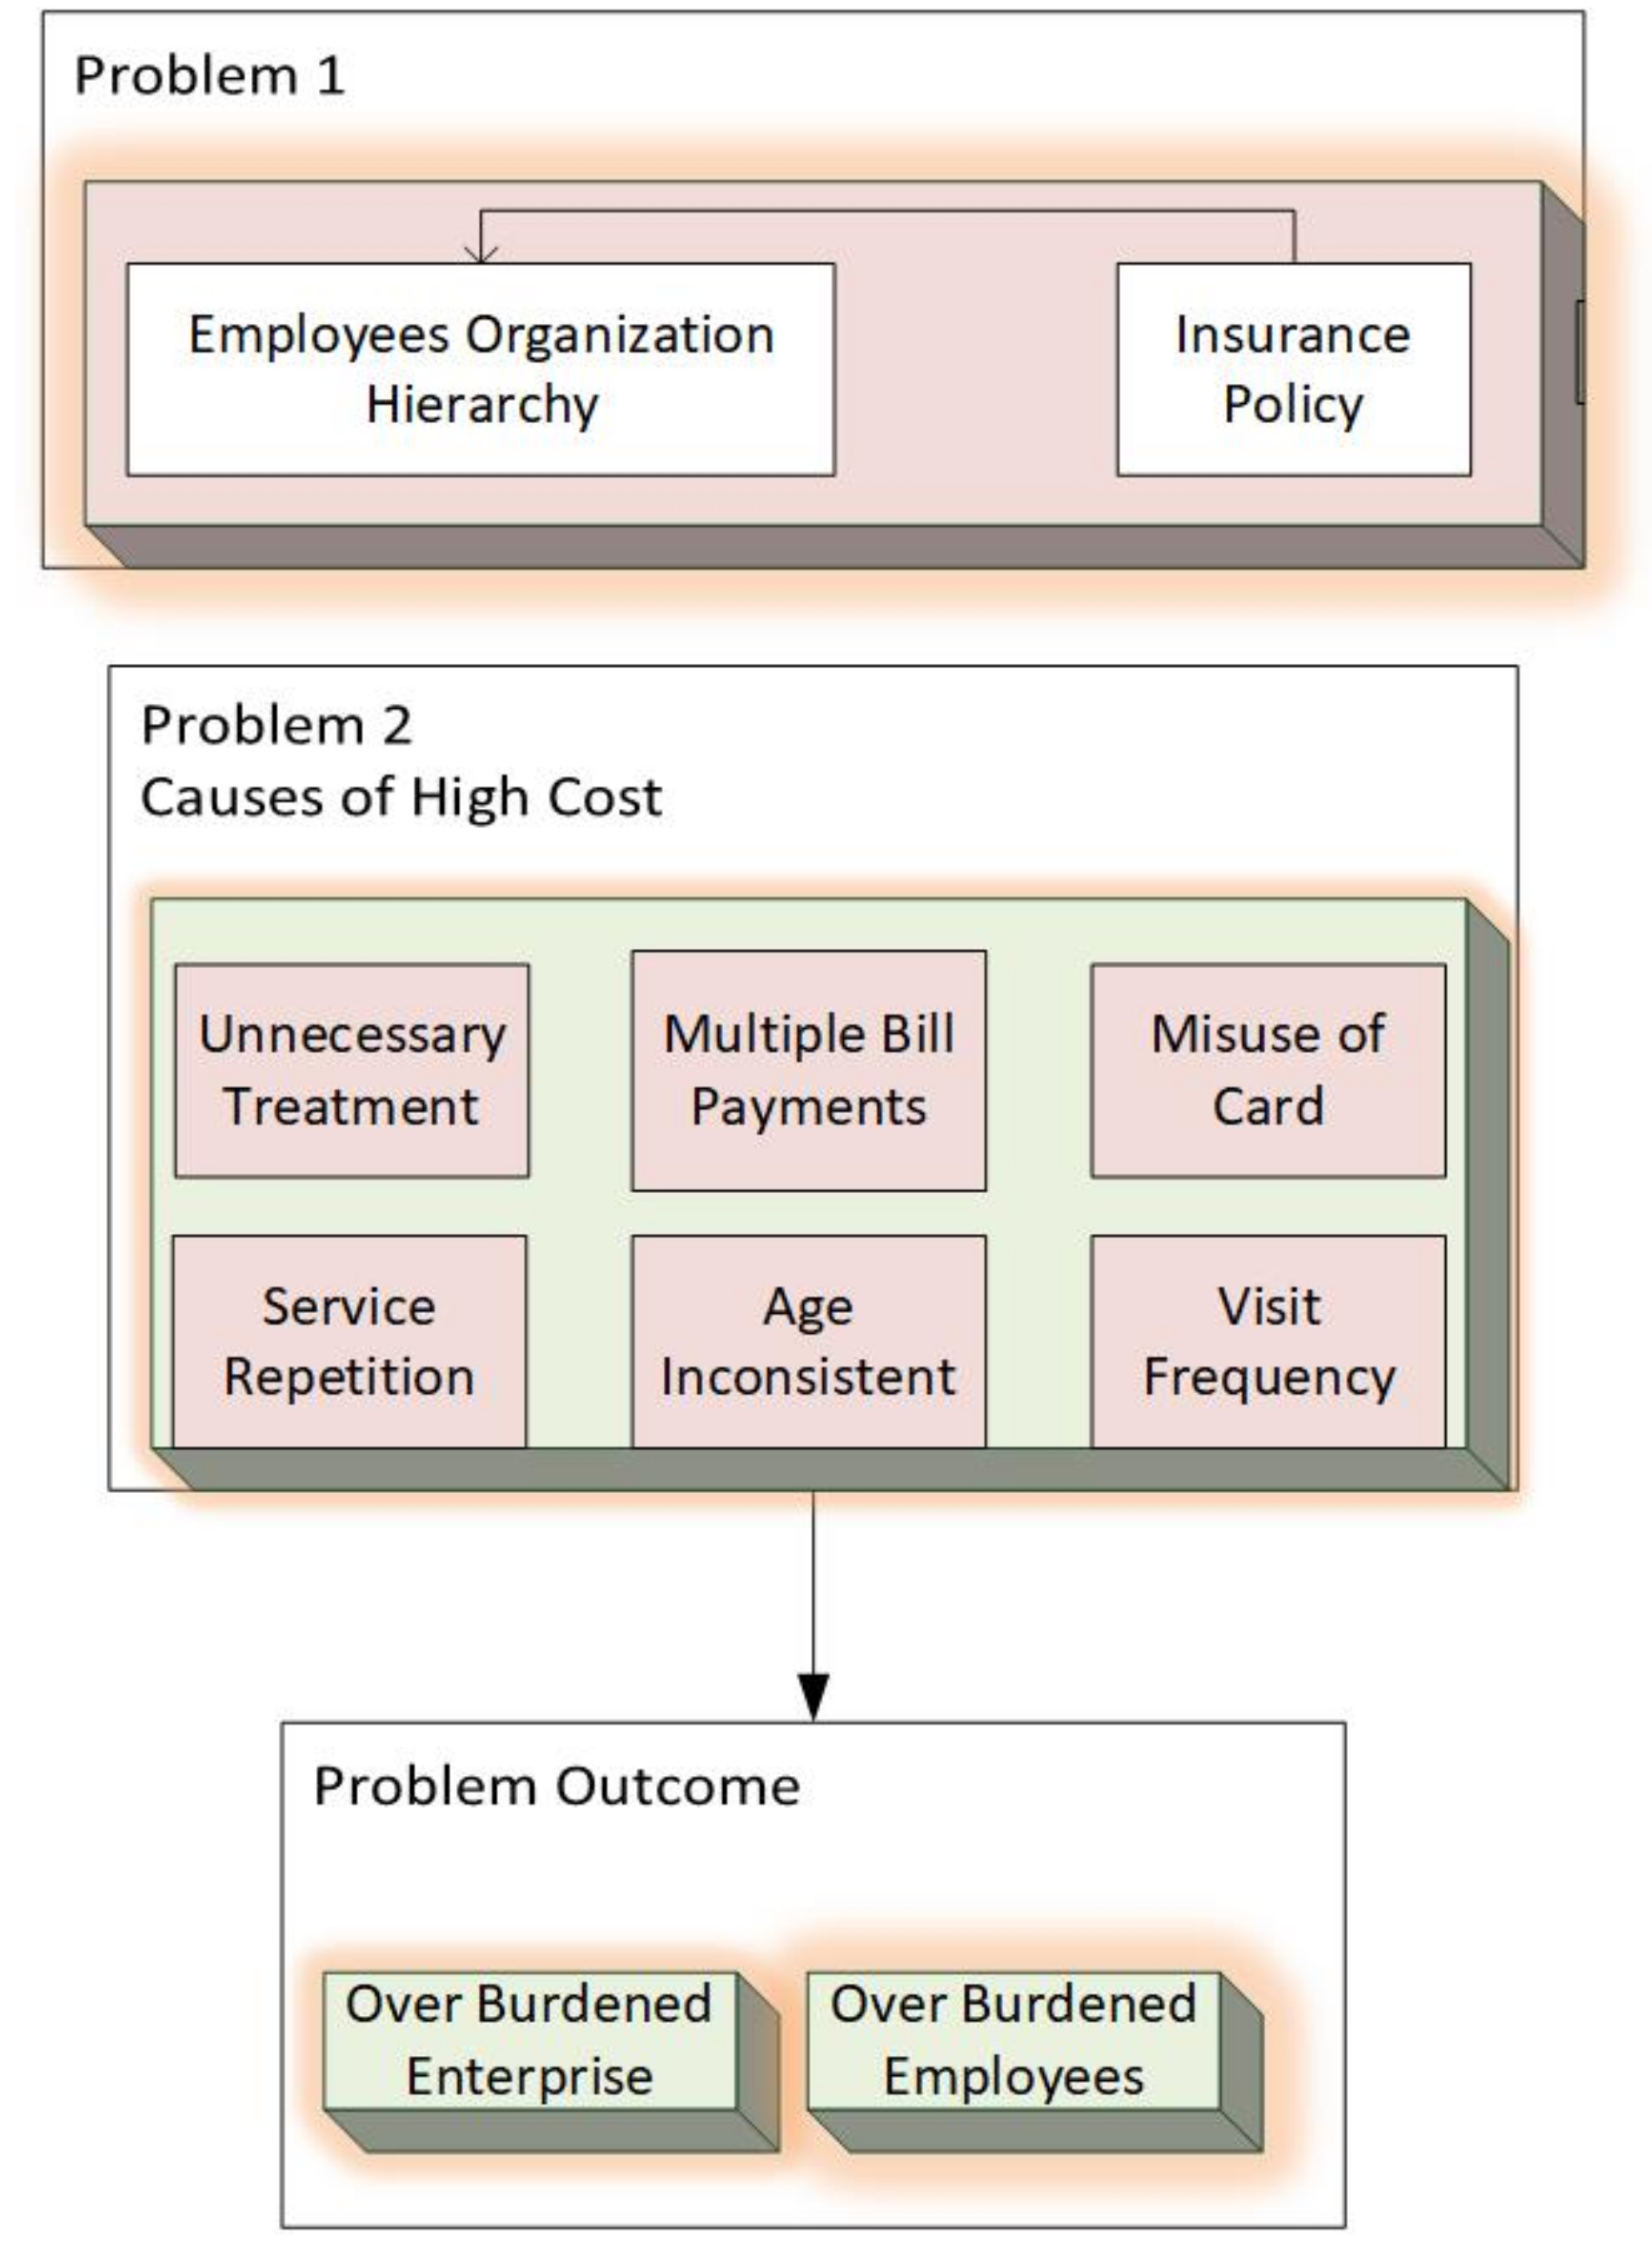
1.1. Problem Description
1.2. Research Contributions
- 1.
- Incorporates medical benefit optimization using kmeans clustering and probability distribution model.
- 2.
- Generates employee need-based health insurance packages for enterprises and insurance companies. The historical medical records of employees are analyzed for generating these packages.
- 3.
- Provides detailed data-driven analysis for medical benefit optimization by defining lower and upper bounds for each package amount and estimation of out of pocket employees in each category.
2. Related Work
3. Materials and Methods
3.1. Need Based Package Generation Using Clustering
| Algorithm 1: Need based Package generation using clustering and mapping. |
 |
3.2. Medical Benefit Computation Using Generated Packages
| Algorithm 2: Medical benefit computation using generated packages. |
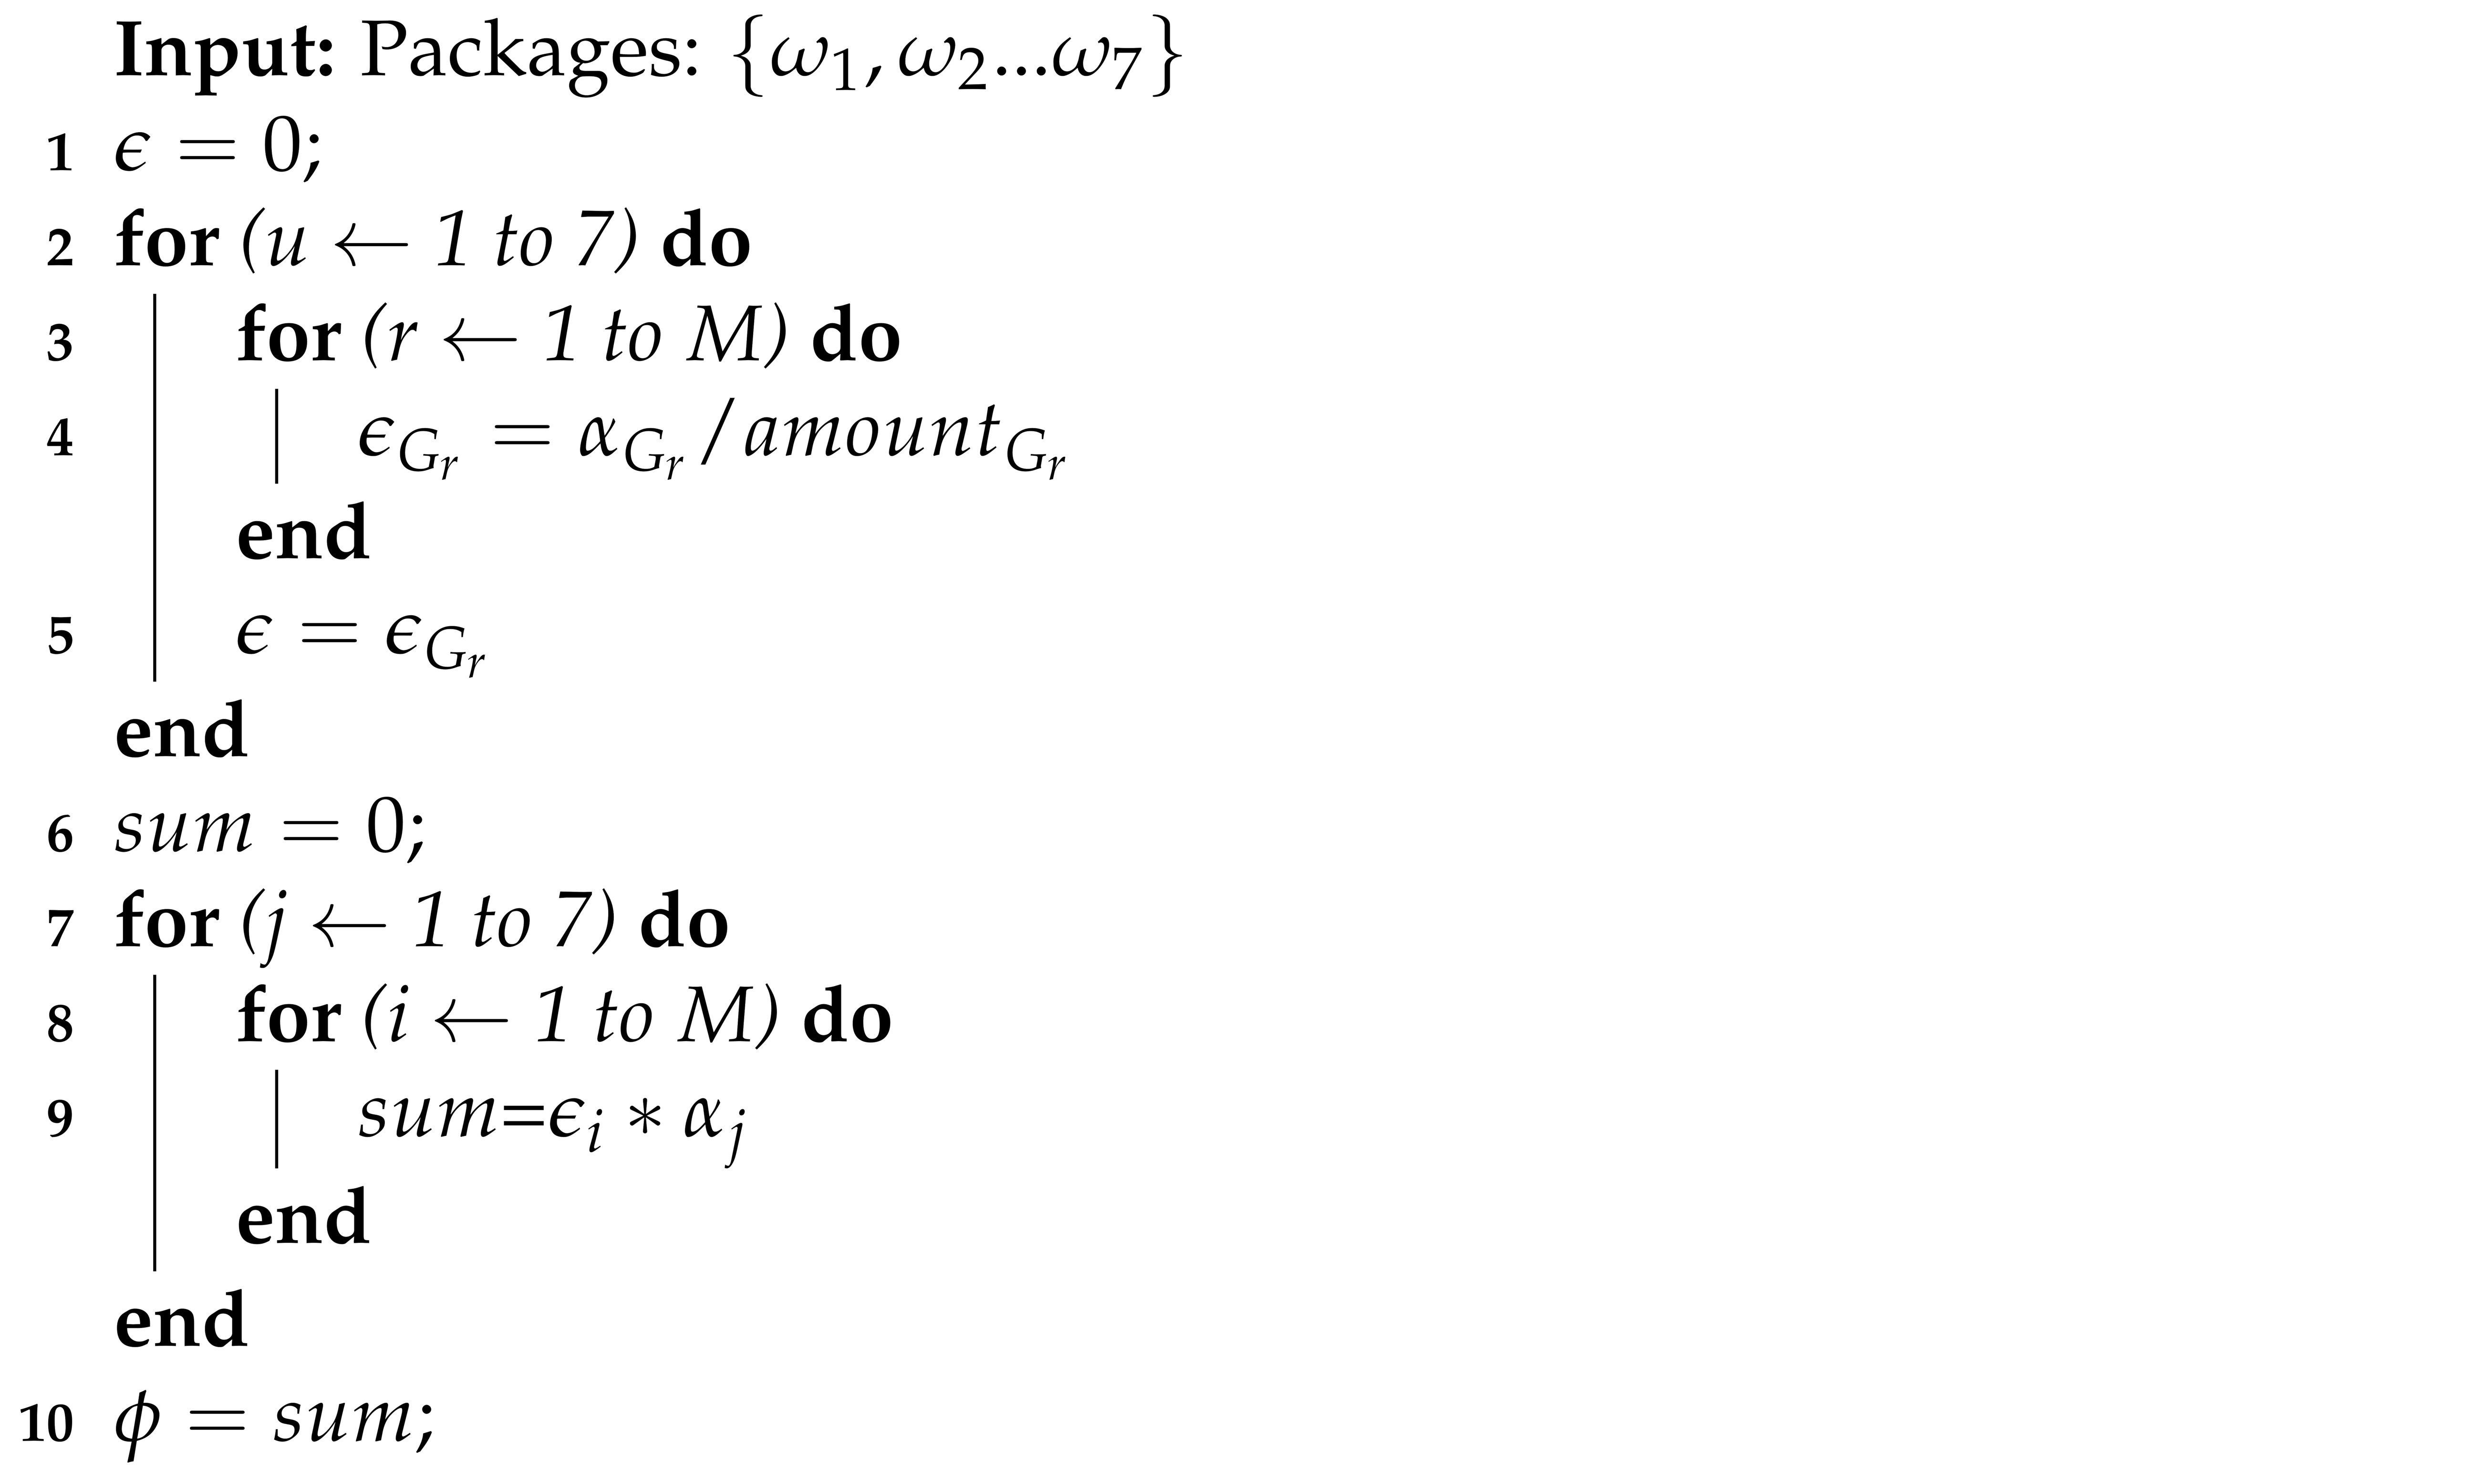 |
3.3. Data Driven Analysis Using Probability Distribution Model
- 1.
- Lower and upper bound for each group of each category and
- 2.
- Out of pocket employees before and after optimization
- 3.
- Estimation of total medical benefits amount by using a probability distribution model
| Algorithm 3: Data driven analysis using probability distribution Model. |
 |
4. Results and Analysis
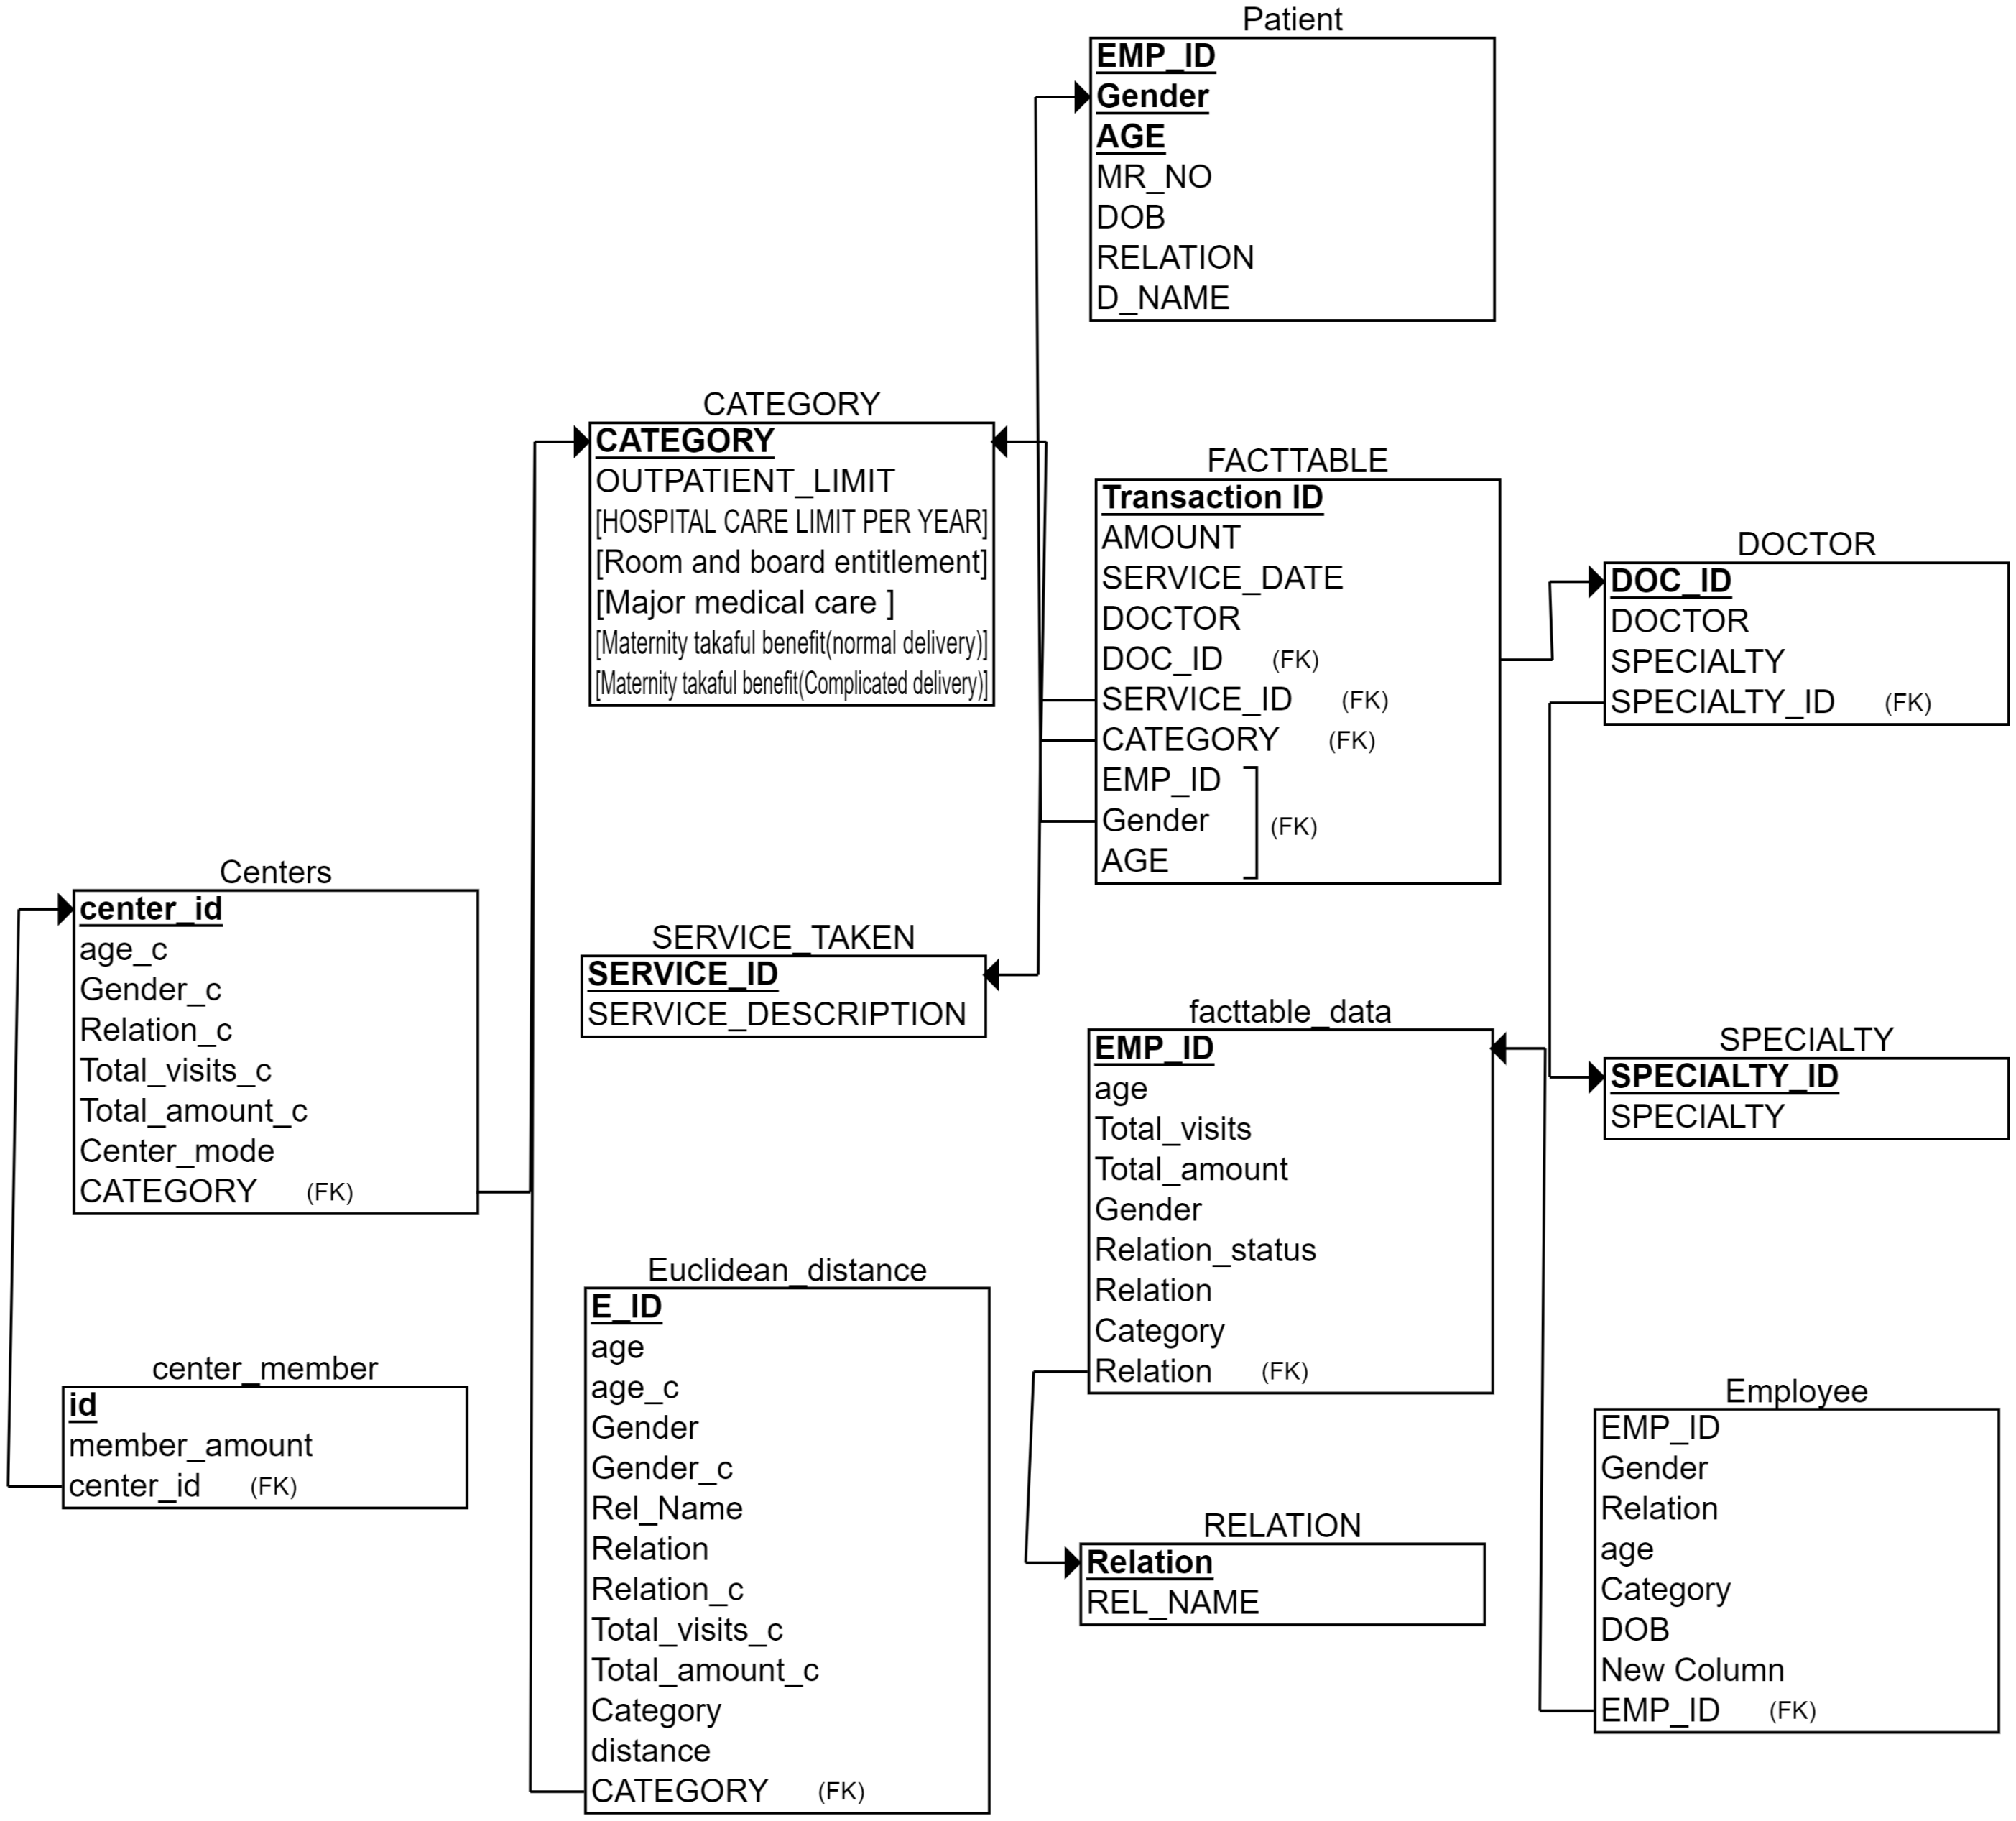
4.1. Data Preparation
4.1.1. Case 1: T <
4.1.2. Case 2: T >
4.1.3. Case 3: Need of Employees Changes with Time
4.1.4. Case 4: T =
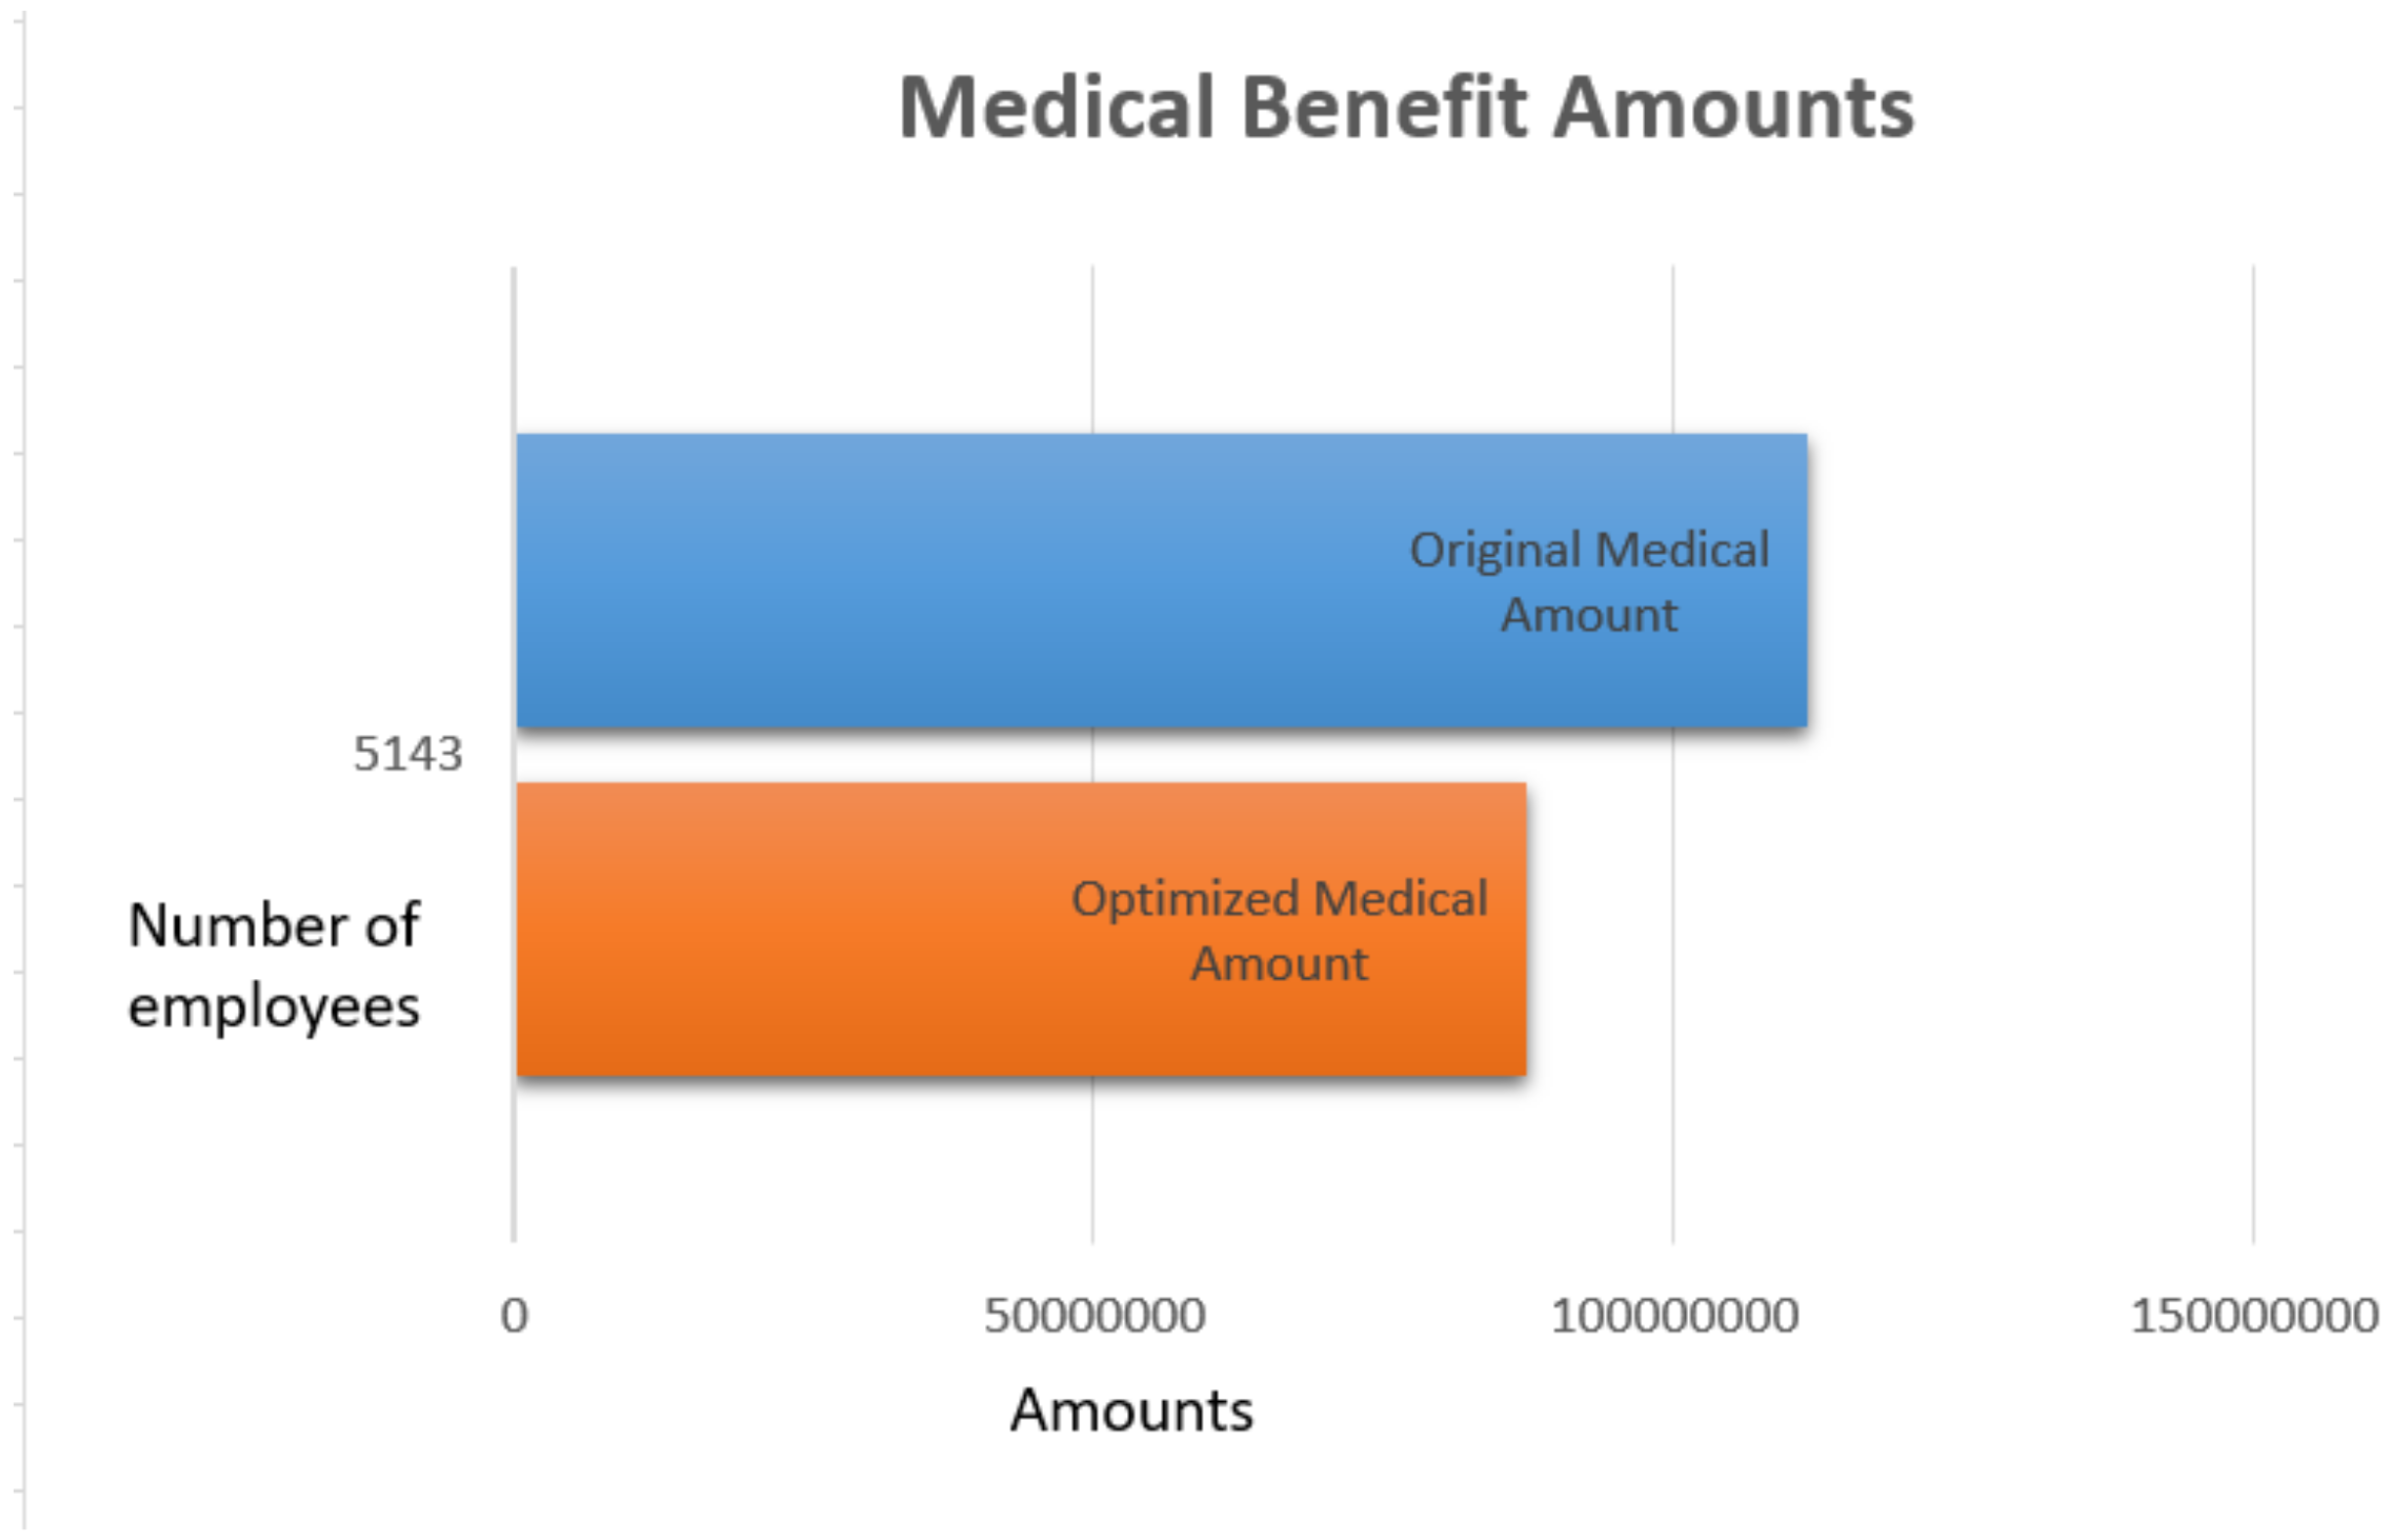
4.1.5. Observation
5. Discussion
6. Practical Implications
7. Limitations
8. Conclusions and Future Work
Author Contributions
Funding
Institutional Review Board Statement
Informed Consent Statement
Acknowledgments
Conflicts of Interest
Appendix A
References
- Rao, S. Health insurance: Concepts, issues and challenges. Econ. Political Wkly. 2004, 39, 3835–3844. [Google Scholar]
- Radermacher, R.; Dror, I.; Noble, G. Challenges and strategies to extend health insurance to the poor. In Protecting the Poor: A Microinsurance Compendium; ILO: Geneva, Switzerland, 2006. [Google Scholar]
- Ding, K.; Lev, B.; Peng, X.; Sun, T.; Vasarhelyi, M.A. Machine learning improves accounting estimates: Evidence from insurance payments. Rev. Account. Stud. 2020, 25, 1098–1134. [Google Scholar] [CrossRef]
- Groba, C.; Sartal, A.; Vázquez, X.H. Solving the dynamic traveling salesman problem using a genetic algorithm with trajectory prediction: An application to fish aggregating devices. Comput. Oper. 2015, 56, 22–32. [Google Scholar] [CrossRef]
- Dhieb, N.; Ghazzai, H.; Besbes, H.; Massoud, Y. A secure ai-driven architecture for automated insurance systems: Fraud detection and risk measurement. IEEE Access 2020, 8, 58546–58558. [Google Scholar] [CrossRef]
- Kowshalya, G.; Nandhini, M. Predicting fraudulent claims in automobile insurance. In 2018 Second International Conference on Inventive Communication and Computational Technologies (ICICCT); IEEE: Piscataway, NJ, USA, 2018; pp. 1338–1343. [Google Scholar]
- Grize, Y.-L.; Fischer, W.; Lützelschwab, C. Machine learning applications in nonlife insurance. Appl. Stoch. Model. In Business Ind. 2020, 36, 523–537. [Google Scholar] [CrossRef]
- Itri, B.; Mohamed, Y.; Mohammed, Q.; Omar, B. Performance comparative study of machine learning algorithms for automobile insurance fraud detection. In 2019 Third International Conference on Intelligent Computing in Data Sciences (ICDS); IEEE: Piscataway, NJ, USA, 2019; pp. 1–4. [Google Scholar]
- Hossain, S.S.M.R.; Salman, S.M. Implementation challenges of the mandatory health insurance scheme. Bull. Natl. Res. Centre 2019, 43, 151. [Google Scholar] [CrossRef] [Green Version]
- Krasheninnikova, E.; García, J.; Maestre, R.; Fernández, F. Reinforcement learning for pricing strategy optimization in the insurance industry. Eng. Appl. Artif. Intell. 2019, 80, 8–19. [Google Scholar] [CrossRef]
- Sundarkumar, G.G.; Ravi, V. A novel hybrid undersampling method for mining unbalanced datasets in banking and insurance. ENgineering Appl. Artif. Intell. 2015, 37, 368–377. [Google Scholar] [CrossRef]
- Subudhi, S.; Panigrahi, S. Use of optimized fuzzy c-means clustering and supervised classifiers for automobile insurance fraud detection. J. King Saud-Univ.-Comput. Inf. Sci. 2020, 32, 568–575. [Google Scholar] [CrossRef]
- Challa, A. Insurance Models and Risk-Function Premium Principle. 2012. Available online: https://www.semanticscholar.org/paper/Insurance-models-and-risk-function-premium-Challa/1f19f01beafdb3c451861c9275901e68ab3a0377 (accessed on 20 May 2021).
- Mazzoccoli, A.; Naldi, M. The expected utility insurance premium principle with fourth-order statistics: Does it make a difference? Algorithms 2020, 13, 116. [Google Scholar] [CrossRef]
- Bianchi, D.; Büchner, M.; Tamoni, A. Bond risk premiums with machine learning. Rev. Financ. Stud. 2020, 34, 1046–1089. [Google Scholar] [CrossRef]
- Gan, L.; Wang, H.; Yang, Z. Machine learning solutions to challenges in finance: An application to the pricing of financial products. Technol. Forecast. Soc. Chang. 2020, 153, 119928. [Google Scholar] [CrossRef]
- Henckaerts, R.; Côté, M.-P.; Antonio, K.; Verbelen, R. Boosting insights in insurance tariff plans with tree-based machine learning methods. North Am. Actuar. J. 2020, 25, 255–285. [Google Scholar] [CrossRef]
- Kuo, K.; Lupton, D. Towards explainability of machine learning models in insurance pricing. arXiv 2020, arXiv:2003.10674. [Google Scholar]
- Kröger, V.; Nordström, R. Expected Individual Insurance Cost Based on Driving Pattern: Machine Learning Methods Using Telemetric Data; Digitala Vetenskapliga Arkivet: Uppsala, Sweden, 2020. [Google Scholar]
- Gan, G. Application of data clustering and machine learning in variable annuity valuation. Insur. Math. Econ. 2013, 53, 795–801. [Google Scholar] [CrossRef]
- Spedicato, G.A.; Dutang, C.; Petrini, L. Machine Learning Methods to Perform Pricing Optimization. A Comparison with Standard Glms. 2018. Available online: https://www.semanticscholar.org/paper/Machine-Learning-Methods-to-Perform-Pricing-A-with-Spedicato-Dutang/6a51b2c8557acde21389193ea86f3d00482036c3 (accessed on 20 May 2021).
- Collopy, F.; Nard, C.A.; Amin, H.S.; Turocy, G.; Takieh, S.V.S.; Krosky, R.C.; Noonan, D.; Narvaez, G.A.; Asquith, B. Dynamic Insurance Rates. US Patent App. 12/536,999, 27 May 2010. [Google Scholar]
- Abdalkareem, Z.A.; Amir, A.; Al-Betar, M.A.; Ekhan, P.; Hammouri, A.I. Healthcare scheduling in optimization context: A review. Health Technol. 2021, 11, 445–469. [Google Scholar] [CrossRef]
- Eling, M.; Nuessle, D.; Staubli, J. The impact of artificial intelligence along the insurance value chain and on the insurability of risks. In The Geneva Papers on Risk and Insurance-Issues and Practice; Springer: Berlin/Heidelberg, Germany, 2021; pp. 1–37. [Google Scholar]
- Hassan, A.K.I.; Abraham, A. Modeling insurance fraud detection using imbalanced data classification. In Advances in Nature and Biologically Inspired Computing; Springer: Berlin/Heidelberg, Germany, 2016; pp. 117–127. [Google Scholar]
- Jha, B.K.; Sivasankari, G.; Venugopal, K. Fraud detection and prevention by using big data analytics. In 2020 Fourth International Conference on Computing Methodologies and Communication (ICCMC); IEEE: Piscataway, NJ, USA, 2020; pp. 267–274. [Google Scholar]
- Matloob, I.; Khan, S.A.; Rahman, H.U. Sequence mining and prediction-based healthcare fraud detection methodology. IEEE Access 2020, 8, 143256–143273. [Google Scholar] [CrossRef]
- Matloob, I.; Khan, S.; Hussain, F.; Rahman, H. Medical health benefit management system for real-time notification of fraud using historical medical records. Appl. Sci. 2020, 10, 5144. [Google Scholar] [CrossRef]
- Singh, D.; Kumar, P. Conceptual mapping of insurance risk management to data mining. Int. J. Comput. Appl. 2012, 975, 8887. [Google Scholar] [CrossRef]
- Soeini, R.A.; Rodpysh, K.V. Applying data mining to insurance customer churn management. Int. Proc. Comput. Sci. And Information Technol. 2012, 30, 82–92. [Google Scholar]
- Bhatnagar, V.; Ranjan, J.; Singh, R. Analytical customer relationship management in insurance industry using data mining: A case study of indian insurance company. Int. J. Netw. Virtual Organ. 2011, 9, 331–366. [Google Scholar] [CrossRef]
- Zhikun, X.; Yanwen, W.; Zhaohui, L. Optional insurance compensation rate selection and evaluation in financial institutions. Int. e-Serv. Sci. Technol. 2014, 7, 233–242. [Google Scholar]
- Goonetilleke, T.O.; Caldera, H. Mining life insurance data for customer attrition analysis. J. Ind. Intell. Inf. 2013. [Google Scholar] [CrossRef]


| Terminology | Description |
|---|---|
| Insured | The employee and his family members, who are availing the insurance policy. |
| Sum amount | A maximum amount paid by the insurance company in case the insured person gets hospitalized. For example, the sum insurance of an employee is PKR 3 Lacs and got hospitalized three times in a year. On his first treatment, the billed amount is 50 thousands PKR, on his second and third treatments, the amount is of PKR 1 Lac and 2 Lacs, respectively. The total bill amount for the year is PKR 3.5 Lacs which exceeds the sum insured of the employee hence, paid by the insured person. |
| Premium amount | The fixed annual amount paid by the insured. In the case of organizations or employers, insured are employees who are availing insurance policy, and their employers are the payer of premium amounts to insurance companies. |
| Payer | It is the employer/ organization paying the premium. |
| Insurance policy | It is a legal document that includes details regarding particular insurance coverage for an insured. |
| Contract | It is the legal agreement between the insurer and insured. |
| Notation | Description |
|---|---|
| depicts transactional data of employees. | |
| k | There are seven categories of employees in this organization and each category is availing separate insurance plan. Categories are represented by k where k= (A B,C,D,E,F,G) |
| denotes total computed medical benefit. | |
| denotes total amount in each category. | |
| depicts packages for k categories. | |
| depicts amount of each group in each category | |
| O | is the Premium amount which the hospital/organization is paying. The organization is giving total premium T and for each category there is a separate value of premium amount |
| Number of total employees are denoted by E and number of employees in each group of each category are denoted by | |
| is the out of pocket employees in each category i = k where k = A,B,C,D,E,F,G. |
| Name | Data Type |
|---|---|
| EMP_ID | varchar(255) |
| Age | Float |
| Total_visits | Float |
| Total_amount | Float |
| Marital_status | Float |
| Relation | Float |
| Gender | Float |
| Category | nvarchar(255) |
| Category Type | Premium Amount (PKR) | Number of Employees |
|---|---|---|
| A | 39,036 | 170 |
| B | 17,466.6 | 5 |
| C | 31,922 | 985 |
| D | 13,075.57 | 252 |
| E | 26,309 | 1991 |
| F | 8862 | 1619 |
| G | 68,811 | 120 |
| Age | Gender | Relation Status | Sum Amount | Amount | Visit |
|---|---|---|---|---|---|
| 30.0 | 0.0 | 1.0 | 2,484,225 | 55,205.0 | 2700 |
| 30.0 | 1.0 | 1.0 | 250,591 | 13,189.0 | 342 |
| Age | Gender | Relation Status | Sum Amount | Amount | Visit |
|---|---|---|---|---|---|
| 26.0 | 0.0 | 1.0 | 66,212 | 33,106.0 | 116.0 |
| 31.0 | 1.0 | 1.0 | 40,518 | 20,259.0 | 34.0 |
| Age | Gender | Relation Status | Sum Amount | Amount | Visit |
|---|---|---|---|---|---|
| 28.0 | 1.0 | 1.0 | 2,460,744 | 17,208.0 | 3003.0 |
| 29.0 | 0.0 | 1.0 | 18,693,312 | 58,784.0 | 21,306.0 |
| Age | Gender | Relation Status | Sum Amount | Amount | Visit |
|---|---|---|---|---|---|
| 28.0 | 0.0 | 1.0 | 2,488,048 | 54,088.0 | 3036.0 |
| 29.0 | 0.0 | 0.0 | 1,697,484 | 10,812.0 | 1727.0 |
| Age | Gender | Relation Status | Sum Amount | Amount | Visit |
|---|---|---|---|---|---|
| 28.0 | 0.0 | 1.0 | 30,557,735 | 54,665.0 | 36,894.0 |
| 29.0 | 1.0 | 1.0 | 4,182,006 | 13,802.0 | 5151.0 |
| Age | Gender | Relation Status | Sum Amount | Amount | Visit |
|---|---|---|---|---|---|
| 28.0 | 0.0 | 1.0 | 10,750,851 | 41,191.0 | 13,572.0 |
| 26.0 | 1.0 | 0.0 | 8,171,936 | 7768.0 | 10,520.0 |
| Age | Gender | Relation Status | Sum Amount | Amount | Visit |
|---|---|---|---|---|---|
| 30.0 | 0.0 | 1.0 | 3,779,568 | 96,912.0 | 4046.0 |
| 30.0 | 1.0 | 1.0 | 1,631,448 | 19,656.0 | 1826.0 |
| Group | a(Shape) | b(Scale) | ||
|---|---|---|---|---|
| 1 | 1.0165 | 12,868.7 | 13,081 | 12,974 |
| 2 | 1.17172 | 47,418.5 | 55,561.2 | 51,328 |
| Group | a(Shape) | b(Scale) | ||
|---|---|---|---|---|
| 1 | 8.91083 | 11,528.9 | 10,2732 | 34,414.82 |
| 2 | 1.1381 | 22,539.6 | 25,652.4 | 24,045.73 |
| Group | a(Shape) | b(Scale) | ||
|---|---|---|---|---|
| 1 | 1.26108 | 42,889.9 | 54,087.8 | 48,164.51 |
| 2 | 0.947823 | 1407.2 | 10,812 | 11,105.67 |
| Category | Group | a(Shape) | b(Scale) | ||
|---|---|---|---|---|---|
| E | 1 | 1.26108 | 42,889.9 | 54,087.8 | 48,164.51 |
| 2 | 0.761365 | 18,175 | 13,837.8 | 15,858.85 | |
| F | 1 | 0.944072 | 8228.13 | 7767.95 | 7994.73 |
| 2 | 1.12469 | 36,624.5 | 41,191.3 | 38,840.83 | |
| G | 1 | 4.60034 | 21,066.4 | 96,912 | 45,183 |
| 2 | 1.31399 | 14,959 | 19,656.1 | 17,147.48 |
| Category | Out of Pocket Employees in Current Amount | Out of Pocket Employees in Optimized Amount |
|---|---|---|
| A | 45 | 33 |
| B | 30 | 10 |
| C | 54 | 33 |
| D | 47 | 15 |
| E | 57 | 31 |
| F | 52 | 12 |
| G | 30 | 17 |
| Category | Group No | ||||||||
|---|---|---|---|---|---|---|---|---|---|
| A | 1 | 13,081 | 12,974 | 26,055 | 39,029 | 52,004 | 1.05 × 10 | 3.84 × 10 | 1.41 × 10 |
| 2 | 55,561 | 51,328 | 106,889 | 158,218 | 209,547 | 2.75 × 10 | 9.9 × 10 | 3.5 × 10 | |
| C | 1 | 102,732 | 34,414 | 137,146 | 171,560 | 205,974 | 5.70 × 10 | 1.60 × 10 | 3.60 × 10 |
| 2 | 25,652 | 24,045 | 49,698 | 73,743 | 97,789.59 | 5.80 × 10 | 2.11 × 10 | 7.50 × 10 | |
| D | 1 | 54,088 | 48,164 | 102,252 | 150,416 | 198,581 | 2.90 × 10 | 1.07 × 10 | 3.70 × 10 |
| 2 | 10,812 | 11,105 | 21,917 | 33,023 | 44,129 | 1.20 × 10 | 4.44 × 10 | 1.65 × 10 | |
| E | 1 | 54,087 | 48,164 | 102,252 | 1,504,16 | 198,581 | 3.10 × 10 | 1.03 × 10 | 3.26 × 10 |
| 2 | 13,837 | 15,859 | 29,697 | 45,555 | 61,414 | 7.80 × 10 | 2.97 × 10 | 1.15 × 10 | |
| F | 1 | 7768 | 7995 | 15,762 | 23,757 | 31,752 | 1.66 × 10 | 6.16 × 10 | 2.29 × 10 |
| 2 | 41,191 | 38,841 | 80,032 | 118,873 | 157,713 | 3.59 × 10 | 1.30 × 10 | 4.60 × 10 | |
| G | 1 | 96,912 | 45,184 | 142,096 | 187,279 | 232,463 | 4.03 × 10 | 1.27 × 10 | 3.20 × 10 |
| 2 | 19,656 | 17,147 | 36,803 | 53,950 | 71,097 | 8.45 × 10 | 3.03 × 10 | 1.05 × 10 |
| Category | Group # | Lower Bound | Upper Bound |
|---|---|---|---|
| A | 1 | 13,081 | 26055.4 |
| 2 | 55,561 | 1,06,889 | |
| C | 1 | 1,02,732 | 137146 |
| 2 | 25,652 | 49,698 | |
| D | 1 | 54,087 | 1,02,252 |
| 2 | 10,812 | 21,917 | |
| E | 1 | 54,087 | 1,02,252 |
| 2 | 13,838 | 29,696 | |
| F | 1 | 7768 | 15,763 |
| 2 | 41,191 | 80,032 | |
| G | 1 | 96,912 | 142,096 |
| 2 | 19,656 | 36,803 |
| Category | |||||
|---|---|---|---|---|---|
| A | 2,722,499 | 6,636,057 | 14,224,155 | 20,743,556 | 27,262,958 |
| B | 126,989 | 87,333 | 231,184 | 335,380 | 439,575 |
| C | 21,274,512 | 31,442,546 | 72,638,057 | 97,809,596 | 122,981,136 |
| D | 4,347,796 | 3,295,044.144 | 12,159,063 | 17,871,775 | 23,584,488 |
| E | 35,067,873 | 52,380,635 | 161,637,982 | 237,239,625 | 312,841,268 |
| F | 19,504,878 | 14,347,412 | 60,059,019 | 89,927,607 | 119,796,195 |
| G | 4,113,456 | 8,257,405 | 11,036,095 | 15,387,108 | 19,738,122 |
| ML Related Researches in Insurance Industry | Type of Research | Comparison |
|---|---|---|
| [8,12,25,26,27,28] | Fraud Detection | All of these researches are proposing methodologies for detecting fraud in insurance industry. |
| [3,6,13,19,21,22,29] | Premium amount in auto insurance | These researches focus on risk functions premium calculation, automobile premium computation based on user driving pattern etc |
| [30,31,32,33] | Customer related | All these researches are related to customer management. |
| Proposed Methodology | Medical benefit optimization | We observe that in the last decade focus of the researcher is more on fraud detection, risk prediction and customer management. None of the research focus on the medical benefit optimization. The main goal of our research is the medical benefit optimization from need based packages. |
Publisher’s Note: MDPI stays neutral with regard to jurisdictional claims in published maps and institutional affiliations. |
© 2021 by the authors. Licensee MDPI, Basel, Switzerland. This article is an open access article distributed under the terms and conditions of the Creative Commons Attribution (CC BY) license (https://creativecommons.org/licenses/by/4.0/).
Share and Cite
Matloob, I.; Khan, S.A.; Hussain, F.; Butt, W.H.; Rukaiya, R.; Khalique, F. Need-Based and Optimized Health Insurance Package Using Clustering Algorithm. Appl. Sci. 2021, 11, 8478. https://doi.org/10.3390/app11188478
Matloob I, Khan SA, Hussain F, Butt WH, Rukaiya R, Khalique F. Need-Based and Optimized Health Insurance Package Using Clustering Algorithm. Applied Sciences. 2021; 11(18):8478. https://doi.org/10.3390/app11188478
Chicago/Turabian StyleMatloob, Irum, Shoab Ahmad Khan, Farhan Hussain, Wasi Haider Butt, Rukaiya Rukaiya, and Fatima Khalique. 2021. "Need-Based and Optimized Health Insurance Package Using Clustering Algorithm" Applied Sciences 11, no. 18: 8478. https://doi.org/10.3390/app11188478
APA StyleMatloob, I., Khan, S. A., Hussain, F., Butt, W. H., Rukaiya, R., & Khalique, F. (2021). Need-Based and Optimized Health Insurance Package Using Clustering Algorithm. Applied Sciences, 11(18), 8478. https://doi.org/10.3390/app11188478