Abstract
The increasing interest in natural foods with functional effects demands progressively higher production levels. Nonetheless, there is an orientation towards practicing more sustainable agriculture, free from environmentally harmful pesticides and fertilizers. Plant biostimulants, a class of bio-based agriculture products designed to improve crop development, represent a feasible alternative to chemical fertilizers, or, at least, an effective way of reducing the employed quantities. Herein, different types of plant biostimulants compatible with organic farming (Phytoalgae, Foliar B, Amino Acids, Soil B, Fitoalgas Green® and Sprint Plus®) were tested in two of the most important nut products worldwide: almonds and hazelnuts, which were tested for nutritional parameters, fatty acids profiles and tocopherols contents. Overall, the most notorious effects in almond samples were obtained with phytoalgae (seaweed Ascophyllum nodosum extracts), particularly reflected in the upraising around 10% of γ-tocopherol and β-tocopherol contents. Likewise, hazelnuts treated with NPK + phytoalgae were also characterized by an increase of almost 18% in tocopherols levels, while treatment with NPK alone induced 15.1% higher percentage of linoleic acid.
1. Introduction
There has been an increasing interest in the functional characteristics of nuts, as these are a relevant source of bioactive constituents. Hazelnut (Corylus avellana L.) is the most important cultivated species in the Corylus genus (Betulaceae). It is widely spread from the Himalayas to the far north of Canada [1]. Turkey is the world’s largest producer, followed by Italy and the United States of America [2]. Likewise, almond [Prunus dulcis (Mill.) D.A. Webb, Rosaceae] is one of the most popular nuts in the world, standing out in first place in what concerns production levels, mainly due to the contribution of California, the world’s largest producer of this species [3,4]. The benefits of including these nuts in the human diet are partly related to their monounsaturated fatty acids (MUFA), particularly oleic acid, and polyunsaturated fatty acids (PUFA), namely linoleic acid, tocopherols (e.g., α-tocopherol), and phytosterols (e.g., β-sitosterol) [5,6,7,8]. These liposoluble components have been recognized for their essential contribution to prevent dyslipidemias [9,10,11,12], by specifically reducing the total plasma concentrations of LDL-cholesterol [13,14,15,16,17].
Tocopherols are also recognized as antioxidants due to their ability to protect cell membranes from oxidative damage induced by free radicals [18,19,20], in addition to having anti-inflammatory potential [21].
Almond and hazelnut crops are very important, particularly among countries with high production levels, such as Portugal, owing to their interesting nutritional/functional value. The chemical profile of these nuts may vary due to edaphoclimatic factors, which can also modulate the corresponding production yields, for instance due to frost damage, by hampering the entomophile pollination, or disordered flowering and flower degeneration. Using biostimulants might be an effective way to improve nutrients uptake from the soil, as well as increasing photosynthesis levels, thereby representing a useful treatment for different crops like almond and hazelnut [2,22,23].
Because of their potential health benefits, almond and hazelnut are being progressively included in healthy diets, demanding higher production levels worldwide. Nonetheless, there is a general concern towards the practice of agriculture less harmful to the environment, which raises the need for ecological alternatives to fertilizers or pesticides. The search for biostimulants has been an active research field, but the maintenance, or ideally the improvement, of the products obtained when using these growing adjuvants must be verified [2,22,23]. Studies report that the use of marine bioactive substances extracted from algae in agricultural and horticultural crops has many beneficial effects in terms of increased yield and quality [24,25]. Seaweed extracts contain primary and secondary nutrients, amino acids, vitamins, cytokins, auxin, and abscisic acid [26], among other substances that stimulate plant growth and performance [27], help develop tolerance to environmental stress [28,29], increase nutrient uptake from soil [30,31], and increase antioxidant properties [31,32].
It is a fact that the chemical profile of nuts can have a slight, although natural, variability within each species. Besides the edaphoclimatic conditions, these fluctuations might be due to the cultivar or agricultural factors, such as the use of plant biostimulants [12,33,34]. The best biostimulant application intends to improve the plant’s nutrient use efficiency and enhance tolerance to biotic and abiotic stresses. Bearing this in mind, we tested the influence of two plant biostimulants (seaweed extract and free amino acids) in combination with soil and foliar boron (in almond), and with or without using a basal NPK (nitrogen, phosphorus, and potassium) fertilization program (in hazelnut), in the chemical (moisture, total fat, proteins, carbohydrates, and ash) and phytochemical (fatty acids, tocopherols, sterols) properties of almond and hazelnut.
2. Materials and Methods
2.1. Samples
Hazelnut (Corylus avellana L.) and almond (Prunus dulcis (Mill.) D.A. Webb) samples were obtained from experimental fields in the Northeast of Portugal. Almond samples belong to Vairo cultivar and were obtained from trees submitted to five treatments: (i) Control (without treatment/biostimulant); (ii) Phytoalgae (Fitoalgas Green®, a seaweed extract of Ascophyllum nodosum); (iii) Foliar B (Tradebor®, boron as ethanolamine, 15.4% w/v); (iv) Amino acids (Sprint Plus®, free amino acids, 28.8% w/v); (v) Soil B (Neobor®, sodium tetraborate pentahydrate, 14.85% B); All products were compatible with organic farming. Hazelnut samples belong to the Ennis cultivar and were obtained from trees submitted to six different treatments resulting from the combination of the plant biostimulants Fitoalgas Green® and Sprint Plus® with or without a basal soil NPK fertilization program. The treatments were: (i) Control (without treatment/biostimulant); (ii) NPK (60 kg ha−1 of N, P2O5, and K2O); (iii) NPK + phytoalgae; (iv) Sprint Plus; (v) NPK + Sprint Plus; (vi) Phytoalgae; In all six cases, a basal treatment with boron was made. All treatments were made in the early spring of 2019.
Both experiments were arranged as completely randomized designs with three replicates. Once in the lab, each sample was analyzed in triplicate. After collection, samples were immediately frozen and lyophilized (Telstar LyoQuest Lyophilizer), to prevent the occurrence of any degradation. Then, samples were ground in a chopper (model A327R1, Moulinex, Barcelona, Spain), homogenized, and stored away from light and moisture.
2.2. Nutritional Value
The proximate composition (ash, fat, moisture, proteins, and carbohydrates) was determined in the freeze-dried samples, according to the AOAC methods [35]. The crude protein was determined by the macro-Kjeldahl method (N × 5.18 for almonds and N × 5.3 for hazelnuts) using an automatic distillation and titration unit (model Pro-Nitro-A; Selecta, Barcelona, Spain); crude fat was determined by Soxhlet extraction with petroleum ether during 7 h and the ash content was evaluated by incineration at 550 ± 15 °C. Total carbohydrates content was calculated by difference using the formula: total carbohydrates (g/100 g) = 100 − (gfat + gash + gproteins) and the energetic value was calculated according to the Decree-Law No. 167/2004 using the formula: energy (kcal/100 g) = 4 × (gproteins + gcarbohydrates) + 9 × (gfat).
2.3. Free Sugars
Free sugars were determined by high-performance liquid chromatography coupled to a refraction index detector (HPLC-RI). Freeze-dried samples (~1.0 g) were extracted with a water:ethanol mixture (80:20) after being spiked with melezitose (IS, 5 mg/mL), further used as the internal standard, following a previously described methodology [36,37]. The equipment of analysis consisted of an integrated system with a pump (Knauer, Smartline system 1000, Berlin, Germany), a degasser system (Smartline manager 5000), an auto-sampler (AS-2057 Jasco, Easton, MD, USA), and an RI detector (Knauer Smartline 2300, Berlin, Germany). Data were analyzed using Clarity 2.4 Software (DataApex, Prague, Czech Republic). The chromatographic separation was achieved with a Eurospher 100-5 NH2 column (4.6 × 250 mm, 5 µm, Knauer) operating at 30 °C. The mobile phase was acetonitrile/deionized water, 70:30 (v/v) at a flow rate of 1 mL/min. Compounds were identified by chromatographic comparisons with commercial standards. Quantification was performed using the internal standard (melezitose) method and sugar contents were further expressed in g/100 g of fresh weight (fw).
2.4. Fatty Acids
Fatty acid composition was determined by gas-liquid chromatography with flame ionization detection (GC-FID)/capillary column, after the extraction and derivatization to fatty acid methyl esters (FAME) according to a previously described methodology [37]. Fatty acids were obtained after 1 h of Soxhlet extraction with petroleum ether. Petroleum ether was chosen as a solvent due to its lower boiling temperature than hexane, for example. Therefore, the samples were not at risk of oxidation because the temperature in question does not affect the extraction of the compounds. The solvent was recovered by drying in an oven at approximately 50 °C until it had a constant weight. Then, the fatty acids were derivatized with 5 mL of methanol:sulphuric acid:toluene 2:1:1 (v:v:v), during at least 12 h in a bath at 50 °C and 160 rpm; then 3 mL of deionized water and 3 mL of diethyl ether were added, to obtain phase separation; FAME were recovered by vortex-shaking, and the upper phase was recovered and filtered with 0.2 µm nylon filter from Whatman before injection [38]. The analysis was carried out with a DANI model GC 1000 instrument equipped with a split/splitless injector, a flame ionization detector (FID), and a Macherey-Nagel (GC 1000, Düren, Germany) column (50% cyanopropyl-methyl-50% phenylmethylpolysiloxane, 30 m × 0.32 mm i.d. × 0.25 µm df). The oven temperature program was as follows: the initial temperature of the column was 50 °C, held for 2 min, then a 30 °C/min ramp to 125 °C, 5 °C/min ramp to 160 °C, 20 °C/min ramp to 180 °C, 3 °C/min ramp to 200 °C, 20 °C/min ramp to 220 °C, and held for 15 min. The carrier gas (hydrogen) flow-rate was 4.0 mL/min (0.61 bar), measured at 50 °C. Split injection (1:40) was carried out at 250 °C. Fatty acid identification was made by comparing the relative retention times of FAME peaks from samples with commercial standards. The results were recorded and processed using the Software Clarity DataApex 4.0.1.7 and expressed as the relative percentage of each fatty acid.
2.5. Tocopherols
Tocopherols were determined by HPLC (equipment described above) and a fluorescence detector (FP-2020; Jasco). The extracts obtained after Soxhlet extraction (1 h) were submitted to dryness under a nitrogen stream. Then, the extract was dissolved in 2 mL of hexane and filtered through 0.2 µm nylon filters (Whatman) and transferred into injection vials. The fluorescence detector was programmed for excitation at 290 nm and emission at 330 nm. The chromatographic separation was achieved with a Polyamide II (250 mm × 4.6 mm, 5 µm) normal-phase column from YMC Waters operating at 30 °C. The mobile phase used was a mixture of n-hexane and ethyl acetate (70:30, v/v) at a flow rate of 1 mL/min. The detected peaks were compared with commercial standards, the quantification is based on the fluorescence signal, using the internal standard method (tocol). The results were expressed in mg/100 g of dried weight (fw).
2.6. Statistical Analysis
For the comparison between the effects of the different treatments, one-way analysis of variance (ANOVA) was used, using the Tukey test or the Tamhane’s T2 test, the (through Levene’s test) homogeneity or heterogeneity of the variances, respectively, were found. Before the variance tests, the normality of the distributions was verified using the Shapiro–Wilks test. The software used was the Statistical Package for the Social Sciences (SPSS) version 24 (IBM Corporation, New York, NY, USA). All results were expressed as mean values ± standard deviations (SD), keeping the decimal places allowed by the magnitude of the standard deviation.
Additionally, a linear discriminant analysis (LDA) was used to evaluate which of the evaluated parameters showed the highest differences as a result of being treated with the assayed biostimulants. This was also done to find the biostimulant that would be able to maximize the concentration of any given compound, either in almonds, as well as in hazelnuts. The independent variables (predictors) were entered together and the usual assumptions of LDA were fully verified. To validate the significance of the canonical discriminating functions, Wilk’s ʎ test was used. A leaving-one-out cross validation procedure was carried out to assess the model performance.
All tests were performed with a 5% significance level. For all methods, three samples were mixed to have a representative pool and all tests were performed in triplicate.
3. Results and Discussion
In this preliminary study, it was intended to evaluate potential changes in different nutrients and bioactive compounds expression in result of treating almond and hazelnut crops with different biostimulants. There are other factors such as edaphoclimatic conditions, different crop locations, different irrigation systems, or different trees densities that can influence the levels of the compounds assayed herein. However, this first assay was mainly designed to pave the way for further investigations relating the previous factors. In addition, comparative statistical tests like ANOVA, loose effectiveness when testing two or more factors, mainly due to the high probability of their interaction; when two given factors interact significantly, it is not possible to infer unequivocal conclusions for each single factor. Accordingly, and in order to acquire those conclusions, the biostimulant type was maintained as the single variability factor for this study.
3.1. Nutritional Value
The results for nutritional evaluation (Table 1) show that both assayed species are mainly composed by fat (around 55% in fresh weight basis). In both cases, the highest fat contents were detected in the control lines, with slight differences resulting from using different plant biostimulants. Protein levels, in turn, were highest (16.8 g/100 g fw) in hazelnuts treated with NPK (12% higher than the control), but all plant biostimulants (except phytoalgae) induced a positive effect in this analyte. On the other hand, the same effect could not be observed among almond samples. Carbohydrate contents were generally increased in samples treated with plant biostimulants, particularly when using phytoalgae (29 g/100 g fw), in almonds’ case, and NPK + phytoalgae (28 g/100 g fw), relating to hazelnut samples. A similar result was obtained for sucrose, the main sugar identified (highest contents: 13.7 g/100 g fw in almond samples treated with Tradebor; 18.8 g/100 g fw in hazelnut samples treated with NPK + phytoalgae), a reducing sugar that has been previously reported as the major form in these species [39,40]. Ash and water, the minor components, showed very small variations (insignificant in the case of ash content in almond samples). In what concerns energy, the maximal values (669 kcal/100 g fw for almonds; 675 kcal/100 g fw for hazelnuts) were obtained in control lines (samples grown in soils without any biostimulant); this result was common to almonds and hazelnuts.

Table 1.
Nutritional composition (g/100 g fw) and energy values (kcal/100g fw) for almond and hazelnut cultivars submitted to different plant biostimulants treatments.
3.2. Fatty Acids
The major fatty acids profile is detailed in Table 2. The results include only the major fatty acids; however, other fatty acids were detected in trace percentages (total sum less than 2%), these being: myristic acid (C14: 0), palmitoleic acid (C16: 1), marginal acid (C17: 0), α- linolenic (C18: 3n3), arachidonic acid (C20: 0), and eicosenoic acid (C20: 1). Oleic acid (C18: 1n9c) was the predominant fatty acid in both species, but it did not affect equally, in terms of percentage, in almond and hazelnut. In fact, while it remained nearly unchanged in almond when using different plant biostimulants, an obvious decrease was observed in hazelnut, independently of the plant biostimulant, when comparing with the control (76%). The lack of significant changes in almond was also observed for linoleic acid (C18:2n6c), which, contrarily to oleic acid, showed a significant increase in hazelnut samples grown in soils treated with plant biostimulants, reaching the maximum value when using NPK (15.1%). Palmitic acid, likewise, was more affected in hazelnut samples, reaching the highest percentage with Sprint Plus (9.6%), while it remained nearly constant in almond samples. A very similar result was observed for stearic acid (C18:0).
Table 2.
Major fatty acids profile (relative%) for almond and hazelnut cultivars submitted to different plant biostimulant treatments.
Besides the tabled fatty acids, a few others were detected in minute percentages, namely myristic acid (C14:0), palmitoleic acid (C16:1), heptadecanoic acid (C17:0), α-linolenic acid (C18:3n3), arachidic acid (C20:0), and eicosanoic acid (C20:1). These profiles were in general agreement with those reported in literature [41,42,43,44], despite the natural variability that results from genetic and edaphoclimatic factors [12,33,34].
3.3. Tocopherols
As in most foods with high fat content, the concentration of tocopherols (Table 3) was elevated: average values of 50 mg/100 g fw in almonds and 25 mg/100 g fw in hazelnuts, which is in agreement with previous reports [45,46]. Considering the concentration in total tocopherols, the soil supplementation with phytoalgae produced an increase around 10% (50 to 55 mg/100 g fw), mainly due to the increase in α-tocopherol and γ-tocopherol. Nonetheless, all other assayed biostimulants had an opposite effect.
Table 3.
Tocopherols profile (mg/100 g fw) for almond and hazelnut cultivars submitted to different plant biostimulants treatments.
In what concerns hazelnuts, all biostimulants had the capacity to increase the tocopherols content, with the mixture NPK + phytoalgae as the one reaching the best results (23 to 28 mg/100 g fw). This is a positive result, although not entirely surprising. The European Biostimulant Industry Council (www.biostimulants.eu (accessed on 19 December 2020)) defined “plant biostimulants as containing substance(s) and/or micro-organisms whose function when applied to plants or the rhizosphere is to stimulate natural processes to enhance/benefit nutrient uptake, nutrient efficiency, tolerance to abiotic stress, and crop quality”. These improvements are mainly based in mechanisms able to enhance key physiological, biochemical and molecular processes. Besides, their effects in nutrients availability, using biostimulants has been related to the up-regulation of photosynthesis and improved nitrogen and carbon metabolism, which can result in higher expressions of antioxidant compounds such as tocopherol [47].
The obtained values were lower than those reported in different hazelnut varieties [48], which might be related with genetic factors (different cultivars), climatic variation [49,50], soil type [41], or analytical methodology [42].
3.4. Linear Discriminant Analysis
To extend the characterization of differences observed in all individual parameters described in the former sections, the totality of results was evaluated simultaneously to analyze the overall effects of the studied biostimulants on almond and hazelnut profiles. This study was made using linear discriminant analysis (LDA), measuring the correlations among different biostimulants (categorical dependent variables) and the obtained results (quantitative independent variables). All significant independent variables were selected from the stepwise method of LDA, using the Wilks’ λ test criterion. The obtained statistical models maintained only the variables with a statistically significant classification performance (p < 0.050).
Concerning almonds, most of the results’ variation was included in function 1 (function 1:68.3%; function 2:24.1%; function 3:6.1%; fourth function:1.5%); the first three functions are represented in Figure 1. Among all studied variables, γ-tocopherol, sucrose, tocopherols, β-tocopherol, protein, water, and C18:2n6c were selected as having discriminant ability (i.e., the ones showing the highest variation in result of using different biostimulants). Considering the correlations among discriminant functions and selected variables, function 1 was more correlated with γ-tocopherol, β-tocopherol, and water, mostly separating samples treated with phytoalgae (which showed the maximum values in γ-tocopherol, β-tocopherol, and water) and Tradebor (which showed the minimum values in γ-tocopherol, β-tocopherol, and water). In turn, function 2 had the highest correlation coefficients with sucrose, grouping samples treated with phytoalgae or Tradebor (higher sucrose contents) in one cluster. On its side, function 3 was mostly correlated with total tocopherols, and its most observable effect was the separation of markers corresponding to samples treated with Borax (lower tocopherol contents). Overall, the most pronounced effect in almond were obtained when using phytoalgae, mainly due to the increase in γ-tocopherol, β-tocopherol. In this LDA, the classification performance was 91.7% accurate for the original grouped cases and 89.4% for the cross-validated grouped ones.
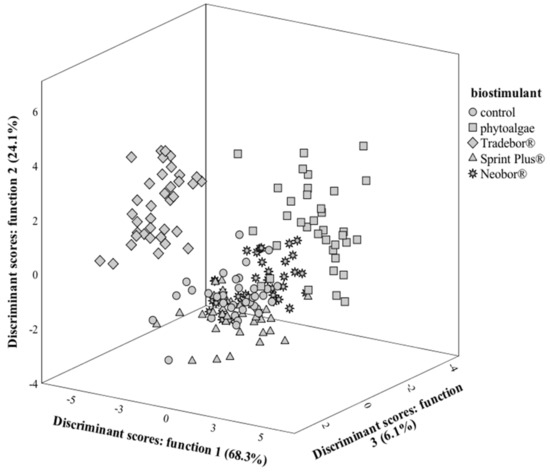
Figure 1.
Spatial distribution of almond crop biostimulant markers according to the discriminant functions coefficients. Function 1 accounted for 68.3% of the variation, function 2 accounted for 24.1%, while function 3 accounted for 6.1%.
In hazelnut’s case, the first three discriminant functions (Figure 2) included 89.3% (function 1:49.6%; function 2:28.5%; function 3:11.2%) of the observed variance. In this second LDA, the variables selected as having discriminant ability were water, β-tocopherol, C18:0, sucrose, protein, C18:1n9c, α-tocopherol, ash, γ-tocopherol, C18:2n6c, and energy. Function 1 was mainly correlated with C18:2n6c (lowest percentage in control samples) and C18:1n9c (highest percentage in control samples), clearly separating the markers corresponding to control samples from all others obtained from trees grown in soils supplemented with any kind of biostimulants. Function 2, on its side, was more correlated with C18:0 and β-tocopherol, placing markers corresponding to samples treated with Sprint Plus (the ones showing highest contents of C18:0 and β-tocopherol) in the positive side of the corresponding axis. Function 3 had higher correlations coefficients with sucrose, α-tocopherol, and total tocopherols, variables that reached the highest contents in samples treated with NPK + phytoalgae, thereby the ones that separated better (positive side of the axis). Generally, these results showed that the treatment with biostimulants is effective to increment the percentage of linoleic acid (particularly when using NPK); likewise, the tocopherols levels were also increased, with maximum expression when using NPK + phytoalgae.
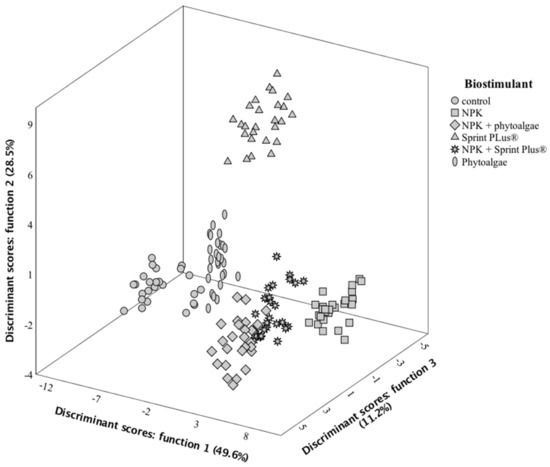
Figure 2.
Spatial distribution of hazelnut crop biostimulant markers according to the discriminant functions coefficients. Function 1 accounted for 49.6% of the variation, function 2 accounted for 28.5%, while function 3 accounted for 11.2%.
In this first LDA, the classification performance was 100% accurate, either for the original grouped cases, as well as for the cross-validated grouped ones.
4. Conclusions
In general, the tested plant biostimulants induced increased levels of important bioactive compounds, particularly in what concerns γ-tocopherol and β-tocopherol in almonds, and linoleic acid (particularly when using NPK) and tocopherols levels (with best results when using NPK + phytoalgae) in hazelnuts. These results might be important to select the best plant biostimulant to be applied in each case, aiming to increase the expression of a specific bioactive compound, and inputting higher commercial value to these products.
Author Contributions
Conceptualization, C.M.C. and J.C.M.B.; Investigation, L.A.P. and F.S.R.; Methodology, L.A.P. and F.S.R.; Resources, M.Â.R. and C.M.C.; Supervision, F.S.R., A.L.V. and J.C.M.B.; Validation, L.B., M.Â.R. and I.C.F.R.F.; Writing–original draft, L.A.P. and F.S.R.; Writing–review and editing, L.B., M.Â.R., C.M.C., A.L.V., I.C.F.R.F. and J.C.M.B. All authors have read and agreed to the published version of the manuscript.
Funding
The authors are grateful to the Foundation for Science and Technology (FCT, Portugal) for financial support through national funds FCT/MCTES to CIMO (UIDB/00690/2020); to the national funding by FCT, P.I., through the institutional scientific employment program-contract for L. Barros and individual scientific employment program-contract (CEECIND/04479/2017). Further acknowledgments are due to the European Regional Development Fund (ERDF) through the Regional Operational Program North 2020, within the scope of Project Mobilizador Norte-01-0247-FEDER-024479: ValorNatural®, whom the author F.S. Reis thanks for her contract. This work was also funded by FEDER-Interreg España-Portugal programme through the project TRANSCoLAB 0612_TRANS_CO_LAB_2_P, and integrated in the activities of the Operational Group EGIS–Estratégias de Gestão Integrada do Solo e da Água em Espécies Produtoras de Frutos Secos, funded by PT2020 and EAFRD (European Agricultural Fund for Rural Development).
Institutional Review Board Statement
Not applicable.
Informed Consent Statement
Not applicable.
Conflicts of Interest
The authors declare no conflict of interest.
References
- Fideghelli, C.; De Salvador, F.R. World hazelnut situation and perspectives. Acta Hortic. 2009, 845, 39–52. [Google Scholar] [CrossRef]
- Islam, A. Hazelnut cultivation in Turkey. Akad. Ziraat Derg. 2018, 7, 251–258. [Google Scholar] [CrossRef] [Green Version]
- Sang, S.; Cheng, X.; Fu, H.-Y.; Shieh, D.-E.; Bai, N.; Lapsley, K.; Stark, R.E.; Rosen, R.T.; Ho, C.-T. New type sesquiterpene lactone from almond hulls (Prunus amygdalus Batsch). Tetrahedron Lett. 2002, 43, 2547–2549. [Google Scholar] [CrossRef]
- Rodrigues, M.A.; Bento, A.; Arrobas, M. Â Amendoeira: Estado Da Produção; Voz do Campo Lda: Castelo Branco, Portugal, 2018. [Google Scholar]
- Maguire, L.S.; O’Sullivan, S.M.; Galvin, K.; O’Connor, T.P.; O’Brien, N.M. Fatty acid profile, tocopherol, squalene and phytosterol content of walnuts, almonds, peanuts, hazelnuts and the macadamia nut. Int. J. Food Sci. Nutr. 2004, 55, 171–178. [Google Scholar] [CrossRef]
- Savage, G.P.; McNeil, D.L.; Dutta, P.C. Lipid composition and oxidative stability of oils in hazelnuts (Corylus avellana L.) grown in New Zealand. JAOCS J. Am. Oil Chem. Soc. 1997, 74, 755–759. [Google Scholar] [CrossRef]
- Alasalvar, C.; Shahidi, F.; Ohshima, T.; Wanasundara, U.; Yurttas, H.C.; Liyanapathirana, C.M.; Rodrigues, F.B. Turkish Tombul hazelnut (Corylus avellana L.). 2. Lipid characteristics and oxidative stability. J. Agric. Food Chem. 2003, 51, 3797–3805. [Google Scholar] [CrossRef]
- Amaral, J.S.; Casal, S.; Citová, I.; Santos, A.; Seabra, R.M.; Oliveira, B.P.P. Characterization of several hazelnut (Corylus avellana L.) cultivars based in chemical, fatty acid and sterol composition. Eur. Food Res. Technol. 2006, 222, 274–280. [Google Scholar] [CrossRef] [Green Version]
- Alasalvar, C.; Salvadó, J.-S.; Ros, E. Bioactives and health benefits of nuts and dried fruits. Food Chem. 2020, 314, 126192. [Google Scholar] [CrossRef]
- Alasalvar, C.; Pelvan, E. Fat-soluble bioactives in nuts. Eur. J. Lipid Sci. Technol. 2011, 113, 943–949. [Google Scholar] [CrossRef]
- Alasalvar, C.; Bolling, B.W. Review of nut phytochemicals, fat-soluble bioactives, antioxidant components and health effects. Br. J. Nutr. 2015, 113, S68–S78. [Google Scholar] [CrossRef]
- Venkatachalan, M.; Sathe, S.K. Chemical composition of selected edible nut seeds. J. Agric. Food Chem. 2006, 54, 4705–4714. [Google Scholar] [CrossRef] [PubMed]
- Horrobin, D.F.; Manku, M.S. How do polyunsaturated fatty acids lower plasma cholesterol levels? Lipids 1983, 18, 558–562. [Google Scholar] [CrossRef]
- Feldman, E.B. The scientific evidence for a beneficial health relationship between walnuts and coronary heart disease. J. Nutr. 2002, 132, 1062S–1101S. [Google Scholar] [CrossRef]
- Jones, P.; MacDougall, D.E.; Ntanios, F.; Vanstone, C.A. Dietary phytosterols as cholesterol-lowering agents in humans. Can. J. Physiol. Pharmacol. 1997, 75, 217–227. [Google Scholar] [CrossRef] [PubMed]
- Weststrate, J.A.; Meijer, G.W. Plant sterol-enriched margarines and reduction of plasma total- and LDL-cholesterol concentrations in normocholesterolaemic and mildly hypercholesterolaemic subjects. Eur. J. Clin. Nutr. 1998, 52, 334–343. [Google Scholar] [CrossRef] [Green Version]
- Coates, A.; Hill, A.; Tan, S. Nuts and Cardiovascular Disease Prevention. Curr. Atheroscler. Rep. 2018, 20, 1–9. [Google Scholar] [CrossRef]
- McGuire, M.; Beerman, K.A. Nutritional Sciences: From Fundamentals to Food; Wadsworth Cengage Learning: Boston, MA, USA, 2011; ISBN 9780324598643. [Google Scholar]
- Fang, Y.Z.; Yang, S.; Wu, G. Free radicals, antioxidants, and nutrition. Nutrition 2002, 18, 872–879. [Google Scholar] [CrossRef]
- Arranz, S.; Cert, R.; Pérez-Jiménez, J.; Cert, A.; Saura-Calixto, F. Comparison between free radical scavenging capacity and oxidative stability of nut oils. Food Chem. 2008, 110, 985–990. [Google Scholar] [CrossRef] [Green Version]
- Tahan, G.; Aytac, E.; Aytekin, H.; Gunduz, F.; Dogusoy, G.; Aydin, S.; Tahan, V.; Uzun, H. Vitamin e has a dual effect of anti-inflammatory and antioxidant activities in acetic acid-induced ulcerative colitis in rats. Can. J. Surg. 2011, 54, 333–338. [Google Scholar] [CrossRef] [Green Version]
- Valverde, M.; Madrid, R.; García, A.L. Effect of the irrigation regime, type of fertilization, and culture year on the physical properties of almond (cv. Guara). J. Food Eng. 2006, 76, 584–593. [Google Scholar] [CrossRef]
- Mondragón-Valero, A.; Lopéz-Cortés, I.; Salazar, D.M.; de Córdova, P.F. Physical mechanisms produced in the development of nursery almond trees (Prunus dulcis Miller) as a response to the plant adaptation to different substrates. Rhizosphere 2017, 3, 44–49. [Google Scholar] [CrossRef]
- Blunden, G. Agricultural Uses of Seaweeds and Seaweed Extracts; John Wiley & Sons: Chichester, UK, 1991; ISBN 0-471-92947-6. [Google Scholar]
- Crouch, I.J.; Van Staden, J. Commercial Seaweed Products as Biostimulants in Horticulture. J. Home Consum. Hortic. 1993, 1, 19–76. [Google Scholar] [CrossRef]
- Mooney, P.A.; van Staden, J. Algae and Cytokinins. J. Plant Physiol. 1986, 123, 1–21. [Google Scholar] [CrossRef]
- Kauffman, G.L.; Kneivel, D.P.; Watschke, T.L. Effects of a Biostimulant on the Heat Tolerance Associated with Photosynthetic Capacity, Membrane Thermostability, and Polyphenol Production of Perennial Ryegrass. Crop Sci. 2007, 47, 261–267. [Google Scholar] [CrossRef]
- Zhang, X.; Ervin, E.H.; Schmidt, R.E. Plant Growth Regulators Can Enhance the Recovery of Kentucky Bluegrass Sod from Heat Injury. Crop Sci. 2003, 43, 952. [Google Scholar] [CrossRef]
- Zhang, X.; Schmidt, R.E. Hormone—Containing Products’ Impact on Antioxidant Status of Tall Fescue and Creeping Bentgrass Subjected to Drought. Crop Sci. 2000, 40, 1344–1349. [Google Scholar] [CrossRef]
- Turan, M.; Köse, C. Seaweed extracts improve copper uptake of grapevine. Acta Agric. Scand. Sect. B Soil Plant. Sci. 2004, 54, 213–220. [Google Scholar] [CrossRef]
- Verkleij, F.N. Seaweed extracts in agriculture and horticulture: A review. Biol. Agric. Hortic. 1992, 8, 309–324. [Google Scholar] [CrossRef]
- Rathore, S.S.; Chaudhary, D.R.; Boricha, G.N.; Ghosh, A.; Bhatt, B.P.; Zodape, S.T.; Patolia, J.S. Effect of seaweed extract on the growth, yield and nutrient uptake of soybean (Glycine max) under rainfed conditions. S. Afr. J. Bot. 2009, 75, 351–355. [Google Scholar] [CrossRef] [Green Version]
- Amaral, J.S.; Cunha, S.C.; Santos, A.; Alves, M.R.; Seabra, R.M.; Oliveira, B.P.P. Influence of cultivar and environmental conditions on the triacylglycerol profile of hazelnut (Corylus avellana L.). J. Agric. Food Chem. 2006, 54, 449–456. [Google Scholar] [CrossRef]
- O’Brien, R. Fats and Oils; CRC Press: New York, NY, USA, 2003; ISBN 978-0-8493-1599-2. [Google Scholar]
- AOAC. Official Methods of Analysis of AOAC International, 20th ed.; Latimer, G.W., Jr., Ed.; AOAC: Rockville, MD, USA, 2016; ISBN 0935584870. [Google Scholar]
- Harumi Iyda, J.; Fernandes, Â.; Calhelha, R.C.; Alves, M.J.; Ferreira, F.D.; Barros, L.; Amaral, J.S.; Ferreira, I.C.F.R. Nutritional composition and bioactivity of Umbilicus rupestris (Salisb.)Dandy: An underexploited edible wild plant. Food Chem. 2019, 295, 341–349. [Google Scholar] [CrossRef] [Green Version]
- Barros, L.; Pereira, E.; Calhelha, R.C.; Dueñas, M.; Carvalho, A.M.; Santos-Buelga, C.; Ferreira, I.C.F.R. Bioactivity and chemical characterization in hydrophilic and lipophilic compounds of Chenopodium ambrosioides L. J. Funct. Foods 2013, 5, 1732–1740. [Google Scholar] [CrossRef]
- Pinela, J.; Barros, L.; Dueñas, M.; Carvalho, A.M.; Santos-Buelga, C.; Ferreira, I.C.F.R. Antioxidant activity, ascorbic acid, phenolic compounds and sugars of wild and commercial Tuberaria lignosa samples: Effects of drying and oral preparation methods. Food Chem. 2012, 135, 1028–1035. [Google Scholar] [CrossRef]
- Botta, R.; Gianotti, C.; Richardson, D.; Suwanagul, A.; Sanz, C.L. Hazelnut Variety Organic Acids, Sugars, And Total Lipid Fatty Acids. Acta Hortic. 1994, 351, 693–699. [Google Scholar] [CrossRef]
- Alasalvar, C.; Shahidi, F.; Liyanapathirana, C.M.; Ohshima, T. Turkish Tombul hazelnut (Corylus avellana L.). 1. Compositional characteristics. J. Agric. Food Chem. 2003, 51, 3790–3796. [Google Scholar] [CrossRef]
- Alasalvar, C.; Amaral, J.S.; Shahidi, F. Functional lipid characteristics of Turkish Tombul hazelnut (Corylus avellana L.). J. Agric. Food Chem. 2006, 54, 10177–10183. [Google Scholar] [CrossRef]
- Derewiaka, D.; Szwed, E.; Wołosiak, R. Physicochemical Properties and Composition of Lipid Fraction of Selected Edible Nuts. Pak. J. Bot. 2014, 46, 337–343. [Google Scholar]
- Karaman, S.; Karasu, S.; Tornuk, F.; Toker, O.S.; Geçgel, Ü.; Sagdic, O.; Ozcan, N.; Gül, O. Recovery potential of cold press byproducts obtained from the edible oil industry: Physicochemical, bioactive, and antimicrobial properties. J. Agric. Food Chem. 2015, 63, 2305–2313. [Google Scholar] [CrossRef] [PubMed]
- Memon, N.N.; Kanwal, S.; Talpur, F.N.; Afridi, H.I.; Memon, G.Z.; Samejo, M.Q.; Memon, J.R.; Khan, H.A. Nutritional characteristics (fatty acid profile, proximate composition and dietary feature) of selected nuts available in local market. Pak. J. Anal. Environ. Chem. 2019, 20, 39–46. [Google Scholar] [CrossRef]
- Kodad, O.; Estopañán, G.; Juan, T.; Alonso, J.M.; Espiau, M.T.; Socias i Company, R. Oil content, fatty acid composition and tocopherol concentration in the Spanish almond genebank collection. Sci. Hortic. 2014, 177, 99–107. [Google Scholar] [CrossRef]
- Özdemir, K.S.; Yılmaz, C.; Durmaz, G.; Gökmen, V. Corrigendum to “Hazelnut skin powder: A new brown colored functional ingredient” [Food Research International 65 (2014) 291-297]. Food Res. Int. 2015, 71, 184. [Google Scholar] [CrossRef]
- Zulfiqar, F.; Casadesús, A.; Brockman, H.; Munné-Bosch, S. An overview of plant-based natural biostimulants for sustainable horticulture with a particular focus on moringa leaf extracts. Plant Sci. 2020, 295, 110194. [Google Scholar] [CrossRef] [PubMed]
- Alasalvar, C.; Amaral, J.S.; Satır, G.; Shahidi, F. Lipid characteristics and essential minerals of native Turkish hazelnut varieties (Corylus avellana L.). Food Chem. 2009, 113, 919–925. [Google Scholar] [CrossRef]
- Benitez-Sánchez, P.L.; León-Camacho, M.; Aparicio, R. A comprehensive study of hazelnut oil composition with comparisons to other vegetable oils, particularly olive oil. Eur. Food Res. Technol. 2003, 218, 13–19. [Google Scholar] [CrossRef]
- Taş, N.G.; Gökmen, V. Profiling triacylglycerols, fatty acids and tocopherols in hazelnut varieties grown in Turkey. J. Food Compos. Anal. 2015, 44, 115–121. [Google Scholar] [CrossRef]
Publisher’s Note: MDPI stays neutral with regard to jurisdictional claims in published maps and institutional affiliations. |
© 2021 by the authors. Licensee MDPI, Basel, Switzerland. This article is an open access article distributed under the terms and conditions of the Creative Commons Attribution (CC BY) license (https://creativecommons.org/licenses/by/4.0/).