Article

An Attempt to Model the Surface Pressures of Apples Using the Finite Element Method

1
Institute of Agricultural Engineering, The Faculty of Life Sciences and Technology, Wrocław University of Environmental and Life Sciences, 50-375 Wrocław, Poland
2
Institute of Environmental Protection and Development, The Faculty of Environmental 7 Engineering and Geodesy, Wrocław University of Environmental and Life Sciences, 8, pl. Grunwaldzki 24, 50-363 Wrocław, Poland
3
Faculty of Mechanical Engineering, Wrocław University of Science and Technology, 50-370 Wrocław, Poland
*
Author to whom correspondence should be addressed.
Appl. Sci. 2021, 11(16), 7579; https://doi.org/10.3390/app11167579
Submission received: 4 July 2021 / Revised: 12 August 2021 / Accepted: 14 August 2021 / Published: 18 August 2021
(This article belongs to the Special Issue New Trends in Biosciences)

Abstract

:
Apples are the most popular fruits grown in Polish orchards. In order to obtain the best quality fruit, it is necessary to improve plantation maintenance, fruit harvesting, and processing. Given that many fruits are exposed to external factors, including forces that adversely affect their structure—causing them to crack, bruise, or crush—it is necessary to provide conditions that do not adversely affect their quality. Therefore, the aim of this article was to develop a simplified model of an apple that could be tested under different loads using the finite element method. The parameters of the model were selected to reflect the actual apple as accurately as possible. To assess the apples under impact load, as well as the construction of the FEM model, concrete and wooden substrates were used, where apples were dropped from height of 10 mm and 30 mm. Due to this research, an apple model was obtained that reflects the actual object very well (high R2 coefficient). In addition, the layering and distribution of surface pressures of the real and model objects from the distribution are presented. This shows that the constructed model corresponds to the behaviour of the biological material, subjected to loads in real conditions.
Keywords:
FEM; model; apple; force; strain

1. Introduction

Poland is one the world’s leading apple producers. The annual production volume reaches about 3 million tonnes [1]. When assessing the quality of these fruits, it turns out that only one-third are intended for dessert purposes, while the remaining quantity is only suitable for processing. The production of fruit of the highest quality, for direct consumption, the parameters of which are described in the Official Journal of the European Union, requires procedures to be followed to classify it in one of three quality classes. The ‘extra’ class includes apples of superior quality, which have, among other qualities, the whole stalk, and do not show any damage to the flesh, i.e., they must have no bruising. Apples in Class I may have no stalks, if the areas of detachment are clean and the skin in that area is not damaged. It is permissible for the flesh to be damaged (bruised) with an area not exceeding 1 cm2. Class II apples, i.e., the lowest class allowed on the consumer market, includes fruit, the flesh of which is damaged, with the damaged area not exceeding 2.5 cm2 [2,3].
It appears that the “structure of destination” should change in favour of dessert apples; therefore, high quality fruits are required. As emphasised by Konopacka and Rutkowski [4], and Nadulski [5], high quality apples translates into higher levels of export and, above all, greater consumption by increasingly demanding consumers. In order to ensure high quality fruit, care and harvesting should be carried out in such a way to prevent the occurrence of mechanical damage, which reduces their usefulness during storage. Among the most common causes of damage to apples, and, consequently, of the decrease in their quality, would include conducting the (subsequent) stages of the technological process in the wrong way. One example is the use of unsuitable fruit picking machines, which cause damage to the flesh tissue in the fruit, decreasing its quality. Consequently, this may lead to a reduction in exports [6,7,8,9].

1.1. Impact Loads on Biological Material

Apples are subjected to various static, dynamic, and impact loads during harvesting, handling, transport, sorting, storage and other operations necessary to obtain the final product. Impact loads are a major cause of knock-on effects that cause loss to apple growers, as they significantly affect the deterioration of fruit quality parameters [10]. During the impact, irreversible changes in the structure of the internal tissues occur, most often involving damage to cell walls. The mechanism of changes in the cellular structure of apples under impact loads differs significantly from those occurring under quasi-static loads. Therefore, it is not possible to analyse the mechanism of bruising formation and determination of resistance to apple bruise using simple measurement methods based on the compression test [11,12]. Under impact loads, the biological material behaves like an elastic material. Liquid and air filling the intercellular spaces do not have time to move to other less loaded areas where there are still free spaces [13]. This results in the release of stresses that exceed the strength of the cells, in the form of cracks and irreversible tissue damage. At low load speeds, biological materials exhibit strong viscoelastic properties. In the initial loading phase, after displacement of gases and filling of cell spaces, the process of liquid migration, causing deformation of cell walls, begins [14]. As a result, this type of load allows higher destructive stress values to be achieved than with impact loading.
In this situation, it becomes important to determine the critical values of the impact energy, for which the elastic deformation of the apple becomes permanent. It can be assumed that, in the case of elastic deformations, i.e., deformations in which the apple returns to its initial shape after removing the load, there is no damage to the flesh tissue, so there is no danger of bruising. Tissue damage occurs only when permanent deformations appear [15].
Permanent deformations are caused by contact of the outer layer of the apple skin with a hard surface, e.g., the wall of a box, working elements of machines used in the production process, but also when hitting another fruit. The intensity of the bruising also depends on a number of other factors, including the degree of ripeness, the weather conditions and the time of harvest [16]. The size of the bruising and, consequently, the usefulness of the fruit, depend mainly on the reactions of the biological material to the external load, and the time scale adopted [17,18].
Guillermin et al. [19] conducted research to assess the rheological properties of two apple varieties: Avrolles and Douce Coetligné. Based on the analysis of the tissue properties of the flesh and the juice content of the fruit, the authors assessed the behaviour of the apples during the compression test. Endurance tests were carried out 15 and 30 days after harvesting. In the case of Avrolles, the plasticity of the biological material was noticed, while in the case of Douce Coetligné, the viscoelastic properties were noticed. In the case of Douce Coetligné, the apple skin significantly reduced the formation of bruises and deformities in the flesh.

1.2. FEM Load Assessment of Biological Material

Forecasts of areas of influence, deformation, and distribution of surface pressure in fruit are important issues in post-harvest research. There are many methods for fruit damage assessment, i.e., by means of surface pressure and stress distribution [20]. Developments in computer technology, with the use of finite element methods (FEM, enable the use of this system to predict the mechanical behaviours of fruits under loading. It is used to solve complex problems with the use of computer engineering techniques, without the need to perform experimental studies. It is a particularly important technique used in the design and construction of engineering structures [21]. Petru et al. [22] described a mechanical behaviour of seeds that were exposed to external linear loading. Thanks to the tests carried out, the researchers identified seed sites that were particularly vulnerable to changes in the structure of biological material [22,23]. Guner et al. [24] examined the behaviour of the structure of the biological material using the example of a nut that was squeezed between two parallel plates until the shell and grain began to crack [24]. The behaviour of a biological material in individual layers of beans was also studied using the example of beans and peas. The maximum deformation that occurred during the external load application was determined. The finite element method was used to model the deformation [25]. Similar studies were conducted by Akangbe et al. [26], who, under external loading, studied the behaviour of interacting rapeseeds in the stack [26].
Theoretical aspects of computer integration—in regard to the method—were solved in the 1960s and 1970s. Research and development from the European Union’s research base in the 1990s resulted in extensive scientific output in various fields of engineering [27]. This method also proved useful in agricultural engineering research, in the context of deformation of agricultural products. Many tests were carried out to estimate the complex stress field of organic materials under different boundary conditions [28,29,30,31,32,33,34]. It should be stressed that most of these tests were carried out considering static or quasi-static load cases—small deformation and linear contacts with the linear assumptions of the elastic material model through implicit solvers. The consideration of non-linearity in partial contact and ductility in material models (especially in cases of impact loads) in such tests were absent or very limited [27].
Many experimental methods can measure the level of damage, stress distribution, surface pressure, and the reaction of the fruit to external forces. Works involving damage measurements, surface pressure using the finite element method are beginning to appear [21,22,23]. For example, the extent of deformation of the tomato fruit because of hard surface contact, between tomatoes, has been mapped [35]. In this study, a 3D model of the tomato was generated in CATIA, and then the compression tests were simulated using MES to determine the mechanical properties of the tomato. The comparison of experimental data with the conducted finite element simulation confirmed that the two sets of results were consistent [5]. The tests in which the Golden Delicious apple variety was tested also used a 3D scanner, a high-speed digital camera, and the FEM technique mentioned above; the aim of the tests was to determine the degree of deformation of these fruits arranged in a box. The experimentally validated FEM model in this study will be used to determine the appropriate conditions related to the transport, storage, and processing of apples. In this way, the authors confirmed the results of a simulation using SolidWorks during the fruit drop, where they also used a high-speed camera, and consequently noticed that the results of visual tests and simulations were very similar [35].
The susceptibility of pears to different impact conditions was determined experimentally and implemented using FEM [21]. In this test, the authors used three drop heights (0.2, 0.5, and 1 m), two impact surfaces (steel and wood), two fruit impact orientations (vertical and horizontal), and three ripeness levels (unripe, ripe, and overripe). The lowest and highest differences between the predicted and observed upholstery surfaces calculated by ANSYS software were 0.00% and 60.53%, respectively. Comparing experimental and model data, high compliance was observed for pears dropped from 0.2 and 0.5 m heights. These studies show the high efficiency of the applied FEM method as an accurate tool to study the deformation of biological material of agricultural origin.
The aim of the study was to develop a simplified model of an apple using the finite element method. The validation consisted in analyses and comparing the results obtained with the experimental results presented in the paper ‘Influence of Contact Surface Type on the Mechanical Damages of Apples Under Impact Loads’ [36], published in the journal Food Bioprocess Technology (2017) 10:1479–1494, doi:10.1007/s11947-017-1918-z. An innovative area in this study was the assessment of fruit damage based on the stress contour distribution based on the surface pressures.

2. Materials and Methods

The model of the apple (‘Golden Delicious’ variety) was presented as an ideal sphere with a diameter of 71.7 mm and a weight of 163 g, determined from an average measurement of 300 apples. Based on the geometric model, a discrete model (Figure 1) was made for finite element method (FEM) calculations.
The apple was modelled with an eight-node hexahedral solid element, a volume elements with 3 degrees of freedom in each node. The average size of a finite element was 1 mm. In the areas most stressed during the test, the grid of the elements was additionally compacted. Since, during the test, a partial plasticisation of the material of which the apple model was made may have occurred, and a significant change in the model may have occurred because of large deflections, all of the elements were adjusted to non-linear calculations, in terms of material and geometry. Considering that the model would have been exposed to fast-changing phenomena, specially prepared explicit elements were used. The material was homogeneous throughout the entire volume of the model. The choice of material was so difficult that it had to be suitable for studying dynamic phenomena and match the viscoelastic nature of the biological material. An additional difficulty was the behaviour of the actual object during the impact tests. The material of the apples was liquefied upon impact, changing the state. Modelling of phase transitions would considerably complicate the adjustment of the numerical model to the results obtained from the experiment. However, due to the way the object was deformed, a non-linear constitutive description of the material as a function of significant deformation had to be applied. The model was developed in the Abaqus CAE system. Finally, the authors decided on a material called Crushable Foam, available in the software used, designed for low-density polymer foams. It was considered that the behaviour of the apple material during dynamic events most resembles the crispy foam. It is an isotropic material, partially strengthening as the model volume changes. This reinforcement is directly related to the deformation mechanism in the apple, which is why the volumetric type reinforcement was chosen in the properties of the material. The description of this material assumes that the dependence of the flow surface in the deviant plane on pressure is expressed by means of an ellipse and uses three components of plasticizing stress (uniaxial compression, hydrostatic—in compression and tension) to determine the parameters of this ellipse. When the material is reinforced, the range of the described ellipse increases (the hydrostatic tensile stress (pt) remains constant, while the compression values (pc) move. An example of stress distribution for such a material before and after reinforcement is shown in Figure 2.
Appropriate parameters of the material were determined, based on an experimental compression test and dynamic analysis of the apples. The elastic values of tested material were as follows: Young’s modulus (E) = 4.069 MPa, Poisson’s ratio (ν) = 0.32, which were calculated in a paper prepared by Komarnicki et al. [36]. A density equal to 845 kg·m−3 was determined, based on the measurement of the whole series of objects. Table 1 presents the material parameters that were adopted.
The numerical tests consisted of dropping the model from a range of height (10–150 mm) on to a horizontal concrete and wooden slab. Their properties are presented in Table 2. Due to the structure of the wood material, Young’s modules for this material were specified in three directions of the grains: 1—longitudinal, 2—radial, and 3—tangential. Poisson’s ratios ν12 ν13 ν23 were also determined, based on the grain direction. Linear models of materials were adopted, as the stresses achieved in them were significantly below the yield point.
The calculations were performed in the Abaqus/Explicit module for the analysis of dynamic phenomena [37]. The model was forced kinematically, by means of speed, applied to the model over its entire volume. The speed was determined by the height from which the object was dropped. The speed range during analysis ranged from 443 to 1715 mm·s−1. Stopa et al., in their observations, assumed and confirmed the hypothesis that permanent deformations indicated an occurrence of the first signs of damage in the parenchyma tissue, and it followed an increase of the impact energy corresponding with the initial phase of maximum surface pressure stabilisation [20].
To provide this hypothesis, the following was conducted: detailed analyses of the contours and the distribution of average surface pressure during individual impacts for successive impact energies. The surfaces of the bruises were also measured as a measure of apple flesh damage.
The study lists and compares experimental results [36] with model results for discharges on two substrates: concrete and wood. Comparison of substrates from corrugated cardboard was abandoned due to difficulties in creating its numerical model. All drop heights, i.e., from 10 to 150 mm, were compared with a change in height every 10 mm. The heights of 10 and 30 mm were analysed in detail for both substrates. Komarnicki el al. [36], in their tests, considered these heights crucial, representing the limit beyond which the permanent deformation that causes the damage occurs.

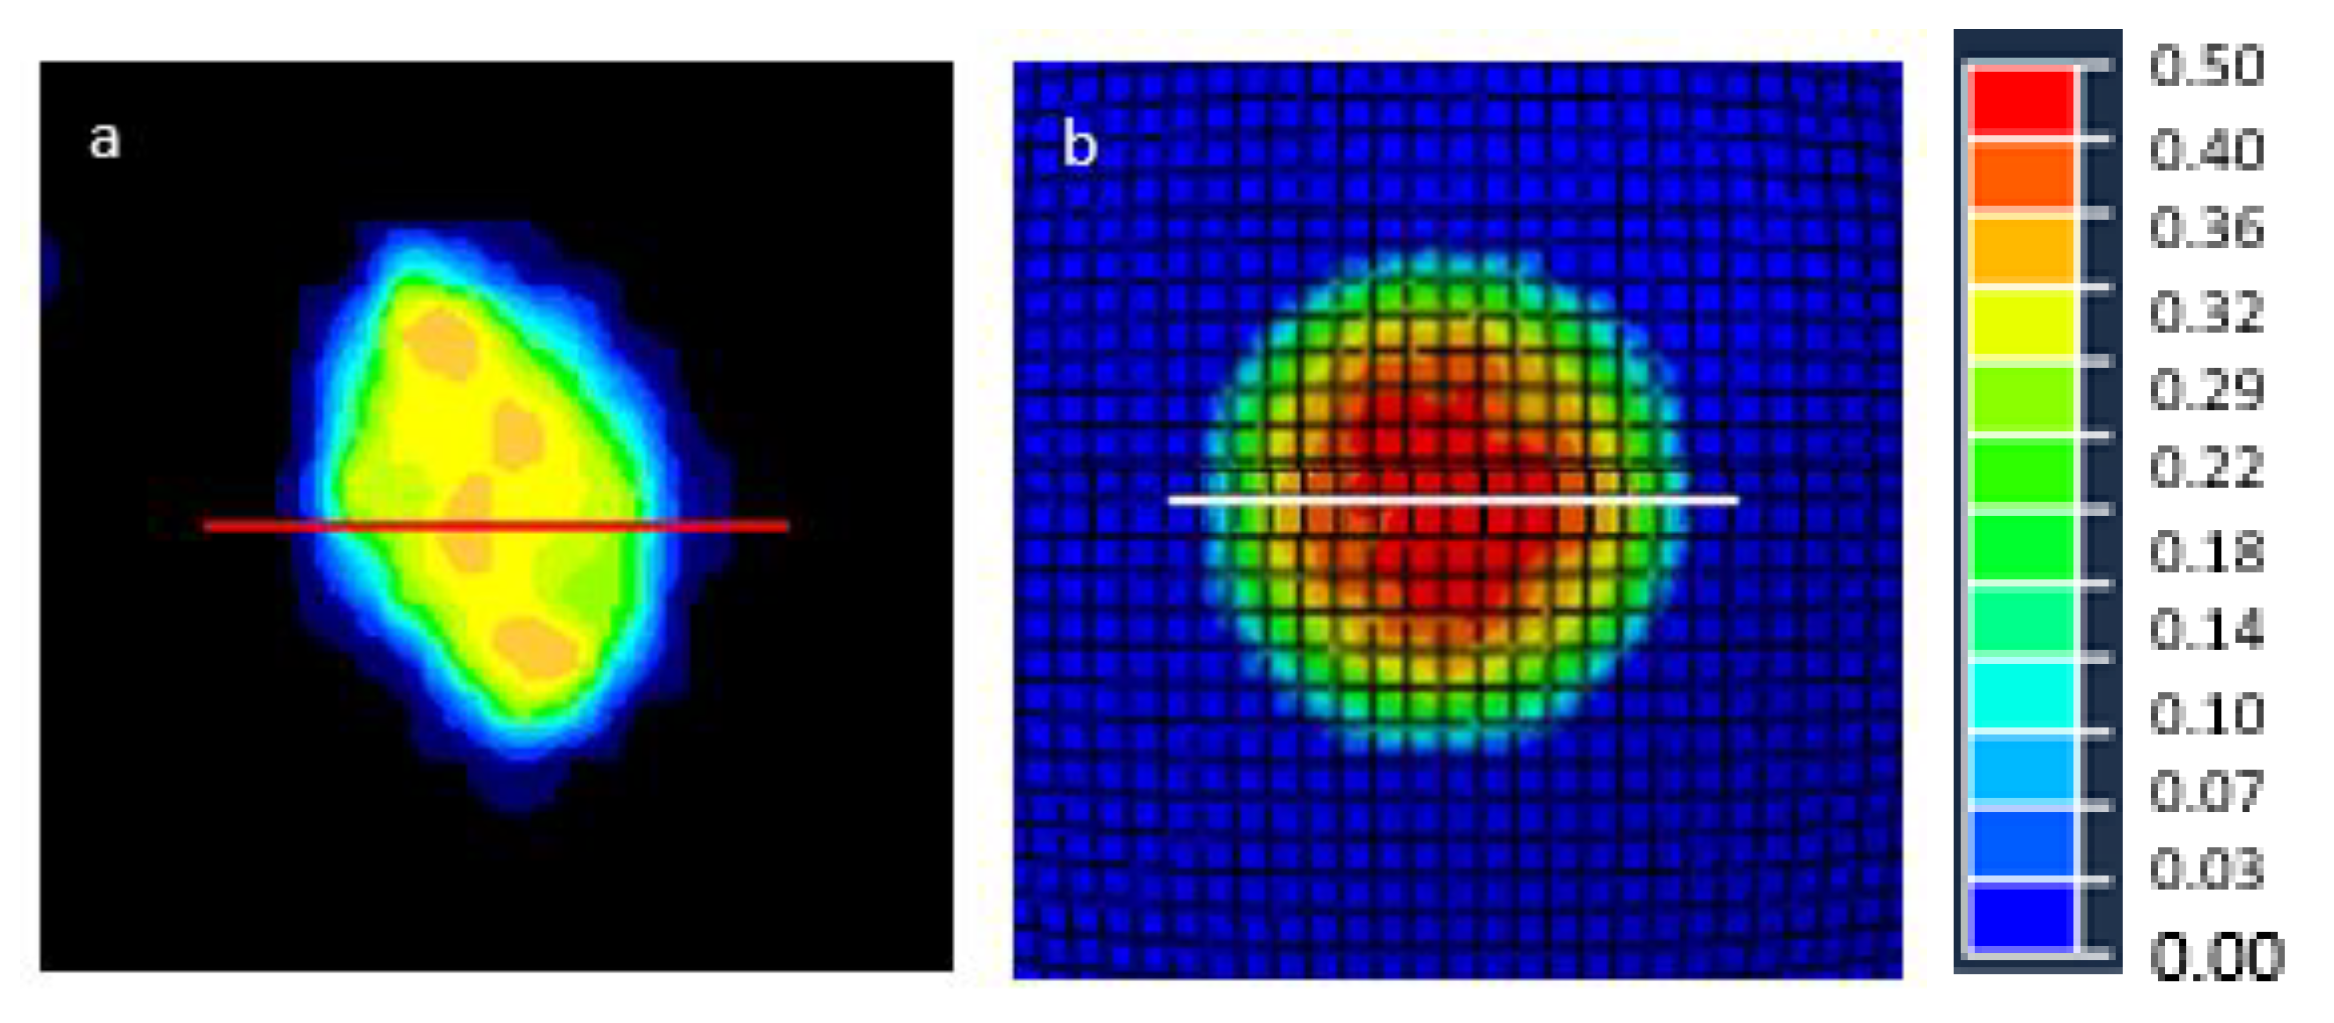
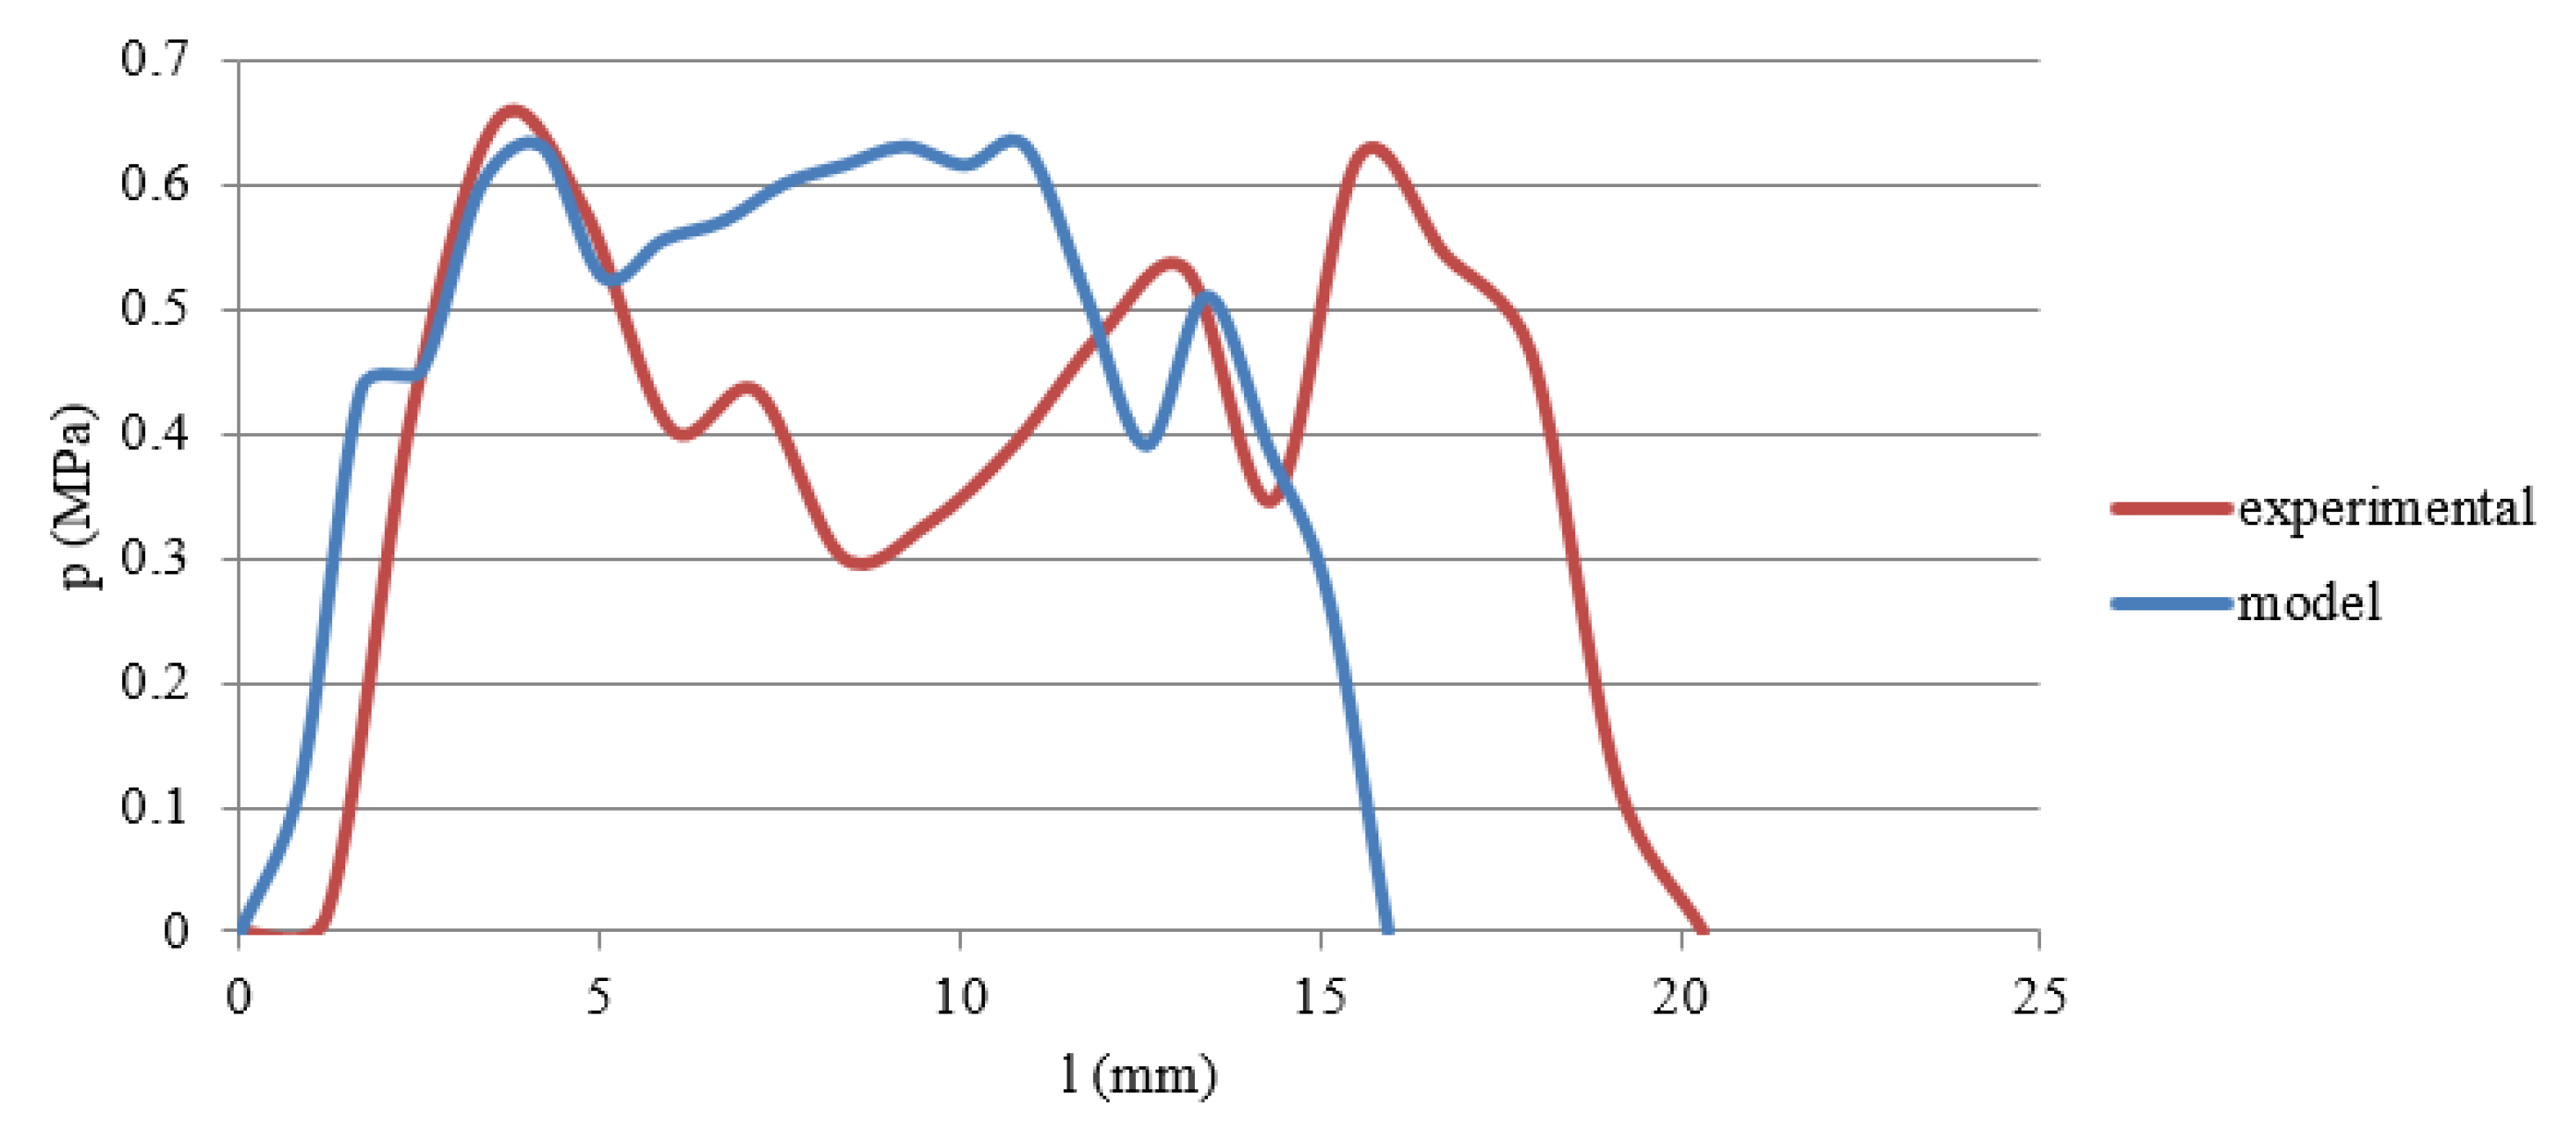
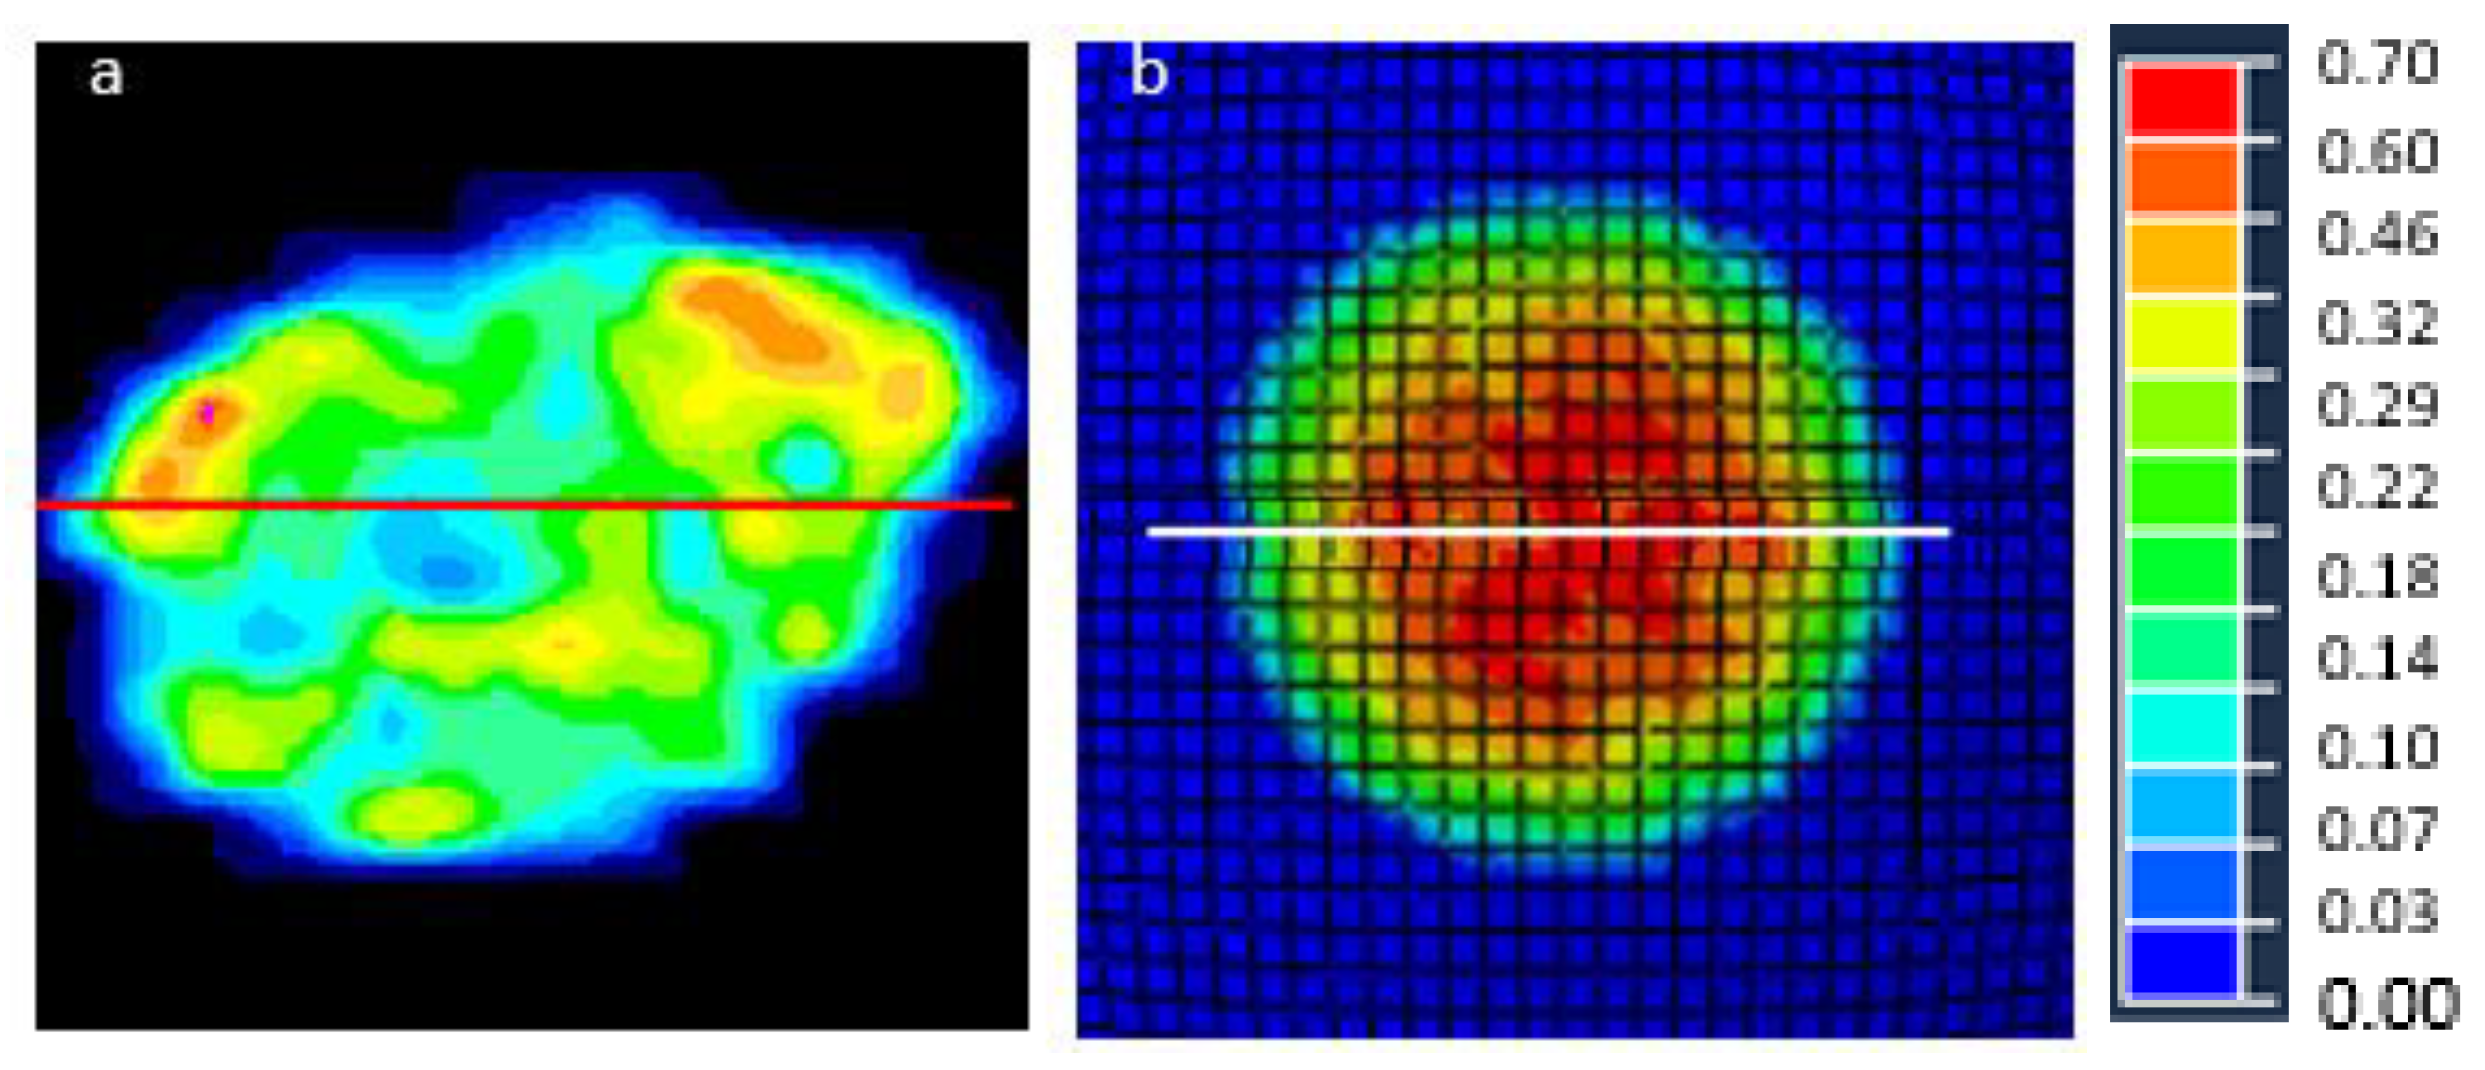
3. Results and Discussion

Figure 3, Figure 4 and Figure 5 present the average values of surface pressures obtained during the experimental tests.
The results were presented on the cut-off axis, and on the ordinate axis—the values calculated with the proposed model. The graph shows that the relation presenting the average maximum values of surface pressures can be considered correct because the average error of matching the model to the variables does not exceed ±10%. It should be noted that the material tested is of biological origin and is characterised by considerable anisotropy and irregularity within a single object (apples), influenced by conditions such as sunlight, humidity, temperature, and other conditions.
Figure 3 shows a comparison of mean values of surface pressures, p, obtained from experimental tests with model results for both substrates. The average model fitting error for each substrate was determined based on the average value of surface pressure +/−5% observations around the trend line (p < 0.95). The high density of the results indicates that the model is correctly matched to the real object, because the model values are slightly different from the experimental values. Based on the linear regression analysis and the coefficient of determination obtained from it, the model fit is good—for concrete substrate R2 = 0.68—and high (for wood substrate R2 = 0.84). The higher surface pressure p values obtained for both experimental and model values for the concrete type substrate are related to the fact that it was a non-deformable substrate with a high modulus of elasticity [20].
In Figure 4, a comparison of contact surface A obtained through experimental and model tests for both substrates is presented. An even distribution of results within an error limit of 10% can be observed. For both substrates, the coefficient of determination obtained, based on linear regression analysis, was very good. For instance, concrete R2 = 0.90 and wood R2 = 0.94. Stopa et al. [20], Komarnicki et al. [36], and Unuigbe and Onuoha [38] proved that the size of the contact surface depended on the type of the resistance surface and was capable of deformation, i.e., the flexural modulus.
In Figure 5, a comparison of force F values for experimental and model values is presented. The results obtained are within an error limit of 10%. For both substrates, the coefficient of determination obtained based on linear regression analysis is very good. For instance, concrete R2 = 0.90 and wood R2 = 0.92. The obtained values are influenced by the height of the drop, the type of retaining surface, and the radius of curvature of the tested object. The deviation of some measurements from the mean value has no significant effect because these are the values obtained for the drop height at which the damage to the flesh tissue occurs [20,36].
In fact, a high coefficient of determination does not always guarantee a perfect fit of model to the experimental data. In this paper, discrepancies between the experimental and model data may result, among others, from properties of the material, conditions of fruit ripening, and conditions under which the tests are performed. These circumstances influence the differences in contact surface areas and surface pressures in the analysed Figure 3, Figure 4 and Figure 5.
Figure 6 presents the effect of the drop height on experimental and model values of surface pressures, p. It can be observed that model values start from a lower value, by about 0.04 MPa from the experimental values and their increase with height increase occurs faster than in the experimental results, and reaches most of them. Komarnicki et al. [36], in his studies, pointed out that, for a wood-type substrate, with a 10 mm drop height, damage occurs, so higher values obtained at higher drop heights do not have any effect, because, even at lower values, damage occurs. As previously stated, these results are within the error limit (10%) and should be considered as very good due to the value of the coefficient of determination R2 = 0.99 obtained from the power model. The results are presented in Figure 6.
In Figure 7, a comparison of contact area A for experimental and model values is presented. The obtained values differ to a small extent, as evidenced by the presented trend lines for their courses, where determination coefficients are close to unity and are R2 = 0.96 for experimental results and R2 = 0.98 for model results. Based on the results of the contact surface, it can be concluded that the proposed model is a very good representation of reality.
In Figure 8, a comparison of the obtained force F values for experimental and model values is presented. It can be observed that the strength values are close to each other and are characterised by an equal fast build-up rate as the height increases; the trend lines for both runs are characterised by a high coefficient of determination close to unity.
In Figure 9, the effect of drop height on experimental and model values of surface pressures is presented. It can be observed that model values start from a lower value, around 0.1 MPa from the experimental values, and their increase with the drop height increase occurs faster than in the experimental results, but reaches a similar maximum value. However, as previously stated, these results were within the error ±10% compared to the base value calculated.
In Figure 10, a comparison of contact area A for experimental and model values is presented. The obtained values differ to a small extent; bigger values were obtained in the model tests. On the other hand, the increases in contact area values are similar and have a similar course.
In Figure 11, a comparison of the obtained force F values for experimental and model values is presented. It can be observed that the force values are similar to each other and are characterised by a comparable rate of increase in speed, as the drop height increases to 70 mm, while from the drop height of 80 mm, the model values are characterised by a greater increase in force, F. The trend lines for both runs have high determination factors.
Figure 12 and Figure 13a,b present the courses of values (of surface pressures) as a function of distance for the drop of fruit, from a height of 10 mm on the concrete substrate, as well as drawings of contour lines and distributions of surface pressures of the real and model objects, in the cross-section passing through the central point of contact. A difference in maximum surface pressure values of 0.1 MPa can be observed (a relative difference of 22%). However, based on course observations, it can be concluded that this difference is insignificant, because a higher value was obtained in the experimental studies and no damage was found due to the shape of the surface pressure distribution, whose maximum values were in the central point of contact. This indicates that we are dealing with an elastic deformation. This also confirms the absence of visible damage to the flesh tissue of the tested apple at the point of contact with the resistance element in the stroke test [36]. Based on the shape of the contact, it can be concluded that this difference may be due to the geometry of the objects. The experimental object could have a smaller radius of curvature (longitudinal shape of the contact) at this point [36], resulting in a higher surface pressure value, whereas the numerical model is the ideal ball.
Figure 14 and Figure 15a,b present the courses of values of surface pressures as functions of distance for the drop, from a height of 30 mm on the concrete substrate, as well as drawings of contour lines and distributions of surface pressures of the real and model objects, in the cross-section passing through the central point of contact. For drops from a height of 30 mm, Komarnicki et al. [36] found the damage, as evidenced by the shift of maximum surface pressures from the central zone to the peripheral zone of the contact area. In the analysed case, the surface pressure values, similar to the height of 10 mm, was 0.05 MPa lower for the numerical model than the experimental values. During the course of the maximum values of surface pressures, in the cross-section passing through the central point of contact, a decrease of these values could be observed in the central part of the contact, indicating the formation of plastic deformation, as confirmed by Stopa et al. [20] and Komarnicki et al. [36]. Furthermore, they discovered that, in extreme cases, the surface pressure values in the central contact zone might decrease to zero.
Figure 16 and Figure 17a,b presented the courses of values of surface pressures as functions of distance for the drop, from the height of 10 mm on the wooden substrate, as well as drawings of contour lines and distributions of surface pressures of the real and model objects, in the cross-section passing through the central point of contact. It can be observed that the difference in the maximum values of surface pressures, as opposed to the concrete substrates, are smaller and amount to about 0.03 MPa. Based on observations of the course, it can be concluded that this difference is not significant, because a higher value was obtained in the experimental studies, and no damage was found due to the shape of the distribution of surface pressures, whose maximum values were at the central point of contact. It can also be concluded that we are dealing with an elastic deformation. This confirms the absence of visible damage to the flesh tissue of the tested apple at the point of contact with the resistance element in the stroke test [20,36]. Based on the shape of the contact, it can be concluded that this difference may be due to the geometry of objects. The experimental object could have a smaller radius of curvature (longitudinal shape of the contact) [20,36], resulting in a higher surface pressure, while the numerical model is the ideal ball.
Figure 18 and Figure 19a,b present the courses of values of surface pressures as functions of distance for the drop, from the height of 30 mm on the wooden substrate, as well as drawings of contour lines and distributions of surface pressures of the real and model objects, in the cross-section passing through the central point of contact. For drops from a height of 30 mm, Komarnicki et al. [36] found the damage, as evidenced by the shift of maximum surface pressures from the central zone to the peripheral zone of the contact area. In the analysed case, the surface pressure values, as opposed to a drop from a height of 10 mm, reached similar values. In the course of the maximum values of surface pressures in the cross-section passing through the central point of contact, a decrease of these values was observed in the central part of the contact, which indicates the formation of plastic deformation, as confirmed by Stopa et al. [20] and Komarnicki et al. [36]. Furthermore, they found that, in extreme cases, the surface pressure values in the central contact zone might decrease to zero.

4. Conclusions

The relationship between load and deformation may become non-linear; a non-linear analysis should be carried out at this point to obtain realistic results that reflect the actual behaviour. In this context, a clear approach to the solution was identified as valuable in solving recharging cases, such as the impact/collision and drop test event. The explicit dynamics system was designed to simulate non-linear structural mechanic applications. In complex applications, open methods are more appropriate and an open approach provides an alternative process to solving problems [39,40,41,42,43]. Today’s technology allows us to efficiently perform non-linear and time-dependent impact load cases using simulations based on numerical methods. However, these types of non-linearities (geometry, contact, and/or non-linearity of material), including dynamic simulations, have not yet become major practices in studies related to the deformation of agricultural products, because of their interactions [44].
In the literature, there are examples of modelling the behaviour of fruits (e.g., pears, apples, or tomatoes) under stress in quasi-static conditions. The proposed models accurately reproduced real objects, in terms of geometry, using 3D scanning; however, the three-layer structures and differences in physical and mechanical properties of the tissues of individual layers (skin, flesh tissue, and seminal nest) were often omitted [29]. The presented research, which included modelling of surface pressures, could replace long-lasting and time-consuming experimental studies. Moreover, a FEM model can be used to analyse and design new devices, technologies, or systems, e.g., during transport or processing, in order to reduce the risk of damage, as well as real deformation of the tissues of plant origin, at the stage of harvesting, transport, storage, and processing.
For this reason, we decided to create a three-layered model of the ‘Golden Delicious’ apple variety, taking into account the interactions between the individual layers and using experimental studies to determine the properties (Poisson’s number, modulus of elasticity) of individual layers.
The next step of our study will obtain a creation of geometric model that will reflect with high precision a real object. Future plans include research on other apple varieties and other types of agricultural products, to define the damage of flesh tissue based on surface pressure. The created models will be used to analyse harvesting, transport, and storage processes, in order to reduce the occurrence of damage and design new technological lines.

Author Contributions

D.S.: main author, worked on all parts of the paper. Ł.K.: worked on the introduction, results, discussion, and the conclusion. P.D.: worked on the material and methods, mainly the FEM model. R.S. advised when the main author was in doubt. All authors have read and agreed to the published version of the manuscript.

Funding

Financial support from the Wrocław University of Environmental and Life Sciences is gratefully acknowledged. The study was financed by Wrocław University of Environmental and Life Sciences from research project D220/0004/17, under the program “Innovative Doctorate”.

Conflicts of Interest

The authors declare no conflict of interest.

References

  1. Poland Statistics, Wynikowy Szacunek Głównych Ziemiopłodów Rolnych Iogrodniczych w 2020r. Available online: Stat.gov.pl/obszary-tematyczne/rolnictwo-lesnictwo/uprawy-rolne-i-ogrodnicze/produkcja-upraw-rolnych-i-ogrodniczych-w-2019-roku,9,18.html (accessed on 14 December 2020).
  2. Commission Implementing Regulation (EU). No 543/2011 of 7 June 2011 laying down detailed rules for the application of Council Regulation (EC) No 1234/2007 in respect of the fruit and vegetables and processed fruit and vegetables sectors. Off. J. Eur. Union Legis. 2011, 54. [Google Scholar] [CrossRef]
  3. Komarnicki, P.; Stopa, R.; Szyjewicz, D.; Młotek, M. Evaluation of bruise resistance of pears to impact load. Postharvest Biol. Technol. 2016, 114, 36–44. [Google Scholar] [CrossRef]
  4. Konopacka, D.; Rutkowski, K.; Jabłek, C.Z.J., II. Hasło Ogrodnicze. Available online: http://www.ho.haslo.pl/article.php?id=662&rok=2001&numer=05 (accessed on 10 December 2019).
  5. Nadulski, R. Wpływ czasu i warunków przechowywania jabłek na ich wybrane właściwości mechaniczne. Inżynieria Rol. 2009, 2, 107–116. [Google Scholar]
  6. Bollen, A.F.; Rue, B.T.D. Handling Impacts for Kiwifruit, Asian Pears and Apples. Am. Soc. Agric. Eng. 1990, 5, 14. [Google Scholar]
  7. Barchi, G.L.; Berardinelli, A.; Guarnieri, A.; Ragni, L.; Totaro, C. Fila Damage to Loquats by Vibration-simulating Intra-state Transport. Biosyst. Eng. 2002, 82, 305–312. [Google Scholar] [CrossRef]
  8. Stropek, Z.; Gołacki, K. A new method for measuring impact related bruises in fruits. Postharvest Biol. Technol. 2015, 110, 131–139. [Google Scholar] [CrossRef]
  9. Sitkei, G. Mechanics of Agricultural Materials; Elsevier: Sopran, Hungary, 1987. [Google Scholar]
  10. Opara, U.L.; Pathare, P.B. Bruise damage measurement and analysis of fresh horticultural produce—A review. Postharvest Biol. Technol. 2014, 91, 9–24. [Google Scholar] [CrossRef]
  11. Gołacki, K. Prędkość i energia w procesie deformacji materiału roślinnego na przykładzie korzeni marchwi. Zeszyty Problemowe Postępów Nauk Rolniczych 1996, 425, 61–66. [Google Scholar]
  12. Gołacki, K. Test relaksacji naprężeń dla korzeni marchwi. Zeszyty Problemowe Postępów Nauk Rolniczych 1996, 433, 347–351. [Google Scholar]
  13. Gołacki, K.; Bobin, G.; Stropek, Z. Bruise resistance of apples (Melrose variety). Teka Komisji Motoryzacji i Energetyki Rolnictwa 2009, 9, 40–47. [Google Scholar]
  14. Blahovec, J. A simple model of the processes of compression and mechanical damage of pulps (In Czech). Zemed. Technol. 1985, 31, 349–364. [Google Scholar]
  15. Gharaghani, B.N.; Maghsoudi, H. Free fall analysis of orange fruit using numerical and experimental methods. Int. J. Food Prop. 2018, 21, 484–495. [Google Scholar] [CrossRef] [Green Version]
  16. Van Zeebroeck, M.; Van Linden, V.; Darius, P.; De Ketelaere, B.; Ramon, H.; Tijskens, E. The effect of fruit factors on the bruise susceptibility of apples. Postharvest Biol. Technol. 2007, 46, 10–19. [Google Scholar] [CrossRef]
  17. Blahovec, J. Role of water content in food and product texture. Int. Agrophys. 2007, 21, 209–215. [Google Scholar]
  18. Balasubramanian, S.; Singh, K.; Kumar, R. Physical properties of coriander seeds at different moisture content. Int. Agrophys. 2012, 26, 419–422. [Google Scholar] [CrossRef]
  19. Guillermin, N.; Dupont, C.; Le Morvan, J.M.; Langlais, C.; Mauget, J.C. Rheological and technological properties of two cider apple cultivars. LWT Food Sci. Technol. 2006, 39, 995–1000. [Google Scholar] [CrossRef]
  20. Stopa, R.; Szyjewicz, D.; Komarnicki, P.; Kuta, Ł. Limit values of impact energy determined from contours and surface pressure distribution of apples under impact loads. Comput. Electron. Agric. 2018, 154, 1–9. [Google Scholar] [CrossRef]
  21. Macek, R.; Silling, S. Peridynamics via finite element analysis. Finite Elem. Anal. Des. 2007, 43, 1169–1178. [Google Scholar] [CrossRef]
  22. Petru, M.; Novak, O.; Herak, D.; Simanjuntak, S. Finite element method model of the mechanical behaviour of Jatropha cur-cas L. seed under compression loading. Biosyst. Eng. 2012, 111, 412–421. [Google Scholar] [CrossRef]
  23. Herak, D.; Kabutey, A.; Divisova, M.; Simanjuntak, S. Mathematical model of mechanical behaviour of Jatropha curcas L. seeds under compression loading. Biosyst. Eng. 2013, 114, 279–288. [Google Scholar] [CrossRef]
  24. Güner, M.; Dursun, E.; Dursun, I. Mechanical Behaviour of Hazelnut under Compression Loading. Biosyst. Eng. 2003, 85, 485–491. [Google Scholar] [CrossRef]
  25. Herak, D.; Kabutey, A.; Sedlacek, A.; Gurdil, G. Mechanical behaviour of several layers of selected plant seeds under com-pression loading. Res. Agric. Eng. 2012, 58, 24–29. [Google Scholar] [CrossRef] [Green Version]
  26. Akangbe, O.; Herak, D. Mechanical behaviour of selected bulk oilseeds under compression loading. Agron. Res. 2017, 15, 941–951. [Google Scholar]
  27. Munjiza, A.; Rougier, E.; Knight, E. Large Strain Finite Element Method: A Practical Course; John Wiley & Sons: Hoboken, NJ, USA, 2014. [Google Scholar]
  28. Cardenas-Weber, M.; Stroshine, R.L.; Haghighi, K.; Edan, Y. Melon material properties and finite element analysis of melon compression with application to robot gripping. Trans. ASAE 1991, 34, 920–929. [Google Scholar] [CrossRef]
  29. Celik, H.K. Determination of bruise susceptibility of pears (Ankara variety) to impact load by means of FEM-based explicit dynamics simulation. Postharvest Biol. Technol. 2017, 128, 83–97. [Google Scholar] [CrossRef]
  30. Fadiji, T.; Coetzee, C.; Chen, L.; Chukwu, O.; Opara, U.L. Susceptibility of apples to bruising inside ventilated corrugated paperboard packages during simulated transport damage. Postharvest Biol. Technol. 2016, 118, 111–119. [Google Scholar] [CrossRef]
  31. Li, Z.; Li, P.; Liu, J. Effect of Mechanical Damage on Mass Loss and Water Content in Tomato Fruits. Int. Agrophys. 2011, 25, 77–83. [Google Scholar]
  32. Lu, R.; Abbott, J.A. Finite element analysis of modes of vibration in apples. J. Texture Stud. 1996, 27, 265–286. [Google Scholar] [CrossRef]
  33. Topakci, M.; Celik, H.K.; Canakci, M.; Rennie, A.; Akinci, I.; Karayel, D. Deep Tillage Tool Optimization by Means of Finite Element Method: Case Study for a Subsoiler Tine. J. Food Agric. Environ. 2010, 8, 531–536. [Google Scholar]
  34. Zhang, S.; Wu, X.; Zhang, S.; Cheng, Q.; Tan, Z. An effective method to inspect and classify the bruising degree of apples based on the optical properties. Postharvest Biol. Technol. 2017, 127, 44–52. [Google Scholar] [CrossRef]
  35. Celik, H.K.; Rennie, A.E.; Akinci, I. Deformation behaviour simulation of an apple under drop case by finite element method. J. Food Eng. 2011, 104, 293–298. [Google Scholar] [CrossRef]
  36. Komarnicki, P.; Stopa, R.; Szyjewicz, D.; Kuta, Ł.; Klimza, T. Influence of Contact Surface Type on the Mechanical Damages of Apples Under Impact Loads. Food Bioprocess. Technol. 2017, 10, 1479–1494. [Google Scholar] [CrossRef] [Green Version]
  37. Masso-Moreu, Y.; Mills, N. Impact compression of polystyrene foam pyramids. Int. J. Impact Eng. 2003, 28, 653–676. [Google Scholar] [CrossRef]
  38. Unuigbe, O.M.; Onuoha, S.N. Assessment of impact damage to apple fruits. Niger. J. Technol. 2013, 32, 137–141. [Google Scholar]
  39. ANSYS Doc. 2016. Available online: https://ansyshelp.ansys.com (accessed on 10 February 2020).
  40. Lee, J.; Lee, B. Modal analysis of carbon nanotubes and nanocones using FEM. Comput. Mater. Sci. 2012, 51, 30–42. [Google Scholar] [CrossRef]
  41. SolidWorks Doc. 2010. Available online: https://help.solidworks.com (accessed on 10 February 2020).
  42. Wakabayashi, N.; Ona, M.; Suzuki, T.; Igarashi, Y. Nonlinear finite element analyses: Advances and challenges in dental applications. J. Dent. 2008, 36, 463–471. [Google Scholar] [CrossRef] [PubMed]
  43. Du, C.-J.; Sun, D.-W. Learning techniques used in computer vision for food quality evaluation: A review. J. Food Eng. 2006, 72, 39–55. [Google Scholar] [CrossRef]
  44. Stopa, R.; Komarnicki, P.; Szyjewicz, D.; Kuta, Ł. Modeling of carrot root radial press process for different shapes of loading elements using the finite element method. Int. J. Food Prop. 2017, 20, S340–S352. [Google Scholar] [CrossRef]
Figure 1. Cross-section view of the FEM model of an apple.
Applsci 11 07579 g001
Figure 2. Exemplary sections of the initial and a hardened yield surface for the crushable foam, in the plane containing the hydrostatic stress axis.
Applsci 11 07579 g002
Figure 3. Comparison of average values of surface pressures obtained during the experimental tests and based on the numerical model. pw—means surface pressure for wood surface, pc—means surface pressure for concrete surface.
Applsci 11 07579 g003
Figure 4. Comparison of contact surfaces obtained from experimental studies and based on a numerical model, for both substrates. Aw—means contact surface for wood surface, Ac—means contact surface for concrete surface.
Applsci 11 07579 g004
Figure 5. Comparison of the force values obtained based on experimental tests and on the numerical model for both substrates. Fw—means force for wood surface, Fc—means force for concrete surface.
Applsci 11 07579 g005
Figure 6. Influence of drop height on the experimental and model values of surface pressure, for wood type substrates. pm—means model surface pressure, pe—means experimental surface pressure. Error bars represent mean ± SD (standard deviation).
Applsci 11 07579 g006
Figure 7. Influence of the drop height on the experimental and model contact surface, for wood type substrates. Am—means model contact surface, Ac—means experimental contact surface. Error bars represent mean ± SD (standard deviation).
Applsci 11 07579 g007
Figure 8. Influence of the drop height on the experimental and model force value, for wood type substrates. Fm—means model force, Fe—means experimental force. Error bars represent mean ± SD (standard deviation).
Applsci 11 07579 g008
Figure 9. Influence of drop height on the experimental and model values of surface pressure, for concrete type substrates. pm—means model surface pressure, pe—means experimental surface pressure. Error bars represent mean ± SD (standard deviation).
Applsci 11 07579 g009
Figure 10. Influence of the drop height on the experimental and model contact surface, for concrete type substrates. Am—means model contact surface, Ac—means experimental contact surface. Error bars represent mean ± SD (standard deviation).
Applsci 11 07579 g010
Figure 11. Influence of the drop height on the experimental and model force value, for wood type substrates. Fm—means model force, Fe—means experimental force. Error bars represent mean ± SD (standard deviation).
Applsci 11 07579 g011
Figure 12. Surface pressure values as a function of the distance for dropping an apple from a height of 10 mm.
Applsci 11 07579 g012
Figure 13. Layers and surface pressure distributions of the real object (a) and model object (b) for an apple dropped from a height of 10 mm on a concrete substrate in a section passing through the central point of contact.
Applsci 11 07579 g013
Figure 14. Surface pressure values as a function of distance for dropping an apple from a height of 30 mm on a concrete substrate.
Applsci 11 07579 g014
Figure 15. Layers and surface pressure distributions of the real object (a) and model object (b) for an apple dropped from a height of 30 mm on a concrete substrate in a section passing through the central point of contact.
Applsci 11 07579 g015
Figure 16. Surface pressure values as a function of distance for dropping an apple from a height of 10 mm on a wooden substrate.
Applsci 11 07579 g016
Figure 17. Layers and surface pressure distributions of the real object (a) and model object (b) for an apple dropped from a height of 10 mm on a wooden substrate in a section passing through the central point of contact.
Applsci 11 07579 g017
Figure 18. Surface pressure values as a function of distance for dropping an apple from a height of 30 mm on a wooden substrate.
Applsci 11 07579 g018
Figure 19. Layers and surface pressure distributions of the real (a) and model (b) object for an apple dropped on a wooden substrate from a height of 30 mm in the cross-section passing through the central point of contact.
Applsci 11 07579 g019
Table 1. Properties of the crushable foam material used.
Foam HardeningRate Dependent
Yield StressUniaxial Plastic StrainYield Stress
Ratio
Equivalent Plastic Strain
Rate
0.300.10
310.51
Table 2. Properties of the impact surface used.
Density (kg·m−3)Elastic Properties
Young’s Modulus (MPa)Poisson’s Ratio
Concrete240014,0000.2
Wood1000E1E2E3ν12ν13ν23
12,5008308300.4670.3720.435
Publisher’s Note: MDPI stays neutral with regard to jurisdictional claims in published maps and institutional affiliations.

