Article

Seismic Performance of Grille-Type Steel Plate Concrete Composite Walls with Application in a Super-High-Rise Building

1
China Construction Seventh Engineering Division (Shanghai) Corp., Ltd., 235 E. Yunling Rd., Putuo District, Shanghai 200062, China
2
Department of Disaster Mitigation for Structures, College of Civil Engineering, Tongji University, 1239 Siping Rd., Shanghai 200092, China
*
Author to whom correspondence should be addressed.
Appl. Sci. 2021, 11(16), 7580; https://doi.org/10.3390/app11167580
Submission received: 31 May 2021 / Revised: 11 August 2021 / Accepted: 16 August 2021 / Published: 18 August 2021

Abstract

:

Featured Application

The grille-type steel plate concrete composite wall (GSPCW) is an innovative shear wall system that has recently been developed. This type of shear wall is characterized by large vertical and lateral load capacity while maintaining large deformation capability. Since barely any traditional reinforcing bars are needed, the structural measures for wall construction are simple and can be easily implemented. Based on both experimental and numerical investigations of the GSPCW wall components, the seismic performance of GSPCW walls have been verified to be satisfactory in terms of load-bearing capacity, stiffness and deformation capacity, energy dissipation, etc. Moreover, further analysis on the application of GSPCW walls in a super-high-rise building as a case study show the excellent performance of the system. Based on these findings, it can be inferred that GSPCW wall could be used as an alternative system for conventional steel concrete composite wall, and is expected to be a promising system for high-rise buildings in seismic regions.

Abstract

The grille-type steel plate concrete composite wall (GSPCW) is an innovative shear wall system that mainly consists of steel faceplates, steel tie plates and infilled concrete. Compared to traditional steel plate concrete composite shear walls, the advantages of GSPCW walls include: (1) relatively high lateral and buckling resistance; and (2) simple structural measures for convenient construction and implementation. This paper presents the results of extensive numerical investigations regarding GSPCW systems, examining both GSPCW wall components and their application in a super-high-rise building as a case study. First, typical GSPCW wall models are established using DIANA software, and the numerical models are validated on the basis of comparison with results from previously reported experimental tests. The verified models are further used to perform parametric analyses with the aim of further understanding the effects of various design parameters on the seismic performance of GSPCW systems, including steel ratio, axial load ratio, height-to-width ratio, aspect ratio of the grille steel plate, and concrete compressive strength. Second, a super-high-rise building was selected for application to perform a case study of a GSPCW system. The seismic performance of the tall building in the case study was comparatively evaluated on the basis of both nonlinear time history analysis and modal pushover analysis (MPA), and the results from both of these methods validated the use of GSPCW is an efficient structural wall system appropriate for use in super-high-rise buildings. Finally, a simple economic assessment of the GSPCW building was performed, and the results were compared with those obtained for conventional reinforced concrete wall buildings.

1. Introduction

Steel plate concrete shear wall is a composite structural wall system that is formed by placing steel plates on one or both sides of a concrete slab or inside a concrete core. The steel and concrete are typically combined using shear nails or bolt tie rods on steel plate. Depending on the layout of the steel plate, such composite shear wall systems can be classified into three main categories, i.e., single-sided, double-sided, and embedded steel plate concrete composite shear walls [1]. A large amount of research has been performed on various types of steel plate concrete composites. On the basis on previous research, steel plate concrete composite shear walls normally possess high load resistance, high stiffness, and excellent ductility and energy dissipation capacity [2,3,4,5].
Despite their excellent performance, traditional steel plate concrete composite shear walls may experience buckling failure of the steel plate, which affects the overall seismic behavior of the system. Furthermore, conventional steel plate concrete composite walls may also require some reinforcing bars when used in the design of wall sections. To improve the performance of existing plate concrete composite shear walls, Xu et al. [6] proposed an innovative grille-type steel plate concrete composite shear wall (GSPCW). As shown in Figure 1, GSPCW is consists primarily of steel faceplates, steel tie plates and infilled concrete, and steel channels are normally placed at the wall ends. The grille-type steel plates are arranged so as to improve the buckling capacity of the steel plate, while maintaining the advantages of conventional steel plate concrete composite shear wall systems.
To date, only limited research has been performed regarding GSPCW wall systems. This research was initiated by Guo et al. [7], and was focused on analyzing the effects of different design parameters on the seismic behavior of GSPCW with embedded corrugated steel plate on the basis of laboratory testing and numerical simulations. The results indicated that the out-of-plane deformation of steel plates on both sides of the shear wall were effectively constrained due to the concrete slab and the corrugated steel tie plates, thereby significantly improving the out-of-plane buckling resistance of the steel plates. Xu et al. [8] and Ye et al. [9] further improved the structure of GSPCW systems and replaced the embedded corrugated steel plates with single independent steel plates. Zhang et al. [10] recently conducted seismic performance tests on three GSPCW walls. The results of their study demonstrated that the improved GSPCW shear wall system exhibited good seismic performance.
This paper aims to further evaluate the effects of various design parameters on the seismic behavior of GSPCW walls, as well as its application in engineering practice. First, a two-dimensional numerical model for GSPCW walls is established using DIANA software based on the test specimens from Ye et al. [9]. A total of eighteen GSPCW wall models with varying design parameters are established to systematically to investigate the effects of different design parameters, including steel ratio, axial load ratio, height–width ratio, aspect ratio of the grille, and concrete compressive strength. The conclusions from the parametric analyses can act as a reference for engineering practice. Second, a super-high-rise building is selected as a case study with the use of GSPCW for the core walls of the structure. The seismic performance of the analytical structure is analyzed using both nonlinear time history analysis (NTHA) and modal pushover analysis (MPA), and the results obtained using these two distinct methods are compared to evaluate the potential capability for application of GSPCW walls in super-high-rise buildings. Finally, a simple economic assessment of the GSPCW building is performed in comparison with conventionally reinforced concrete wall buildings.

2. Numerical Modeling and Validation

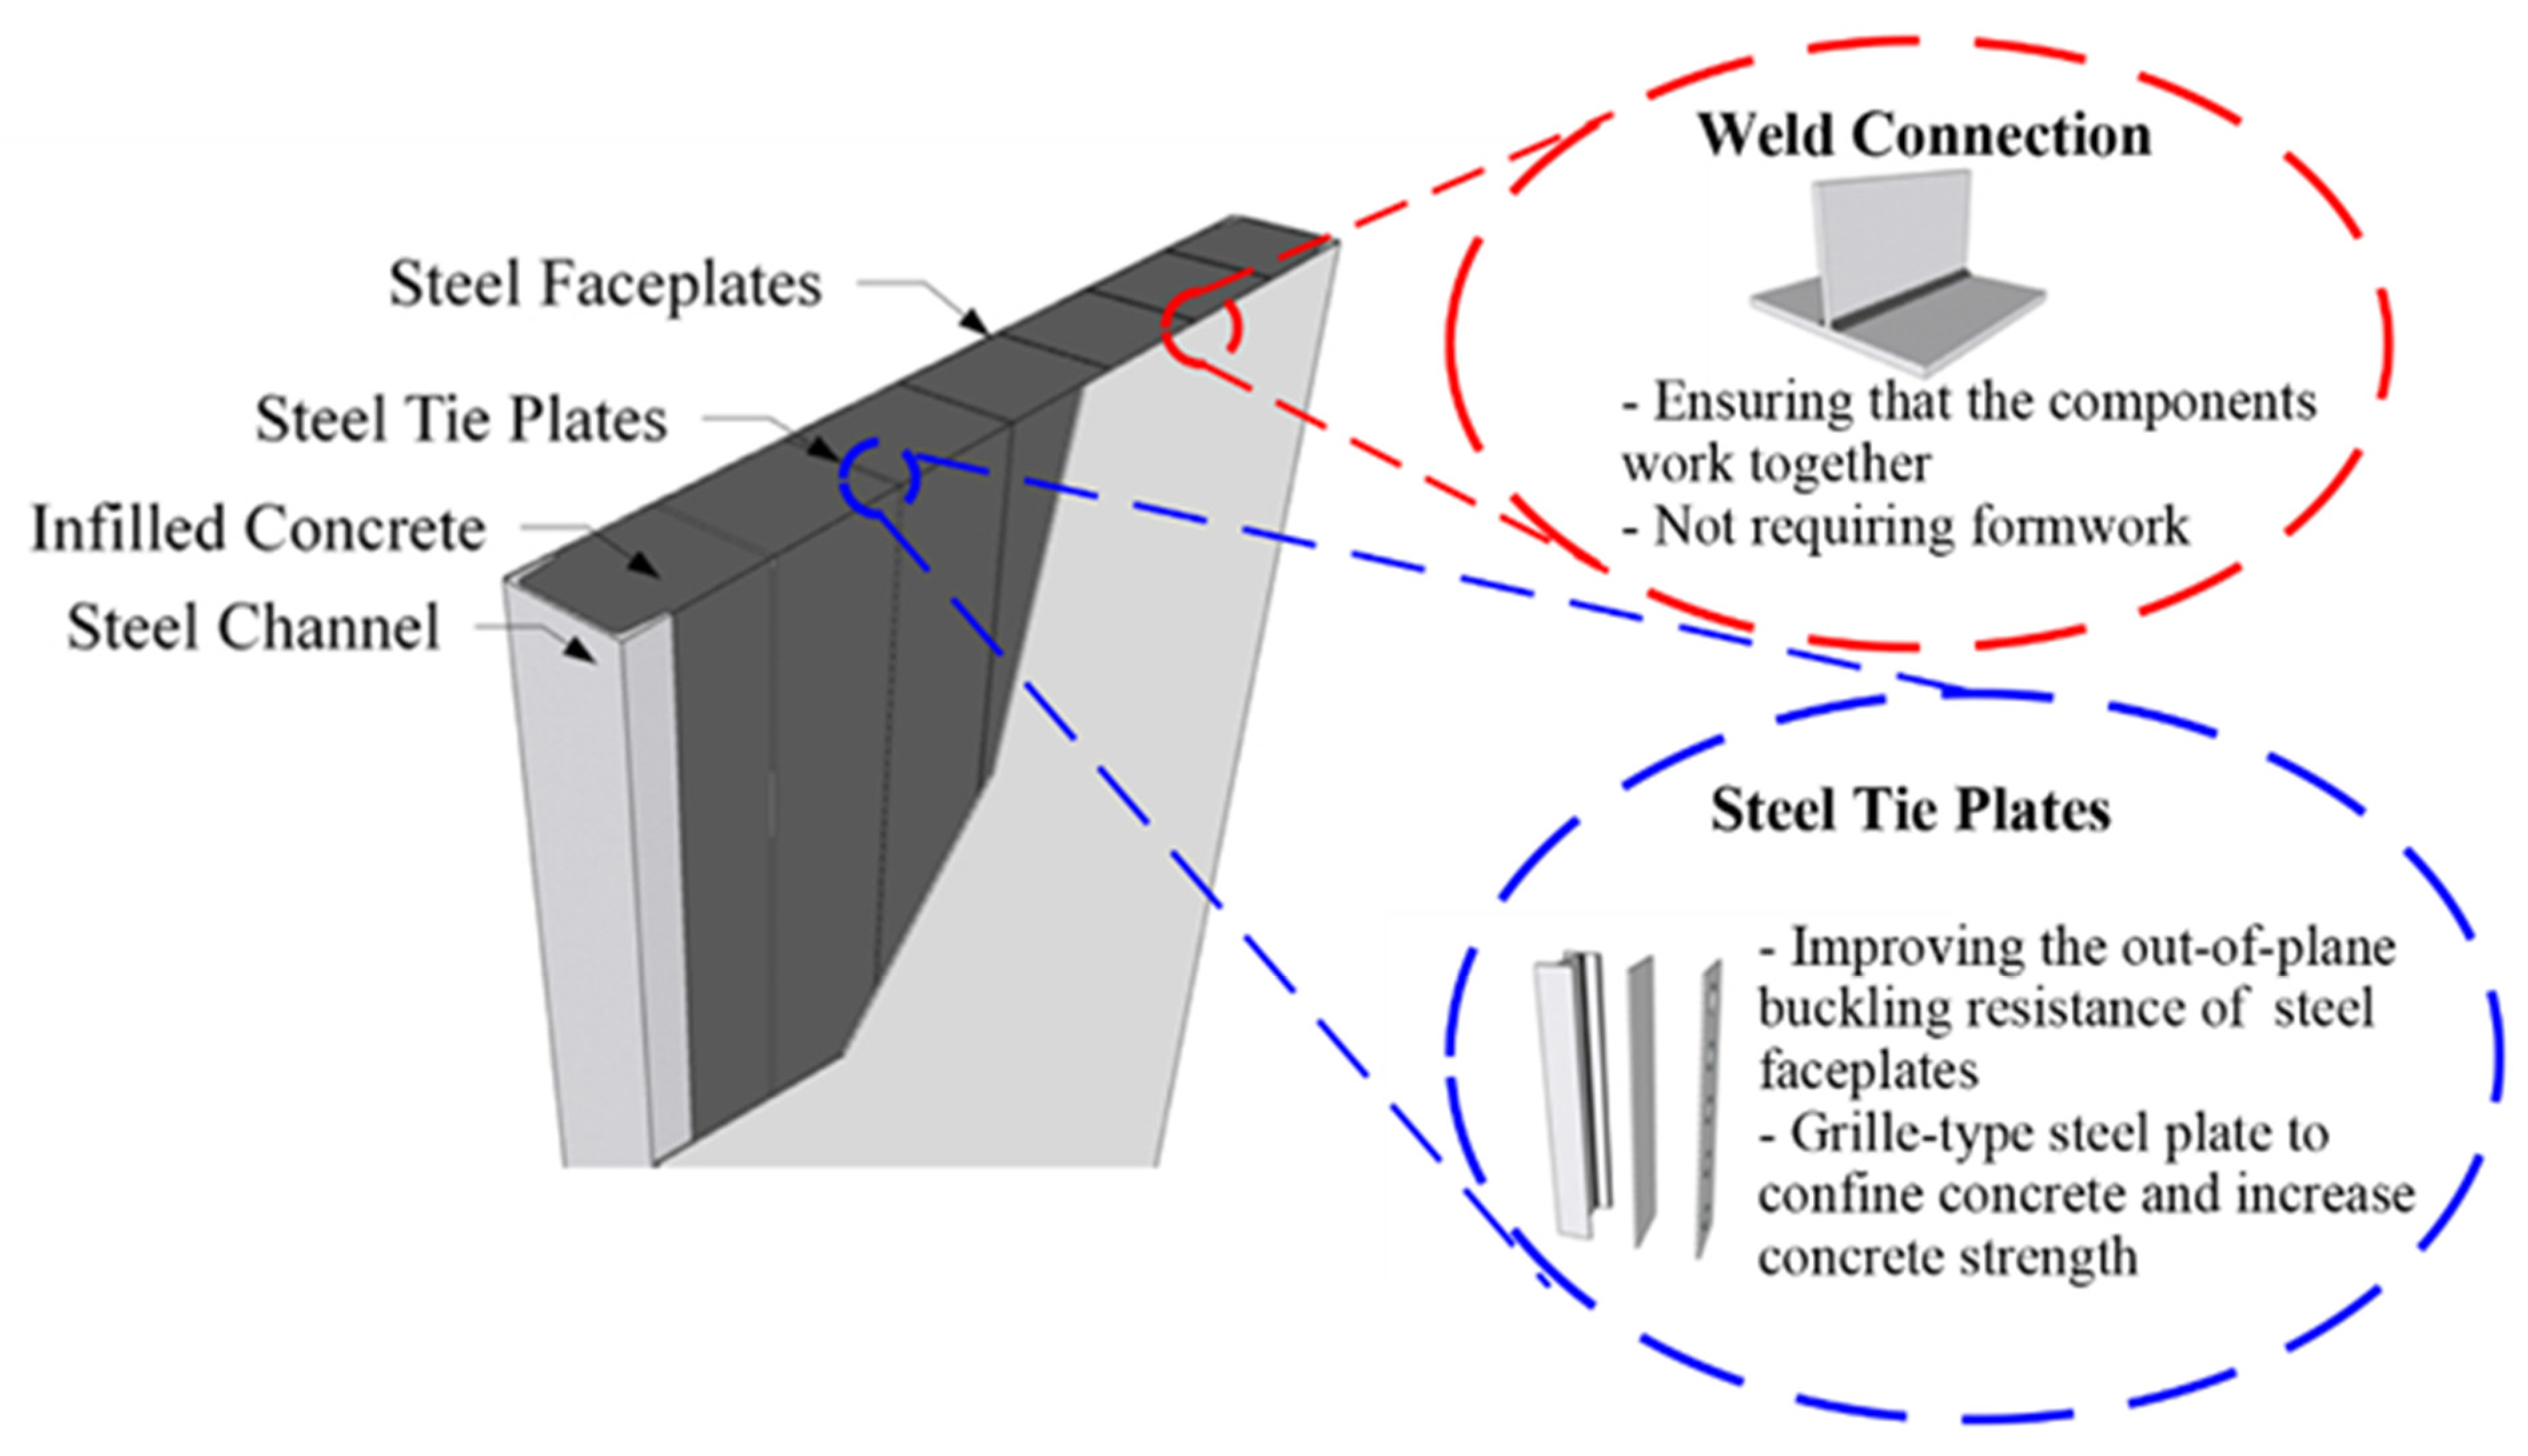
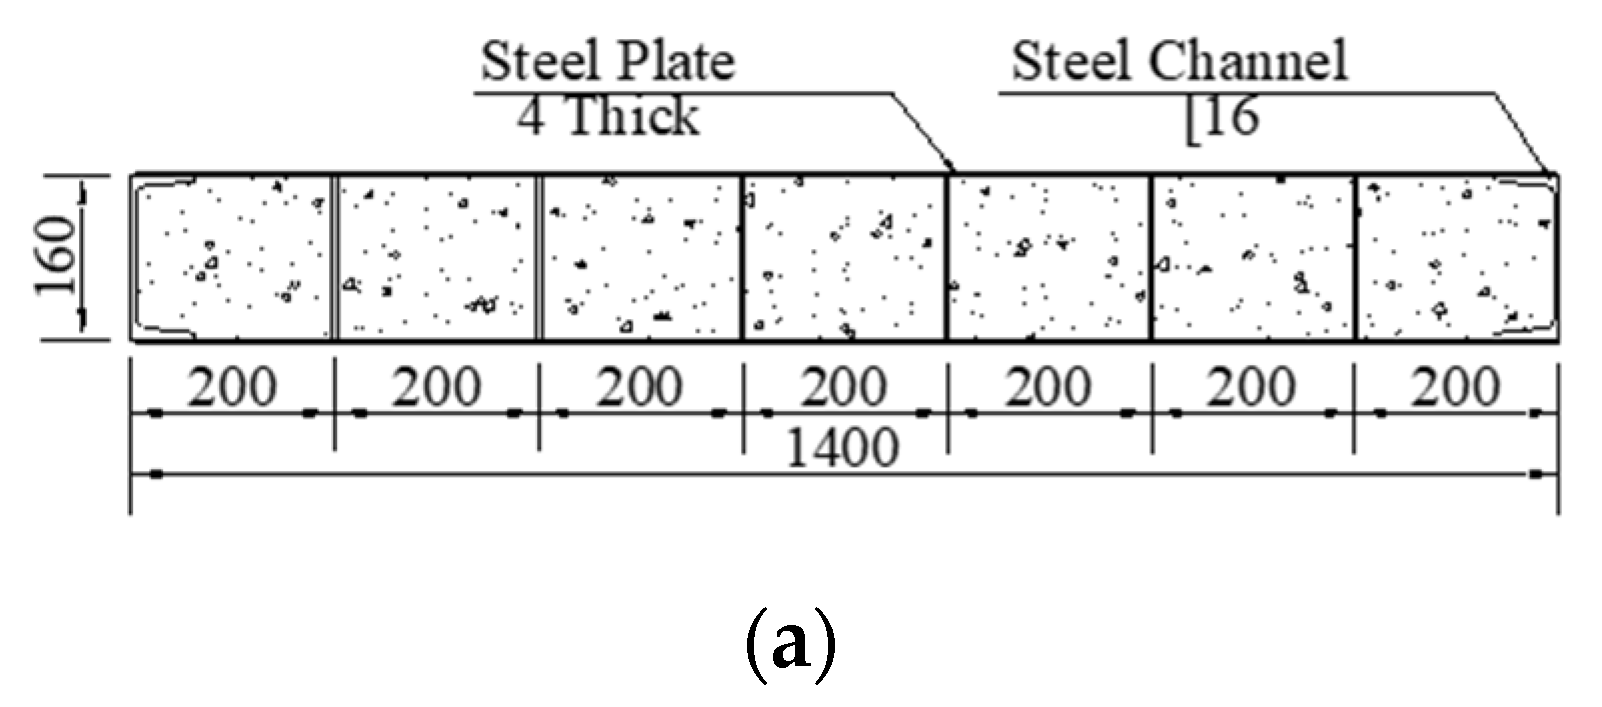
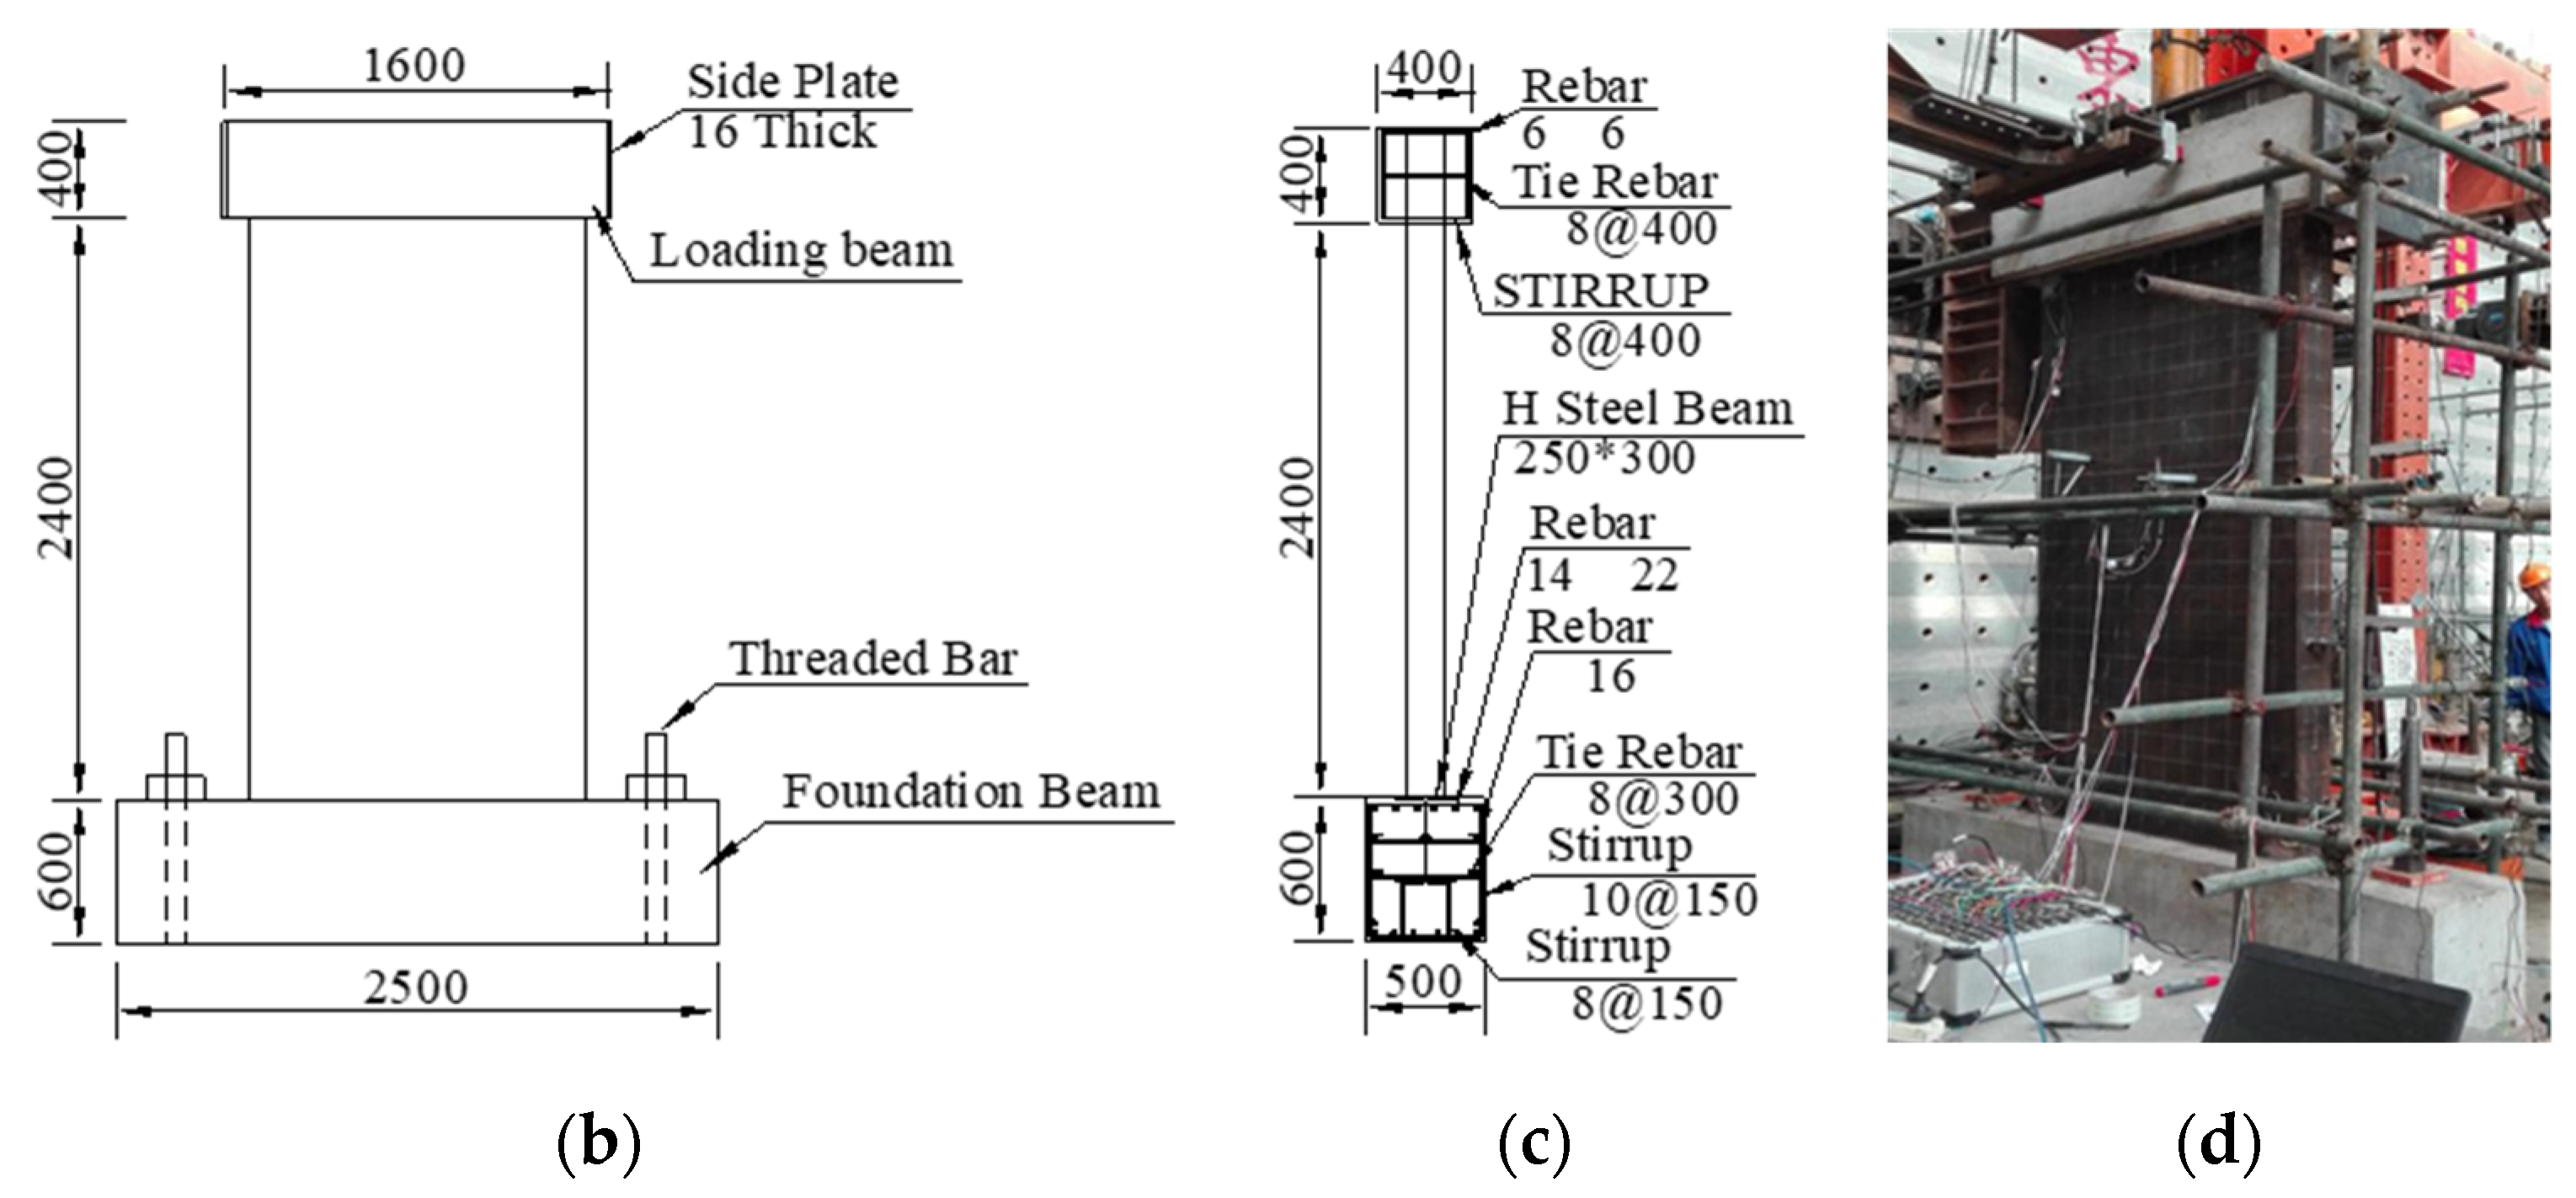
2.1. Literature Tests for GSPCW Walls

As mentioned earlier, very limited experimental research related to GSPCW wall system has been performed to date. Therefore, the two GSPCW wall specimens tested by Ye et al. [9] were selected in the study and used for numerical modeling verification. Figure 2 shows the schematic for and photo of the test walls, and the design details of the specimens are listed in Table 1. As shown, the two selected wall specimens have almost the same design parameters, except for the axial load ratio, which is the main variable of concern in the tests. The concrete grade is C40, and the steel grade is Q235B, based on the Chinese design code. Since the loading beam and the foundation beam are made of reinforced concrete, the steel beam of the H section is embedded in order to improve the stiffness of the foundation beam. More details relating to the two wall specimens can be found in Ye. [9].
The test setup of the wall specimens consisted of a bottom fixing device, out-of-plane supports, and vertical and lateral loading devices. The lateral loading protocol adopted both force control and displacement control loading protocols. The vertical load was applied using a hydraulic jack, and a steel beam was placed on the top of the loading beam in order to distribute the vertical loads in an averaged fashion. Before the application of formal lateral loading, lateral preloading was carried out to make sure that all the loading equipment, connectors, data acquisition system were in good condition. After that, a single-stage lateral load using load control protocol was applied until the specimen yielded. Once the specimen had yielded, displacement control multi-stage loading were applied until the lateral capacity of the specimen reached its peak, and then decreased to 85% of the load capacity, indicating failure.

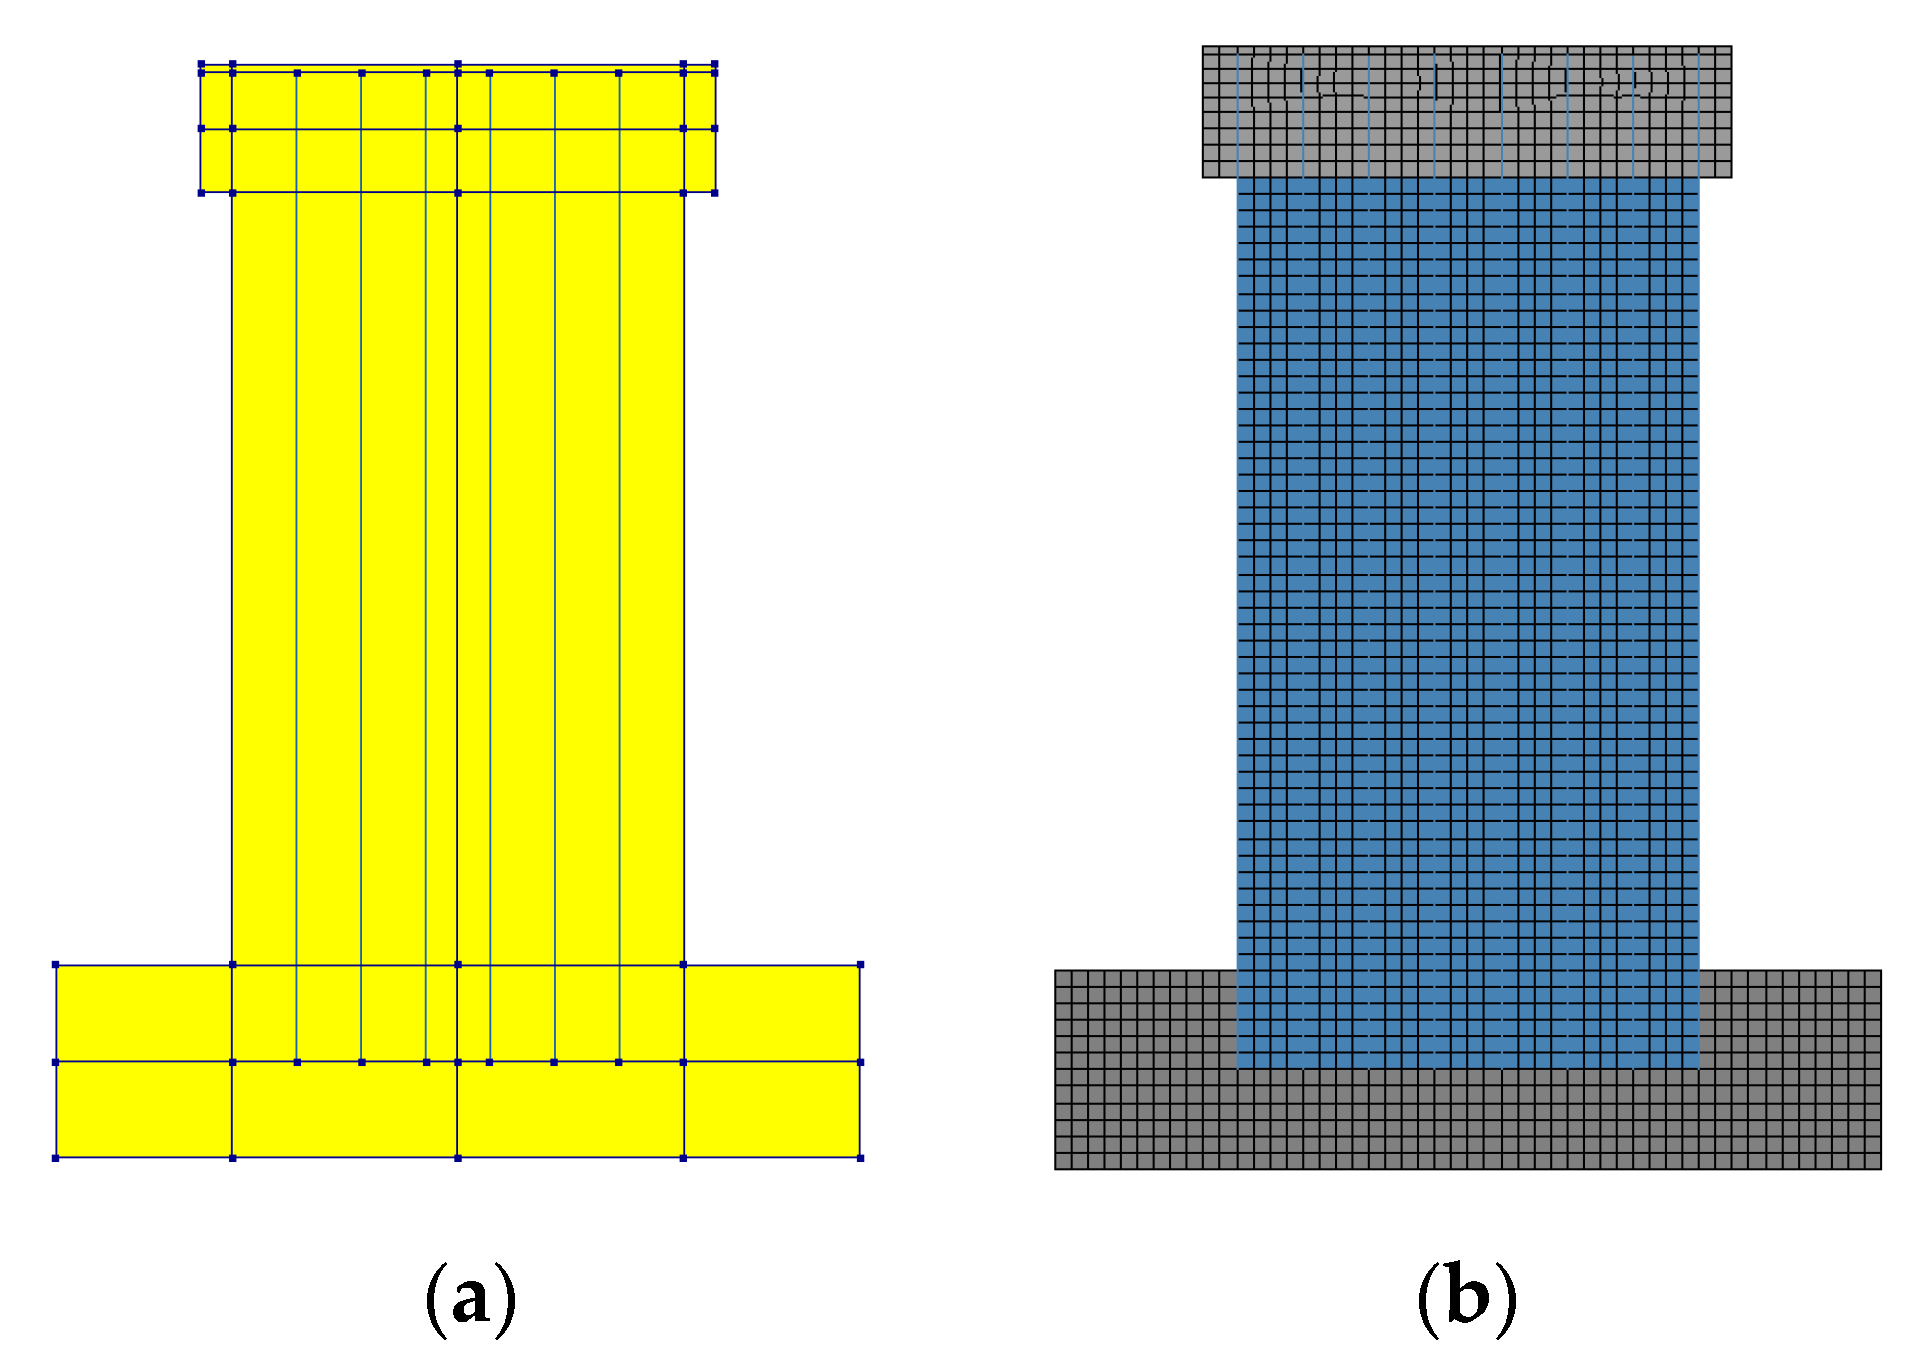
2.2. Numerical Models

2.2.1. Modeling Assumptions

Since the test walls were in-plane loaded and constrained in the out-of-plane direction during testing, a two-dimensional simulation scheme was deemed to be sufficient, and was subsequently adopted for the modeling in this study. Figure 3 shows the schematic of the GSPCW wall models developed in DIANA software [11]. As shown, an eight-node quadrilateral isoparametric plane stress element was used to model the infill concrete, steel faceplates, loading beam and foundation beam. A bar reinforcement element was used for the steel tie plates. No consideration for the interface between concrete and steel plates was modeled, since no data on this have been reported for test wall specimens. The mesh size for all of the elements was 50 mm, and the translation of the bottom of the foundation beam was constrained. The FE models were loaded in two steps following the same protocol as in the tests: the vertical loading was applied first to the top of the loading beam at uniform pressure, and then cyclic lateral displacement-controlled loading was applied to the centroid of the loading beam. The modified Newton–Raphson method was used for the incremental iterative solution. The convergence criteria combine both force norm and displacement norm. In addition, geometrical nonlinearity was considered in the analysis.

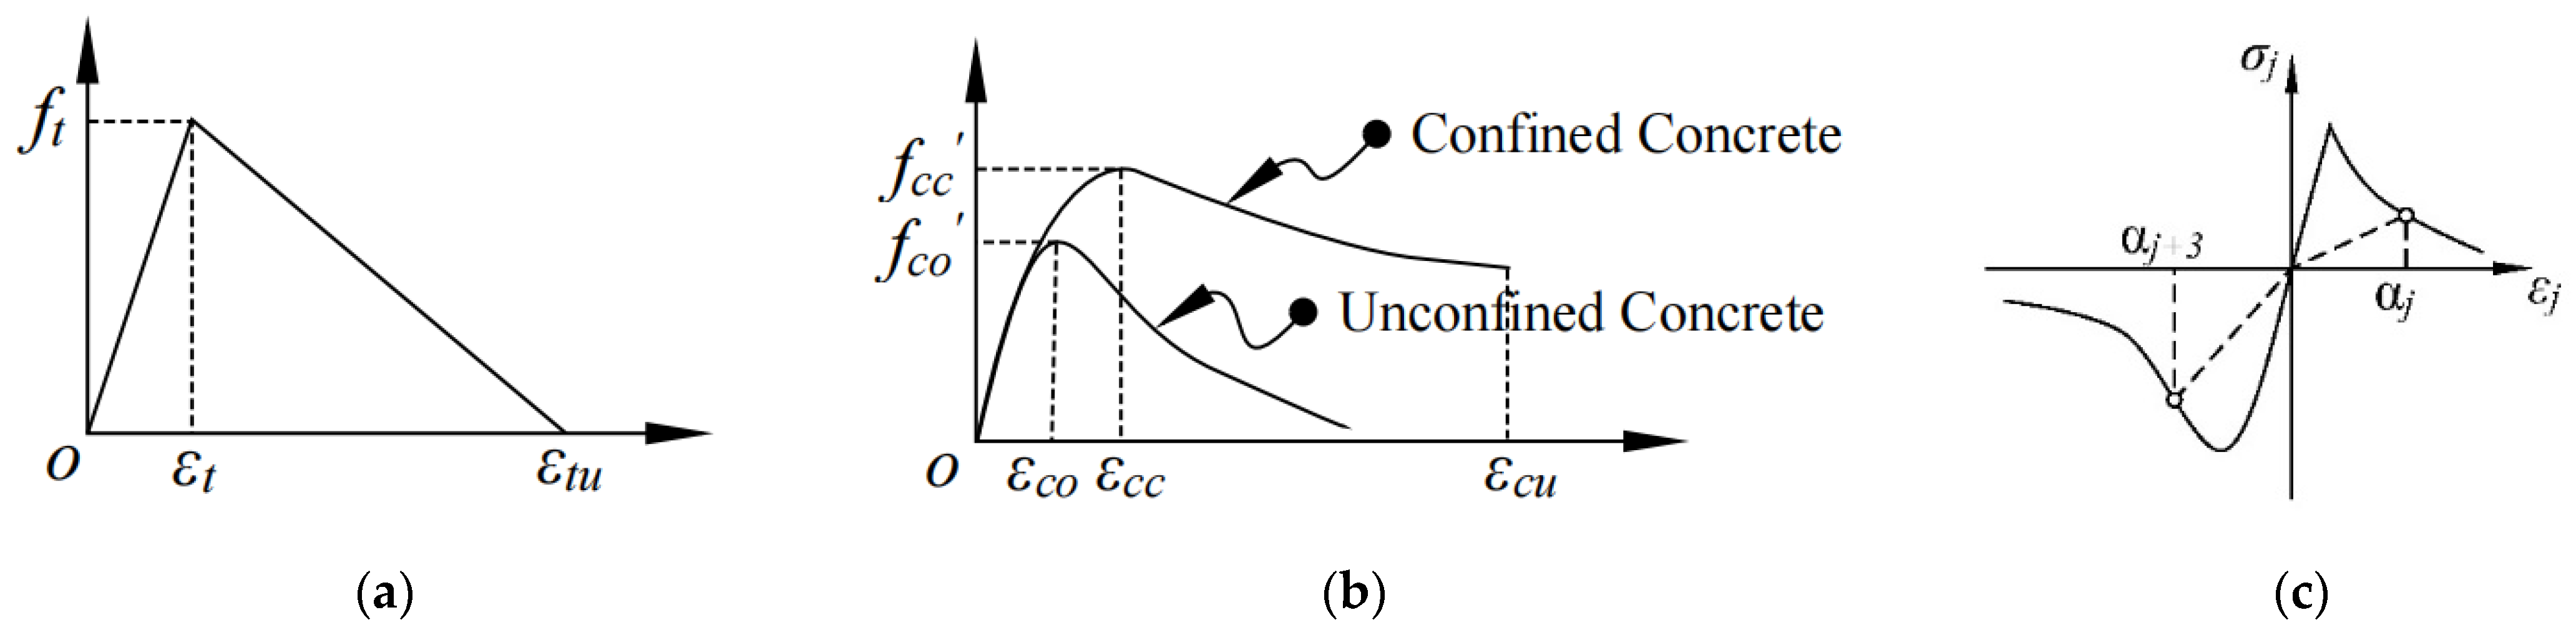
2.2.2. Material Models

The material model for the infilled concrete in GSPCW walls was selected as the total strain crack model in DIANA. The input parameters for this concrete model include the elastic concrete properties, cracking direction, and uniaxial behavior of concrete under compression and tension. The secant unloading method was used for total strain crack model and the internal damage variables α k were used to monitor the strain of the concrete due to cracking and crushing, which is related to the constitutive model of concrete, see Figure 4. The cracking direction was selected as the rotating direction, and the shear stiffness remained constant. Figure 4 also shows the stress–strain constitutive relationship for the uniaxial behavior of concrete. In this study, the model proposed by Mander et al. [12] was adopted as the constitutive model of concrete under compression, and is applicable to concrete constrained by both circular- and rectangular-shaped reinforcement. The constraint effects of the steel plates on concrete can be regarded as a constraint effect with many transverse reinforcements on concrete, as in the following formula:
f c = f c c x r r 1 + x r
x = ε c ε c c
ε c c = ε c o [ 1 + 5 ( f c c f c o 1 ) ]
r = E C E C E sec
E sec = f c c ε c c
where f c c is the compressive strength of confined concrete, ε c is the longitudinal compressive concrete strain, f c o is the unconfined concrete strength and ε c o is the corresponding strain, which can be assumed to be 0.002. E c is the elastic modulus of concrete, which can be calculated using E c = 5000 f c o . The compressive strength of confined concrete f c c can be determined by the confinement effectiveness of steel plates and calculated as described by Cai et al. [13]. The constitutive model of concrete under tension was calculated according to CEB-FIP Model 1990 [14], and the formula is given by:
f t = { 0.26 f c u 2 / 3 ( f c u 50 MPa ) 0.21 f c u 2 / 3 ( f c u > 50 MPa )
The constitutive model for steel in the study adopts a simple bilinear elastic hardening material model. The elastic modulus, yielding strength, and ultimate strength were all based on material properties determined by tests in Ref. [9]. The Von Mises yielding criterion was selected to describe the yielding status of steel.

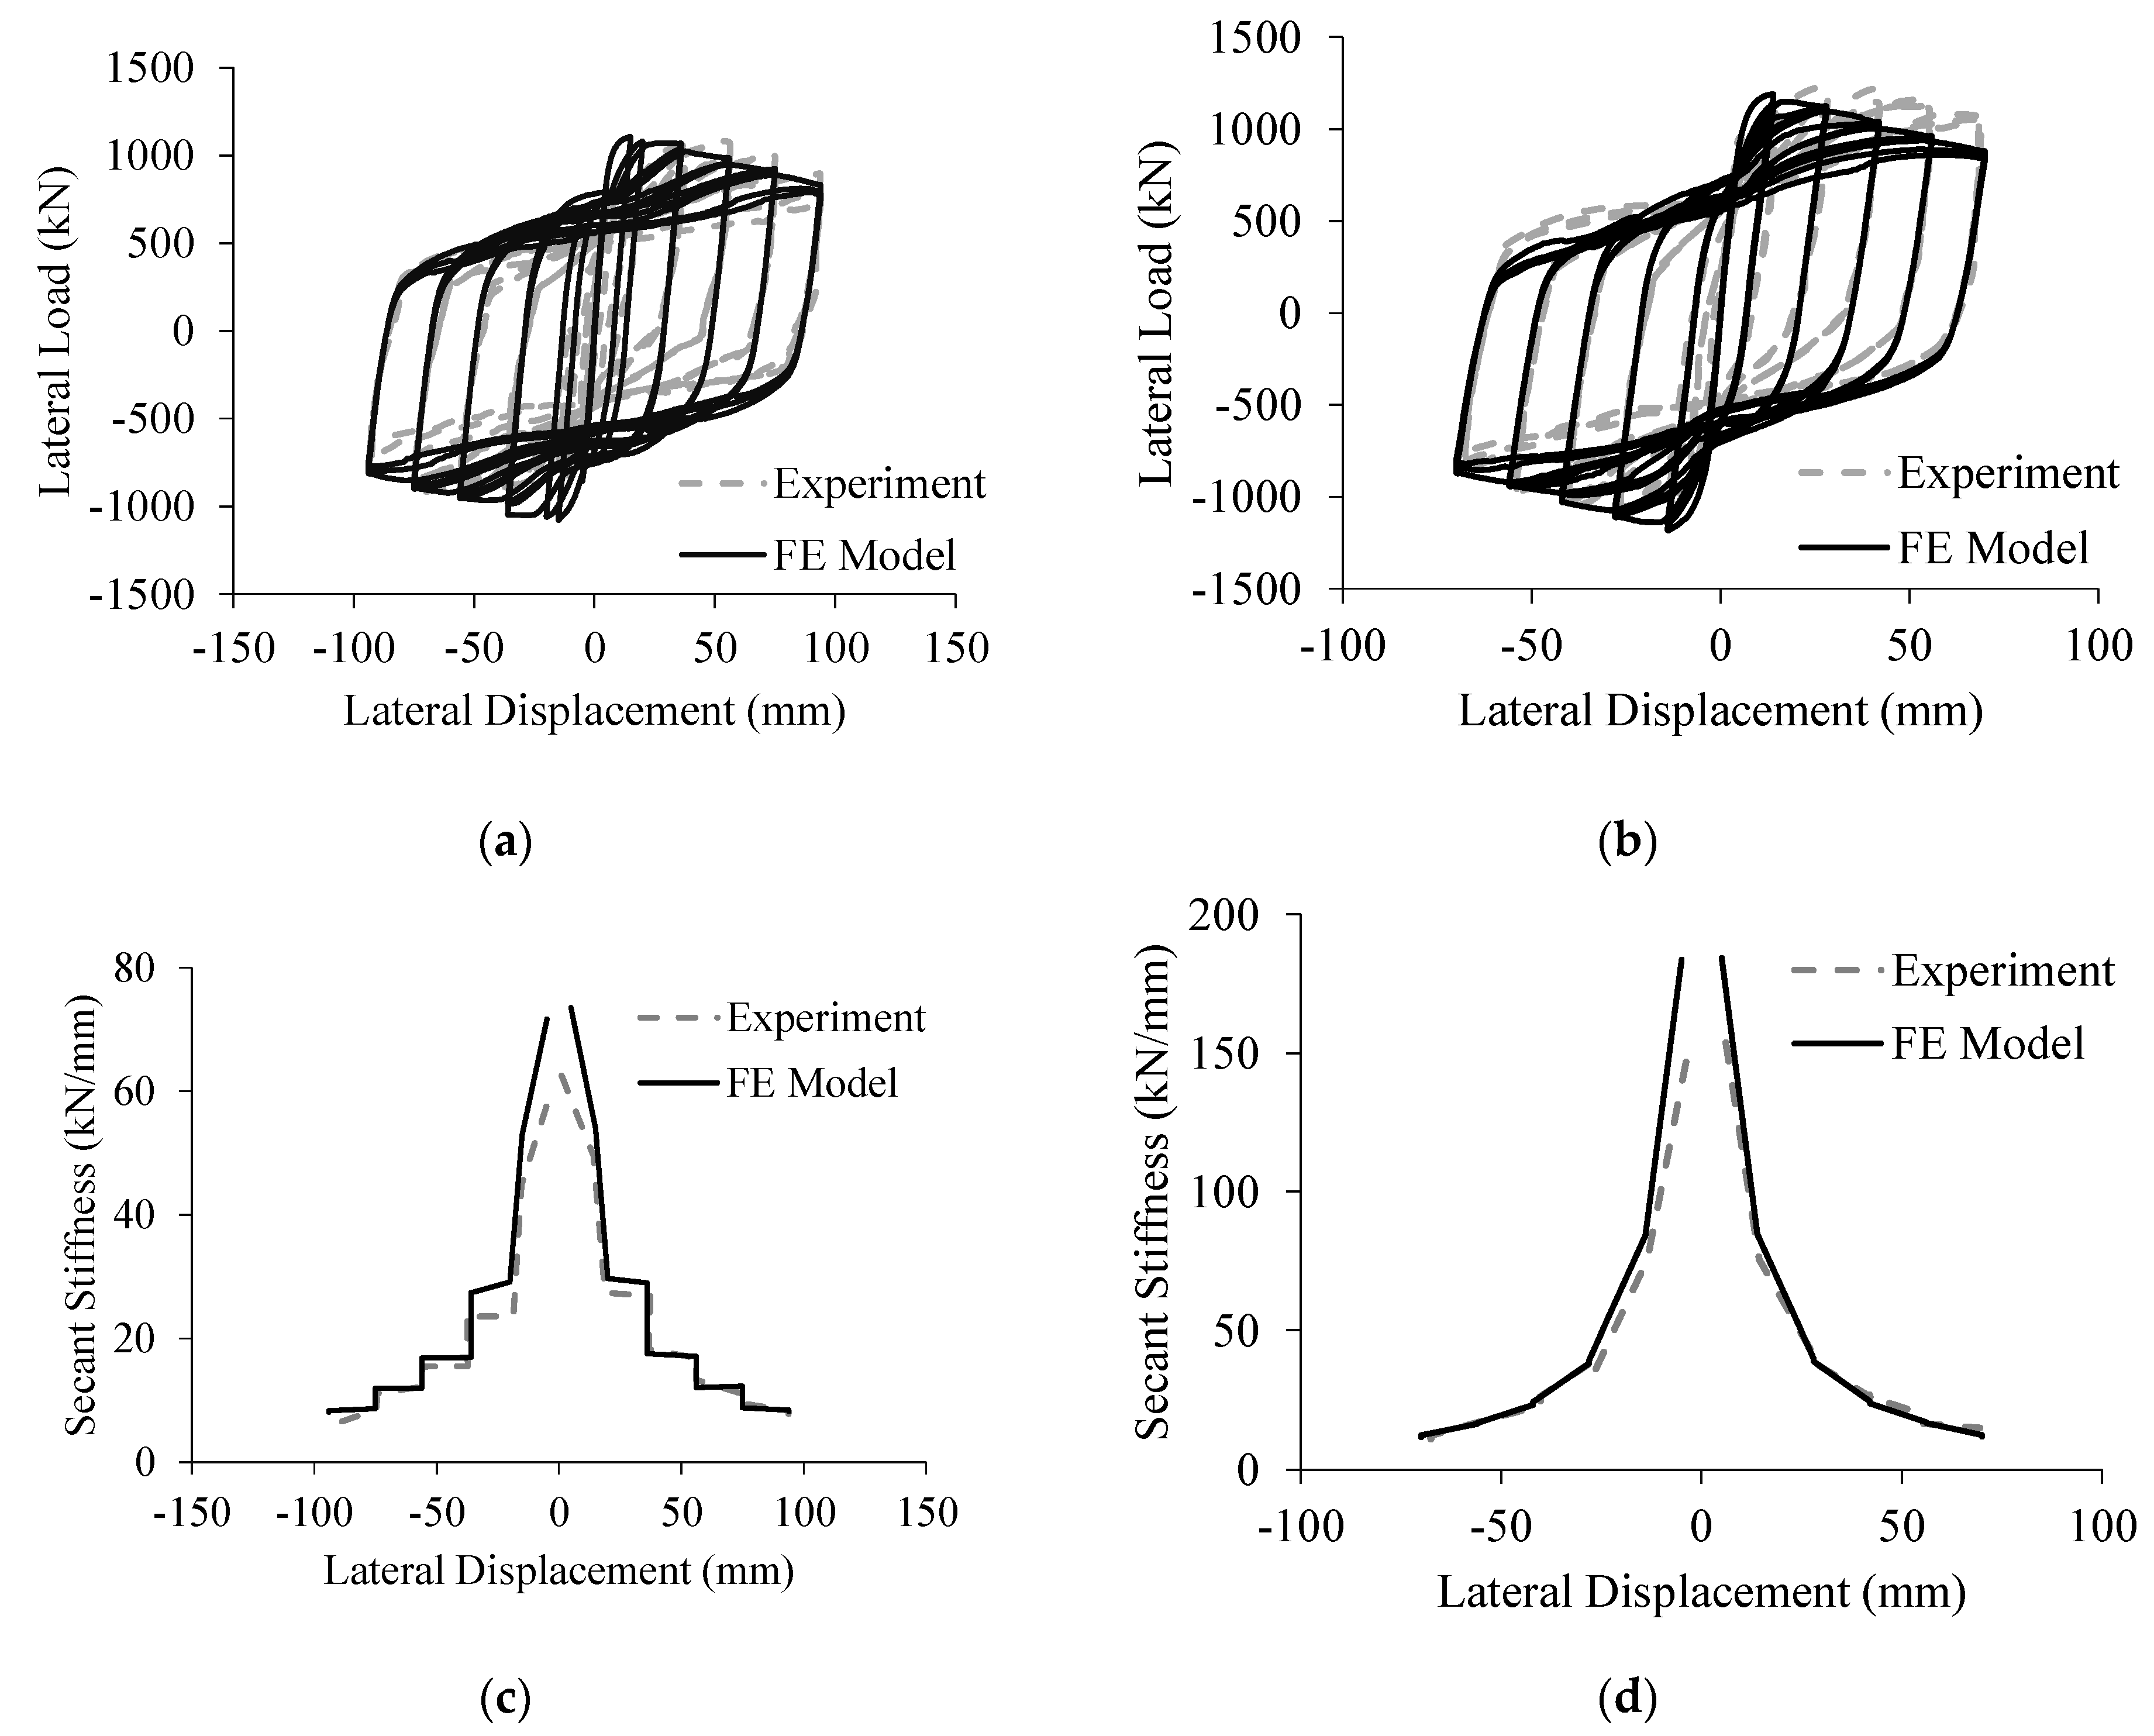
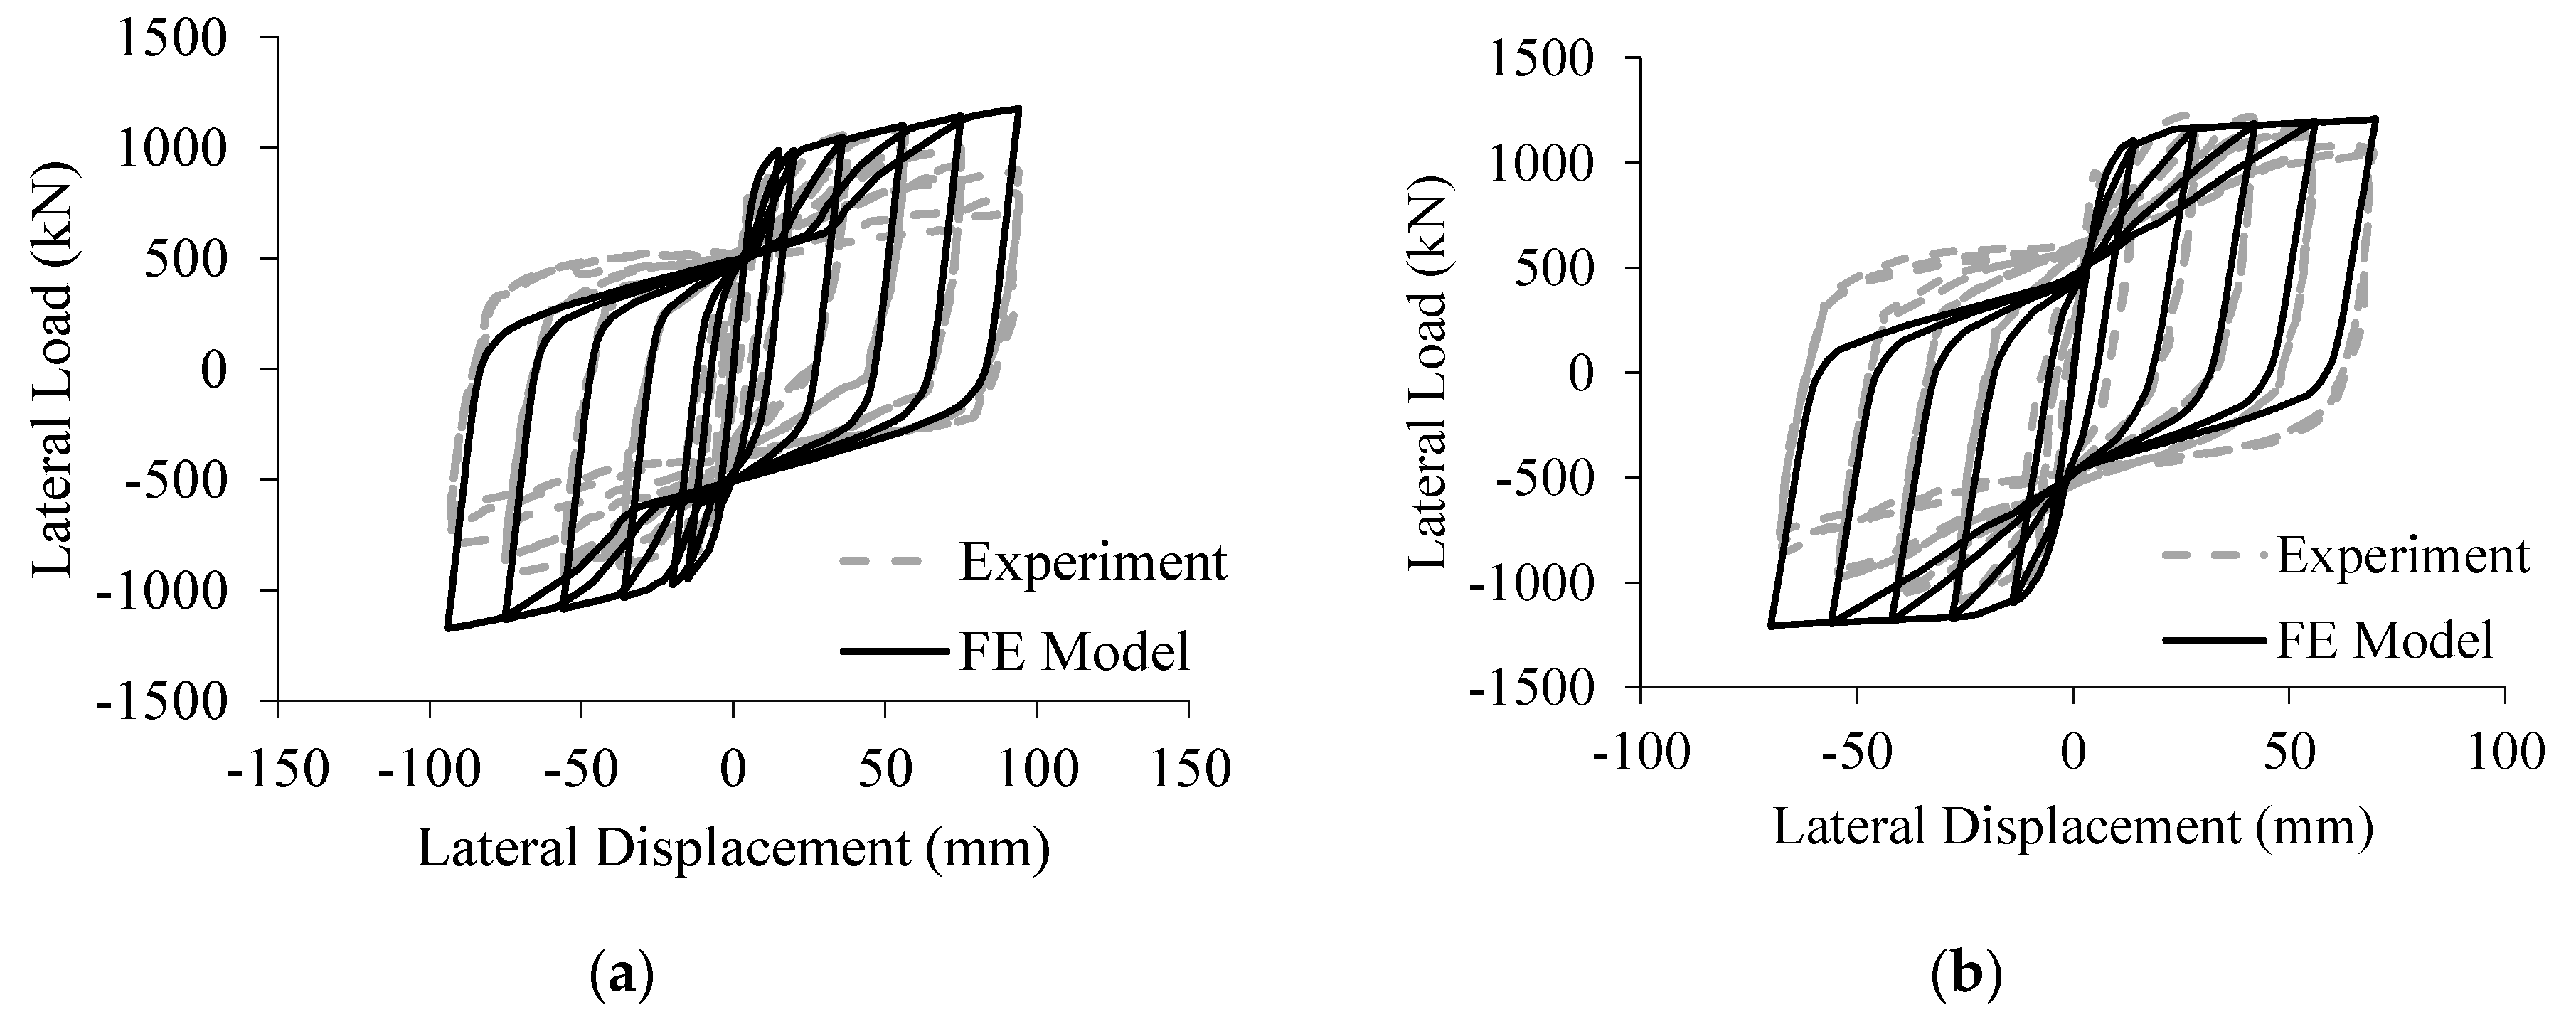
2.3. Validation of Numerical Modeling

Figure 5 compares the results from numerical models with experimental results for the test walls described in Section 2.1 in terms of load–displacement hysteresis curves and secant stiffness degradation curves. It can be seen from the figure that the hysteresis curves obtained from the numerical simulation are in good agreement with the test results for both of the selected wall specimens. The magnitude of the peak load, the initial stiffness, and the hysteresis energy dissipation are all reasonably matched with the test results. Secant stiffness degradation can be calculated on the basis of the hysteresis curves, and it also shows good agreement between the simulation and the experimental results. Please note that Table 2 lists all of the values of force and displacement corresponding to the characteristic points for both the simulation and the experimental results in the skeleton curves (in both positive and negative directions). These characteristic points include yielding point, peak capacity point and ultimate capacity point.

3. Parametric Modeling of GSPCW Walls
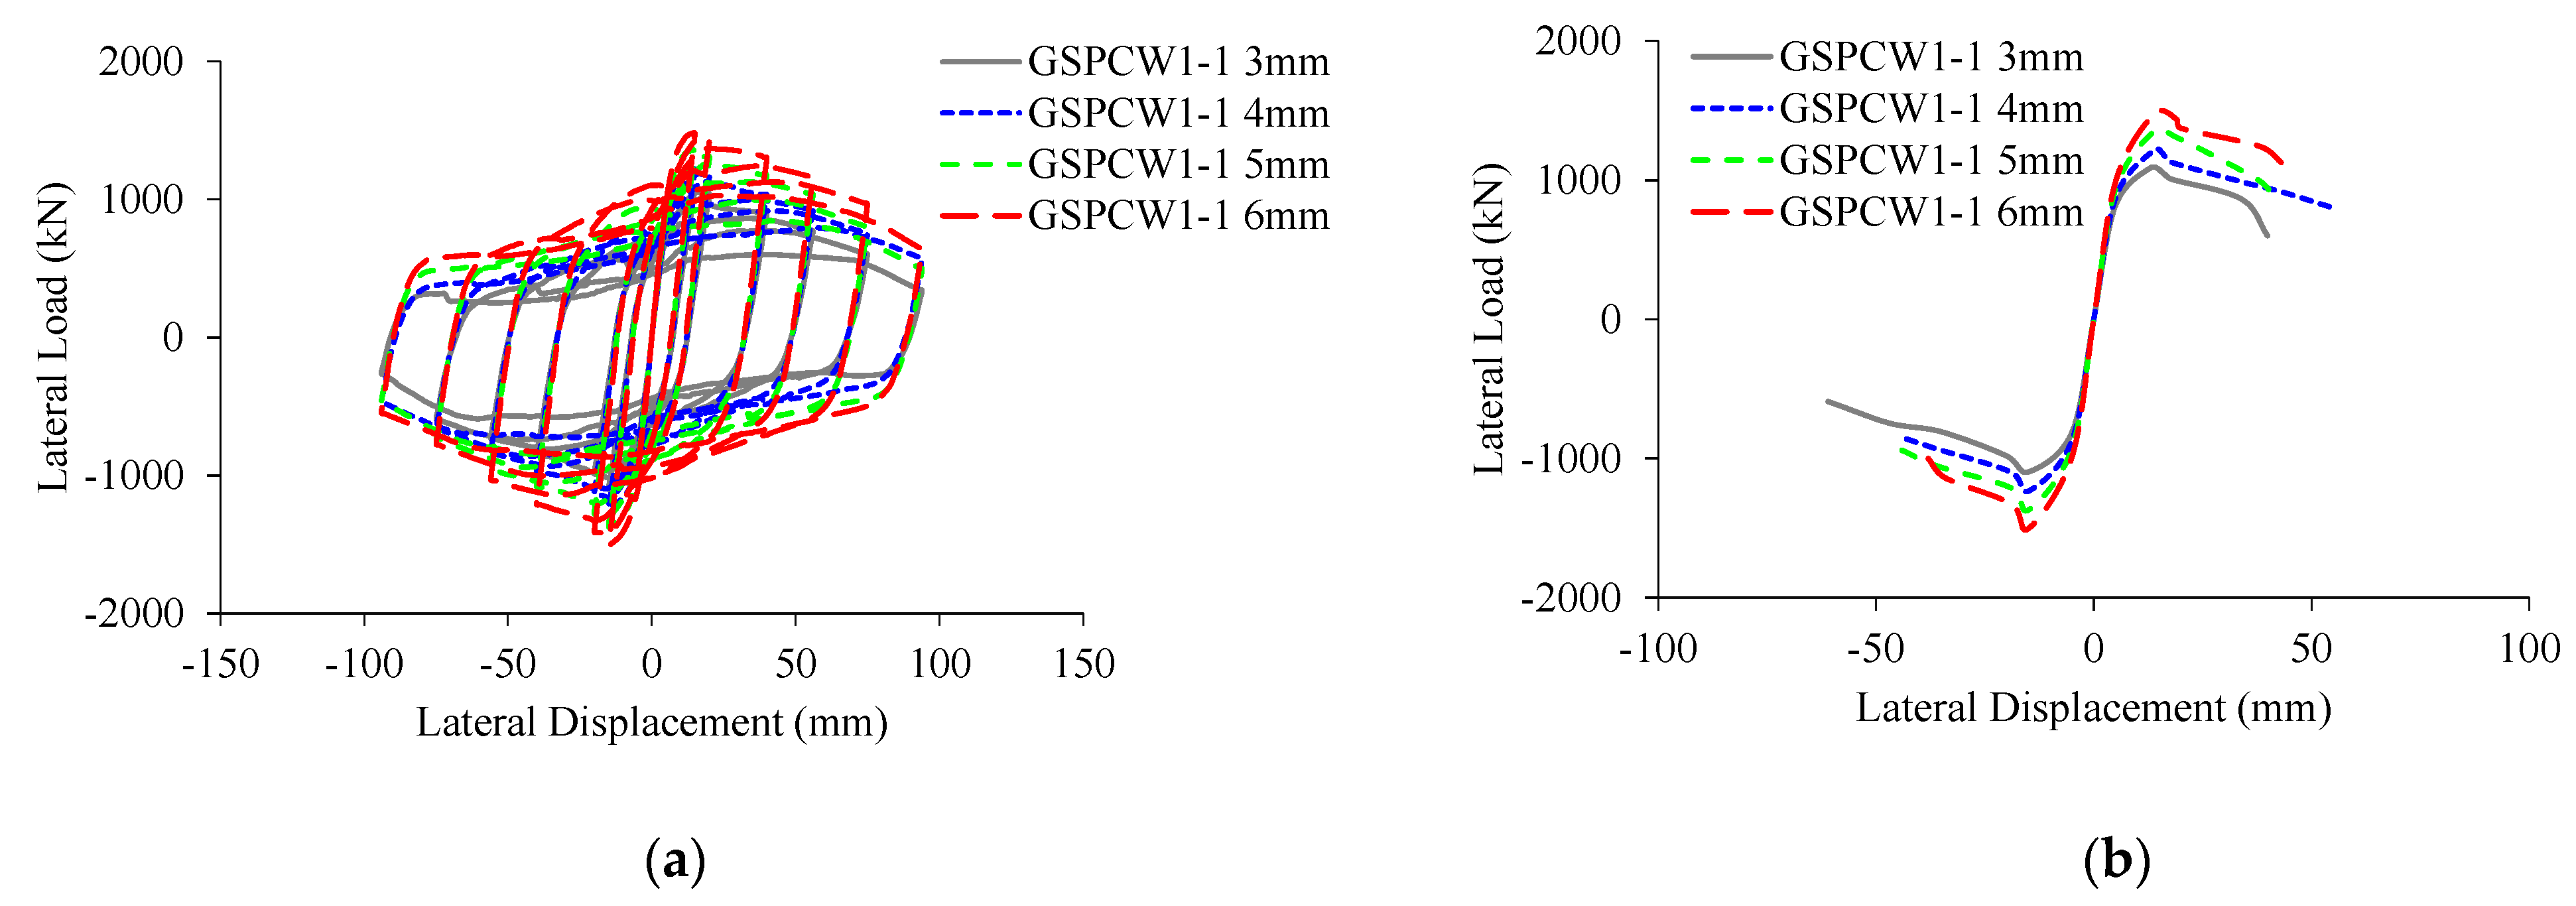
To extend our understanding of GSPCW wall systems beyond the limited test data, parametric modeling of GSPCW walls based on test walls was performed. In this study, a total of 18 wall models with varying design parameters were simulated. Table 3 lists all of the variations of the parametric wall models. These parameters include: (1) Steel ratio, defined as the ratio of the total steel area to the gross wall section area. Note that the variations in steel ratio are achieved by varying the thickness of the steel faceplates and the steel tie plates; (2) Axial load ratio, defined as the ratio of total vertical load to the product of concrete compressive strength and the wall gross section area; (3) Height-to-width ratio, defined as the ratio of the wall height to the wall section width; (4) Aspect ratio of the grille-type steel, defined as the ratio of the spacing of the steel tie plates to the thickness of the wall section; and (5) Concrete compressive strength. In the process of parametric analysis, the values for material strength were taken from the Chinese Code for Design of Concrete Structures (GB50010-2010) [15] and Code for Design of Steel Structures (GB50017-2017) [16].

3.1. Steel Ratio

As demonstrated in Table 3, changes in steel ratio can be accomplished by varying the thickness of the steel plate, i.e., thicker steel plate leads to a higher steel ratio. Figure 6 shows the hysteresis and skeleton curves for the parametric wall models with different steel ratios. It can be observed from the figure that with increasing steel ratio, there is an increase in loading capacity and post-yielding stiffness of the model walls. Because the axial load ratio of the models is relatively low (i.e., 0.3), the stiffness of the specimen is basically determined by the elastic stiffness of the cross-section, will the infill concrete accounting for a large part of this contribution to stiffness. Therefore, the increase in post-yield stiffness is relatively smaller than the increase in load capacity.
ρ s = A s A
where ρ s is the steel ratio, A s is the horizontal cross-section area of the steel, and A is the entire horizontal cross-section.

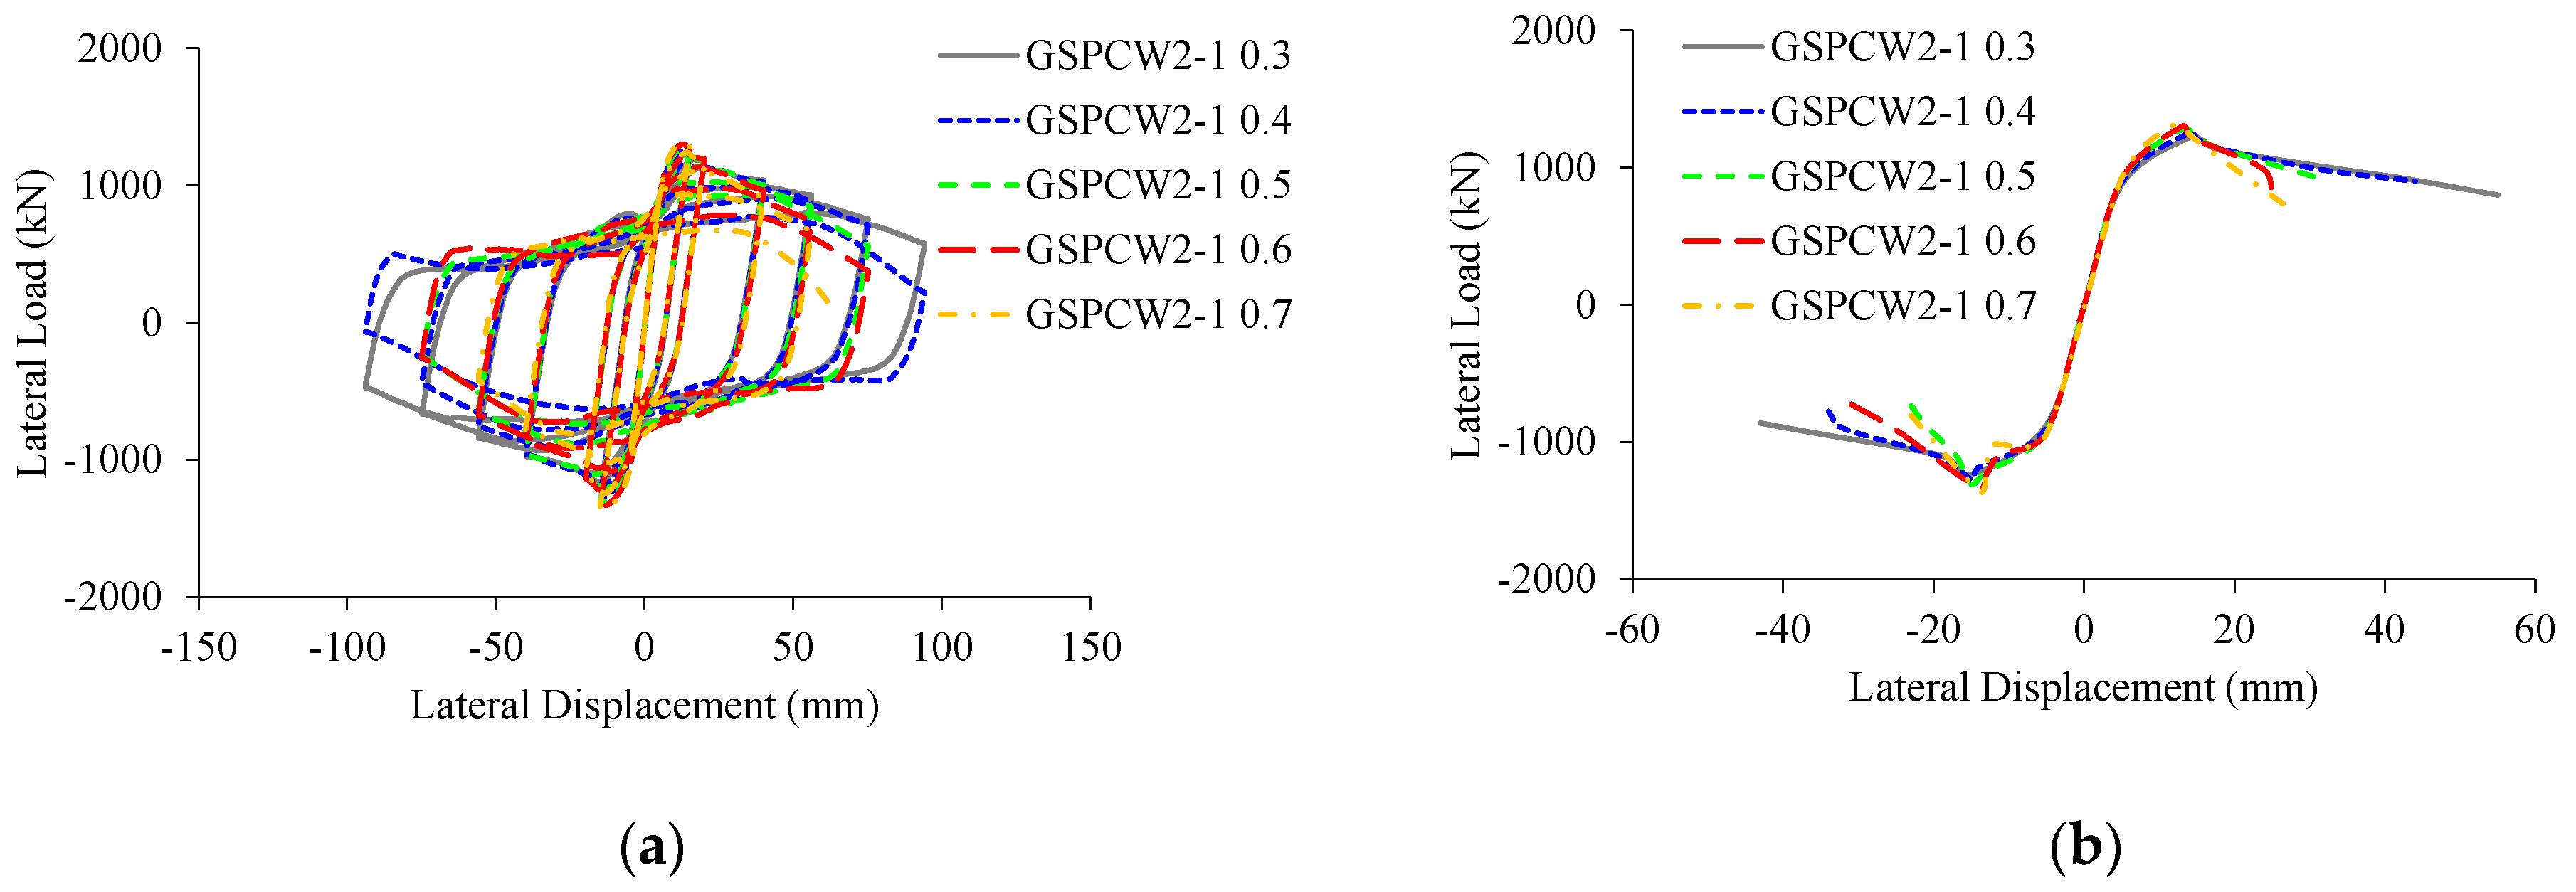
3.2. Axial Load Ratio

The axial load ratio is was varied between 0.3 and 0.7. Figure 7 shows the hysteresis and skeleton curves for the parametric wall models with different axial load ratios. It can be seen from the figure that the lateral load capacity calculated by numerical modeling varies little, but the ductility for the GSPCW walls exhibits some changes influenced by variations in the axial load ratio, i.e., as the axial load ratio increases, the ductility decreases. As can be seen from the figure, when the axial load ratio is greater than 0.5, the ductility appears to evidently decrease as compared with axial load ratios below 0.5. Consequently, it is recommended in this study that the axial load ratio of GSPCW walls be controlled to below 0.5 in practice in order to ensure good ductility performance.
n = N f c A
where, n is axial load ratio, N is the vertical compressive force, f c is the compressive strength of concrete, A is the entire horizontal cross-section.

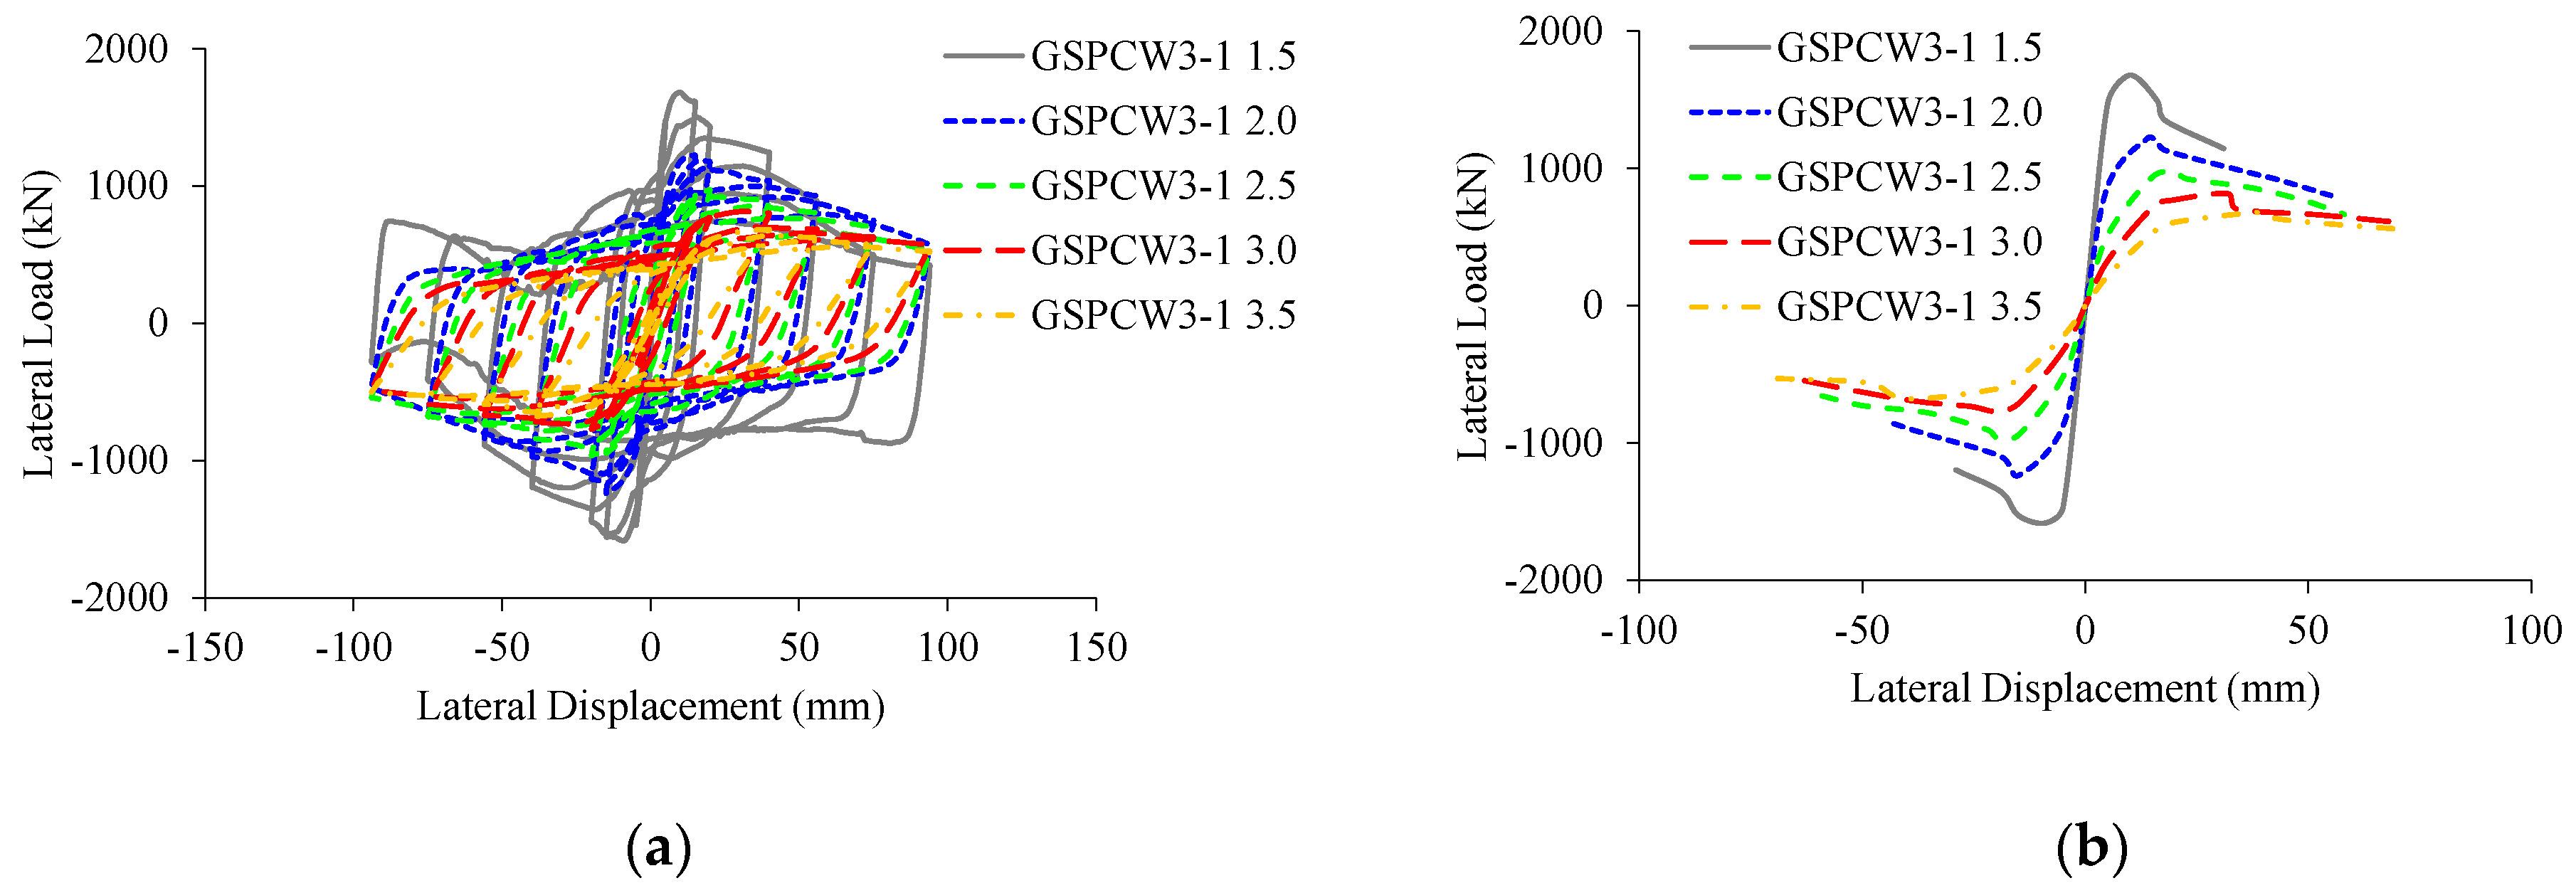
3.3. Height-to-Width Ratio

The height-to-width ratio is one of the main factors that determines the failure type of shear walls and affects their seismic performance. The height-to-width ratios of the model studied in this paper were selected in the range from 1.5 to 3.5, as listed in Table 3, thus being representative of common height-to-width ratio values in engineering practice for shear walls. Figure 8 shows the hysteresis and skeleton curves for the parametric wall models with different height-to-width ratios. It can be seen from the figure that the height-to-width ratio has a distinct effect on the load capacity and stiffness of the wall models. As the height-to-width ratio increases from 1.5 to 3.5, the load capacity decreases by 59%, and its lateral stiffness decreases by 88%. This is because as the height-to-width ratio increases, the failure mode of the specimen transfers from shear failure to bending failure.

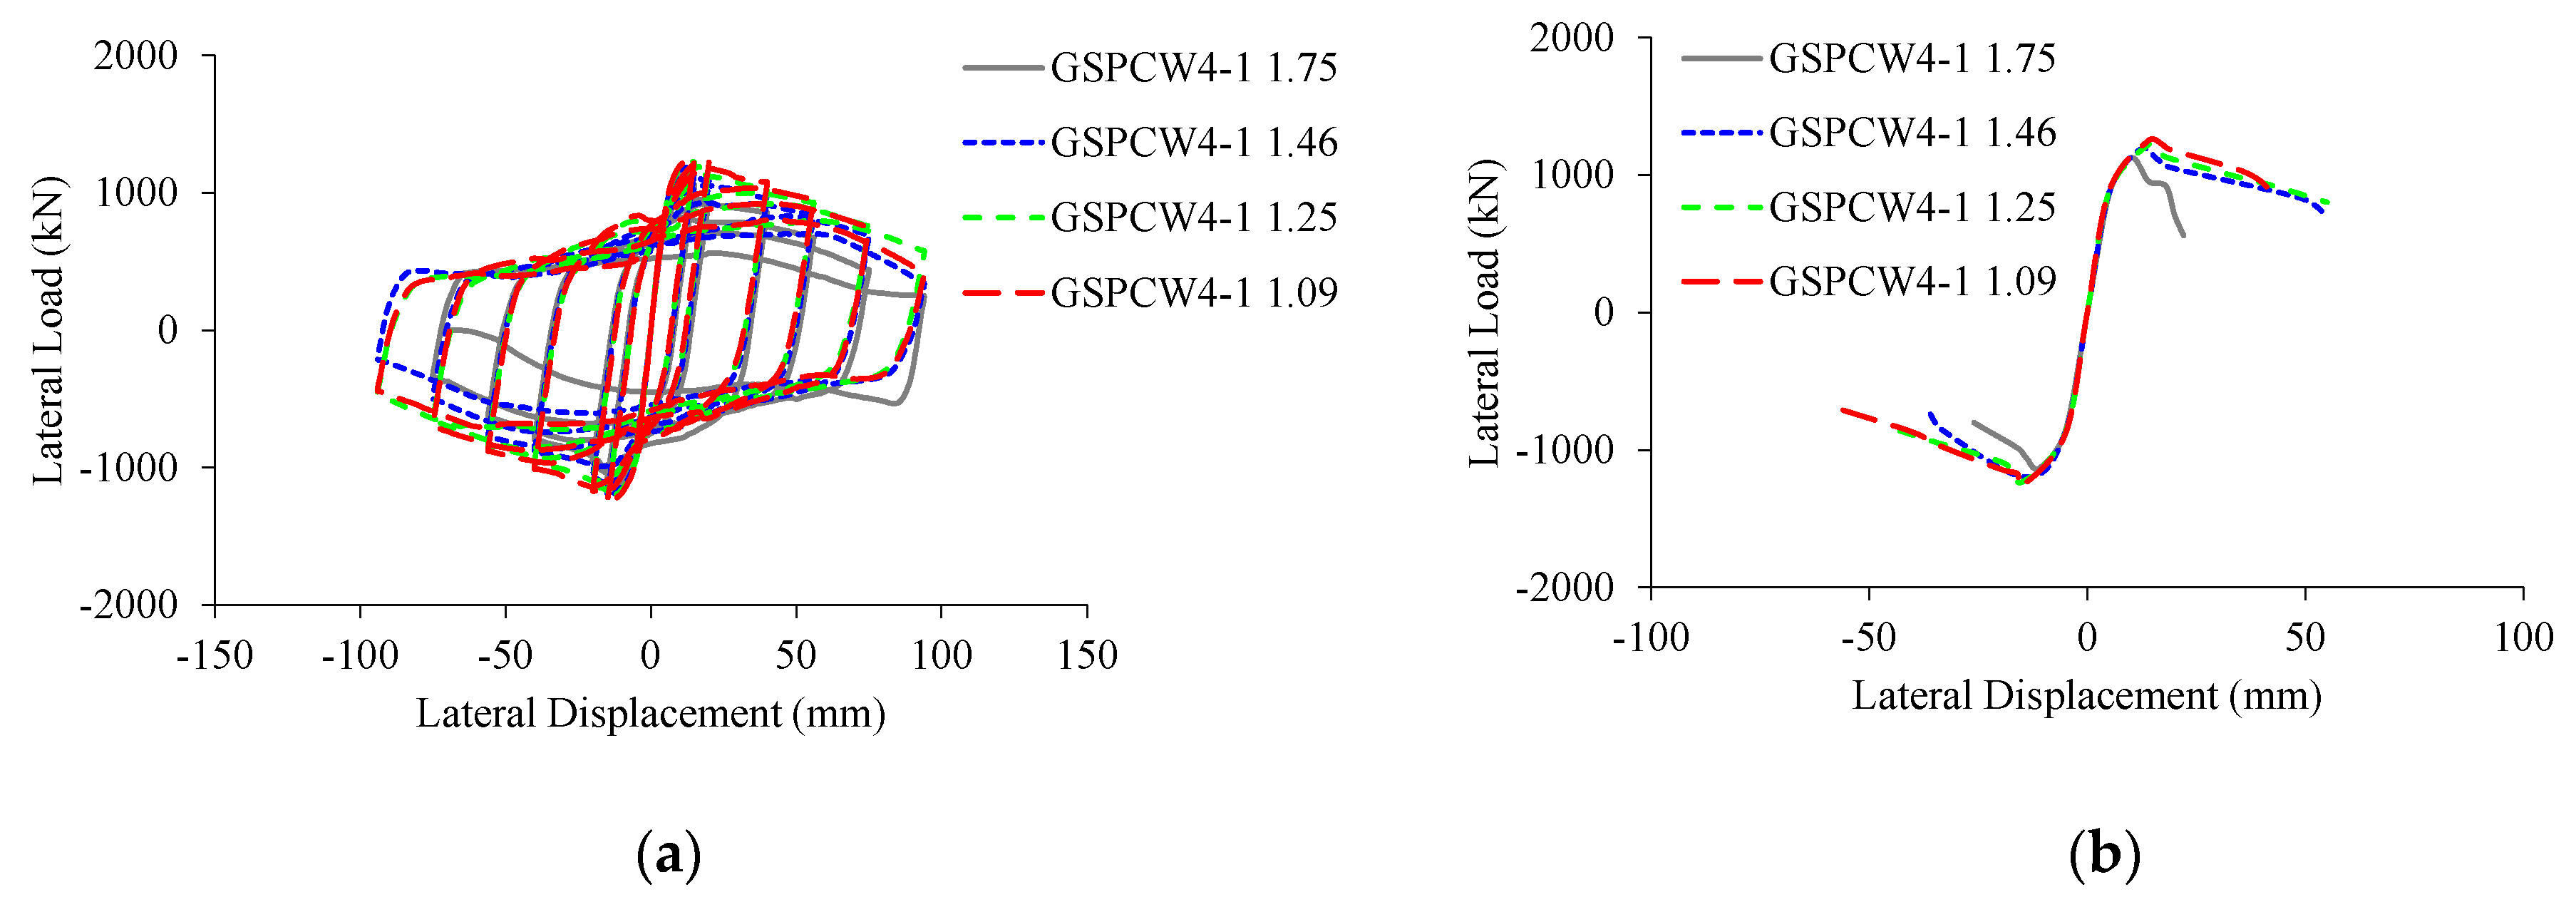
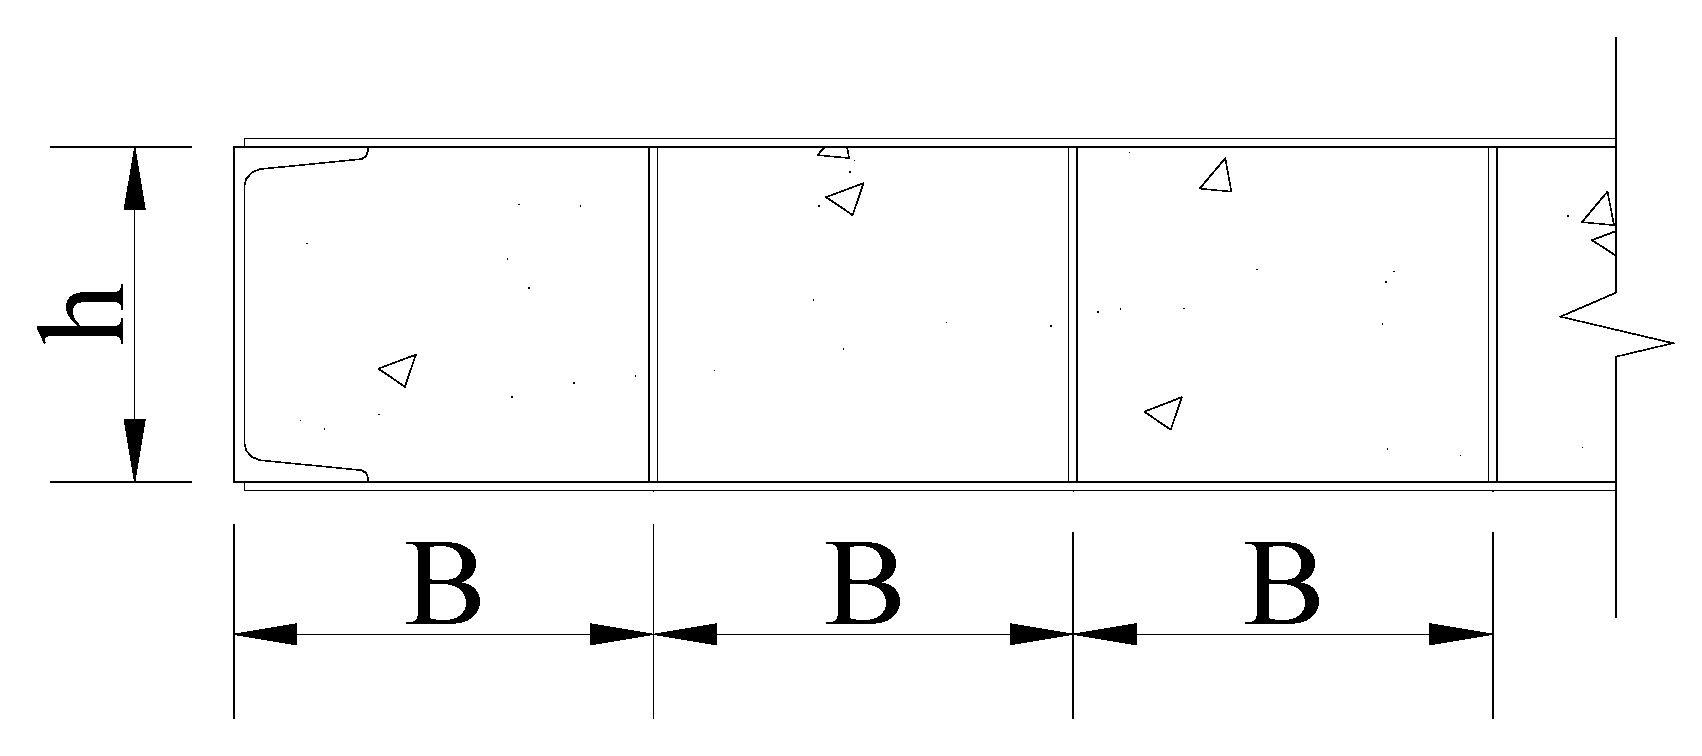
3.4. Aspect Ratio of Grille-Type Steel Plate

Figure 9 shows the hysteresis and skeleton curves for the parametric wall models for grille-type steel plates with different aspect ratios. It can be seen from the figure that the aspect ratio of the grille only influences the lateral behavior of GSPCW walls to a certain extent. As the aspect ratio of the grille decreases, the lateral load capacity of the wall model increases. This is because the steel faceplates and steel tie plates have a certain constraining effect on the infilled concrete. As the aspect ratio of the grille increases, the bond between the steel faceplates and the inner concrete is weakened, meaning that it cannot effectively limit the out-of-plane deformation of the steel faceplate, weakening the hoop effect.
r g = B h
where r g is the aspect ratio of the grille, B is the spacing of the steel tie plates, and h is the thickness of the wall, see Figure 10.

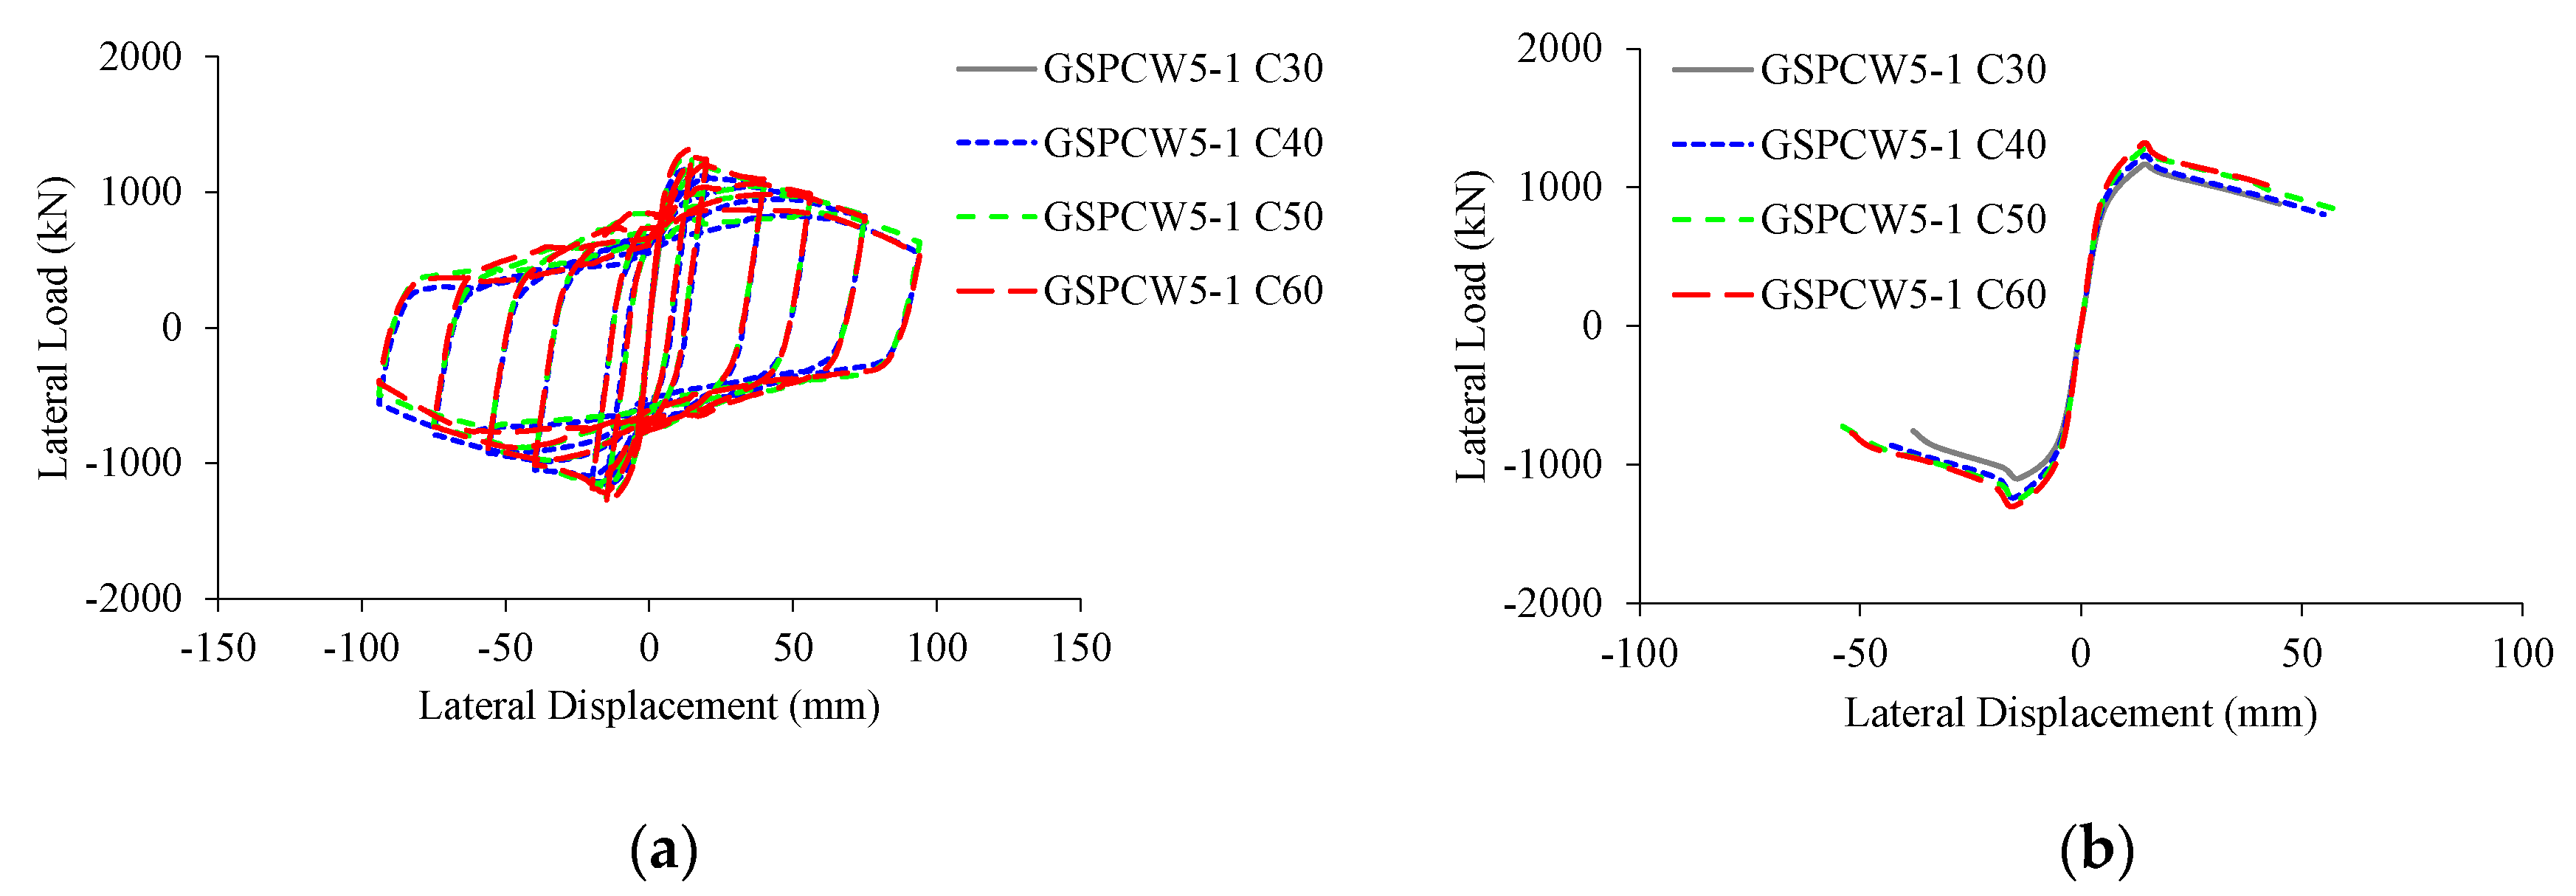
3.5. Concrete Compressive Strength

The compressive strength of concrete was changed from 30 MPa to 60 MPa, and the parametric modeling results are shown in Figure 11. The results show that with increasing concrete strength, the lateral load capacity and stiffness of the test walls increased to a certain degree, but the rate of increase rate was small. Compared with other design variables, the compressive strength of concrete has less influence on the seismic behavior of GSPCW walls.

4. Selection and Modeling of a Case-Study Super-High-Rise Building

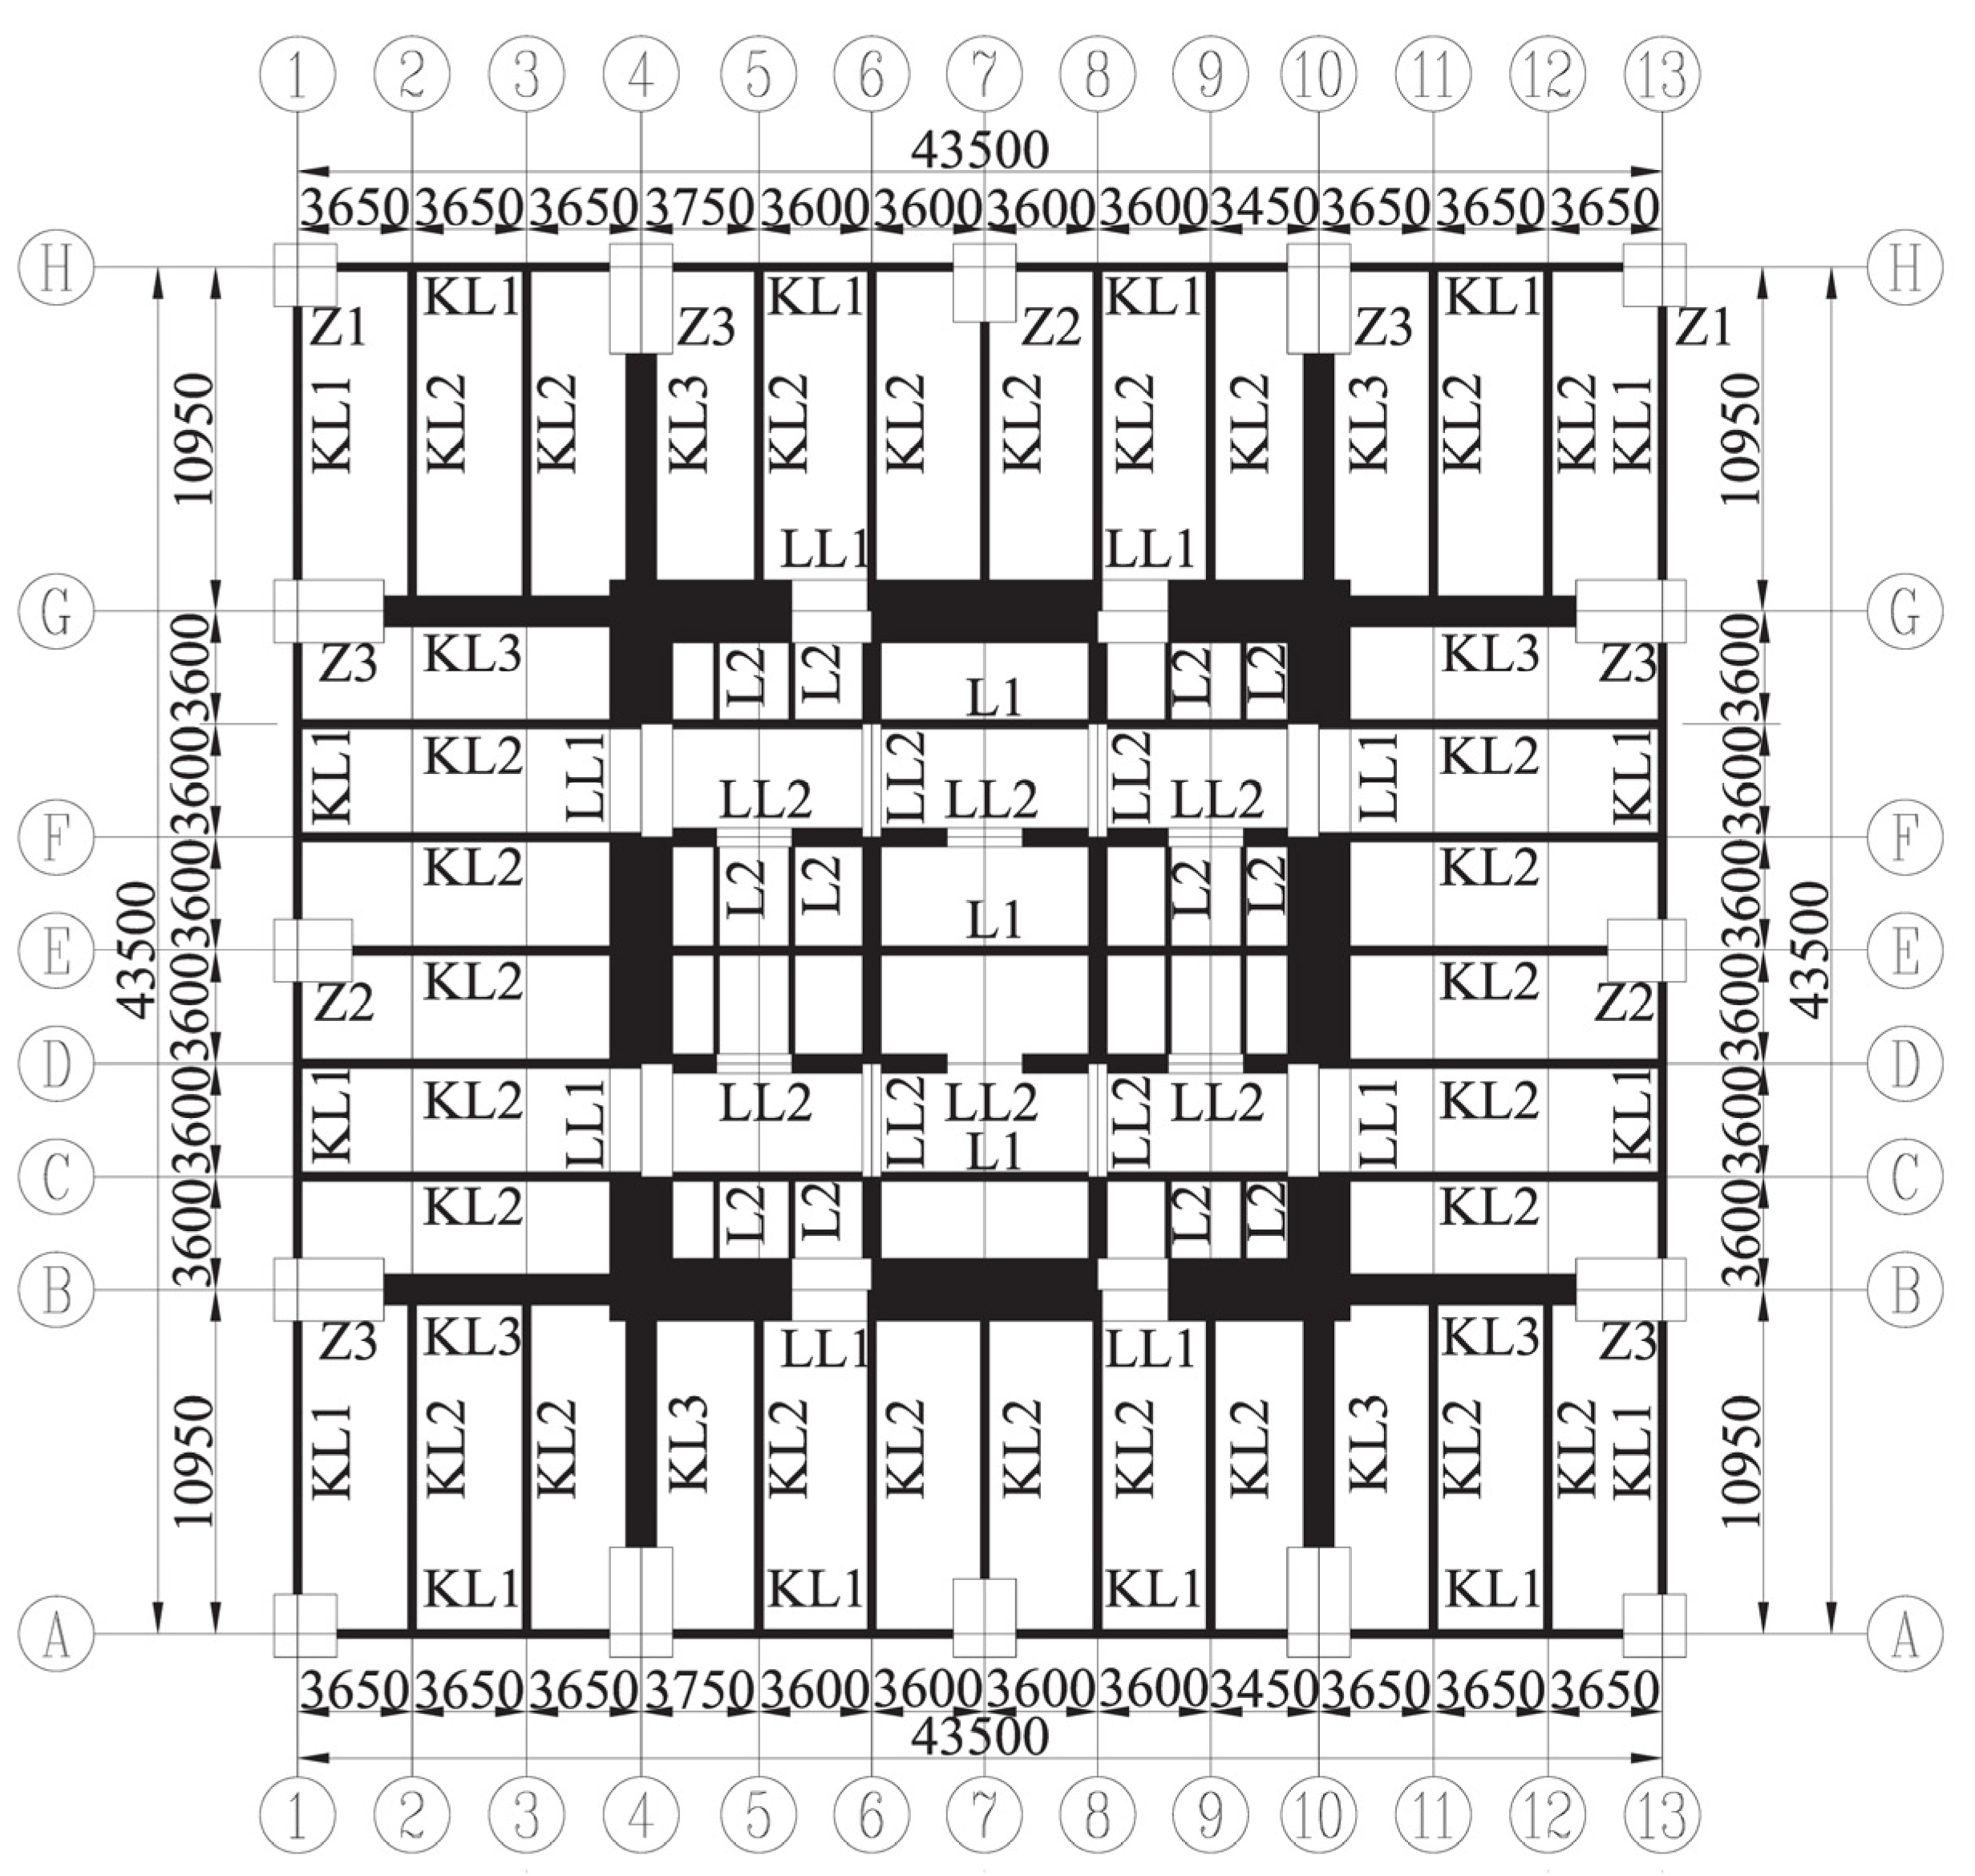
4.1. Case-Study Building

To further investigate the potential application of GSPCW walls in real structures, a super-high-rise building was selected for the case study. Figure 12 shows the floor plan of the structure. The structural system of the selected building was a reinforced concrete (RC) frame-core wall system, which is the most commonly used system for super-high-rise buildings in China. This system normally combines core walls (in the middle of the plan) and columns (at the perimeter of the plan) to resist later loads, obtaining a balance between lateral resistance and stiffness, along with architectural functions. In this study, the frame columns of the building were concrete-filled steel tube (CFT) columns, and the frame beams were RC beams and steel beams. The coupling beams of the core walls were steel–concrete coupling beams and RC coupling beams. The floor slabs and roof slab were reinforced concrete slabs, and the thicknesses of the floors were 100 mm and 120 mm, respectively. Outriggers and mega-braces were used at several stories along the building height to increase the lateral stiffness. The total height of the building was 400 m, with 96 stories. Structural concrete strength was C60 (based on the Chinese design code) for the columns and core walls, and C35 for the floors. The structural steel was Q345, and the reinforcing steel was HRB500 for force-resisting bars and HRB400 for hoops and stirrups. In accordance with the Chinese Code for seismic design of buildings [17], the building was assumed to be on a location representing high seismicity, with a peak ground acceleration (PGA) for the designed earthquake of 0.2 g. The site class was III, and the seismicity group was I, resulting in a characteristic period for the site of 0.45 s. The dead and live loads for both the floor and the roof were 5.0 kN/m2 and 2.0 kN/m2, respectively. The details of the design for structural member sizes can be found in Table 4 (horizontal components) and Table 5 (vertical components). It is worth noting that the thickness of the exterior wall in brackets is the thickness for grille-type steel plate concrete composite walls, which is reduced compared to their counterpart RC walls. The steel ratios of the RC walls and GSPCW walls were controlled at 0.8% and 8%, respectively.

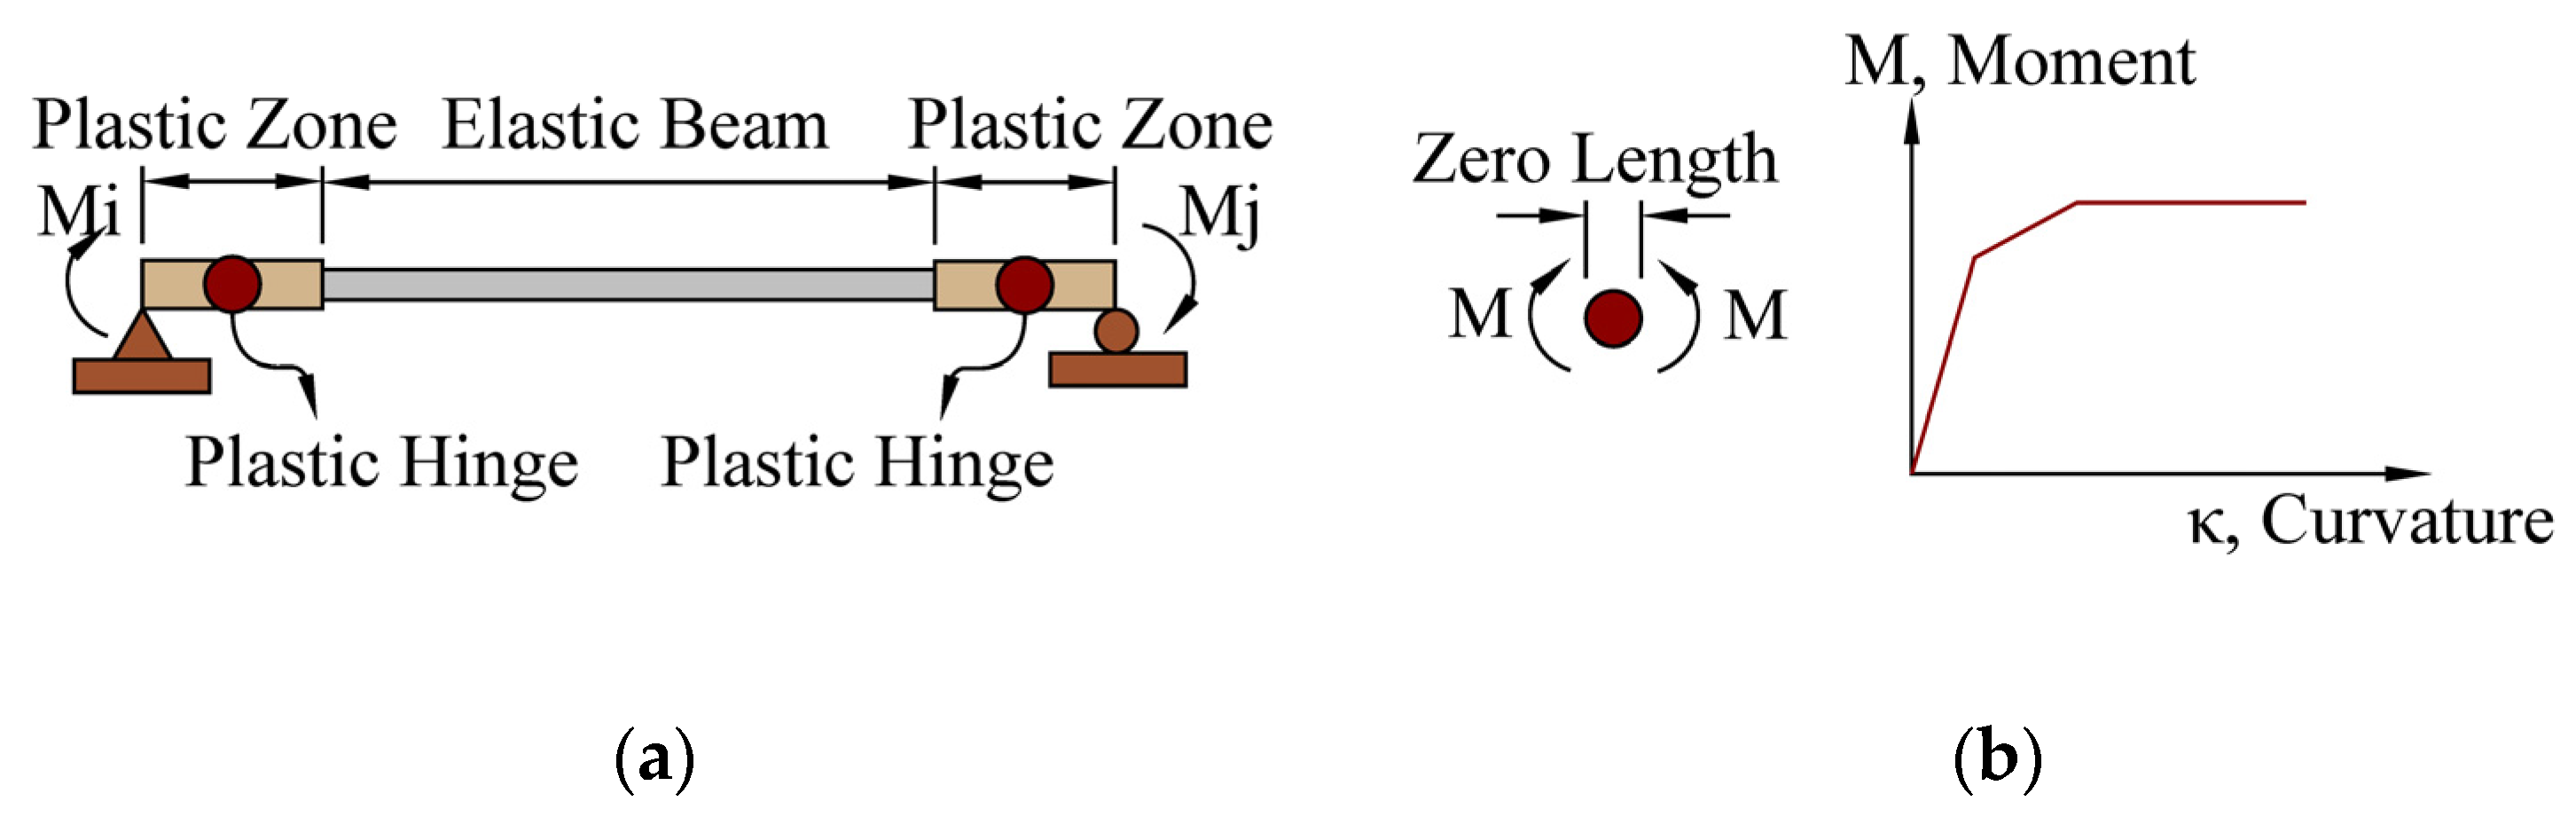
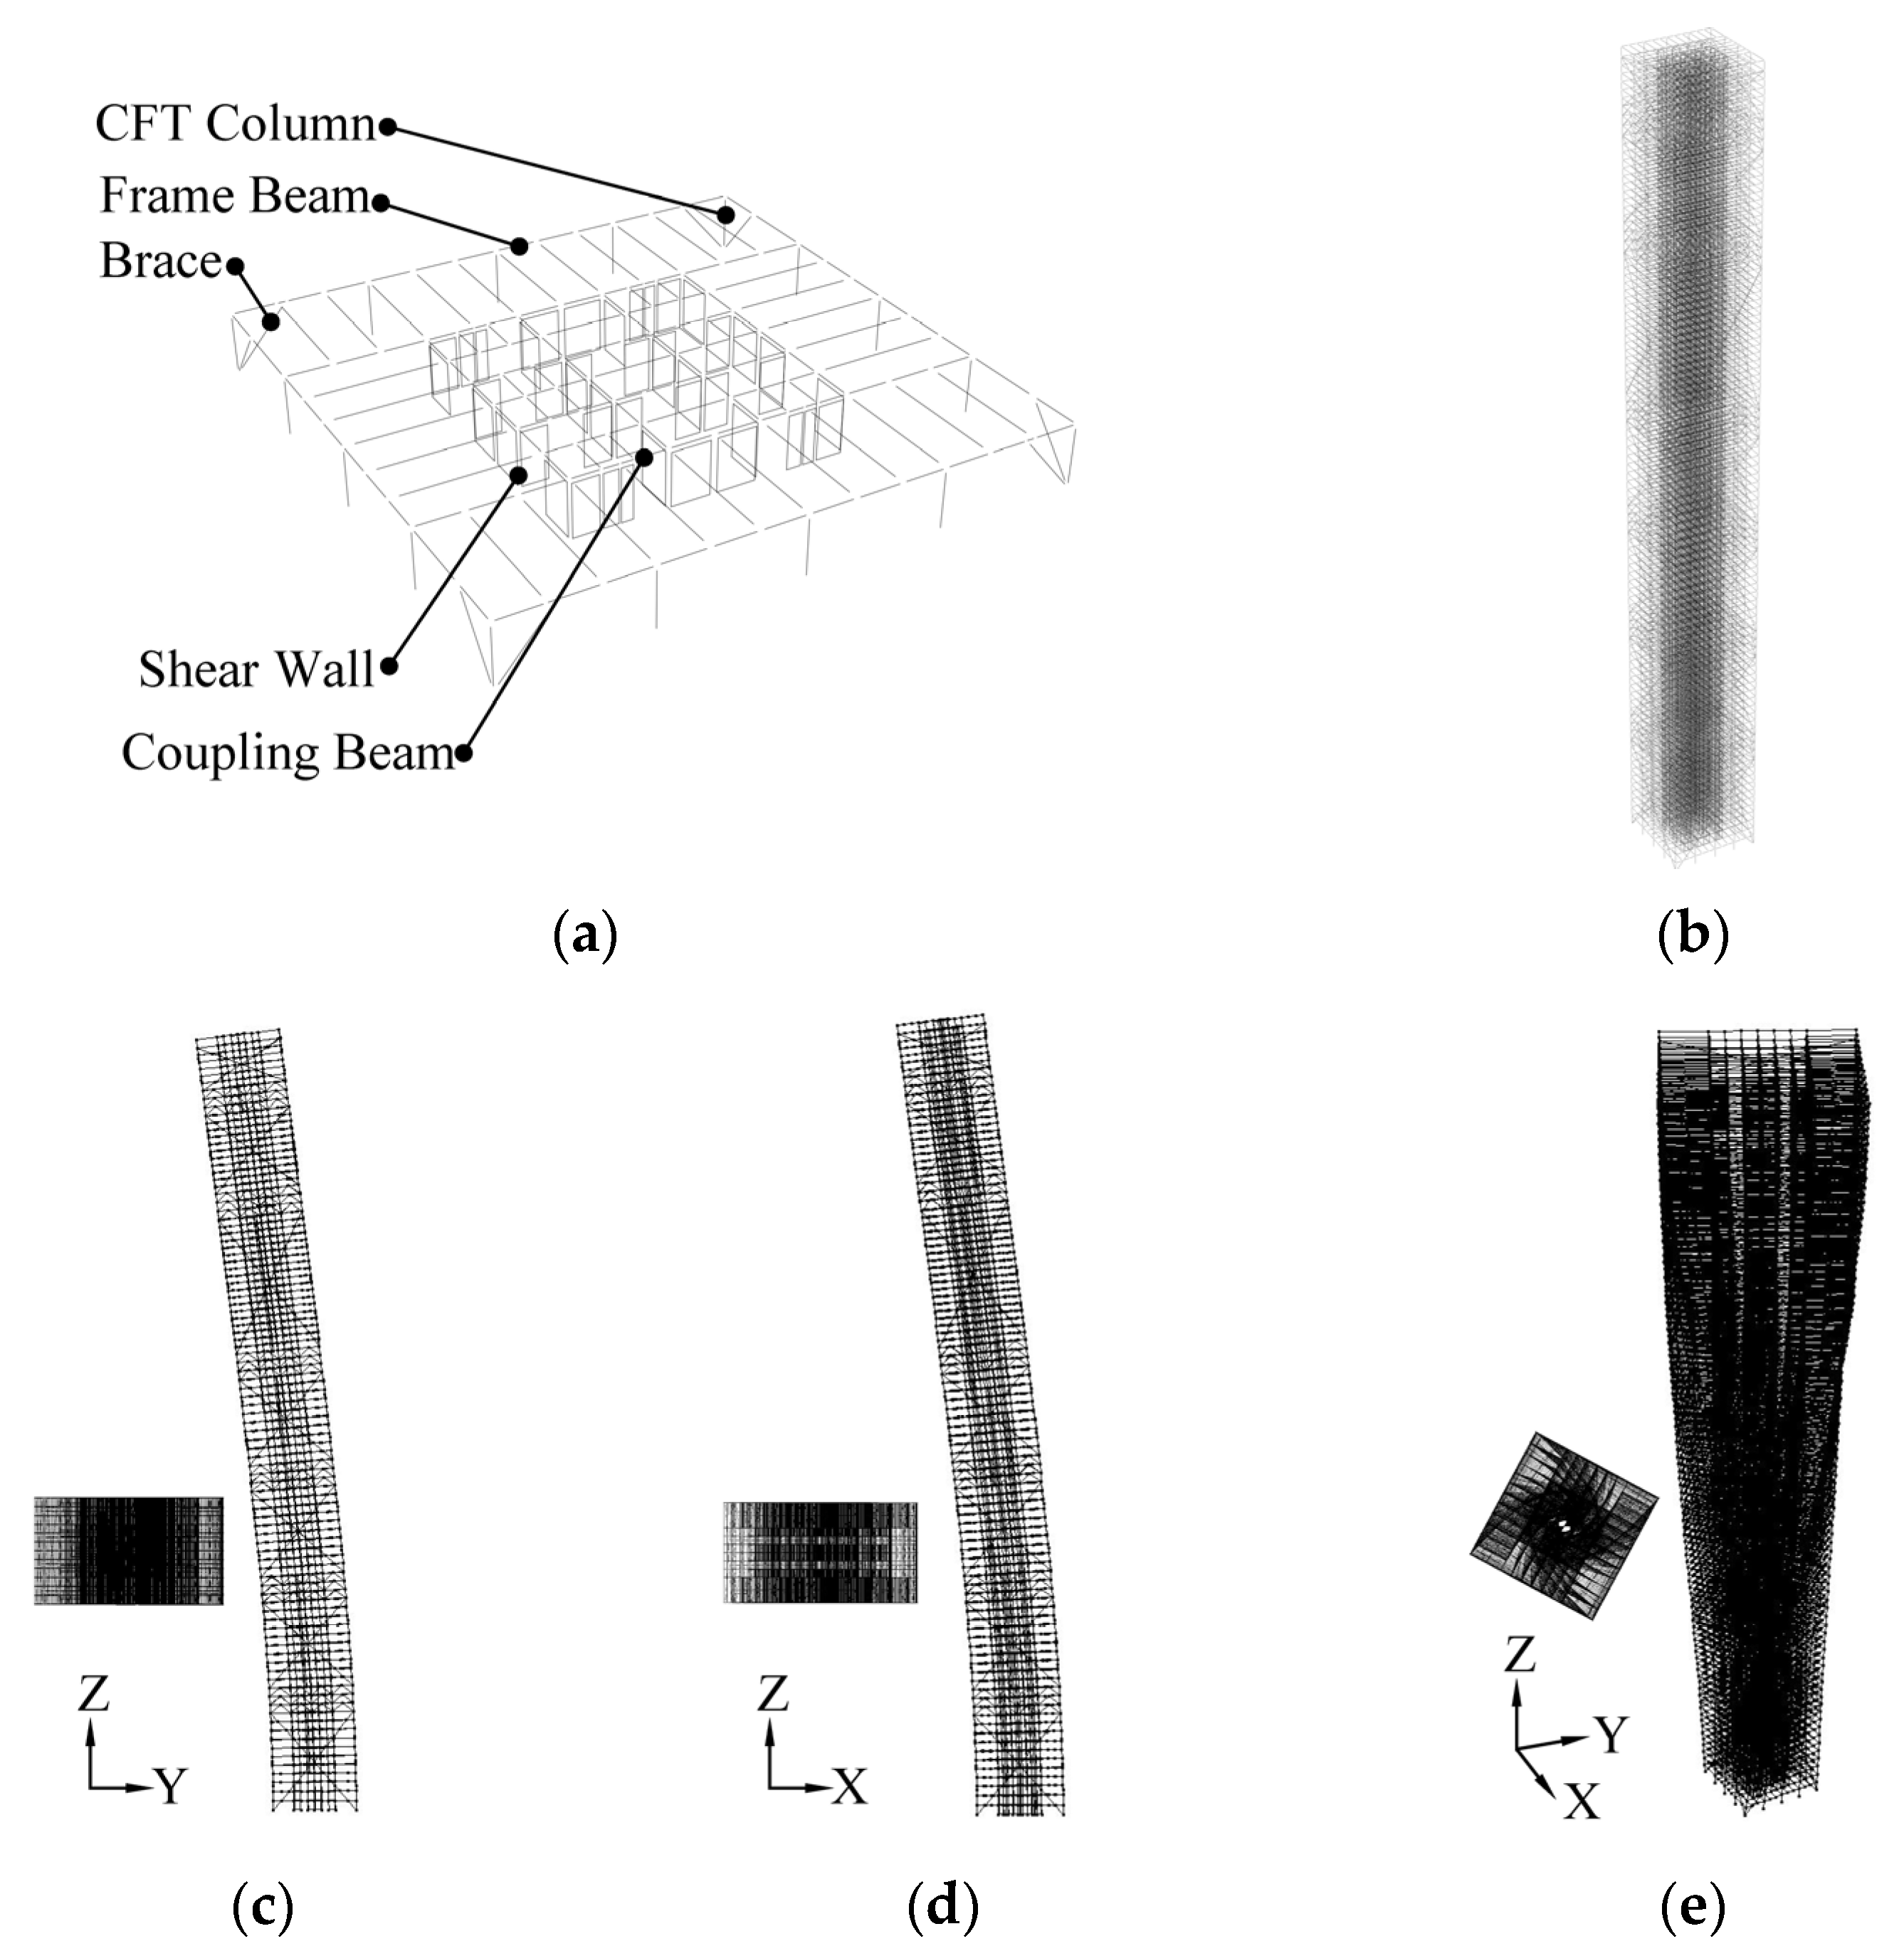
4.2. Modeling of the Case-Study Building

The numerical model of the case-study building was established using the PERFORM-3D software [18]. The building core walls were modeled using the General Wall element in PERFORM-3D, considering both the axial–flexural interaction and the nonlinear shear behavior. The axial and flexural behavior of the core walls were modeled using fiber-section-based models, while the shear behavior was modeled by defining shear material. The CFT columns were modeled using a fiber section beam–column element in order to consider axial–flexural interaction. For simplicity, all of the beams were modeled using a concentrated plasticity beam–column element, and the constitutive relationship of moment–curvature for the concentrated plastic hinge in the element was determined on the basis of the static elastoplastic method, see Figure 13. For coupling beams, it is critical to include the shear effect to model the shear mechanism of coupling beams. The model adopts rigid floor constraints, where slabs are assumed to be rigid slabs, and all beams have zero axial deformation. All the material models were determined according to current design codes as well as several reference guidelines [15,16,17,19,20,21]. Figure 14 shows the elevation view along with the bottom story view of the building model. The core walls of the case-study building were initially designed using RC shear walls, and then the RC walls were substituted with GSPCW walls with reduced wall section sizes. The load combination included 1 times dead load and 0.5 times live load. A comparison of the dynamic characteristics between the RC model and the GSPCW model are provided in Table 6.

4.3. Validation of Modeling in PERFORM-3D

Modeling and validation of GSPCW walls in PERFORM-3D software was performed as follows. First, the elastic modulus of shear walls can be determined on the basis of the modeling manual of PERFORM-3D software [18,22]. Second, modeling of shear behavior of GSPCW walls should include the contribution from both concrete and steel [23], and the shear capacity can be calculated as in [19],
G = p E s
τ = 0.27 f c + N 4 A
τ = 0.6 N A
V y k = 1 λ 0.5 ( 0.4 f t k b h 0 + 0.1 N A w A ) + 0.8 f y v k A s h s h w 0 + 0.25 λ f a k A a 1 + 0.32 λ f p k A p
On the basis of [24,25,26], the strain-hardening ratio can be selected as 3%, the shear strain corresponding to the peak shear stress can be determined as 0.0075, the maximum usable shear strain can be determined as 0.02, the residual shear capacity can be determined as 40% of the peak capacity, and the hysteresis degradation coefficient can be selected as 0.3 for all stages. Figure 15 presents a comparison of the numerical modeling results of the two GSPCW test wall specimens using the PERFORM-3D software, as well as a comparison of those results with test data. It can be seen from the figure that the modeling results are reasonably good in terms of bearing load capacity and loading and unloading stiffness. However, the numerical model appears to sustain a larger load capacity for larger lateral displacement compared with the test results. This behavior is likely due to the fact that the modeling assumptions in PERFORM-3D software do not include the consideration of the steel buckling mechanism when the wall reaches a large lateral displacement. This behavior may cause unconservative results for buildings subjected to large earthquake intensities, such as in the near collapse limit state, but should be marginal in the current assessment under this design and the maximum considered earthquake intensity levels.

5. Seismic Performance Assessment through Nonlinear Time History Analysis
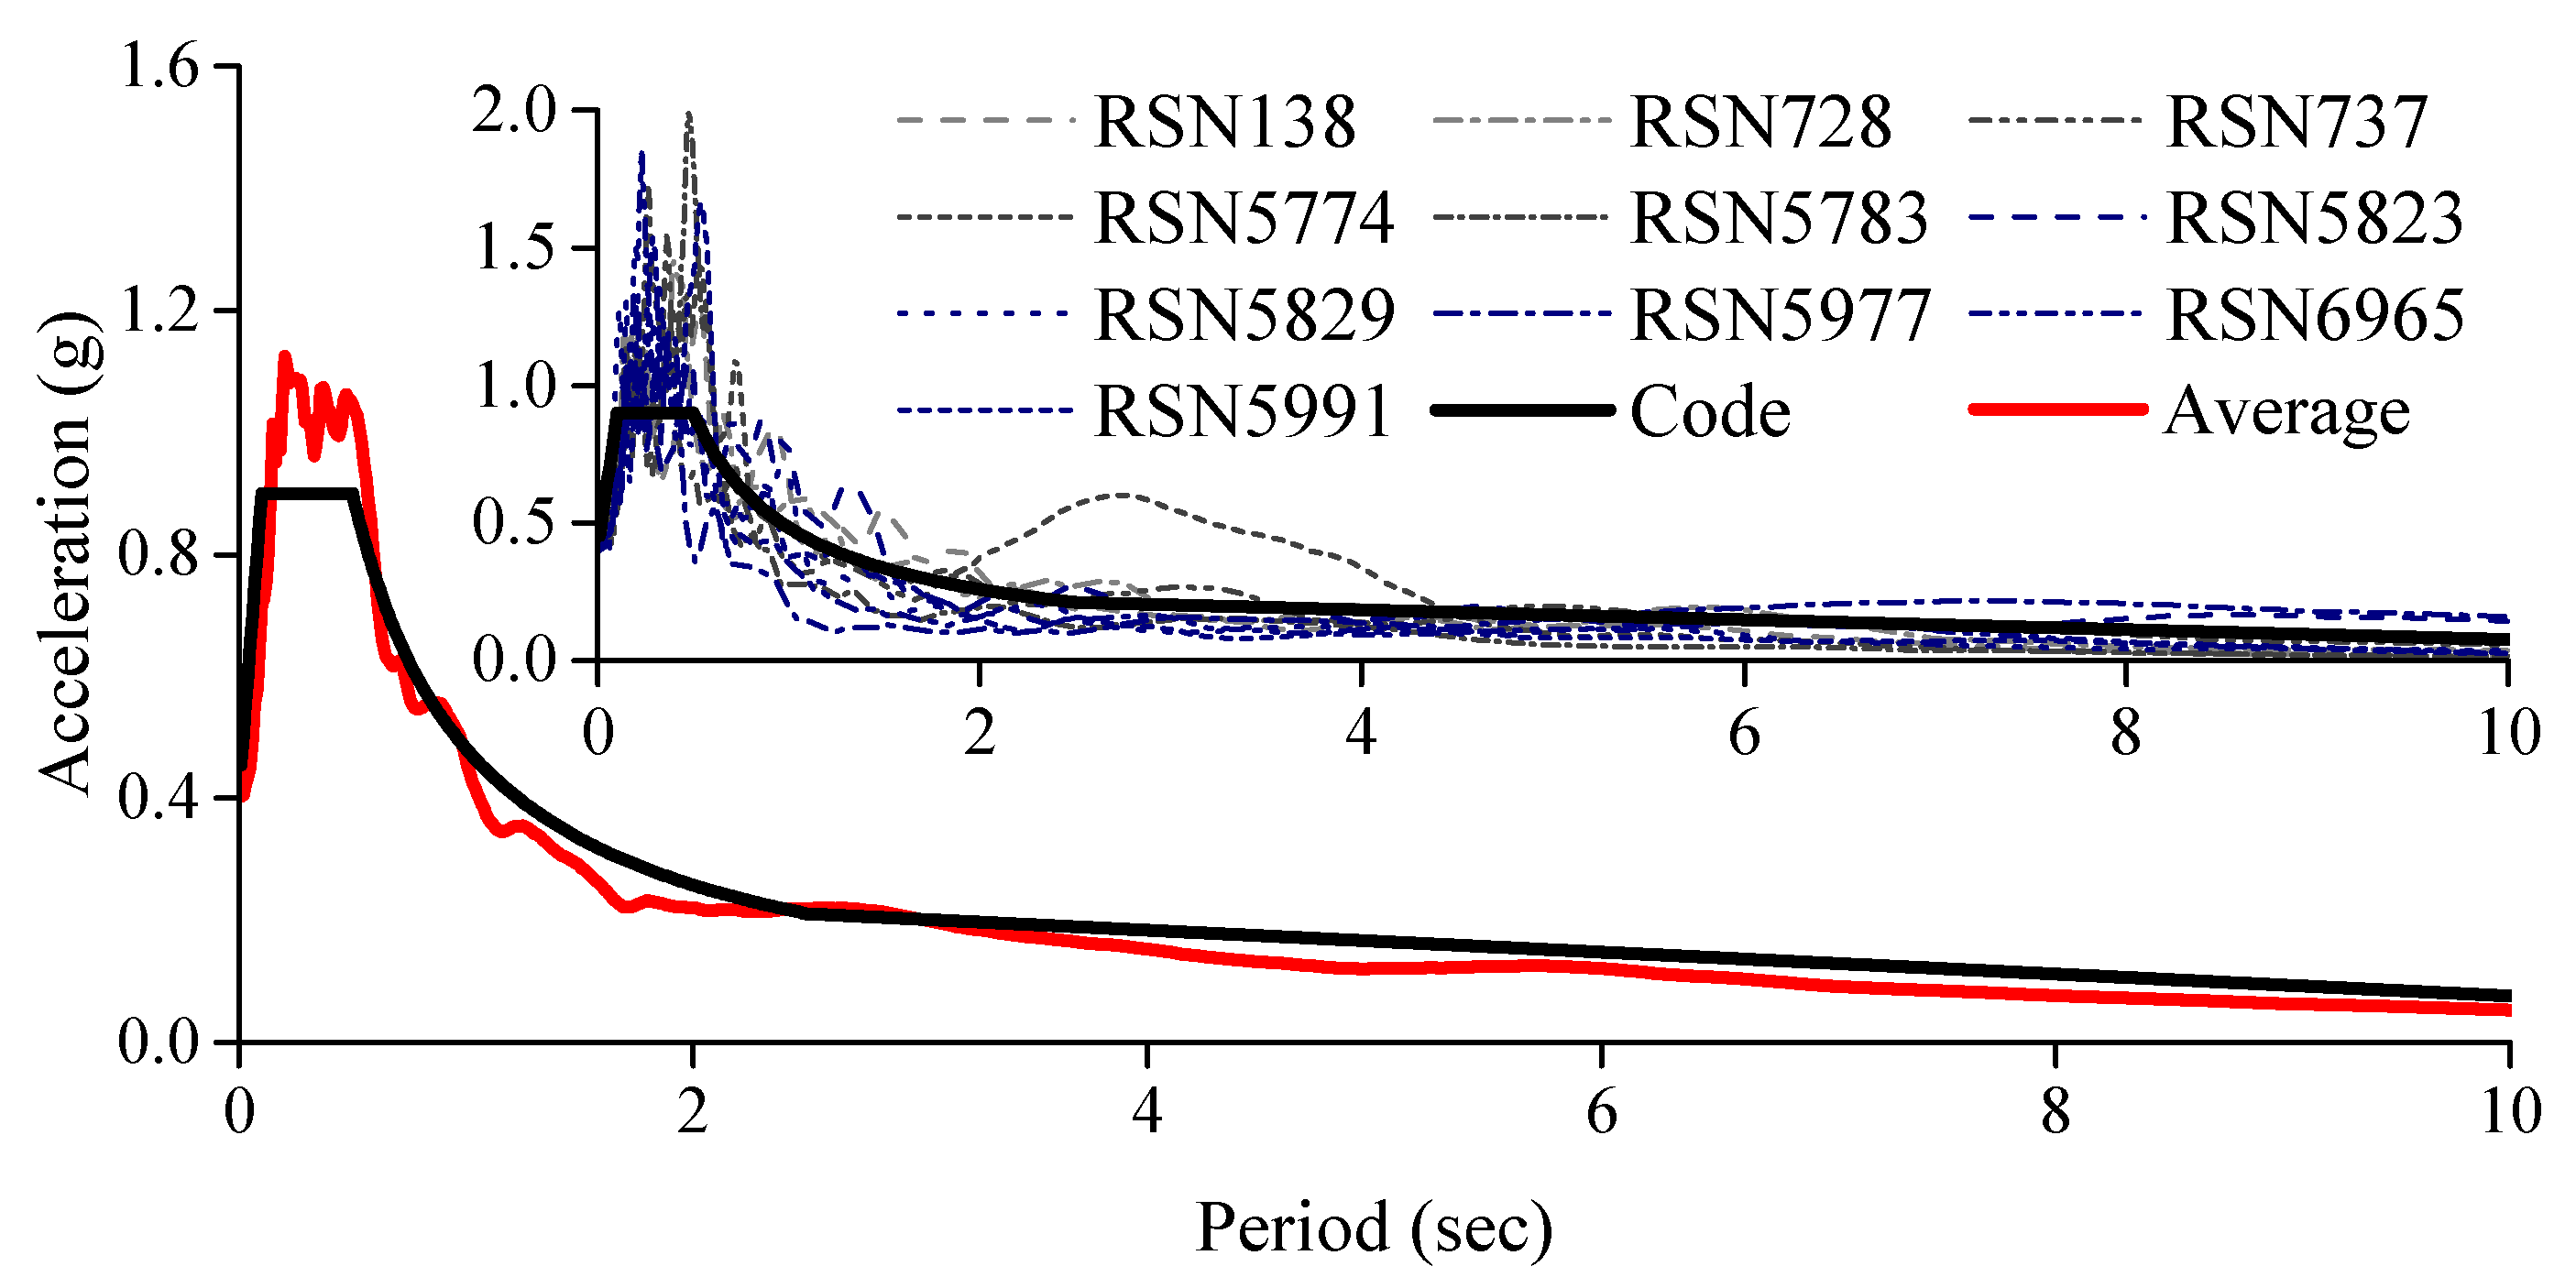
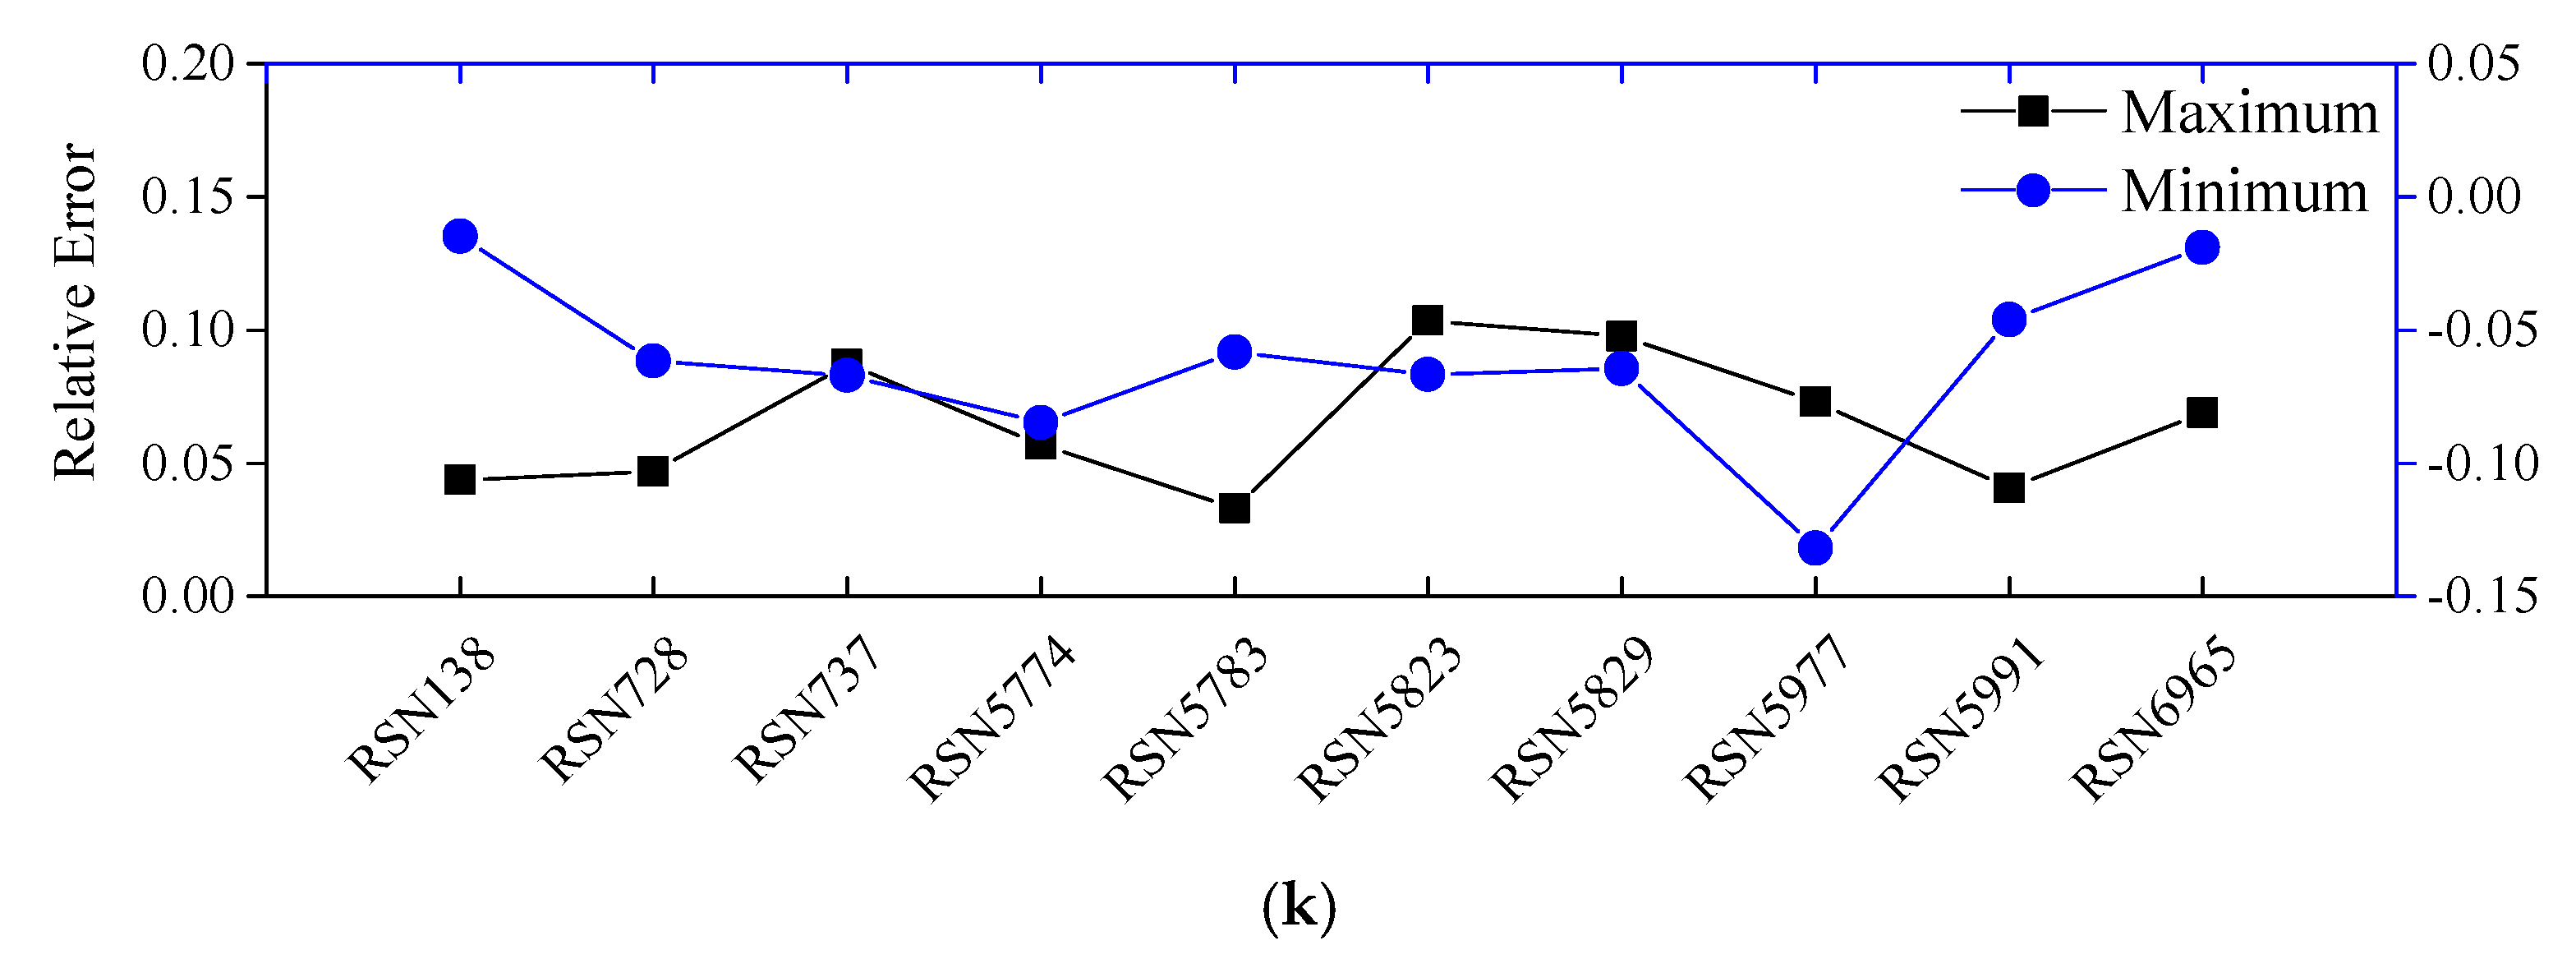
5.1. Ground Motions

For nonlinear time history analysis, a total of ten ground motion records were selected for the current study. The ground motions were selected according to the Chinese Code for the seismic design of buildings [17]. The returning period of the ground motion with a 2% probability of exceedance for design reference periods of 50 years is 2475 years. Each of the ten seismic records was a natural recorded seismic excitation, and the records can be downloaded from the PEER ground motion database. Table 7 presents the basic information for the ten earthquake ground motions, including the earthquake records’ site station, year and duration time. The wave forms were scaled according to the site PGA. Figure 16 shows the design spectrum with a 5% damping ratio based on Chinese Code for seismic design of buildings [17], along with the individual ground motion spectrum. Figure 16 also shows the comparison of the average ground motion spectrum with the design spectrum. It can be inferred from the figure that the average spectrum of the ground motions matches well with the design spectrum in an overall sense.

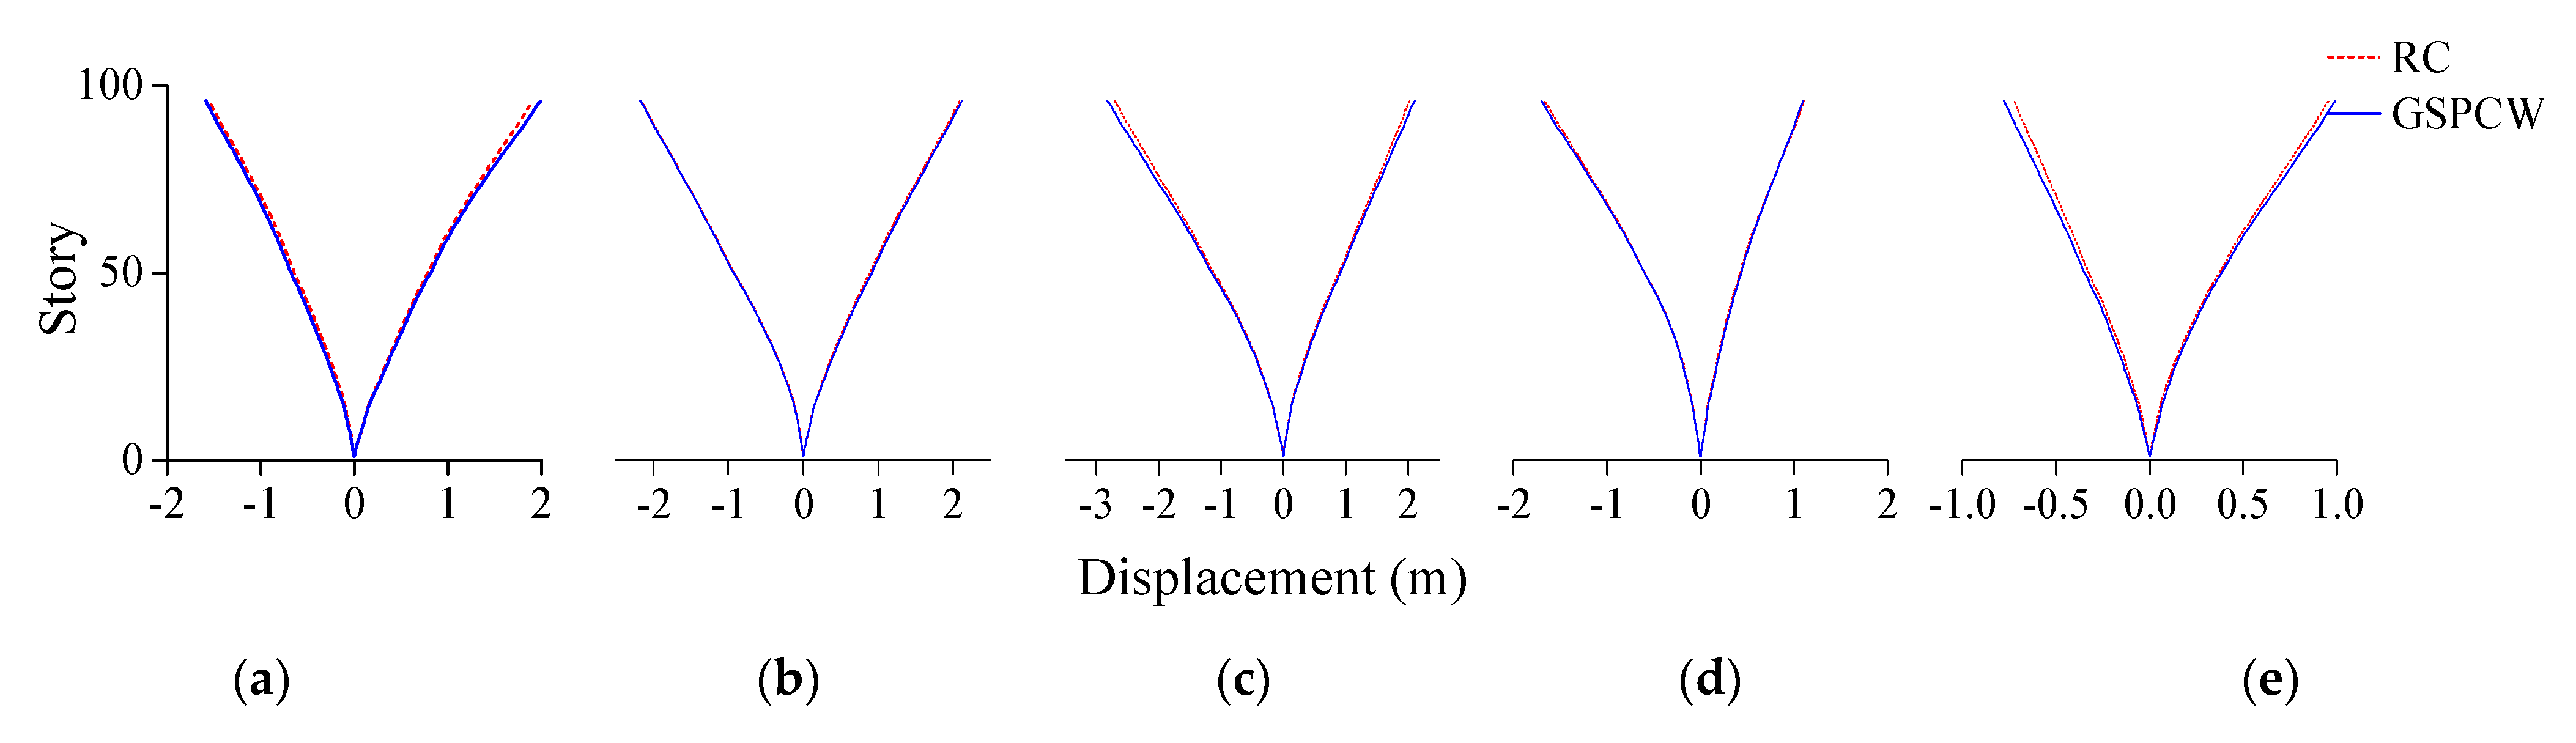
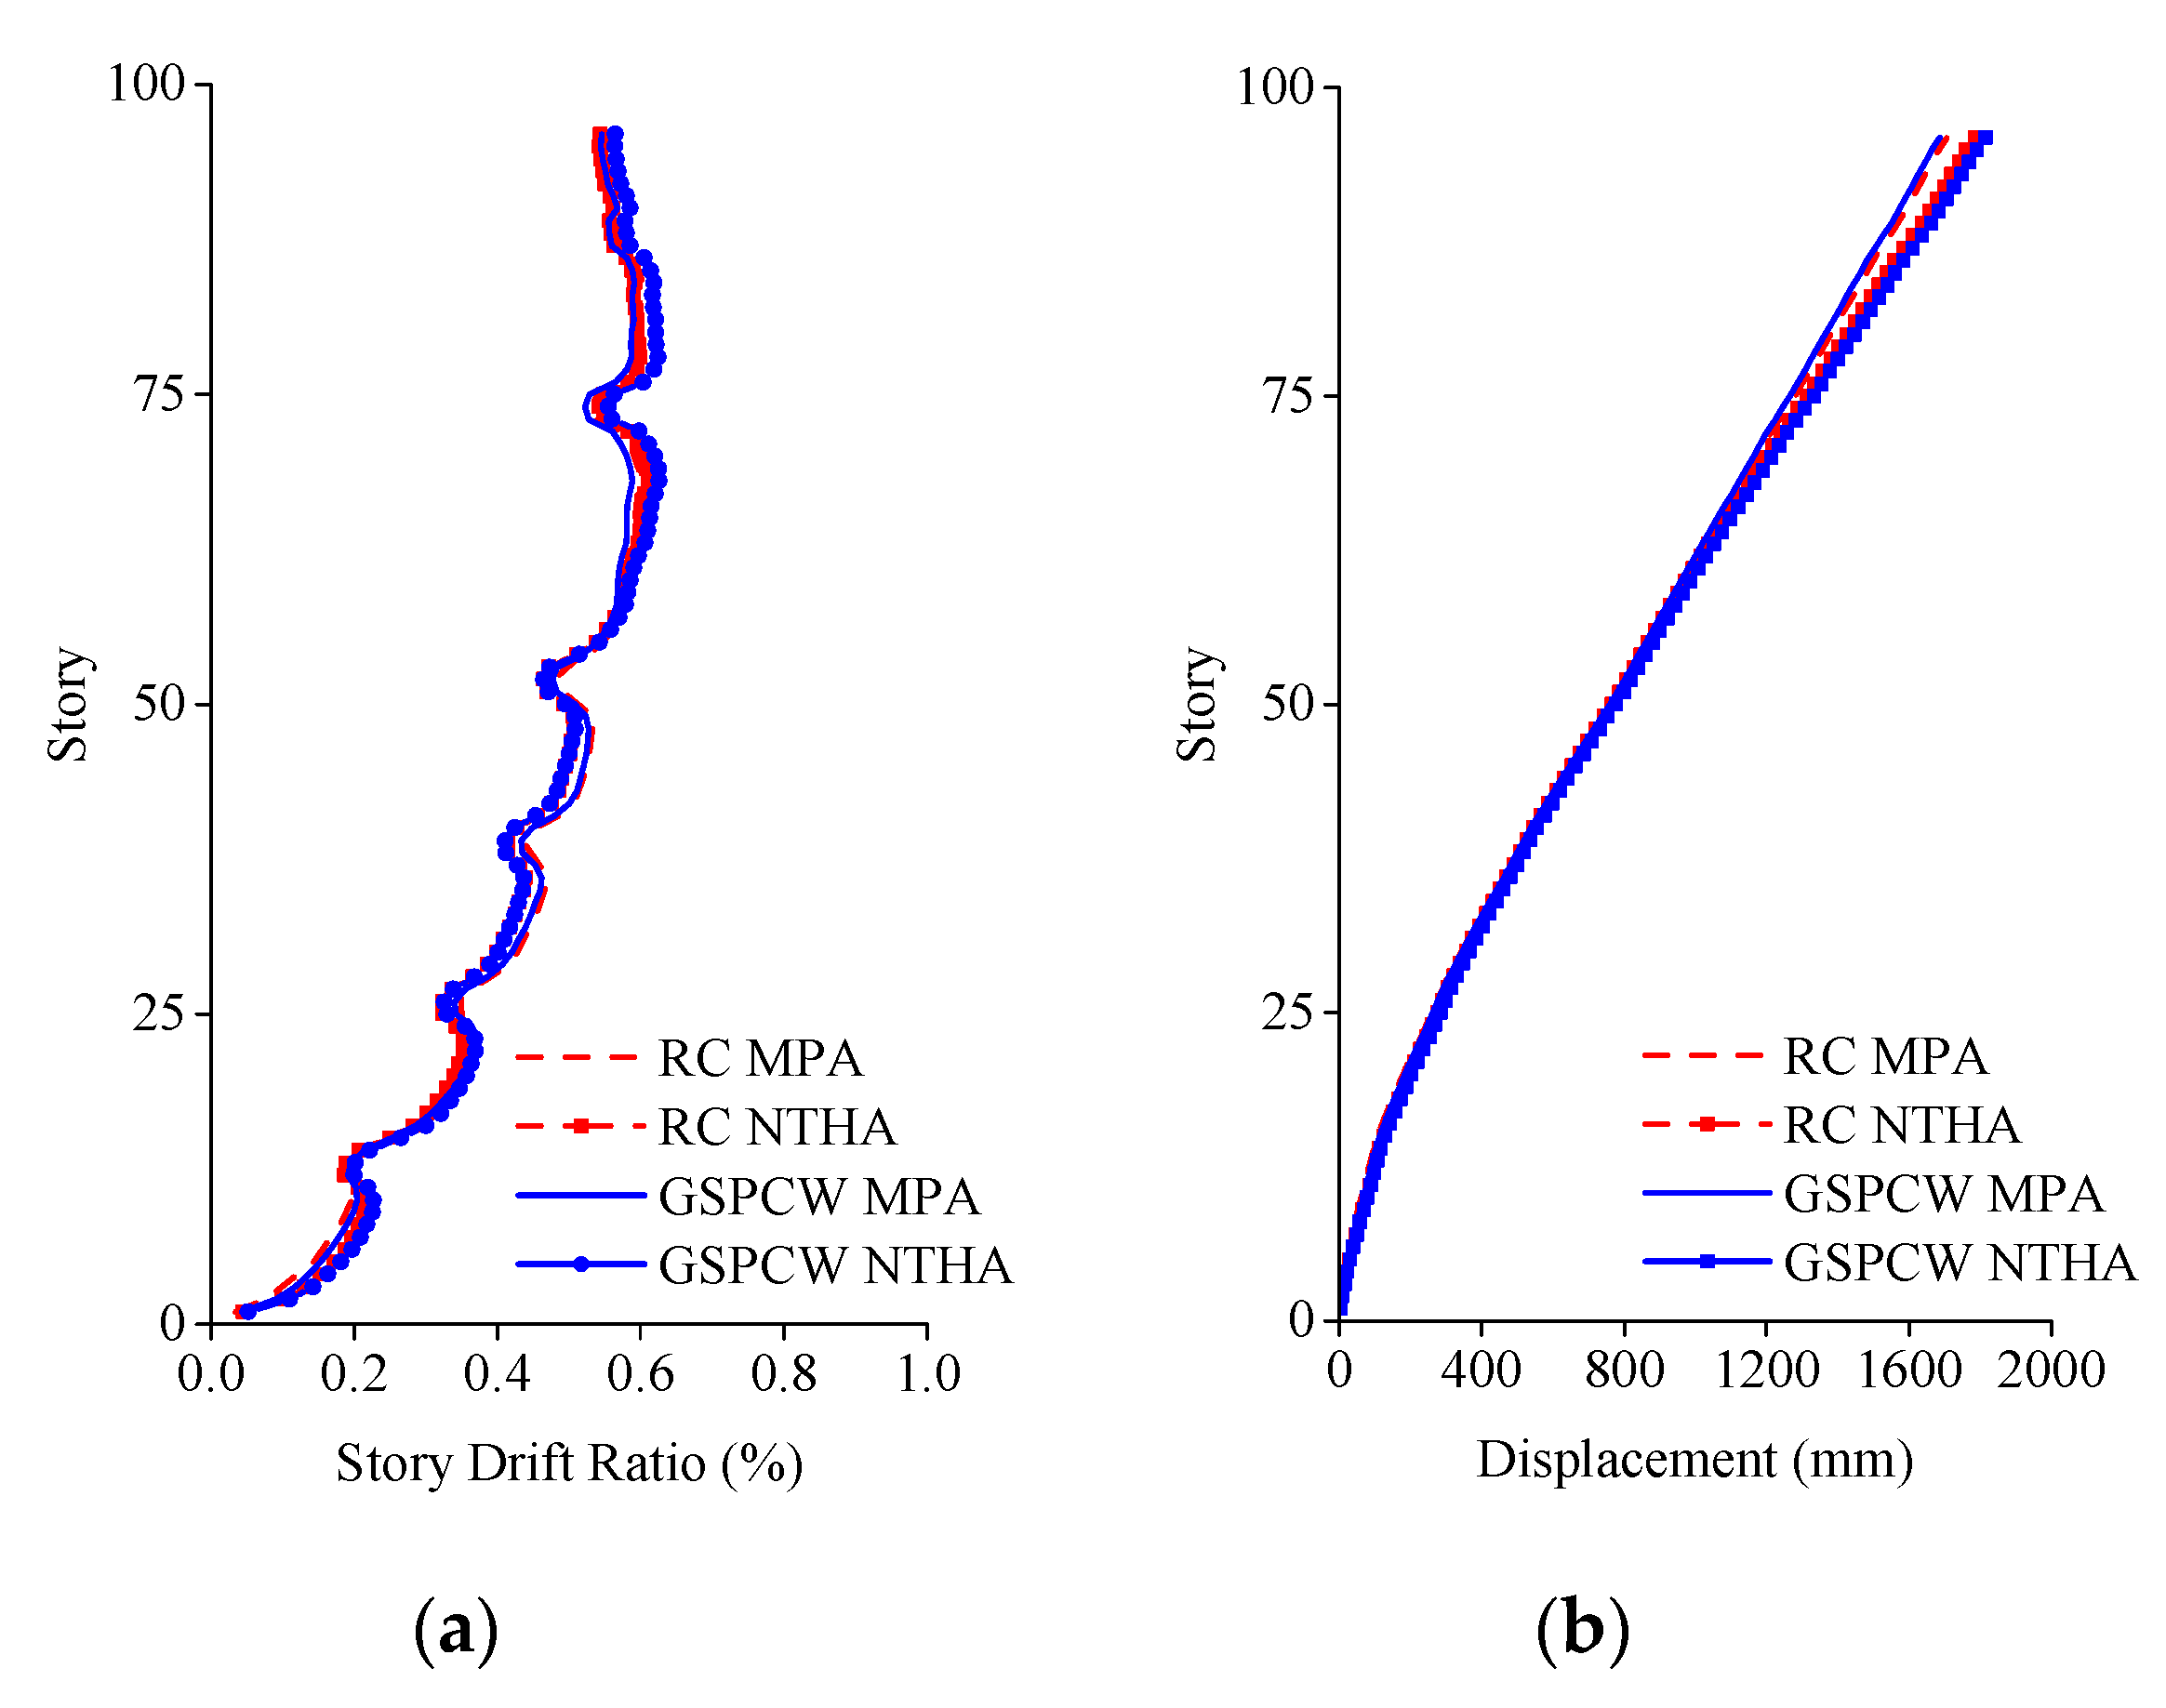
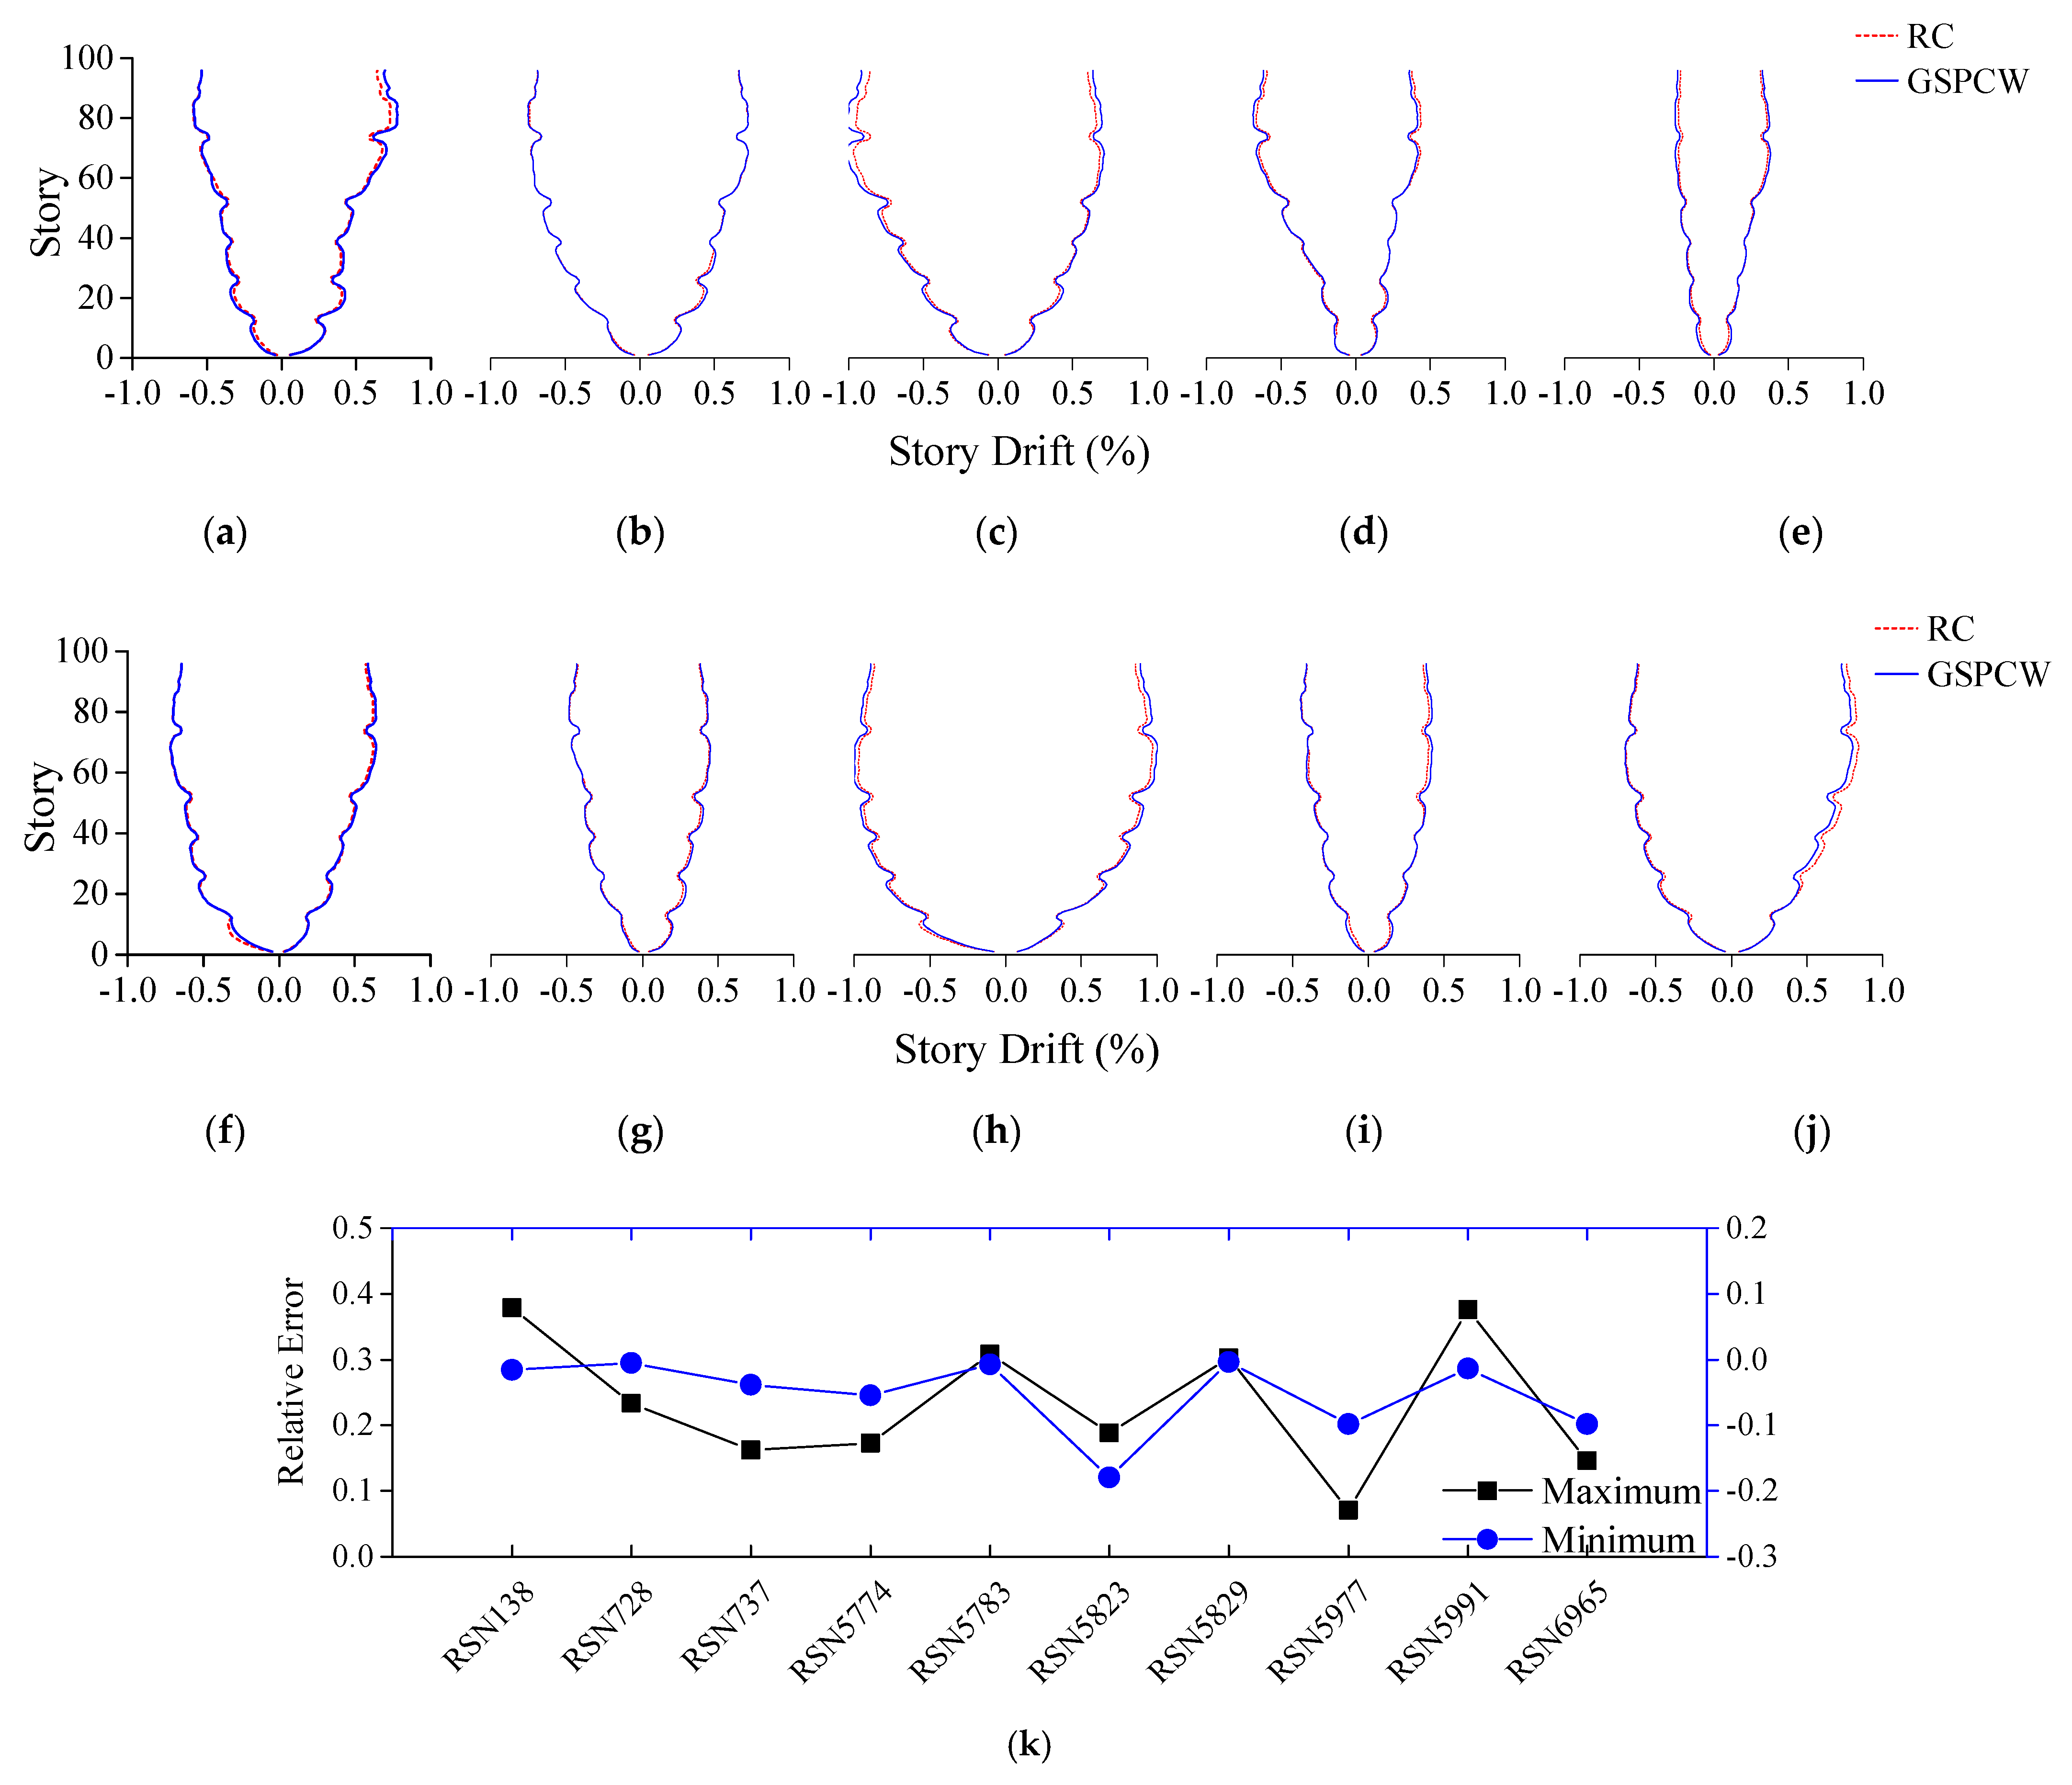
5.2. Story Drifts and Peak Displacements

The results for story drifts and peak displacements obtained using nonlinear time history analysis (NTHA) are presented in Figure 17 and Figure 18, respectively. In the meantime, the figures compare the results of the GSPCW building and the RC building. It can be seen from the figure that in an overall sense, the GSPCW building model designed with reduced exterior wall section sizes (see Table 5) exhibits similar structural performance as the RC building. The relative errors between the two models are also presented in the figure. Quantitatively, the maximum relative error of story drifts and peak displacements between the two models could reach up to 40%, and the minimum relative error between the two models could be up to 10%. Based on this analysis, the error usually occurs at the bottom of the building. It can be inferred from the results that the GSPCW walls are able to control the story drift response and peak story response to be basically consistent with the RC walls, even if the thickness of the GSPCW walls is reduced by nearly 30%.

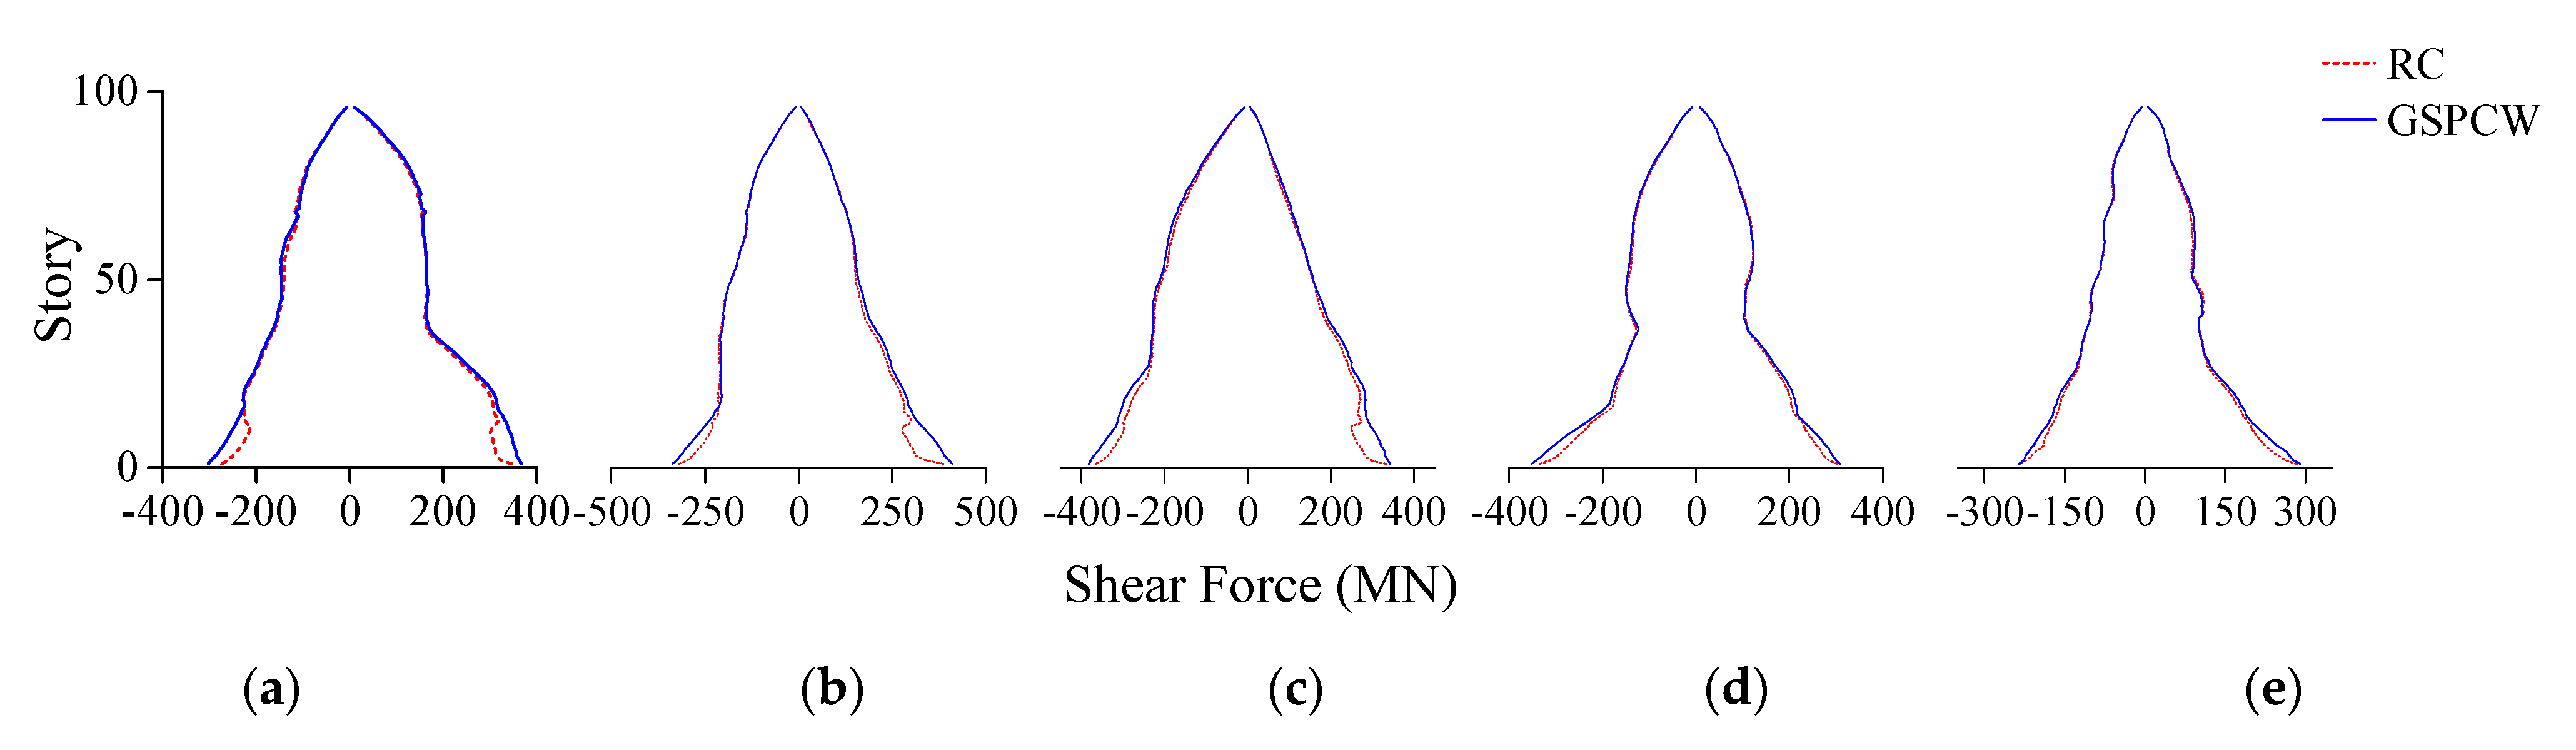
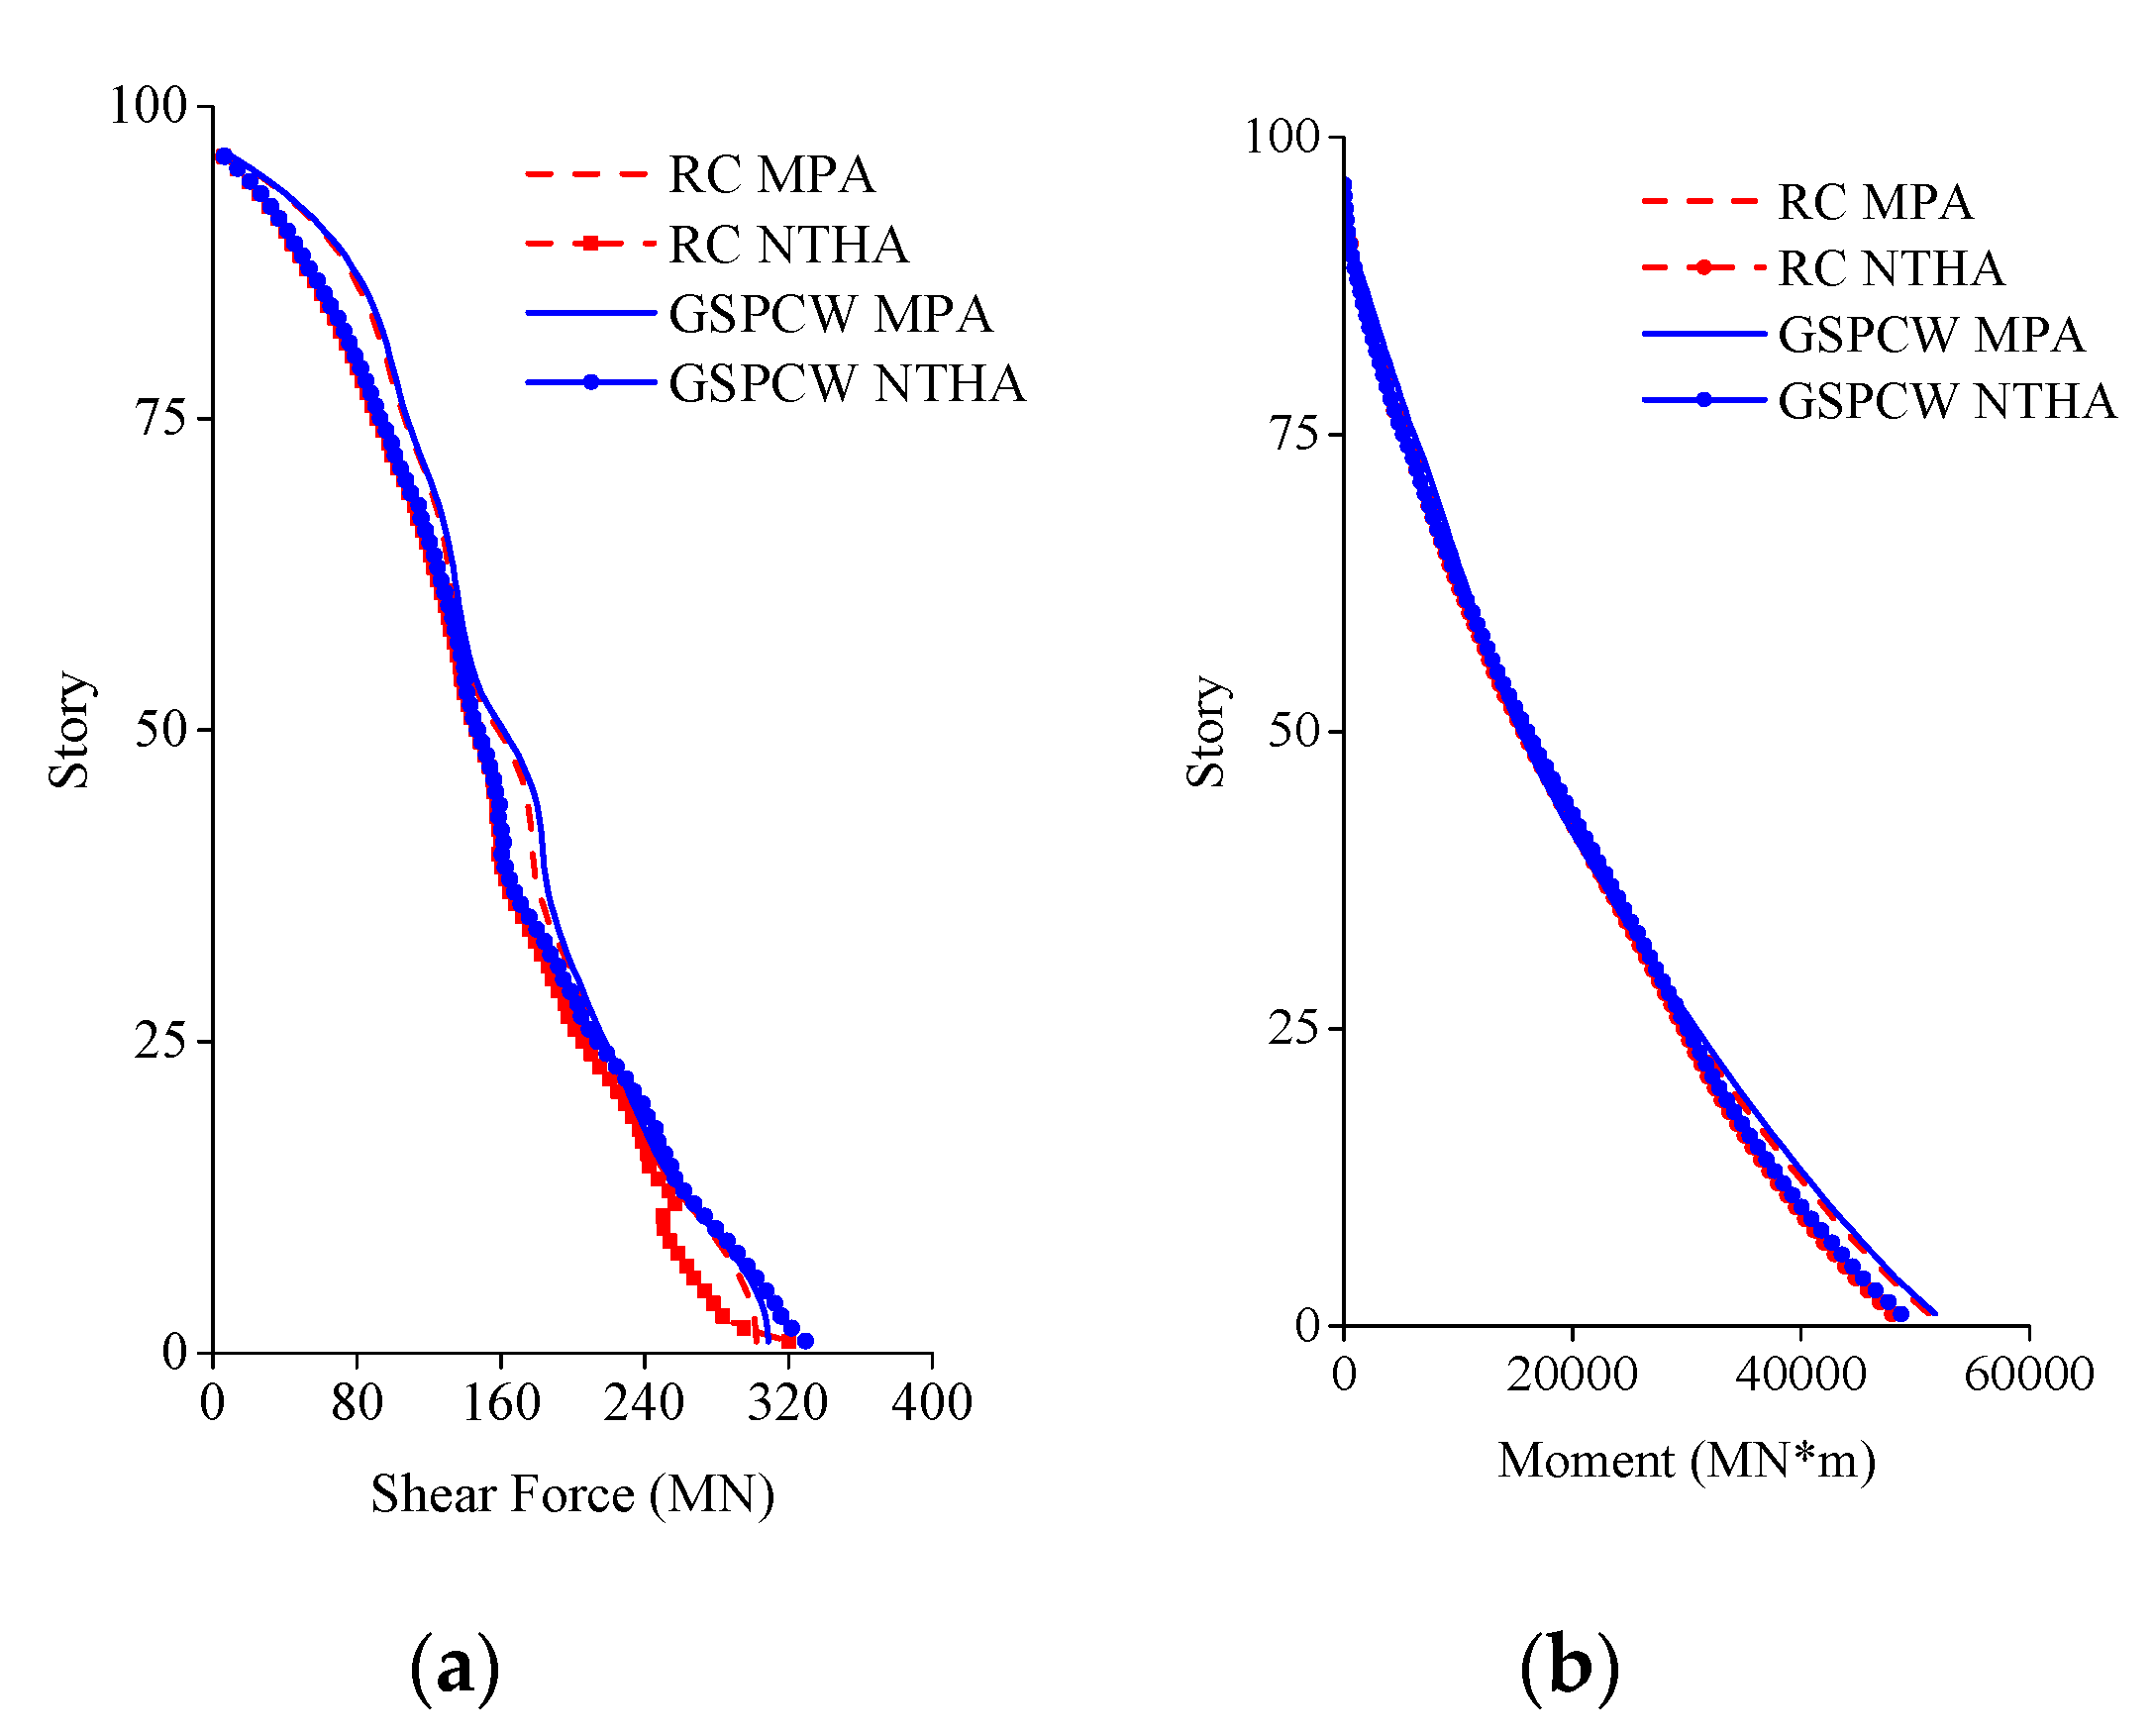
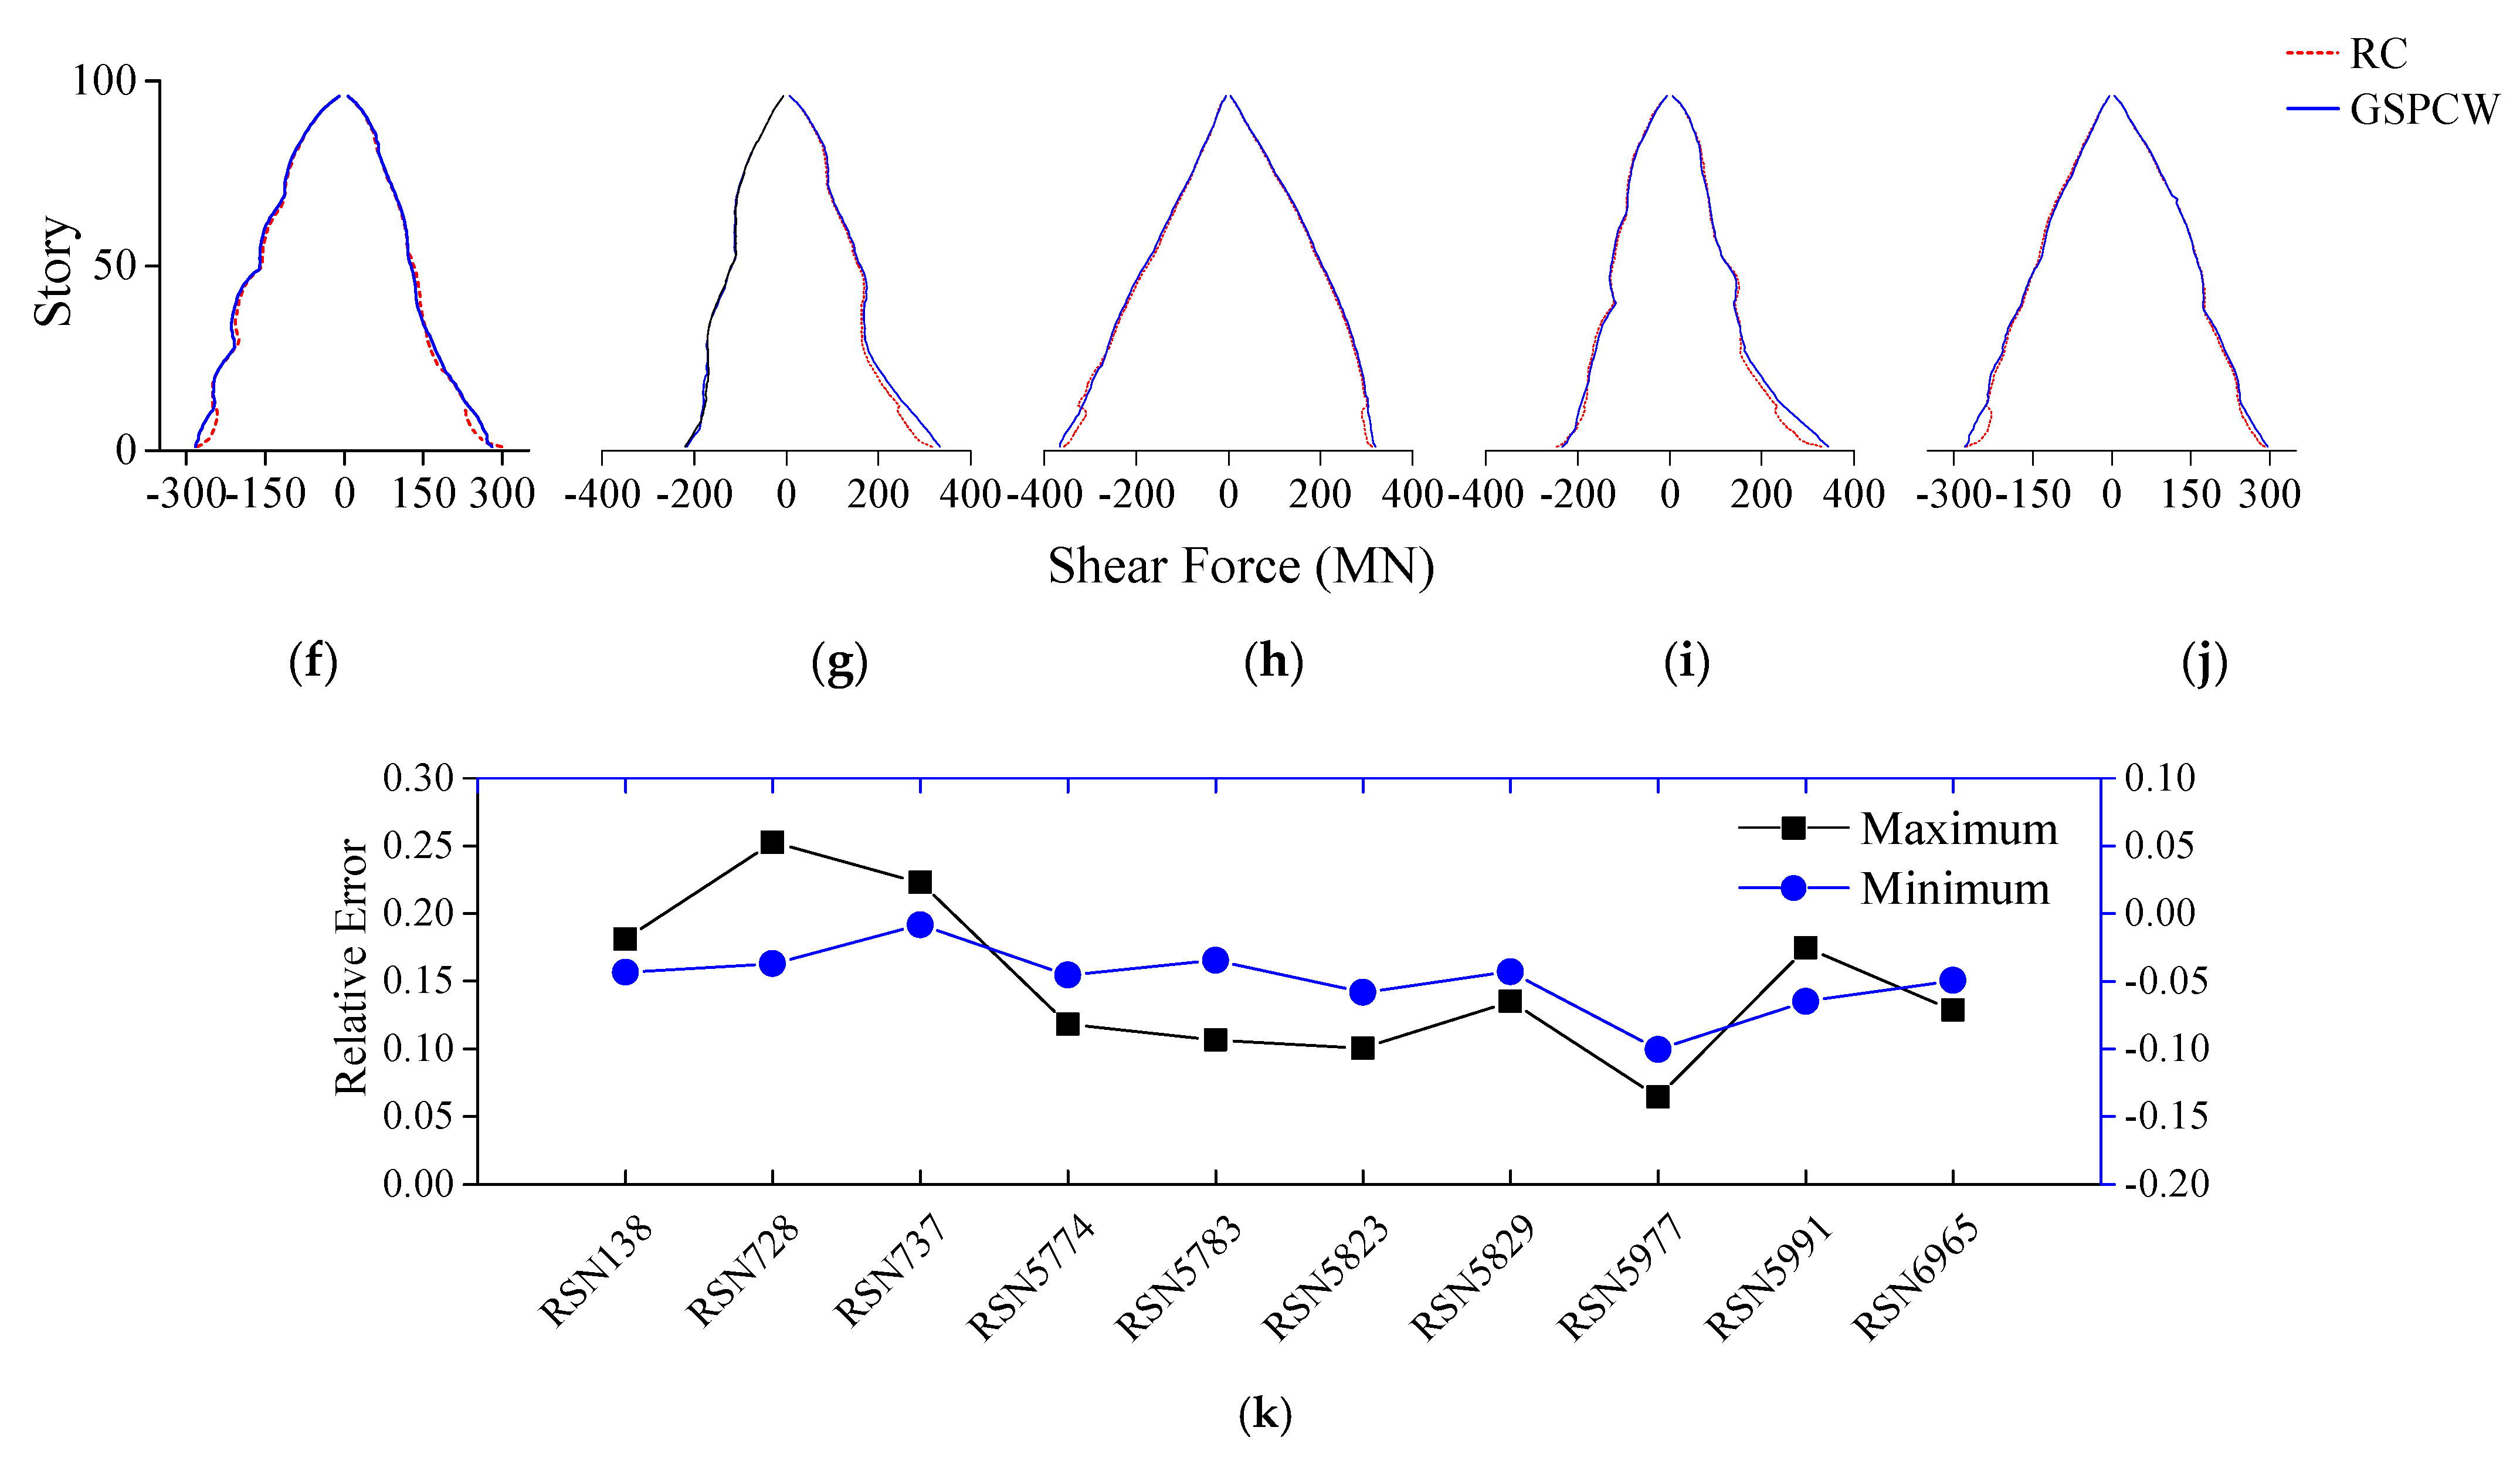
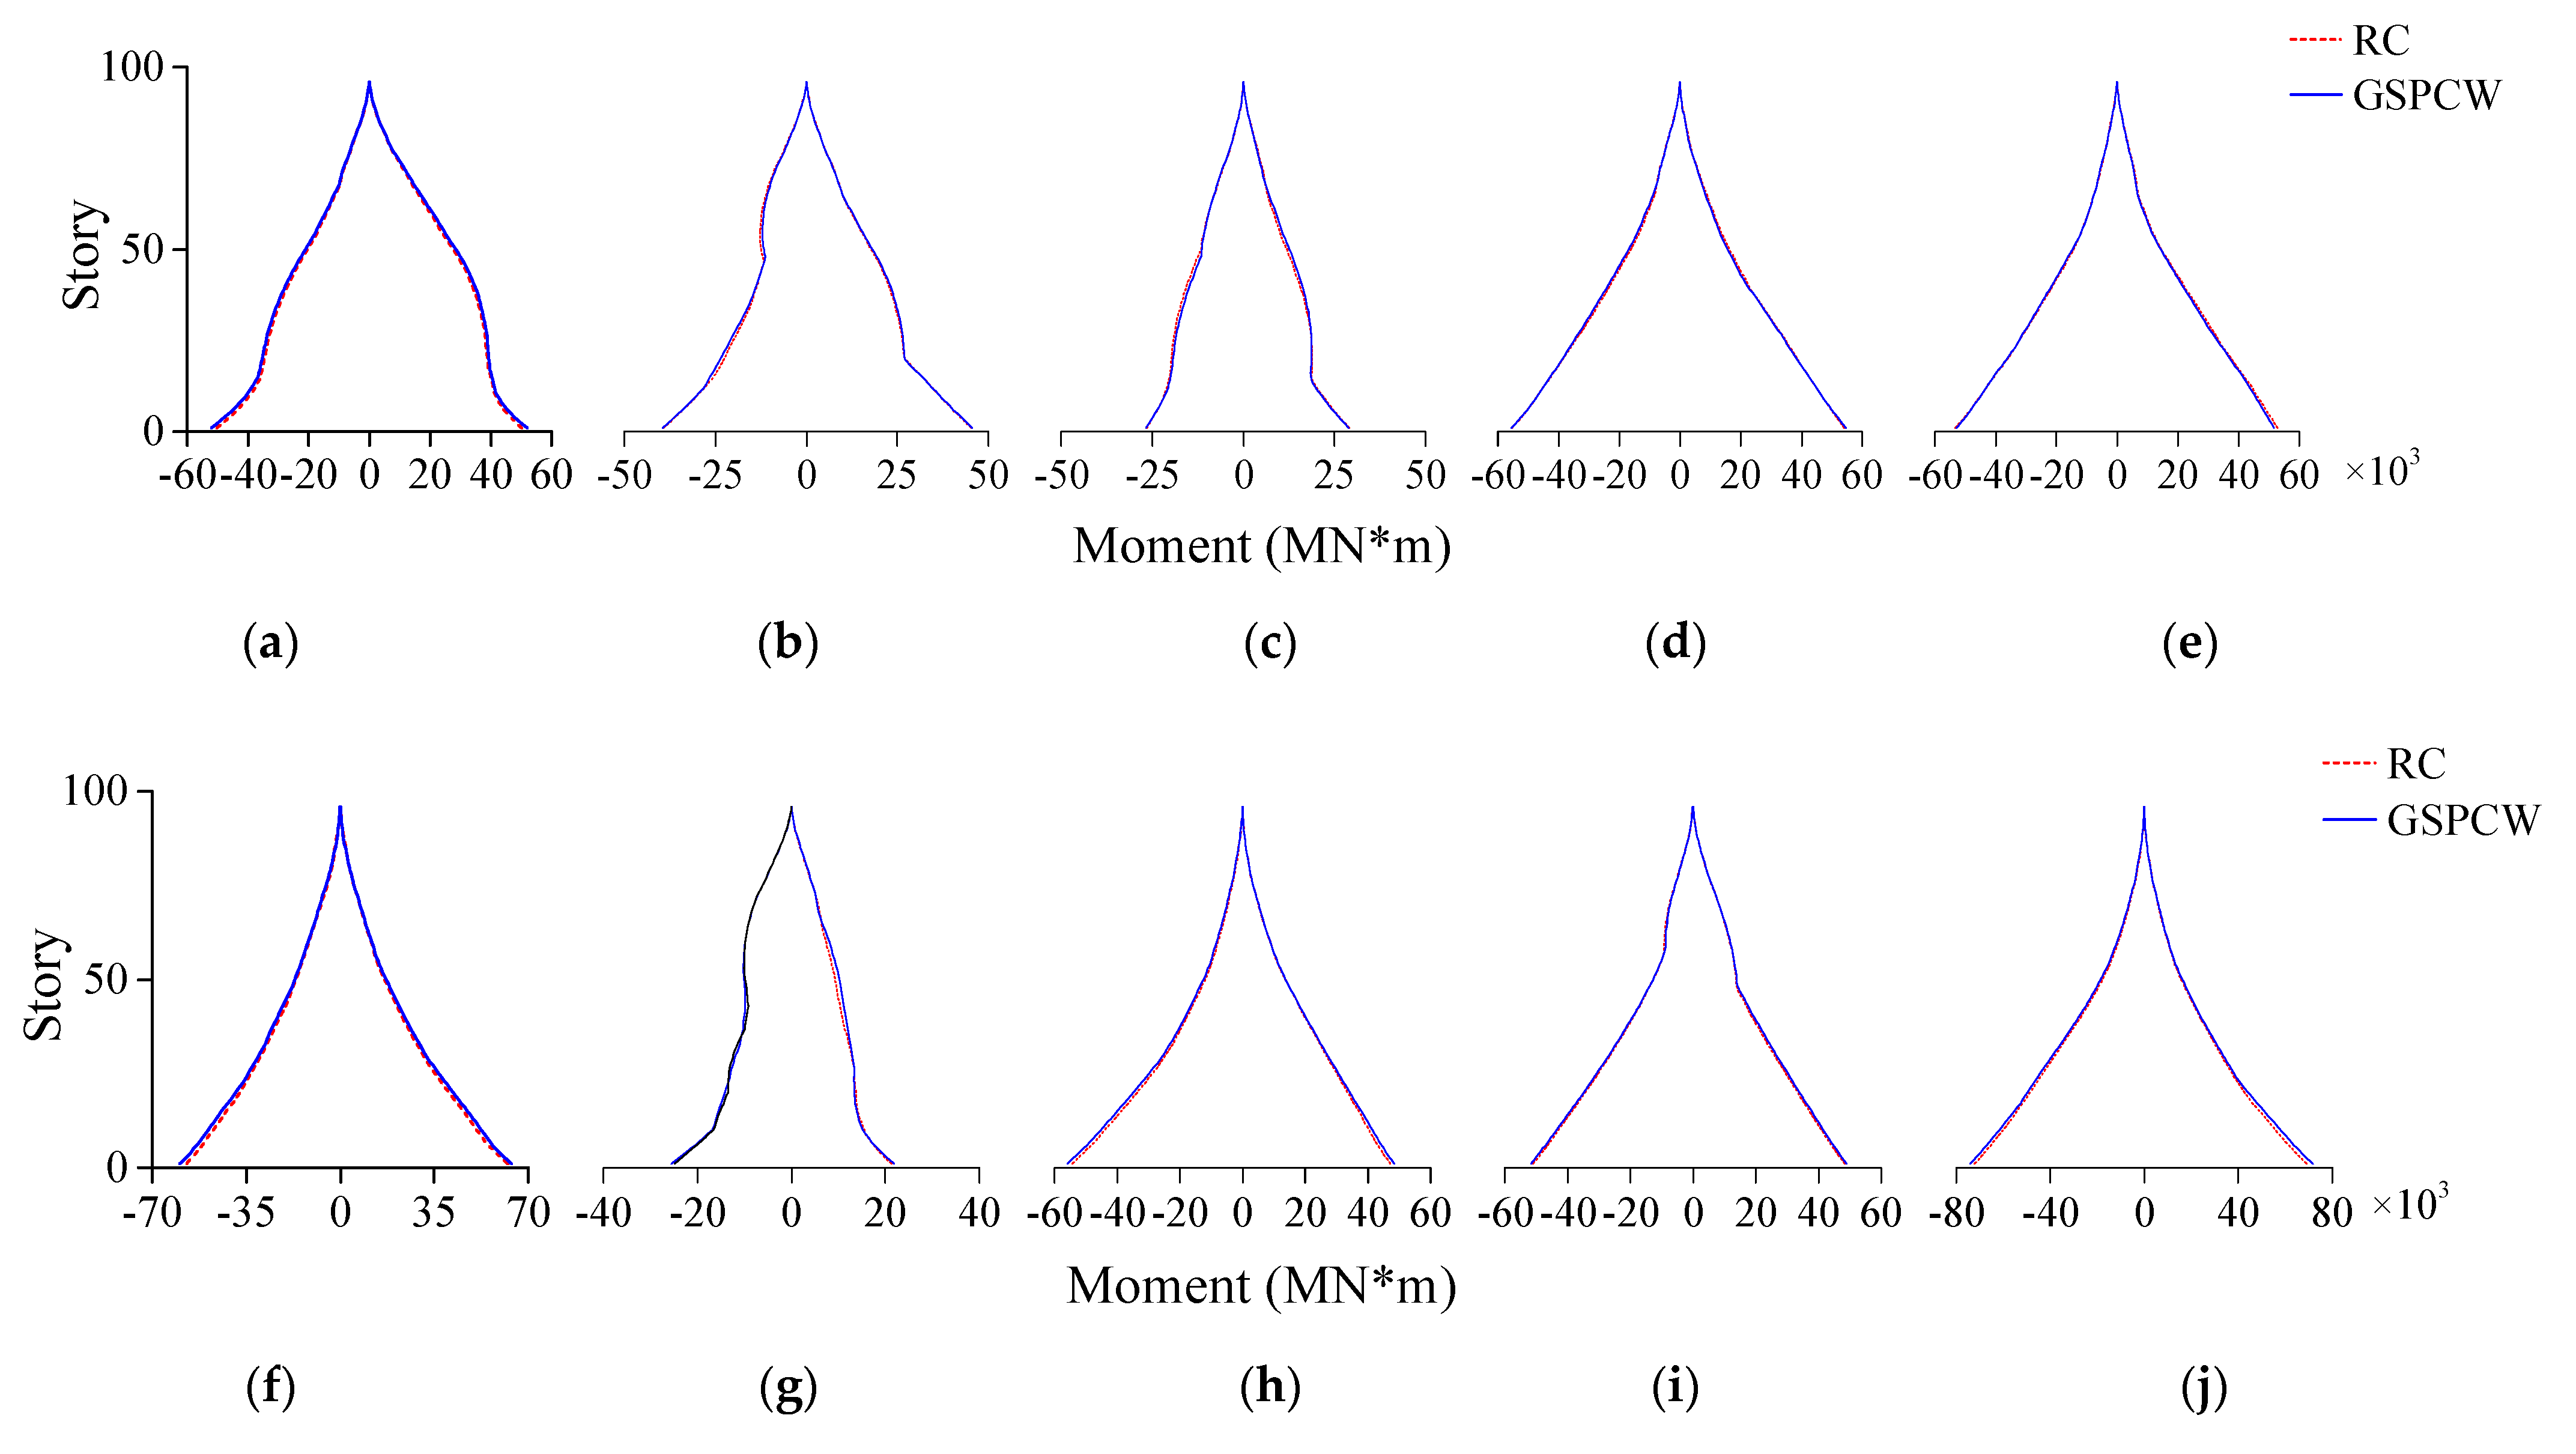
5.3. Story Shear Forces and Overturning Moments

Similarly, Figure 19 and Figure 20 show the results of story shear forces and story moments of the two building models obtained using NTHA. It can be clearly seen from these figures that the story shear force and the story moment responses at the bottom of the GSPCW building are generally higher than those of the RC building, which is due to the greater stiffness and higher capacity of the GSPCW walls.

6. Seismic Performance Assessment through Modal Pushover Analysis

6.1. Story Drifts and Peak Displacements

Figure 21 shows the story drift response and peak story response of the RC building model and the GSPCW building model along the building height obtained using both Model Pushover Analysis (MPA) and the average NTHA results. The MPA procedure analyzes structures using pushover analysis at several selected modes, and combines the modal responses using a certain combination rule to obtain the final response. Since this procedure is able to include higher mode responses, it is becoming more popular than conventional pushover analysis for the seismic performance assessment of high-rise buildings. In this study, the first five modes of the case-study building were selected for MPA analysis. Details of the theory and procedure for MPA are not addressed in this paper for simplicity.
From the comparison between the MPA and NTHA results, it can be confirmed that the structural response calculated on the basis of MPA with five modes was in very good agreements with the results obtained from NTHA, especially for stories below 60. Comparing the RC building model and the GSPCW building model, it can be found that the deformation response between the two models is almost identical, and the requirements in the specification are satisfied no matter which method is used.

6.2. Story Shear Forces and Overturning Moments

Figure 22 shows the story shear force and story moment results from MPA and compares the results from the average NTHA analysis. Similar to the response of the previous section, both the MPA results for story shear force and the story moments for the GSPCW and RC building models are in good agreement with the NTHA results, and the difference in the story force responses between the GSPCW and RC building models is also small.
These results from MPA verify that using five modal responses is enough to accurately determine the nonlinear response in the current study. However, the time consumed for MPA is much less than that required for NTHA, which definitely broadens the use of MPA in the analysis of super-high-rise buildings.

7. Economic Assessment

To further assess the economic performance of GSPCW walls, a simple economic evaluation of GSPCW for application in the selected super-high-rise building was performed. Note that this assessment was for the whole structure, including both the original structure and the parts of structure where the conventional RC core walls were replaced with GSPCW walls. Figure 23 and Table 8 present the results from this simple economic assessment. In the RC model and the GSPCW model, the proportions of concrete were 74.78% and 73.14%, respectively, while the proportions of steel were 25.22% and 26.86%, respectively. According to the statistical results, in terms of the GSPCW model versus the RC model, the amount of concrete was reduced by 1.64%, while the amount of steel was increased by 1.64%. In this regard, it can be seen that the overall increase in steel use was marginal when using GSPCW walls in the lower 1/3 of the building. Table 8 lists the material construction prices for each model (considering concrete to be 1100 JPY/ton and steel to be 12,000 JPY/ton). It shows that the material price for the GSPCW models is only increased by about 2.2% per unit area. However, due to the reduction in GSPCW wall thickness, the available architecture area of the GSPCW building increases by 1283.9 m2, which is almost a 3% increment over the original area. Therefore, the economy of GSPCW walls can still be considered to be reasonable.

8. Conclusions

This paper investigated the seismic performance of GSPCW walls from the component level to the structural level, performing (1) numerical and parametric analysis of GSPCW walls using FEM DIANA software, (2) nonlinear analysis of a super-high-rise building as a case study with the application of GSPCW walls through the NTHA and MPA procedure. The following key findings can be drawn from the study.
  • Parametric analysis results show that the steel ratio has a critical effect on the load capacity and stiffness of GSPCW walls, since steel plate is the only source of steel in GSPCW walls, and no additional reinforcement (e.g., reinforcing bars) is used. The height-to-width ratio has a critical influence on the failure mode of GSPCW walls. The axial load ratio has some influence on the ductility of GSPCW walls, i.e., the ductility decreases as the axial load ratio increases, which is especially evident when the axial load ratio is greater than 0.5. Based on the current study, it is suggested that the axial load ratio be kept below 0.5 in practice in order to maintain good ductility. The aspect ratio of the grille determines the constraining effect from the steel plate on the filled concrete, which should be considered during the design process. Concrete compressive strength has little to no effect on the seismic performance of GSPCW.
  • After replacing the ordinary reinforced concrete shear walls with GSPCW walls with wall thickness reduced by 30%, the GSPCW building was still able to control the overall deformation of the structures to a good extent, and the average deformation response from the analyses met the code requirements.
  • In this study, the MPA procedure using five modes was verified to be accurate enough to provide similar results to those obtained using the NTHA procedure for nonlinear analysis. However, the time required for MPA analysis is much less than that required for NTHA.
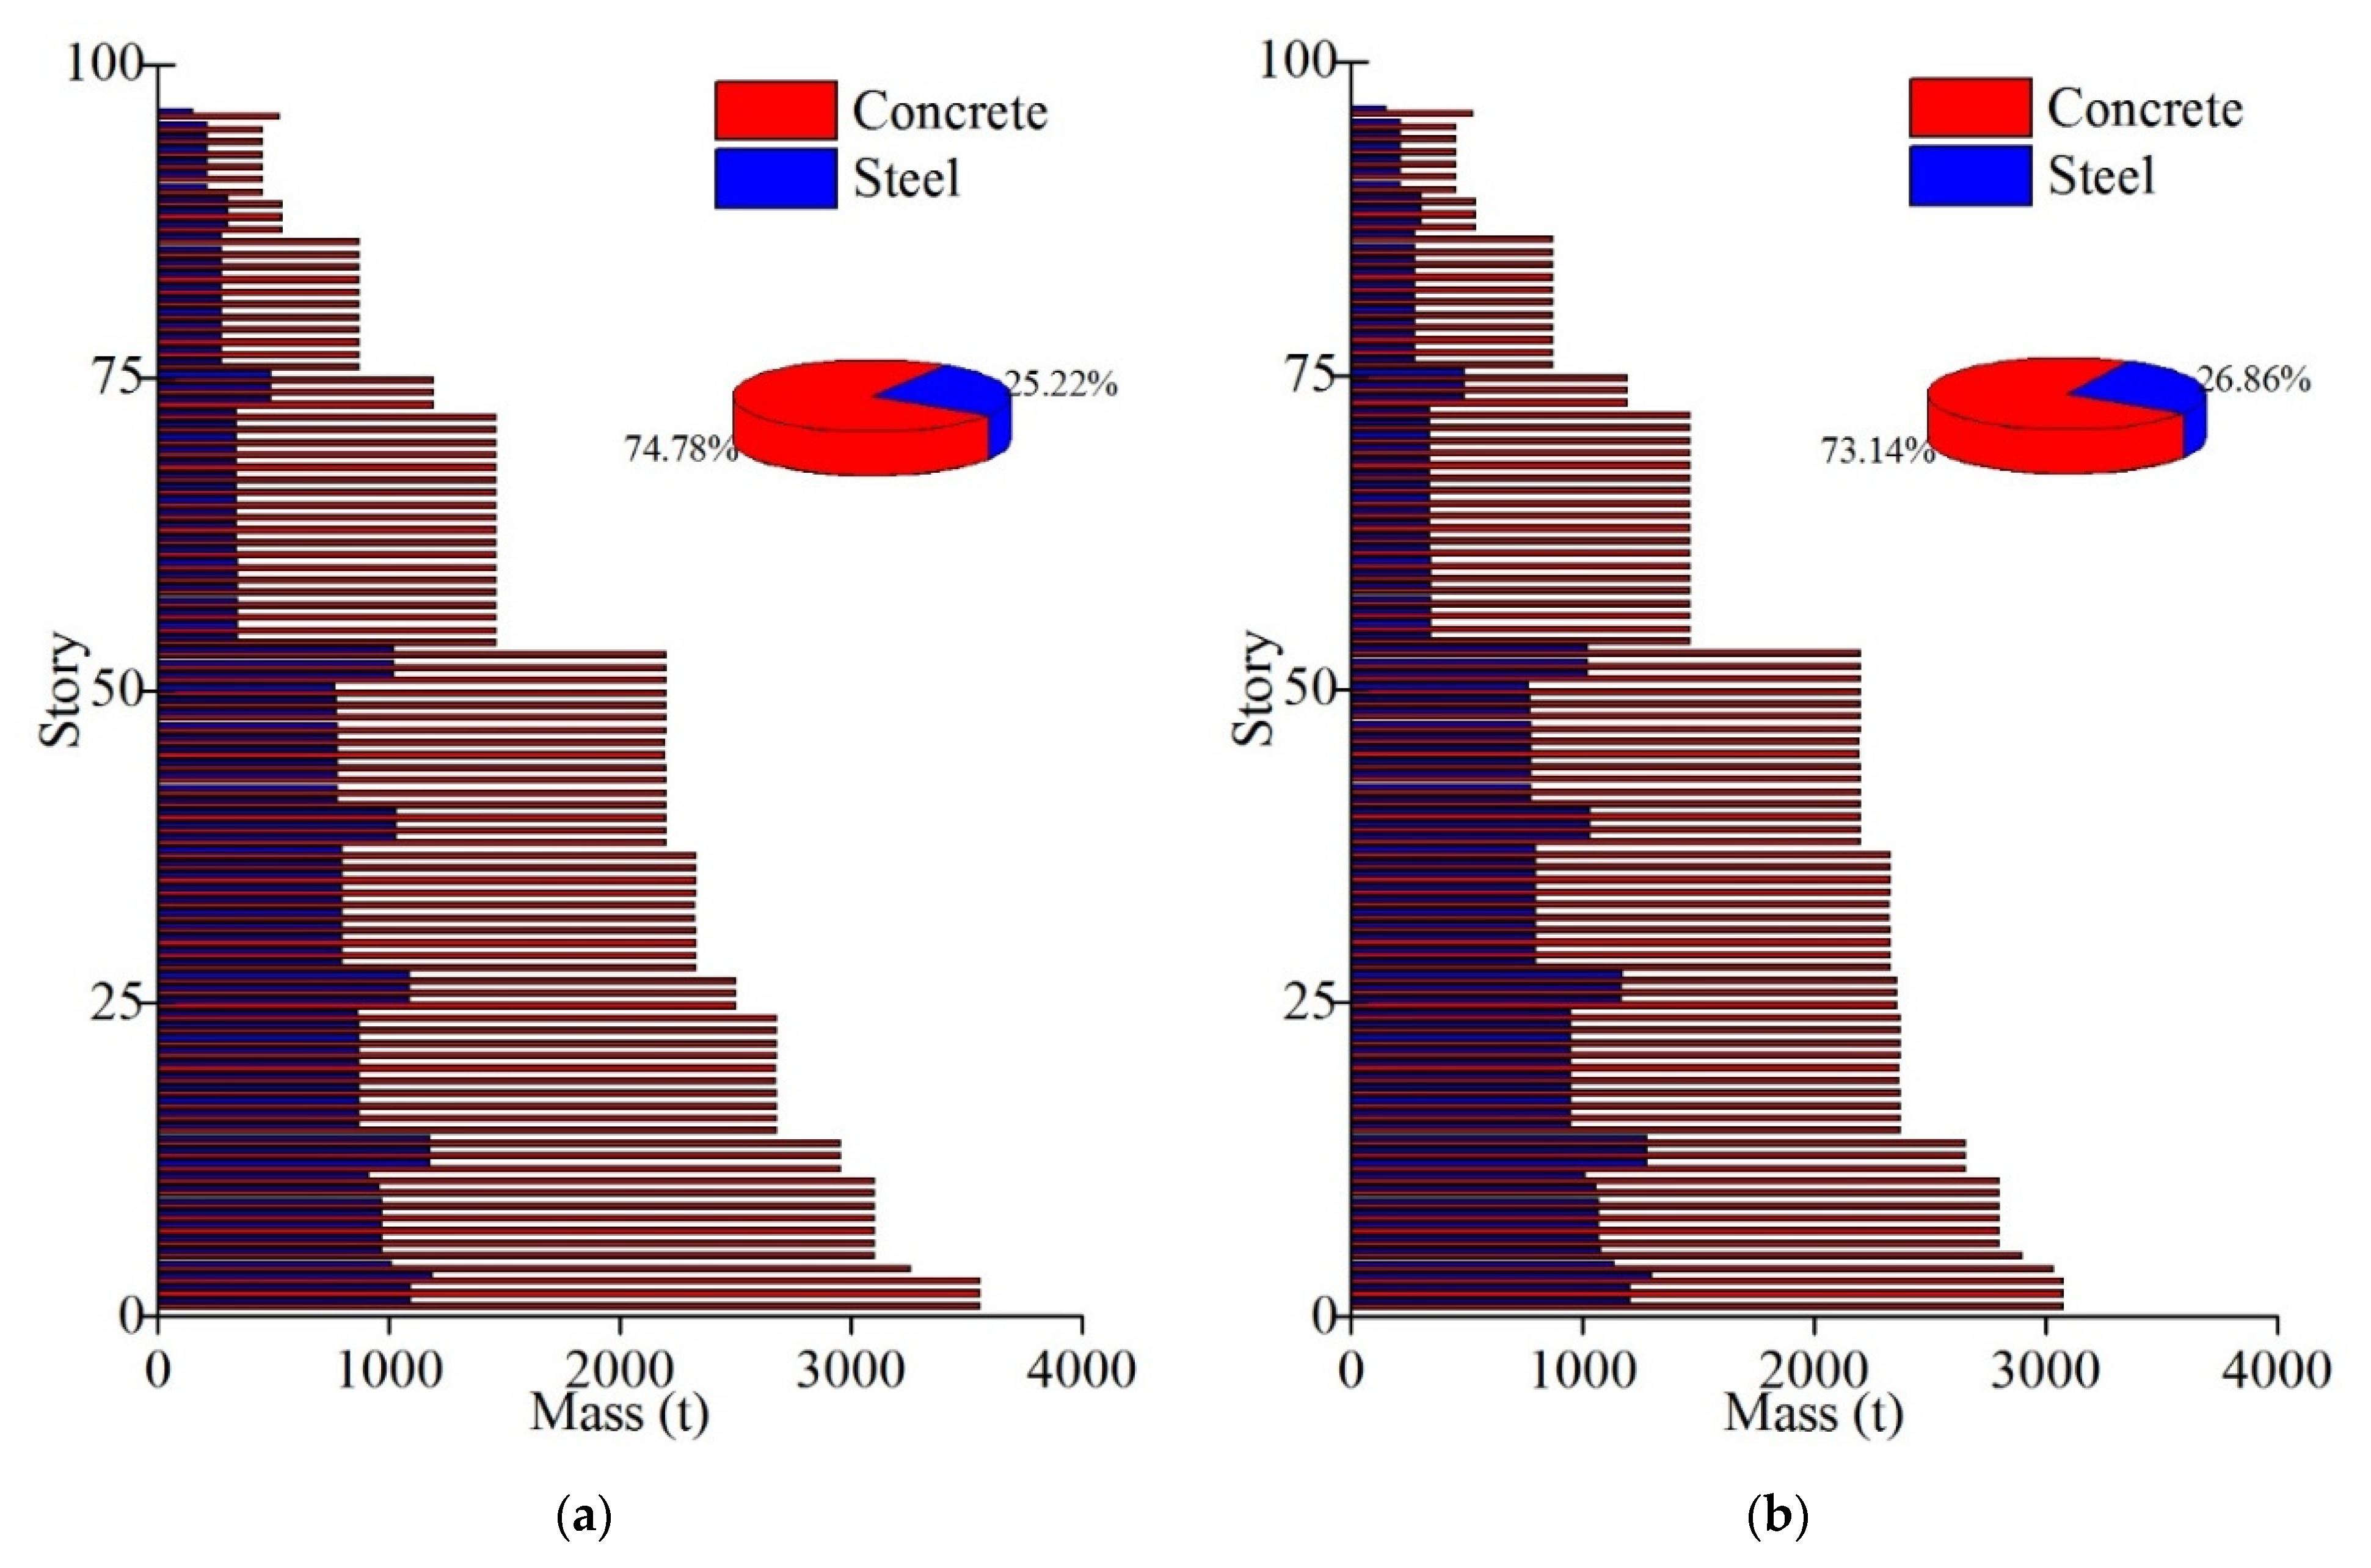
  • Based on a simple statistical analysis of the current case study, the amount of concrete consumed for the whole structure was decreased by 1.64% using the GSPCW model, while the steel consumption increased by 1.64%, which shows a marginal overall increase in steel consumption using GSPCW walls. Economic analysis shows the cost of materials for GSPCW models was only increased by about 2.2% per unit area. However, due to the reduction in the thickness of GSPCW walls, the available architecture area of GSPCW buildings is increased by almost 3% compared to the original area. Therefore, the economy of GSPCW walls can still be considered reasonable.

Author Contributions

Conceptualization, Y.L. (Yang Liu); Funding acquisition, H.W.; Investigation, H.W. and Q.Y.; Project administration, Y.L. (Yun Li); Resources, J.L.; Writing—original draft, H.W. and Q.Y.; Writing—review & editing, H.W. and L.L. All authors have read and agreed to the published version of the manuscript.

Funding

This research was funded by China Construction Seventh Engineering Division Corp., Ltd., grant number cscec7b-2019-Z-22.

Institutional Review Board Statement

Not applicable.

Informed Consent Statement

Not applicable.

Acknowledgments

This work was financially supported by a grant from the Science Research Development Program of China Construction Seventh Engineering Division Corp., Ltd. (Grant No. cscec7b-2019-Z-22), which is gratefully acknowledged by the authors. The authors also want to acknowledge professor Wenping Xu from Southeast University of China for his previous test work on GSPCW system, which makes the analytical work of this study possible.

Conflicts of Interest

The authors declare no conflict of interest.

References

  1. Nie, J.G.; Tao, M.X.; Fan, J.S.; Pu, F.M.; Hu, H.S.; Ma, X.W.; Li, S.Y.; Liu, F.J. Research advances of composite shear walls with double steel plates and filled concrete. J. Build. Struct. 2011, 41, 52–60. (In Chinese) [Google Scholar]
  2. Wang, W.; Wang, Y.; Lu, Z. Experimental study on seismic behavior of steel plate reinforced concrete composite shear wall. Eng. Struct. 2018, 160, 281–292. [Google Scholar] [CrossRef]
  3. Ozaki, M.; Akita, S.; Osuga, H.; Nakayama, T.; Adachi, N. Study on steel plate reinforced concrete panels subjected to cyclic in-plane shear. Nucl. Eng. Des. 2004, 228, 225–244. [Google Scholar] [CrossRef]
  4. Emori, K. Compressive and shear strength of concrete filled steel box wall. Int. J. Steel Struct. 2002, 2, 29–40. [Google Scholar]
  5. Link, R.A.; Elwi, A.E. Composite concrete-steel plate walls: Analysis and behavior. J. Struct. Eng. 1995, 121, 260–271. [Google Scholar] [CrossRef]
  6. Xu, W.P.; Xu, T. Seismic performance test of grille type double steel plate concrete composite shear wall. J. Archit. Civ. Eng. 2018, 35, 111–118. (In Chinese) [Google Scholar]
  7. Guo, X. Study on Seismic Behavior of Grid-Type Steel Tube-Concrete Composite Shear Walls. Master’s Thesis, Southeast University, Nanjing, China, 2016. (In Chinese). [Google Scholar]
  8. Xu, T. Experimental Study on Grille-Type Steel Plate Concrete Composite Shear Wall under Low Cyclic Loading. Master’s Thesis, Southeast University, Nanjing, China, 2017. (In Chinese). [Google Scholar]
  9. Ye, S. Study on Seismic Performance of Concrete Filled Steel Tube Frame-Grille Type Steel Plate Shear Wall Structure. Master’s Thesis, Southeast University, Nanjing, China, 2018. (In Chinese). [Google Scholar]
  10. Zhang, X.L.; Liu, Y.; Wang, T.; Xu, W.P. Anti-seismic test study on the grid-tube-type double steel plate and infilled concrete composite shear wall. IOP Conf. Ser. Earth Environ. Sci. 2021, 719, 022004. [Google Scholar] [CrossRef]
  11. DIANA. User’s Manual—DIANA Documentation Release 10.3; Version 10.3; DIANA FEA BV.: Delft, The Netherlands, 2019. [Google Scholar]
  12. Mander, J.B.; Prestley, M.J.; Park, R. Theoretical stress-strain model for confined concrete. Am. Soc. Civ. Eng. 1988, 114, 1804–1826. [Google Scholar] [CrossRef] [Green Version]
  13. Cai, J.; Sun, G. Constitutive relationship of concrete core confined by square steel tube. J. South China Univ. Technol. 2008, 36, 105–109. [Google Scholar]
  14. CEB-FIP Model 1990. In Model Code for Concrete Structures (1990): Chapter 2: Material Properties; International Federation for Structural Concrete: Lausanne, Switzerland, 1991.
  15. GB 50010-2010. In Code for Design of Concrete Structures; China Architecture & Building Press: Beijing, China, 2015. (In Chinese)
  16. GB 50017-2017. In Standard for Design of Steel Structures; China Architecture & Building Press: Beijing, China, 2017. (In Chinese)
  17. GB 50011-2010. In Code for Seismic Design of Buildings; China Architecture & Building Press: Beijing, China, 2016. (In Chinese)
  18. PERFORM-3D. In User Guide PERFORM-3DTM Nonlinear Analysis and Performance Assessment for 3D Structures; Version 7; Computers and Structures, Inc.: Berkeley, CA, USA, 2018.
  19. JGJ 138-2016. In Code for Design of Composite Structures; China Architecture & Building Press: Beijing, China, 2016. (In Chinese)
  20. JGJ 3-2010. In Technical Specification for Concrete Structures of Tall Building; China Architecture & Building Press: Beijing, China, 2010. (In Chinese)
  21. GB 50009-2012. In Load Code for the Design of Building Structures; China Architecture & Building Press: Beijing, China, 2012. (In Chinese)
  22. PERFORM-3D. In Components and Elements for PERFORM-3DTM; Version 7; Computers and Structures, Inc.: Berkeley, CA, USA, 2018.
  23. Zhang, C.Q. Study on the Key Issues of Seismic Performance of Super High-Rise Structures with New Type Energy Dissipation Outrigger Truss. Ph.D. Thesis, Tongji University, Shanghai, China, 2014. (In Chinese). [Google Scholar]
  24. FEMA 273. In NEHRP Guidelines for the Seismic Rehabilitation of Buildings; Federal Emergency Management Agency: Washington, DC, USA, 1997.
  25. FEMA 356. In Prestandard and Commentary for the Seismic Rehabilitation of Building; Federal Emergency Management Agency: Washington, DC, USA, 2000.
  26. Elwood, K.J.; Matamoros, A.B.; Wallace, J.W.; Lehman, D.E.; Heintz, J.A.; Mitchell, A.D.; Moore, M.A.; Valley, M.T.; Lowes, L.N.; Comartin, C.D.; et al. Update to ASCE/SEI 41 concrete provision. Earthq. Spectra 2007, 23, 493–523. [Google Scholar] [CrossRef] [Green Version]
Figure 1. Schematic of grille-type steel plate concrete composite shear walls (GSPCWs).
Applsci 11 07580 g001
Figure 2. Tested GSPCW walls (adapted from [9]): (a) cross-section; (b) front view; (c) side view; (d) photo.
Applsci 11 07580 g002aApplsci 11 07580 g002b
Figure 3. GSPCW wall models in DIANA: (a) model schematic; (b) meshed model with loading conditions and constraints.
Applsci 11 07580 g003
Figure 4. The constitutive relationship of concrete: (a) tension; (b) compression; (c) loading–unloading protocol.
Applsci 11 07580 g004
Figure 5. Comparison of experimental and simulation results: load–displacement hysteresis curves of specimen (a) GSPCW-1 and (b) GSPCW-2; secant stiffness degradation of specimen (c) GSPCW-1 and (d) GSPCW-2.
Applsci 11 07580 g005
Figure 6. Influence of steel ratio: (a) load–displacement hysteresis curves, and (b) skeleton curves.
Applsci 11 07580 g006
Figure 7. Influence of axial load ratio: (a) load–displacement hysteresis curves, and (b) skeleton curves.
Applsci 11 07580 g007
Figure 8. Influence of the height-to-width ratio: (a) load–displacement hysteresis curves, and (b) skeleton curves.
Applsci 11 07580 g008
Figure 9. Influence of the aspect ratio of grille-type steel plate: (a) load–displacement hysteresis curves, and (b) skeleton curves.
Applsci 11 07580 g009
Figure 10. Schematic diagram of the aspect ratio of grille-type steel plate.
Applsci 11 07580 g010
Figure 11. Influence of concrete compressive strength: (a) load–displacement hysteresis curves, and (b) skeleton curves.
Applsci 11 07580 g011
Figure 12. Typical floor plan layout of the case-study building (unit: mm).
Applsci 11 07580 g012
Figure 13. Plastic hinge beam–column element. (a) Schematic diagram, (b) moment–curvature relationship.
Applsci 11 07580 g013
Figure 14. Schematic of the case-study building model: (a) view of the bottom story; (b) three-dimensional view, (c) deformation shape of mode 1, (d) deformation shape of mode 2, (e) deformation shape of mode 3.
Applsci 11 07580 g014
Figure 15. Validation of PERFORM-3D models in comparison to experimental results: load–displacement hysteresis curves of specimens (a) GSPCW-1 and (b) GSPCW-2.
Applsci 11 07580 g015
Figure 16. Ground motion data.
Applsci 11 07580 g016
Figure 17. Comparison of story drift ratios of each ground motion between RC and GSPCW models: (a) RSN138; (b) RSN728; (c) RSN737; (d) RSN5774; (e) RSN5783; (f) RSN5823; (g) RSN5829; (h) RSN5977; (i) RSN5991; (j) RSN6965; (k) Relative error.
Applsci 11 07580 g017
Figure 18. Comparison of story displacement of each ground motion between RC and GSPCW models: (a) RSN138; (b) RSN728; (c) RSN737; (d) RSN5774; (e) RSN5783; (f) RSN5823; (g) RSN5829; (h) RSN5977; (i) RSN5991; (j) RSN6965; (k) Relative error.
Applsci 11 07580 g018aApplsci 11 07580 g018b
Figure 19. Comparison of story shear forces of each ground motion between RC and GSPCW models: (a) RSN138; (b) RSN728; (c) RSN737; (d) RSN5774; (e) RSN5783; (f) RSN5823; (g) RSN5829; (h) RSN5977; (i) RSN5991; (j) RSN6965; (k) Relative error.
Applsci 11 07580 g019aApplsci 11 07580 g019b
Figure 20. Comparison of story moments of each ground motion between RC and GSPCW models: (a) RSN138; (b) RSN728; (c) RSN737; (d) RSN5774; (e) RSN5783; (f) RSN5823; (g) RSN5829; (h) RSN5977; (i) RSN5991; (j) RSN6965; (k) Relative error.
Applsci 11 07580 g020aApplsci 11 07580 g020b
Figure 21. Comparison of story deformation between the RC and GSPCW models: (a) story drift ratios; (b) peak story displacements.
Applsci 11 07580 g021
Figure 22. Comparison of story force between the RC and GSPCW models: (a) story shear forces; (b) story overturning moments.
Applsci 11 07580 g022
Figure 23. Comparison of material consumption: (a) RC models; (b) GSPCW models.
Applsci 11 07580 g023
Table 1. Design parameters for the wall specimens [9].
Wall IDWall Dimension
W × T *
(mm × mm)
Steel Plate Thickness
(mm)
Steel Channel
(mm × mm × mm)
Axial Load RatioConcrete Strength
(MPa)
Steel Plate Strength
(MPa)
GSPCW-11400 × 1604[16 (160 × 64 × 5)0.126.6263.2
GSPCW-21400 × 1604[16 (160 × 64 × 5)0.426.6263.2
Note: * W is wall width, and T is wall thickness.
Table 2. Comparison of characteristic points of skeleton curves.
Wall ID Loading DirectionFy
(kN)
Dy
(mm)
Fp
(kN)
Dp
(mm)
Du
(mm)
GSPCW-1Testpositive803.4710.941079.5452.9092.60
negative840.5913.10930.0055.4091.90
Modelpositive898.697.751078.7020.0075.57
negative890.347.521060.0020.0091.00
GSPCW-2Testpositive931.244.811223.1126.6466.80
negative885.277.551070.0026.4060.04
Modelpositive1019.347.921190.0013.0040.07
negative1002.537.901180.0014.0035.73
Notes: Fy and Fp are the lateral force capacity of specimens at the yield and peak point, respectively; Dy, Dp and Du are the lateral displacement at the loading point of the specimens at the yield point, peak point and ultimate point, respectively; and the ultimate point is the point at which the bearing capacity decreases to 85% that of the peak point.
Table 3. Parameter variations for numerical parametric analyses.
Wall IDWall Dimension
W × T *
(mm × mm)
Height
(mm)
Height-to-Width RatioConcrete GradeAspect Ratio of Grille Steel PlateAxial Load RatioSteel Plate ThicknessSteel Ratio
GSPCW1-11400 × 16028002.0C401.250.337.2%
GSPCW1-21400 × 16028002.0C401.250.348.9%
GSPCW1-31400 × 16028002.0C401.250.3510.5%
GSPCW1-41400 × 16028002.0C401.250.3612.1%
GSPCW2-1 same as GSPCW1-2
GSPCW2-21400 × 16028002.0C401.250.448.9%
GSPCW2-31400 × 16028002.0C401.250.548.9%
GSPCW2-41400 × 16028002.0C401.250.648.9%
GSPCW2-51400 × 16028002.0C401.250.748.9%
GSPCW3-11400 × 16021001.5C401.250.348.9%
GSPCW3-2 same as GSPCW1-2
GSPCW3-31400 × 16035002.5C401.250.348.9%
GSPCW3-41400 × 16042003.0C401.250.348.9%
GSPCW3-51400 × 16049003.5C401.250.348.9%
GSPCW4-11400 × 16028002.0C401.750.348.3%
GSPCW4-21400 × 16028002.0C401.460.348.6%
GSPCW4-3 same as GSPCW1-2
GSPCW4-41400 × 16028002.0C401.090.349.1%
GSPCW5-11400 × 16028002.0C301.250.348.9%
GSPCW5-2 same as GSPCW1-2
GSPCW5-31400 × 16028002.0C501.250.348.9%
GSPCW5-41400 × 16028002.0C601.250.348.9%
Note: * W is wall width, and T is wall thickness.
Table 4. Member size of horizontal components (unit: mm).
StoryKL1KL2KL3LL1LL2L1L2
1~41000 × 300 × 28 × 40900 × 300 × 25 × 401000 × 12002000 × 2000 + 1200 × 1200 × 50 × 50800 × 1000300 × 700200 × 350
5~111800 × 2000 + 1200 × 1200 × 50 × 50
12~14600 × 800
15~241560 × 1000 + 800 × 800 × 45 × 45
25~271320 × 1000 + 800 × 800 × 45 × 45
28~371080 × 1000 + 800 × 400 × 50 × 55
38~531080 × 1000400 × 800
54~72800 × 1000800 × 1000
73~75650 × 300 × 14 × 30600 × 800
76~86900 × 300 × 25 × 40300 × 600
87~95700 × 300 × 16 × 30650 × 300 × 14 × 30300 × 600
96300 × 700
Notes: (1) The notation of section size of I-beam is height × width × thickness of web × thickness of flange. (2) The notation of section size of steel reinforcement concrete beam is section size of full section + section size of I-beam.
Table 5. Member size of vertical components (unit: mm).
StoryZ1Z2Z3Inner WallExterior WallTrussBrace
1~42000 × 2000 × 70 × 702000 × 3500 × 70 × 702000 × 3500 × 70 × 808002000 (1350)-800 × 800 × 55 × 55
5~111800 (1350)
12~14600700 × 700 × 50 × 50-
15~241560 (1100)-1000 × 1000 × 60 × 60
25~271320 (1100)700 × 700 × 50 × 50-
28~371080 (-)-1000 × 1000 × 60 × 60
38~40400700 × 700 × 50 × 50-
41~50-1000 × 1000 × 60 × 60
51~53700 × 700 × 50 × 50-
54~721500 × 15001500 × 20001500 × 3000800 (-)-1000 × 1000 × 60 × 60
73~751200 × 12001200 × 16001200 × 2000600 (-)700 × 700 × 50 × 50
500 × 500 × 30 × 30
-
76~861000 × 10001000 × 12001000 × 1800300600 (-)-700 × 700 × 50 × 50
87~89500 × 500500 × 800650 × 1000300 (-)500 × 500 × 30 × 30-
90~95-700 × 700 × 50 × 50
96-
Notes: (1) The notation of section size of CFT column is height × width × thickness of steel plate in height direction × thickness of steel plate in width direction. (2) The rectangular steel tube is used for truss and brace, and the notation of section size is height × width × thickness of steel plate in height direction × thickness of steel plate in width direction. (3) The thickness of exterior wall for GSPCW model is in brackets, and (-) means the walls are not replaced by GSPCW walls.
Table 6. Comparison of the dynamic characteristics between the RC and GSPCW building models.
No.DirectionRC ModelGSPCW ModelError of Periods
Periods (s)Angle (deg)Effective Modal MassPeriods (s)Angle (deg)Effective Modal Mass
EXEYEXEY
1Y6.04789.900.00%56.85%6.11789.840.00%57.64%1.15%
2X5.967179.9056.53%0.00%6.039179.8057.32%0.00%1.20%
3T2.25390.000.00%0.00%2.37049.370.00%0.00%5.19%
4Y1.67889.980.00%19.87%1.71789.970.00%20.55%2.33%
5X1.612180.0020.33%0.00%1.652180.0020.98%0.00%2.48%
6T0.88389.270.00%0.01%0.91986.830.00%0.00%4.02%
7Y0.87590.010.00%7.30%0.89590.010.00%7.35%2.30%
8X0.8110.017.47%0.00%0.8310.017.52%0.00%2.56%
9Y0.59290.000.00%3.98%0.60690.010.00%3.88%2.20%
10T0.54283.240.00%0.00%0.56385.110.00%0.00%3.84%
Table 7. Ground motion information.
No.StationEventArias Intensity (m/s)YearDuration (s)
RSN138BoshrooyehTabas Iran0.3197835
RSN728Westmorland Fire StationSuperstition Hills-021.2198760
RSN737Agnews State HospitalLoma Prieta0.5198960
RSN5774Nakashinden TownIwate Japan1.0200860
RSN5783Semine Kurihara CityIwate Japan0.82008120
RSN5823ChihuahuaEl Mayor-Cucapah Mexico2.32010130
RSN5829RIITOEl Mayor-Cucapah Mexico4.72010130
RSN5977ChihuahuaEl Mayor-Cucapah Mexico0.02010105
RSN5991El Centro Array #10El Mayor-Cucapah Mexico3.62010275
RSN6965SBRCDarfield_ New Zealand0.7201064
Table 8. Statistics of material mass and available area.
RC ModelGSPCW Model
Total Area (m2)Mass of Concrete (t)Mass of Steel (t)Price (JPY/m2)Available Area (m2)Mass of Concrete (t)Mass of Steel (t)Price (JPY/m2)Available Area (m2)
Total181,660.8182,892.761,696.35182.945,754.7174,796.864,181.85298.147,038.6
Publisher’s Note: MDPI stays neutral with regard to jurisdictional claims in published maps and institutional affiliations.

