
Influence of Infill Patterns Generated by CAD and FDM 3D Printer on Surface Roughness and Tensile Strength Properties

 , ,
, ,  ,
,  ,
, 
Abstract
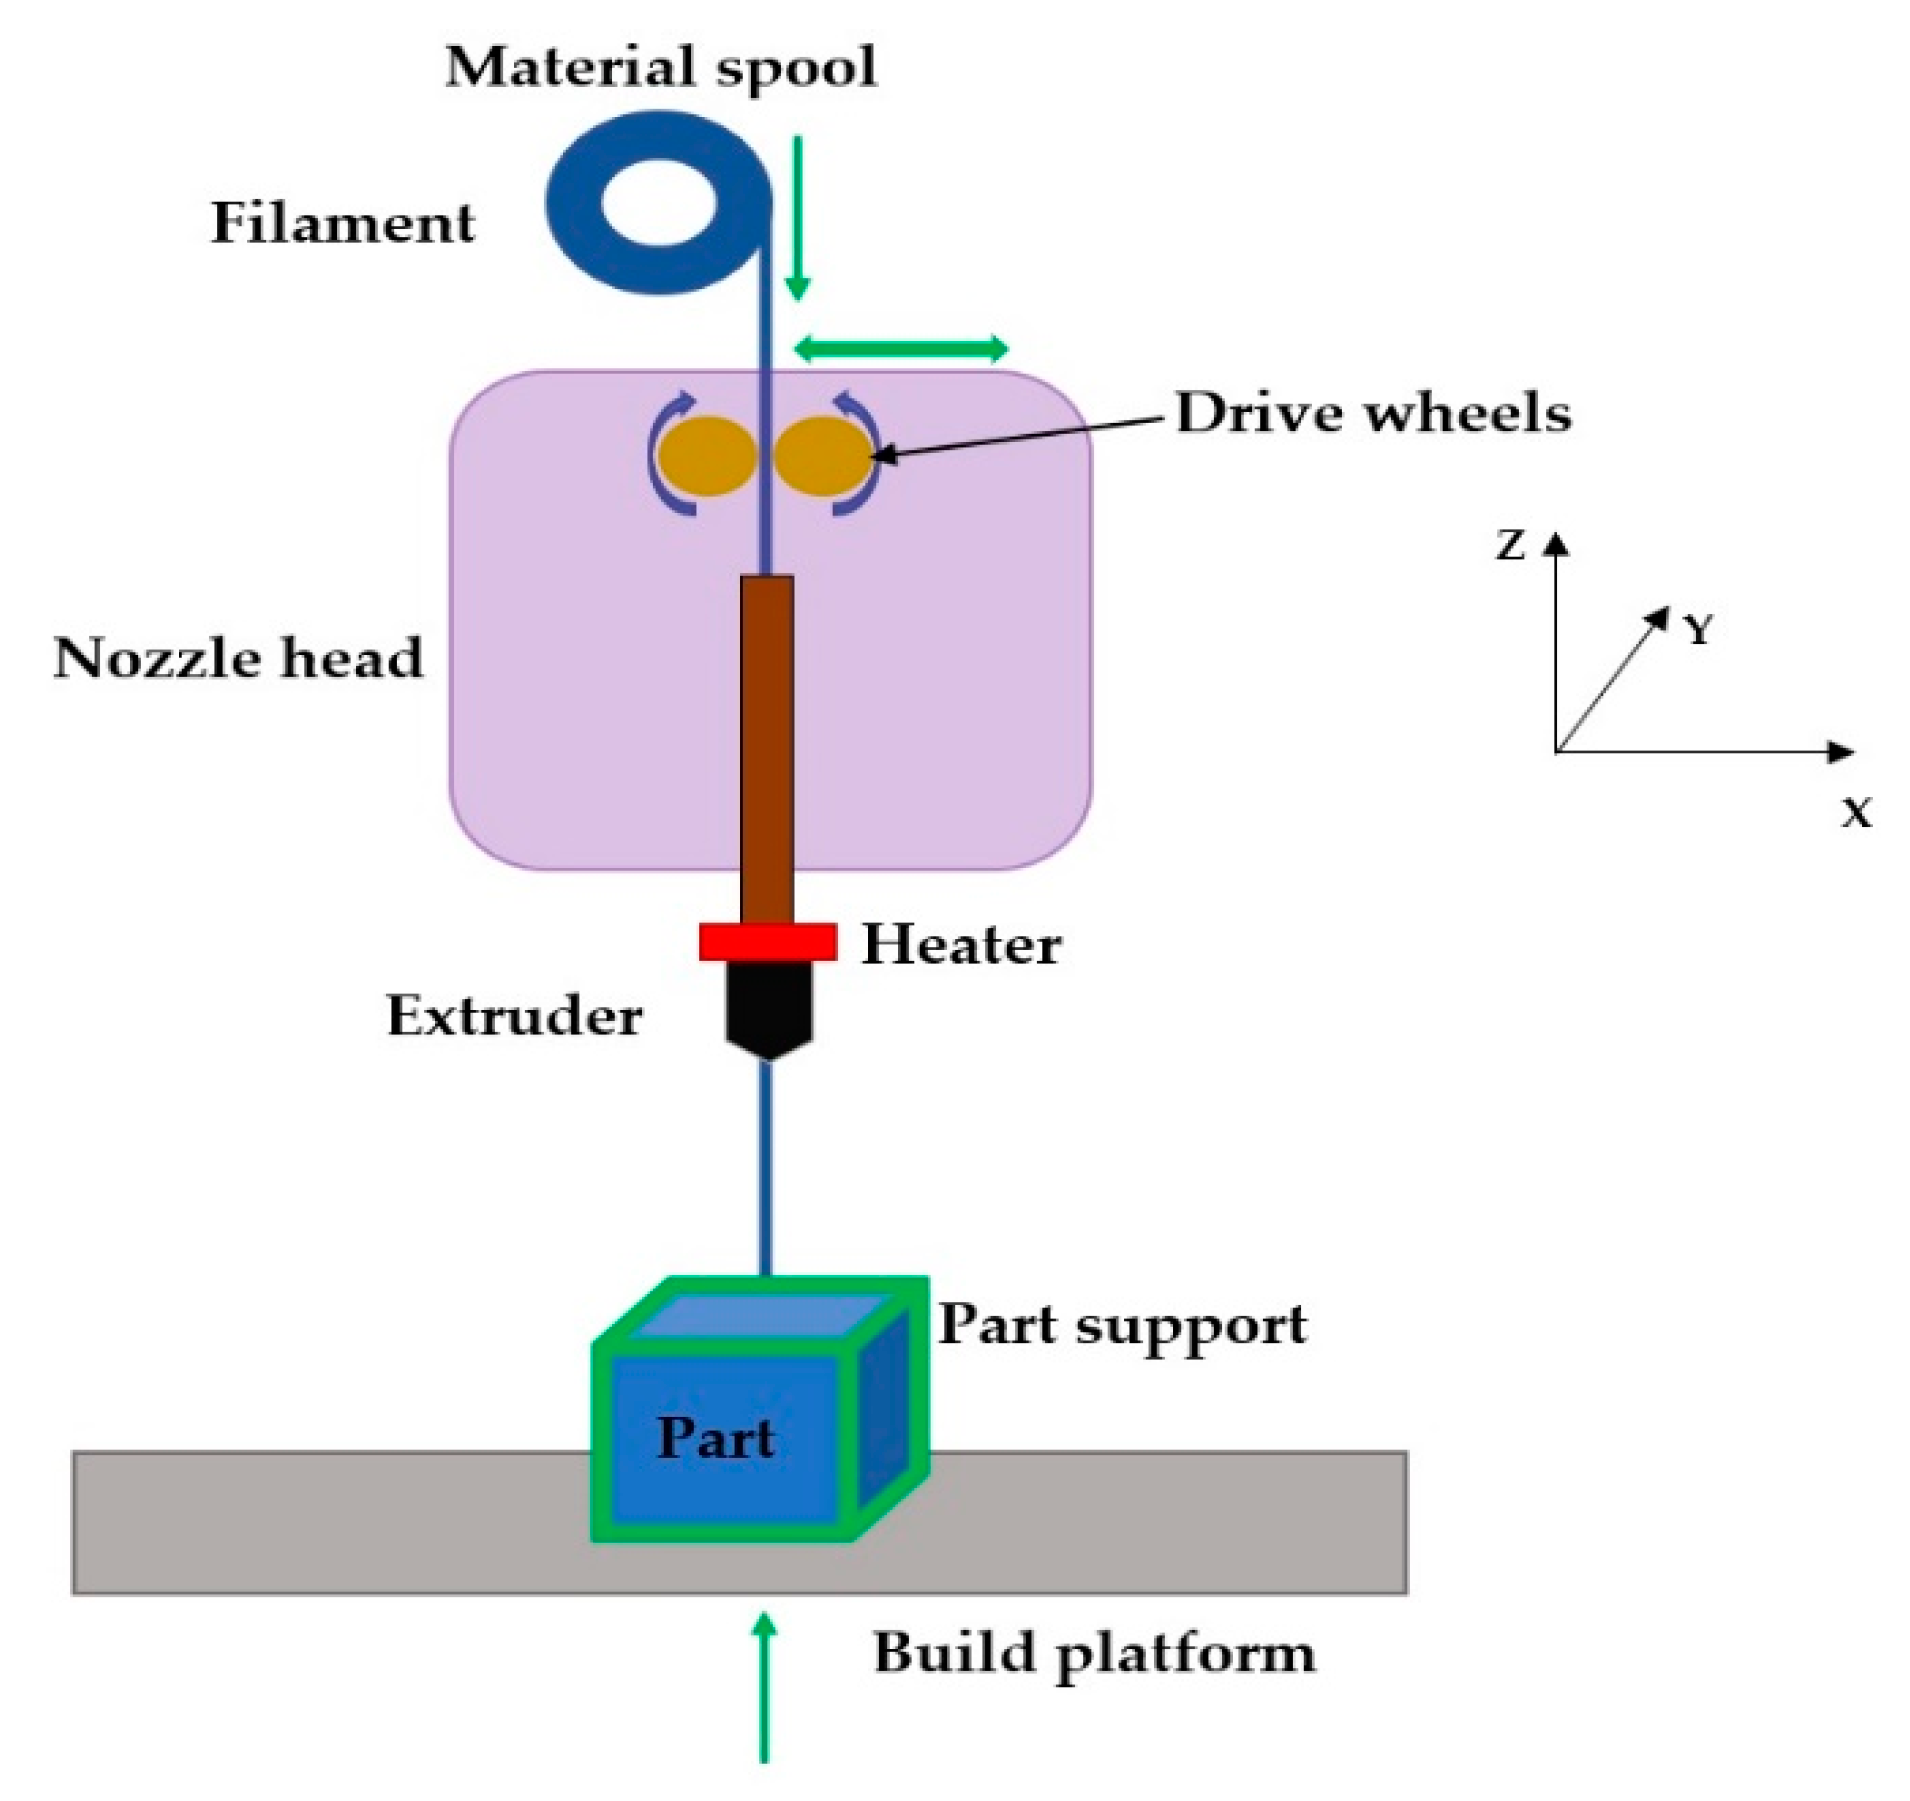
:1. Introduction
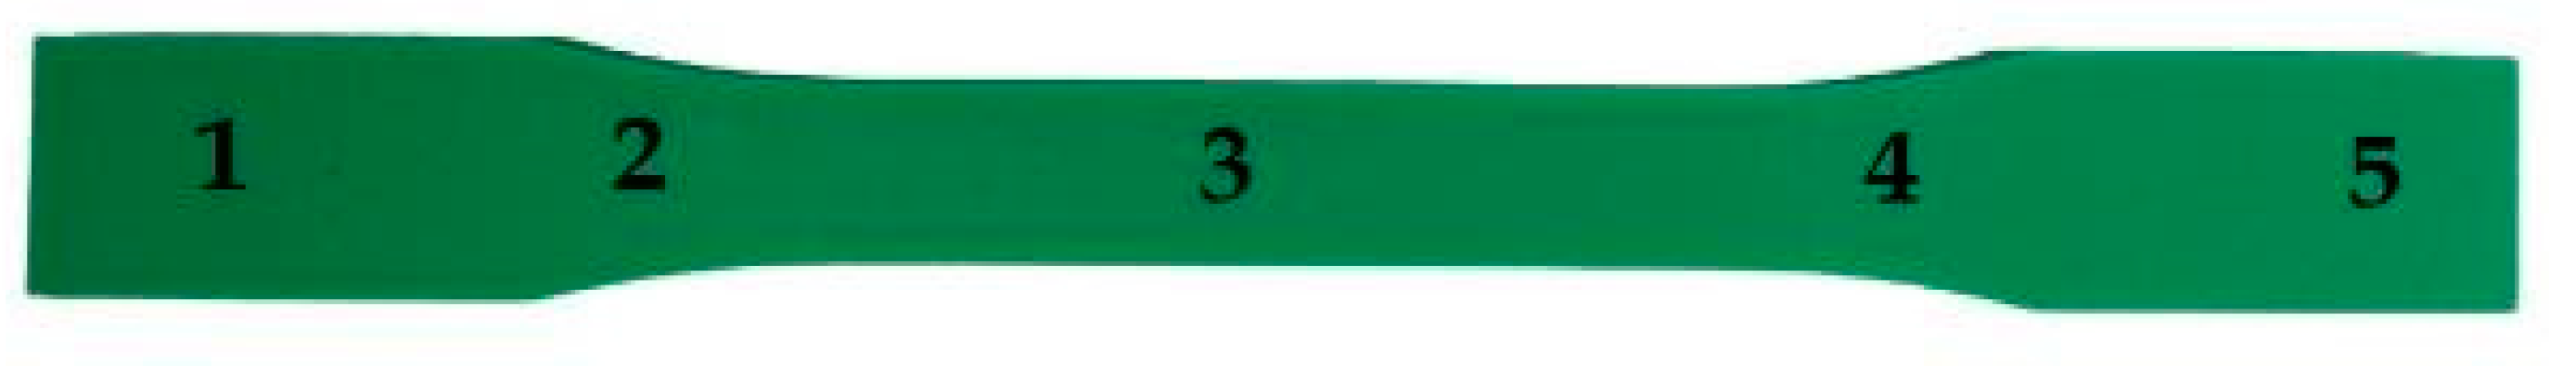
2. Materials and Methods
3. Results and Discussion
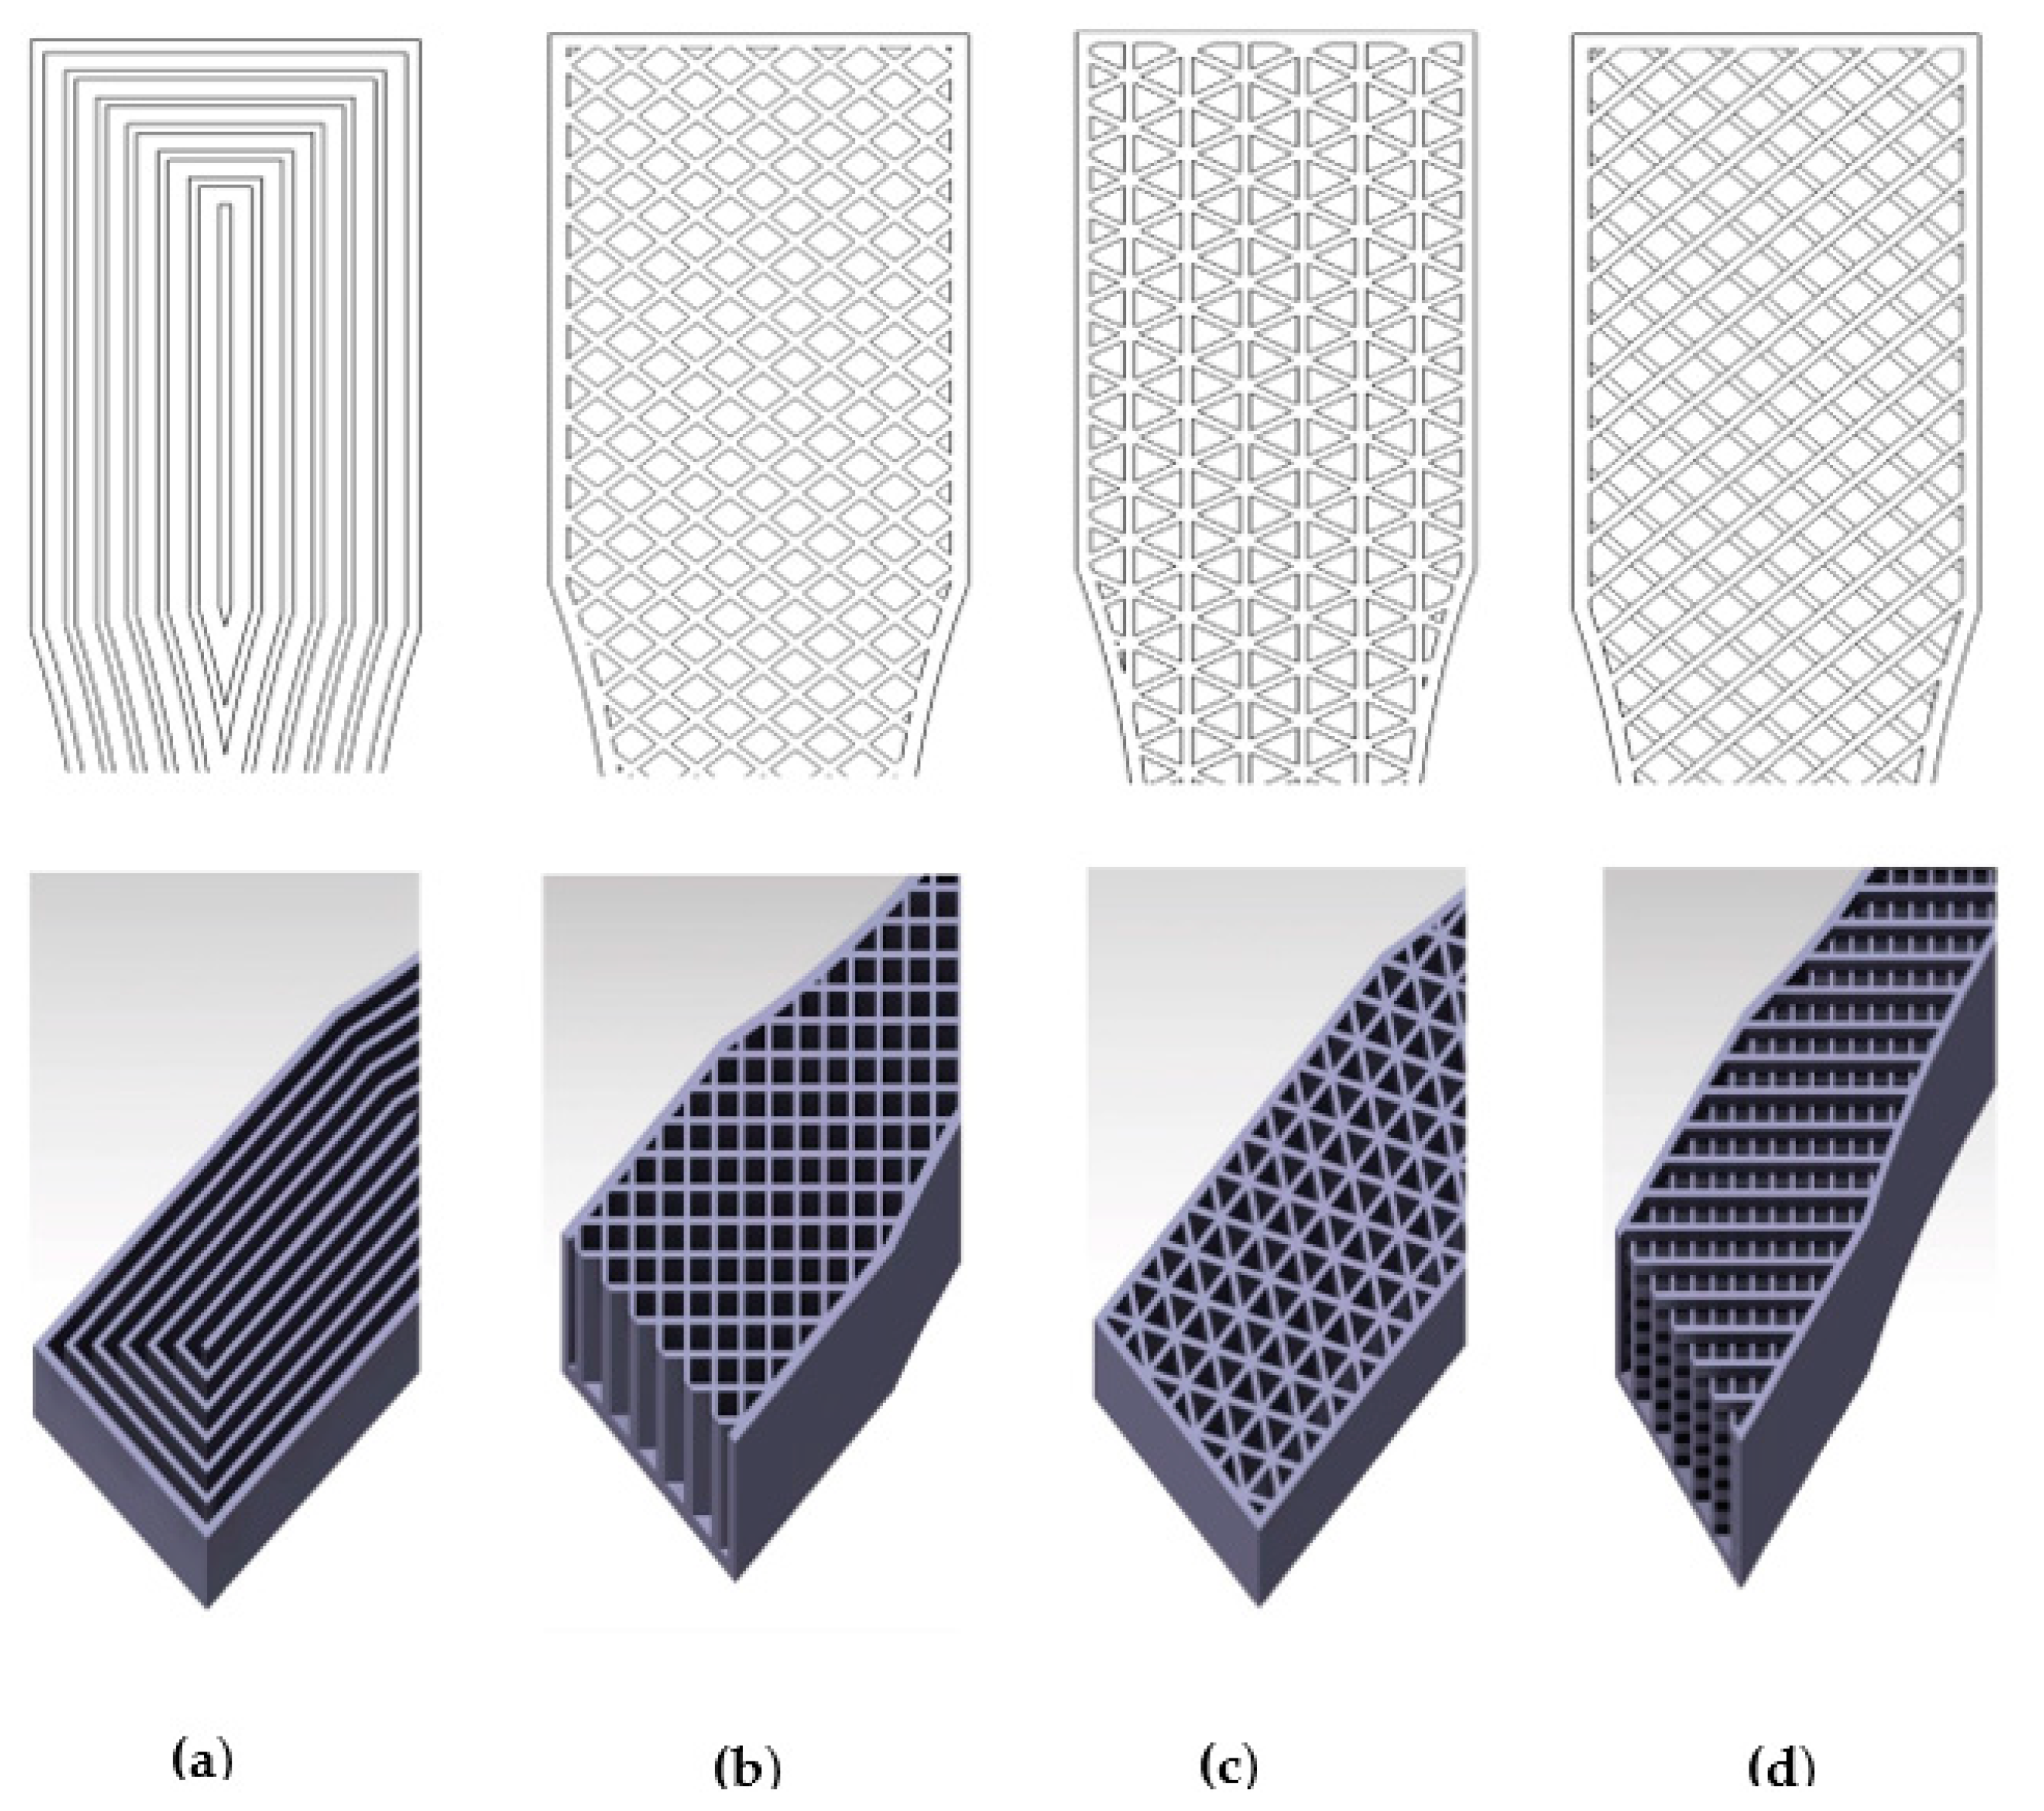
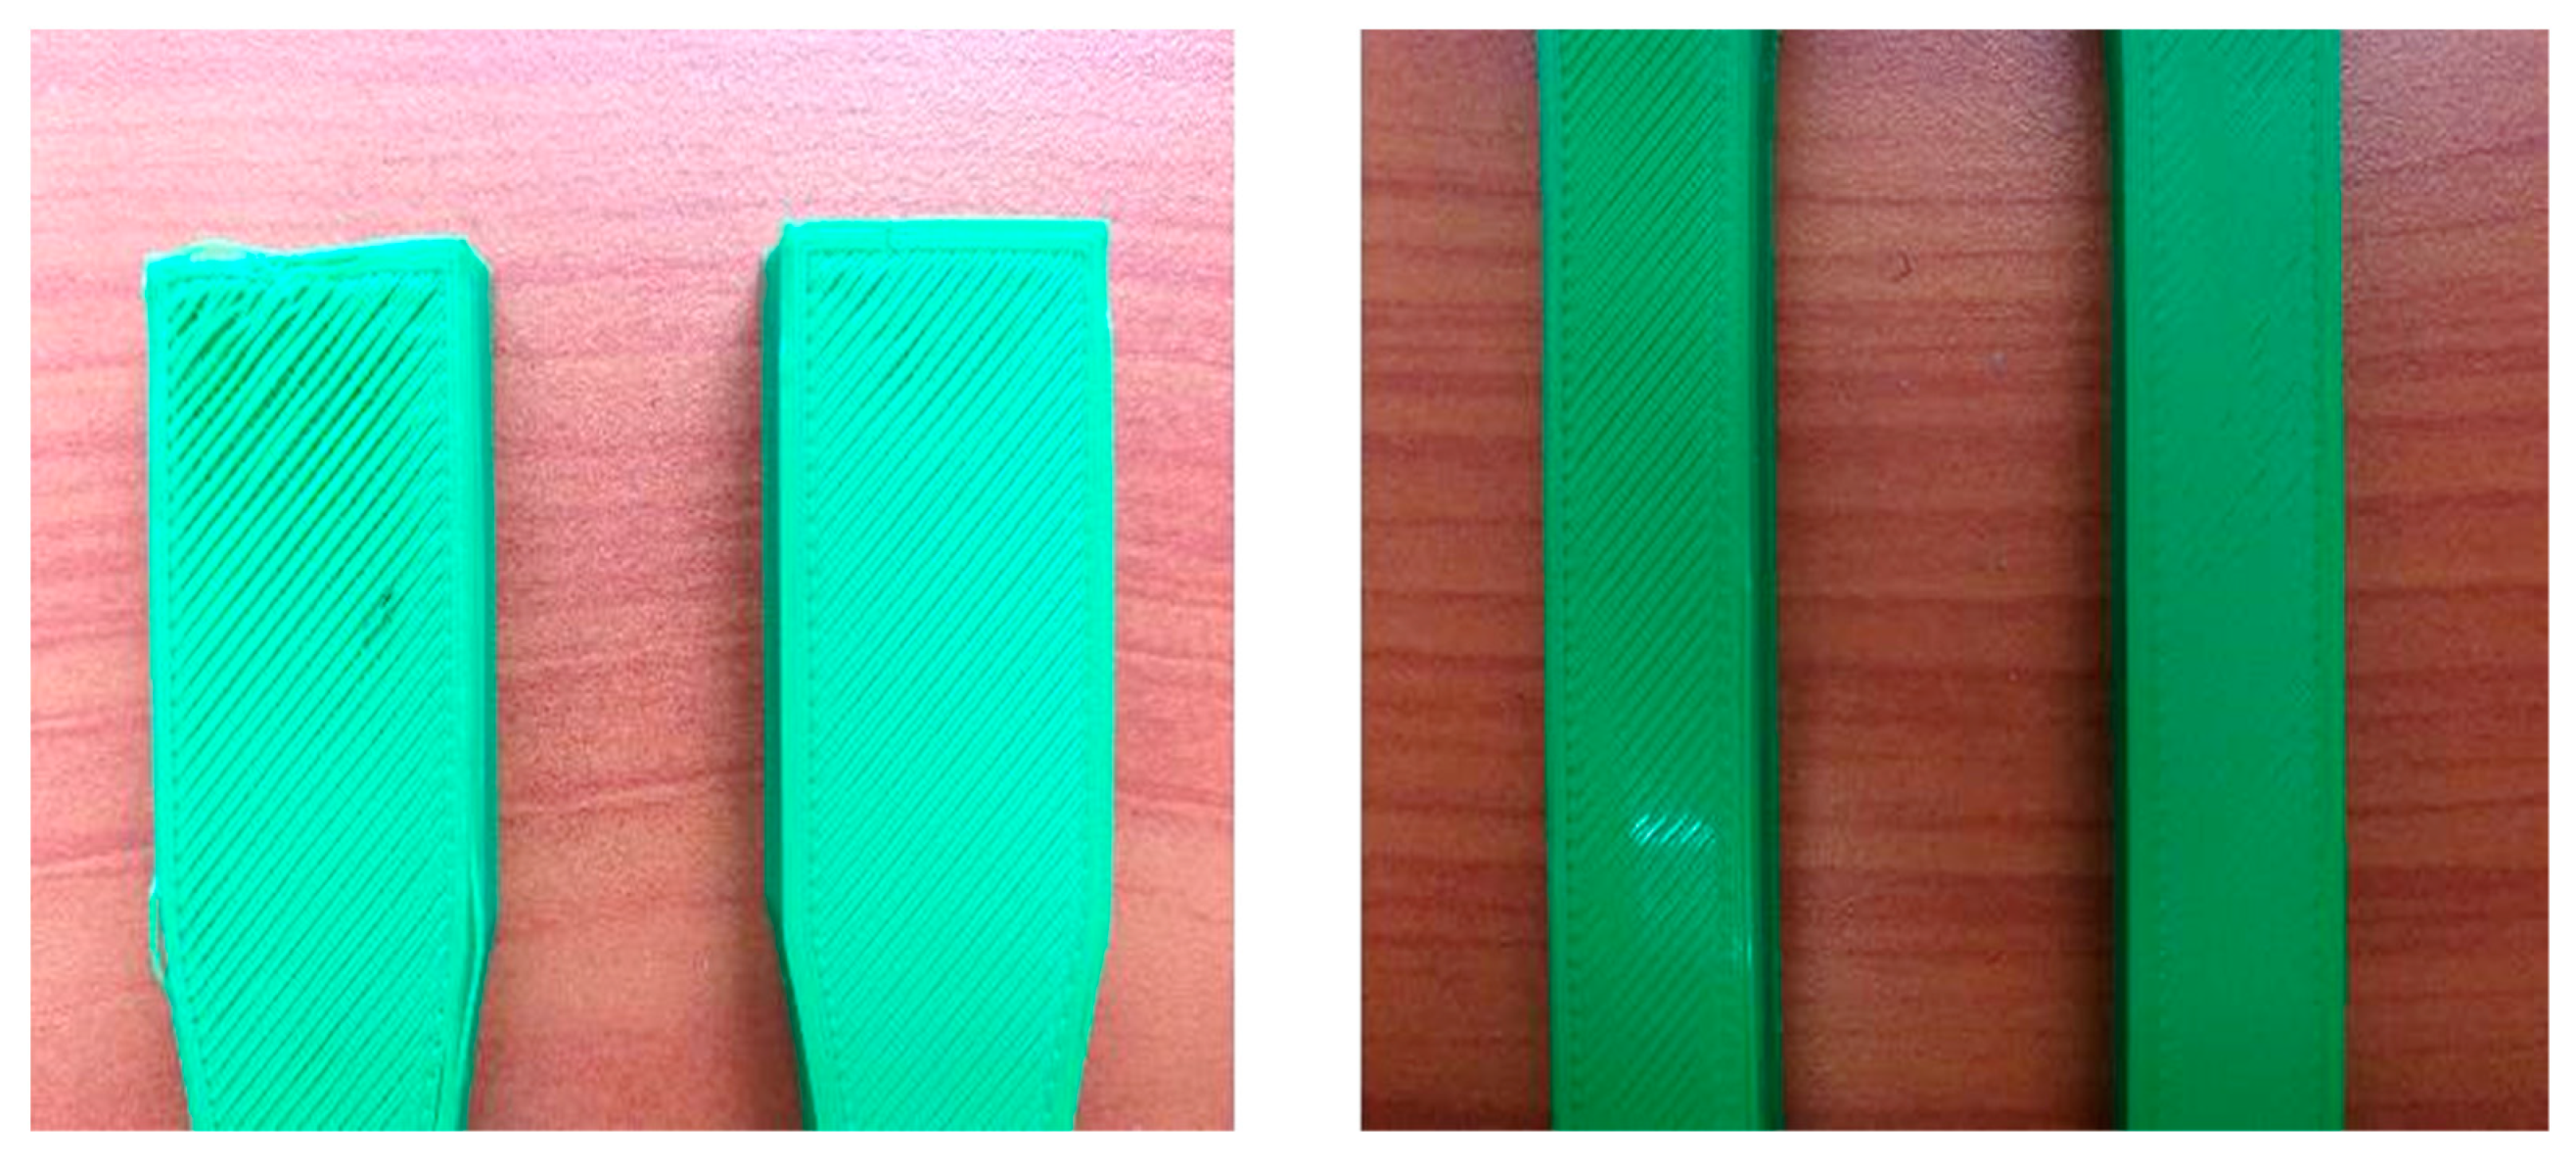
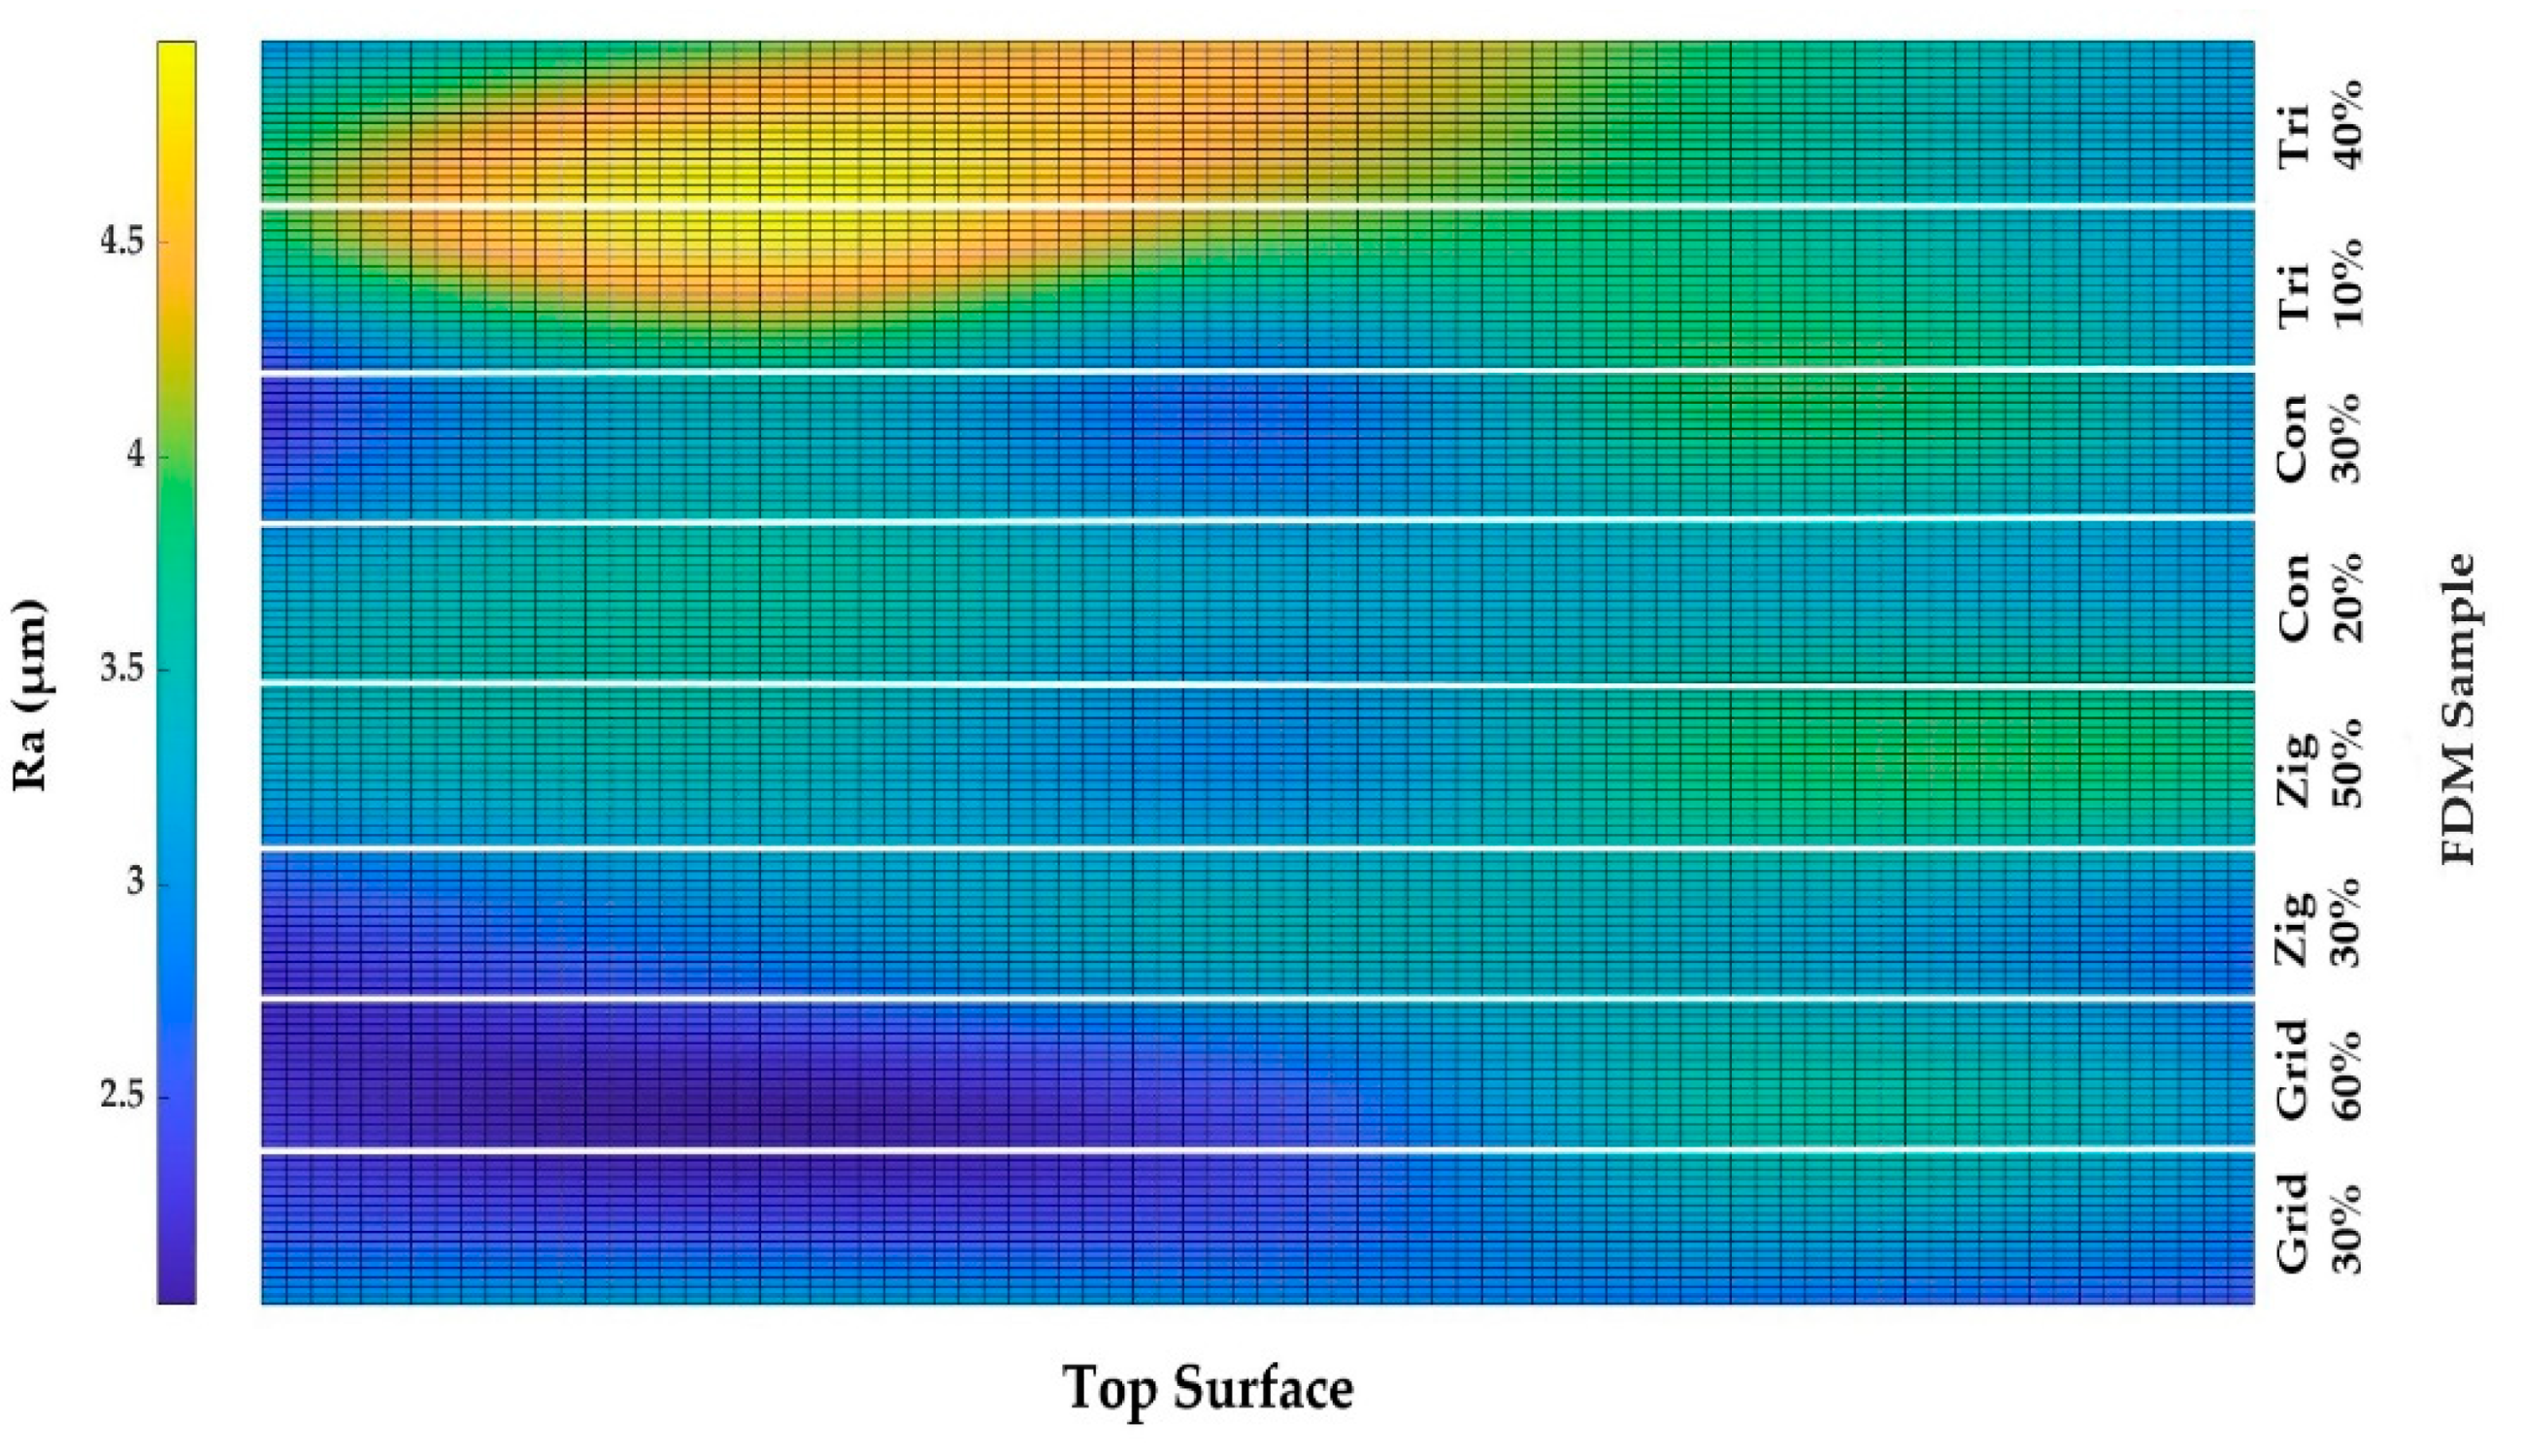
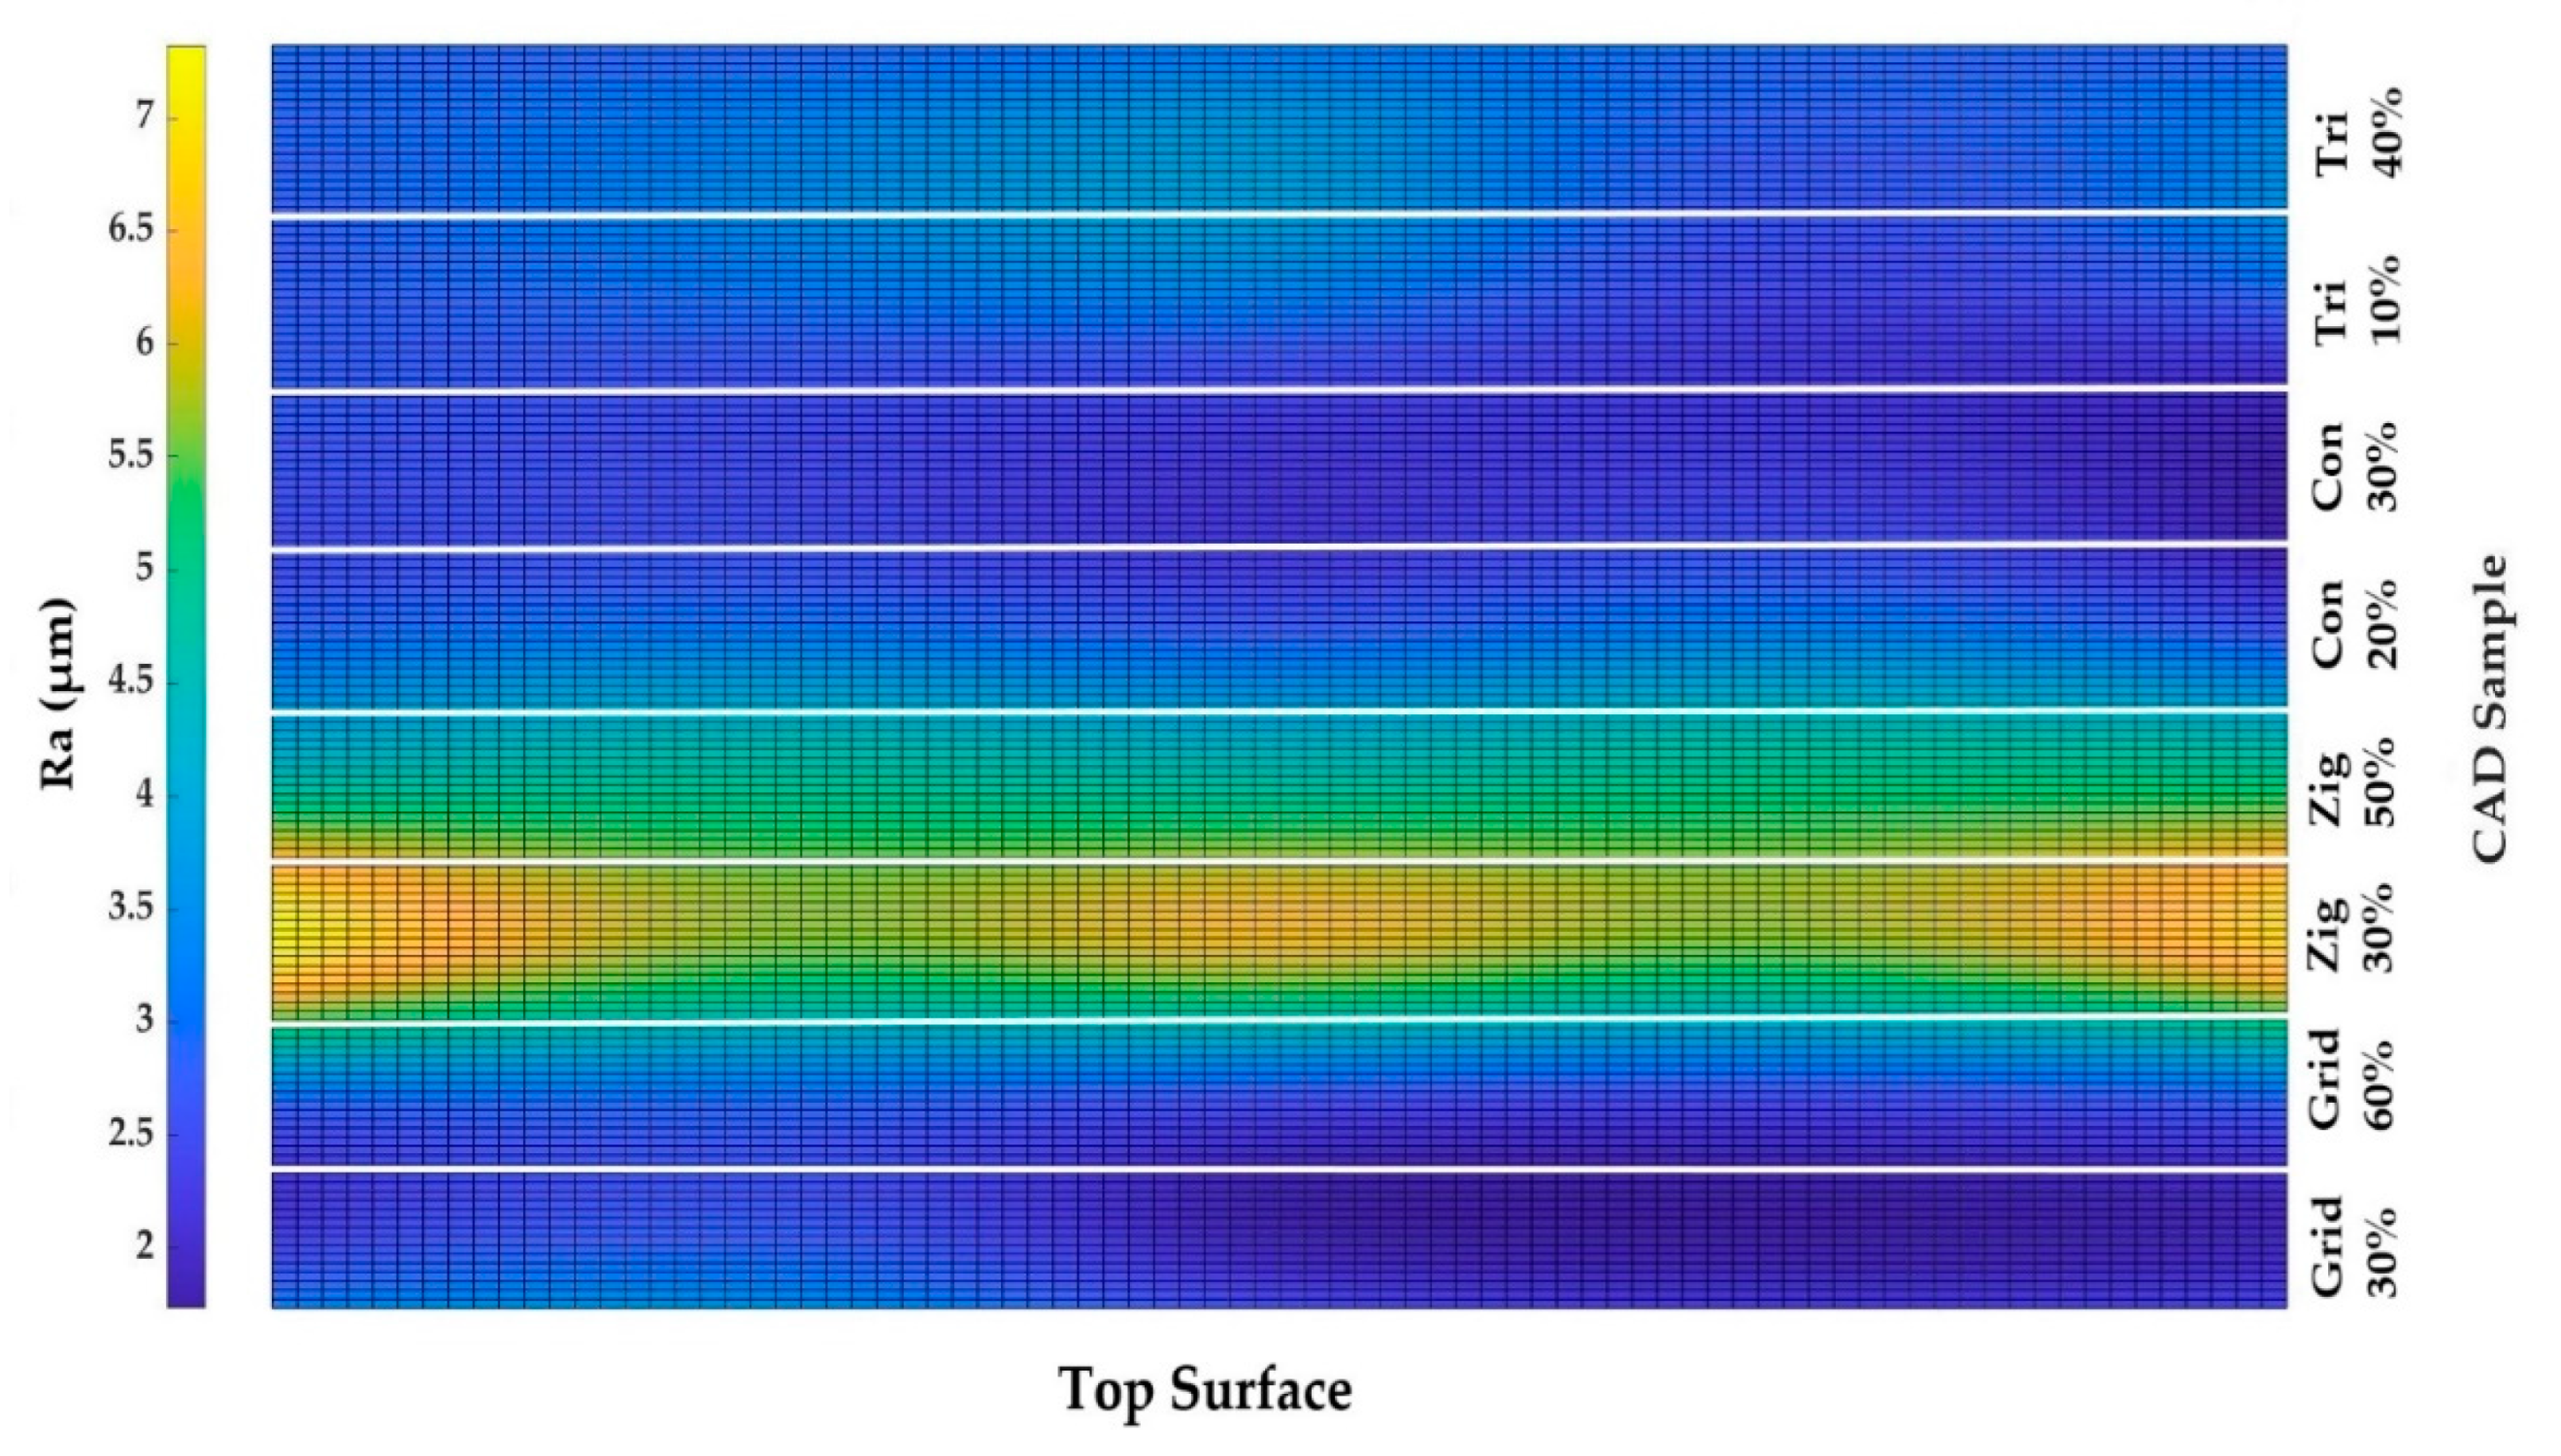
3.1. Effects of Infill Patterns on SR
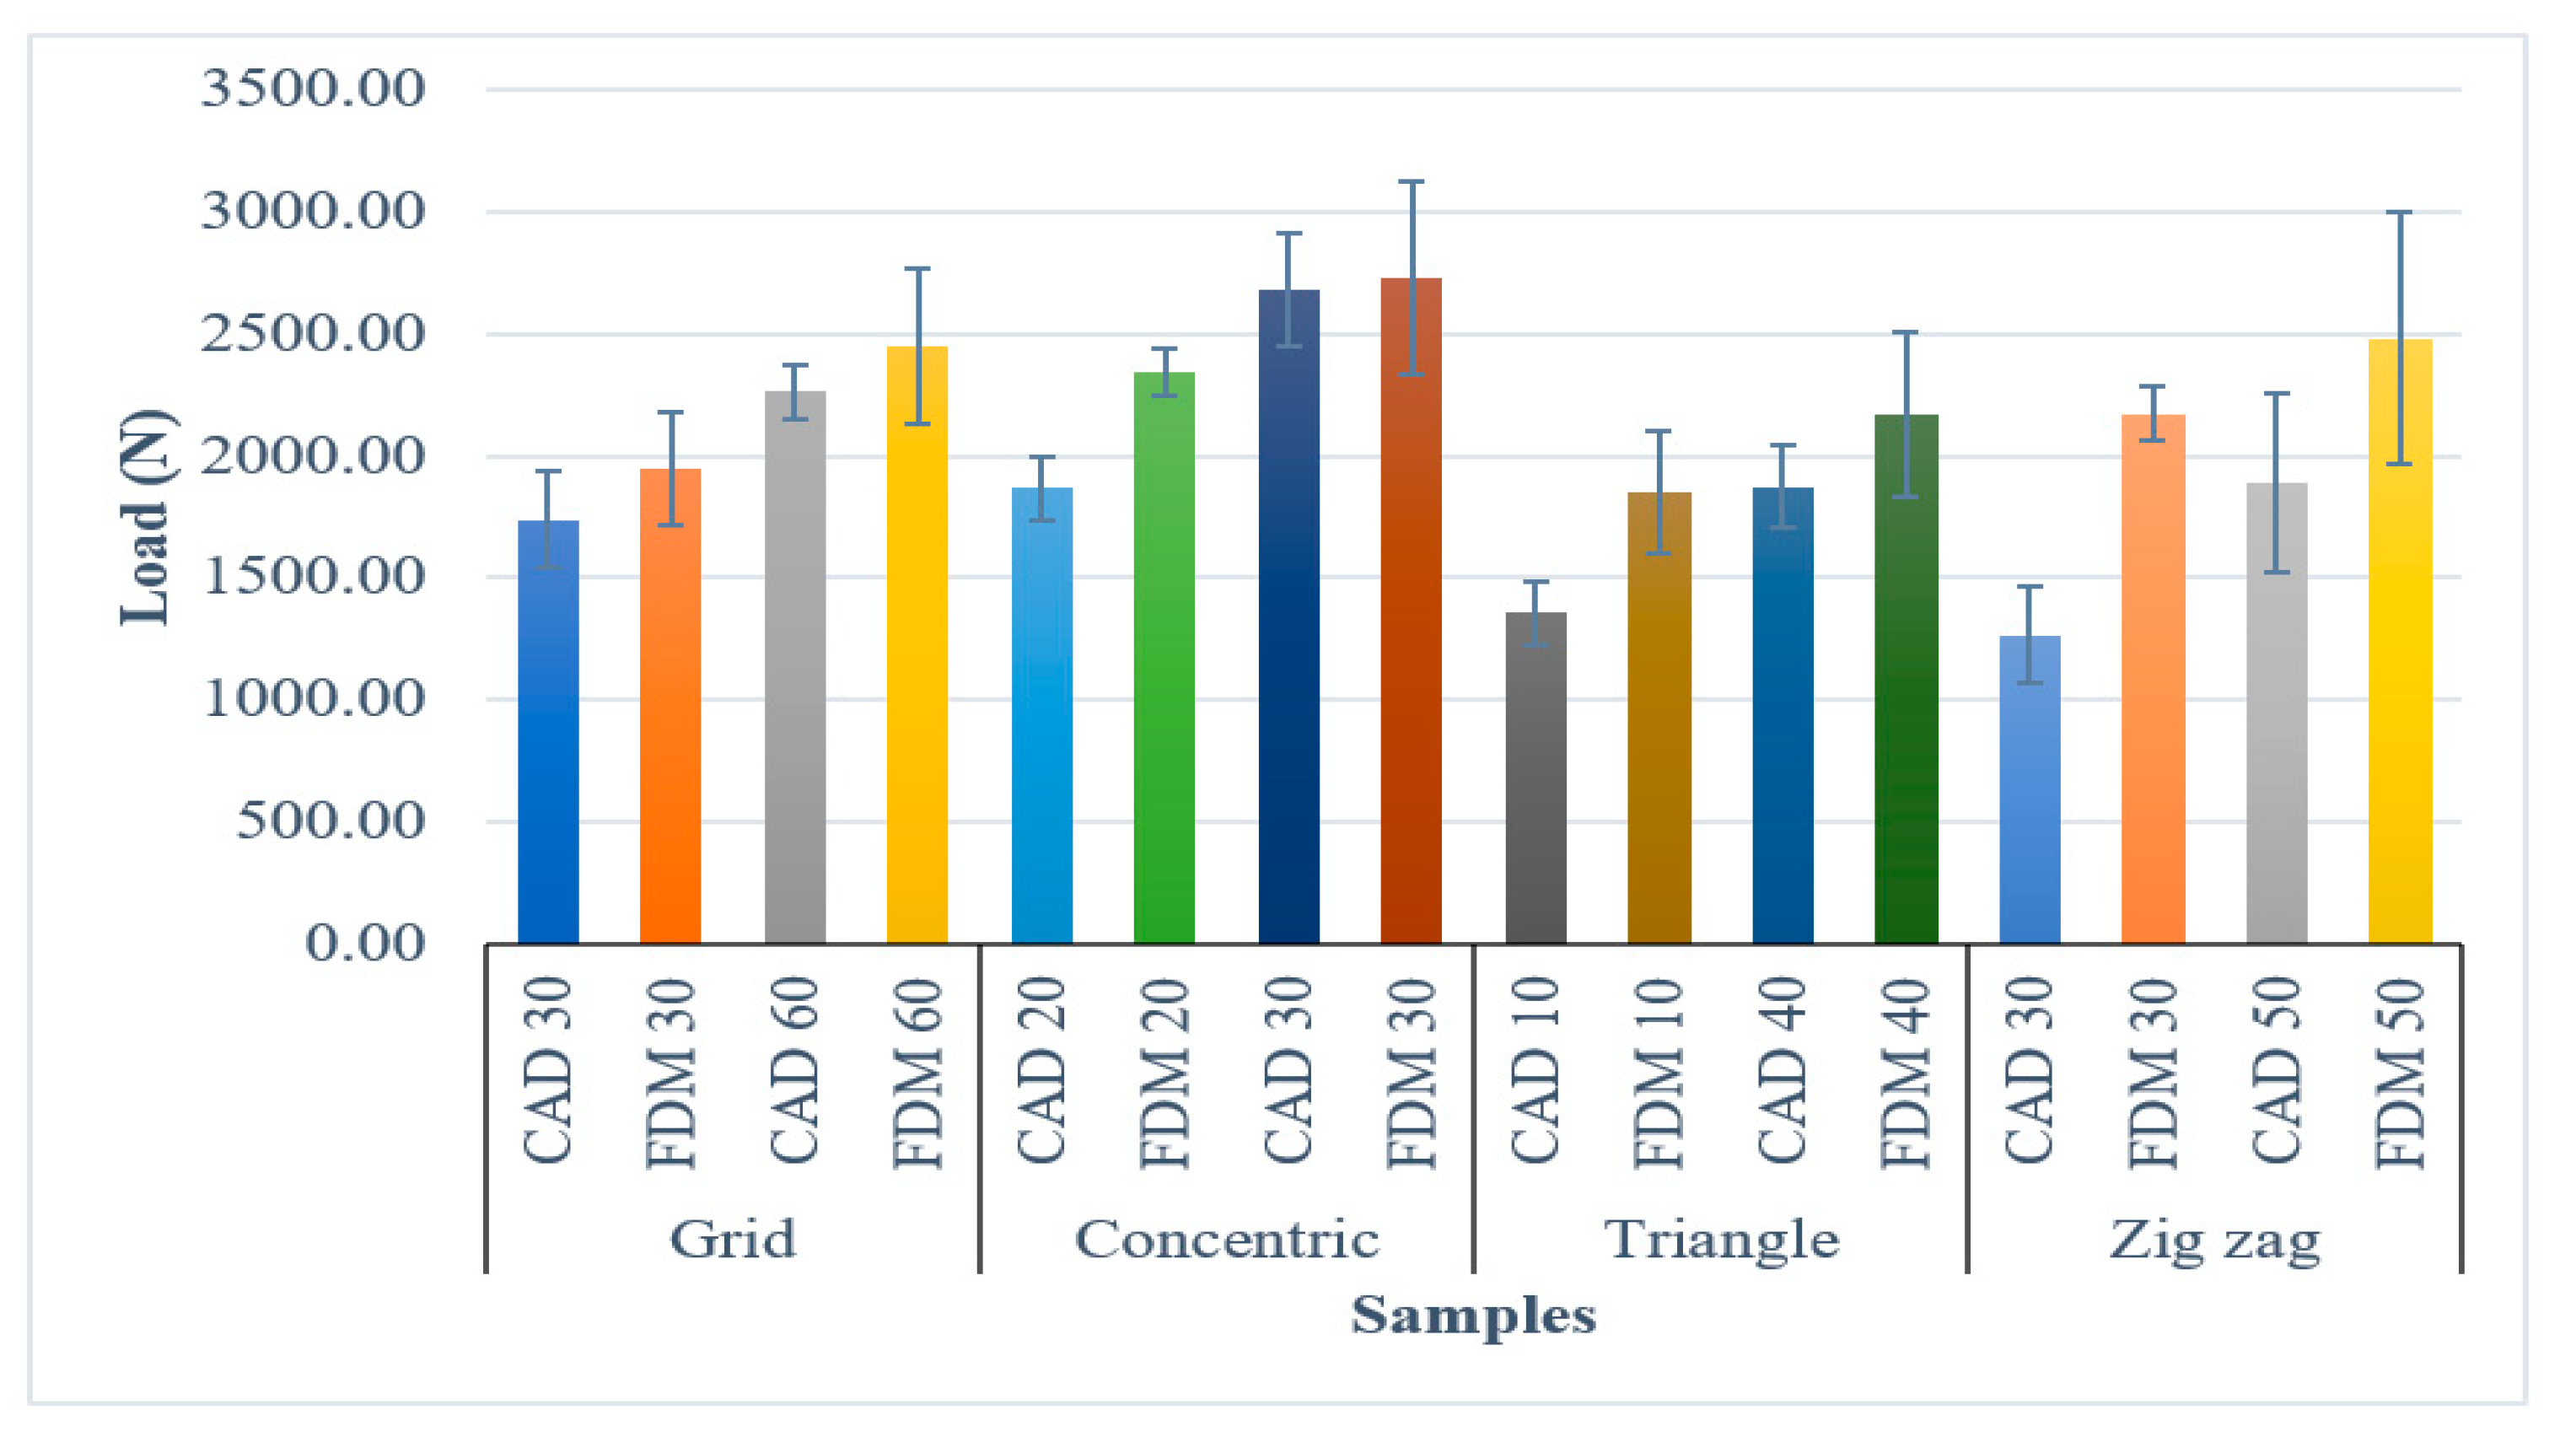
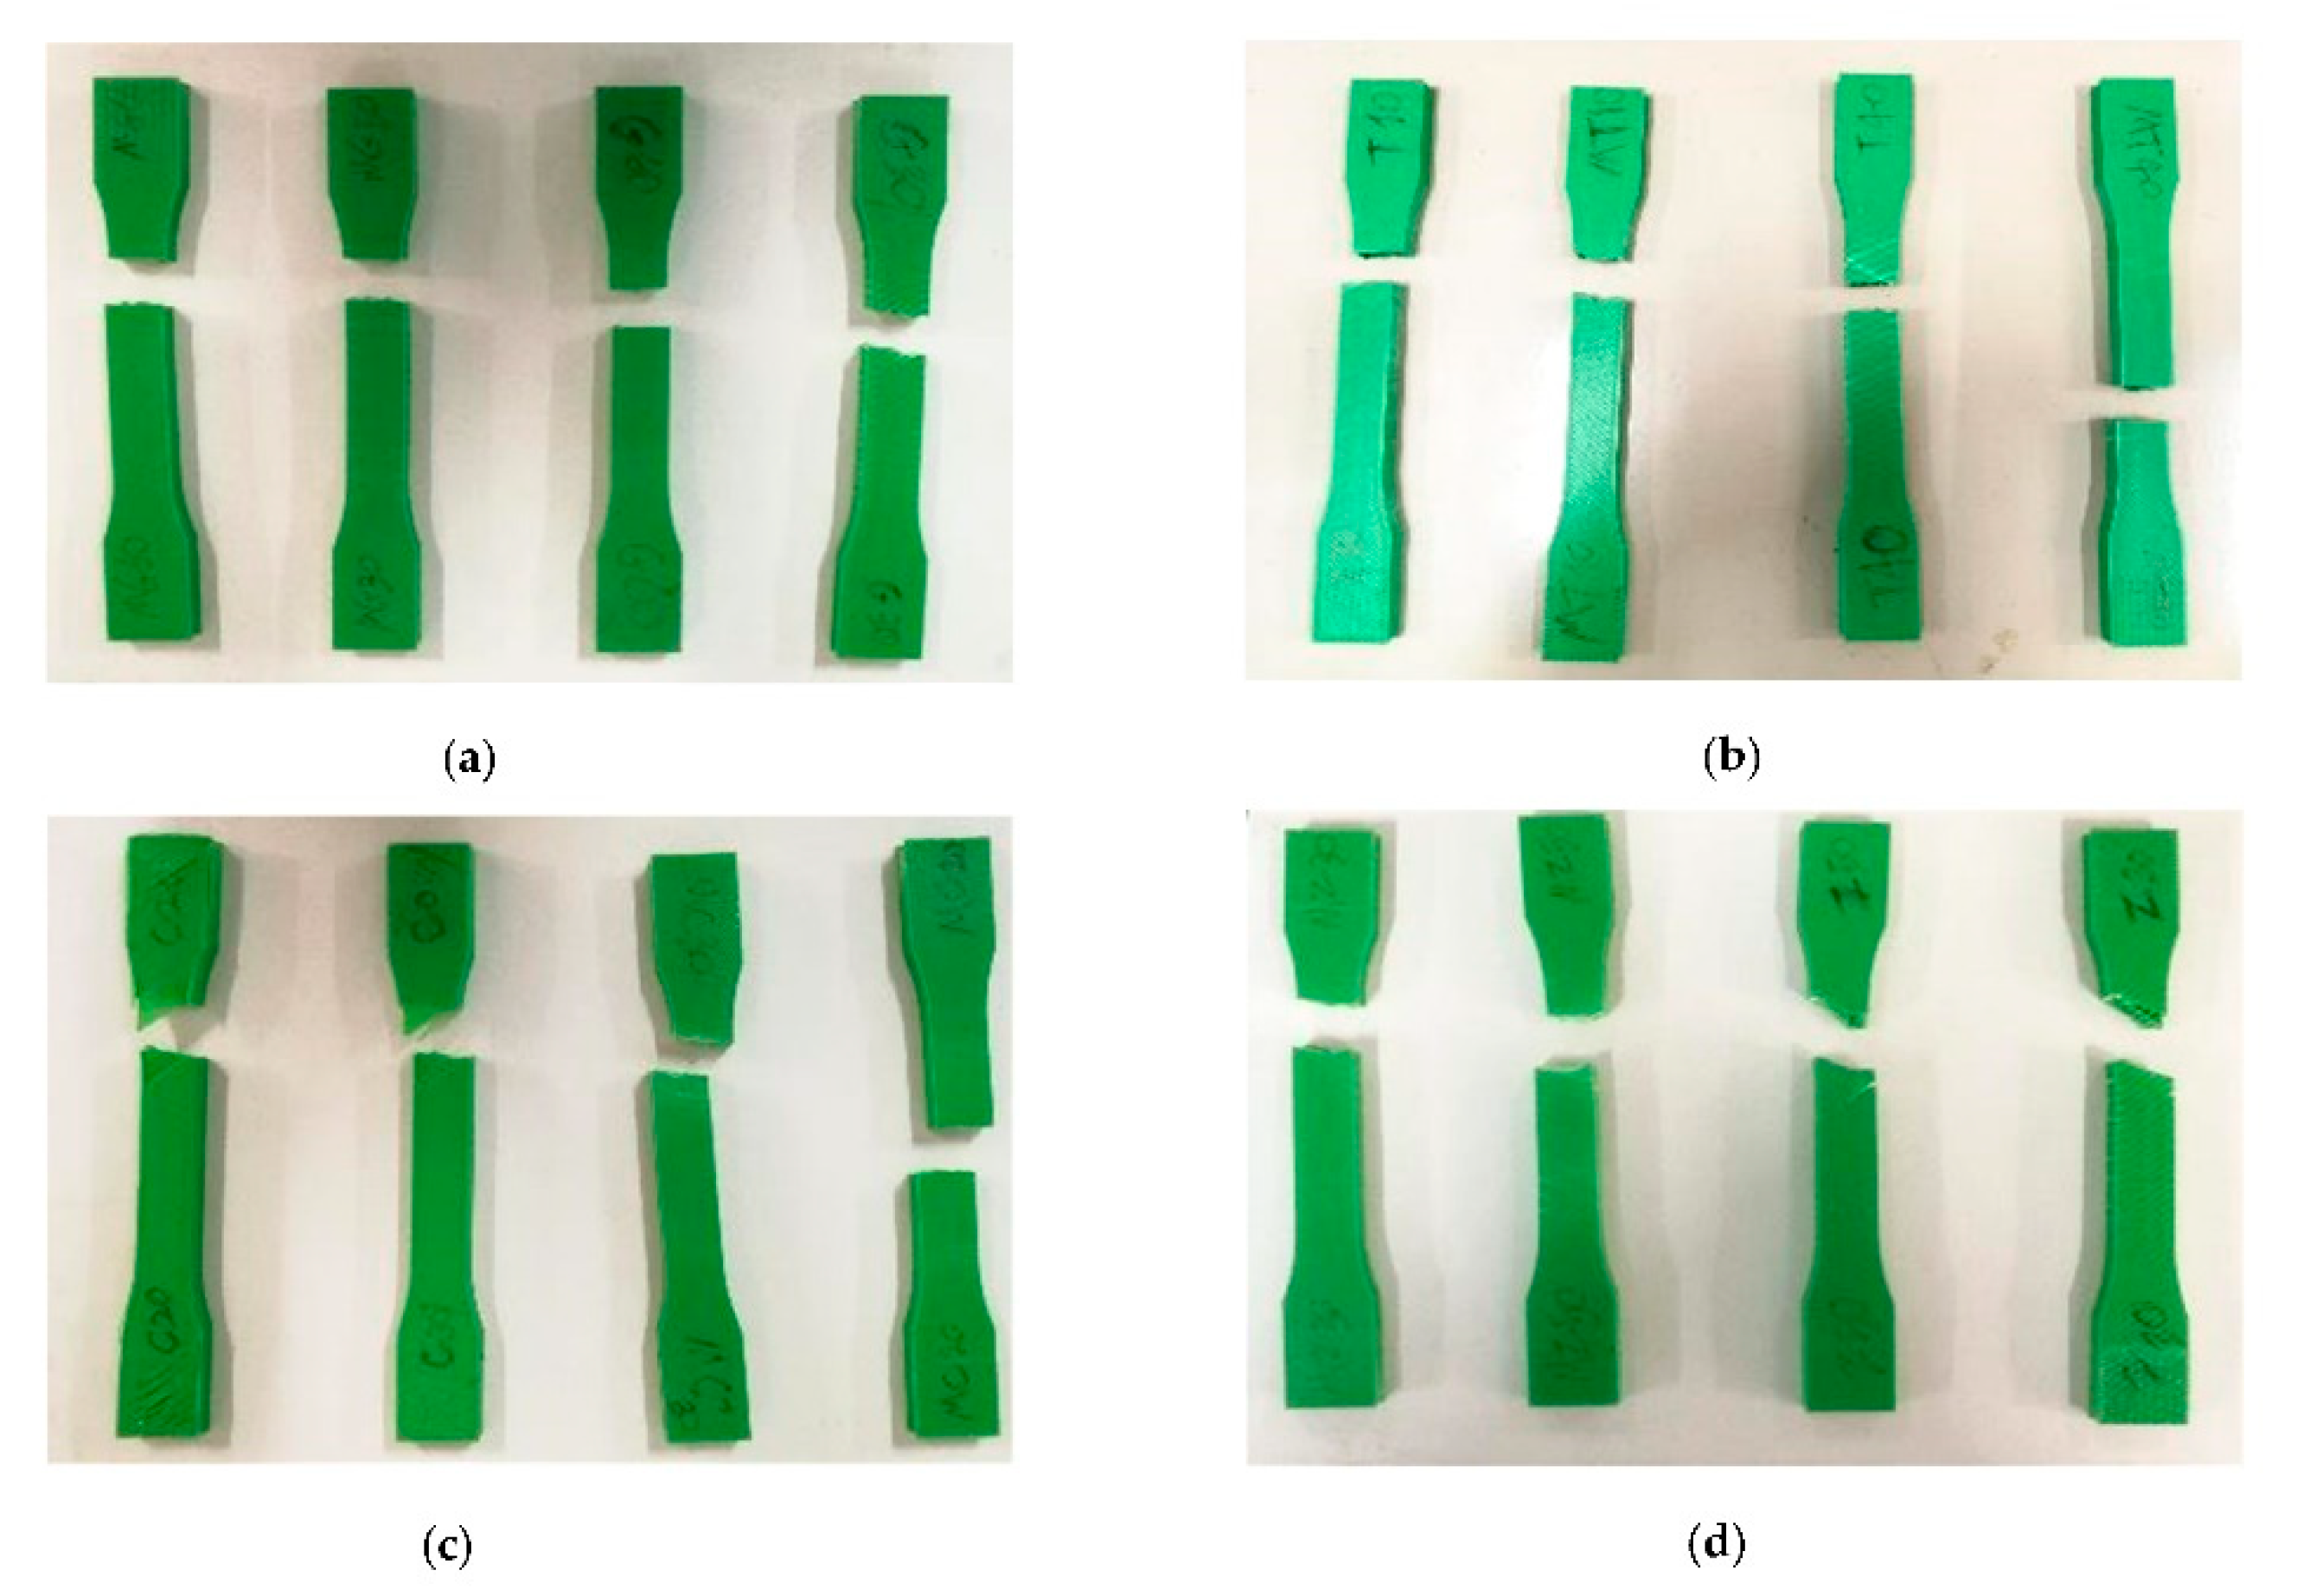
3.2. Effects of Infill Patterns on Mechanical Properties
4. Conclusions
Author Contributions
Funding
Institutional Review Board Statement
Informed Consent Statement
Data Availability Statement
Conflicts of Interest
References
- Dezaki, M.L.; Ariffin, M.K.A.M.; Hatami, S. An overview of fused deposition modelling (FDM): Research, development and process optimisation. Rapid Prototyp. J. 2021, 27, 562–582. [Google Scholar] [CrossRef]
- Askari, M.; Naniz, M.A.; Kouhi, M.; Saberi, A.; Zolfagharian, A.; Bodaghi, M. Recent progress in extrusion 3D bioprinting of hydrogel biomaterials for tissue regeneration: A comprehensive review with focus on advanced fabrication techniques. Biomater. Sci. 2021, 9, 535–573. [Google Scholar] [CrossRef] [PubMed]
- Tosto, C.; Tirillò, J.; Sarasini, F.; Cicala, G. Hybrid Metal/Polymer Filaments for Fused Filament Fabrication (FFF) to Print Metal Parts. Appl. Sci. 2021, 11, 1444. [Google Scholar] [CrossRef]
- Osswald, T.A.; Puentes, J.; Kattinger, J. Fused filament fabrication melting model. Addit. Manuf. 2018, 22, 51–59. [Google Scholar] [CrossRef]
- Tlegenov, Y.; Hong, G.S.; Lu, W.F. Nozzle condition monitoring in 3D printing. Robot. Comput. Integr. Manuf. 2018, 54, 45–55. [Google Scholar] [CrossRef]
- Moretti, M.; Rossi, A.; Senin, N. In-process simulation of the extrusion to support optimisation and real-time monitoring in fused filament fabrication. Addit. Manuf. 2021, 38, 101817. [Google Scholar] [CrossRef]
- Nieto, D.; Sánchez, D. Design for Additive Manufacturing: Tool Review and a Case Study. Appl. Sci. 2021, 11, 1571. [Google Scholar] [CrossRef]
- Yu, H.; Hong, H.; Cao, S.; Ahmad, R. Topology Optimization for Multipatch Fused Deposition Modeling 3D Printing. Appl. Sci. 2020, 10, 943. [Google Scholar] [CrossRef] [Green Version]
- Bourell, D.; Kruth, J.P.; Leu, M.; Levy, G.; Rosen, D.; Beese, A.; Clare, A. Materials for additive manufacturing. CIRP Ann. 2017, 66, 659–681. [Google Scholar] [CrossRef]
- Cuiffo, M.A.; Snyder, J.; Elliott, A.M.; Romero, N.; Kannan, S.; Halada, G.P. Impact of the Fused Deposition (FDM) Printing Process on Polylactic Acid (PLA) Chemistry and Structure. Appl. Sci. 2017, 7, 579. [Google Scholar] [CrossRef] [Green Version]
- Kaščak, J.; Gašpár, S.; Paško, J.; Knapčíková, L.; Husár, J.; Baron, P.; Török, J. Design of an Atypical Construction of Equipment for Additive Manufacturing with a Conceptual Solution of a Printhead Intended for the Use of Recycled Plastic Materials. Appl. Sci. 2021, 11, 2928. [Google Scholar] [CrossRef]
- Liu, Z.; Wang, Y.; Wu, B.; Cui, C.; Guo, Y.; Yan, C. A critical review of fused deposition modeling 3D printing technology in manufacturing polylactic acid parts. Int. J. Adv. Manuf. Technol. 2019, 102, 2877–2889. [Google Scholar] [CrossRef]
- Soltani, A.; Noroozi, R.; Bodaghi, M.; Zolfagharian, A.; Hedayati, R. 3D Printing On-Water Sports Boards with Bio-Inspired Core Designs. Polymers 2020, 12, 250. [Google Scholar] [CrossRef] [PubMed] [Green Version]
- Kuo, C.-C.; Wu, Y.-R.; Li, M.-H.; Wu, H.-W. Minimizing warpage of ABS prototypes built with low-cost fused deposition modeling machine using developed closed-chamber and optimal process parameters. Int. J. Adv. Manuf. Technol. 2018, 101, 593–602. [Google Scholar] [CrossRef]
- Huang, Q.; Zhang, J.; Sabbaghi, A.; Dasgupta, T. Optimal offline compensation of shape shrinkage for three-dimensional printing processes. IIE Trans. 2014, 47, 431–441. [Google Scholar] [CrossRef]
- Chohan, J.S.; Singh, R.; Boparai, K.S. Mathematical modelling of surface roughness for vapour processing of ABS parts fabricated with fused deposition modelling. J. Manuf. Process. 2016, 24, 161–169. [Google Scholar] [CrossRef]
- Bodaghi, M.; Damanpack, A.; Hu, G.; Liao, W. Large deformations of soft metamaterials fabricated by 3D printing. Mater. Des. 2017, 131, 81–91. [Google Scholar] [CrossRef]
- Jiang, J.; Lou, J.; Hu, G. Effect of support on printed properties in fused deposition modelling processes. Virtual Phys. Prototyp. 2019, 14, 308–315. [Google Scholar] [CrossRef]
- Bedi, P.; Singh, R.; Ahuja, I. Multifactor optimization of FDM process parameters for development of rapid tooling using SiC/Al2O3-reinforced LDPE filament. J. Thermoplast. Compos. Mater. 2018, 33, 581–598. [Google Scholar] [CrossRef]
- Moradi, M.; Moghadam, M.K.; Shamsborhan, M.; Bodaghi, M.; Falavandi, H. Post-Processing of FDM 3D-Printed Polylactic Acid Parts by Laser Beam Cutting. Polymers 2020, 12, 550. [Google Scholar] [CrossRef] [Green Version]
- Barari, A.; Kishawy, H.A.; Kaji, F.; Elbestawi, M.A. On the surface quality of additive manufactured parts. Int. J. Adv. Manuf. Technol. 2016, 89, 1969–1974. [Google Scholar] [CrossRef]
- Marwah, O.M.F.; Sharif, S.; Ibrahim, M.; Mohamad, E.J.; Idris, M.H. Direct rapid prototyping evaluation on multijet and fused deposition modeling patterns for investment casting. Proc. Inst. Mech. Eng. Part L J. Mater. Des. Appl. 2015, 230, 949–958. [Google Scholar] [CrossRef]
- Solomon, I.J.; Sevvel, P.; Gunasekaran, J. A review on the various processing parameters in FDM. Mater. Today Proc. 2021, 37, 509–514. [Google Scholar] [CrossRef]
- Vaezi, M.; Seitz, H.; Yang, S. A review on 3D micro-additive manufacturing technologies. Int. J. Adv. Manuf. Technol. 2013, 67, 1721–1754. [Google Scholar] [CrossRef]
- Naveed, N. Investigate the effects of process parameters on material properties and microstructural changes of 3D-printed specimens using fused deposition modelling (FDM). Mater. Technol. 2020, 1–14. [Google Scholar] [CrossRef]
- Ziemian, S.; Okwara, M.; Ziemian, C.W. Tensile and fatigue behavior of layered acrylonitrile butadiene styrene. Rapid Prototyp. J. 2015, 21, 270–278. [Google Scholar] [CrossRef]
- Durgun, I.; Ertan, R. Experimental investigation of FDM process for improvement of mechanical properties and production cost. Rapid Prototyp. J. 2014, 20, 228–235. [Google Scholar] [CrossRef]
- Yang, L.; Li, S.; Li, Y.; Yang, M.; Yuan, Q. Experimental Investigations for Optimizing the Extrusion Parameters on FDM PLA Printed Parts. J. Mater. Eng. Perform. 2018, 28, 169–182. [Google Scholar] [CrossRef]
- Camposeco-Negrete, C. Optimization of FDM parameters for improving part quality, productivity and sustainability of the process using Taguchi methodology and desirability approach. Prog. Addit. Manuf. 2020, 5, 59–65. [Google Scholar] [CrossRef]
- Babu, N.V.; Venkateshwaran, N.; Rajini, N.; Ismail, S.O.; Mohammad, F.; Al-Lohedan, H.A.; Siengchin, S. Influence of slicing parameters on surface quality and mechanical properties of 3D-printed CF/PLA composites fabricated by FDM technique. Mater. Technol. 2021, 1–18. [Google Scholar] [CrossRef]
- Di Angelo, L.; Di Stefano, P.; Dolatnezhadsomarin, A.; Guardiani, E.; Khorram, E. A reliable build orientation optimization method in additive manufacturing: The application to FDM technology. Int. J. Adv. Manuf. Technol. 2020, 108, 263–276. [Google Scholar] [CrossRef]
- Salmi, M.; Ituarte, I.F.; Chekurov, S.; Huotilainen, E. Effect of build orientation in 3D printing production for material extrusion, material jetting, binder jetting, sheet object lamination, vat photopolymerisation, and powder bed fusion. Int. J. Collab. Enterp. 2016, 5, 218–231. [Google Scholar] [CrossRef]
- Buj-Corral, I.; Domínguez-Fernández, A.; Durán-Llucià, R. Influence of Print Orientation on Surface Roughness in Fused Deposition Modeling (FDM) Processes. Materials 2019, 12, 3834. [Google Scholar] [CrossRef] [Green Version]
- Dezaki, M.L.; Ariffin, M.K.A.M.; Ismail, M.I.S. Effects of CNC Machining on Surface Roughness in Fused Deposition Modelling (FDM) Products. Materials 2020, 13, 2608. [Google Scholar] [CrossRef]
- Suteja, T.J.; Soesanti, A. Mechanical Properties of 3D Printed Polylactic Acid Product for Various Infill Design Parameters: A Review. J. Phys. Conf. Ser. 2020, 1569. [Google Scholar] [CrossRef]
- Ćwikła, G.; Grabowik, C.W.; Kalinowski, K.; Paprocka, I.; Ociepka, P. The influence of printing parameters on selected mechanical properties of FDM/FFF 3D-printed parts. IOP Conf. Ser. Mater. Sci. Eng. 2017, 227. [Google Scholar] [CrossRef]
- Moradi, M.; Meiabadi, S.; Kaplan, A. 3D Printed Parts with Honeycomb Internal Pattern by Fused Deposition Modelling; Experimental Characterization and Production Optimization. Met. Mater. Int. 2019, 25, 1312–1325. [Google Scholar] [CrossRef]
- Camargo, J.C.; Machado, R.; Almeida, E.C.; Silva, E.F.M.S. Mechanical properties of PLA-graphene filament for FDM 3D printing. Int. J. Adv. Manuf. Technol. 2019, 103, 2423–2443. [Google Scholar] [CrossRef]
- Dudescu, C.; Racz, L. Effects of Raster Orientation, Infill Rate and Infill Pattern on the Mechanical Properties of 3D Printed Materials. Acta Univ. Cibiniensis 2017, 69, 23–30. [Google Scholar] [CrossRef] [Green Version]
- Podroužek, J.; Marcon, M.; Ninčević, K.; Wan-Wendner, R. Bio-Inspired 3D Infill Patterns for Additive Manufacturing and Structural Applications. Materials 2019, 12, 499. [Google Scholar] [CrossRef] [Green Version]
- Ahn, S.; Montero, M.; Odell, D.; Roundy, S.; Wright, P.K. Anisotropic material properties of fused deposition modeling ABS. Rapid Prototyp. J. 2002, 8, 248–257. [Google Scholar] [CrossRef] [Green Version]
- Dave, H.K.; Patadiya, N.H.; Prajapati, A.R.; Rajpurohit, S. Effect of infill pattern and infill density at varying part orientation on tensile properties of fused deposition modeling-printed poly-lactic acid part. Proc. Inst. Mech. Eng. Part C J. Mech. Eng. Sci. 2019, 235, 1811–1827. [Google Scholar] [CrossRef]
- Burke, C.; Dalal, A.; Abukhalaf, A.; Noorani, R. Effects of process parameter variation on the surface roughness of polylactic acid (PLA) materials using design of experiments (DOE). IOP Conf. Ser. Mater. Sci. Eng. 2020, 897. [Google Scholar] [CrossRef]
- Yadav, P.; Sahai, A.; Sharma, R.S. Strength and Surface Characteristics of FDM-Based 3D Printed PLA Parts for Multiple Infill Design Patterns. J. Inst. Eng. 2020, 102, 197–207. [Google Scholar] [CrossRef]
- Dezaki, M.L.; Ariffin, M.K.A.M. The Effects of Combined Infill Patterns on Mechanical Properties in FDM Process. Polymers 2020, 12, 2792. [Google Scholar] [CrossRef]
- Samykano, M.; Selvamani, S.K.; Kadirgama, K.; Ngui, W.K.; Kanagaraj, G.; Sudhakar, K. Mechanical property of FDM printed ABS: Influence of printing parameters. Int. J. Adv. Manuf. Technol. 2019, 102, 2779–2796. [Google Scholar] [CrossRef]
- Gopsill, J.A.; Shindler, J.; Hicks, B.J. Using finite element analysis to influence the infill design of fused deposition modelled parts. Prog. Addit. Manuf. 2017, 3, 145–163. [Google Scholar] [CrossRef] [Green Version]
- Heidari-Rarani, M.; Ezati, N.; Sadeghi, P. Badrossamay Optimization of FDM process parameters for tensile properties of polylactic acid specimens using Taguchi design of experiment method. J. Thermoplast. Compos. Mater. 2020. [Google Scholar] [CrossRef]
- Afrose, M.F.; Masood, S.H.; Iovenitti, P.; Nikzad, M.; Sbarski, I. Effects of part build orientations on fatigue behaviour of FDM-processed PLA material. Prog. Addit. Manuf. 2015, 1, 21–28. [Google Scholar] [CrossRef]
- Galantucci, L.M.; Lavecchia, F.; Percoco, G. Experimental study aiming to enhance the surface finish of fused deposition modeled parts. CIRP Ann. 2009, 58, 189–192. [Google Scholar] [CrossRef]
- Gohar, S.; Hussain, G.; Ali, A.; Ahmad, H. Mechanical performance of honeycomb sandwich structures built by FDM printing technique. J. Thermoplast. Compos. Mater. 2021. [Google Scholar] [CrossRef]
- Guessasma, S.; Belhabib, S.; Nouri, H. Effect of printing temperature on microstructure, thermal behavior and tensile properties of 3D printed nylon using fused deposition modeling. J. Appl. Polym. Sci. 2020, 138. [Google Scholar] [CrossRef]
- Garlotta, D. A Literature Review of Poly(Lactic Acid). J. Polym. Environ. 2001, 9, 63–84. [Google Scholar] [CrossRef]
- Keleş, Ö.; Blevins, C.W.; Bowman, K.J. Effect of build orientation on the mechanical reliability of 3D printed ABS. Rapid Prototyp. J. 2017, 23, 320–328. [Google Scholar] [CrossRef]
- Ingole, D.S.; Deshmukh, T.R.; Kuthe, A.M.; Ashtankar, K.M. Build orientation analysis for minimum cost determination in FDM. Proc. Inst. Mech. Eng. Part B J. Eng. Manuf. 2011, 225, 1925–1938. [Google Scholar] [CrossRef]
- Raju, K.V.M.K.; Janardhana, G.R.; Kumar, P.N.; Rao, V.D.P. Optimization of cutting conditions for surface roughness in CNC end milling. Int. J. Precis. Eng. Manuf. 2011, 12, 383–391. [Google Scholar] [CrossRef]


| Process | Infill Pattern | Infill Density (%) | Process | Infill Pattern | Infill Density (%) |
|---|---|---|---|---|---|
| CAD | Concentric | 20 | FDM | Concentric | 20 |
| 30 | 30 | ||||
| Grid | 30 | Grid | 30 | ||
| 60 | 60 | ||||
| Triangle | 10 | Triangle | 10 | ||
| 40 | 40 | ||||
| Zigzag | 30 | Zigzag | 30 | ||
| 50 | 50 |
| CAD Sample | Concentric | Grid | Triangle | Zigzag | ||||
|---|---|---|---|---|---|---|---|---|
| Infill density (%) | 20 | 30 | 30 | 60 | 10 | 40 | 30 | 60 |
| Mesh size | 3 | 3 | 3 | 3 | 3 | 3 | 3 | 3 |
| Force (N) | 2500 | 2500 | 2500 | 2500 | 2500 | 2500 | 2500 | 2500 |
| No. of nodes | 30,851 | 42,627 | 61,543 | 147,310 | 29,122 | 53,964 | 27,532 | 48,223 |
| No. of elements | 17,685 | 23,916 | 37,980 | 94,266 | 15,335 | 34,206 | 13,941 | 25,632 |
| Boundary condition | 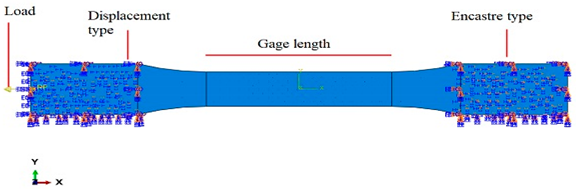 | |||||||
| 3D mesh design | 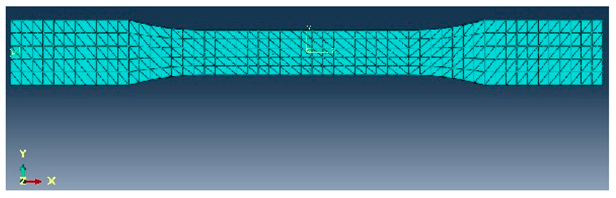 | |||||||
| PLA Properties | Value |
|---|---|
| Density (g/cm3) | 1.17 |
| Printing temperature (°C) | 190–230 |
| Printing speed (mm/s) | 40–60 |
| Bed temperature (°C) | 25–60 |
| Tensile strength (MPa) | 46.6 ± 0.9 |
| Young’s Modulus (MPa) | 2636 ± 330 |
| Process | Build Orientation (Degree) | Nozzle Diameter (mm) | Filament Diameter (mm) | Layer Height (mm) | Nozzle Temp. (°C) | Bed Temp. (°C) | Print Speed (mm/s) | Wall Thickness (mm) | Number of Top/Bottom Layer |
|---|---|---|---|---|---|---|---|---|---|
| CAD | 0 | 0.4 | 1.75 | 0.15 | 200 | 60 | 80 | 1 | 7 |
| FDM | 0 | 0.4 | 1.75 | 0.15 | 200 | 60 | 80 | 1 | 7 |
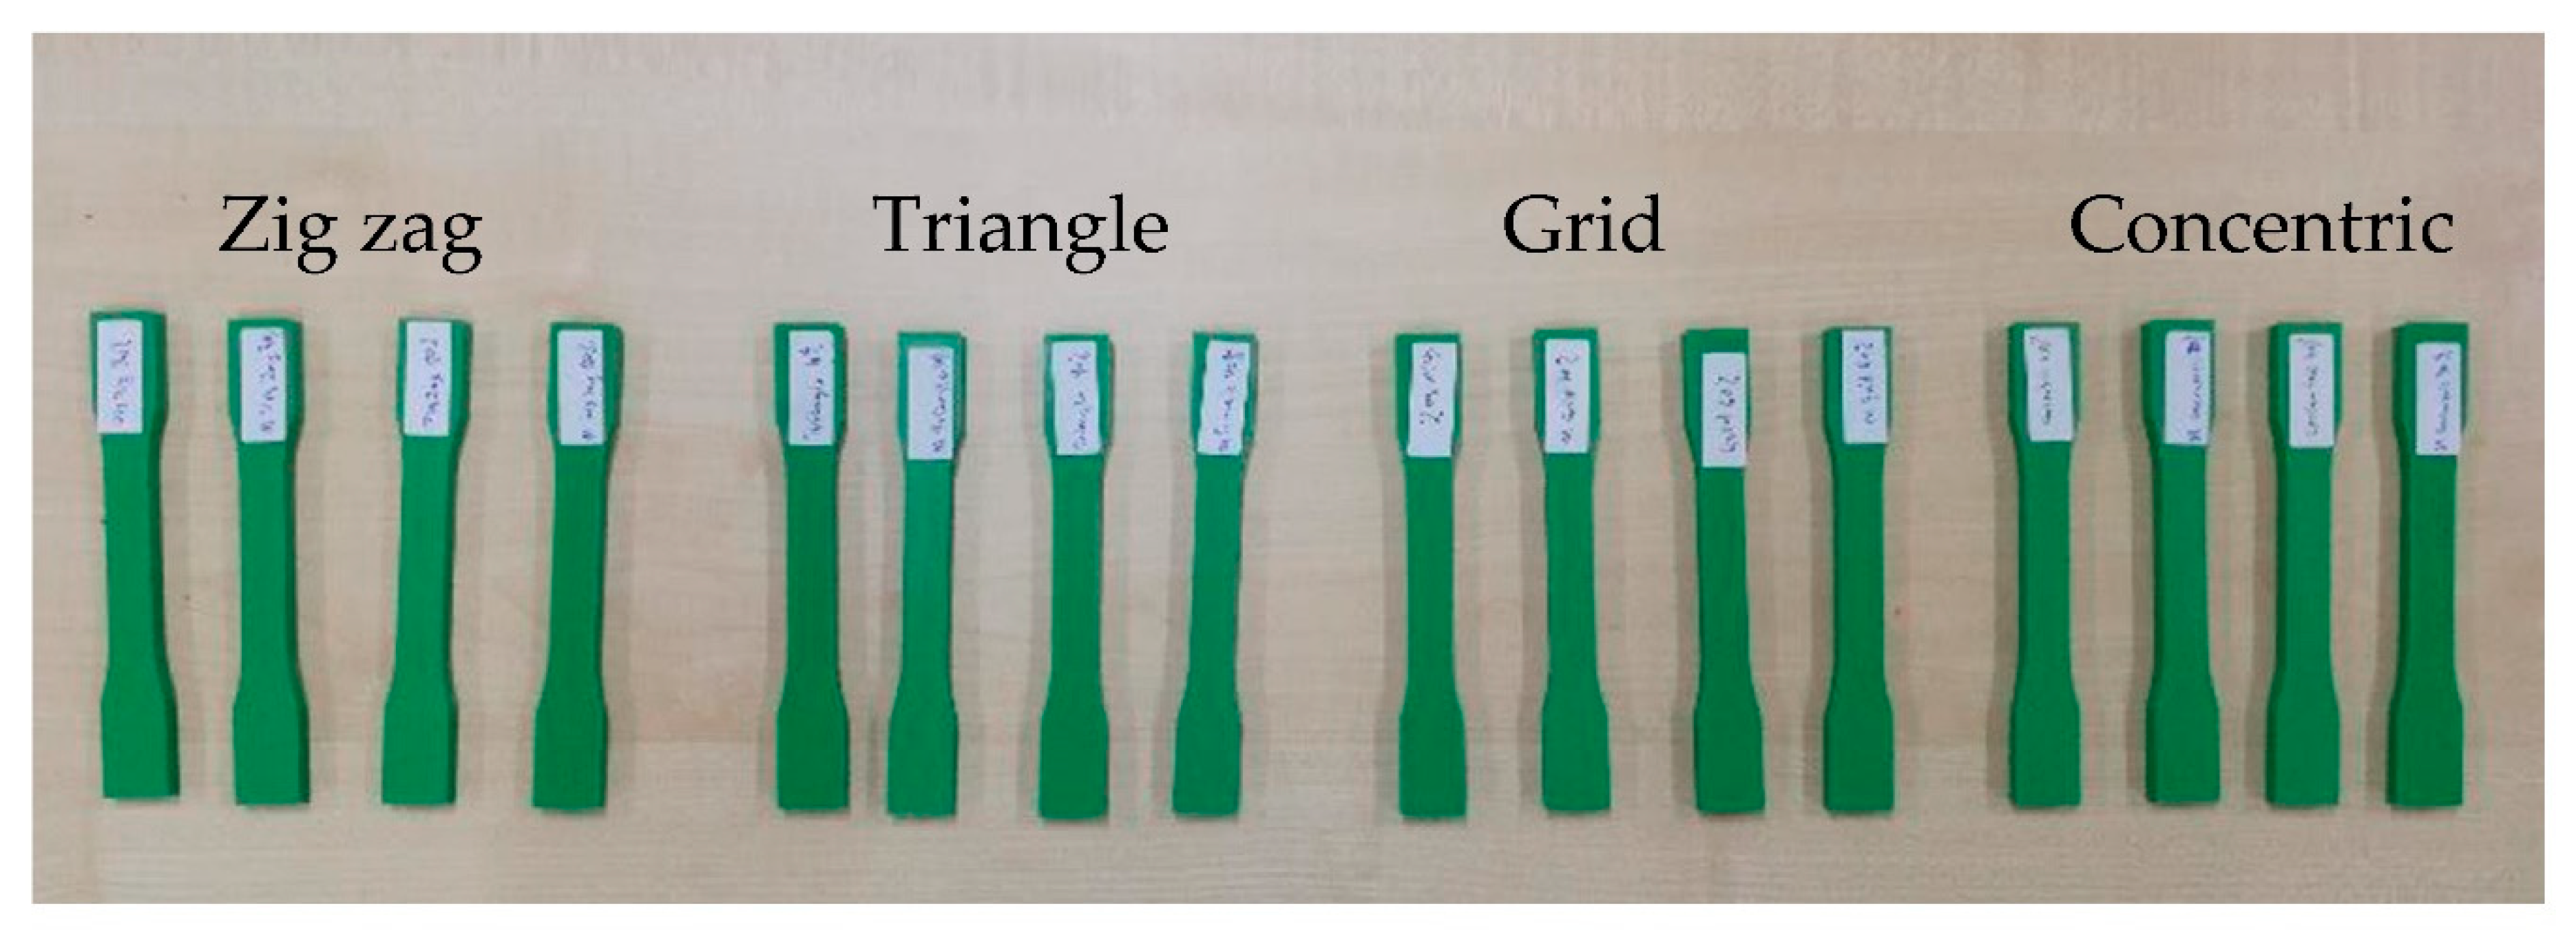
| Process & Pattern | Concentric 20% Concentric 30% | Grid 30% Grid 60% | Triangle 10% Triangle 40% | Zigzag 30% Zigzag 50% |
|---|---|---|---|---|
| CAD weight (gr) | 12 15 | 15 18 | 10 15 | 12 17 |
| FDM weight (gr) | 12 14 | 14 18 | 12 16 | 14 17 |
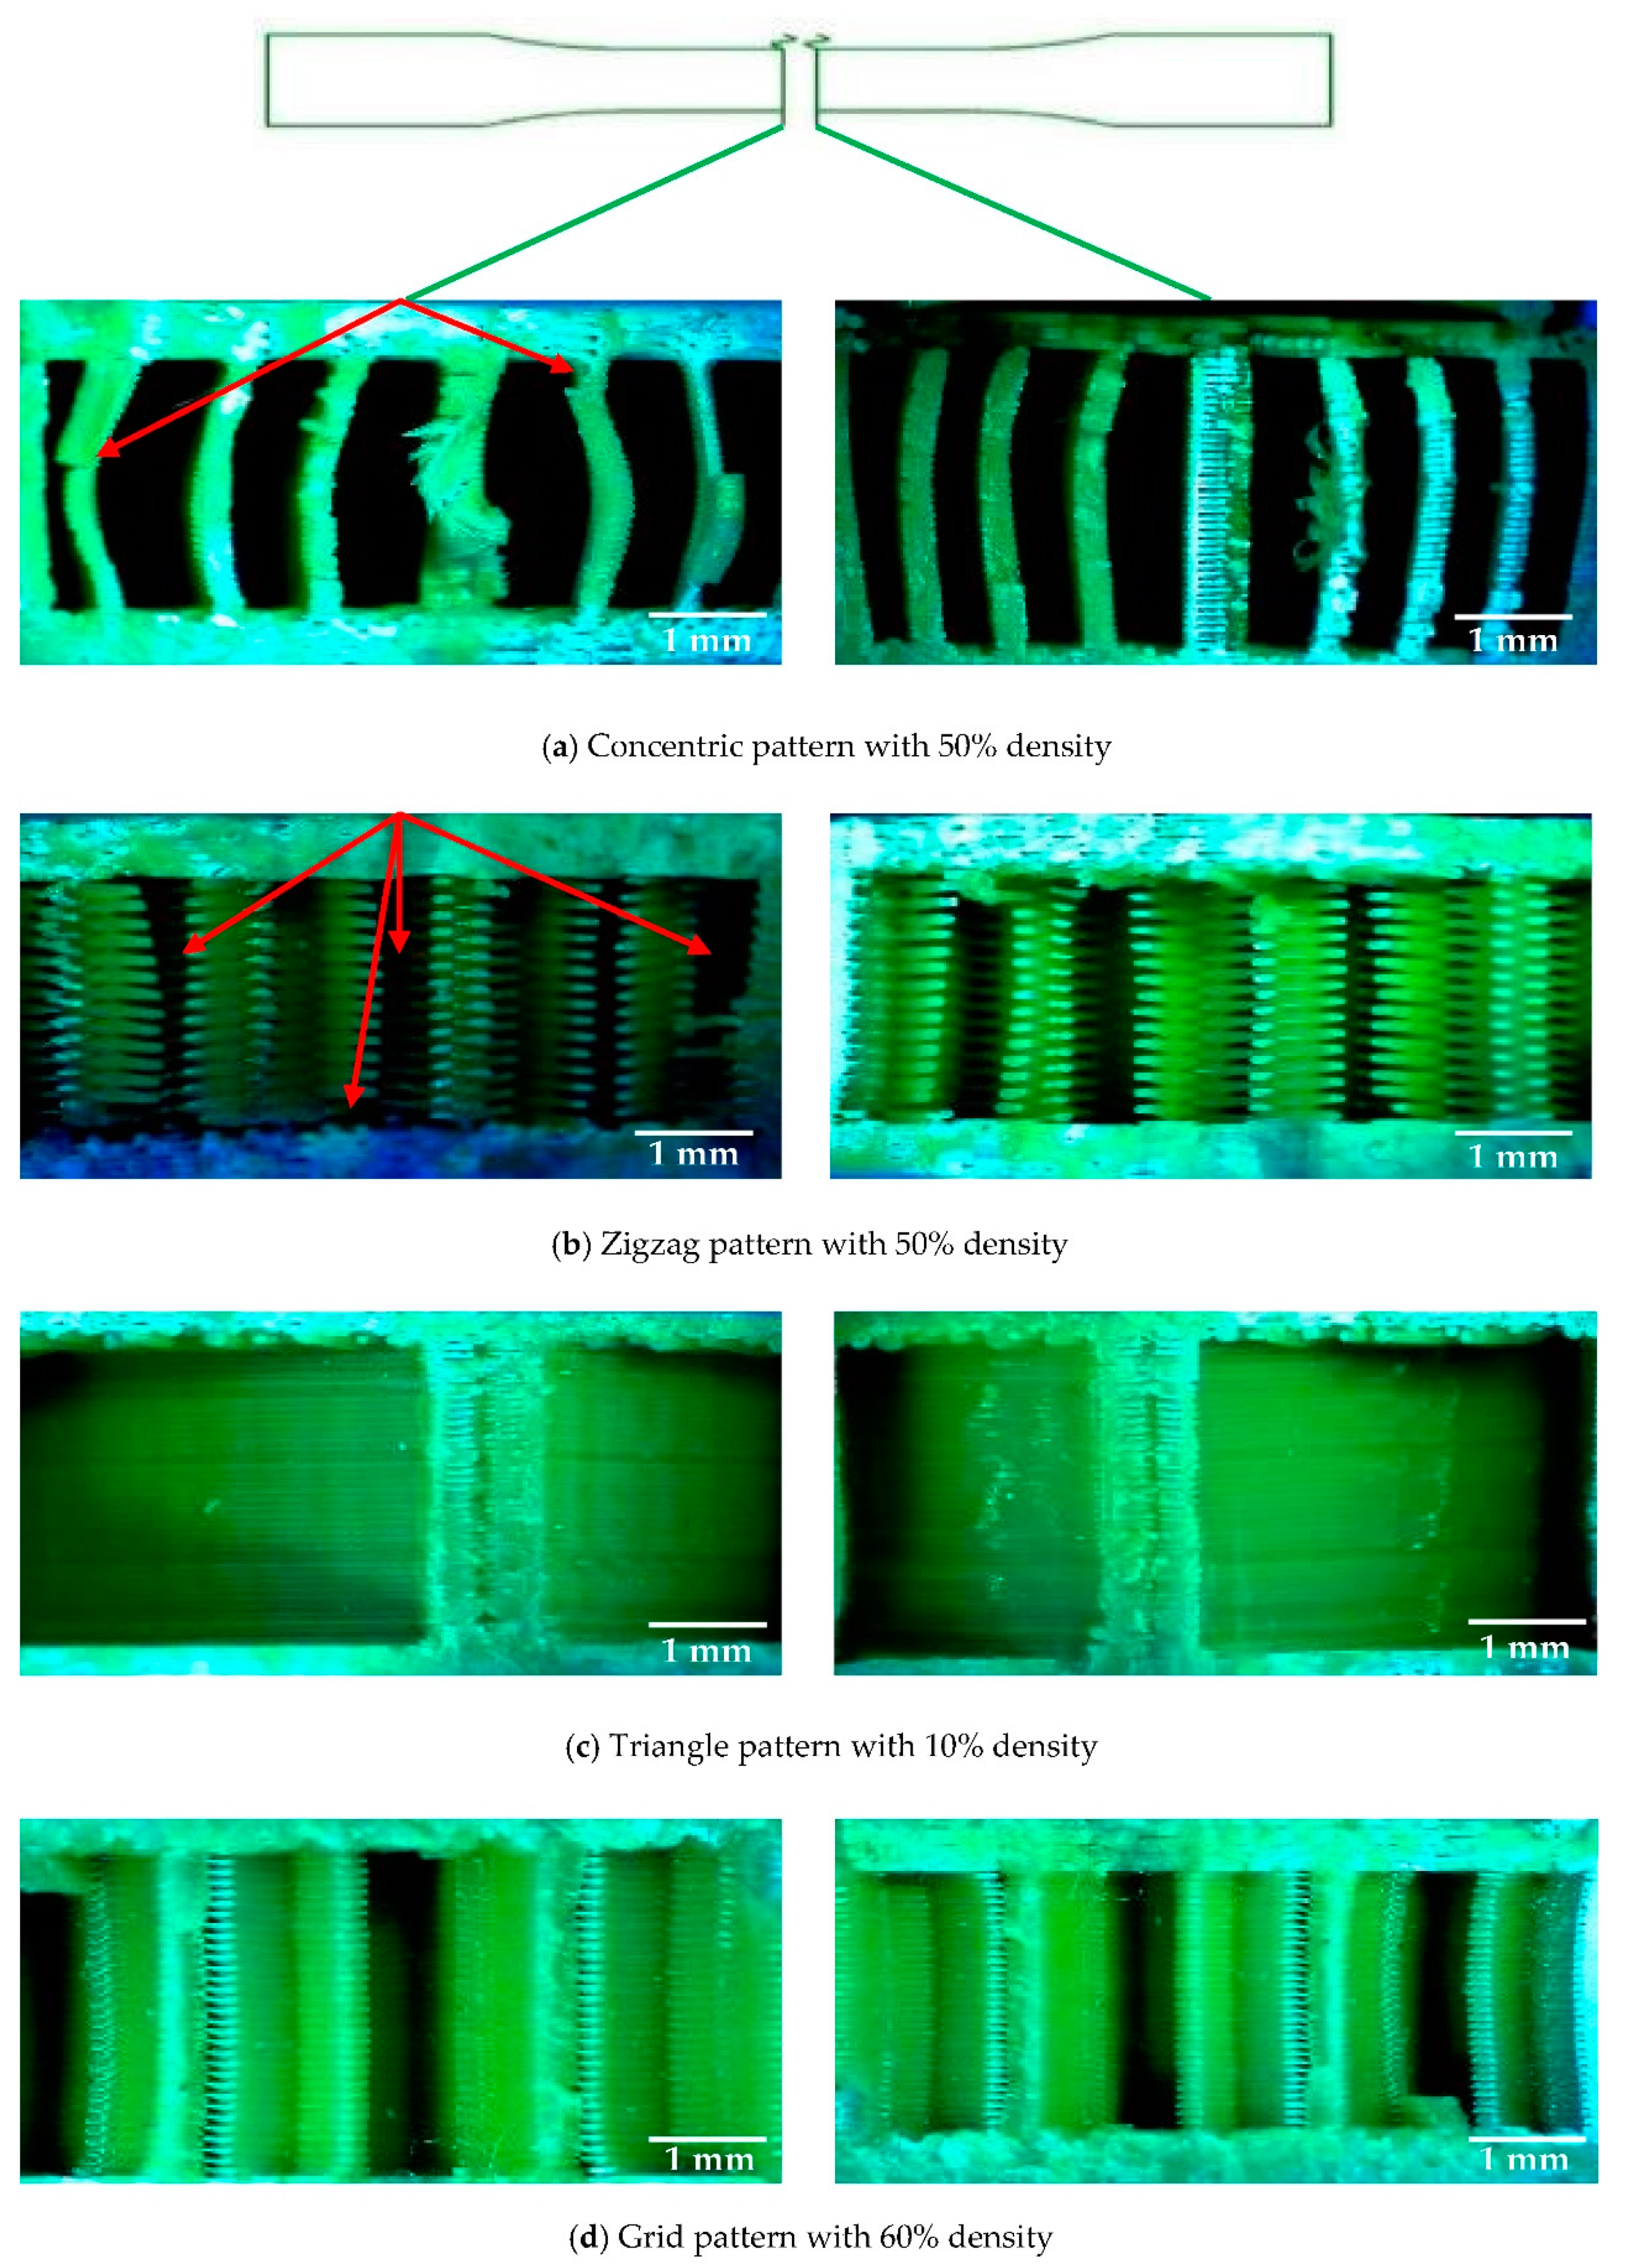
| Point | Grid Pattern | Zigzag Pattern | ||||||
|---|---|---|---|---|---|---|---|---|
| Part | Ra (µm) | Part | Ra (µm) | Part | Ra (µm) | Part | Ra (µm) | |
| 1 | CAD 30% | 2.37 | FDM 30% | 2.54 | CAD 30% | 6.78 | FDM 30% | 2.78 |
| 2 | 2.17 | 2.77 | 5.6 | 3.3 | ||||
| 3 | 2.45 | 2.93 | 6.11 | 3.4 | ||||
| 4 | 3.49 | 3.14 | 5.63 | 2.93 | ||||
| 5 | 3.1 | 2.89 | 7.3 | 2.27 | ||||
| Average | 2.72 | 2.85 | 6.28 | 2.94 | ||||
| Standard deviation | 0.56 | 0.22 | 0.74 | 0.45 | ||||
| 1 | CAD 60% | 2.52 | FDM 60% | 3.07 | CAD 50% | 4.83 | FDM 50% | 3.73 |
| 2 | 2.19 | 3.57 | 4.88 | 3.81 | ||||
| 3 | 2.25 | 2.42 | 4.5 | 2.94 | ||||
| 4 | 2.78 | 2.02 | 4.7 | 3.47 | ||||
| 5 | 2.54 | 2.3 | 4.3 | 3.26 | ||||
| Average | 2.45 | 2.67 | 4.64 | 3.45 | ||||
| Standard deviation | 0.24 | 0.63 | 0.24 | 0.36 | ||||
| Concentric pattern | Triangle pattern | |||||||
| 1 | CAD 20% | 2.12 | FDM 20% | 3.11 | CAD 10% | 3.47 | FDM 10% | 3.12 |
| 2 | 2.86 | 3.33 | 2.64 | 3.7 | ||||
| 3 | 2.4 | 3.25 | 3.78 | 4.17 | ||||
| 4 | 2.78 | 3.61 | 3.4 | 4.96 | ||||
| 5 | 2.62 | 3.17 | 2.77 | 3.81 | ||||
| Average | 2.55 | 3.29 | 3.21 | 3.95 | ||||
| Standard deviation | 0.30 | 0.20 | 0.49 | 0.68 | ||||
| 1 | CAD 30% | 1.97 | FDM 30% | 3.08 | CAD 40% | 2.83 | FDM 40% | 3.11 |
| 2 | 2.23 | 3.89 | 3.03 | 3.85 | ||||
| 3 | 2.38 | 2.74 | 3.13 | 4.41 | ||||
| 4 | 2.56 | 3.47 | 2.87 | 3.9 | ||||
| 5 | 2.77 | 2.22 | 3.04 | 2.82 | ||||
| Average | 2.38 | 3.08 | 2.98 | 3.62 | ||||
| Standard deviation | 0.31 | 0.64 | 0.13 | 0.64 | ||||
| Sample | von Mises (MPa) |
|---|---|
| Concen 30 % |  |
| Grid 60% |  |
| Triangle 10% | 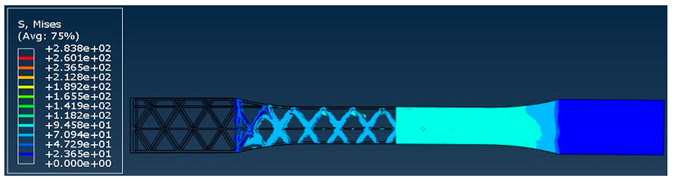 |
| Zigzag 30% | 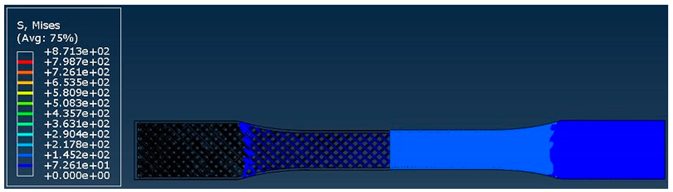 |
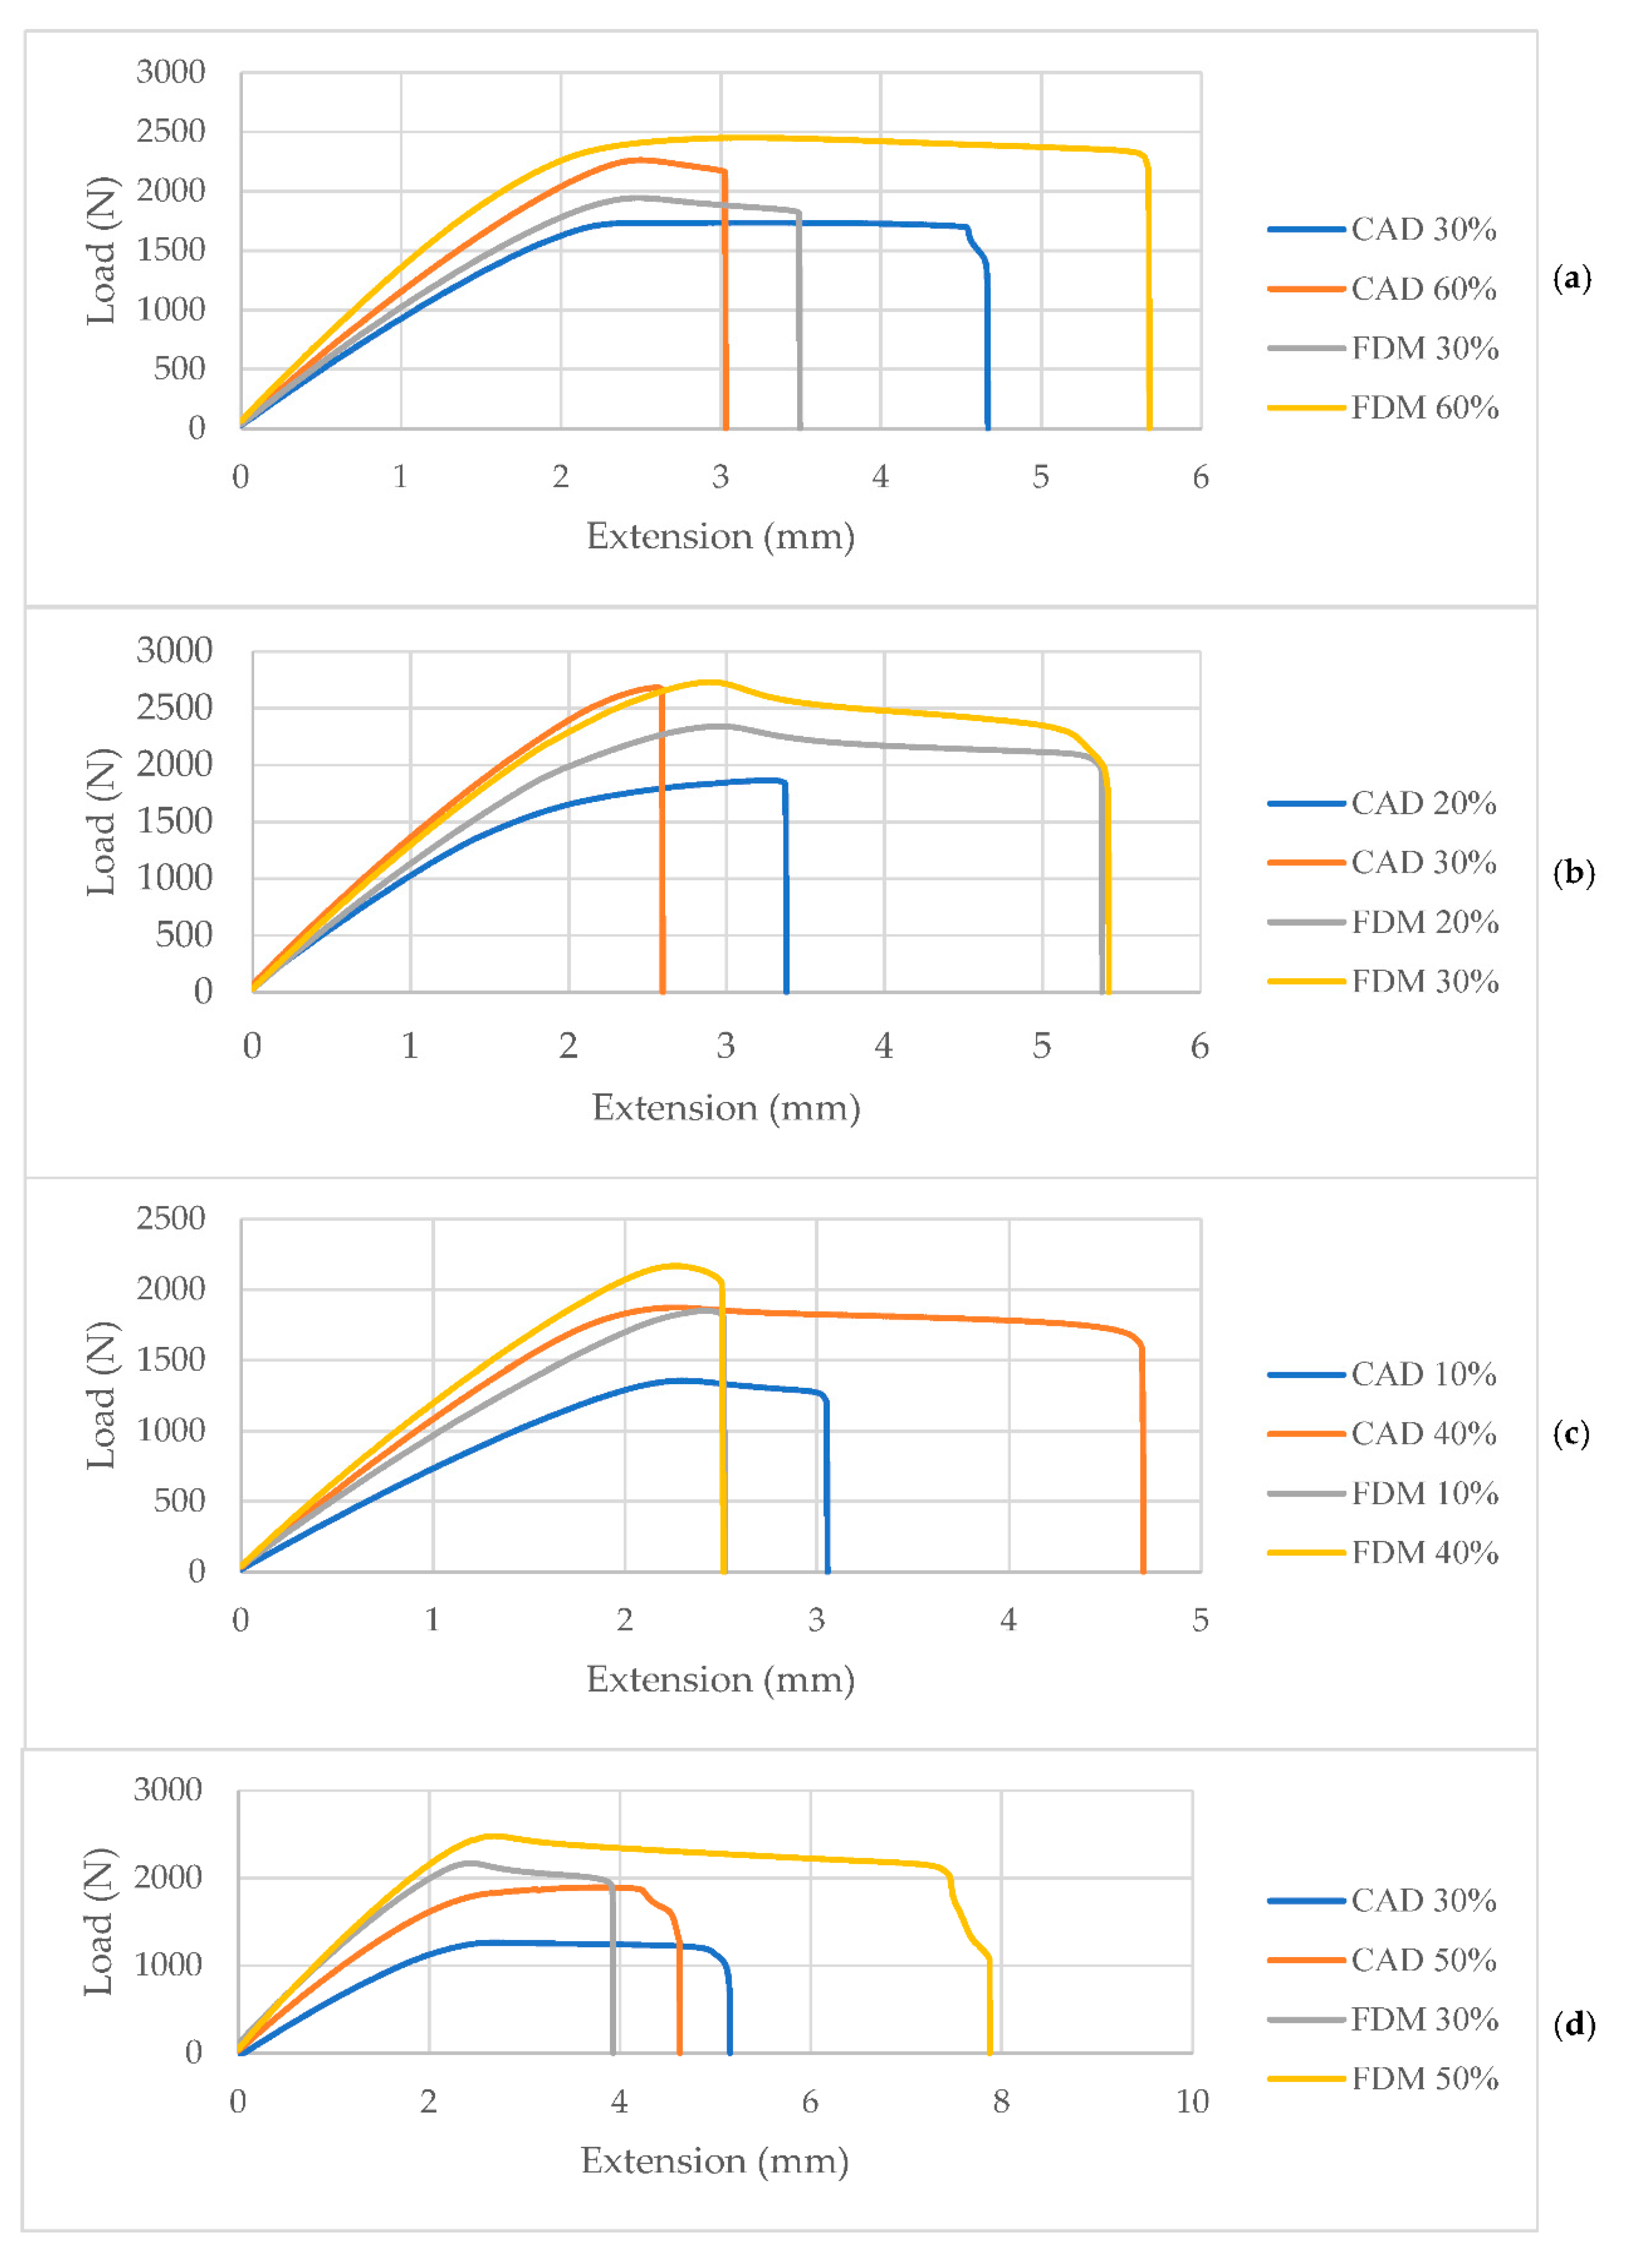
| Pattern | Infill Density (%) | Maximum Load (N) | Stress at Max. Load (MPa) | Strain at Max. Load (%) | Standard Deviation |
|---|---|---|---|---|---|
| Grid | CAD 30 | 1736 | 19.08 | 6.65 | 198 |
| FDM 30 | 1944 | 21.36 | 4.96 | 231 | |
| CAD 60 | 2263 | 24.87 | 4.99 | 110 | |
| FDM 60 | 2452 | 26.95 | 6.41 | 320 | |
| Concentric | CAD 20 | 1866 | 20.51 | 6.57 | 131 |
| FDM 20 | 2342 | 25.74 | 5.92 | 98 | |
| CAD 30 | 2683 | 29.49 | 5.13 | 230 | |
| FDM 30 | 2732 | 30.02 | 5.79 | 399 | |
| Triangle | CAD 10 | 1357 | 14.92 | 4.57 | 130 |
| FDM 10 | 1851 | 20.34 | 4.82 | 253 | |
| CAD 40 | 1873 | 20.58 | 4.55 | 167 | |
| FDM 40 | 2168 | 23.82 | 4.52 | 336 | |
| Zigzag | CAD 30 | 1264 | 13.9 | 5.42 | 200 |
| FDM 30 | 2172 | 23.87 | 4.88 | 111 | |
| CAD 50 | 1893 | 20.81 | 7.78 | 367 | |
| FDM 50 | 2481 | 27.27 | 5.37 | 518 |
Publisher’s Note: MDPI stays neutral with regard to jurisdictional claims in published maps and institutional affiliations. |
© 2021 by the authors. Licensee MDPI, Basel, Switzerland. This article is an open access article distributed under the terms and conditions of the Creative Commons Attribution (CC BY) license (https://creativecommons.org/licenses/by/4.0/).
Share and Cite
Lalegani Dezaki, M.; Ariffin, M.K.A.M.; Serjouei, A.; Zolfagharian, A.; Hatami, S.; Bodaghi, M. Influence of Infill Patterns Generated by CAD and FDM 3D Printer on Surface Roughness and Tensile Strength Properties. Appl. Sci. 2021, 11, 7272. https://doi.org/10.3390/app11167272
Lalegani Dezaki M, Ariffin MKAM, Serjouei A, Zolfagharian A, Hatami S, Bodaghi M. Influence of Infill Patterns Generated by CAD and FDM 3D Printer on Surface Roughness and Tensile Strength Properties. Applied Sciences. 2021; 11(16):7272. https://doi.org/10.3390/app11167272
Chicago/Turabian StyleLalegani Dezaki, Mohammadreza, Mohd Khairol Anuar Mohd Ariffin, Ahmad Serjouei, Ali Zolfagharian, Saghi Hatami, and Mahdi Bodaghi. 2021. "Influence of Infill Patterns Generated by CAD and FDM 3D Printer on Surface Roughness and Tensile Strength Properties" Applied Sciences 11, no. 16: 7272. https://doi.org/10.3390/app11167272
APA StyleLalegani Dezaki, M., Ariffin, M. K. A. M., Serjouei, A., Zolfagharian, A., Hatami, S., & Bodaghi, M. (2021). Influence of Infill Patterns Generated by CAD and FDM 3D Printer on Surface Roughness and Tensile Strength Properties. Applied Sciences, 11(16), 7272. https://doi.org/10.3390/app11167272