Article

Seismic Performance of Dam Piers Retrofitted with Reinforced Polymer Cement Mortar

1
Department of Civil Engineering, Kyushu University, Fukuoka 819-0395, Japan
2
Research Institute Technical Solution Headquarters, Kyushu Electric Power Co., Inc., Fukuoka 815-8520, Japan
*
Author to whom correspondence should be addressed.
Appl. Sci. 2021, 11(16), 7255; https://doi.org/10.3390/app11167255
Submission received: 7 June 2021 / Revised: 30 July 2021 / Accepted: 3 August 2021 / Published: 6 August 2021
(This article belongs to the Special Issue Seismic Assessment and Design of Structures)

Abstract

:
The deterioration of existing reinforced concrete (RC) structures is regarded as a problem worldwide. In Japan especially, the deterioration of RC dam structures has become severe. Many such dams meet design standards that were in place at the time of construction but do not meet the current seismic design standards, and appropriate seismic retrofitting is required. If the dam pier, which is an important part of the dam related to water storage, is damaged by an earthquake, the gate cannot be opened or closed, and the amount of water stored cannot be controlled. Therefore, the seismic retrofitting of dam piers is a top priority. However, various construction restrictions exist for dam piers, such as only the cross-section on the downstream side can be reinforced, and not on the upstream side where water is stored. Thus, it is difficult to apply the same reinforcement method that is applied to the piers of general road bridges. Therefore, in this study, we confirm the effectiveness of the SRS method (seismic retrofitting using cement mortar for shotcrete), which is suitable for partial reinforcement. Specifically, the dam piers of four types of existing dams were modeled using the three-dimensional finite element method, and a seismic response analysis was performed by inputting two types of seismic waveforms having different characteristics. As a result, the reinforcement effect of this method was verified according to structural characteristics. Furthermore, the effect of the reinforcement range on the reinforcement effect was clarified.

1. Introduction

Dams are constructed mainly for flood control and water use. A dam pier is a tower-shaped reinforced concrete (RC) structure that opens and closes gates, such as spillways installed at the top of a gravity dam, as shown in Figure 1. It supports the drain gates attached to the dam, and thus crucial to water storage. If the dam pier breaks down during an earthquake, the water storage function of the dam is lost and there is a significant impact on the surrounding environment; therefore, the seismic resistance of the dam pier must be carefully considered. However, some dams in Japan have severely deteriorated due to aging. To improve their earthquake resistance, various reinforcement methods that are used for bridge piers [1] have been considered for dam pier reinforcement, such as retrofitting with concrete, steel jacketing and fiber sheets [2,3,4,5,6]. The reinforcing effect of these methods has been confirmed by some studies, but it is difficult to use these methods to strengthen dam piers. Owing to the structural characteristics of dam piers such as the one shown in Figure 1, there are limitations involved in their reinforcement: (i) it is difficult to install a formwork on the dam body; (ii) to reduce the percentage inhibition of the cross-sectional area of a river, the cross-section after reinforcement should not be as large as possible, (iii) if the weight increase due to the reinforcement is large, it will affect the dam body; (iv) as shown in Figure 2, only partial reinforcement is possible owing to the influence of gates and water storage. In light of these restrictions, the application of the SRS (seismic retrofitting using cement mortar for shotcrete) method is considered to be optimal for reinforcing dam piers. This method involves the placement of rebar on the existing parts of the dam and then spraying polymer cement mortar (PCM) after scraping their surface. In this study, the reinforced part on which the PCM is sprayed after the reinforcing bar is attached is called reinforced polymer cement mortar (RPCM). As shown in Figure 3, this method is suitable for partial reinforcement. It is possible to reinforce the existing part by installing the reinforcing bar on the existing concrete part after chipping and spraying PCM on it. In addition, this method has the advantages of a lesser reinforcement thickness than the conventional RC winding method, no need to install formwork and suitability to partial reinforcement. This method is easy to apply partially and can reduce the reinforcement thickness and additional mass because reinforcement is performed after scraping the surface. This means that the SRS construction method can reduce the risk that an increase in the structure’s weight will increase the seismic load. Furthermore, by using PCM for the surface layer, which has a dense internal structure, high permeability resistance can be ensured, so it can be said that this method is suitable for dam piers.
Many past studies on the seismic resistance of dams have examined the seismic resistance of the entire dam structure [7,8,9,10]. However, there are few studies on the seismic resistance of dam piers that are relevant to the present study. In addition, many studies have been conducted on the bending reinforcement effect of reinforcement methods such as RC winding reinforcement, steel plate winding reinforcement and fiber reinforcement as a method of reinforcing similar structural members such as RC piers. However, few studies [11,12] have been conducted on the reinforcement effect of the SRS method. Nakamura et al. [11] confirmed the seismic retrofitting effect of this method by reinforcing RC column specimens that modeled existing bridge piers by the SRS method and by conducting a peak-to-peak alternative load test that assumed earthquake conditions. As a result, it was confirmed that the specimen to which the method was applied showed an increase in horizontal physical strength, sufficient toughness and energy absorption capacity, and it had almost the same seismic retrofitting effect as the design. In addition, by applying this method to existing RC pier type specimens with a cut-off part, the bending strength of the cut-off part was improved, and the seismic reinforcement effect was confirmed. A review of previous studies revealed that there are no studies on the seismic resistance of dam piers to which the SRS method was applied, which demonstrates the novelty of this study.
Based on the above, to confirm the effectiveness of the SRS method as a seismic retrofitting method, four types of existing dam piers were modeled by FEM in this study and the reinforcement effect of the SRS method was examined by performing seismic response analysis. Furthermore, the effect of the cross-sectional shape and reinforcement range on the reinforcement effect was quantitatively analyzed.

2. Application of SRS Method to RC Beam Members (and Validation of FE Model)

To clarify the static load-bearing performance when the SRS method is applied to a bending fracture type RC beam, which is a primary structural member, and to verify the accuracy of the finite element (FE) analysis for the RC beam reinforced by the SRS method, a flat beam specimen that modeled the dam pier reinforced by the SRS method was produced, and a static loading experiment was conducted. Subsequently, a static test simulation using FEM was performed, and the analysis results were compared with the experimental results to confirm their validity.

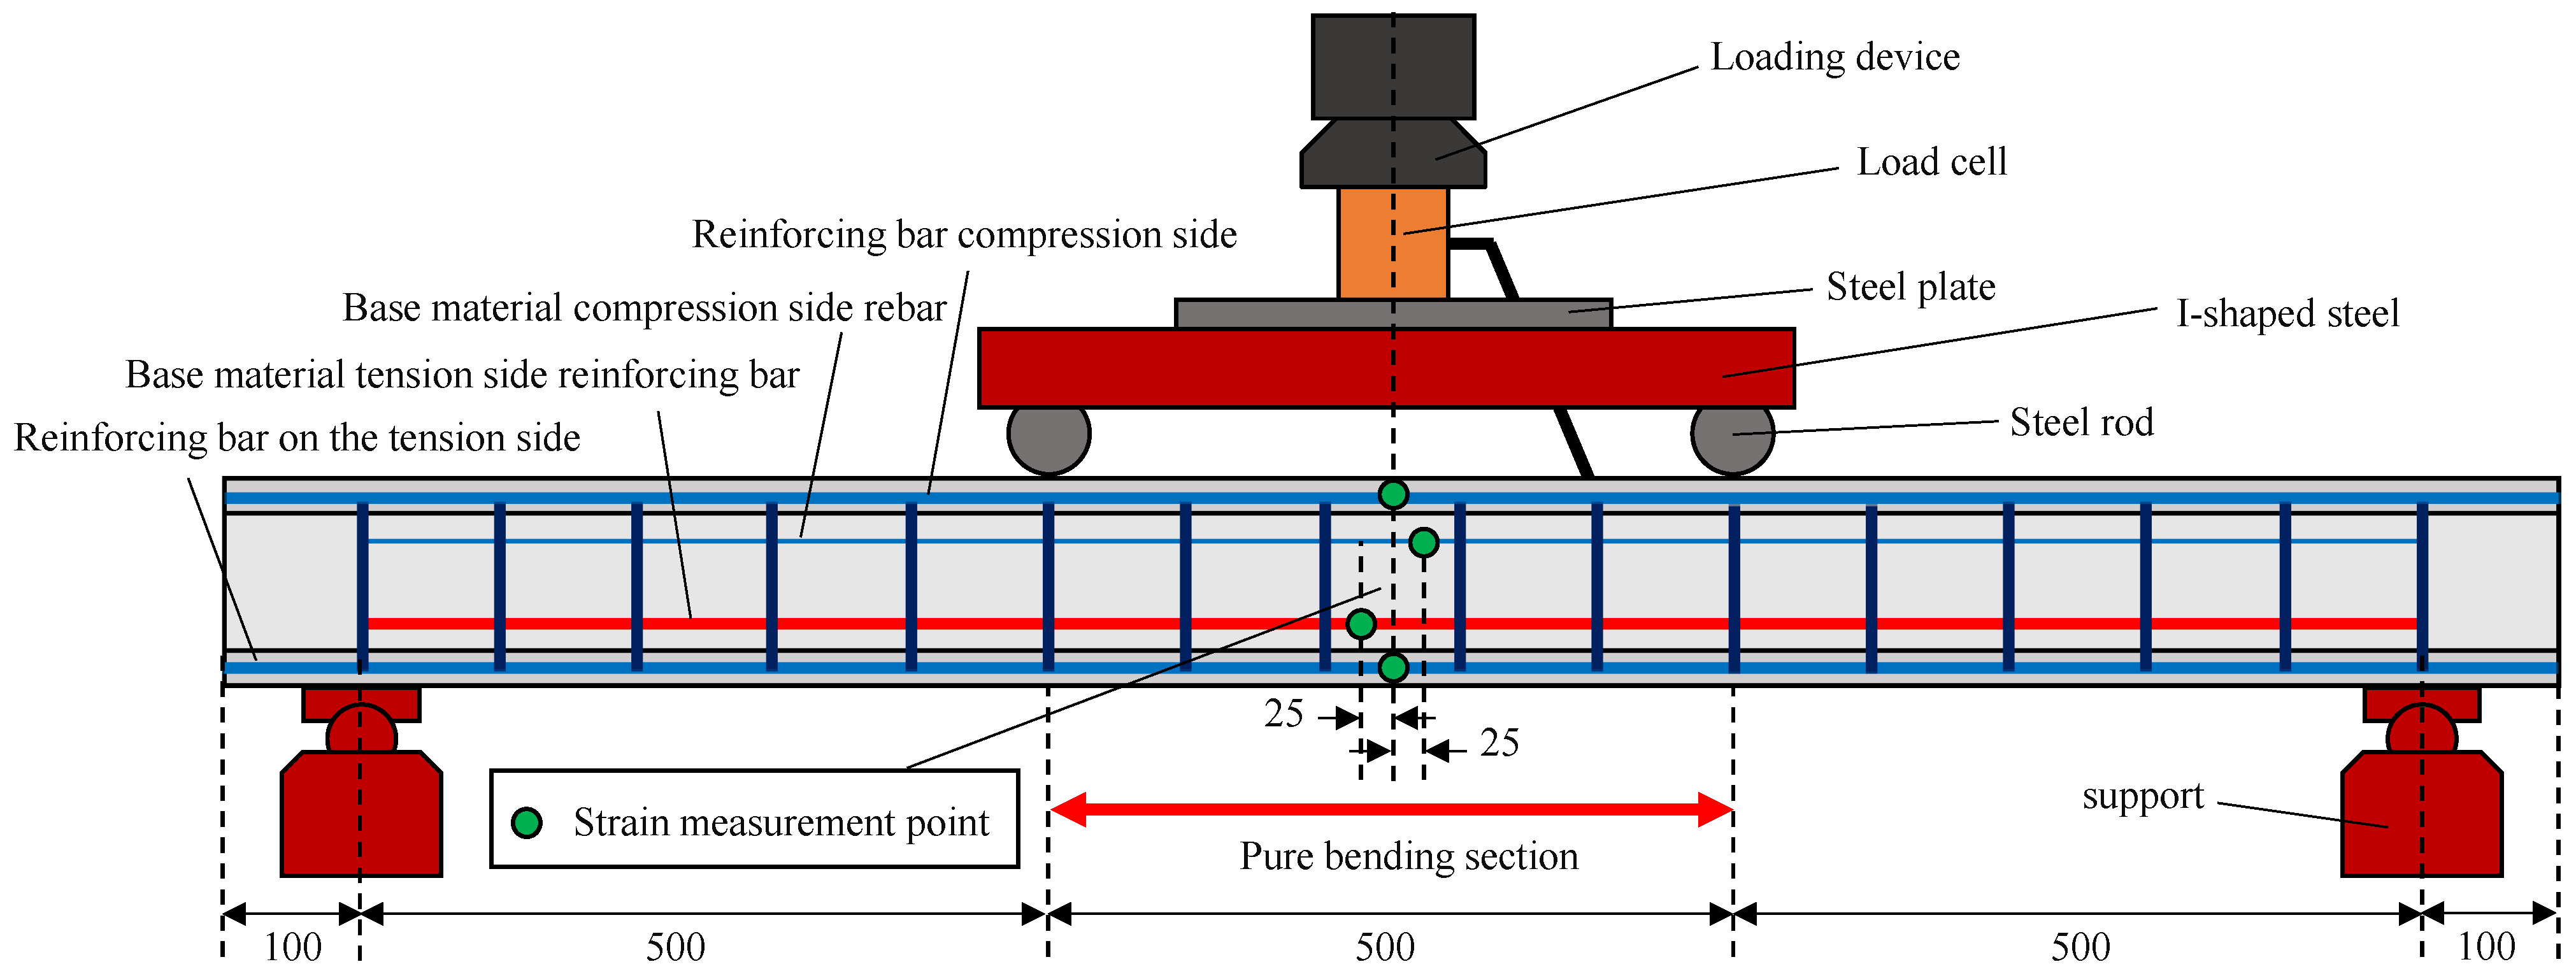
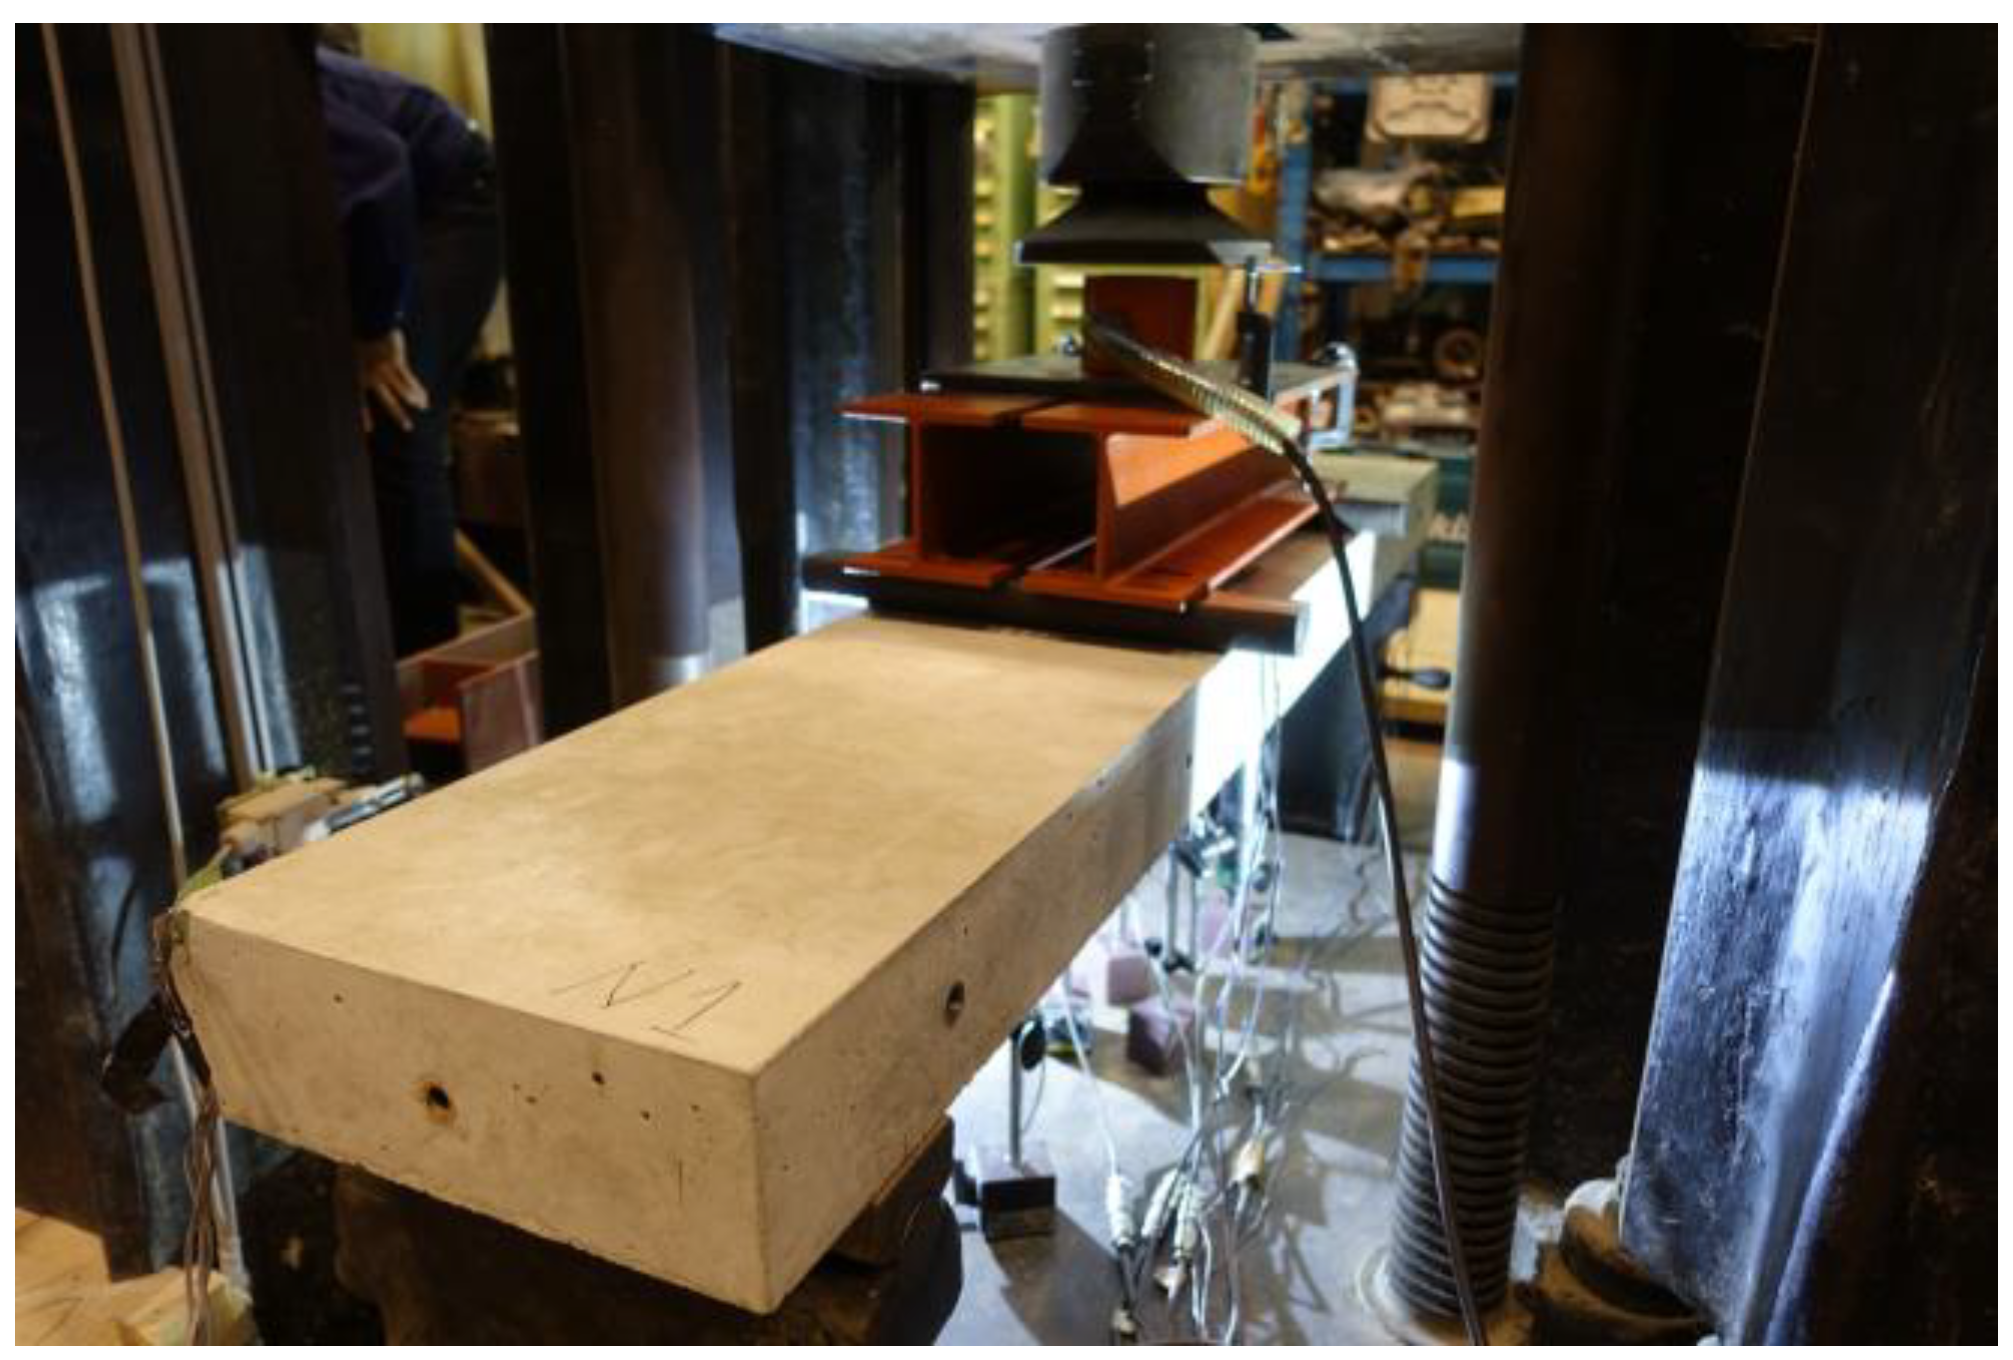
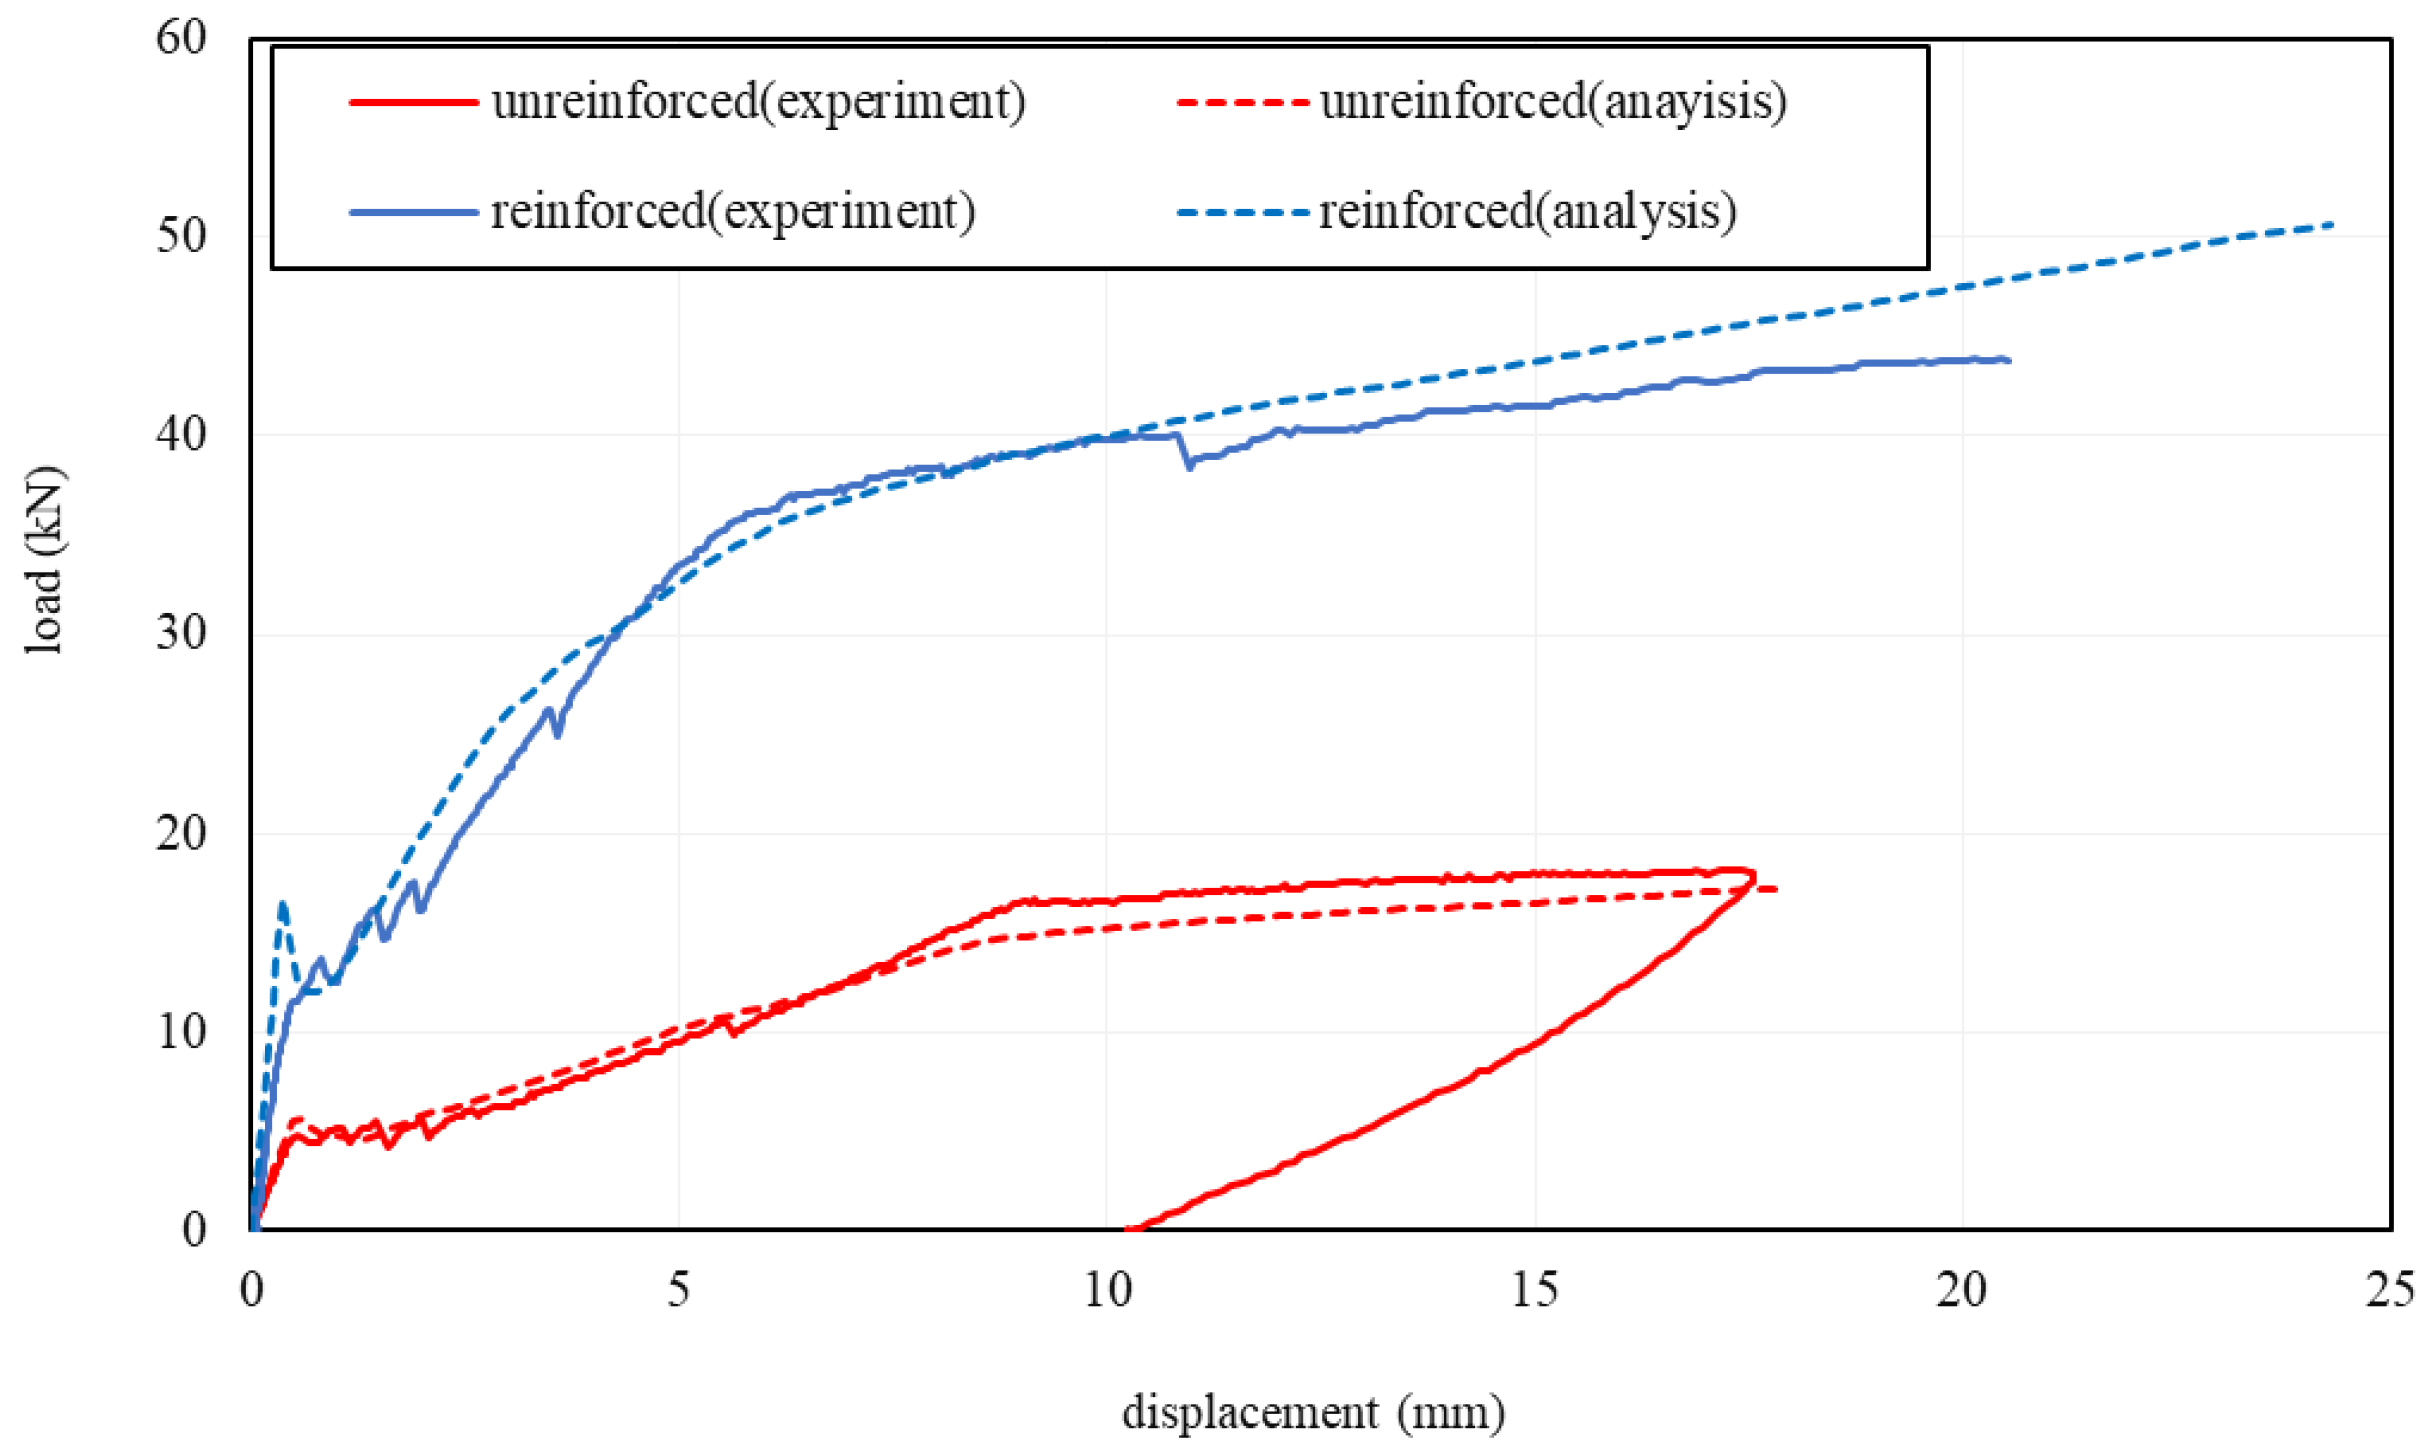
2.1. Outline of Static Loading Experiment

Figure 4 and Figure 5 show the cross-sectional dimensions of the beam specimens. In this study, the RC beam that was not reinforced by the SRS method is referred to as the RC specimen, and the RC beam reinforced with the SRS method is referred to as the RPCM specimen. D10 reinforcing bars were placed on the tensile side of the RC specimen, D6 reinforcing bars were placed on the compression side, and D10 reinforcing bars were placed at 100 mm intervals for shear reinforcement. For the RPCM specimen, a mortar layer with D6 reinforcement in the longitudinal direction was added around the cross-section of the RC specimen. In addition, D6 rebars with a thickness of 25 mm were also arranged as shear reinforcements at 100 mm intervals in the mortar layer. In this study, a simple reinforcement which was expected to adhere between the reinforcing bars and PCM was used for the ordinary purpose of seismic retrofitting of dam piers, and it has been confirmed that unexpected peeling or delamination do not occur in the bending test of the RPCM beam. However, additional studies will be required for other applications in which a large shear force or a tensile force that causes peeling or delamination in the PCM layer.
Table 1 shows the average values of the material properties obtained using the material test. In this study, three specimens with the same cross-section specifications were prepared as both RC and RPCM specimens, and three static loading tests were conducted on each specimen. Two-point static bending tests were performed with a pure bending section length of 500 mm, as shown in Figure 6, and Figure 7 shows a photograph of the experimental equipment.

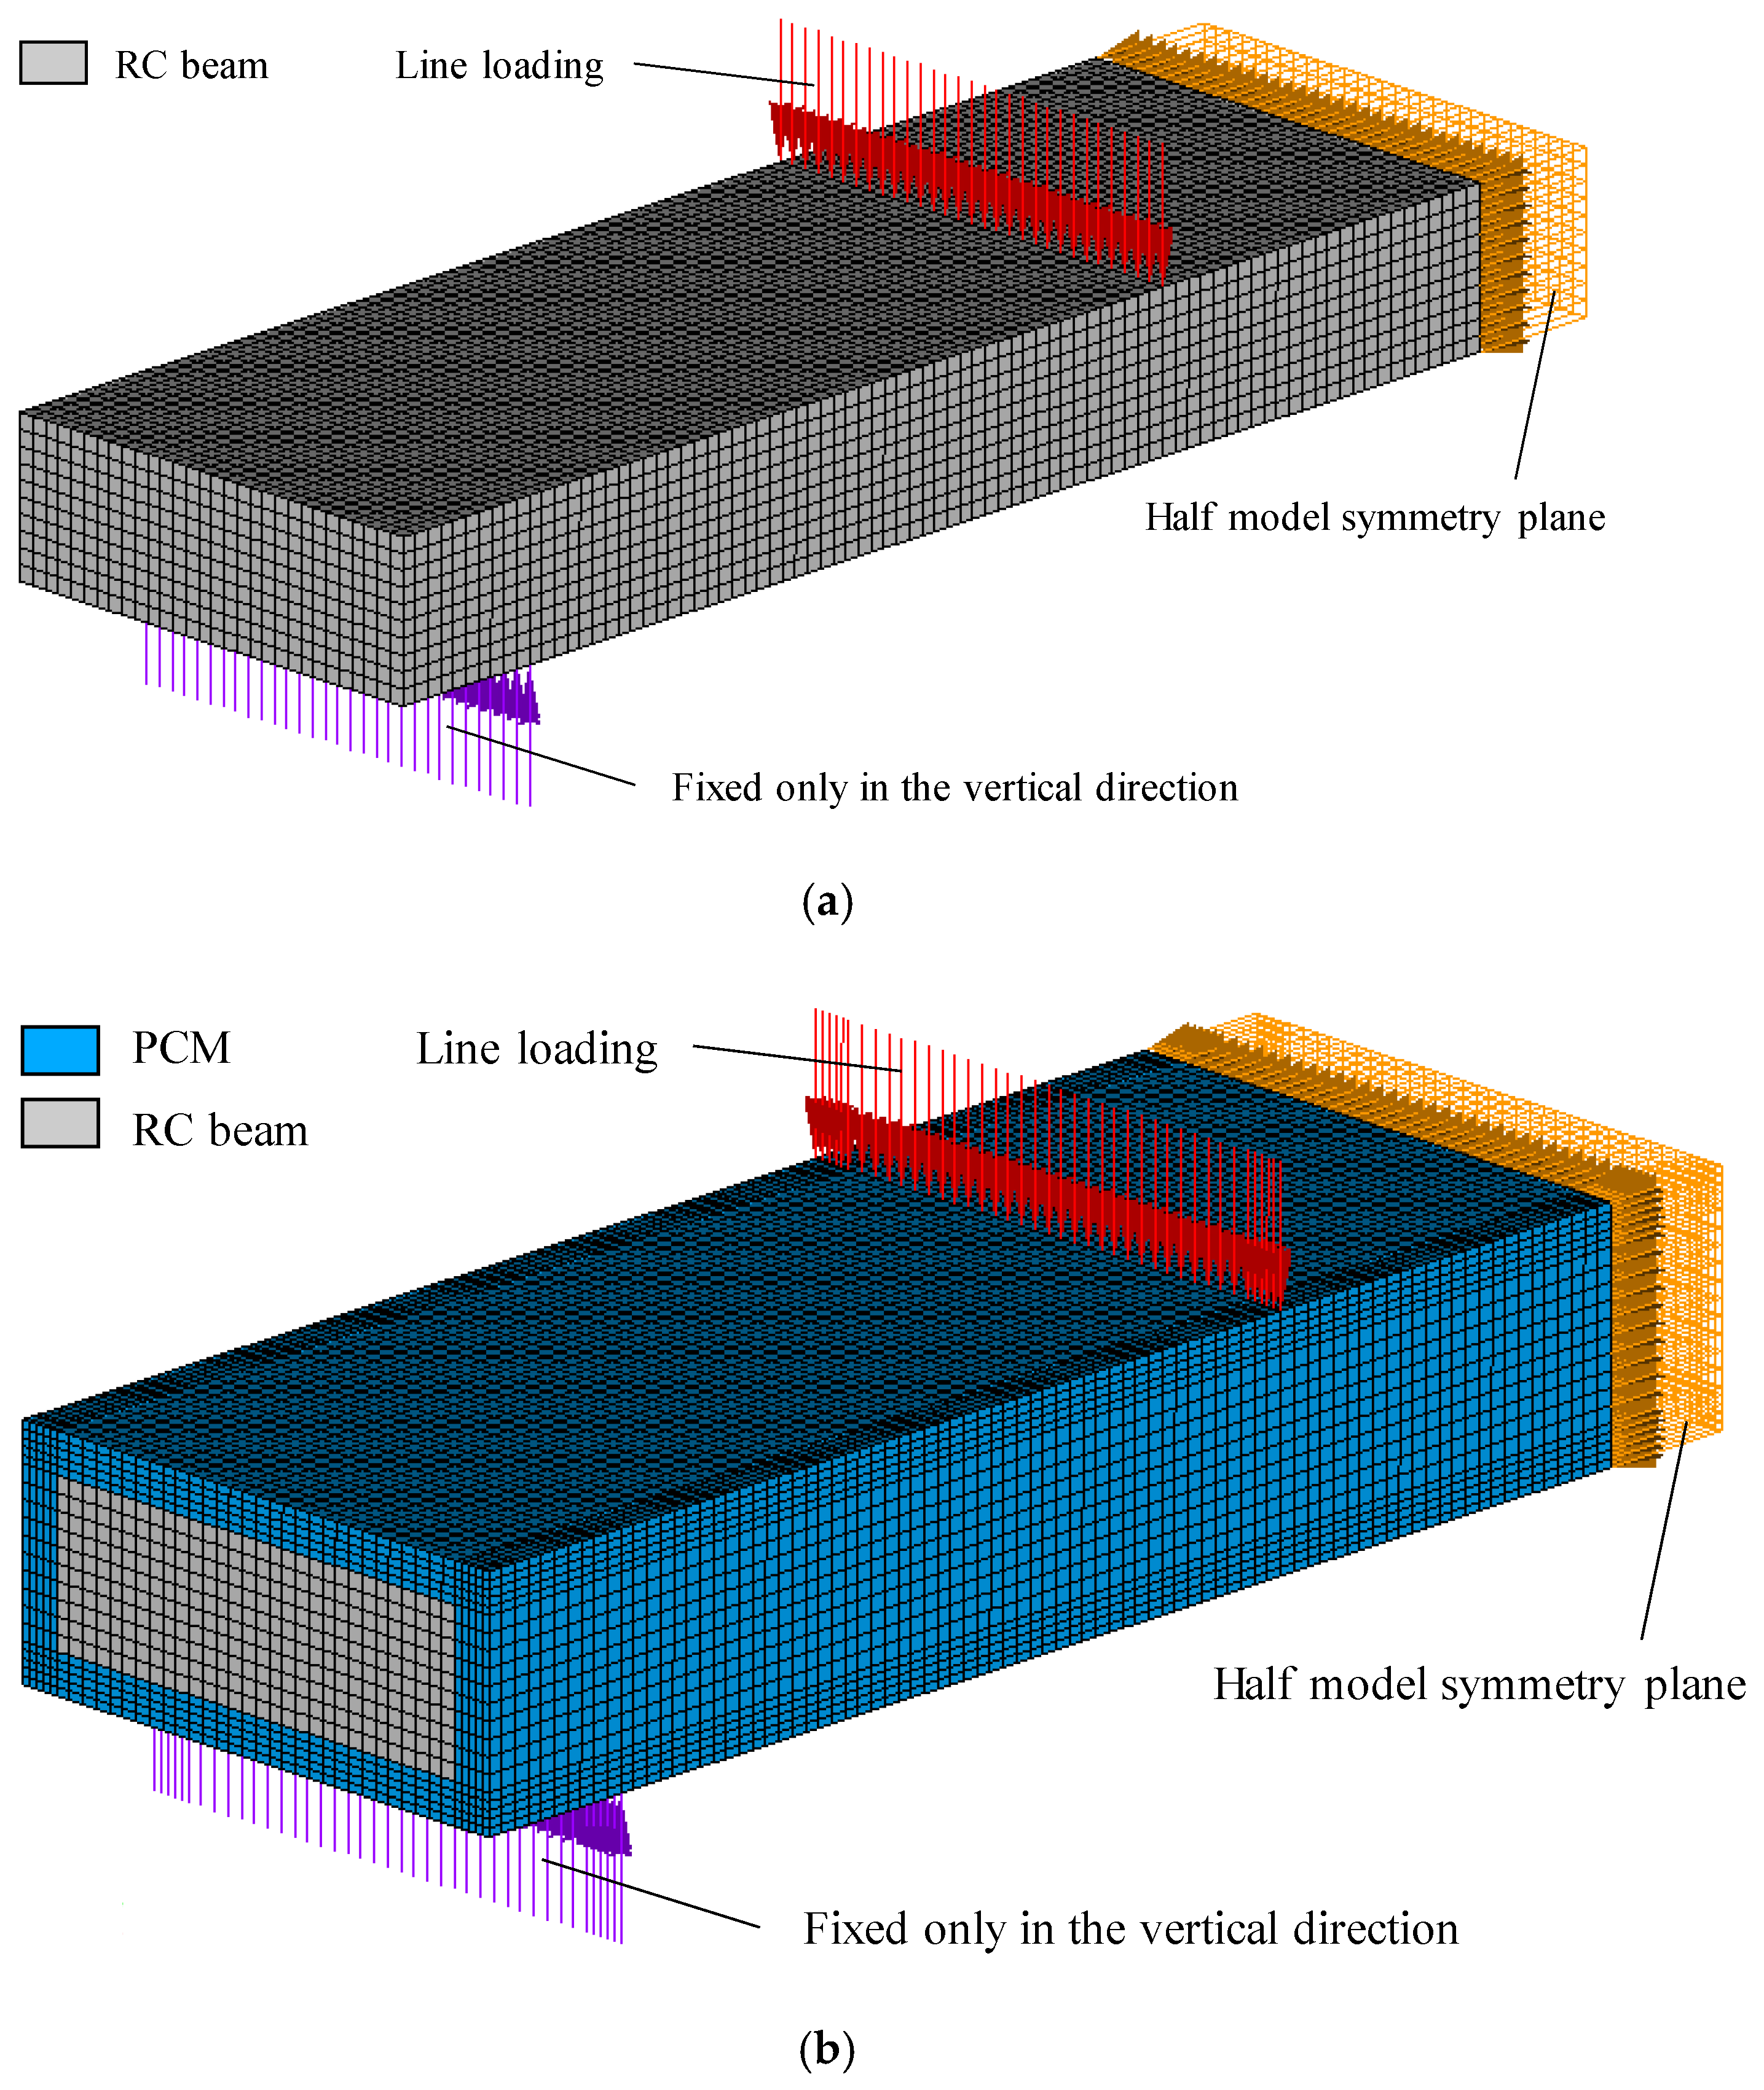
2.2. Outline of FE Analysis

In this analysis, to confirm whether the reinforcement effect of the SRS method and the elasto-plastic behavior until the final failure could be accurately predicted by FEM, we attempted to reproduce the experimental results for both the RC and the RPCM specimens. The analysis models are presented in Figure 8. The concrete was modeled using a three-dimensional solid element, and the reinforcing bar was modeled using a truss element. Complete adhesion between the concrete and rebar elements was assumed. Regarding the boundary conditions of the specimen, an analytical model that discretized only half of the domain was used, as shown in Figure 8, considering the symmetry at midspan for both the RC and RPCM specimens. Complete adhesion between the concrete and the RPCM was also assumed at their interface because there was no significant separation during the experiment. For the material properties of both the RC and RPCM specimens, the values of compressive strength, tensile strength and static elastic modulus obtained by the material test shown in Table 1 were used.

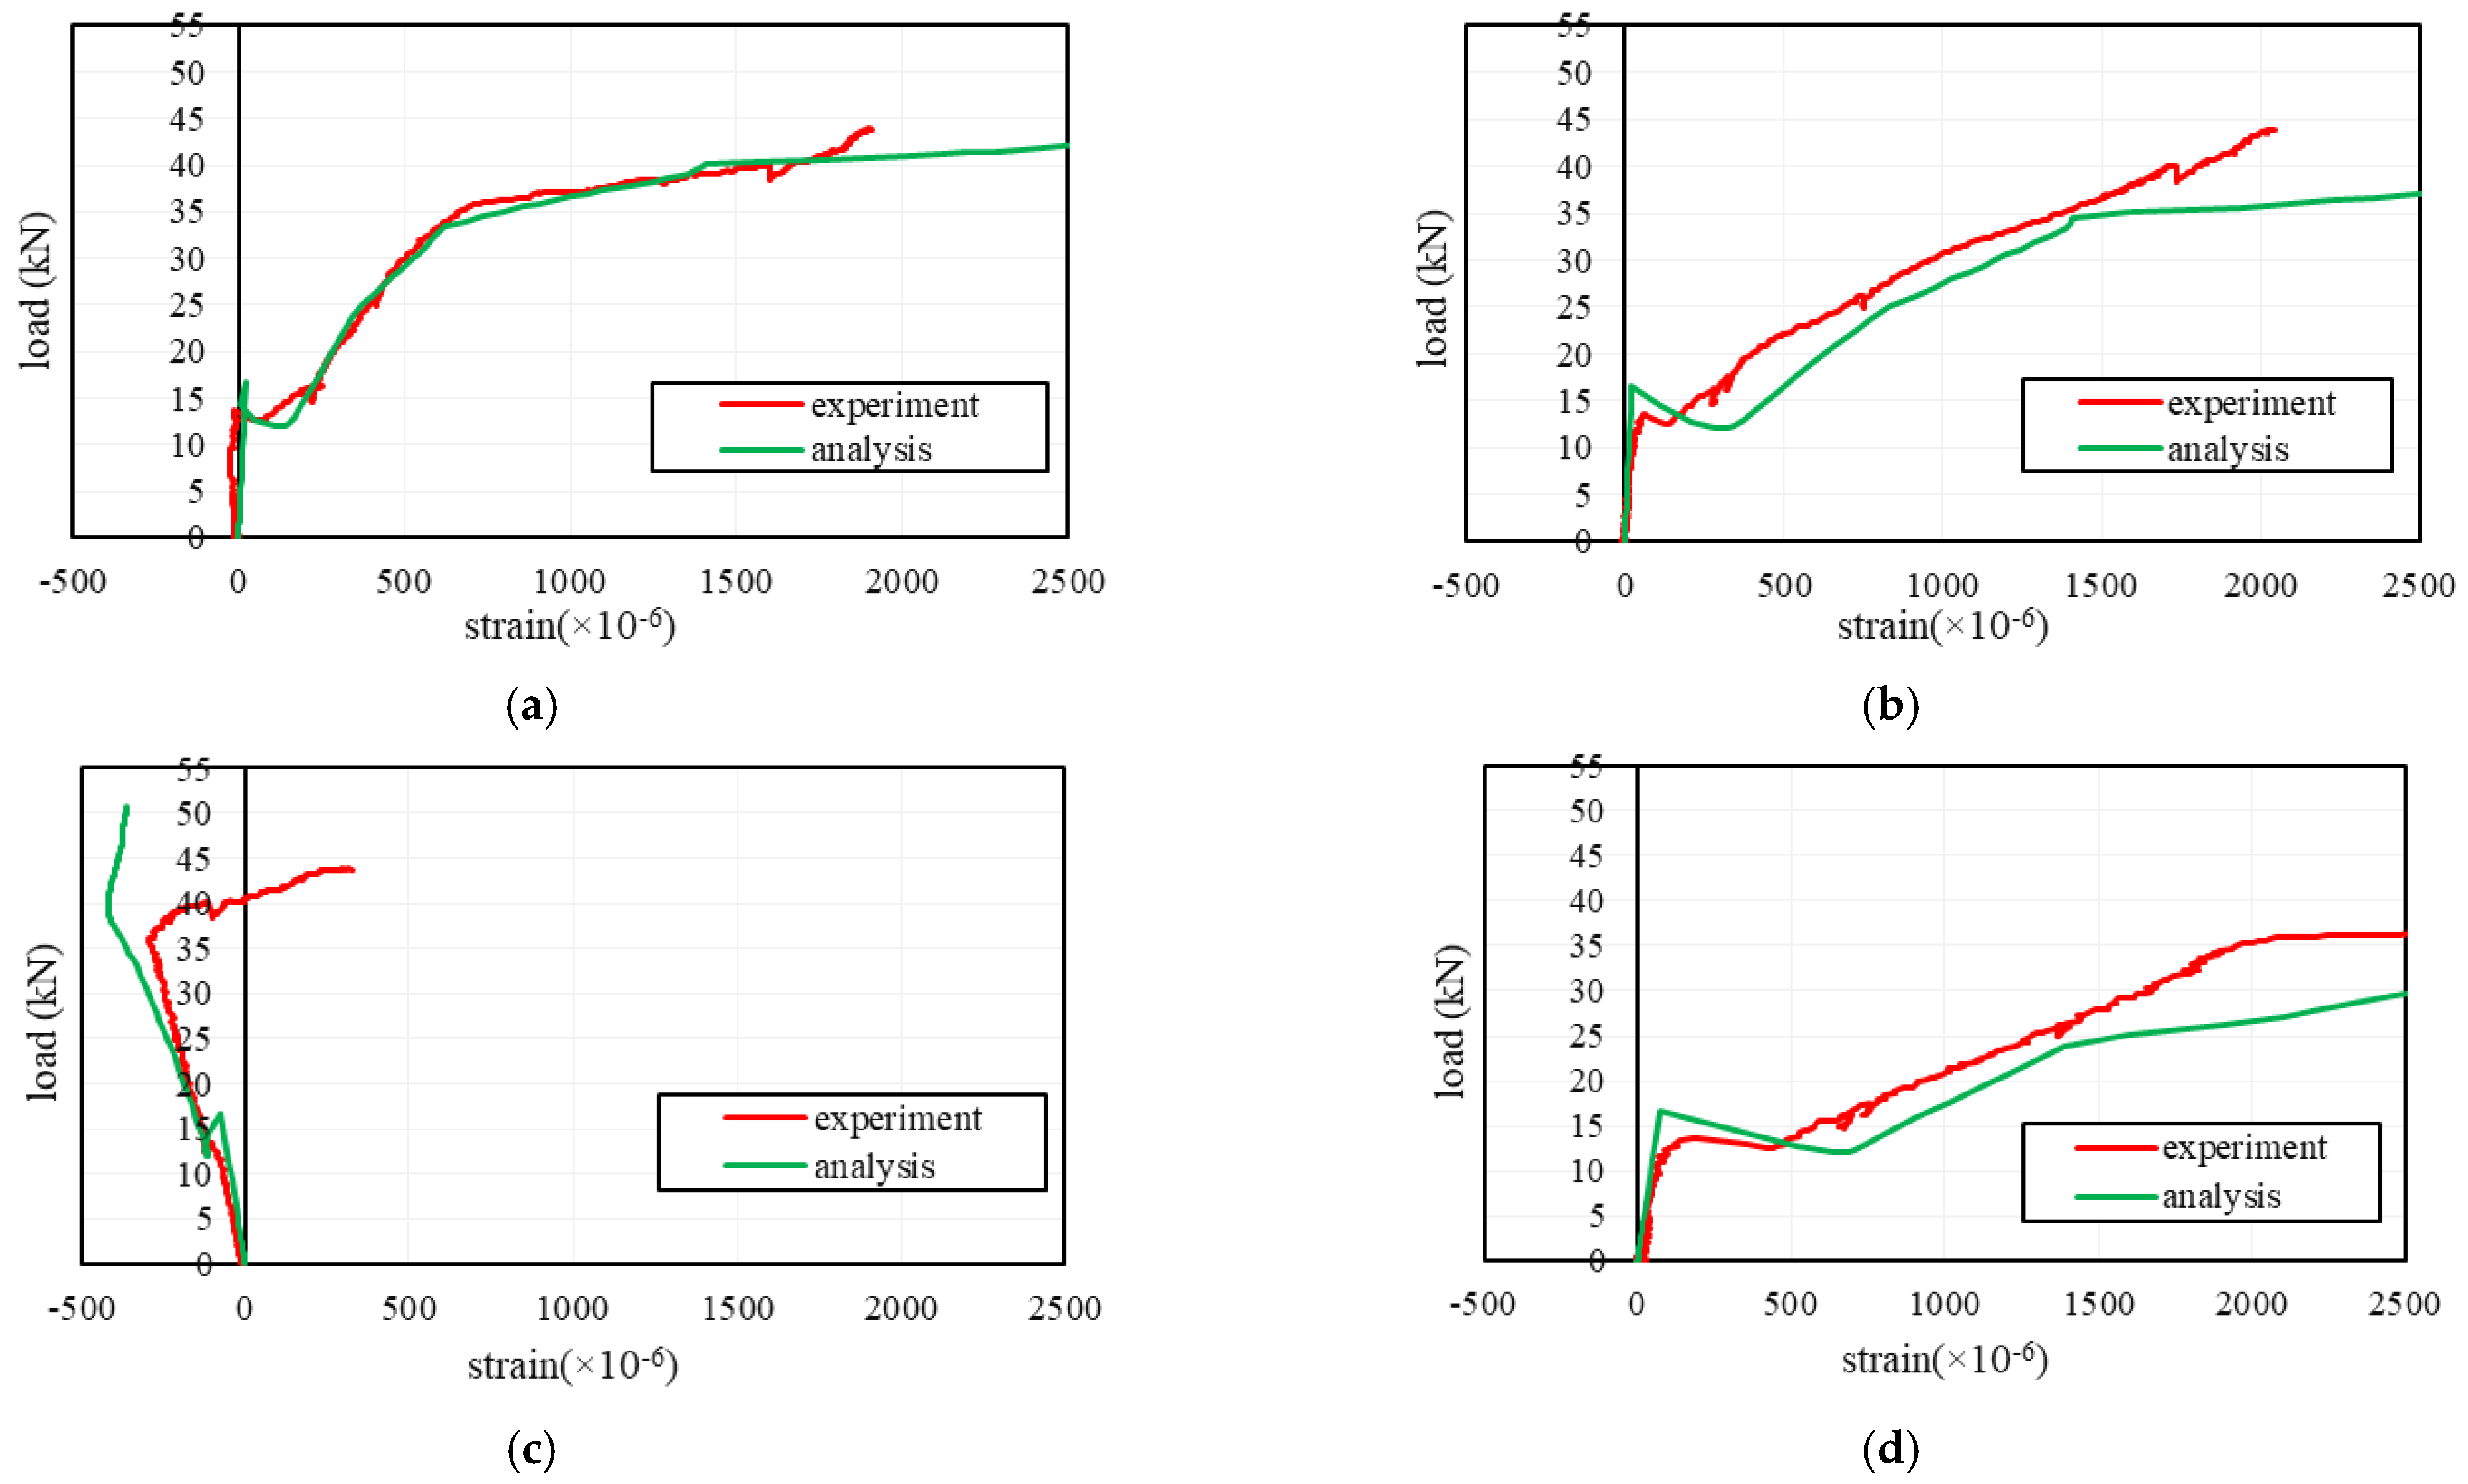
2.3. Results and Discussion

Figure 9 shows a comparison of the load-displacement relationship between the RC and RPCM specimens. The load of the analysis result was obtained by doubling the vertical reaction force at the fixed support of the 1/2 model, considering symmetry.
Figure 10 shows a comparison of the load-strain relationship of the RPCM specimen. In the analysis, although the strain on the tension side of the rebar in the existing concrete domain decreased immediately after the occurrence of concrete cracks from bending, the experimental results could be reproduced quite well on both the compression and tension sides. On the one hand, regarding the strain of the reinforcing bars in the PCM layer, it was confirmed that the reinforcing bars on the compression side could be accurately reproduced only up to the yield load level, but the tensile reinforcing bars could be reproduced up to the final failure level. Therefore, the validity of the analysis method and FE model used in this study was confirmed.

3. Outline of Seismic Response Analysis for Dam Piers of Existing Dams

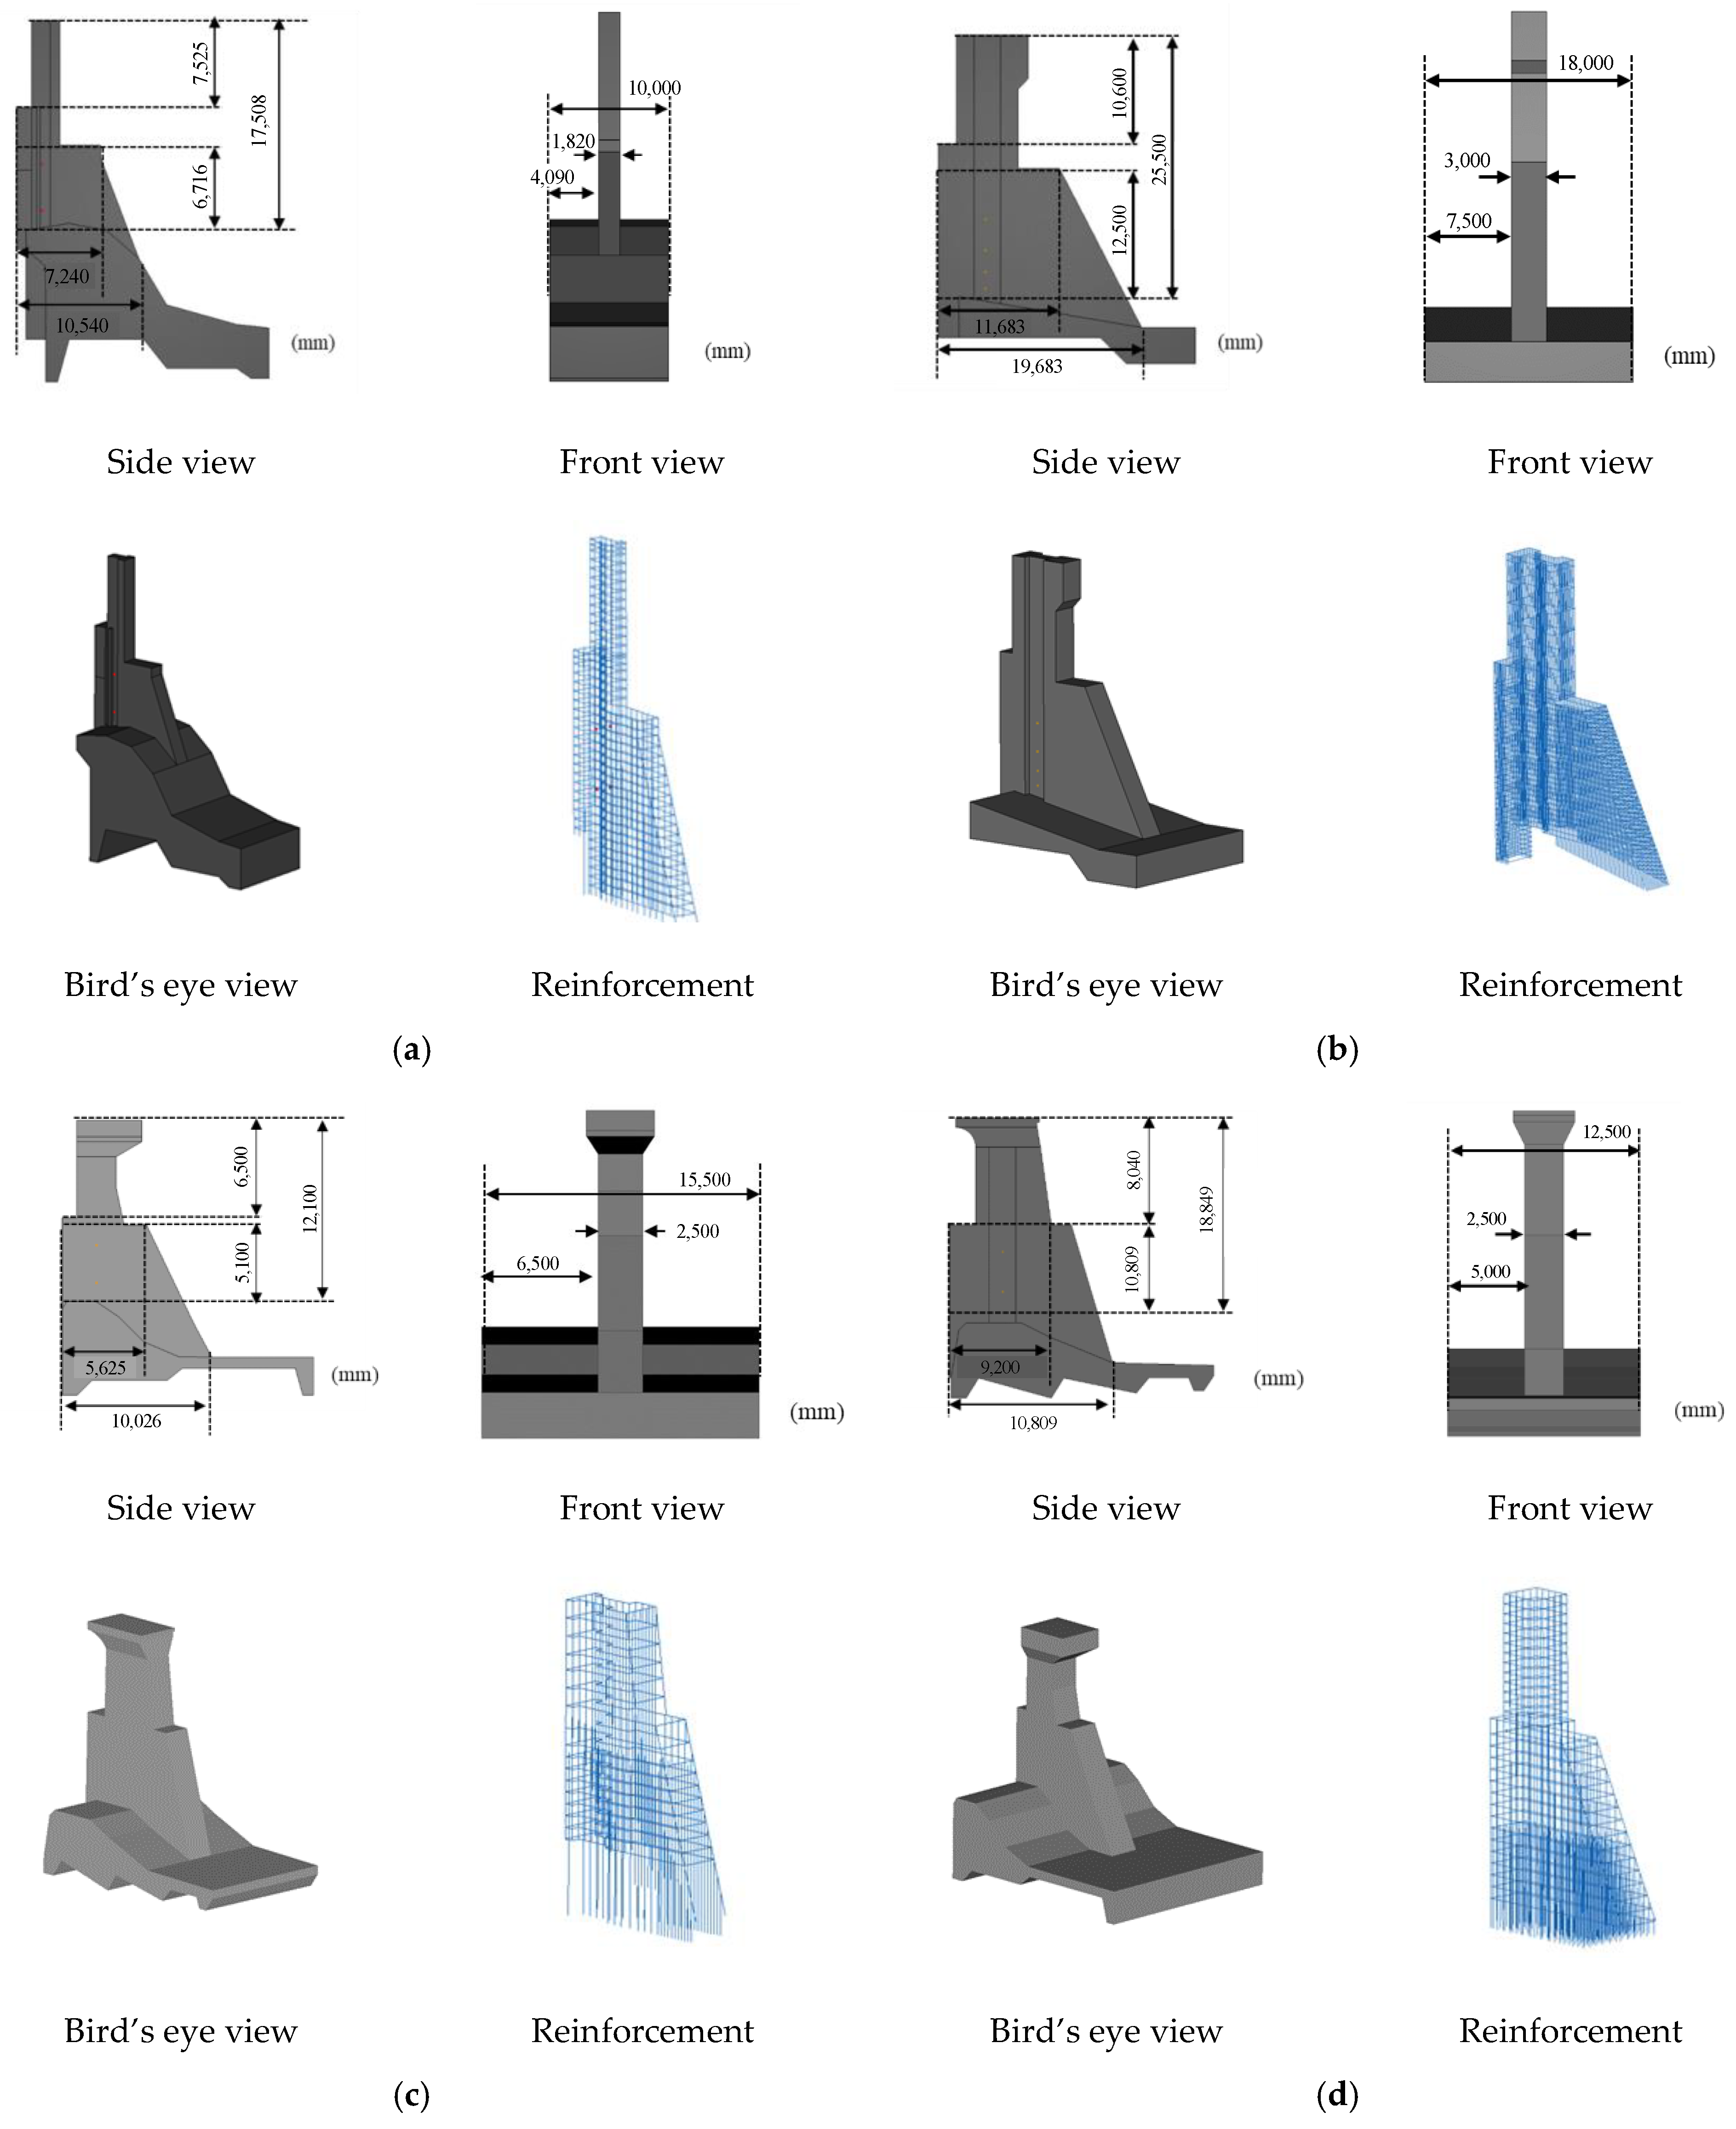
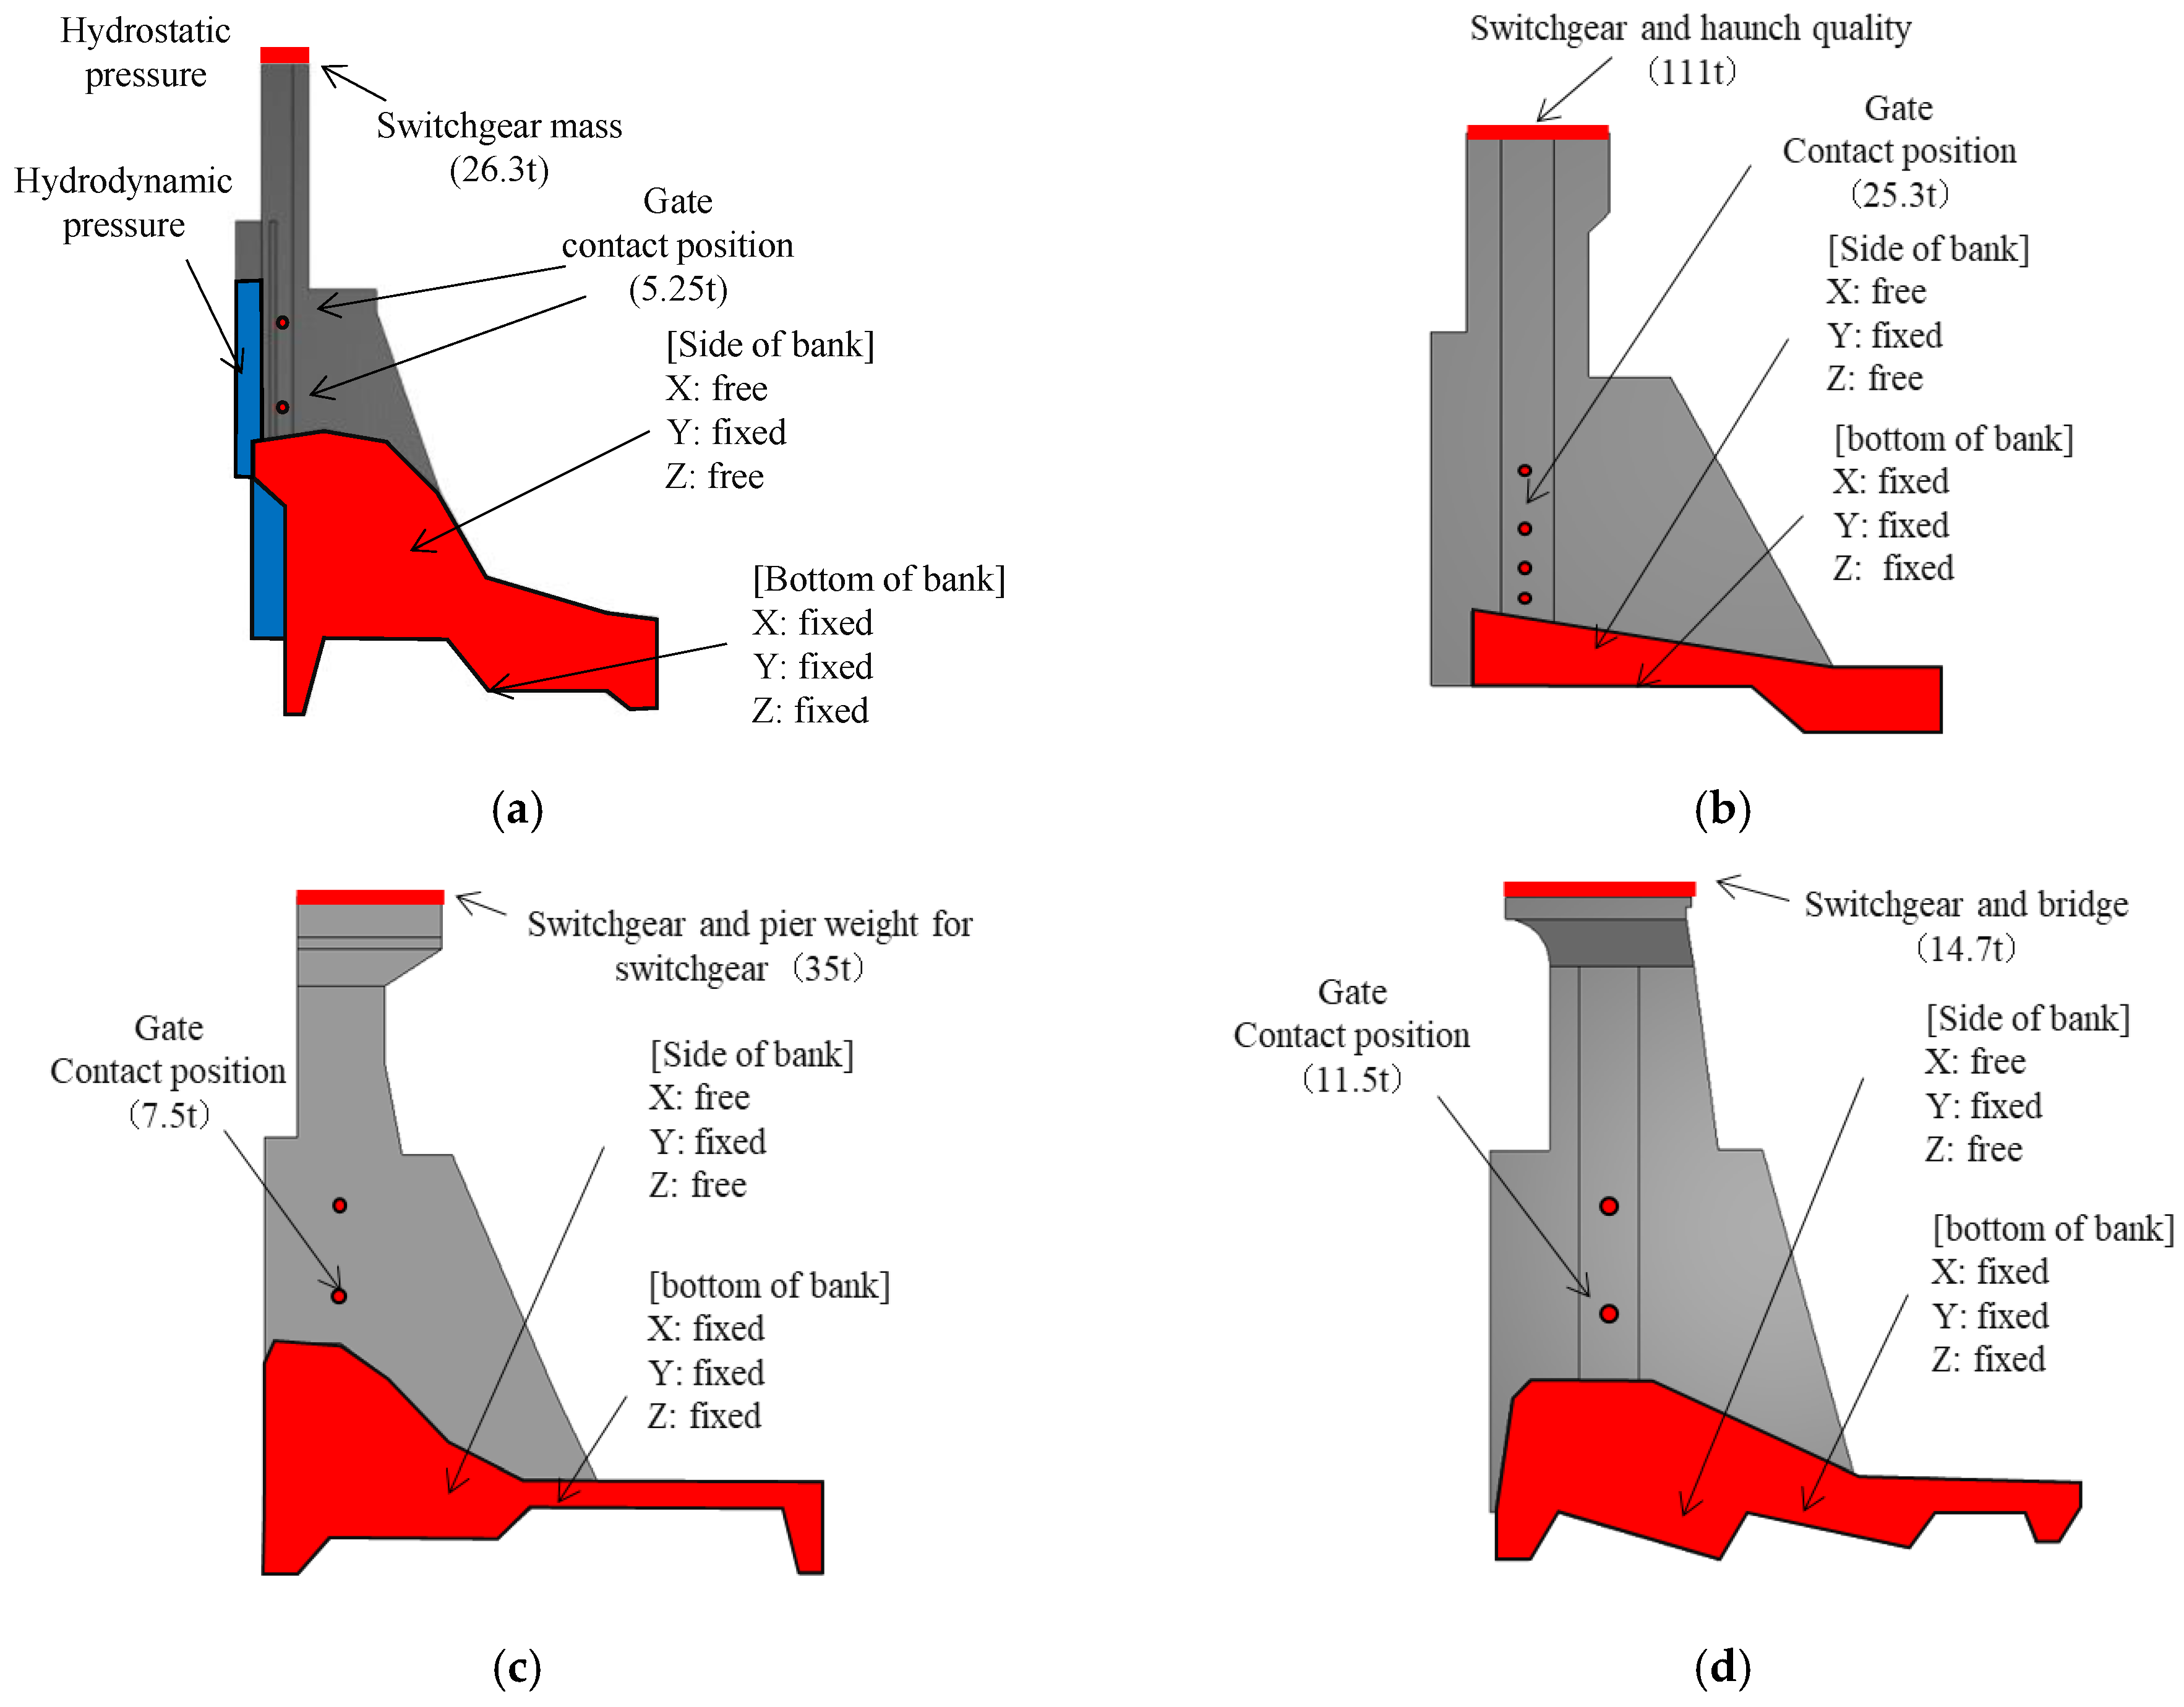
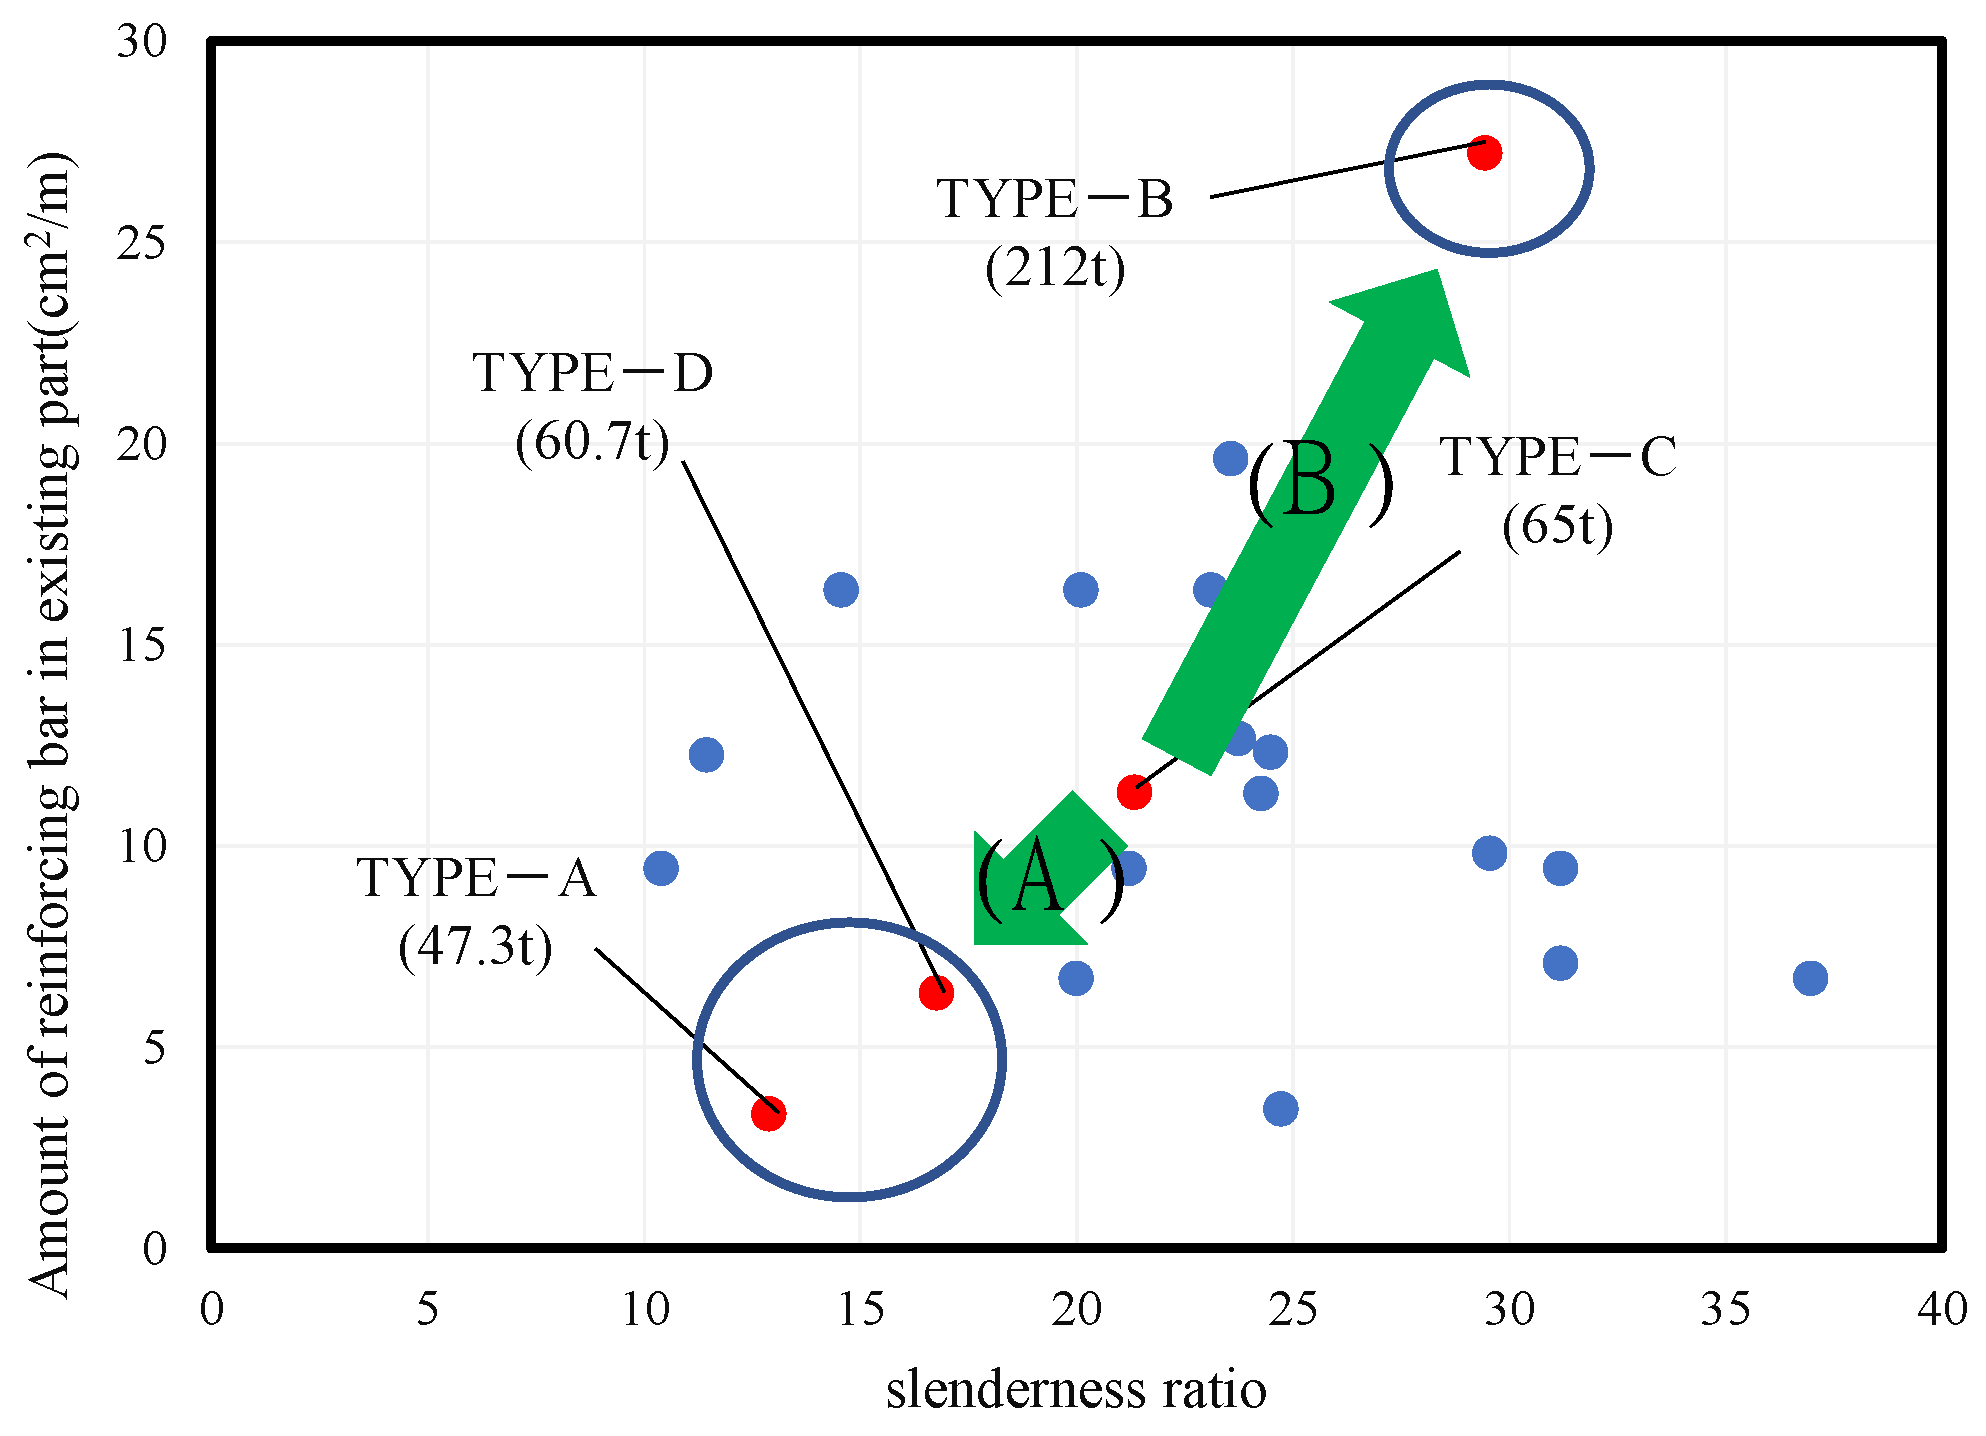
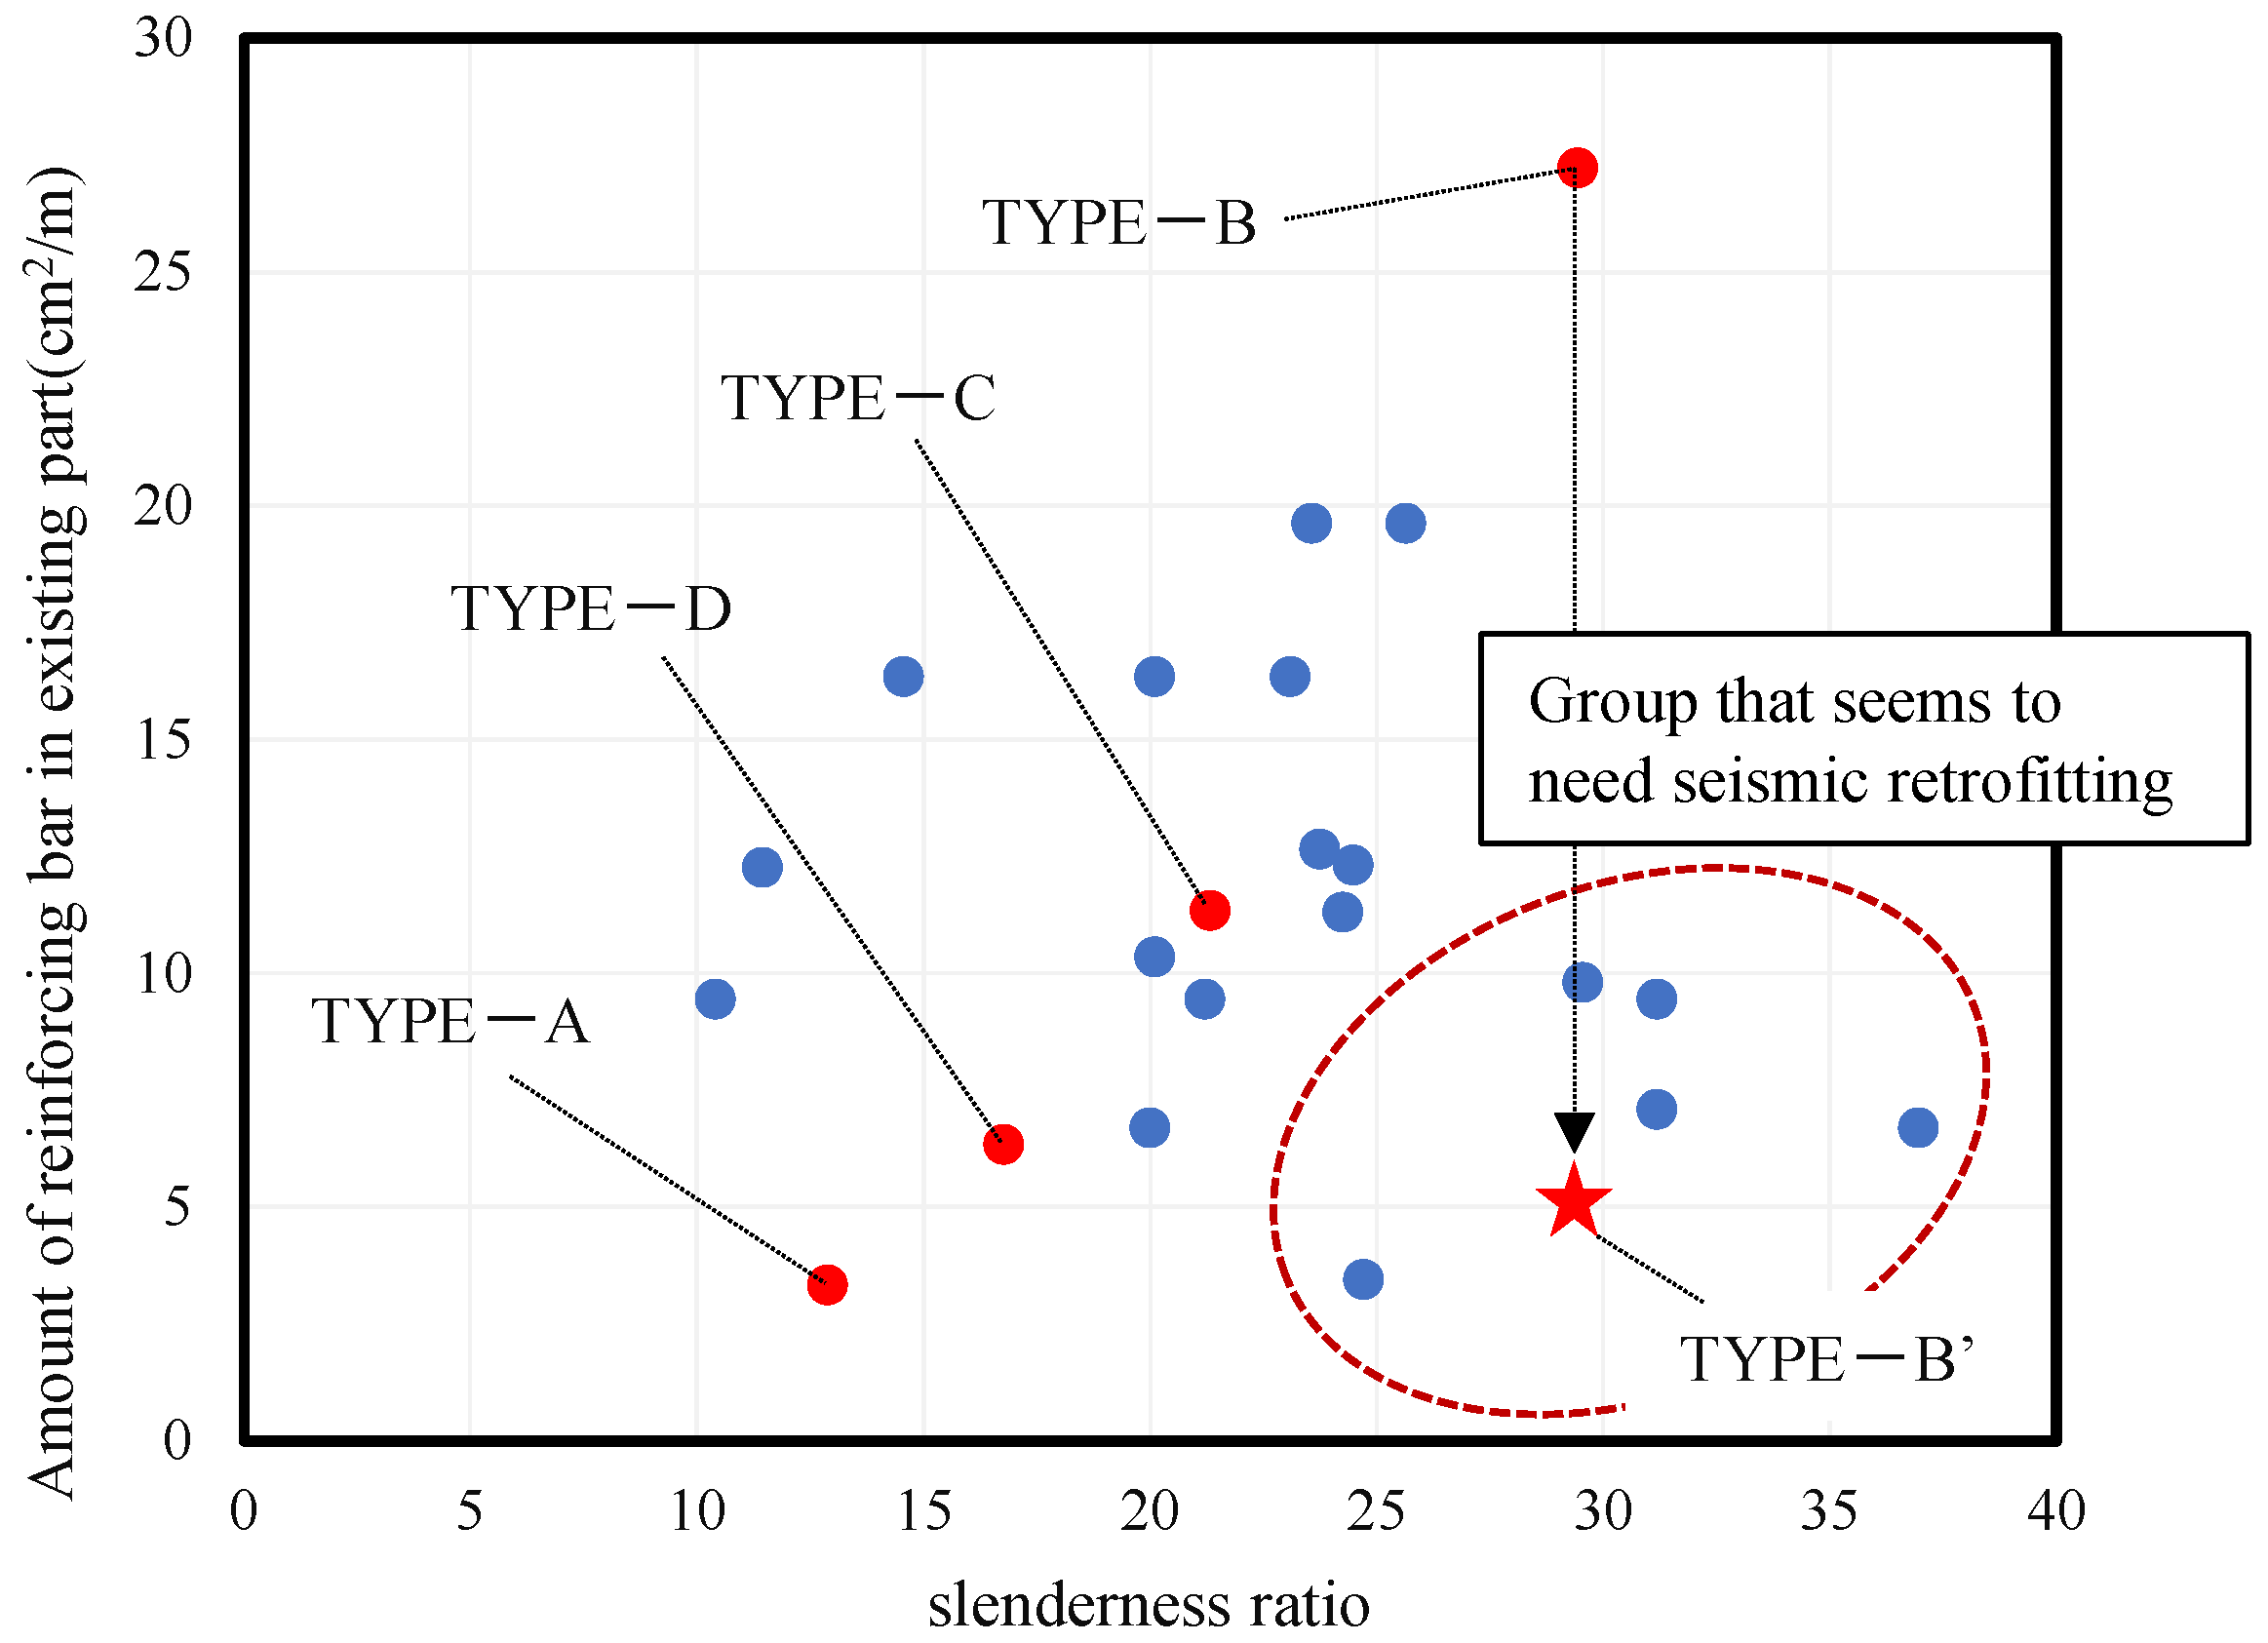
3.1. Shape and Modeling of the Target Dam Piers

To investigate the influence of the structural characteristics of dam piers on the reinforcing effect of the SRS method, we targeted the dam piers of four existing dams. In this study, they are called TYPE-A, -B, -C and -D, respectively. Figure 11 shows their shapes and dimensions, as well as the FEM model. As shown in Figure 11a, TYPE-A has dimensions such as a height of approximately 17.5 m, a length in the upstream and downstream directions of approximately 10 m, and a thickness in the dam axis direction (this becomes a weak axis direction) of approximately 2 m. For reinforcement, D16 was used as the main reinforcement, and D13 was used as the shear reinforcement. The bar arrangement interval was 600 mm for the main bar and 600 mm for the shear reinforcing bar. Next, as shown in Figure 11b, TYPE-B has a height of approximately 25 m, a length in the upstream and downstream directions of approximately 20 m, and a thickness in the dam axis direction of approximately 3 m. It is a dam pier that is larger than the TYPE-A model in both thicknesses. Regarding the reinforcement, D22 and D19 were used as the main reinforcements, and D13 was used as the shear reinforcement in the upper part. The bar arrangement interval was 158 mm for the main bar and 2000 mm for the shear reinforcing bar. At the bottom, D25 was arranged as the main reinforcement, and D16 was arranged as the shear reinforcement. The bar arrangement interval was 181 mm for the main bar and 500 mm for the shear reinforcing bar.
The major difference between the four types of dam piers is the shape and amount of the reinforcement. TYPE-A has a low and thick shape, and TYPE-B has a high and thin shape. In addition, TYPE-A has sparse reinforcement, and TYPE-B has dense reinforcement. As shown in Figure 11c, TYPE-C has dimensions such as a height of approximately 12.1 m, a length in the upstream and downstream directions of approximately 10 m and a thickness in the dam axis direction of approximately 2.5 m. For reinforcement, D25 is used as the main reinforcement, and D16 is used as the shear reinforcement. The bar arrangement interval was 450 mm for the main bar and 800 mm for the shear reinforcing bar. TYPE-C is lower and thicker than the TYPE-A and -B models, so it has a chunky shape overall. As shown in Figure 11d, TYPE-D has dimensions such as a height of approximately 15.4 m, a length in the upstream and downstream directions of approximately 10 m and a thickness in the dam axis direction of approximately 2.5 m. For reinforcement, D16 is used as the main reinforcement, and D12 is used as the shear reinforcement. The bar arrangement interval was 500 mm for the main bar and 1000 mm for the shear reinforcing bar. The TYPE-D model has the sparsest reinforcement among the four dam types.
The differences in the structural characteristics of these four dam piers are shown for the slenderness ratio and natural frequency. Figure 12 shows the slenderness ratio of the four dams and the amount of reinforcing bar in the existing part. The slenderness ratio is defined by Equation (1). Here, i is the radius of gyration of area, A is the cross-sectional area, B is the horizontal width of the cross-section and H is the vertical width of the cross-section. In addition, the amount of reinforcing bars in the existing part is defined by the total cross-sectional area of the reinforcing bars included in the unit length.
λ = L i = L A I = L B H 1 12 B H 3 = L 12 H 2 = 2 3 L H
The red dots in Figure 12 represent the four target dam piers, and the blue dots represent other dam piers owned by the same power company. From this figure, it can be seen that the four dam piers targeted in this study were evenly extracted based on the slenderness ratio of approximately 10 to 30 general dam piers, and the overall tendency could be determined by confirming these reinforcing effects. In addition, there is a positive correlation between the slenderness ratio and the amounts of reinforcing bar, and it is recognized that these four dams had the required amounts of reinforcing bar for their slenderness ratio. On the one hand, the five dam piers at the lower right are the groups that are expected to be reinforced by PCM because the amount of existing reinforcing bar is insufficient for their slenderness ratio. The effect of PCM reinforcement on dam piers in this group is discussed in the last section.
Table 2 shows the eigenvalue analysis results for the four dam piers without reinforcement. From the results, it can be seen that the natural frequencies of the four dams vary from 2 Hz to 6 Hz in terms of the primary mode, and the vibration characteristics of the dams are covered as widely as possible. However, we decided to study the above four dams from TYPE-A to -D.
For the discretization of these four dam piers using the FE method, the concrete was modeled with 8-node solid elements and the reinforcing bars with 2-node truss elements. The nodes of the concrete and reinforcing bars were the same nodes, and complete adhesion was assumed.

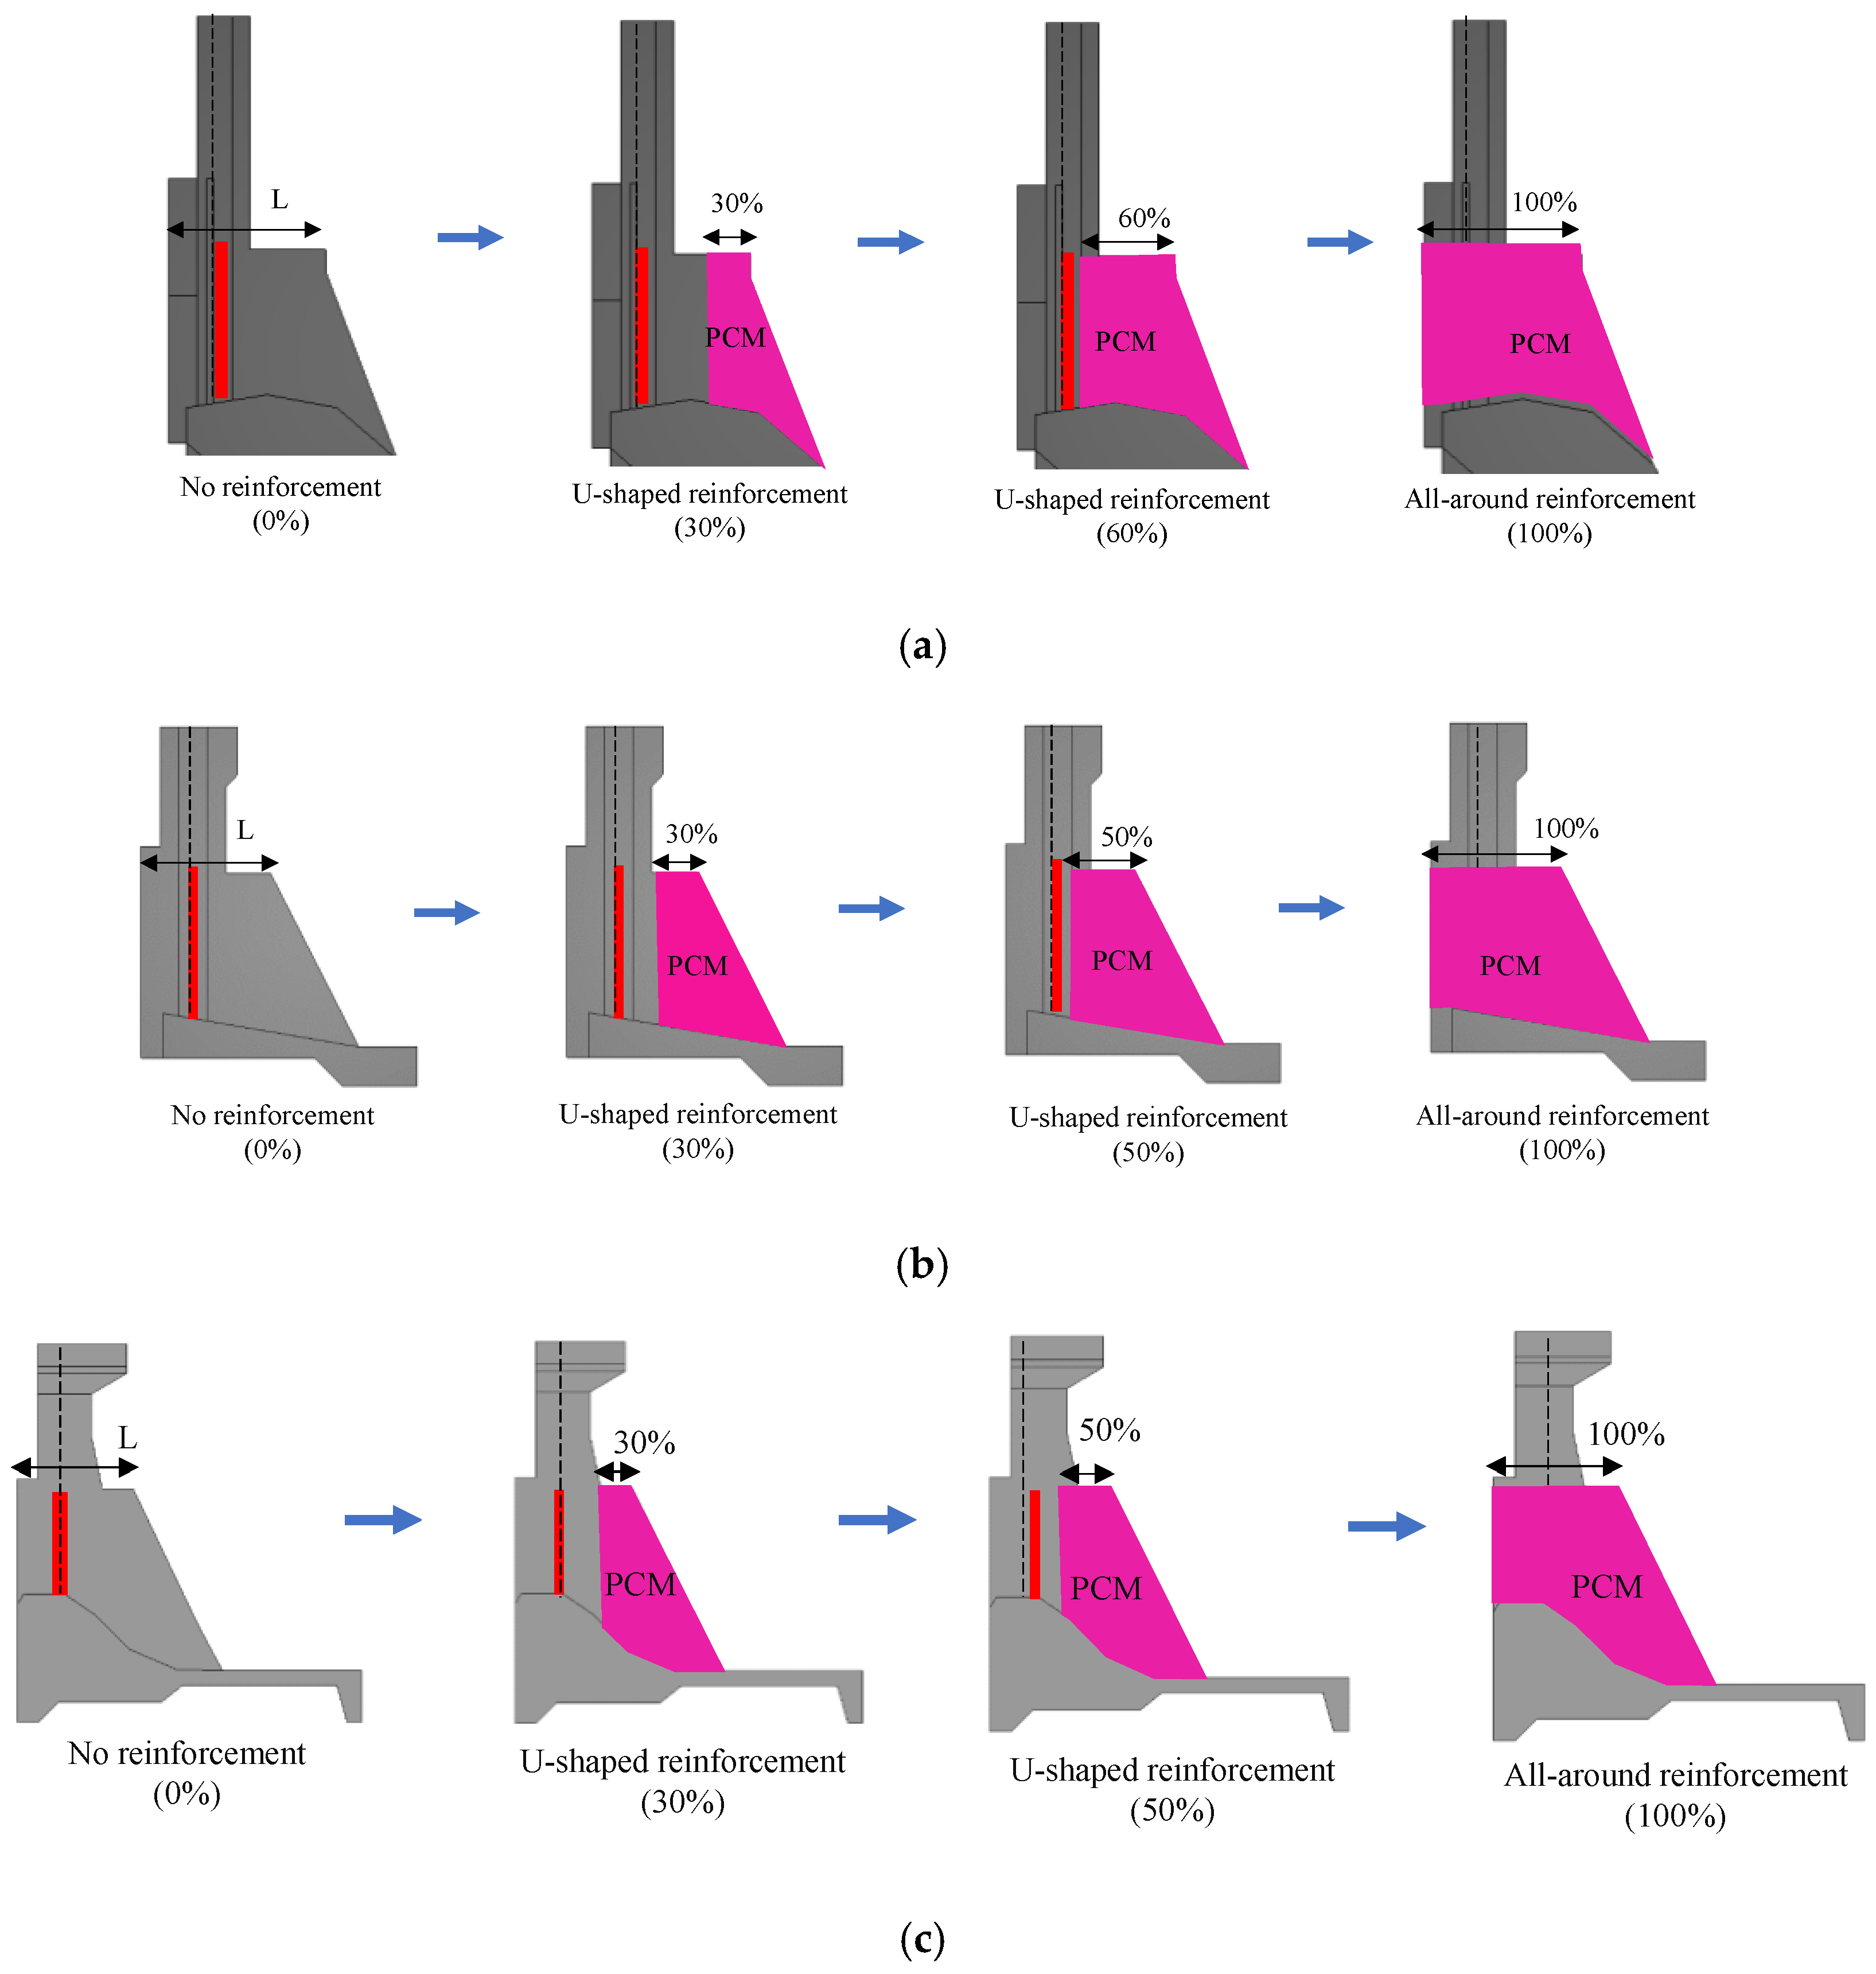
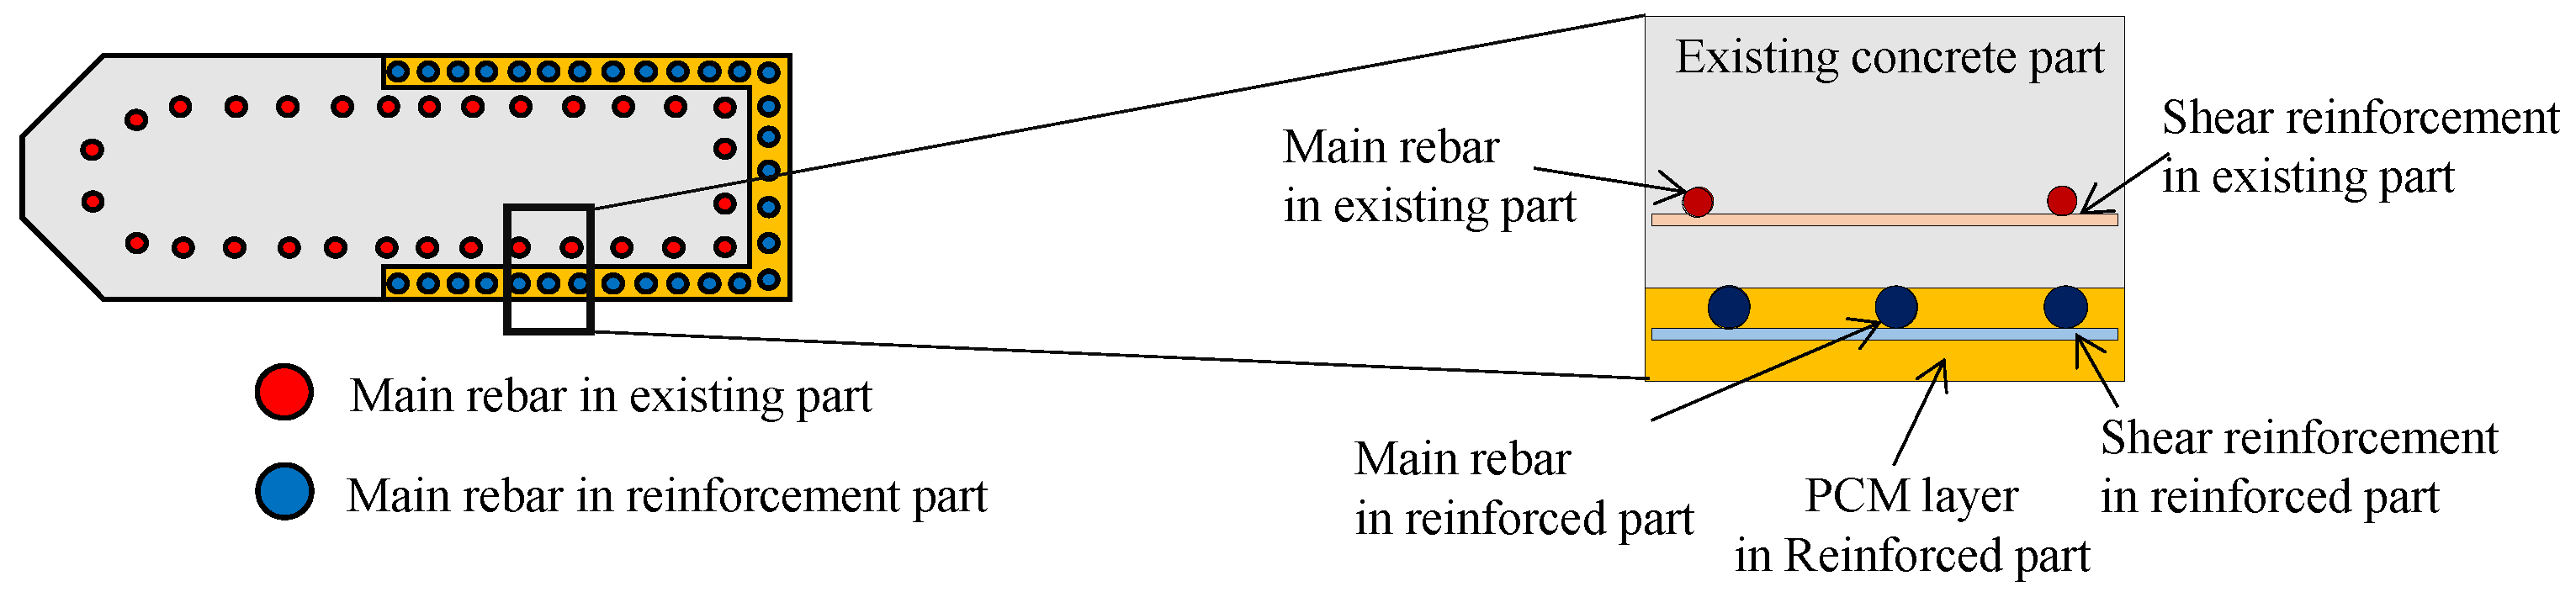
3.2. Modeling of the Reinforcement Part
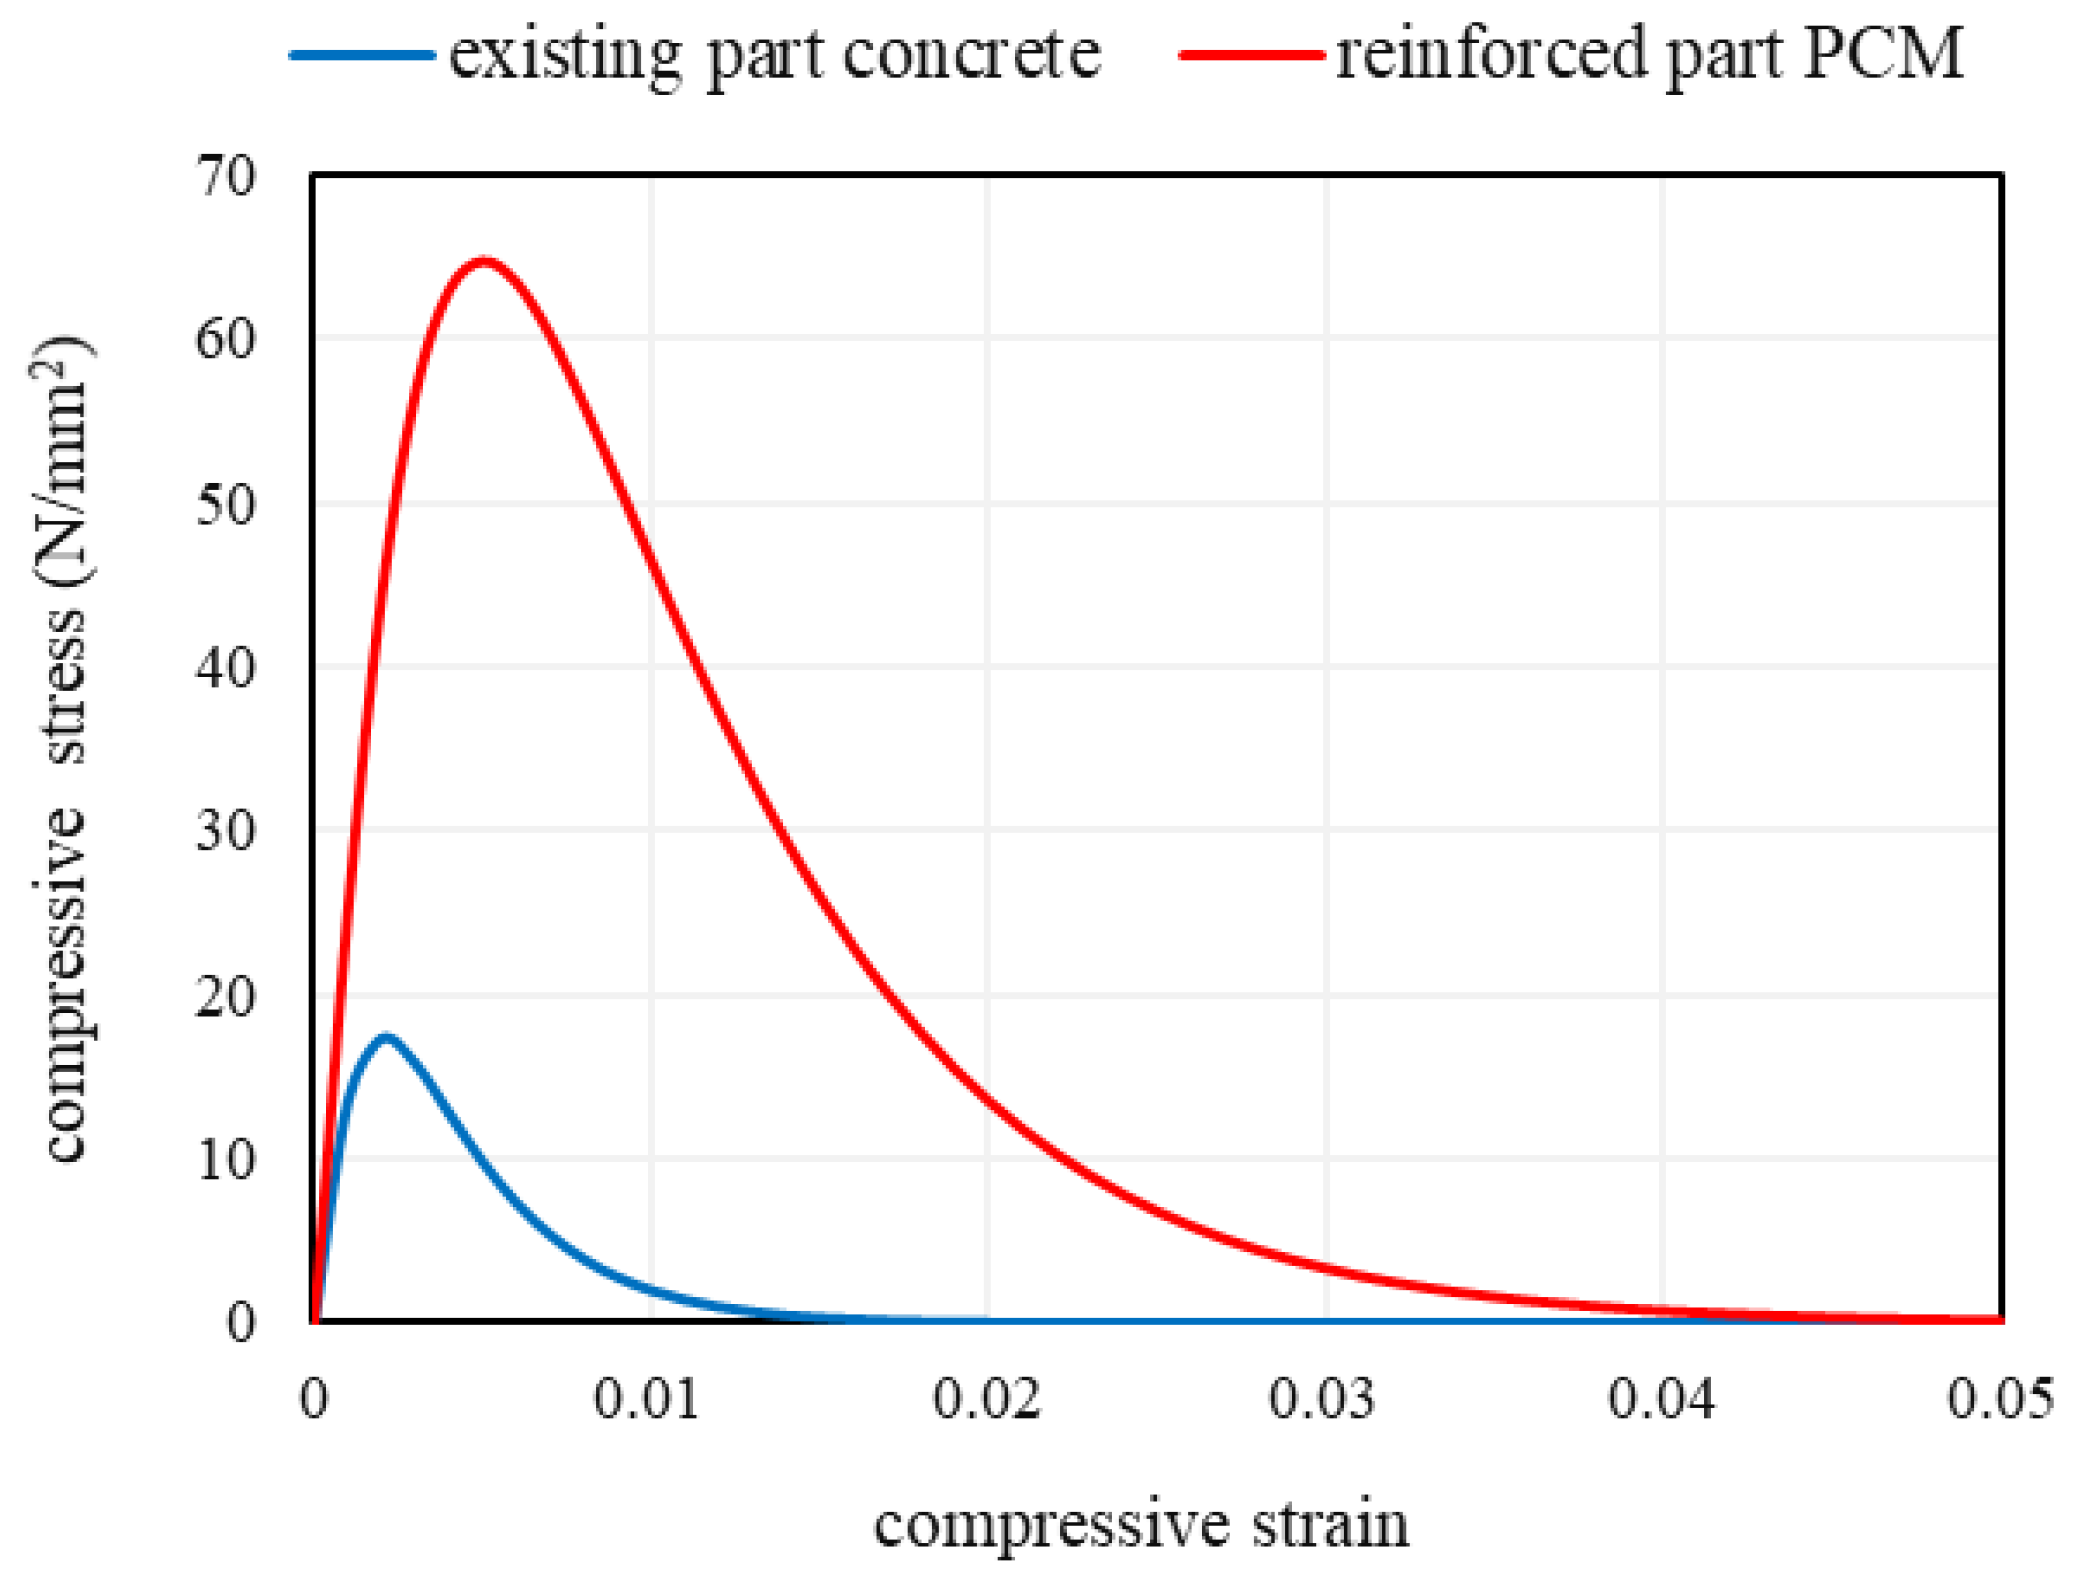
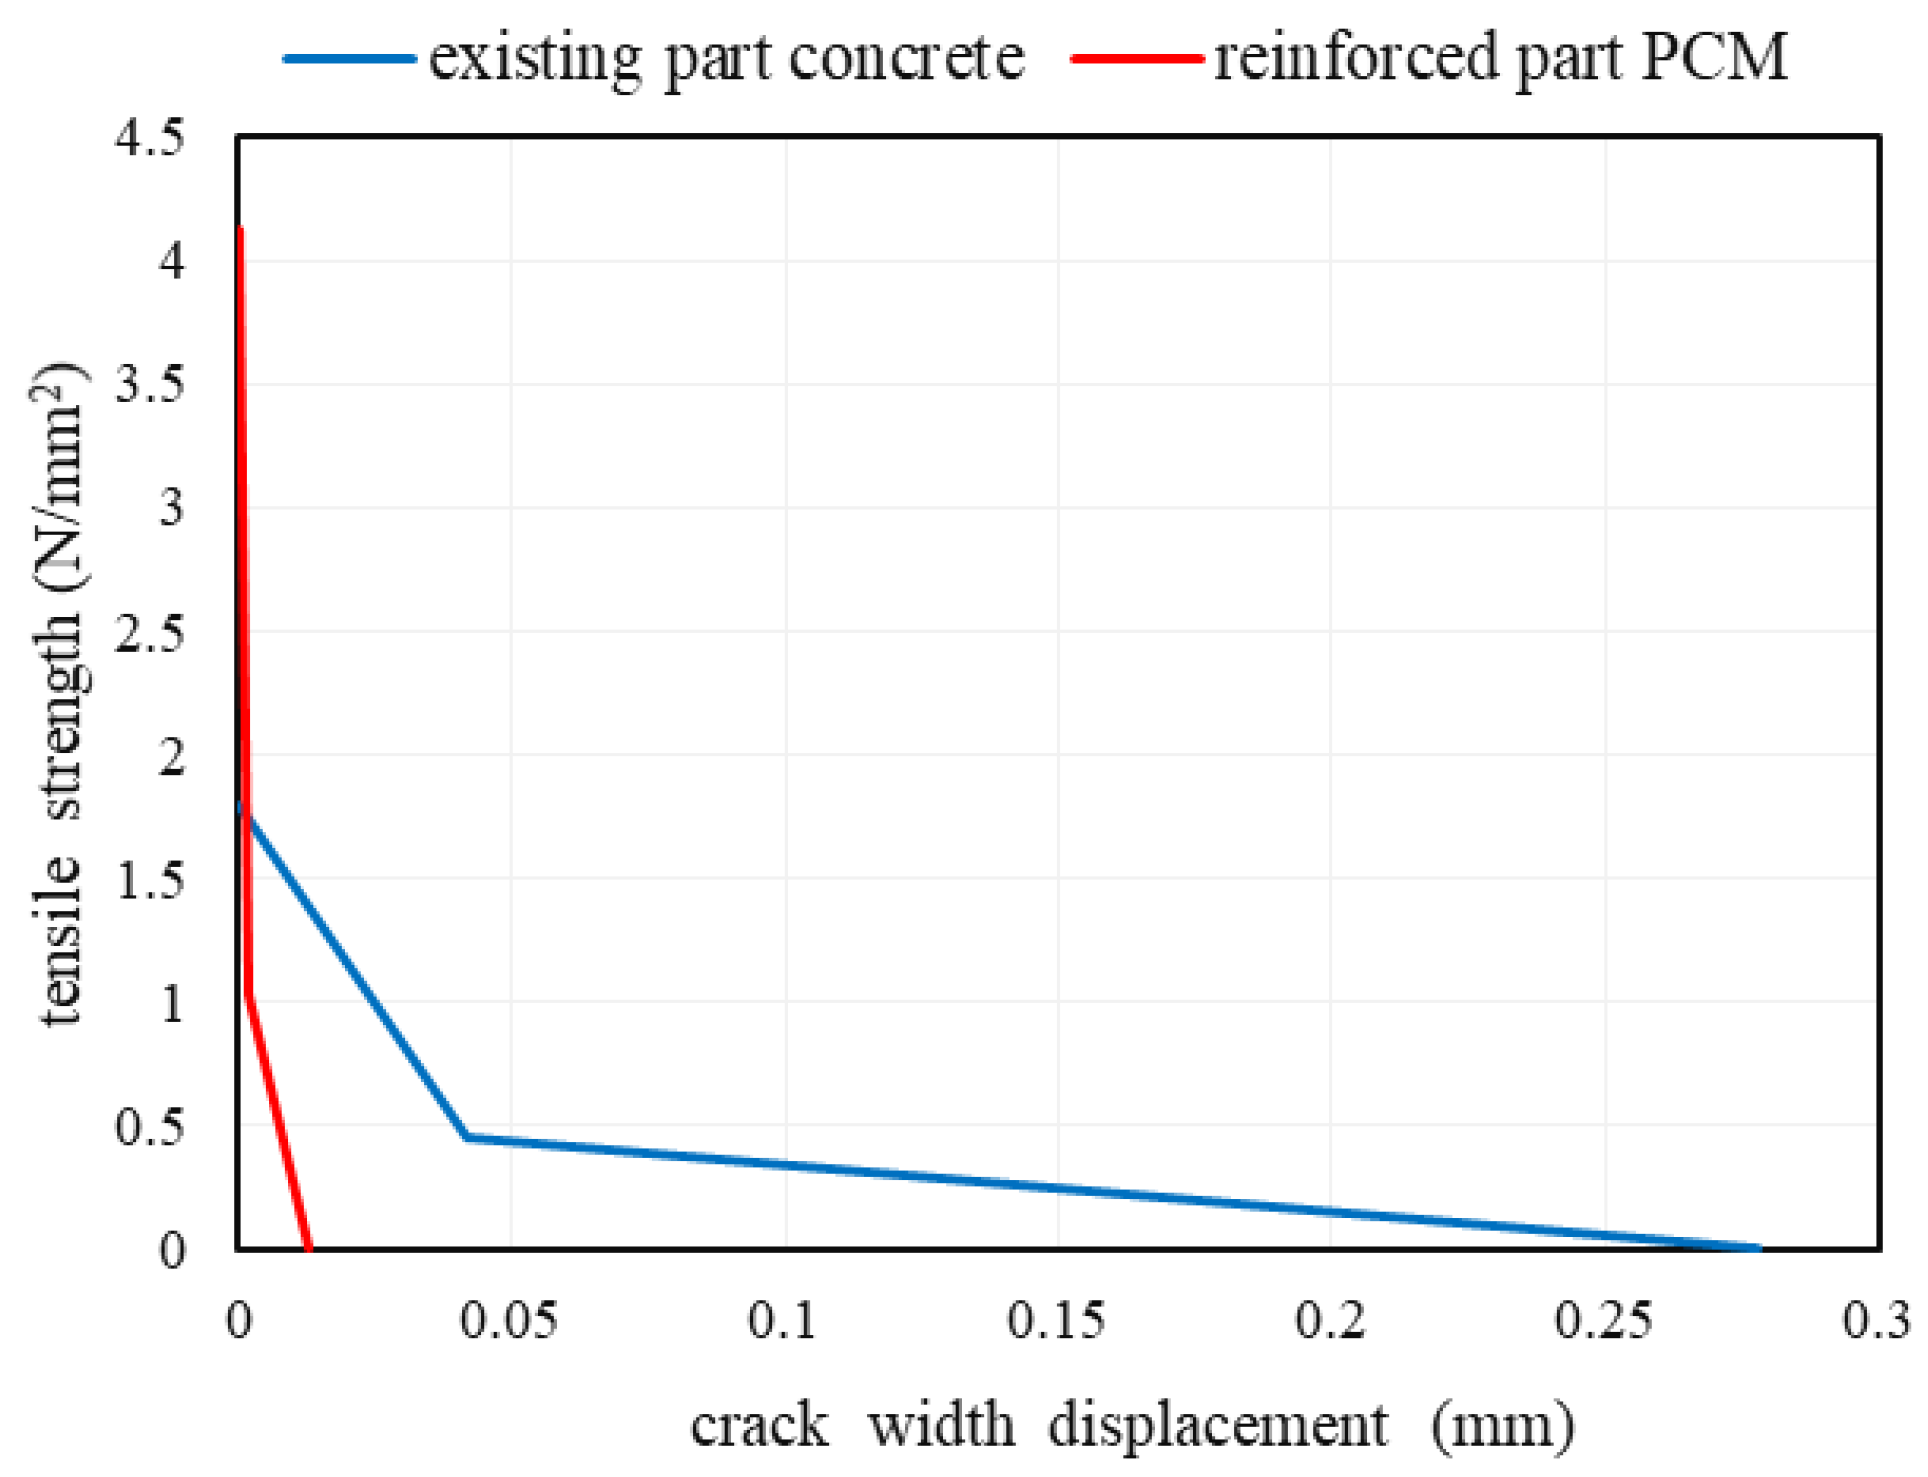
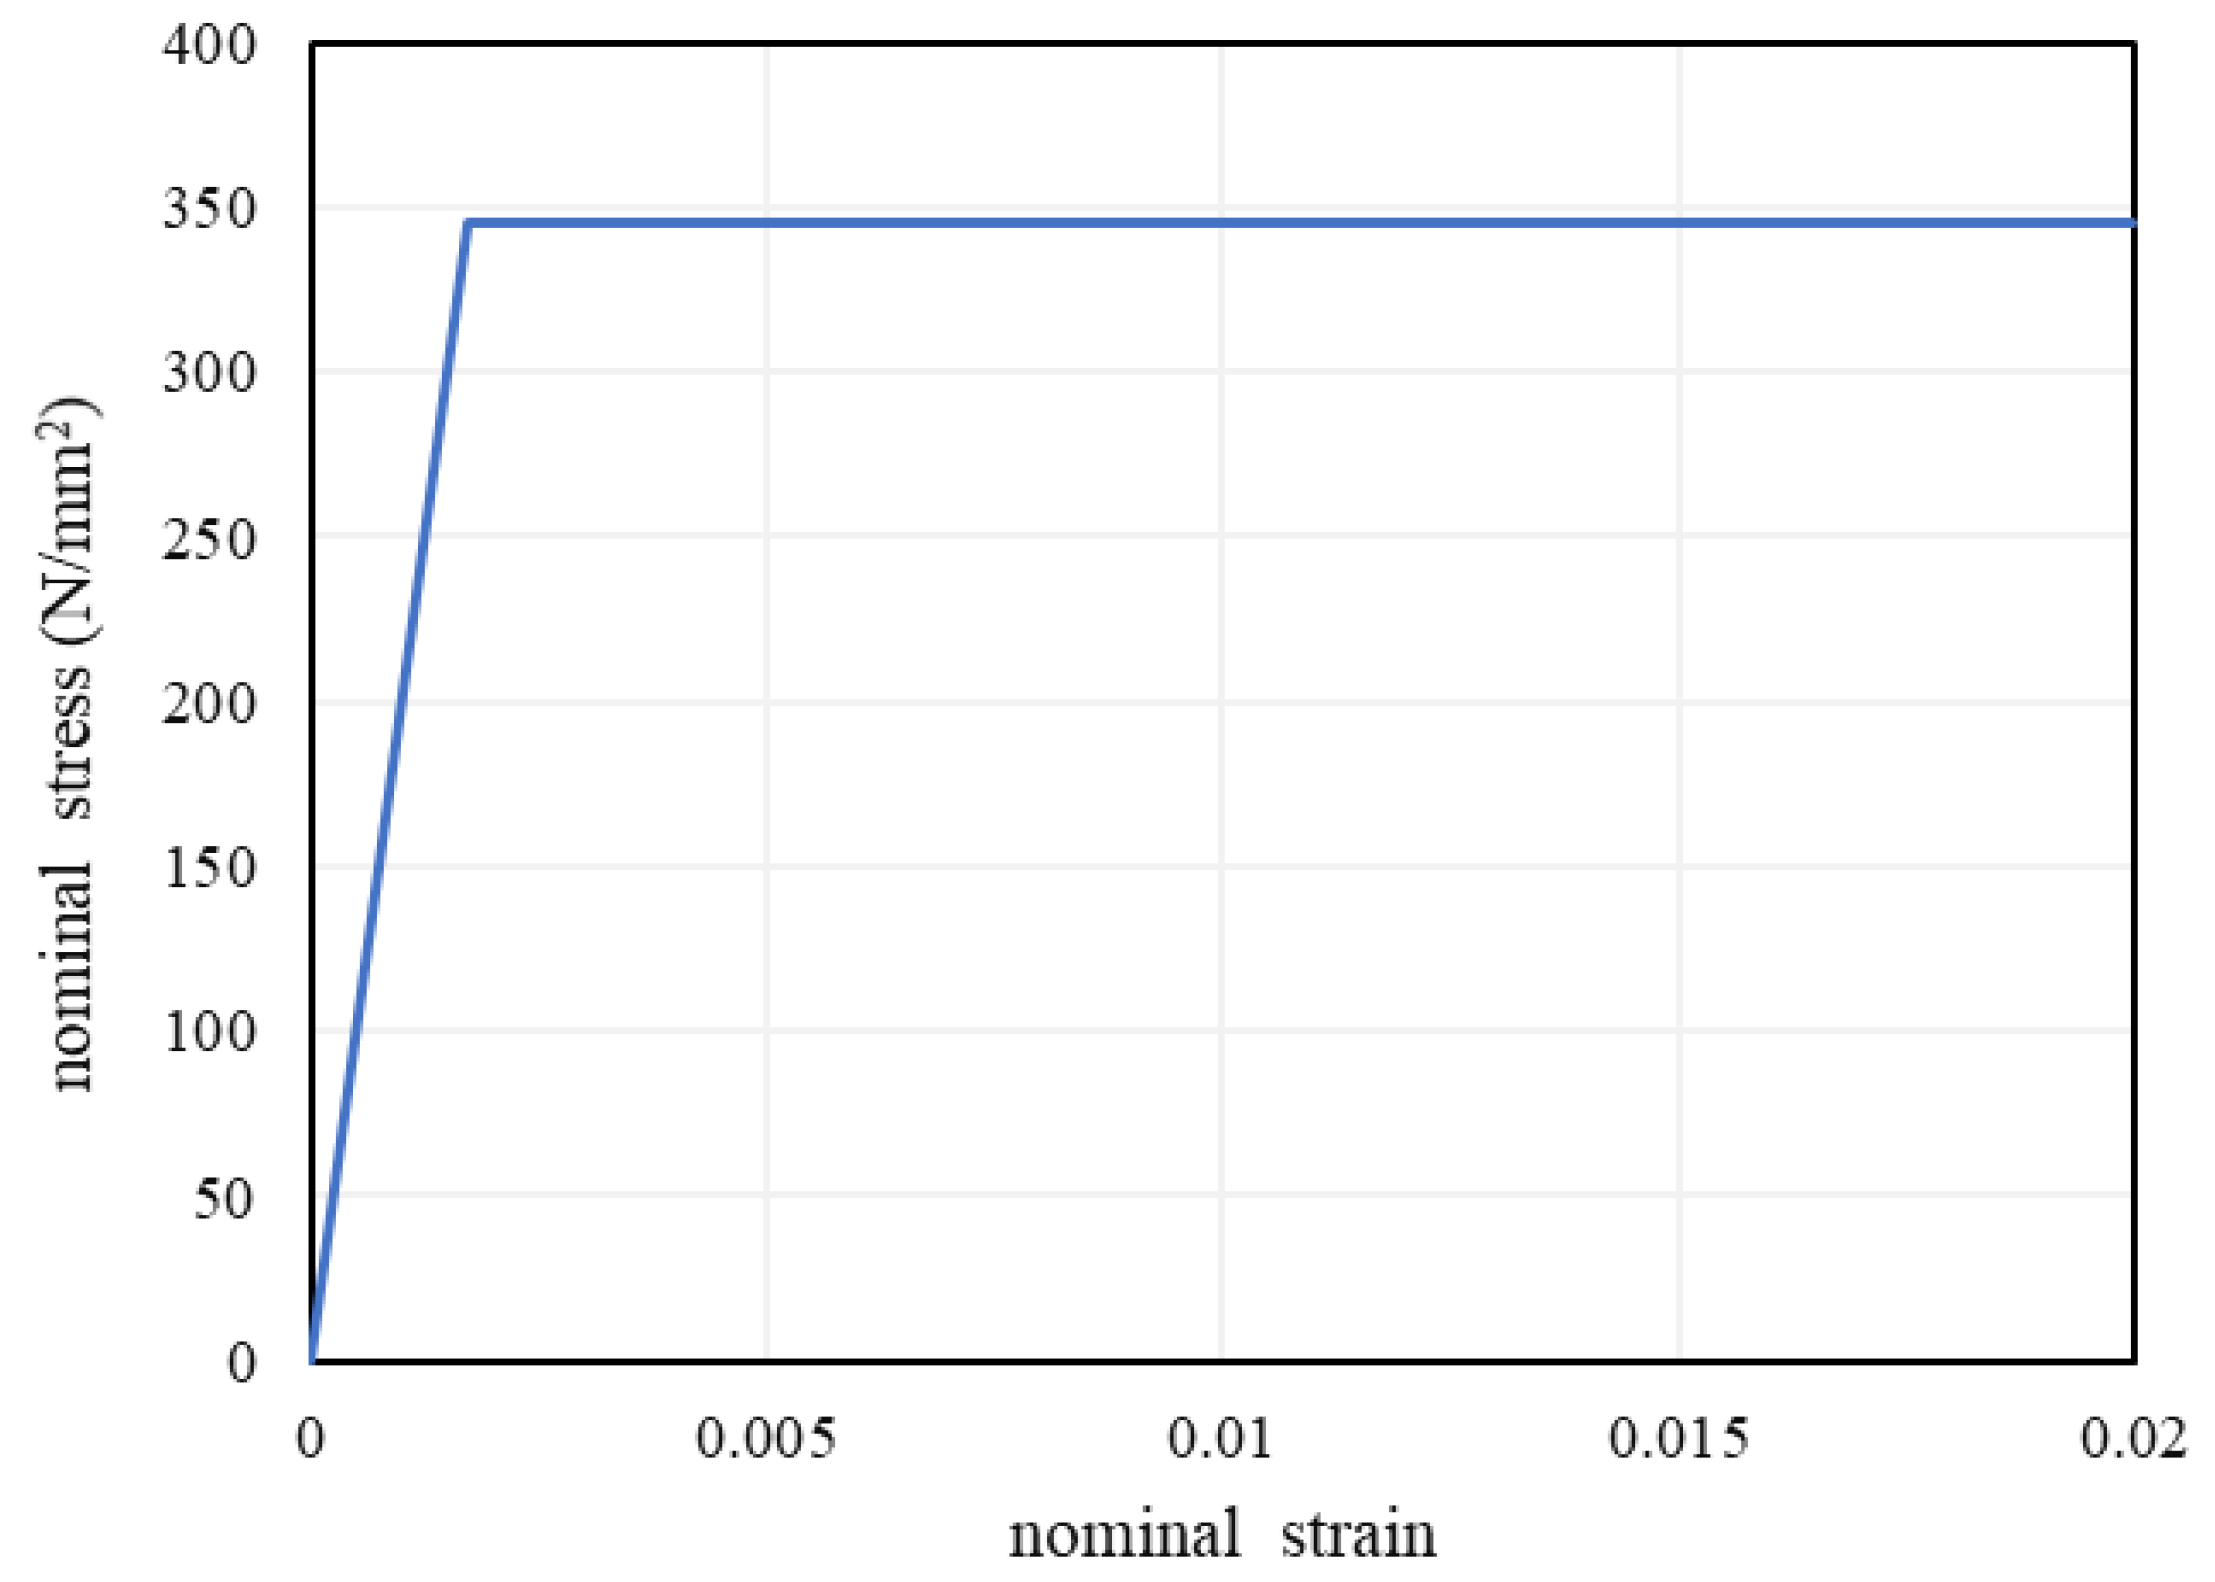
The FE model reinforced using the SRS method was modeled assuming that the existing deteriorated concrete elements were replaced with PCM elements, and new reinforcing bars were placed based on the actual reinforcing bar placement, as shown in Figure 13.
The PCM cover was 69 mm, and the main reinforcing bar diameter was D25 with a spacing of 250 mm for both types.

3.3. Material Model

In this study, the elastic-plastic material properties of the existing parts and reinforcing parts of dam piers are considered. Table 3 lists the material properties of the concrete and PCM.
The stress-strain relationship on the compression side is shown in Equations (2)–(5) and conforms to the equation in the “Concrete Standard Specification” of the JSCE [13]. The strain at the compression strength was defined by the inverse calculation of Equation (3). Figure 14 shows the stress-strain curves on the compression side.
σ c = E 0 K ( ε c ε p )
E 0 = 2 f c / ε p e a k
K = exp { 0.73 ε c ε p e a k ( 1 exp ( 1.25 ε c ε p e a k ) ) }
ε p = ε c 2.86 · ε p e a k { 1 exp ( 0.35 ε c ε p e a k ) }
where σ c is the compressive stress (MPa), E 0 is the initial stiffness (MPa), K is the elastic rigidity residual rate, ε c is the compressive strain, ε p is the plastic strain, f c is the compressive strength (MPa) and ε p e a k is the strain at compression strength. As shown in Figure 15, the stress-strain relationship on the tensile side was derived from the tensile softening curve based on the tensile stress-crack width relations from the “Concrete Standard Specification” of the JSCE [13], as shown in Equations (6) and (7).
w t = 5 G f f t
G f = 10 ( d m a x ) 1 3 · f c 1 3
where w t is the crack width (mm), G f is the tensile fracture energy (N/mm), f t is the tensile strength (MPa) and d m a x is the maximum dimension of the coarse aggregate (mm). In addition, the von Mises yield condition with no hardening (complete elastic-plastic characteristics) was applied to the steel material, as shown in Figure 16. The post-yield handling of the rebar is thought to have some effect on the elasto-plastic response of the member, but since the main purpose of this study is a relative comparison of the four existing dam piers, this modeling will not be mentioned in depth. In addition, kinematic hardening was assumed for the steel material. Table 4 lists the material properties of the steel bars for the concrete and PCM parts.

3.4. Boundary Condition

As shown in Figure 17, the boundary conditions of the dam pier were set based on actual mechanical conditions. Specifically, for both dams, the dam axis direction and the upstream and downstream directions were fixed at the bottom surface of the model. In this analysis, we focused on the dynamic behavior of only one dam pier and modeled only the levee body. The ground acceleration, as shown in Figure 18, was input in the dam axis direction of the full analysis model. In this study, seismic wave A and seismic wave B were applied to TYPE-A, -B, -C and -D. These acceleration waveforms were created from the waveforms used to verify the seismic performance of the dams and assumed a level 2 seismic motion. Seismic wave A had a maximum acceleration of 300 gal (3 m/s2) and a duration of approximately 20 s, while seismic wave B had a maximum acceleration of 441 gal (4.41 m/s2) and a duration of 24 s.
For all dams, an additional mass imitating the gate was provided to the gate support of the dam pier. The external force applied to the dam pier due to the vibration of the gate was considered. In addition, a switchgear was installed at the top of the pier, and an additional mass that was equivalent to the mass of the switchgear was applied to the top of the dam pier, as shown in Figure 17. Furthermore, for the TYPE-A dam, hydrostatic pressure and hydrodynamic pressure were applied to the dam pier, considering the amount of water stored. In this analysis, the hydrodynamic pressure was calculated using the Westergaard [14] equation shown in Equation (8). Here, md is the additional mass that represents hydrodynamic pressure; γw is the unit volume weight of water; g is the gravitational acceleration; b is the length in the upstream and downstream directions of the part where the dam pier and the water storage are in contact; H is the water storage level; h1 and h2 indicate the water depth at the representative points.
m d = h 1 h 2 7 8 γ w g b H h d h = 7 12 γ w g b ( H h 2 3 H h 1 3 )

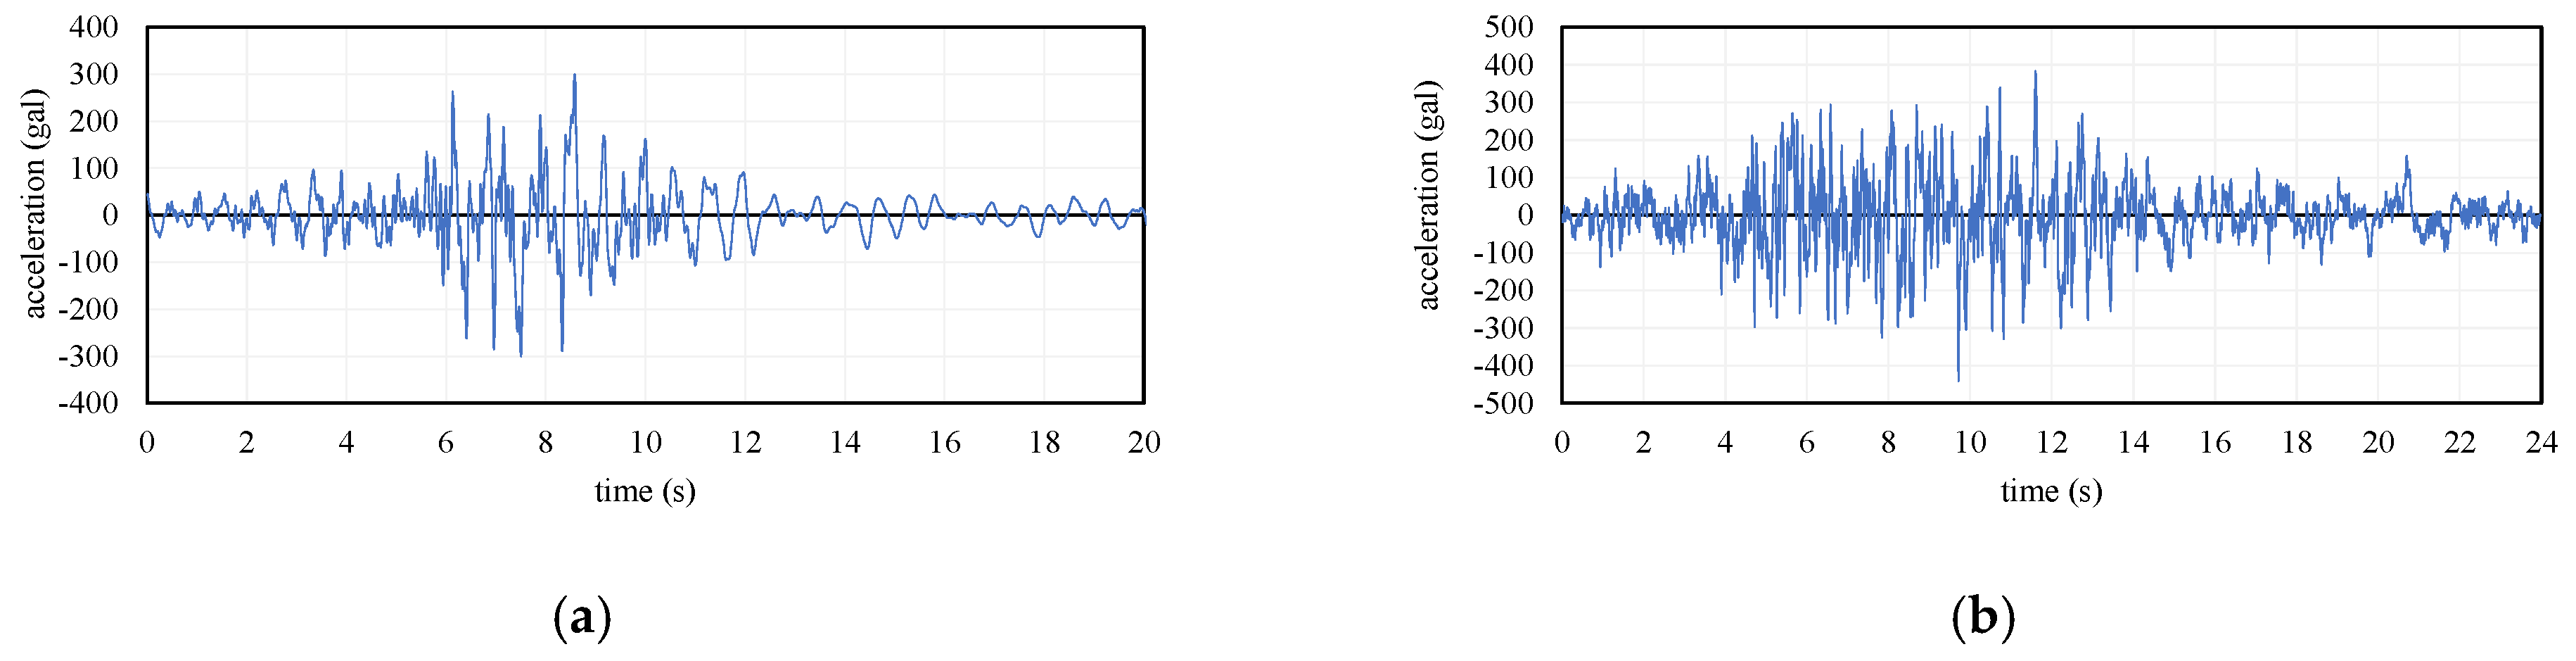
3.5. Analysis Method and Cases

The FE analysis software DIANA 10.3 was used for this analysis. The Newmark β method (β = 0.25) was used for the time integration method, and the time step was set to 0.01 s. This dynamic analysis assumed Rayleigh attenuation. Equations (9) and (10) show the equations for the Rayleigh attenuation parameters α and β, where ω1 and ω2 are the primary and secondary frequencies, respectively, and h1 and h2 are the critical attenuations (=5%) corresponding to each mode.
β = 2 ( ω 1 h 1 ω 2 h 2 ) / ( ω 1 2 ω 2 2 )
α = 2 ω 1 h 1 β ω 1 2
There are two main types of dam gates: roller gates and radial gates. In this study, a U-shaped reinforcement range was assumed for the roller gate, as shown in Figure 19. Full (universal) reinforcement was not adopted, but full reinforcement (100%) was also calculated as a comparative example to understand the effect of partial reinforcement. The main rebar used was D25, and D22 was used as the shear rebar in the PCM layer, as shown in Figure 20.

4. Results and Discussion

4.1. Seismic Resistance Evaluation Method for Dam Pier by FE Analysis

In this study, the reinforcement effect of the SRS method on the seismic resistance performance of dam piers during and after an earthquake was determined from the damaged state. In general, dam piers need to function even if they are damaged after an earthquake. The highest priority function is, of course, the water storage function; however, to maintain the water storage function, it is also important that the gate can be opened and closed smoothly and that water leakage due to damage to the skeleton is prevented [15]. To ensure that these functions were not impaired, we decided to confirm that the residual displacement of the dam pier at the gate position was within the allowable value. However, the residual displacement depends not only on the maximum acceleration of the seismic waves but also on their historical characteristics. In addition, the damage distribution in the structure and the seismic wave amplitude characteristics in the final stage seem to have a significant impact. Therefore, it is difficult to predict the residual displacement quantitatively and accurately using numerical analysis. Therefore, we decided to make a relative comparison of the reinforcement effect on the dam, focusing not only on the residual displacement but also on the maximum displacement. In addition, the strength of the dam pier itself was evaluated by checking the crack distribution in the concrete in the non-reinforced part and the reinforced part, and the strain of the main reinforcing bar.
The results and discussions are given below after Section 4.2.

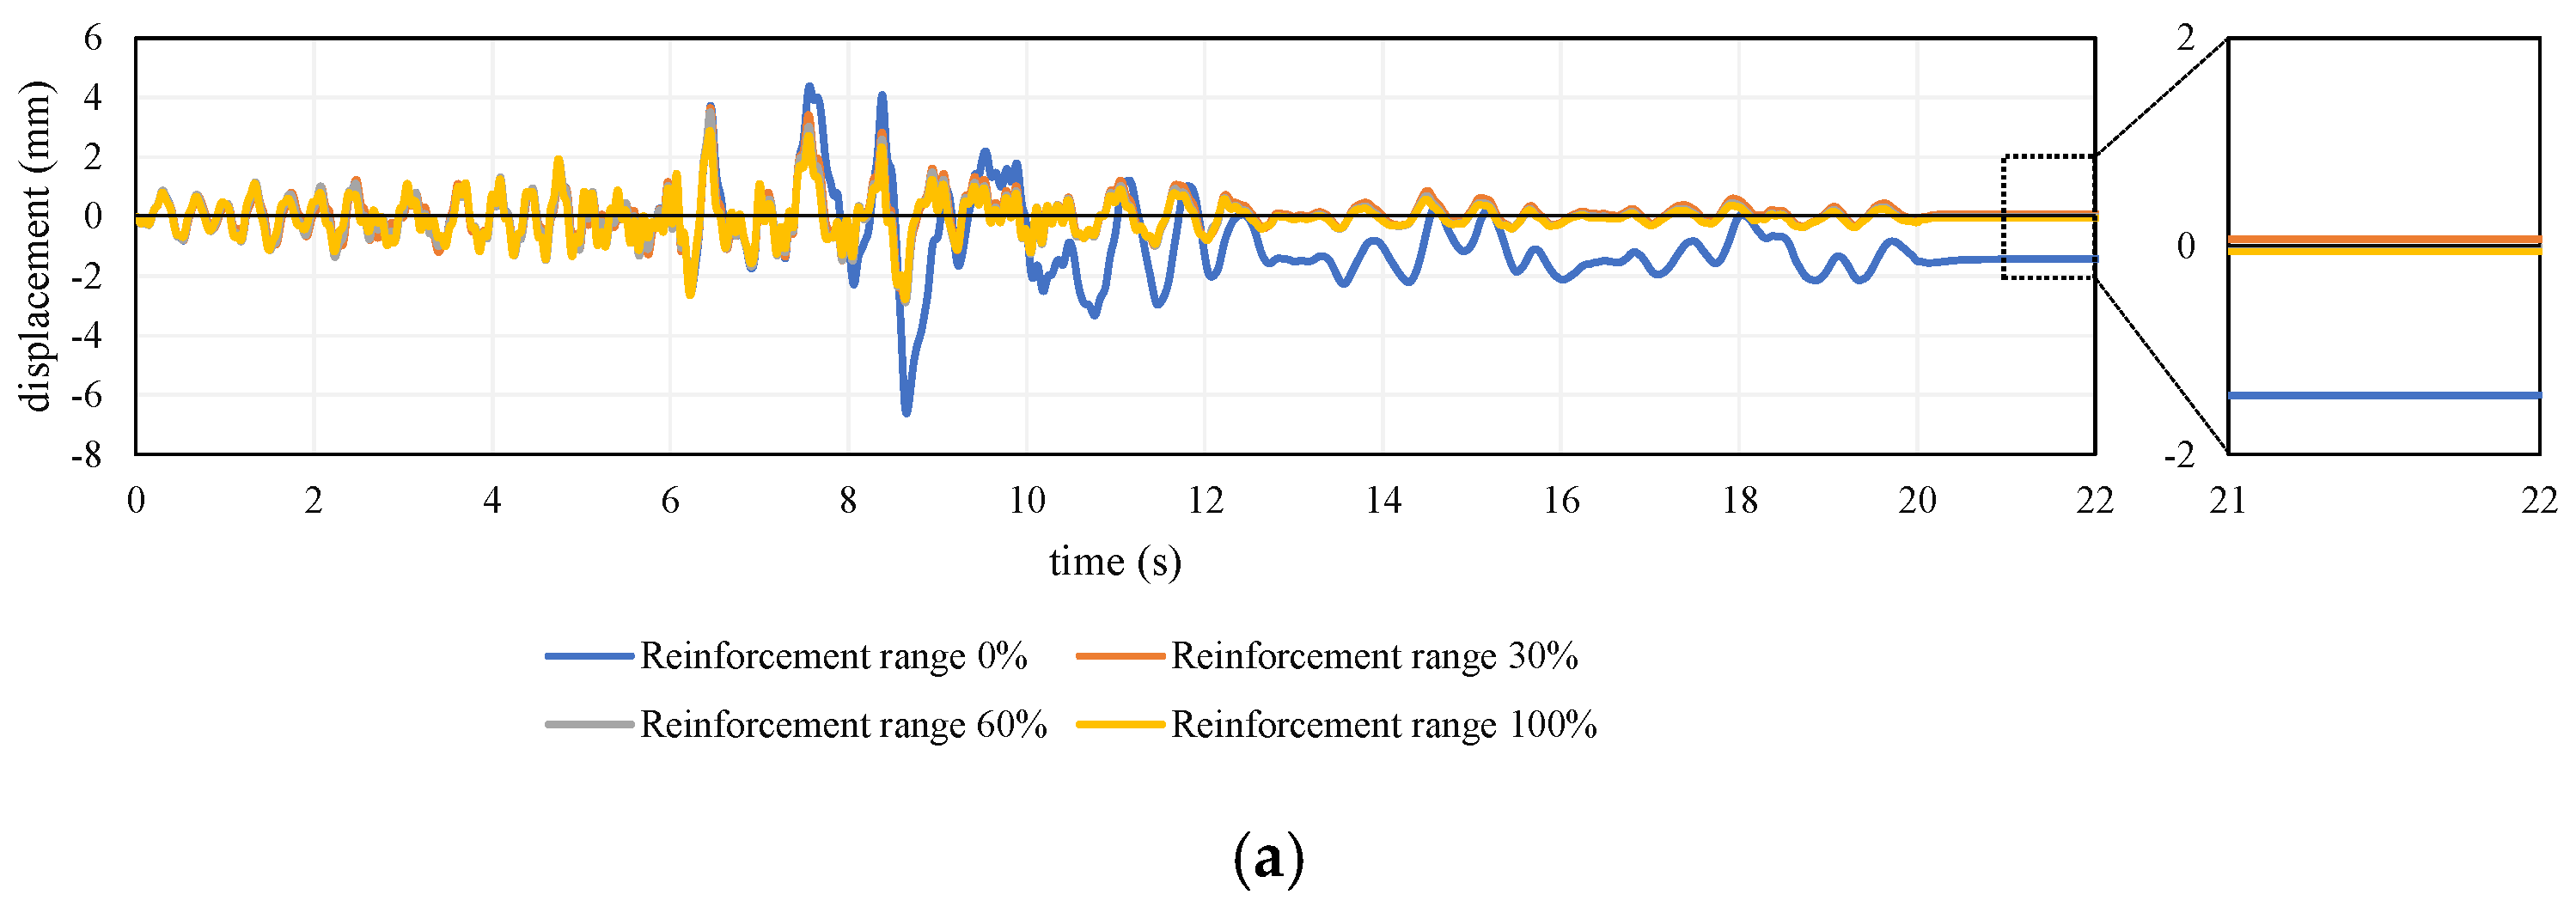
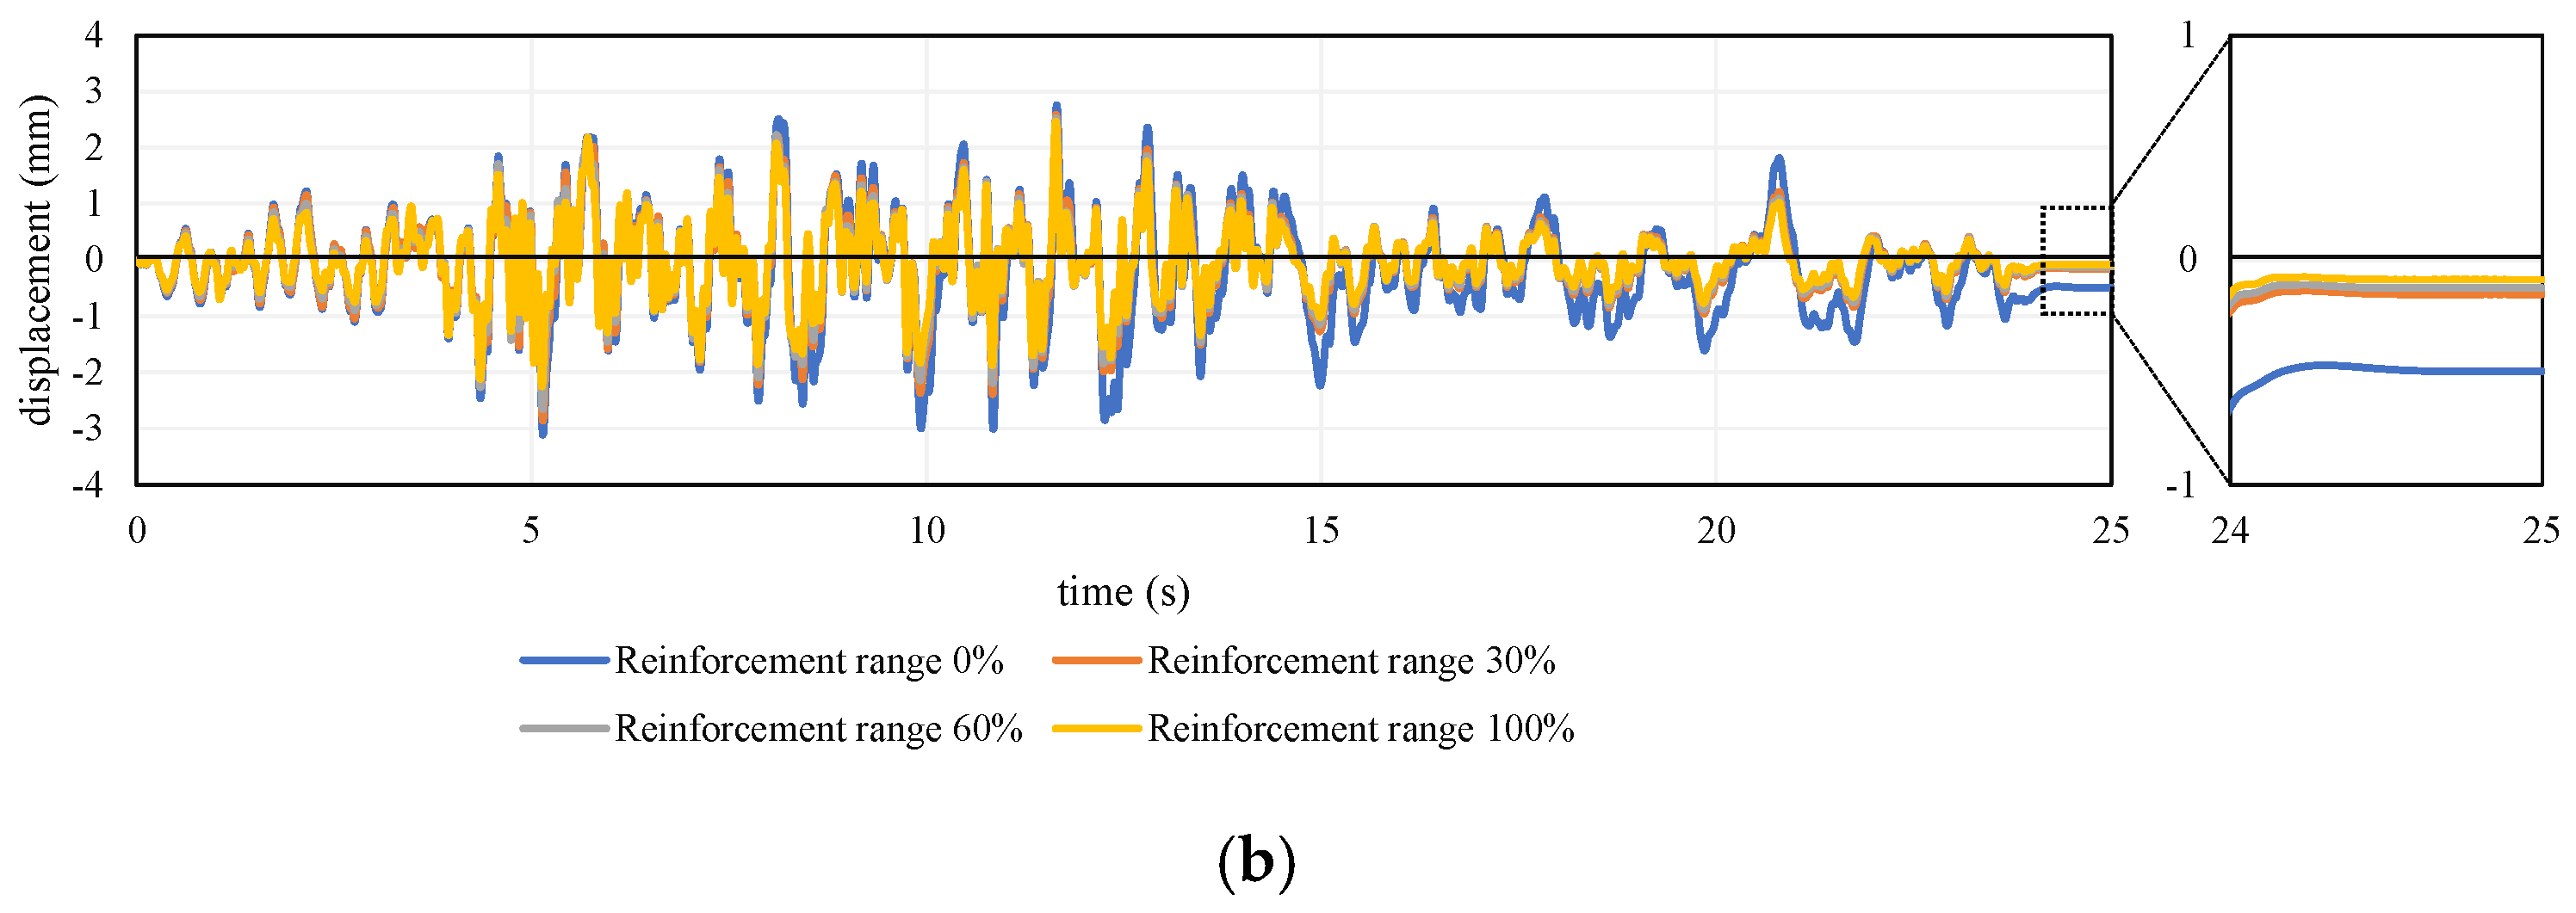
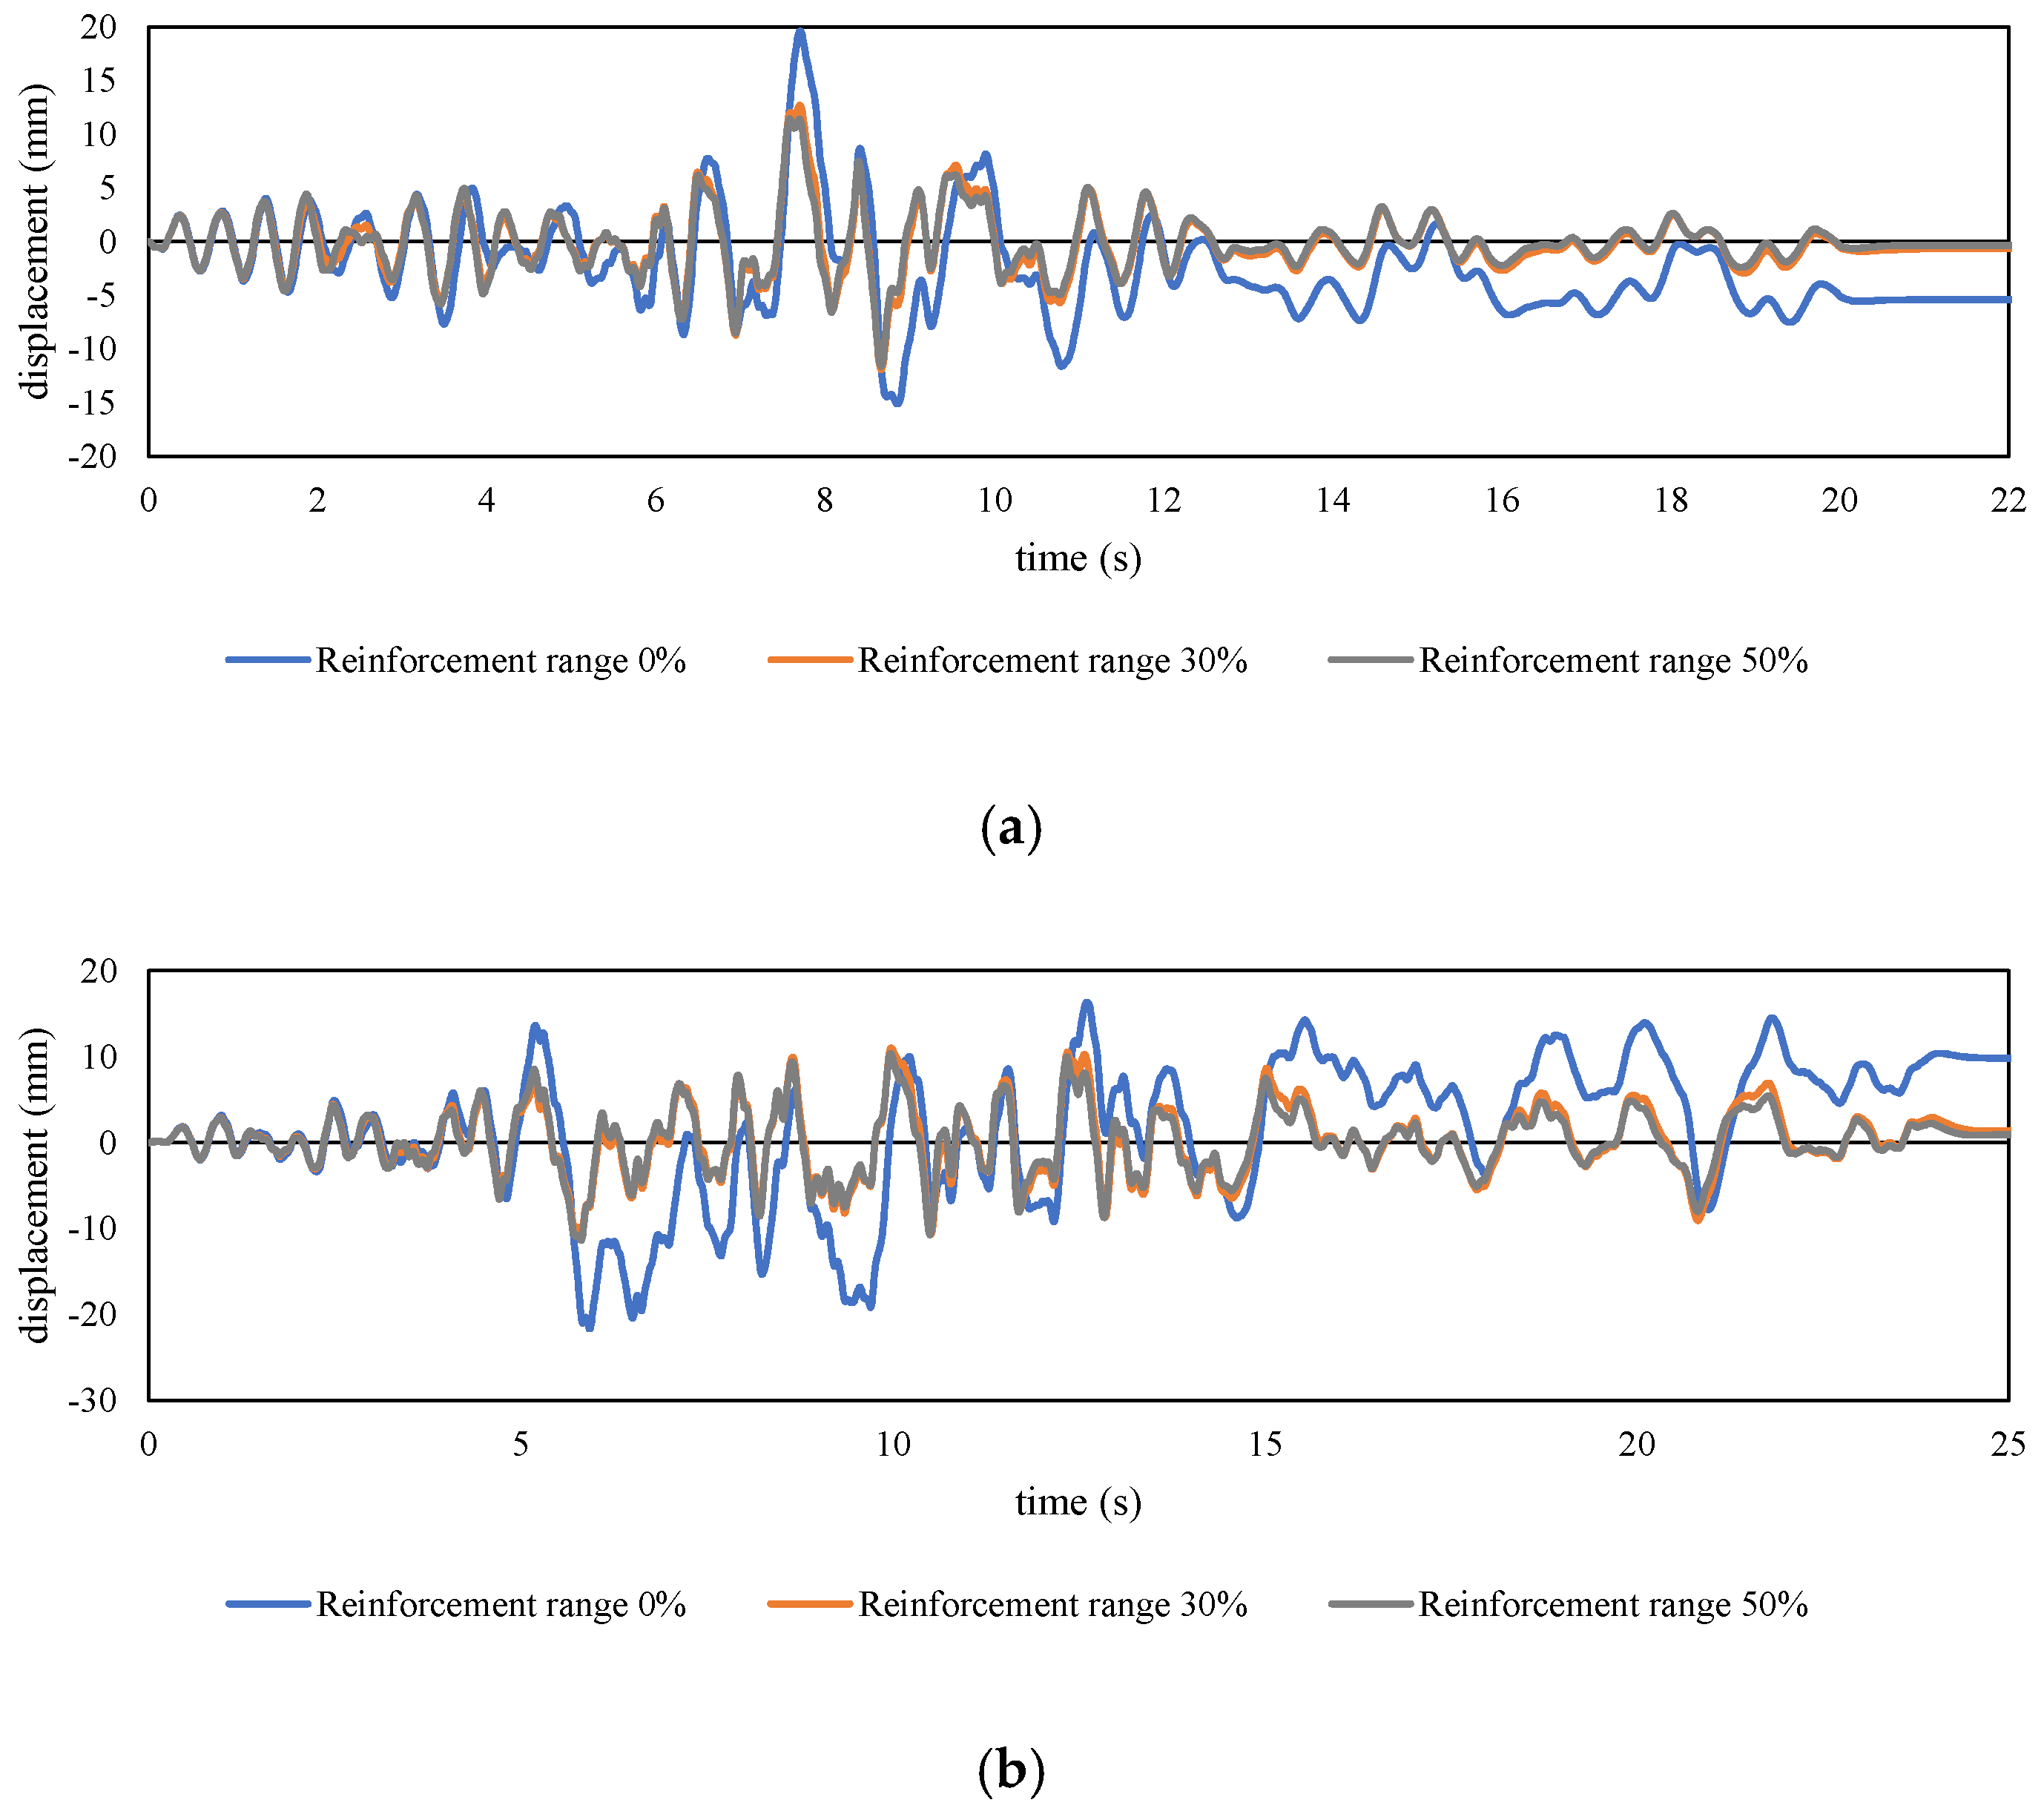
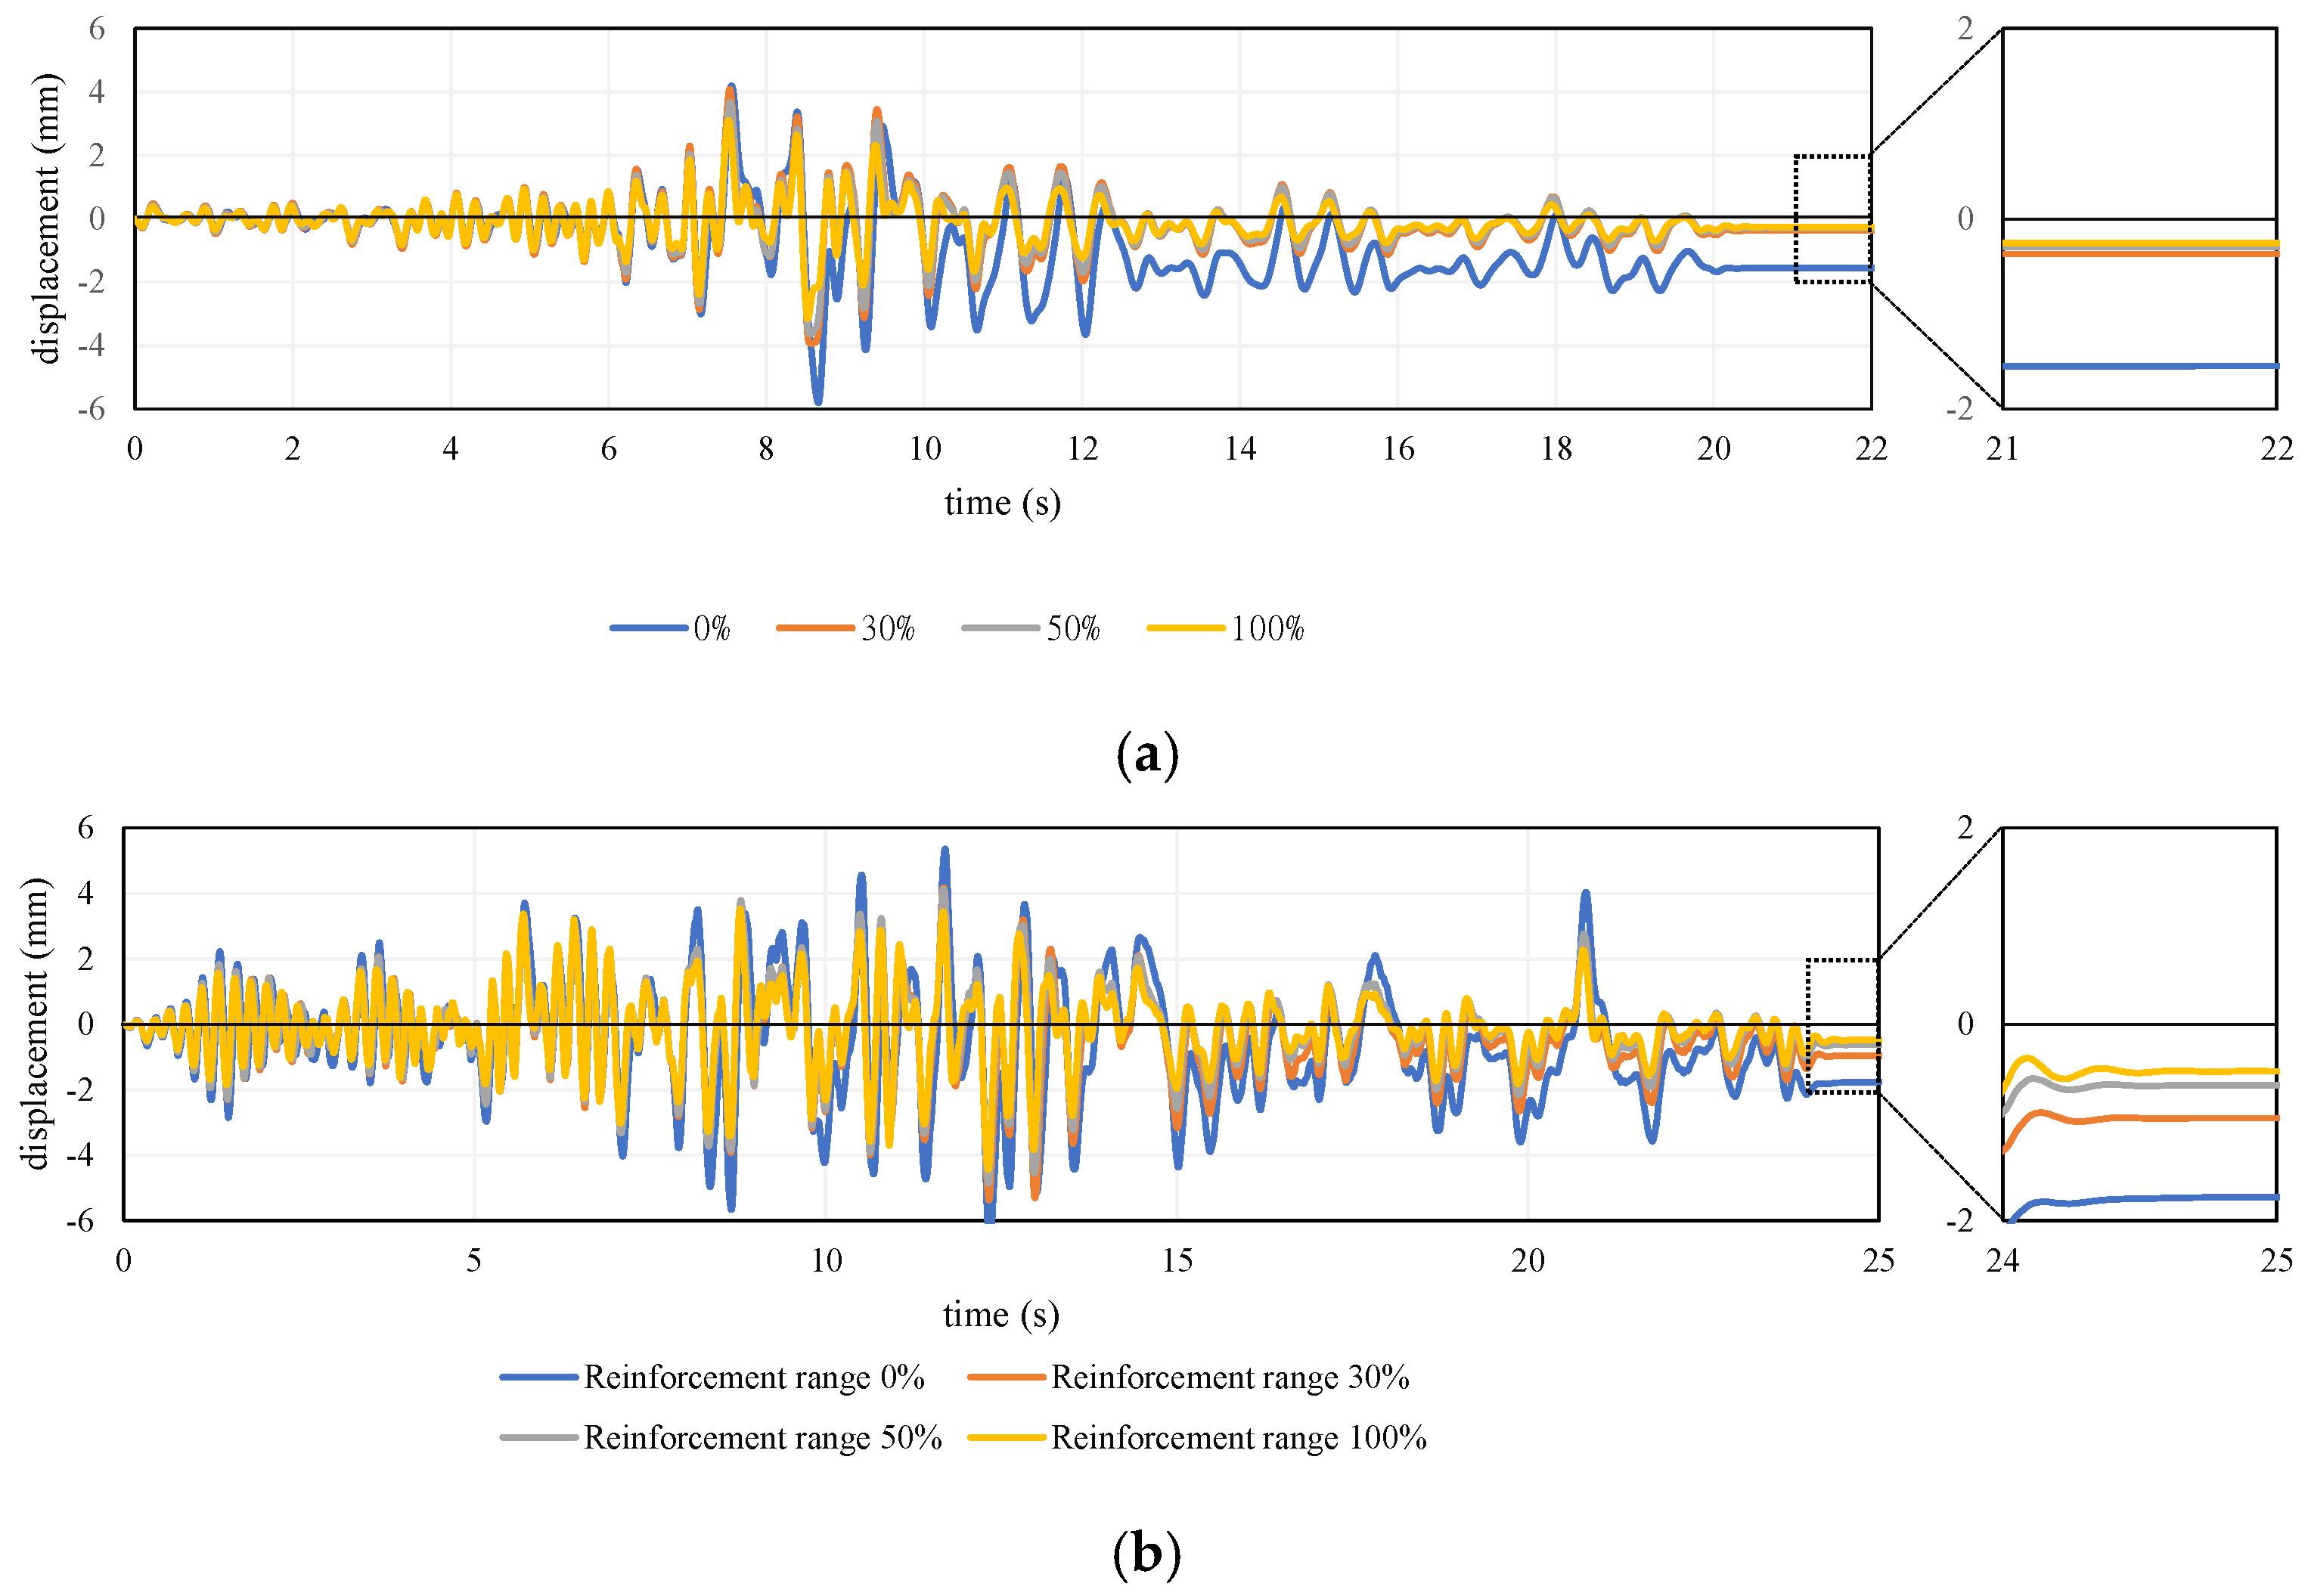
4.2. Seismic Response of Dam Piers

Figure 21, Figure 22, Figure 23 and Figure 24 show the results of the displacement-time history of the four dam types using wave A and wave B, respectively. From these results, it can be seen that the maximum displacement of each type is reduced owing to the reinforcement effect.
In Figure 21a, by comparing the results of the RC and RPCM models (reinforcement range of 60%) in TYPE-A, it can be confirmed that the displacement response of the RPCM model becomes smaller than that of the RC model after 7 s under wave A. In the case of Figure 21b, it can also be confirmed that the displacement response of the RPCM model becomes smaller than that of the RC model after 12 s under wave B. This is because the maximum principal strain of the RC model throughout the base of the dam pier reached a strain level that caused bending cracks, as shown in Figure 25a, which caused a decrease in rigidity. However, in the case of the RPCM model, the bending cracks in the concrete at the base of the pier are limited to one part; thus, their maximum displacement decreased.
Next, the strain of the existing reinforcing bars was also compared between the RC and RPCM models at the time of maximum displacement, as shown in Figure 26. It was confirmed that many of the reinforcing bars reached the yield strain in the RC model. In contrast, in the RPCM model, the strain of all the existing reinforcing bars was less than the yield strain.

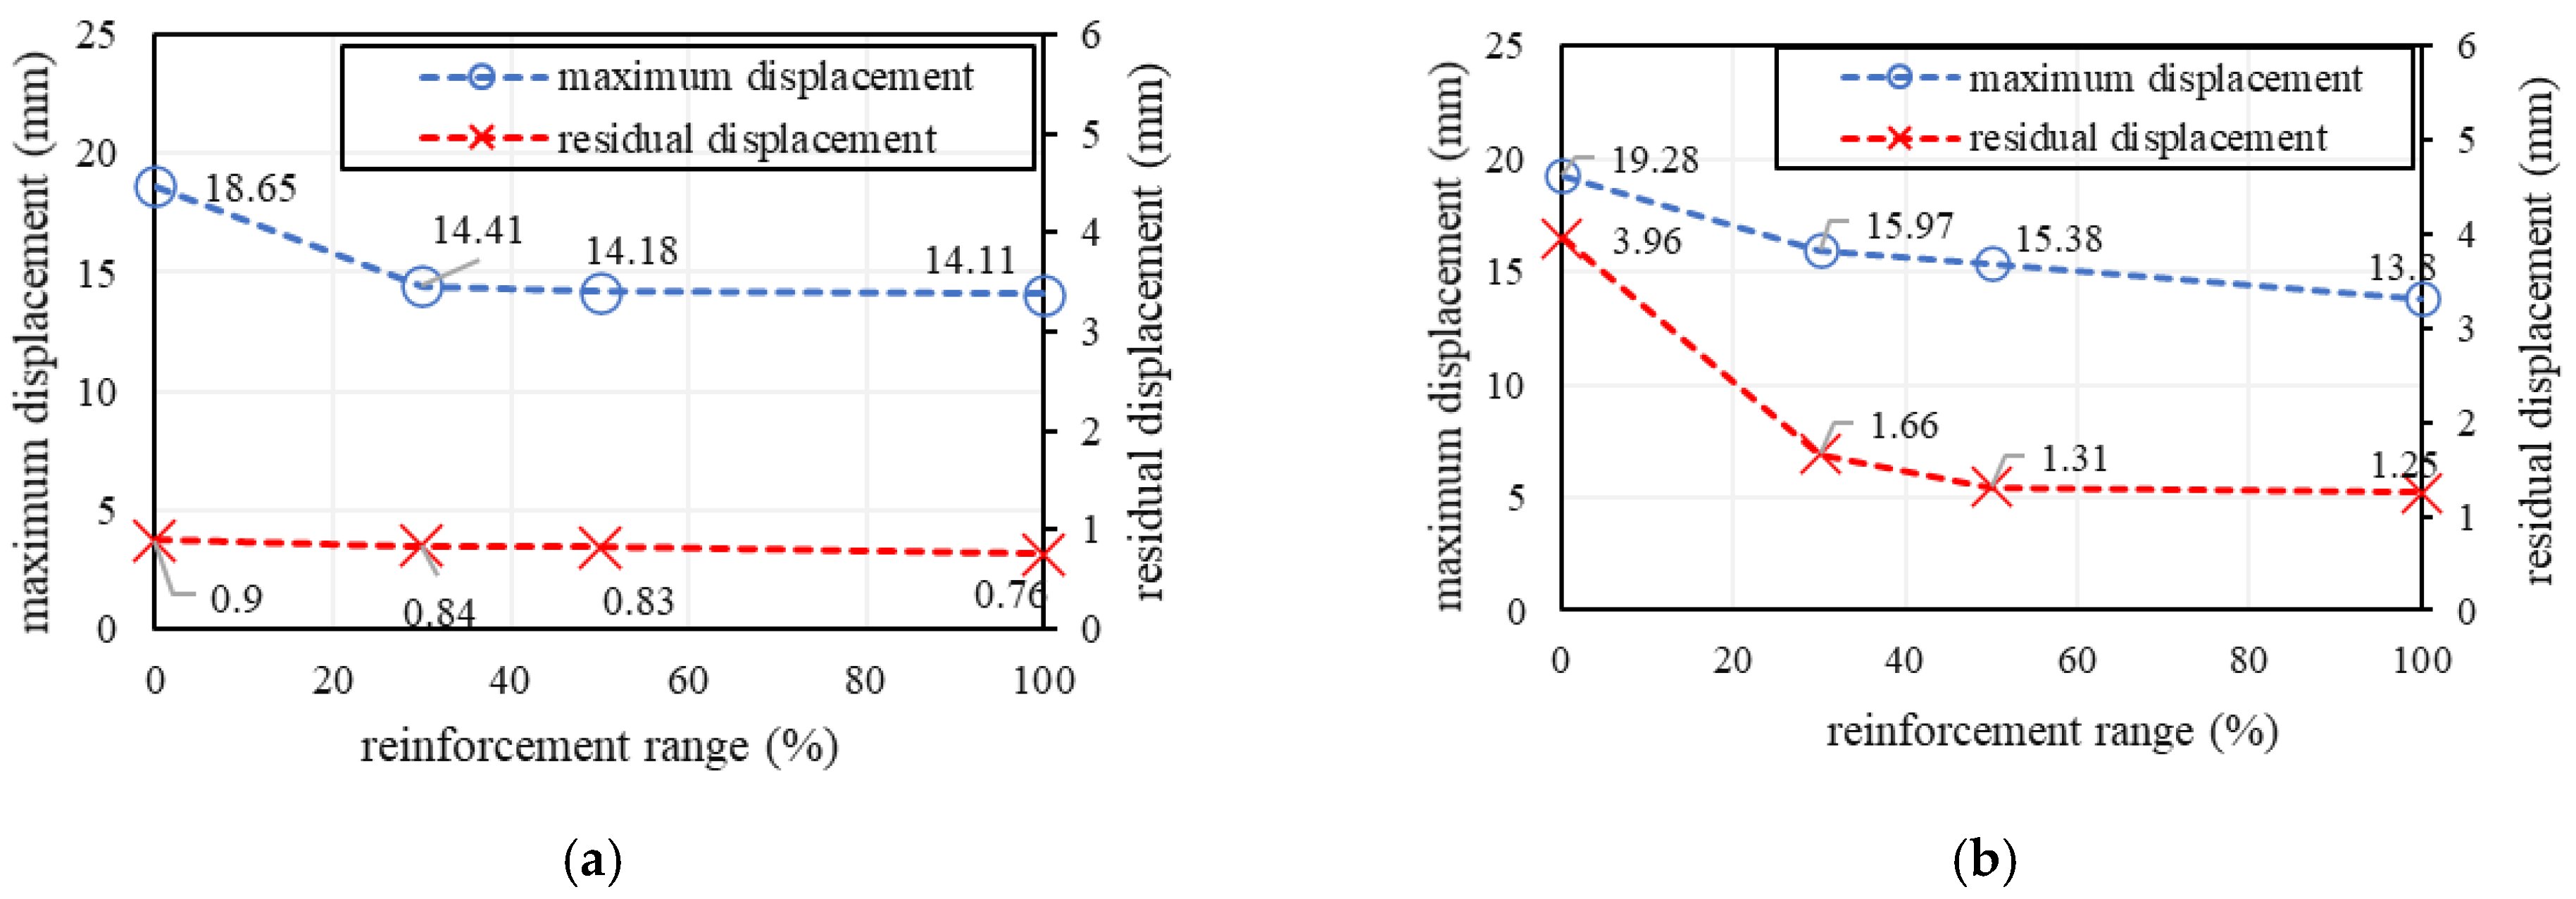
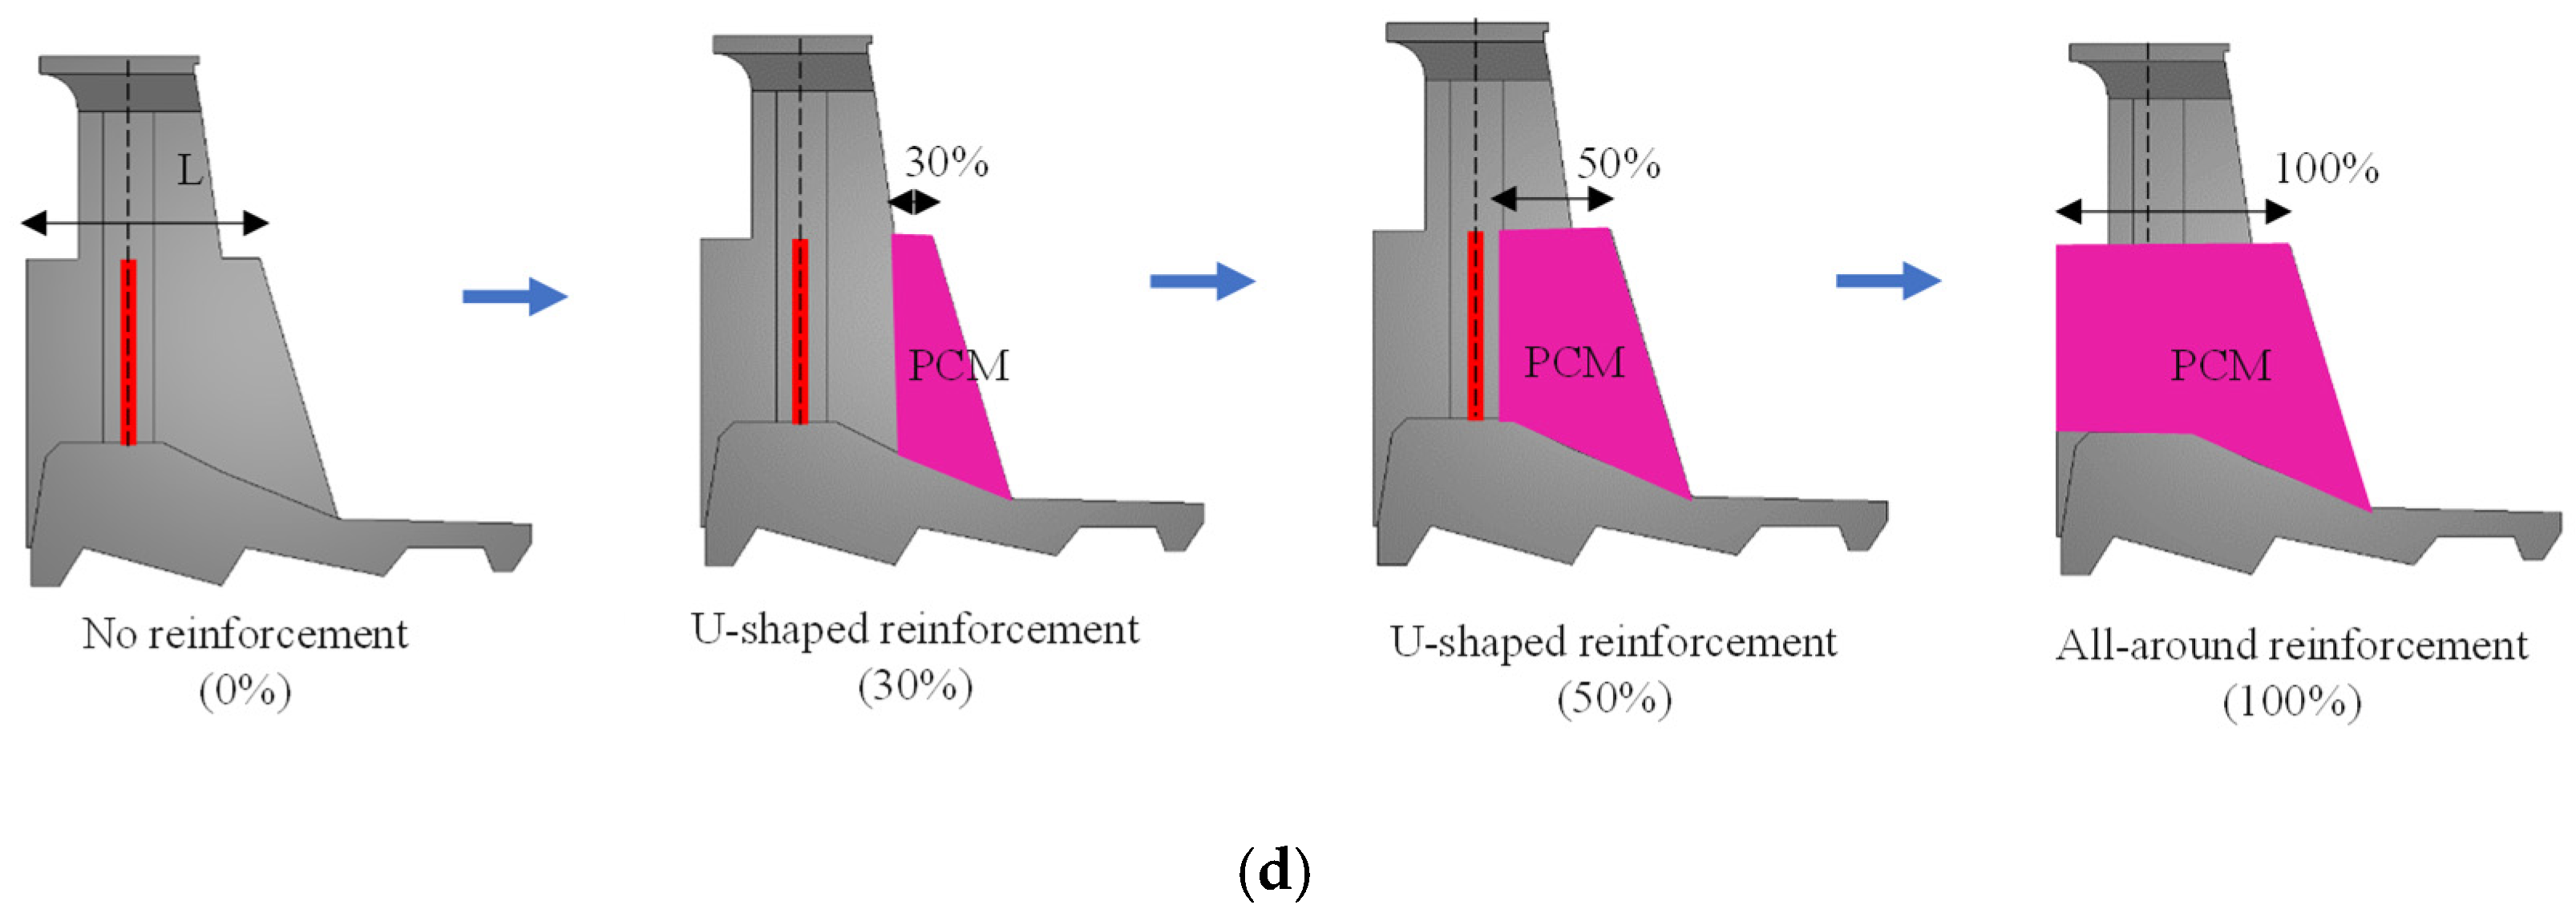
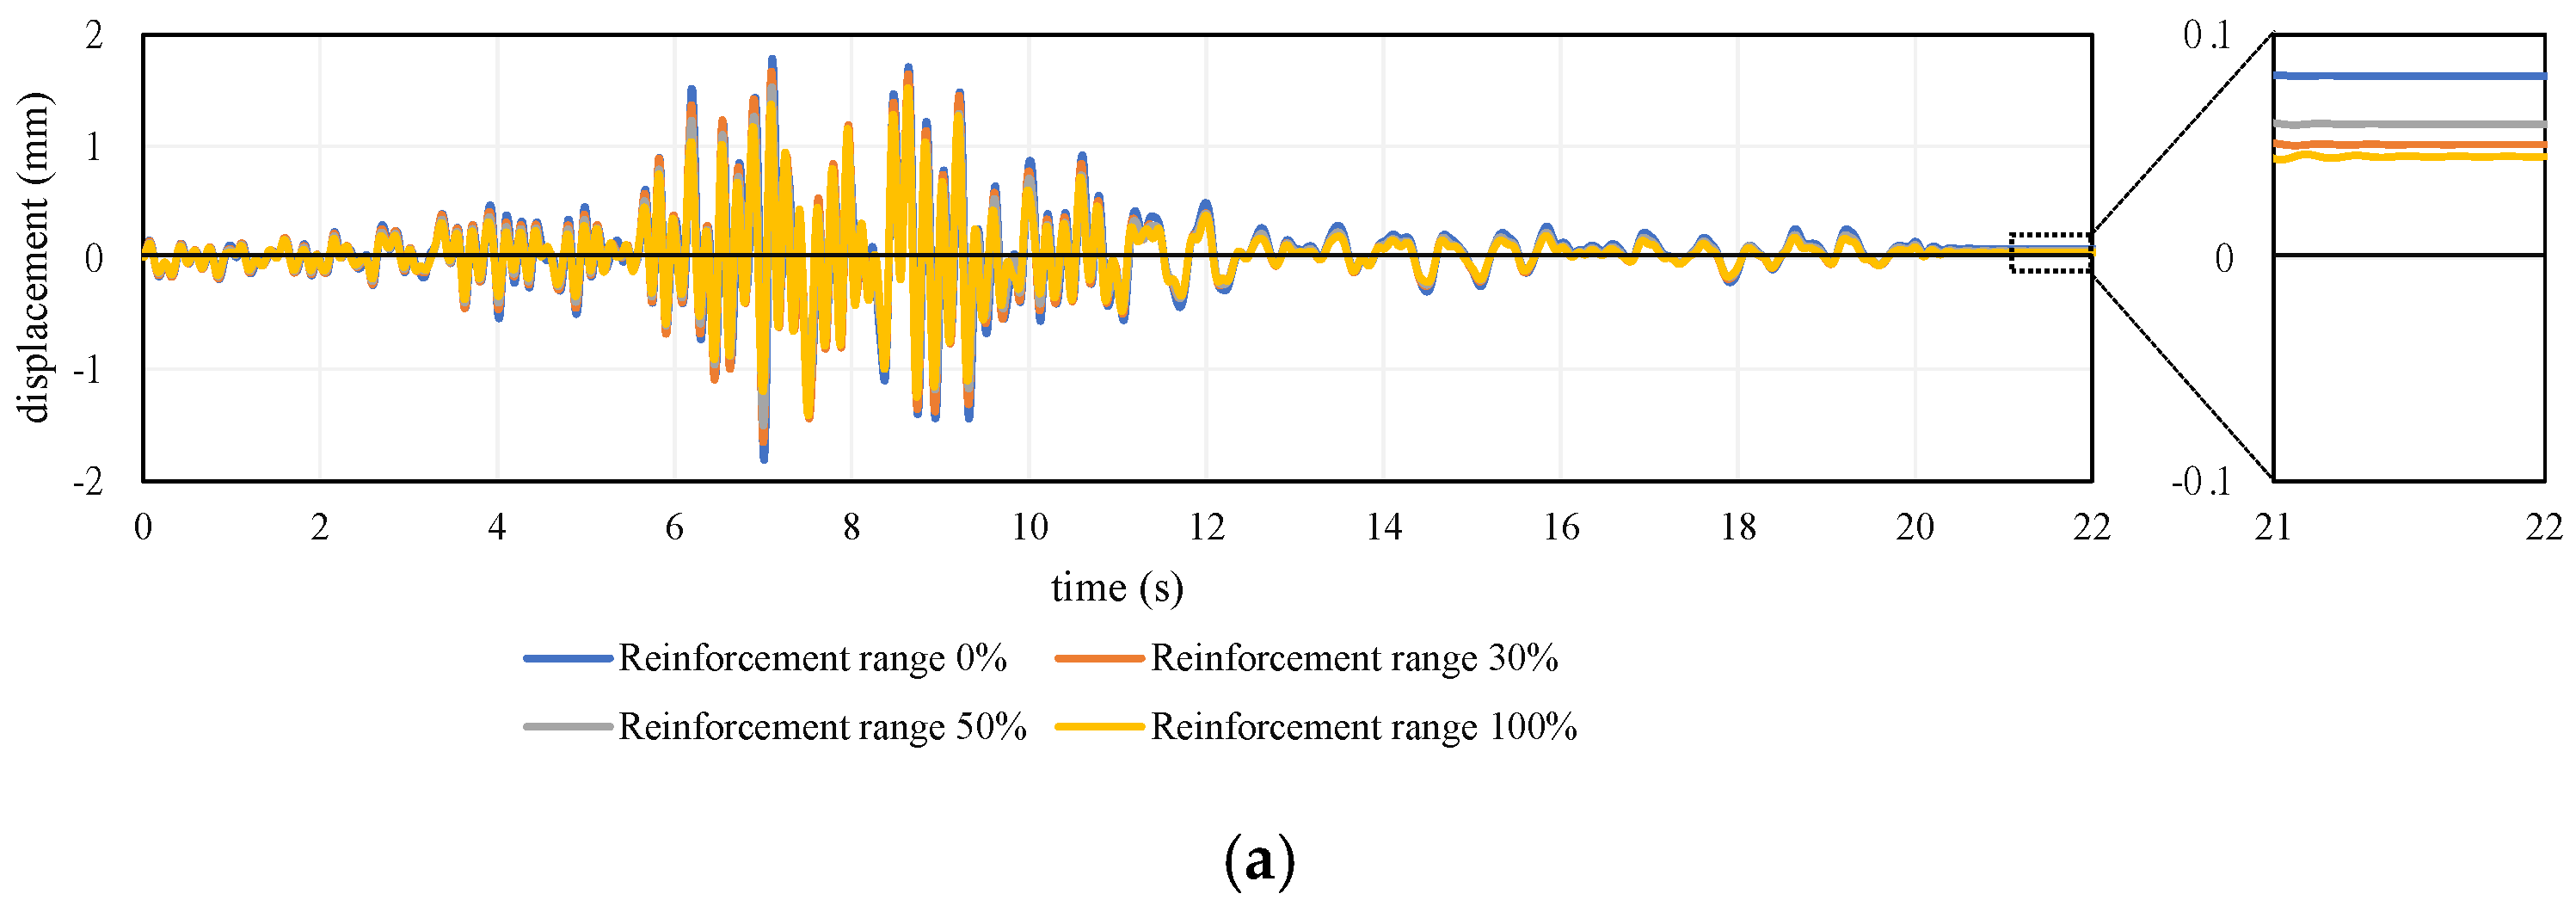
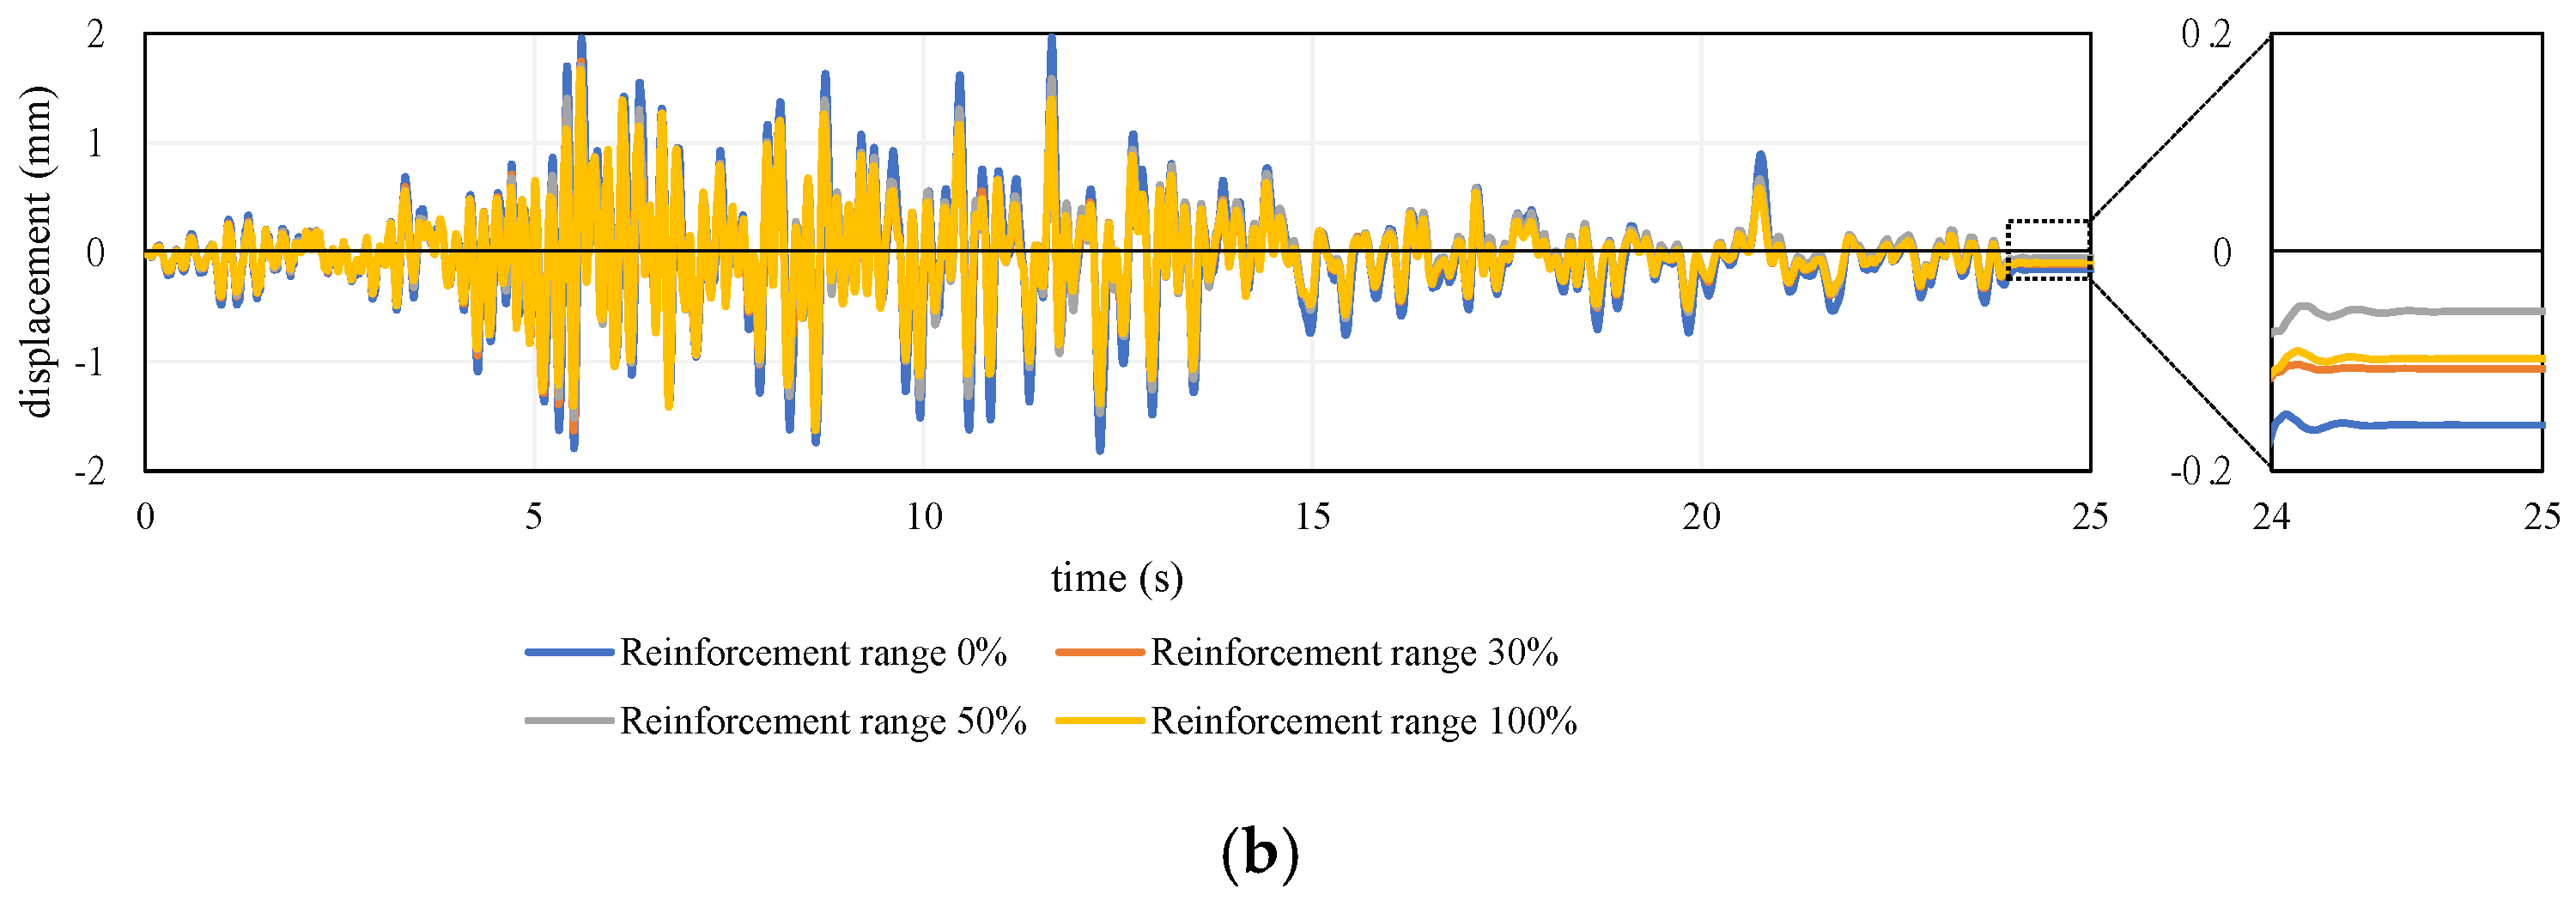
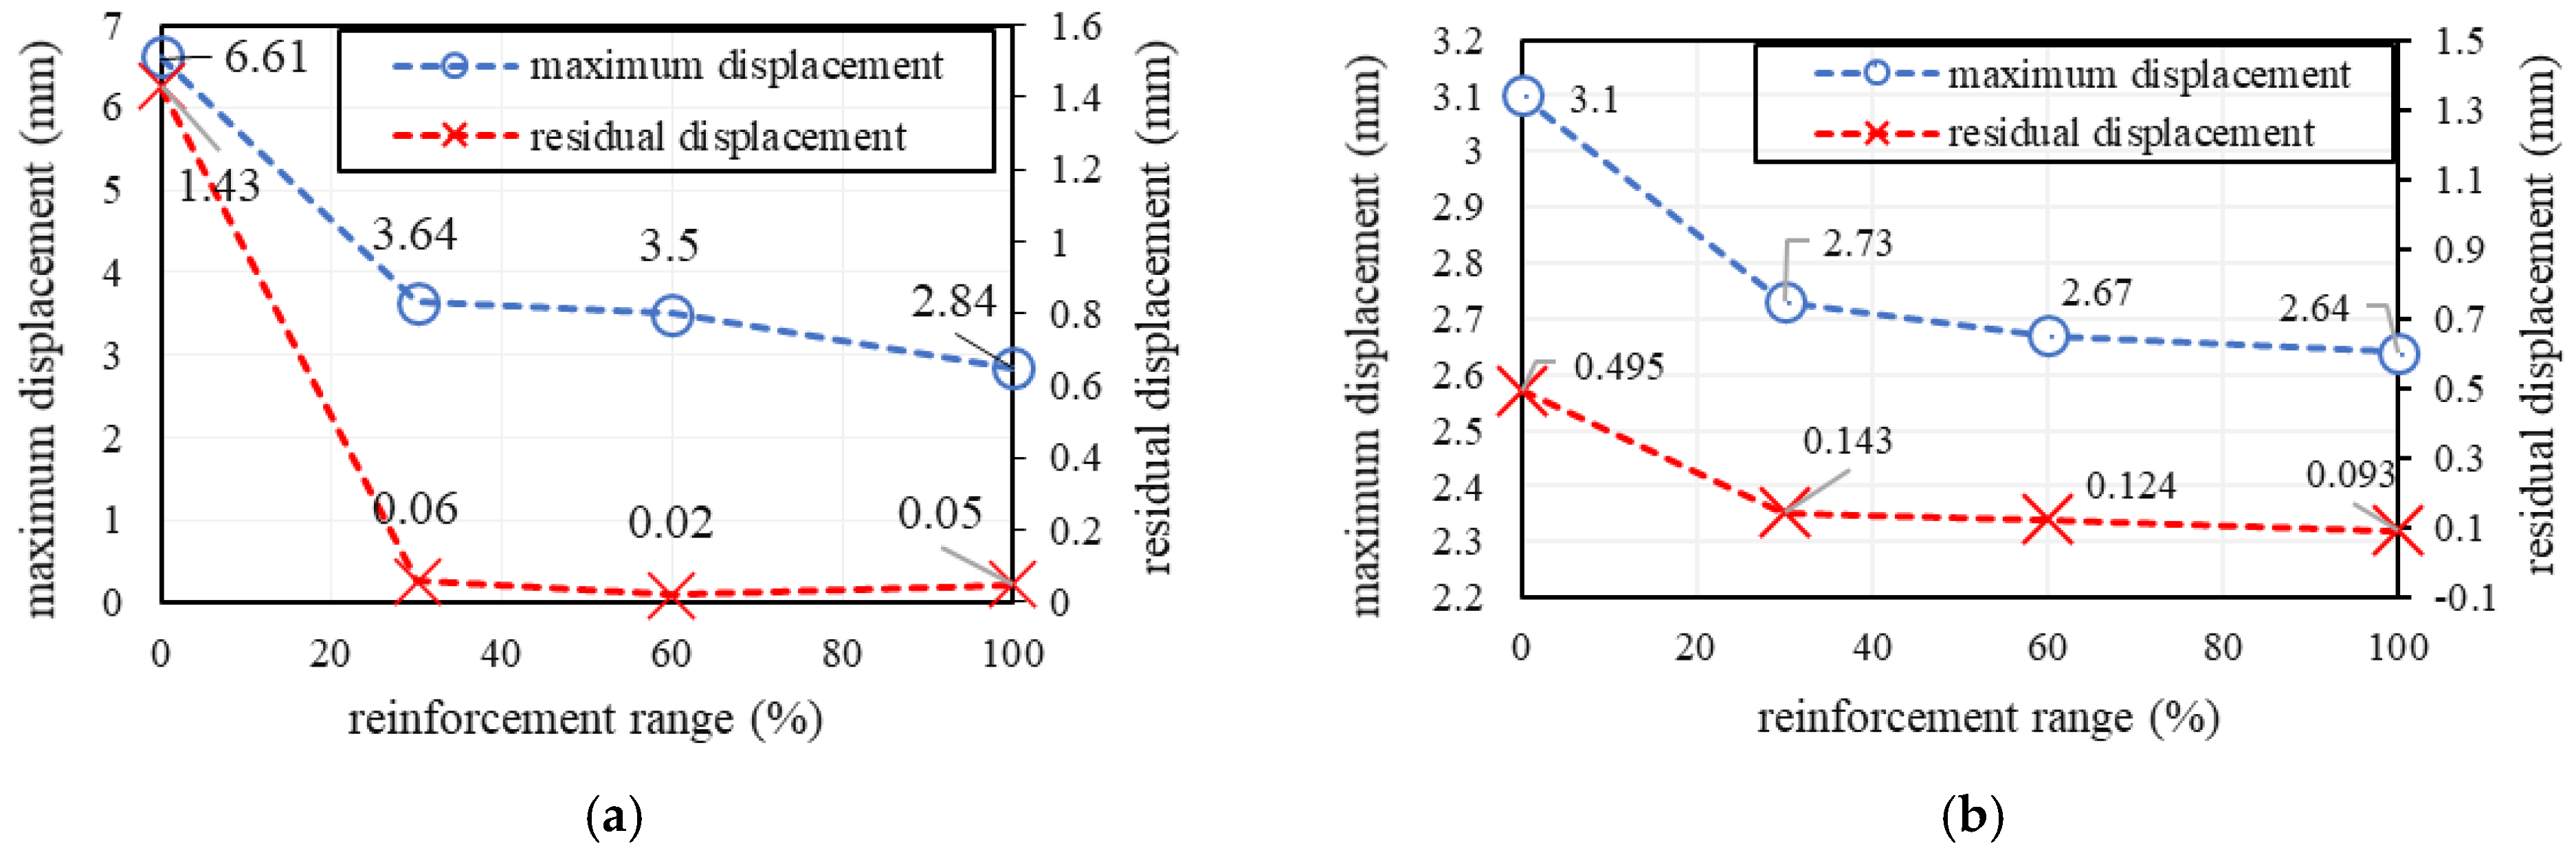
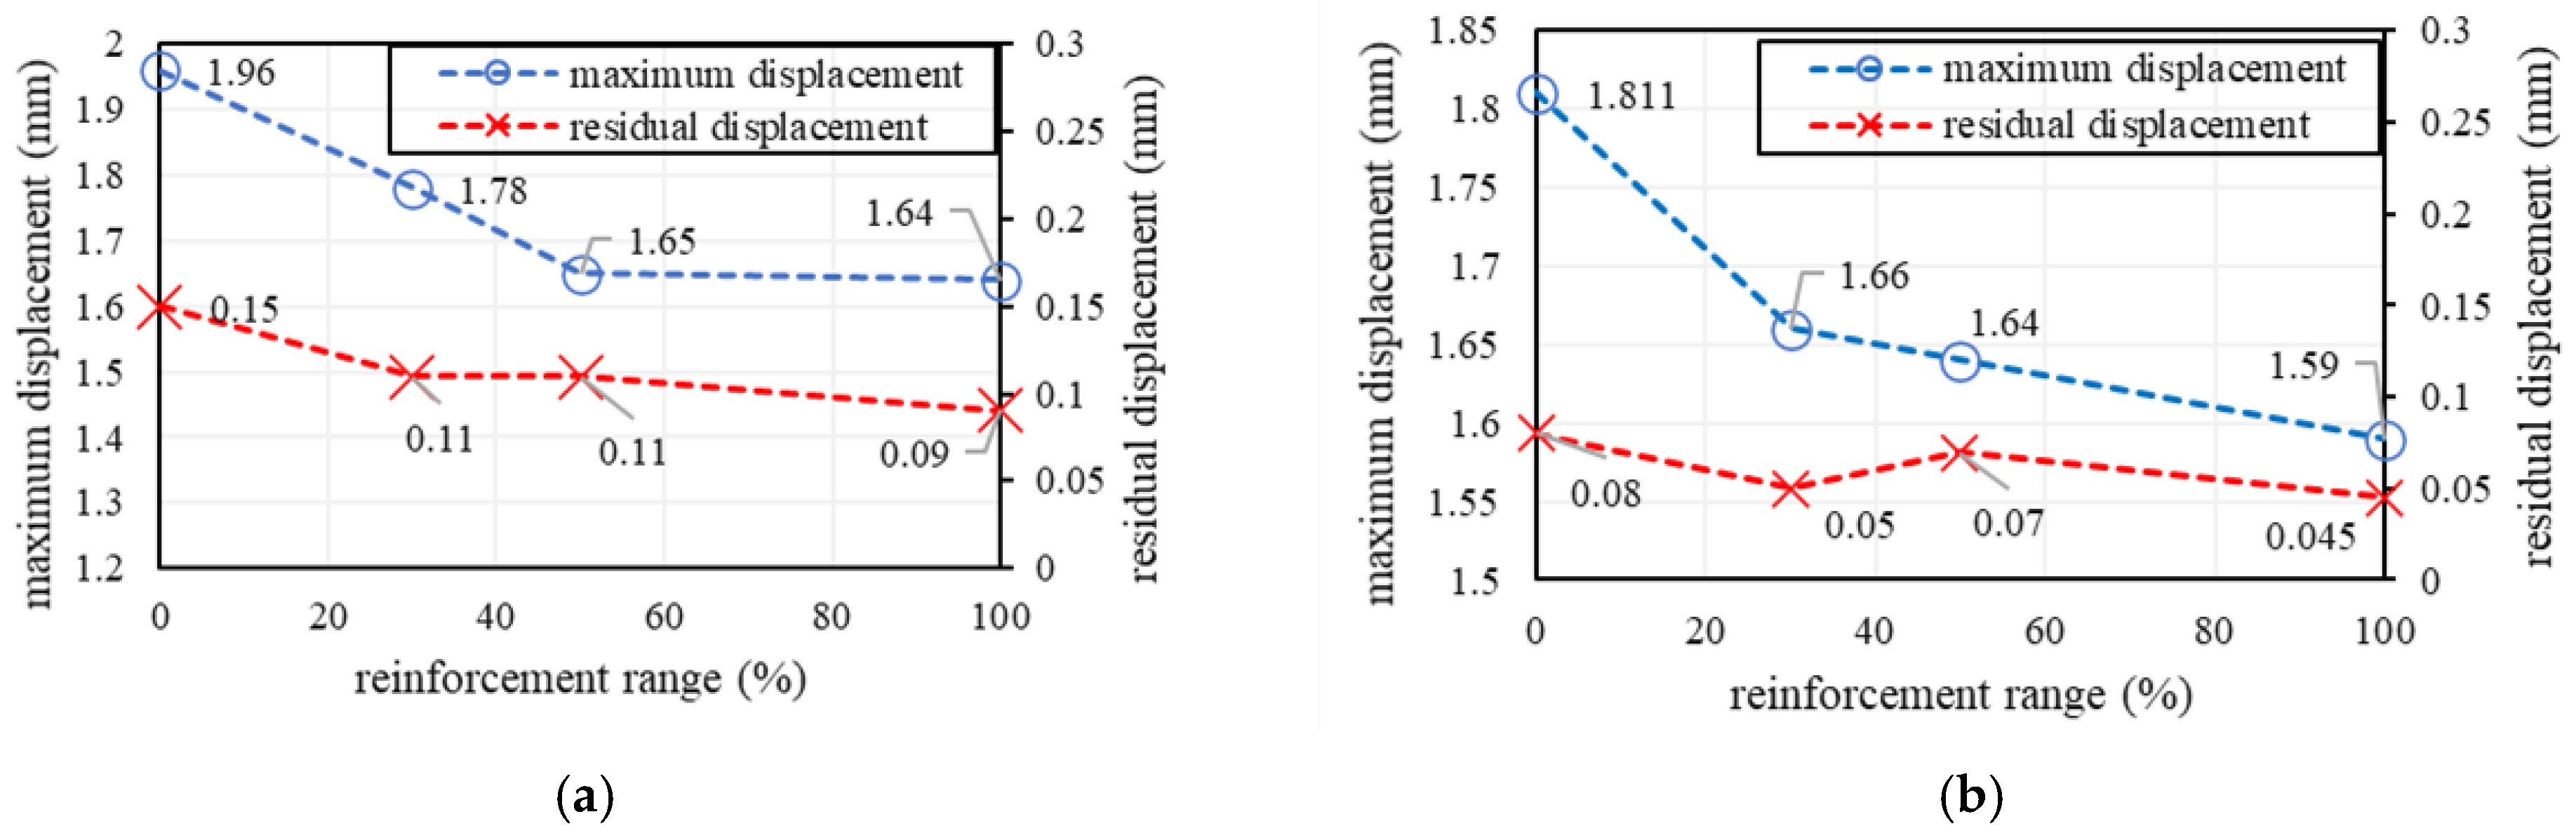
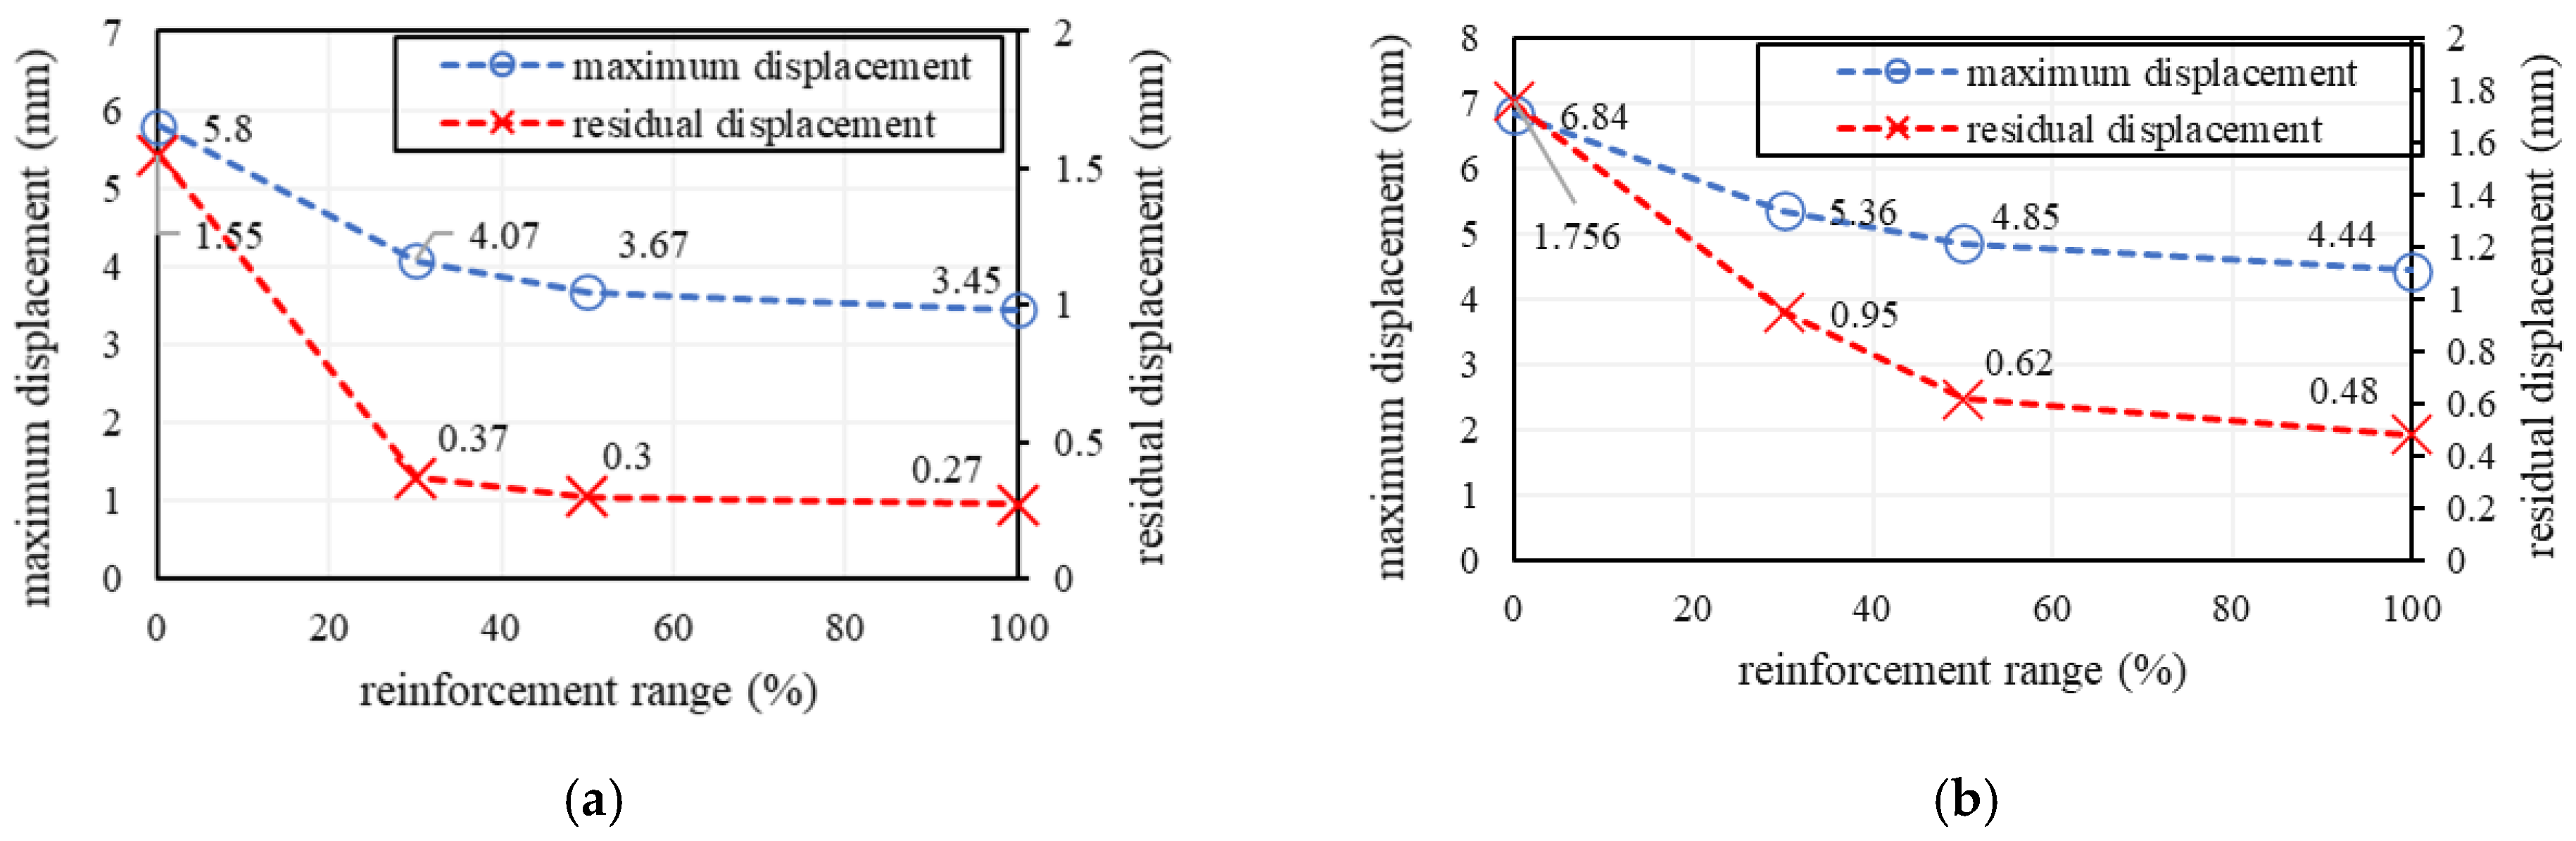
4.3. Effect of Reinforcement Range on Reinforcement Effect

To discuss the effect of the reinforcement range on the reinforcement effect, we focused on the axial strain distribution in both the existing and reinforcement parts. Here, the results of two different reinforcement ranges (30% and 60%) for the TYPE-A dam under wave A are compared, as shown in Figure 27 and Figure 28. First, it was confirmed that the axial strain of the existing reinforcing bar did not exceed the yield strain in either case and that they had a sufficiently reinforcing effect. In addition, the tendencies of both are similar, and it can be said that the effect of the reinforcement range on the vibration characteristics of the entire structure is small. As shown in Figure 27b and Figure 28b, it was confirmed that relatively large strains were concentrated at the root of and upstream of the reinforcing bar at the reinforcement part. When the seismic motion that exceeds the seismic load is applied, it is thought that the weakest reinforcing bars will yield first, so it is necessary to take measures such as using large reinforcing bars for these parts.

4.4. Comparison of Reinforcement Effect of Each Dam

Figure 29, Figure 30, Figure 31 and Figure 32 show a comparison of each dam type’s maximum displacement and residual displacement for four different reinforcement ranges by seismic wave A and seismic wave B. In the TYPE-A model, the reinforcing effect was recognized for both types of seismic waves. In particular, for seismic wave A, it was found that by reinforcing the cross-sectional area of the column by 30%, a remarkable reinforcement effect was observed, such that the maximum displacement was reduced by 45%, and the residual displacement was almost zero. Next, in the TYPE-B model, the reinforcing effect was relatively smaller than that in the TYPE-A model, but a certain reinforcing effect was confirmed for both seismic waves A and B. In particular, a clear reinforcement effect was confirmed for the residual displacement due to seismic wave B, such as the 58% reduction in residual displacement from reinforcing 30% of the column cross-section. In the TYPE-D model, similar to the TYPE-A model, a clear reinforcing effect was observed for both types of seismic waves. In particular, it was found that the residual displacement was significantly reduced by simply reinforcing 50% of the column cross-section. However, for the TYPE-C model, the reinforcement effect was found to be significantly smaller than that of the other three dams. One of the reasons is that the TYPE-C model has high rigidity; thus, the maximum displacement and residual displacement due to the two types of seismic waves are both small, so the need for reinforcement by the SRS method was initially minimal. The next section examines the causes of the different reinforcement effects for each dam and seismic wave. In some cases (for example, in the case of Figure 31b), the residual displacement is slightly large even though the reinforcement range is large. It can be said that this is because the final residual displacement of the element that repeats compression and tension changes sensitively depending on the mesh size and handling after cracking occurs. However, the reinforcing effect of the RPCM was observed in all cases.

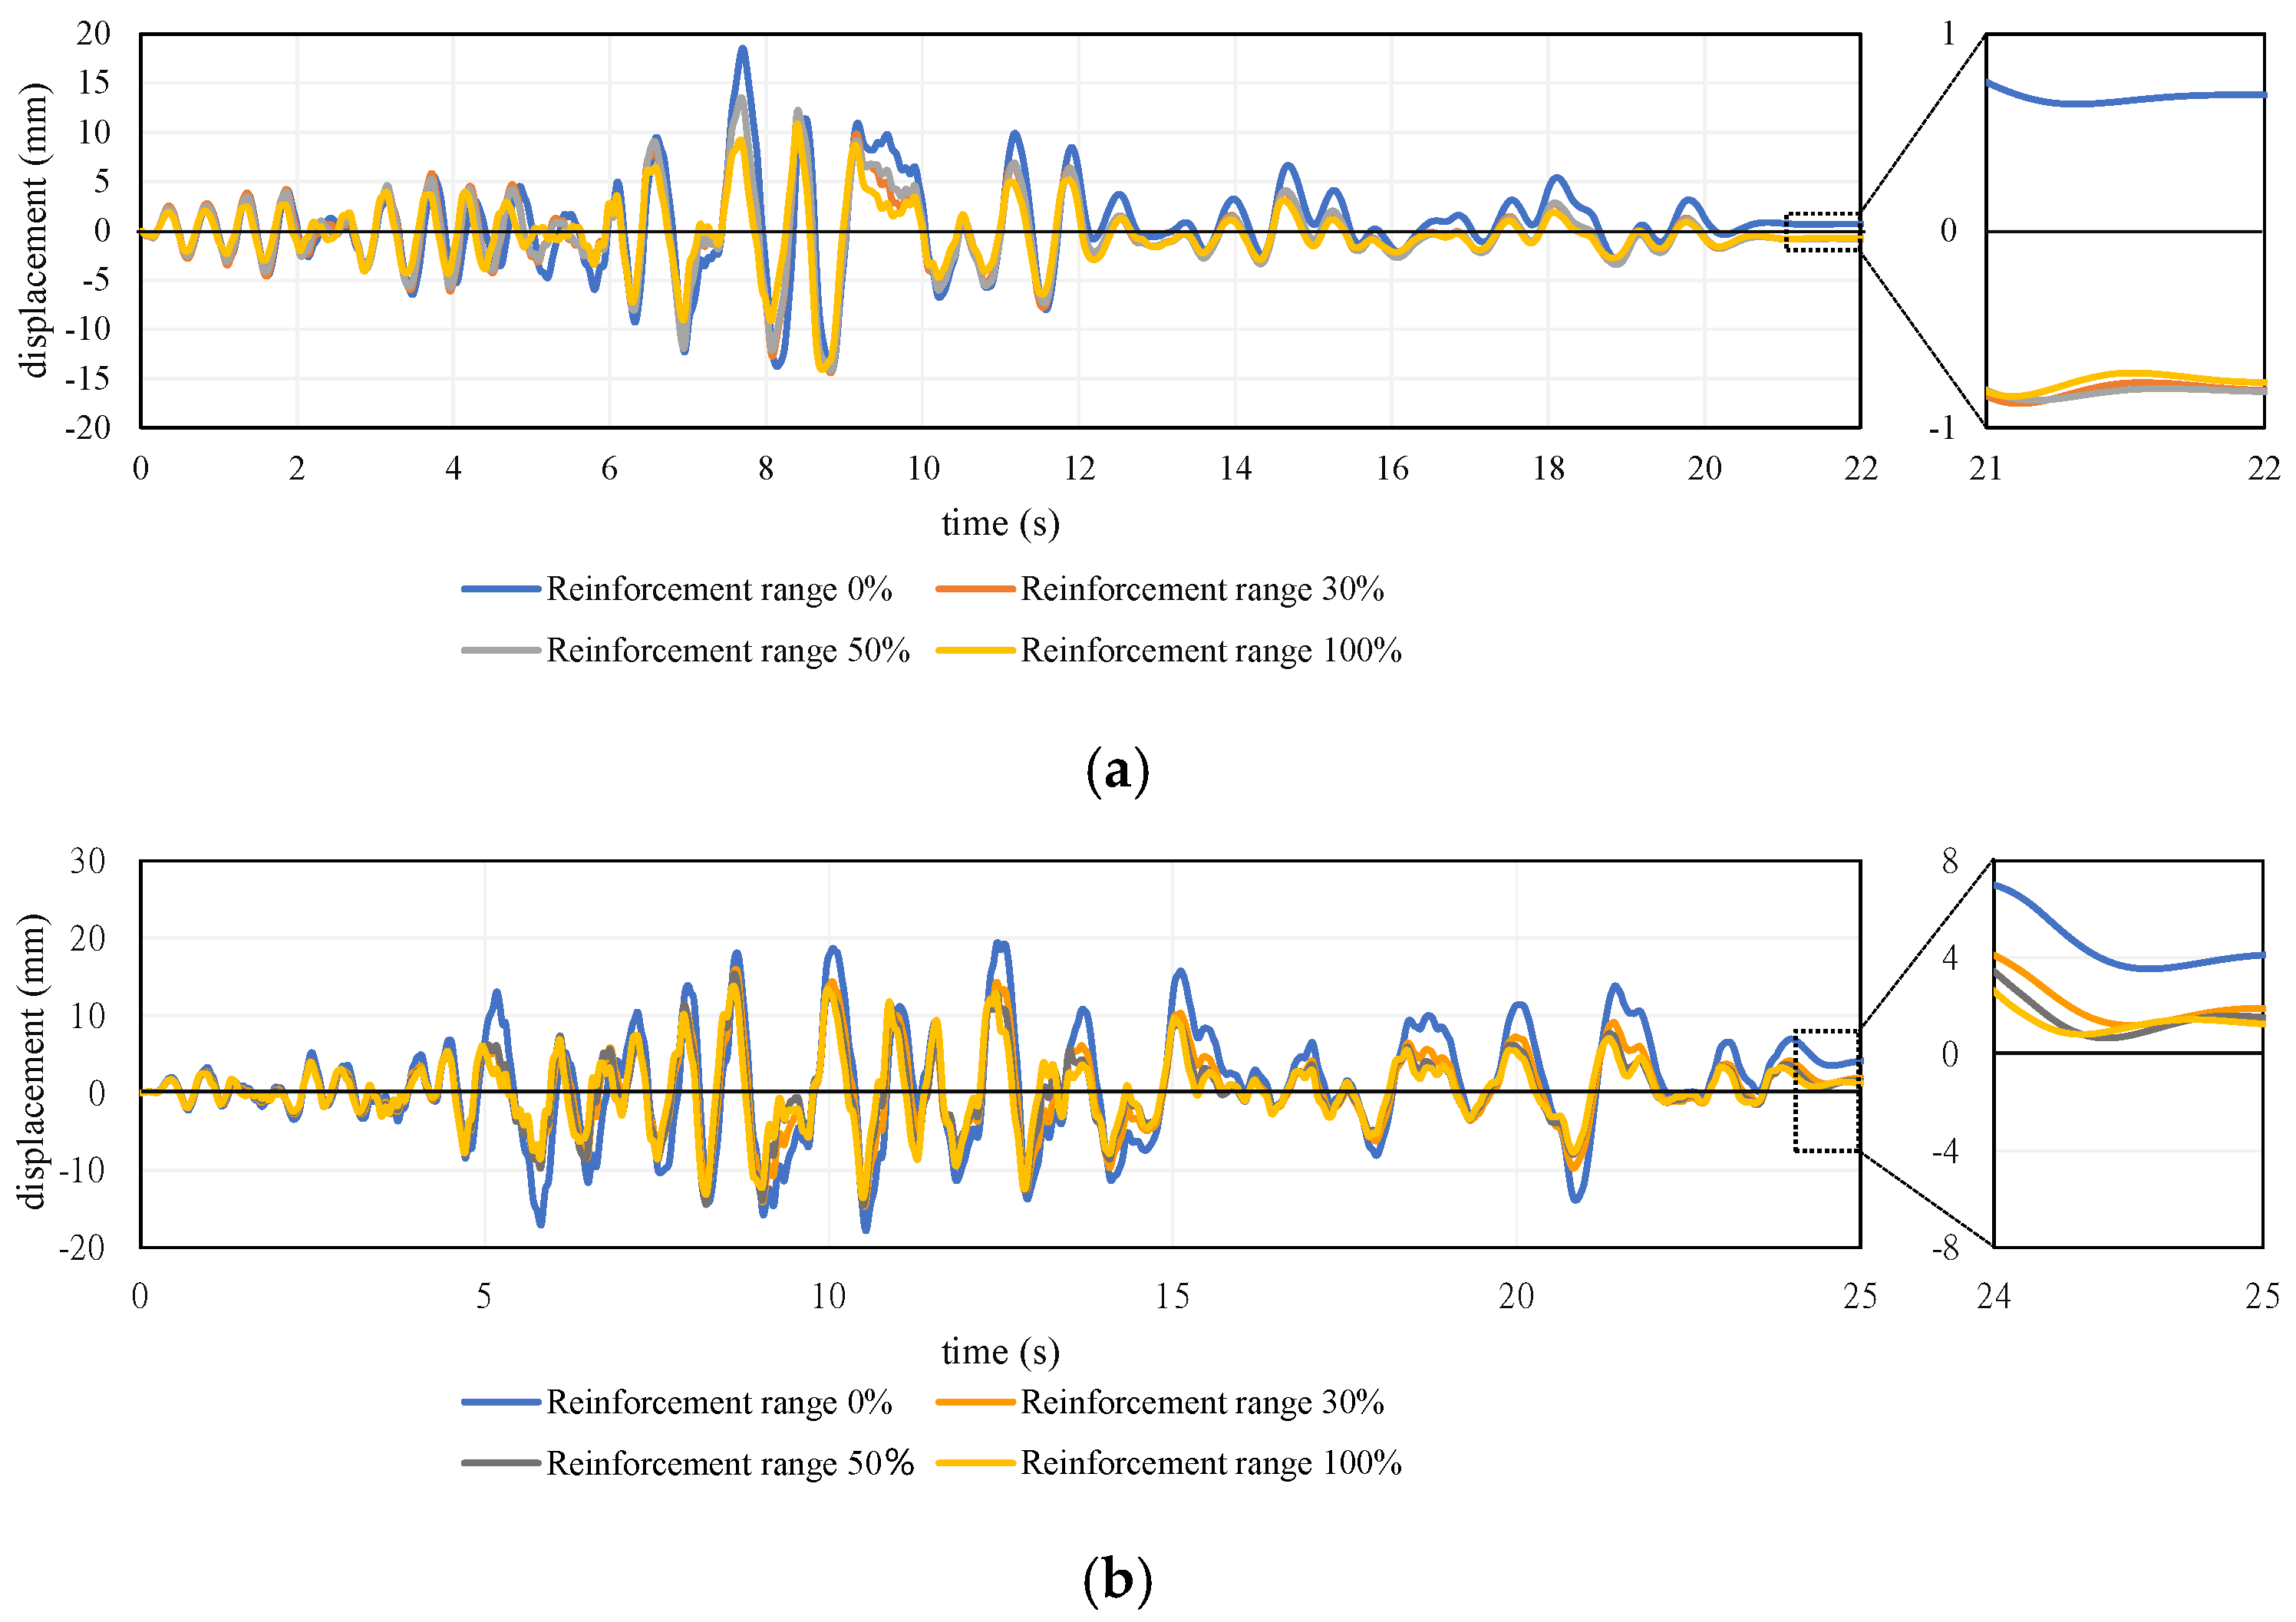
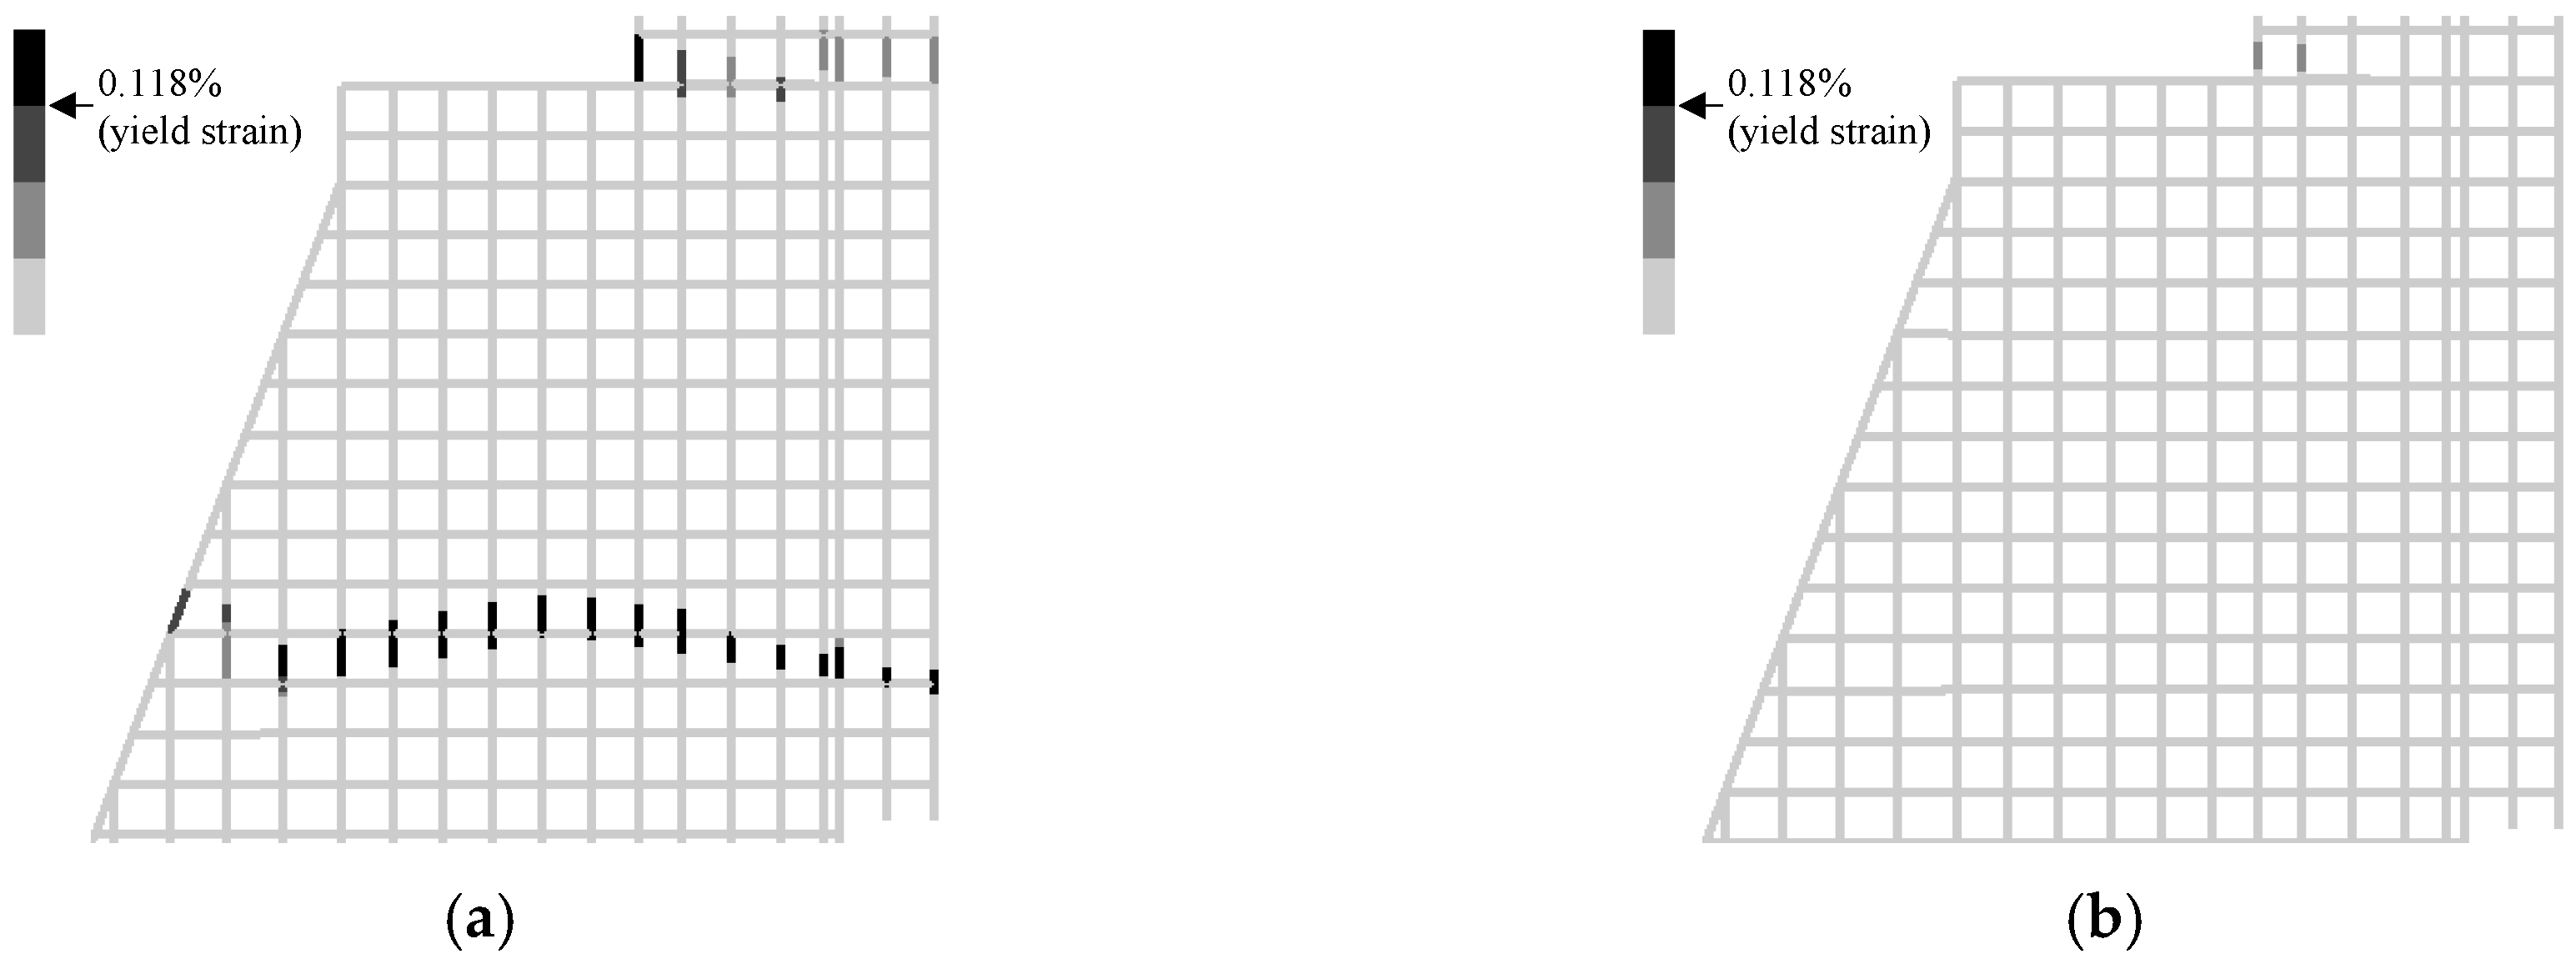
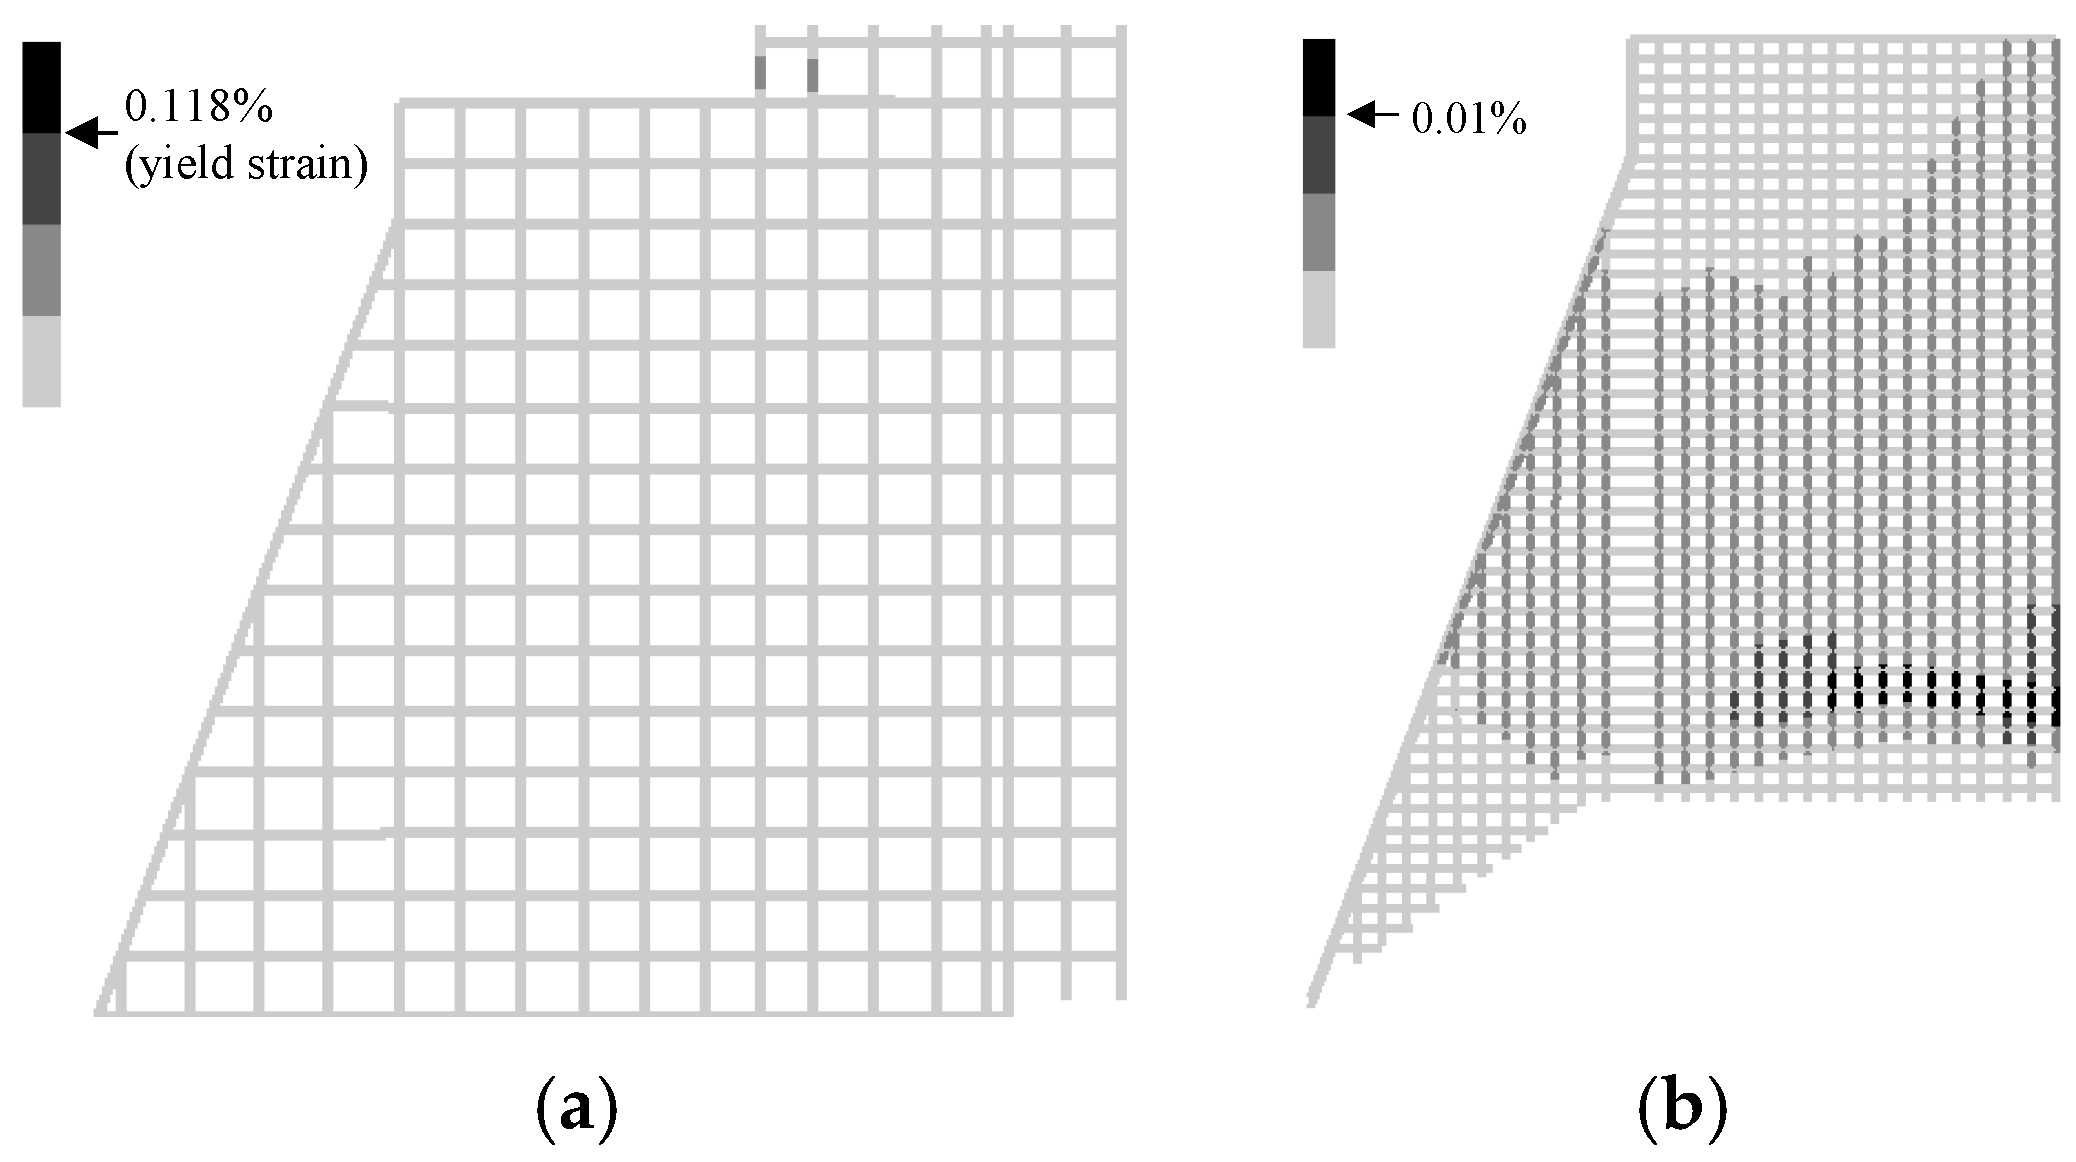
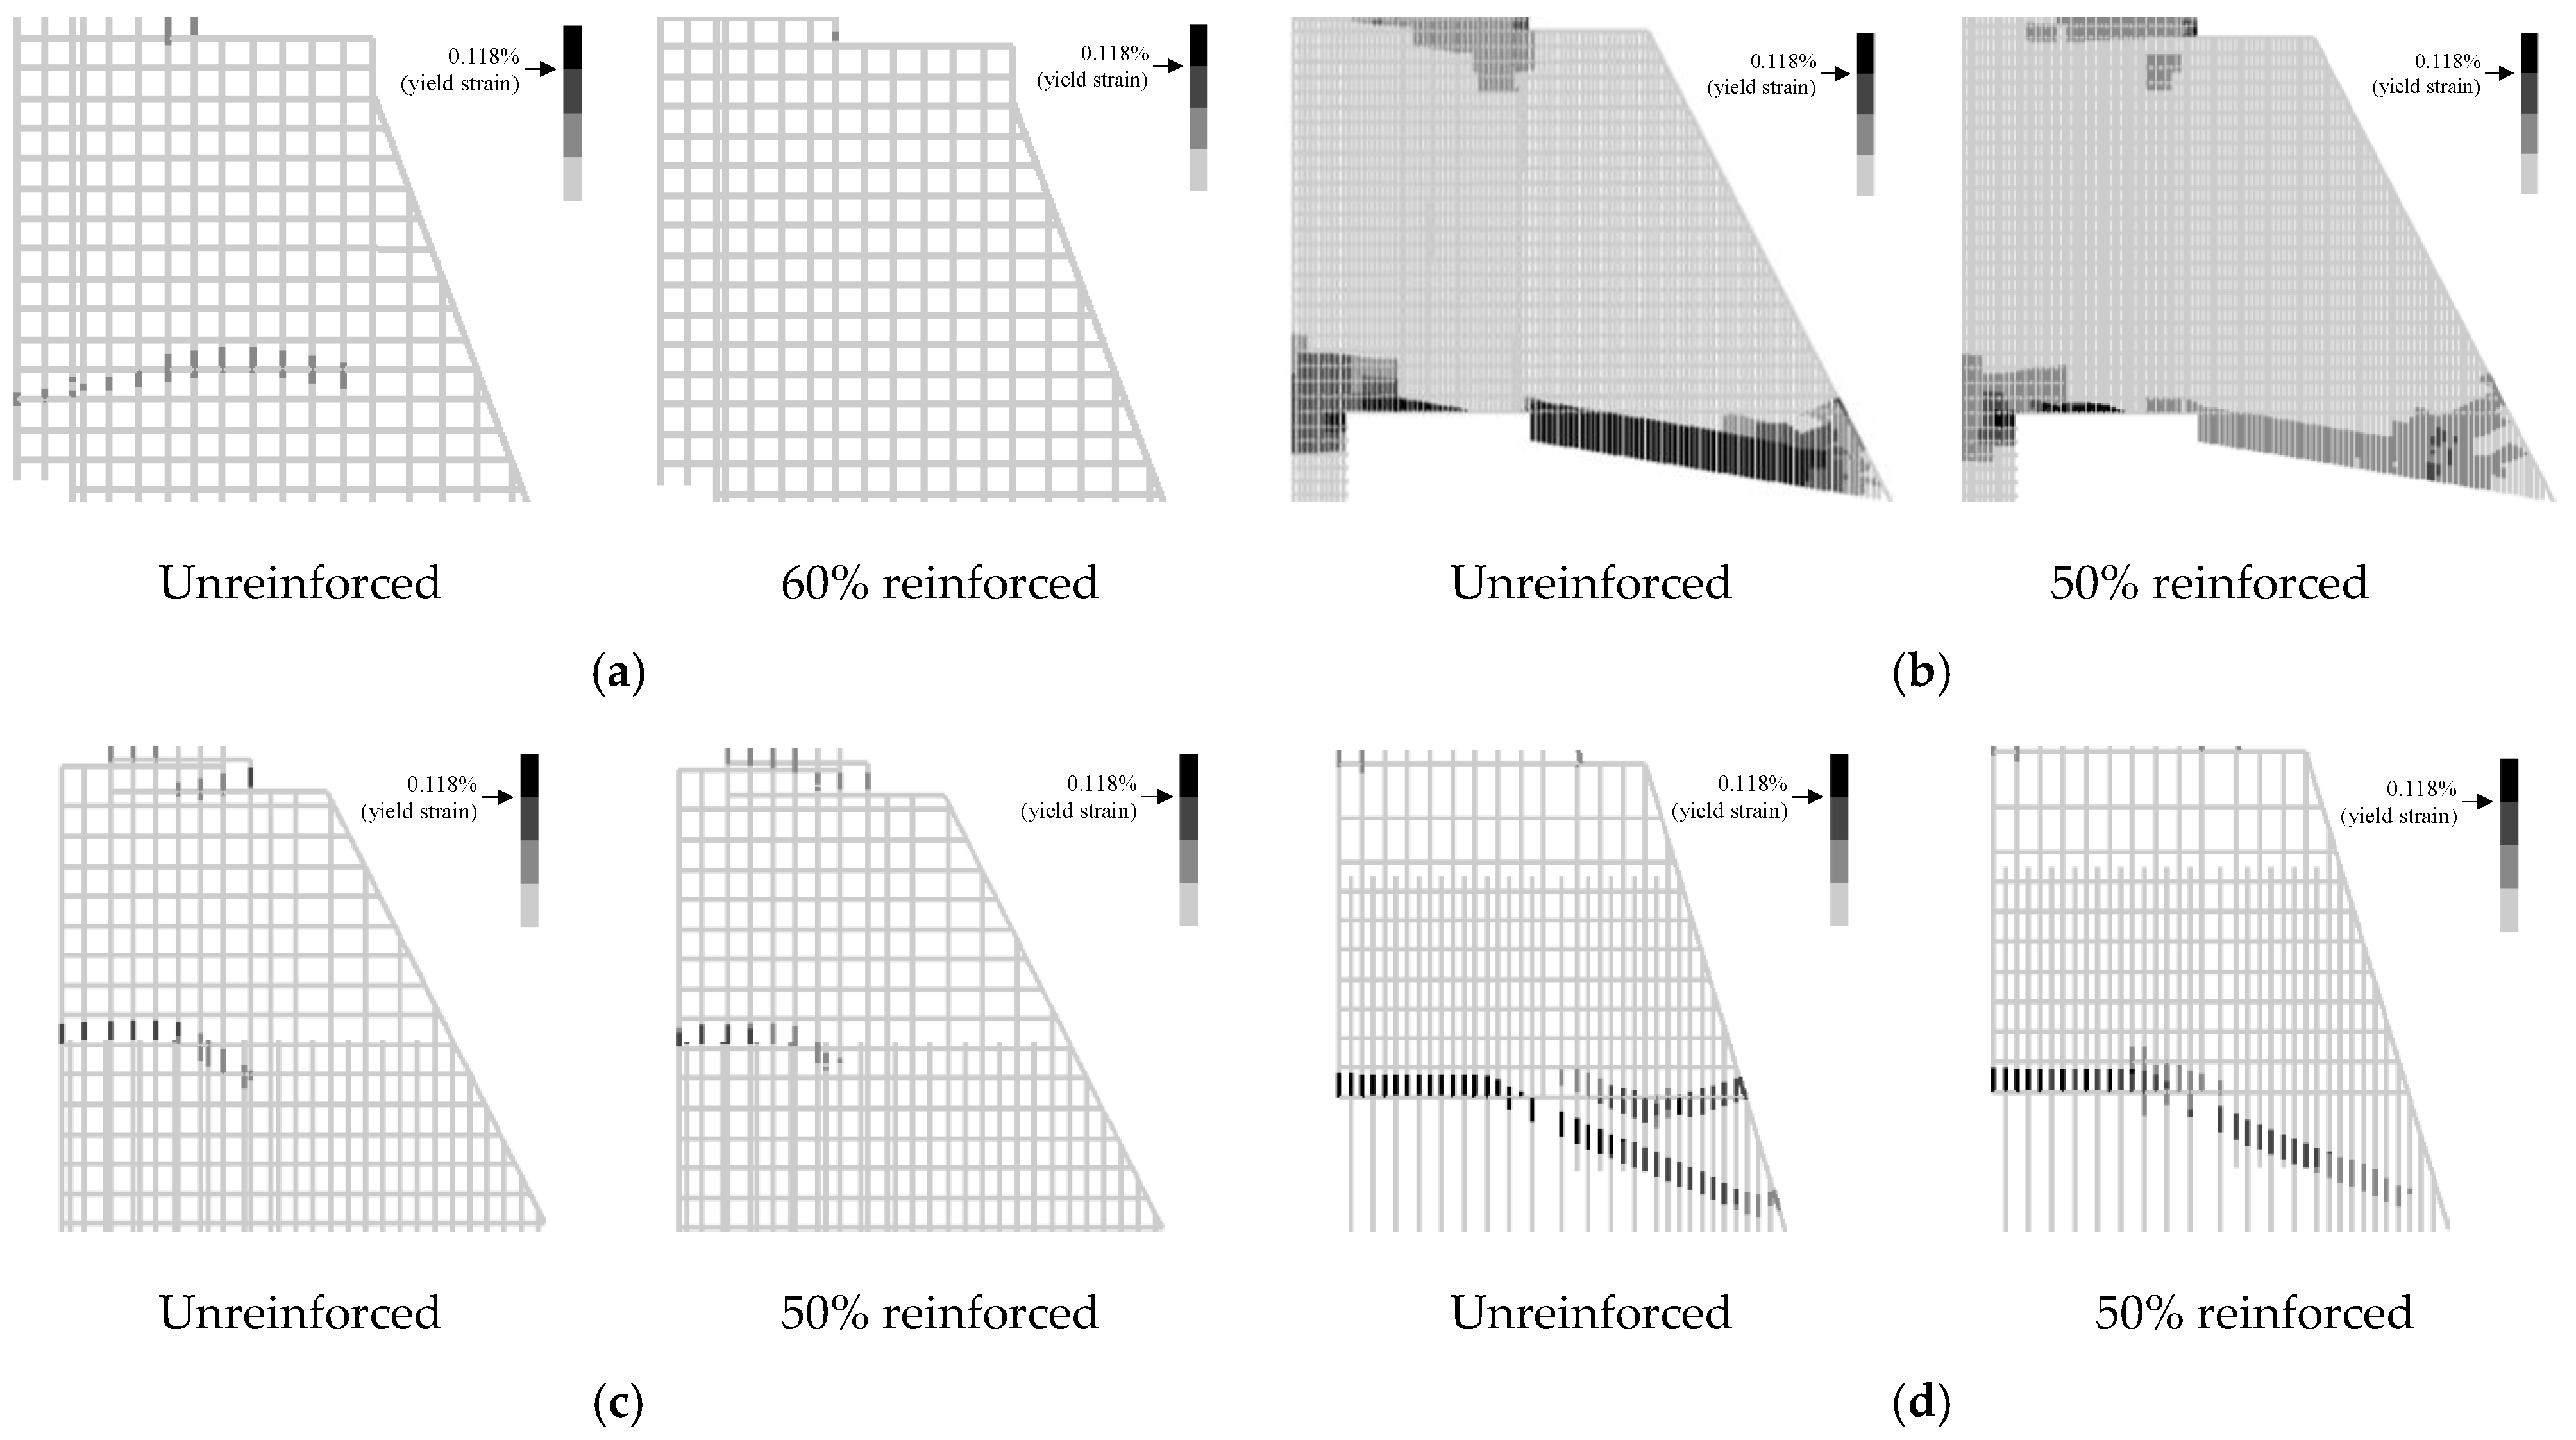
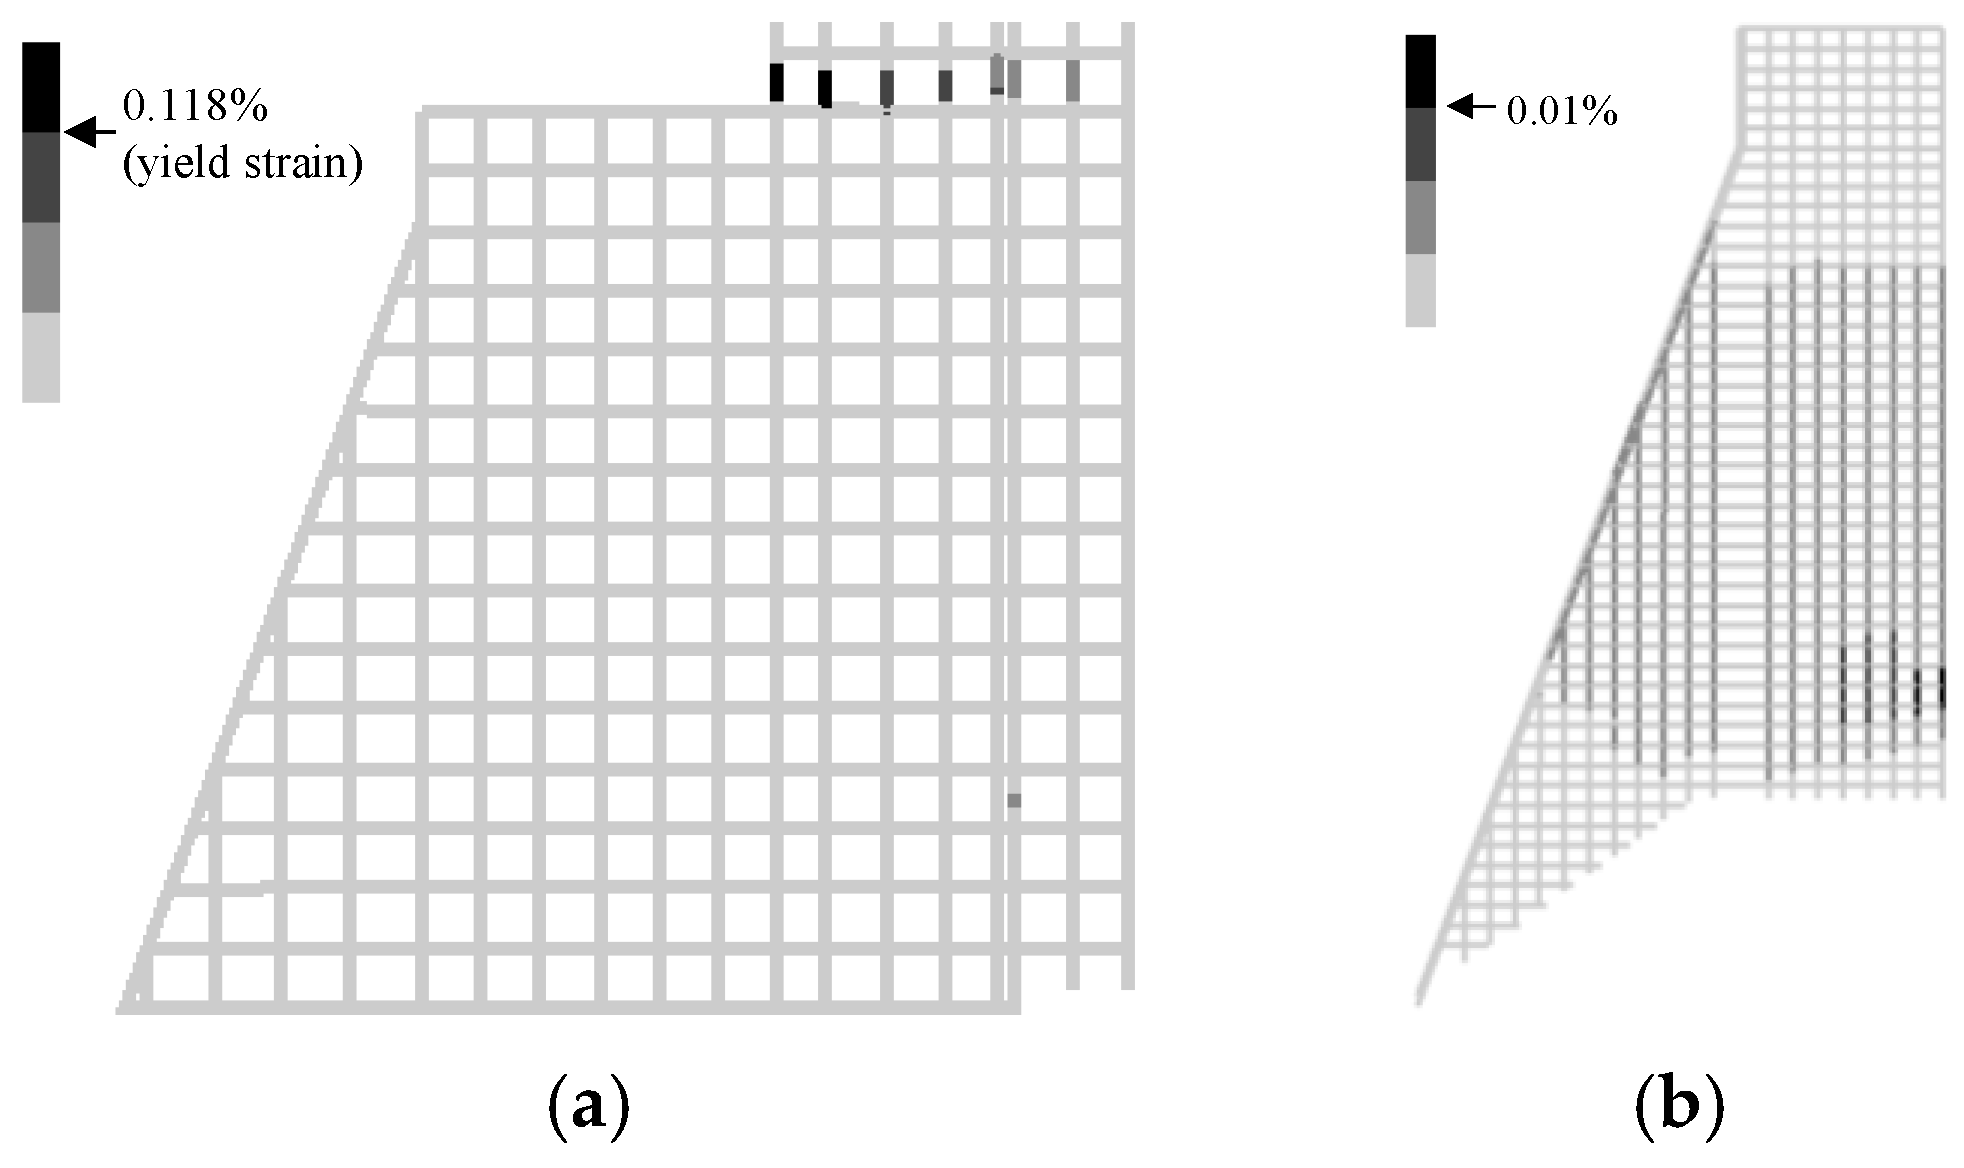
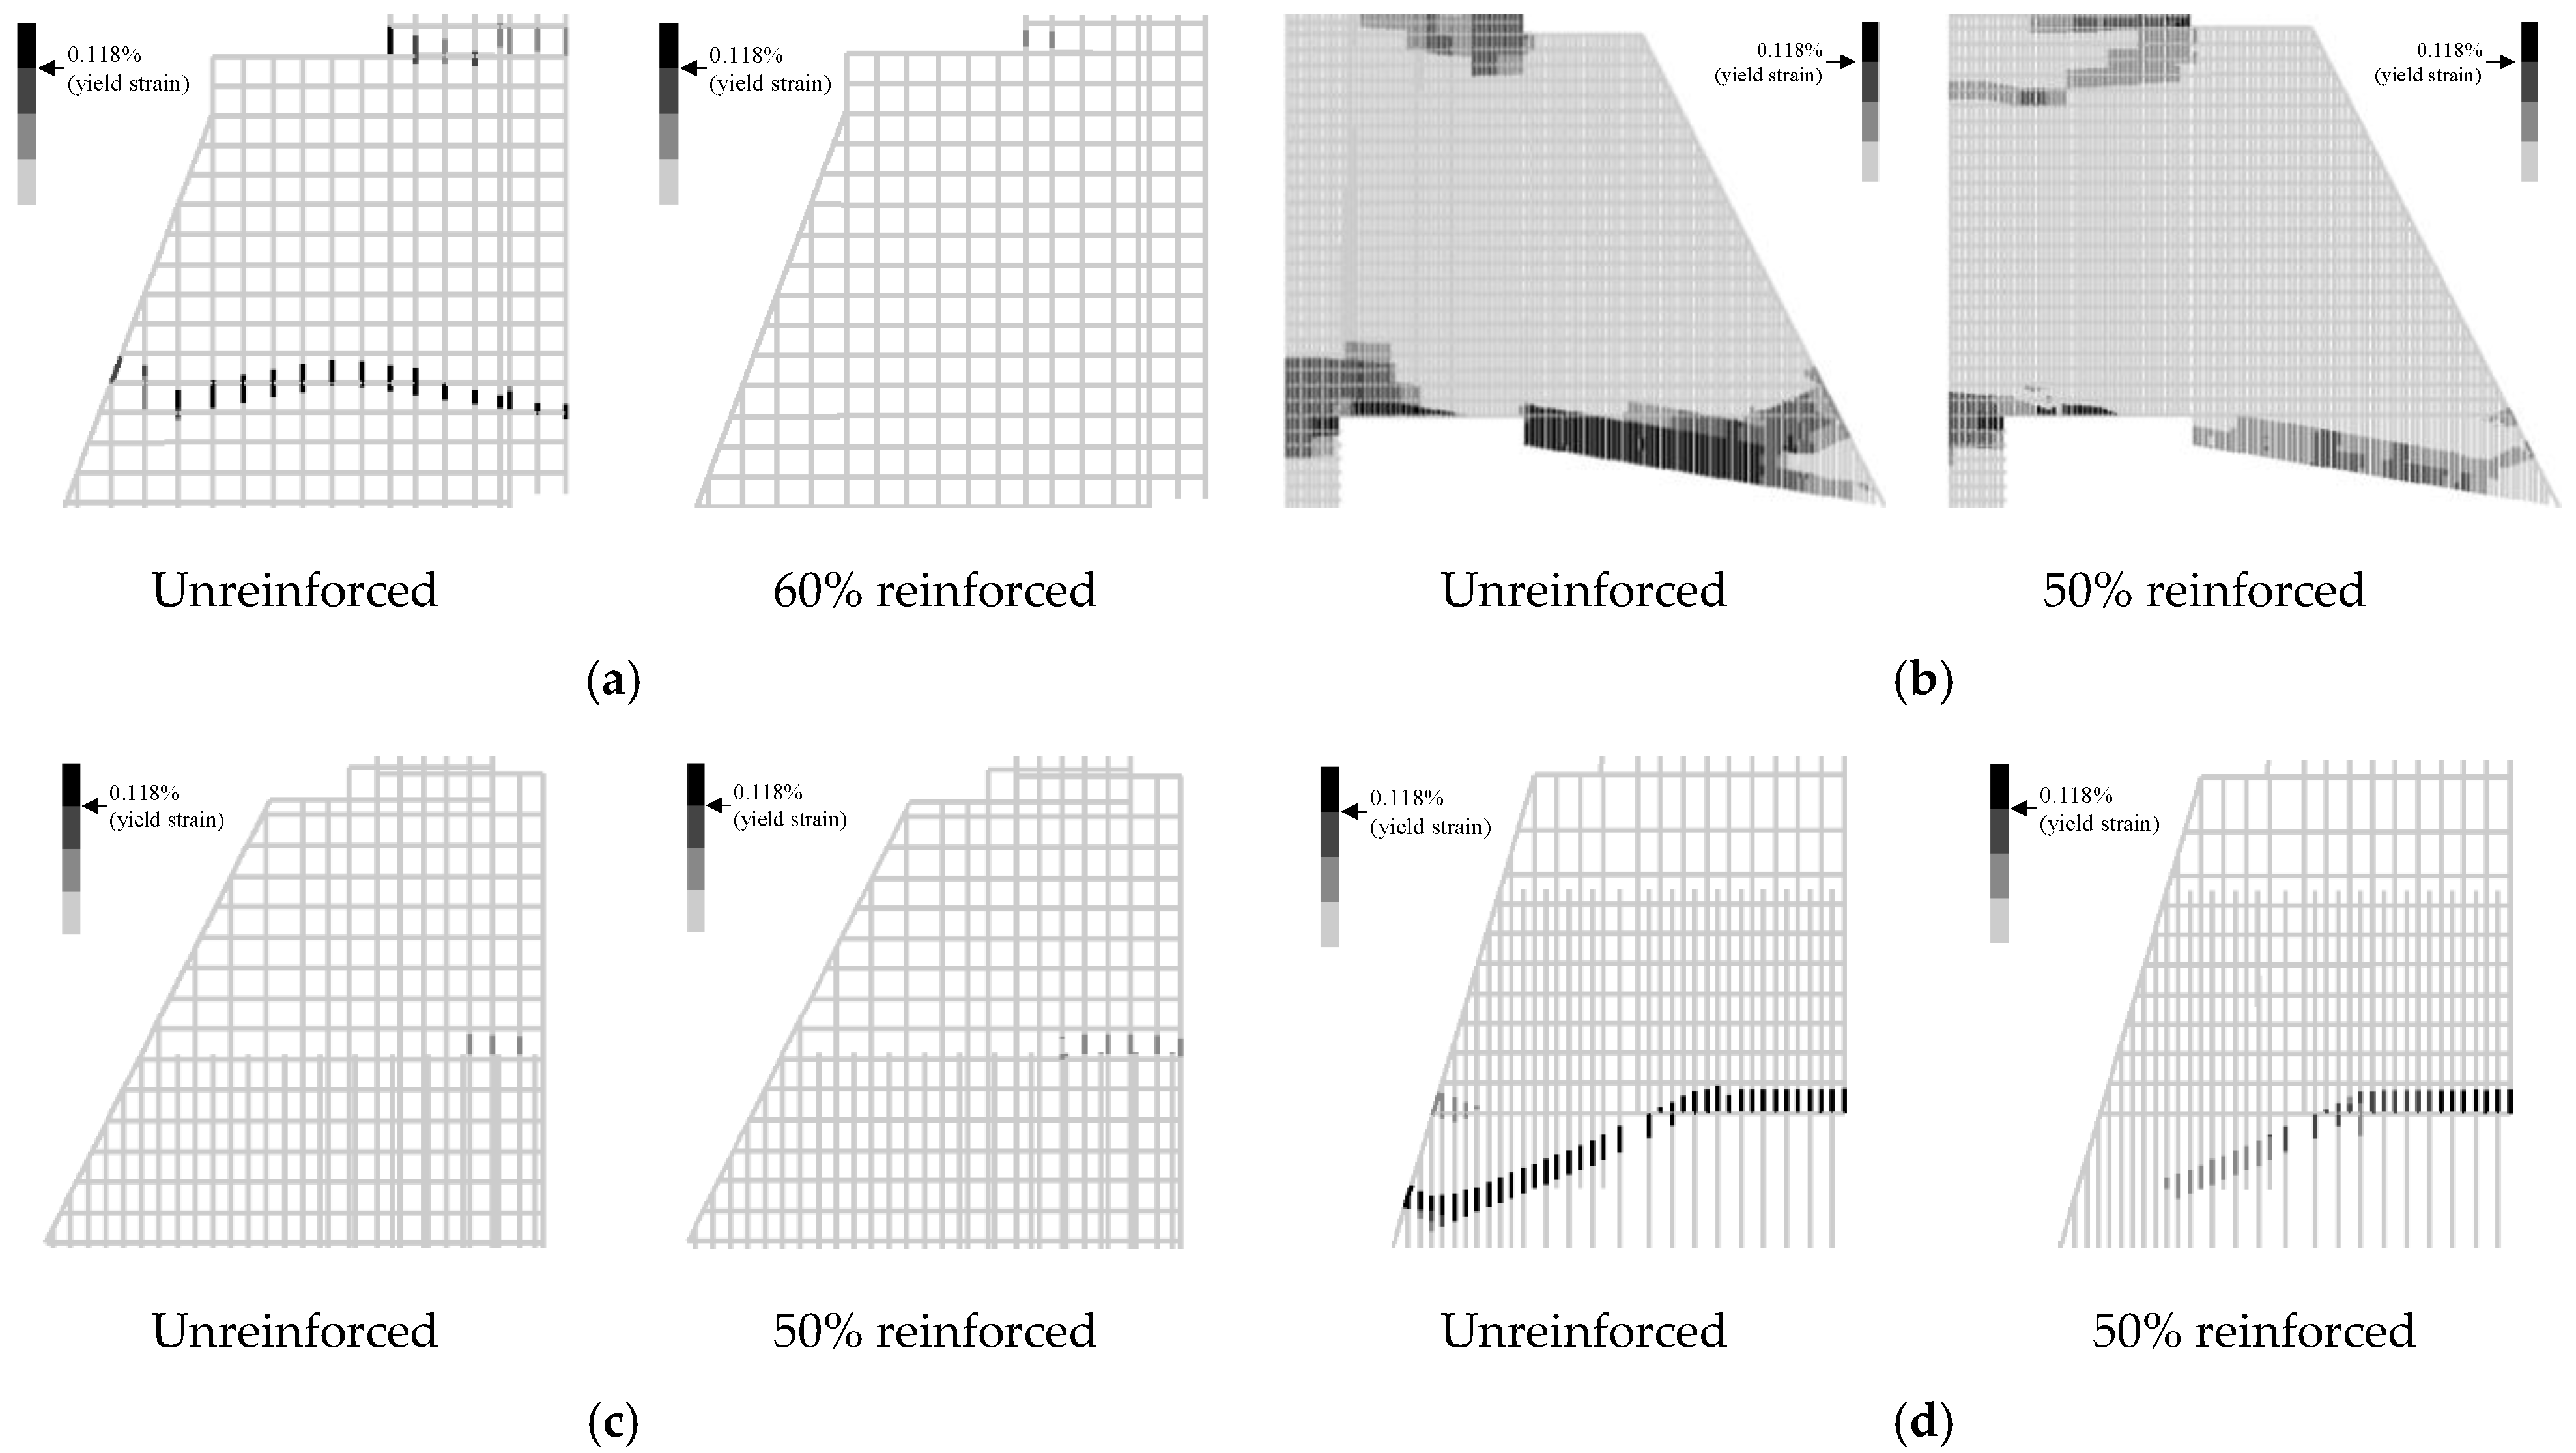
4.5. Strain Distribution of Existing Reinforcing Bars: Comparison of Unreinforced and Reinforced Case

As shown in Section 4.2, there was no significant difference in displacement between the unreinforced and RPCM-reinforced cases until bending cracks occurred in the elastic region. However, it was confirmed that when the displacement increased, the reinforcing bars of the existing part yielded in the unreinforced case, so there was a difference between the unreinforced and RPCM-reinforced cases. Figure 33 and Figure 34 show the axial strain distribution of the existing reinforcing bars at the peak displacement of each of the four dams under seismic wave A and seismic wave B, respectively. The TYPE-A model showed a tendency for the maximum displacement reduction effect to differ significantly between the two types of seismic waves, and the ratio of existing reinforcing bars that yielded in this type was larger for seismic wave A.
Next, the reinforcing effects of TYPE-B, TYPE-C and TYPE-D were compared using the strain distribution of the existing reinforcing bars, as shown in Figure 33 and Figure 34. These figures show that the number of existing reinforcing bars that reached yield strain before and after reinforcement decreased in TYPE-B and TYPE-D dams. However, existing reinforcing bars that reached yield strain were not observed in the TYPE-C. Thus, there was no significant difference in displacement between the unreinforced and RPCM-reinforced TYPE-C cases. Therefore, it is concluded that a large reinforcing effect can be obtained in the case of a dam pier having a small amount of existing reinforcing bar and a large mass of attached structures such as switchgear, pier for switchgear and door body. In addition, it was confirmed that when a large number of existing reinforcing bars reach yield strain, as in TYPE-A and TYPE-D shown in Figure 29a and Figure 32a, even partial reinforcement has almost the same effect as 100% reinforcement.

4.6. Reinforcement Effect by Structural Characteristics of Dam Pier

Figure 35 shows the classification of dams in the area of the graph near the four dams discussed in the previous section, using the amount of reinforcing bars in the existing cross-section and the slenderness ratio of the column shape, and Table 5 shows the natural period of each dam. It was found that the TYPE-C dam shows the least damage and has the shortest natural period; thus, the TYPE-C dam has higher rigidity than the other dams. As shown by arrow (A) in Figure 35, TYPE-A and TYPE-D have a smaller slenderness ratio than other dams, but the amount of existing reinforcing bars is small, and the load-bearing performance is also lower than that of other dams. Therefore, the reinforcing effect of the PCM method is clearly shown for TYPE-A and TYPE-D. On the other hand, although the TYPE-B dam has a larger amount of reinforcing bars than the TYPE-C dam, the slenderness ratio of the column shape is large, and the additional mass is also larger than that of the TYPE-C. Therefore, the reinforcement effect of TYPE-B is higher than that of TYPE-C. In summary, the reinforcement effect of the SRS method is likely to be obtained in dams with a long natural period.
Figure 36 shows that the five dams in the red dashed circle are the groups that are most likely to be reinforced by RPCM because of their insufficient amount of reinforcing bars. To confirm the effect of the RPCM reinforcement, TYPE-B’ having a lower amount of existing reinforcing bars than TYPE-B (shown in Figure 36) was modeled, and its elastic-plastic behavior under earthquake conditions was calculated. Specifically, the cross-sectional area of the rebar elements in the TYPE-B FE model was uniformly reduced, and the total number and spacing of reinforcing bars did not change in TYPE-B’.
Figure 37 shows the displacement-time history of TYPE-B’ under seismic waves A and B, respectively. From these results, it can be seen that the maximum displacement and residual displacement of TYPE-B’ are significantly reduced owing to the reinforcement effect of the RPCM. In addition, it was confirmed that reinforcement by RPCM is sufficiently effective only if an area of approximately 30% of the entire cross-section of the column is reinforced to reduce the residual displacement.
As a result, it was concluded that the RPCM reinforcement method is very effective for existing aged dam piers with insufficient rigidity.

5. Conclusions

The following were confirmed by performing seismic response analysis using FEM.
  • It was confirmed that the displacement response of the dam pier could be reduced by using the SRS method, and the effect of the reinforcement range by the SRS method on the maximum displacement and residual displacement could be quantitatively determined.
  • In the case of the dam pier, it was difficult to reinforce the entire cross-section owing to the characteristics of the structure. In this study, it was confirmed that a sufficient reinforcement effect was obtained even with partial reinforcement.
  • It was determined that the maximum stress occurred between the existing RC cross-section and the reinforced PCM layer, especially on the upstream side. Therefore, when a dam pier was reinforced using this method, using a large-diameter reinforcing bar at the boundary between the existing RC cross-section and the PCM layer is conceivable.
  • The reinforcing effect was remarkable in the case where the existing reinforcing bar yielded.
  • It was found that the SRS method had a considerable reinforcing effect on dams with a long natural period, which have low rigidity relative to their mass.
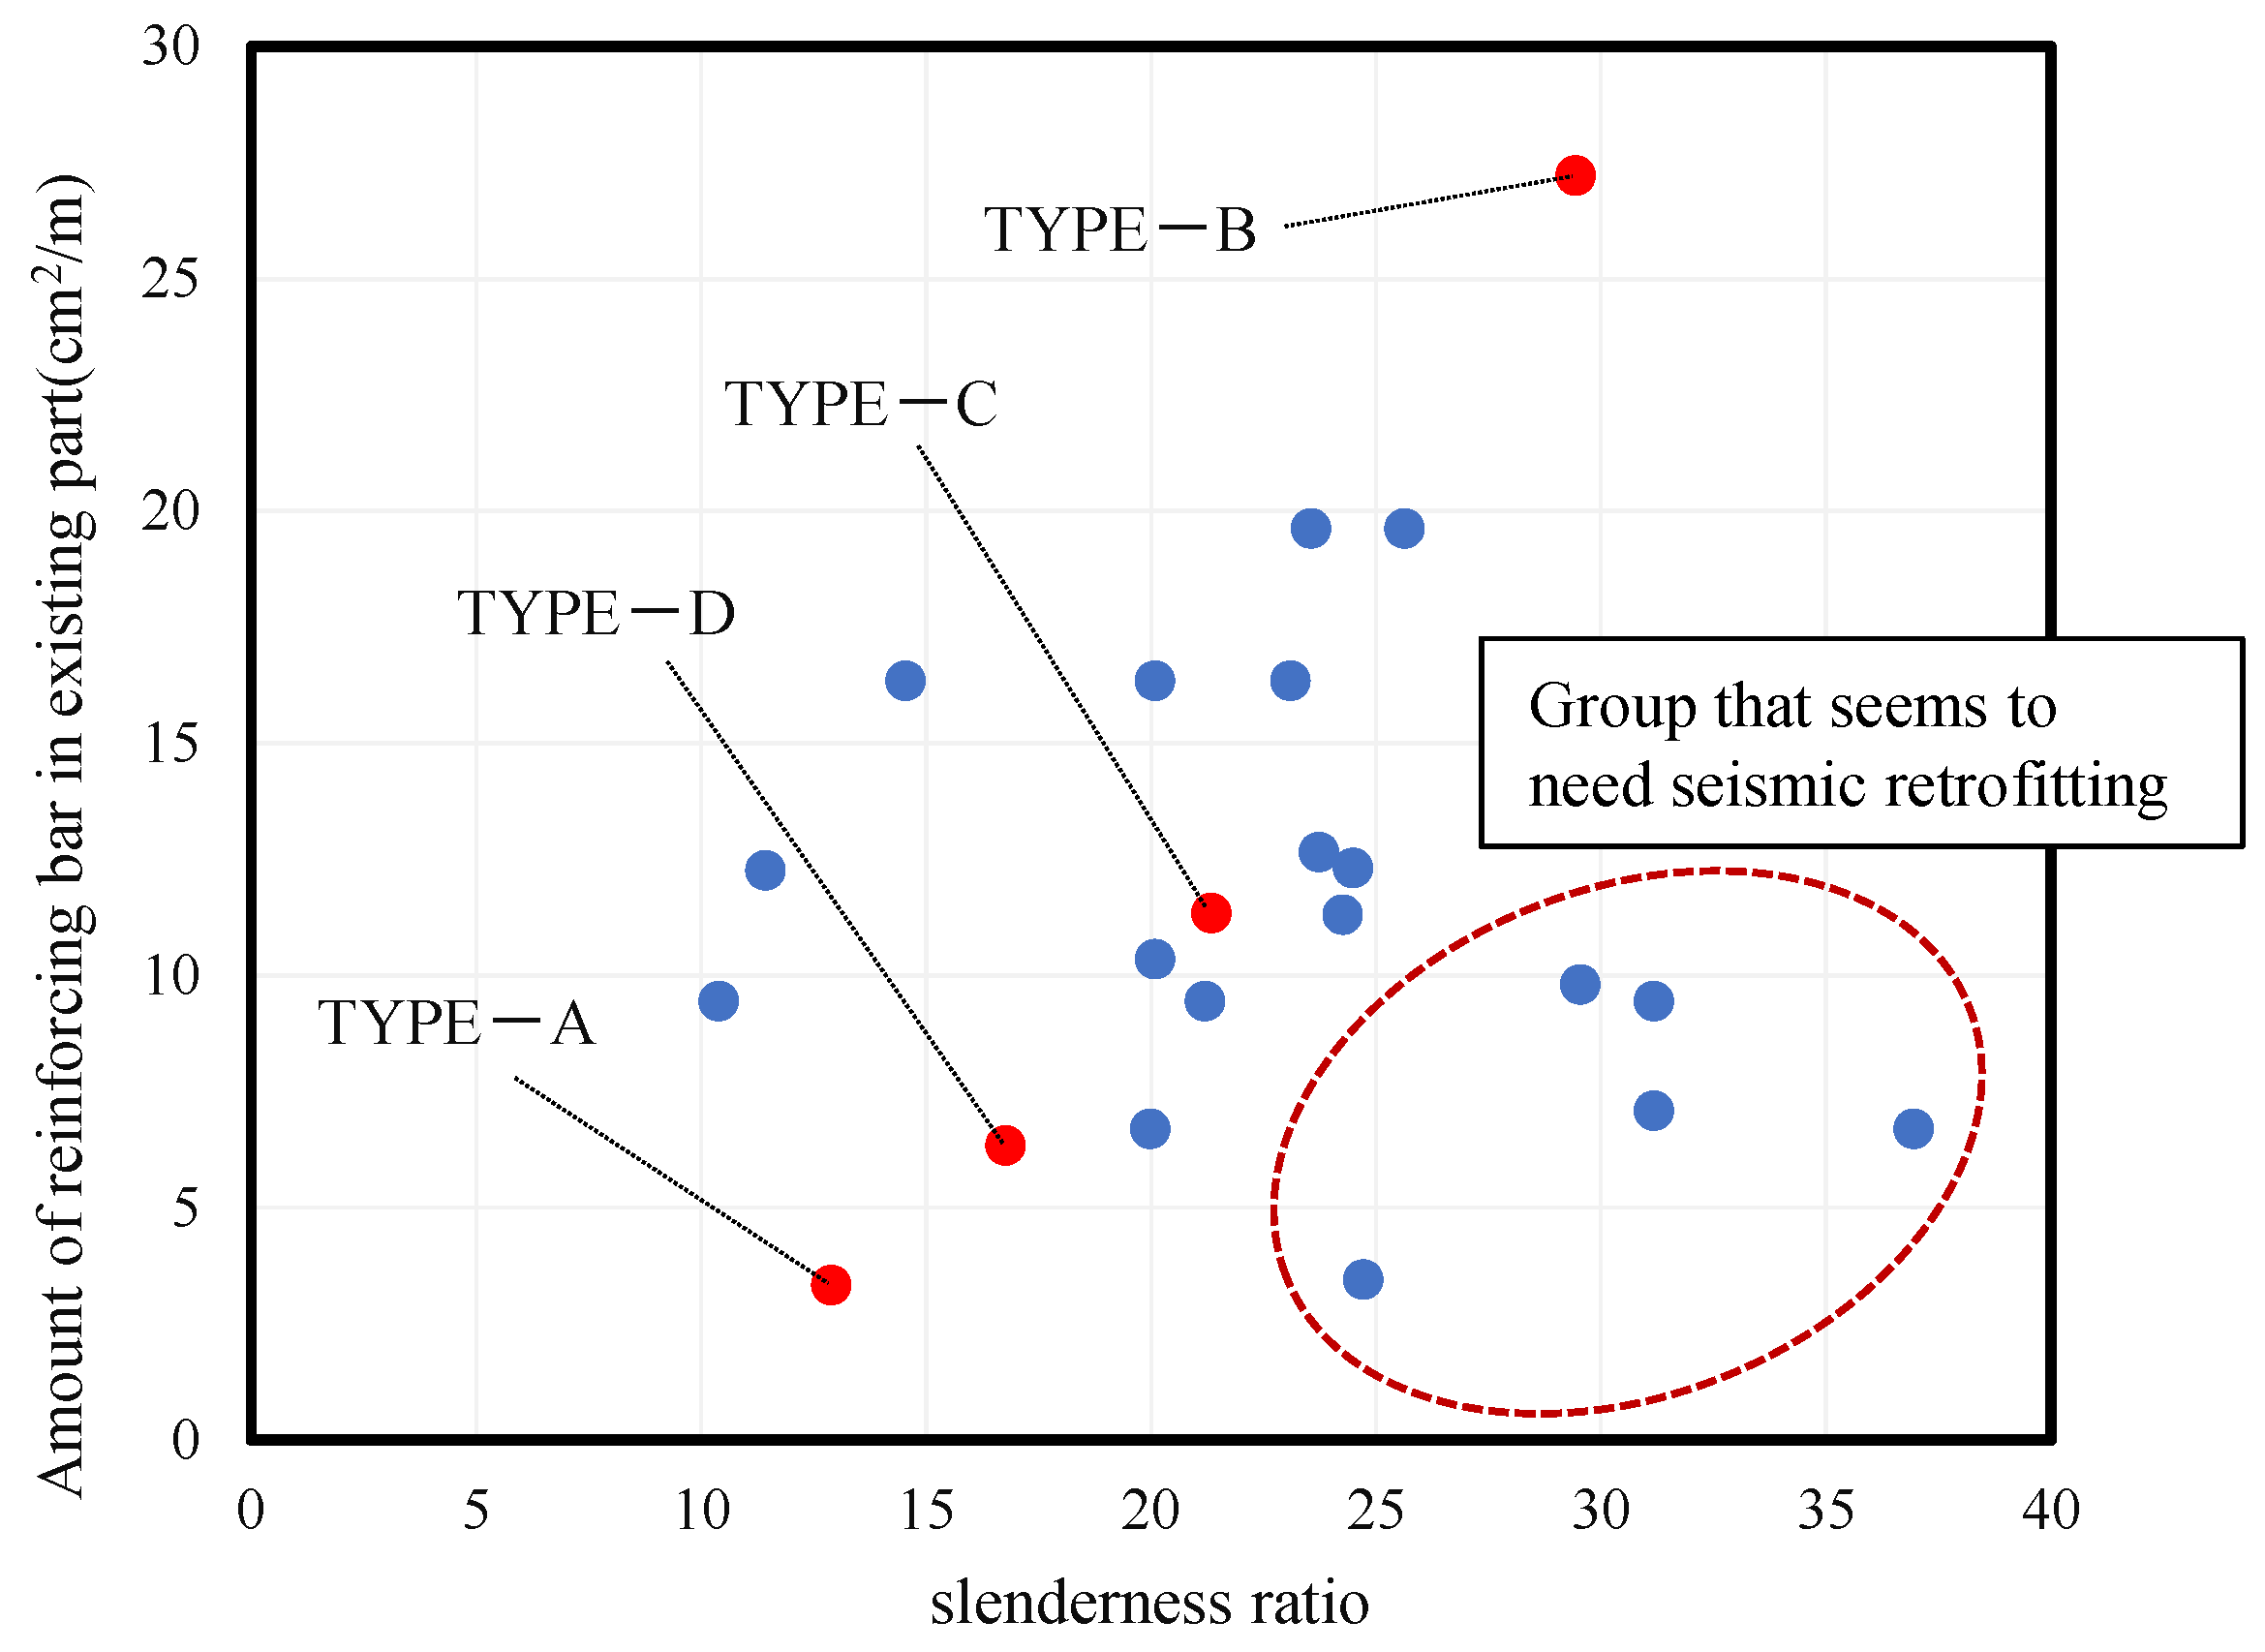
  • In fact, according to the TYPE-B’ calculation that simulates a group with a small amount of existing reinforcing bar relative to their slenderness ratio, it was confirmed that if a column cross-sectional area greater than 30% is reinforced using RPCM, the residual displacement after an earthquake can be significantly reduced.

Author Contributions

Conceptualization, Y.S., H.T. and H.I.; methodology, Y.S. and H.T.; software, H.T.; validation, Y.S. and H.T.; investigation, H.I.; resources, H.I.; writing—original draft preparation, Y.S. and H.T.; writing—review and editing, Y.S. and H.T.; visualization, H.T.; supervision, Y.S.; project administration, H.I. All authors have read and agreed to the published version of the manuscript.

Funding

This research received no external funding.

Institutional Review Board Statement

Not applicable.

Informed Consent Statement

Not applicable.

Data Availability Statement

Not applicable.

Acknowledgments

This paper is based on the research conducted by Kazuki Yamazaki and Junji Cho for their master’s theses at Kyushu University. We would like to express our gratitude for the research activities.

Conflicts of Interest

The authors declare no conflict of interest.

References

  1. Nobuyuki, M.; Tsutomu, S. Current Status of Seismic Methods for Railway Reinforced Concrete Viaducts. JCI Concr. J. 1997, 35, 9–17. [Google Scholar]
  2. Gkournelos, P.D.; Triantafillou, T.C.; Bournas, D.A. Seismic Upgrading of Existing Reinforced Concrete Buildings: A State-of-the-Art Review. Eng. Struct. 2021, 240, 112273. [Google Scholar] [CrossRef]
  3. Priestley, M.N.; Seible, F.; Xiao, Y.; Verma, R. Steel Jacket Retrofitting of Reinforced Concrete Bridge Columns for Enhanced Shear Strength. Part 1: Theoretical Considerations and Test Design. ACI Mater. J. 1994, 91, 394–405. [Google Scholar] [CrossRef]
  4. Nigel Priestley, M.J.; Seible, F.; Xiao, Y.; Verma, R. Steel Jacket Retrofitting of Reinforced Concrete Bridge Columns for Enhanced Shear Strength. Part 2: Test Results and Comparison with Theory. ACI Mater. J. 1994, 91, 537–551. [Google Scholar] [CrossRef]
  5. Balsamo, A.; Colombo, A.; Manfredi, G.; Negro, P.; Prota, A. Seismic Behavior of a Full-Scale RC Frame Repaired using CFRP Laminates. Eng. Struct. 2005, 27, 769–780. [Google Scholar] [CrossRef]
  6. Thermou, G.E.; Papanikolaou, V.K.; Kappos, A.J. Flexural Behaviour of Reinforced Concrete Jacketed Columns under Reversed Cyclic Loading. Eng. Struct. 2014, 76, 270–282. [Google Scholar] [CrossRef]
  7. Léger, P.; Leclerc, M. Evaluation of Earthquake Ground Motions to Predict Cracking Response of Gravity Dams. Eng. Struct. 1996, 18, 227–239. [Google Scholar] [CrossRef]
  8. Mridha, S.; Maity, D. Experimental Investigation on Nonlinear Dynamic Response of Concrete Gravity Dam-Reservoir System. Eng. Struct. 2014, 80, 289–297. [Google Scholar] [CrossRef]
  9. Zhang, S.; Wang, G. Effects of Near-Fault and Far-Fault Ground Motions on Nonlinear Dynamic Response and Seismic Damage of Concrete Gravity Dams. Soil Dyn. Earthq. Eng. 2013, 53, 217–229. [Google Scholar] [CrossRef]
  10. Wang, G.; Wang, Y.; Lu, W.; Yu, M.; Wang, C. Deterministic 3D Seismic Damage Analysis of Guandi Concrete Gravity Dam: A Case Study. Eng. Struct. 2017, 148, 263–276. [Google Scholar] [CrossRef]
  11. Satoru, N.; Shinichi, H. Seismic Retrofitting for Existing RC Bridge Pier by PCM Shotcrete Spray. JCI Concr. J. 2007, 29, 1219–1224. [Google Scholar]
  12. Tomoaki, S.; Yasuhiro, M. Structural Performance of RC Column with Sidewalls Strengthened by Polymer-Cement Mortar. JCI Concr. J. 2007, 29, 1117–1122. [Google Scholar]
  13. JSCE. Standard Specifications for Concrete Structures-2012, Structural Performance Evaluation; Japan Society of Civil Engineering: Tokyo, Japan, 2012. [Google Scholar]
  14. Westergaard, H.M. Water Pressures on Dams during Earthquakes. Trans. ASCE 1933, 98. [Google Scholar] [CrossRef]
  15. The River Bureau of MLIT. Guidelines for Seismic Performance Evaluation of Dams During Large Earthquakes (Draft); The River Bureau of the Ministry of Land, Infrastructure and Transport (MLIT): Tokyo, Japan, 2005.
Figure 1. Dam pier.
Figure 1. Dam pier.
Applsci 11 07255 g001
Figure 2. Reinforceable range.
Applsci 11 07255 g002
Figure 3. Modeling of reinforcement part in bird’s-eye view.
Applsci 11 07255 g003
Figure 4. Dimensions of unreinforced specimen.
Applsci 11 07255 g004
Figure 5. Dimensions of the RPCM reinforced specimen.
Applsci 11 07255 g005
Figure 6. Installation of a specimen.
Applsci 11 07255 g006
Figure 7. Set-up of a specimen.
Applsci 11 07255 g007
Figure 8. Analysis model: (a) RC specimen; (b) RPCM specimen model.
Applsci 11 07255 g008
Figure 9. Comparison of the load-displacement relationship.
Applsci 11 07255 g009
Figure 10. Load−strain relationship of each of the reinforcing bars: (a) compression strain of the rebar in the concrete; (b) tensile strain of the rebar in the concrete; (c) compression strain of the rebar in the PCM layer; (d) tensile strain of the rebar in the PCM layer.
Applsci 11 07255 g010
Figure 11. FEM analysis models of dam pier: (a) TYPE-A dam pier; (b) TYPE-B dam pier; (c) TYPE-C dam pier; (d) TYPE-D dam pier.
Applsci 11 07255 g011
Figure 12. Classification of dams by slenderness ratio and amount of reinforcing bar.
Applsci 11 07255 g012
Figure 13. Modeling of the reinforcement part.
Applsci 11 07255 g013
Figure 14. Stress-strain relationship of concrete (compression side).
Applsci 11 07255 g014
Figure 15. Concrete stress−crack displacement relationship (tension side).
Applsci 11 07255 g015
Figure 16. Stress−strain relationship of steel, converted to a single axis.
Applsci 11 07255 g016
Figure 17. Boundary conditions: (a) TYPE-A dam model; (b) TYPE-B dam model; (c) TYPE-C dam model; (d) TYPE-D dam model.
Applsci 11 07255 g017
Figure 18. Input acceleration waveforms: (a) wave A; (b) wave B.
Applsci 11 07255 g018
Figure 19. Roller gate and reinforceable range.
Applsci 11 07255 g019
Figure 20. Reinforcement range: (a) TYPE-A dam model; (b) TYPE-B dam model; (c) TYPE-C dam model; (d) TYPE-D dam model.
Applsci 11 07255 g020aApplsci 11 07255 g020b
Figure 21. Comparison of displacement−time history at the top of the pier in TYPE-A: (a) under wave A; (b) under wave B.
Applsci 11 07255 g021aApplsci 11 07255 g021b
Figure 22. Comparison of displacement−time history at the top of the pier in TYPE-B: (a) under wave A; (b) under wave B.
Applsci 11 07255 g022
Figure 23. Comparison of displacement−time history at the top of the pier in TYPE-C: (a) under wave A; (b) under wave B.
Applsci 11 07255 g023aApplsci 11 07255 g023b
Figure 24. Comparison of displacement−time history at the top of the pier in TYPE-D: (a) under wave A; (b) under wave B.
Applsci 11 07255 g024
Figure 25. Maximum principal strain distribution of TYPE-A at 8.65 s.
Applsci 11 07255 g025
Figure 26. Comparison of reinforcing bar strain in the vertical direction of TYPE-A: (a) RC model; (b) RPCM model.
Applsci 11 07255 g026
Figure 27. Strain distribution of the reinforcing bars (TYPE-A, wave A, reinforcing range 30%): (a) existing part: (b) reinforcement part.
Applsci 11 07255 g027
Figure 28. Strain distribution of the reinforcing bars (TYPE-A, wave A, reinforcing range 60%): (a) existing part: (b) reinforcement part.
Applsci 11 07255 g028
Figure 29. Comparison of maximum displacement and residual displacement of TYPE-A: (a) wave A; (b) wave B.
Applsci 11 07255 g029
Figure 30. Comparison of maximum displacement and residual displacement of TYPE-B: (a) wave A; (b) wave B.
Applsci 11 07255 g030
Figure 31. Comparison of maximum displacement and residual displacement of TYPE-C: (a) wave A; (b) wave B.
Applsci 11 07255 g031
Figure 32. Comparison of maximum displacement and residual displacement of TYPE-D: (a) wave A; (b) wave B.
Applsci 11 07255 g032
Figure 33. Strain distribution of existing reinforcing bars at peak displacement in wave A: (a) Type-A; (b) Type-B; (c) Type-C; (d) Type-D.
Applsci 11 07255 g033
Figure 34. Strain distribution of existing reinforcing bars at peak displacement in wave B: (a) TYPE-A; (b) TYPE-B; (c) TYPE-C; (d) TYPE-D.
Applsci 11 07255 g034
Figure 35. Classification of gravity dams when viewed in terms of the amount of existing reinforcing bars and slenderness ratio of dams near the area where the four dams exist.
Applsci 11 07255 g035
Figure 36. Classification of dams by slenderness ratio and amount of reinforcing bars (Added TYPE-B’).
Applsci 11 07255 g036
Figure 37. Comparison of displacement-time history at the top of the pier in TYPE-B’: (a) wave A; (b) wave B.
Applsci 11 07255 g037
Table 1. Average value of the material property (Unit: MPa).
MaterialCompressive
Strength
Tensile
Strength
Static Modulus
Concrete41.23.0727,389
PCM56.55.7328,373
Table 2. Results of eigenvalue analysis.
Natural Frequency (Hz)TYPE-ATYPE-BTYPE-CTYPE-D
Primary mode2.752.085.734.32
Secondary mode6.527.229.8413.2
3rd mode10.38.3323.016.7
4th mode18.99.6927.819.5
Table 3. Physical characteristics of concrete.
Material PropertiesExisting PartReinforcement Part (PCM)
Densitykg/mm322902300
Young’s modulusN/mm217,50027,000
Poisson’s ratio-0.170.2
Compressive strengthN/mm217.264.5
Tensile strengthN/mm21.84.12
Maximum aggregate diametermm600.1
Table 4. Physical characteristics of steel materials.
Material PropertiesUnitExisting PartReinforcement Part
Main RebarShear ReinforcementMain RebarShear Reinforcement
Material SR235SD345
Mass densitykg/m37850
Young’s modulusN/mm2200,000
Yield modulusN/mm2235345
Poisson’s ratio-0.3
Table 5. Natural period of each dam.
Natural Period (s)TYPE-ATYPE-BTYPE-CTYPE-D
Primary mode0.3530.4820.1750.243
Secondary mode0.1530.1390.1020.076
3rd mode0.09730.1200.04350.059
4th mode0.0530.1030.0360.051
Publisher’s Note: MDPI stays neutral with regard to jurisdictional claims in published maps and institutional affiliations.

