Article

Aerodynamic Differences between New and Used Soccer Balls

1
Faculty of Health and Sport Sciences, University of Tsukuba, Tsukuba 305-8574, Japan
2
Advanced Research Initiative for Human High Performance (ARIHHP), University of Tsukuba, Tsukuba 305-8574, Japan
*
Author to whom correspondence should be addressed.
Appl. Sci. 2021, 11(16), 7204; https://doi.org/10.3390/app11167204
Submission received: 26 June 2021 / Revised: 2 August 2021 / Accepted: 3 August 2021 / Published: 4 August 2021
(This article belongs to the Special Issue Sports Fluid Mechanics)

Abstract

:
The surface structure of soccer balls, such as the number and shapes of the ball panels, has recently changed, and research on the aerodynamics and flight trajectories of new soccer balls is actively proceeding. However, these studies are focused on new soccer balls, whereas the used soccer balls were never studied. In this study, the aerodynamic characteristics of soccer balls kicked 1000 times by a robot were investigated through wind tunnel tests. The results were compared with those obtained using new soccer balls. Regarding the aerodynamic characteristics of the soccer balls, it was found that the critical Reynold number, Recrit, changes with usage. This is related to the transition from laminar to turbulent flow of airflow around the ball. The comparison of the drag coefficients of the balls at Recrit showed that the drag coefficients of the new and used Telstar18 balls were 0.15 (Re = 2.5 × 10⁵) and 0.14 (Re = 2.2 × 10⁵), respectively; those of the new and used Merlin were 0.13 (Re = 2.8 × 10⁵) and 0.13 (Re = 2.2 × 10⁵), respectively; and finally, those of the new and used Derbystar were 0.14 (Re = 2.1 × 10⁵) and 0.14 (Re = 2.1 × 10⁵), respectively. The surface conditions of a soccer ball, such as the surface roughness and surface damages, are essential factors to determine the aerodynamics of the soccer balls.

1. Introduction

In the last few years, the design of the official soccer balls has changed in each FIFA World Cup. In particular, between the 2006 World Cup in Germany (Teamgeist, 14-panels, Adidas) and the 2018 World Cup in Russia (Telstar 18, 6-panels, Adidas), the shape of the official soccer balls changed significantly. The number of ball panels was considerably reduced from 32 (used from the 1970 World Cup in Mexico until the 2002 World Cup in South Korea and Japan), to 14 (2006 World Cup), 8 (2010 World Cup), and 6 (2014 and 2018 World Cup). Furthermore, from the 2008 EURO Cup event, the surface roughness of the soccer balls changed from being very smooth to having small protrusion patterns with different shapes, such as square, triangular, and hexagonal [1]. The players, the coaches, and the spectators are very interested in the aerodynamics and flight trajectories of the new type of soccer balls. Many studies on the effects of the soccer balls’ shapes on aerodynamics and flight trajectories have been conducted [2,3,4,5,6,7,8,9,10,11,12,13]. Studies on the effects of the panel orientation variations, owing to the number of panels reduction, on the aerodynamics and flight trajectories of the soccer balls have also been published [14,15,16,17,18]. In modern soccer balls, not only the number of panels but also the surface roughness (bumps and dimples) significantly change, substantially affecting the ball aerodynamics [1,19,20,21,22]. Additionally, depending on the type of soccer ball and its producer, the material used for the ball surface varies considerably. Specifically, the aerodynamic properties change significantly depending on whether the seam structure between the soccer ball panels is made using stitching threads or adhesive bonds. This increases or decreases the distance of the soccer ball, and also affects the stability of the ball during flight [8,19]. It is considered extremely difficult to directly compare such soccer balls as is. A review on these soccer balls was also published [23].
However, in all previous studies, only new soccer balls were tested to study their aerodynamics. While in international events such as the FIFA World Cup, it is possible to use a new ball for each game, in games not involving the professional teams, such as amateurs, schools, and club teams, used balls are utilized. However, no fluid dynamics studies were ever conducted on used soccer balls. For this reason, in this study, we analyzed the flight trajectories and aerodynamics of soccer balls kicked 1000 times (used balls) by a robot for a certain period. In this study, we used three new and three used soccer balls (① Telstar 18 (Adidas), ② Merlin (Nike), ③ Derbystar (Select Sports)) designed by three different manufacturers. We compared the aerodynamics of these soccer balls through wind tunnel tests. Additionally, we studied the effects of the soccer ball conditions (used vs. new) on the aerodynamic forces acting on the ball by analyzing the flight trajectories of each ball. Based on the results obtained from these experiments, we aim to elucidate the aerodynamic characteristics and flight trajectory characteristics of the used soccer balls.

2. Tests and Methods of Analysis

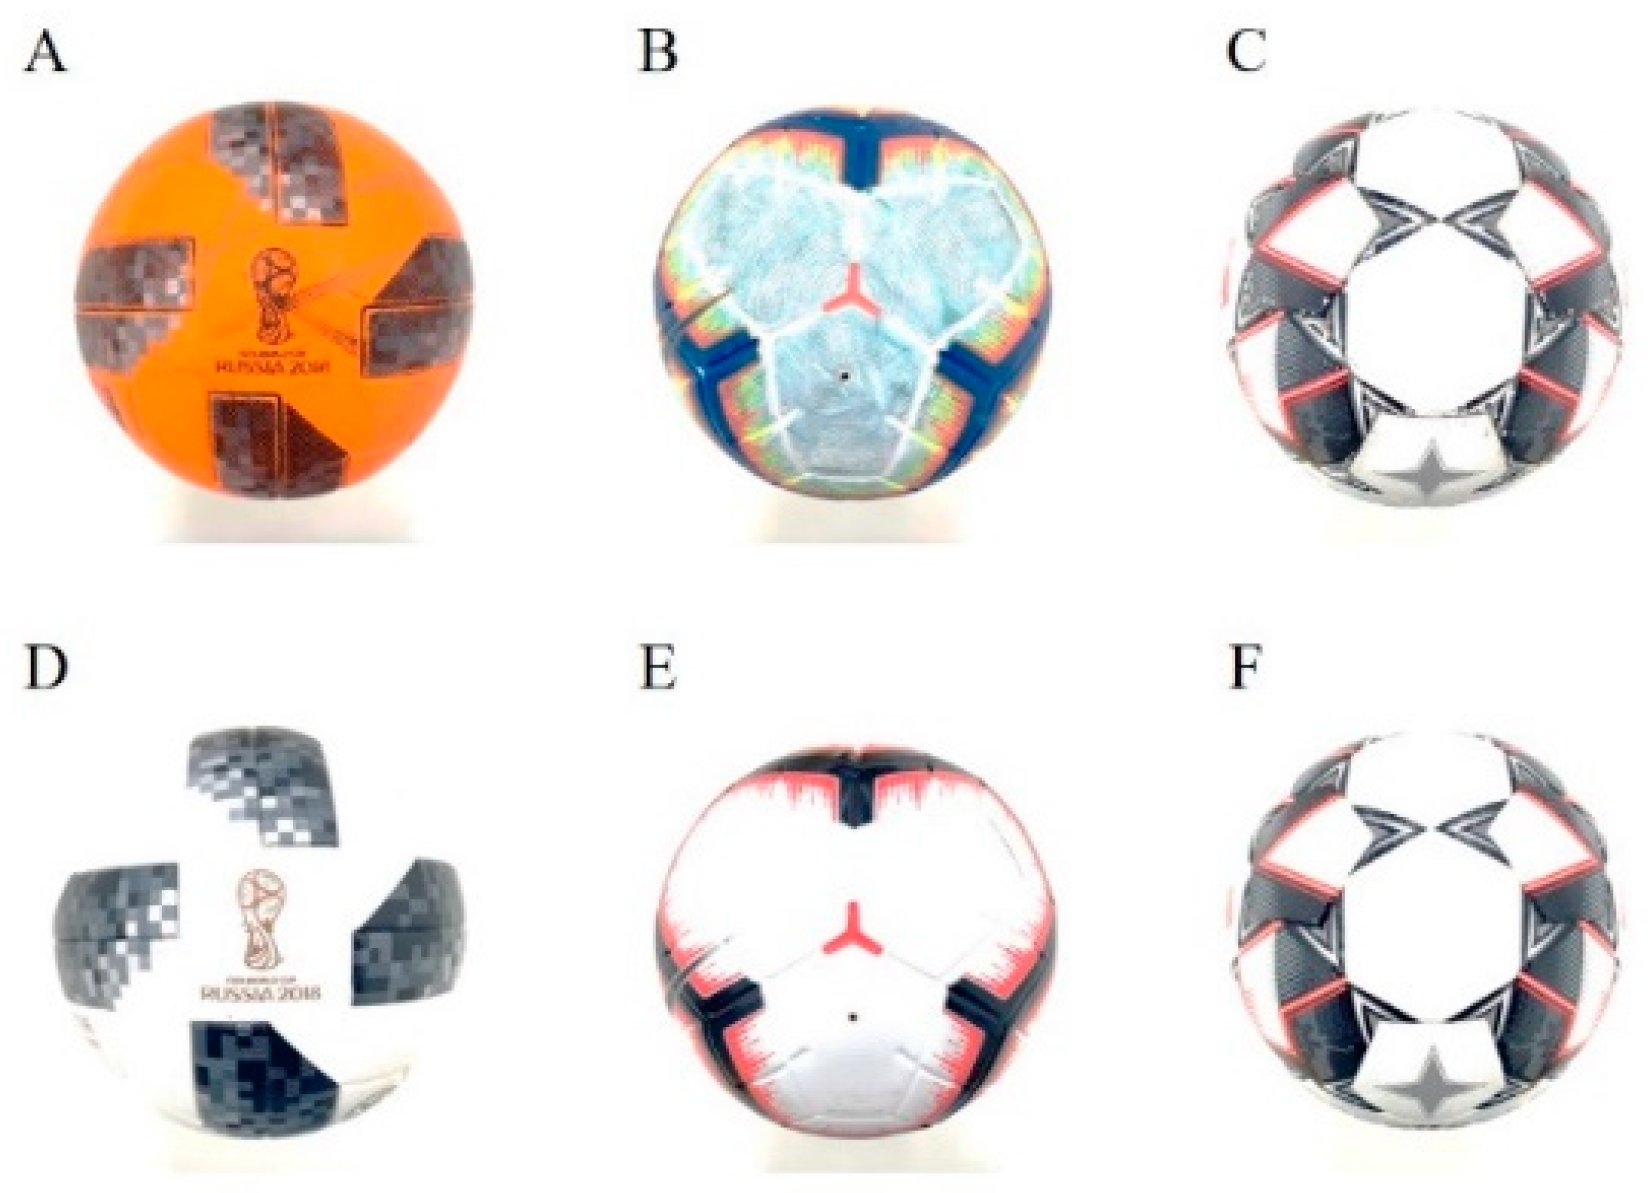
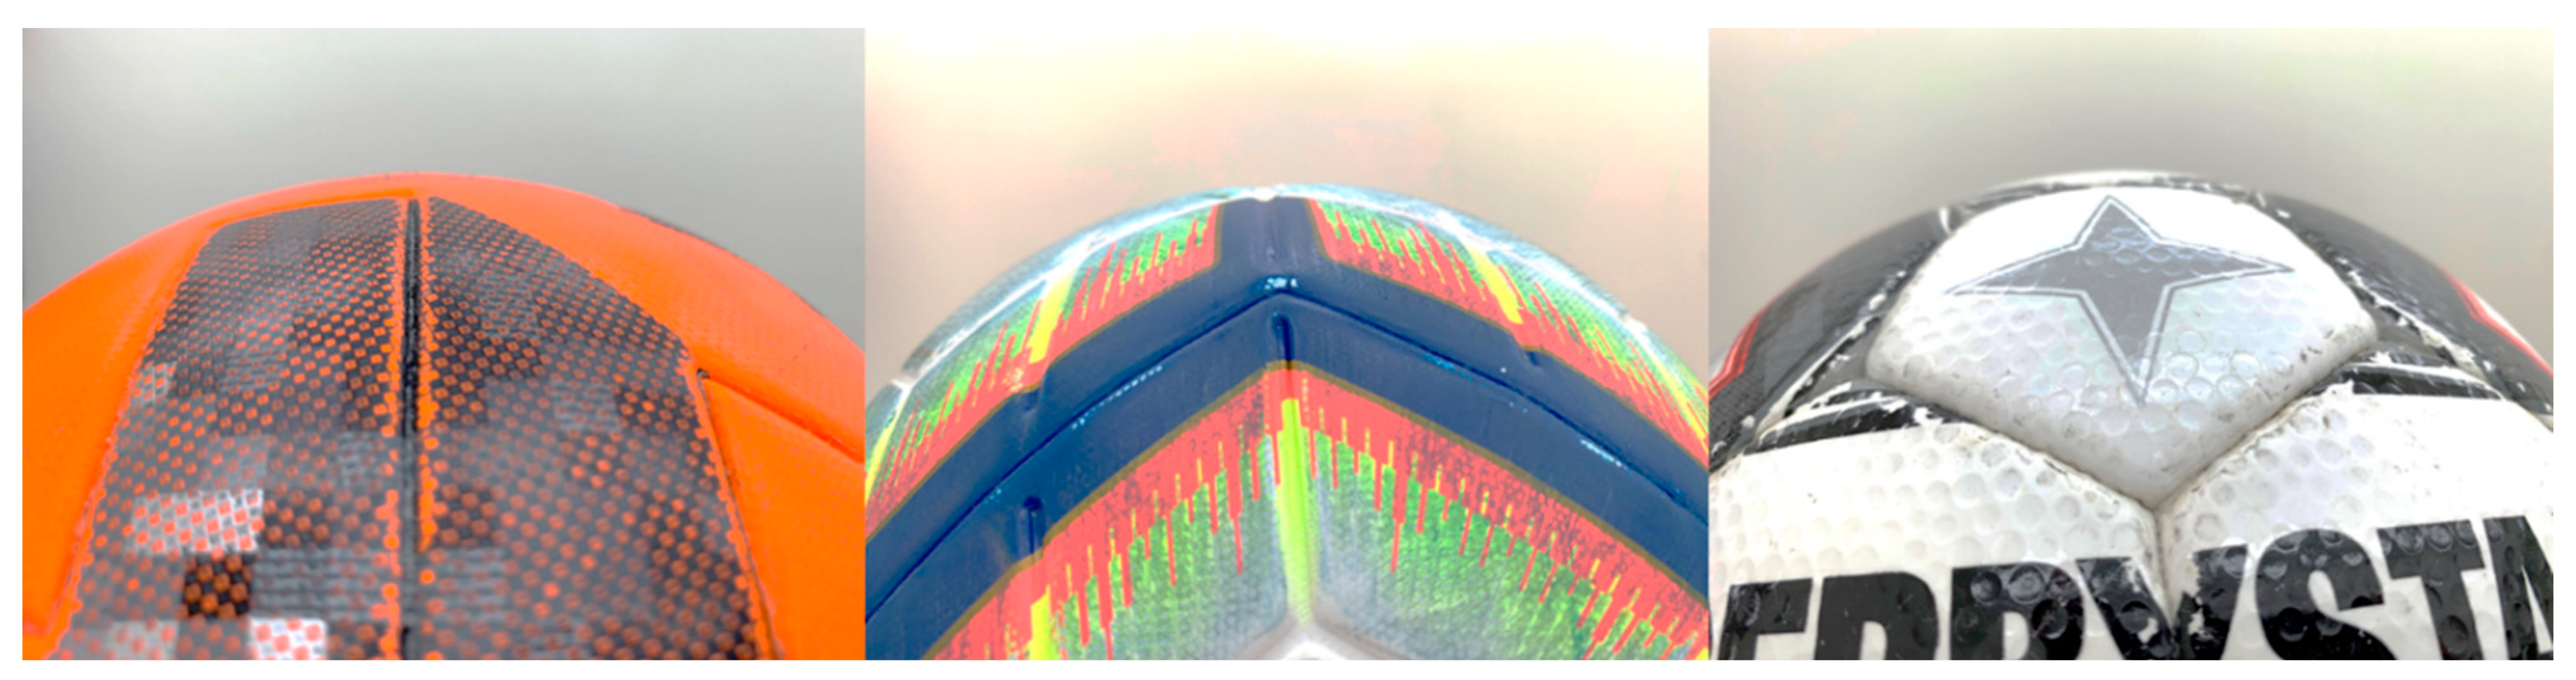
2.1. Wearing out Balls Using a Kicking Robot

The balls used in the tests were all kicked 1000 times by a robot to generate the same surface conditions (Figure 1). The speed of the ball, when kicked by the robot, was set to 30 m/s, and the kicks were repeated 1000 times. Since there is no previous research on used balls, we set the standard as 1000 strong kicks (30 m/s), which can cause the ball to wear out. A large net was placed at approximately 1 m in front of the robot to limit external interferences. Since the three “used soccer balls” used in the tests had been all kicked 1000 times, they were in the same condition.
The soccer balls used in this study were official balls used in the 2018–2019 season: ① Telstar 18 (6-panel, Adidas) EPL (English Premier League) official soccer ball, ② Merlin (4-panel, Nike) Seria A (Italian Football League) official soccer ball, ③ Derbystar (32-panel, Select Sports) Bundesliga (German Football League) official soccer ball. Three used and three new balls (Figure 2) were utilized in the wind tunnel tests.

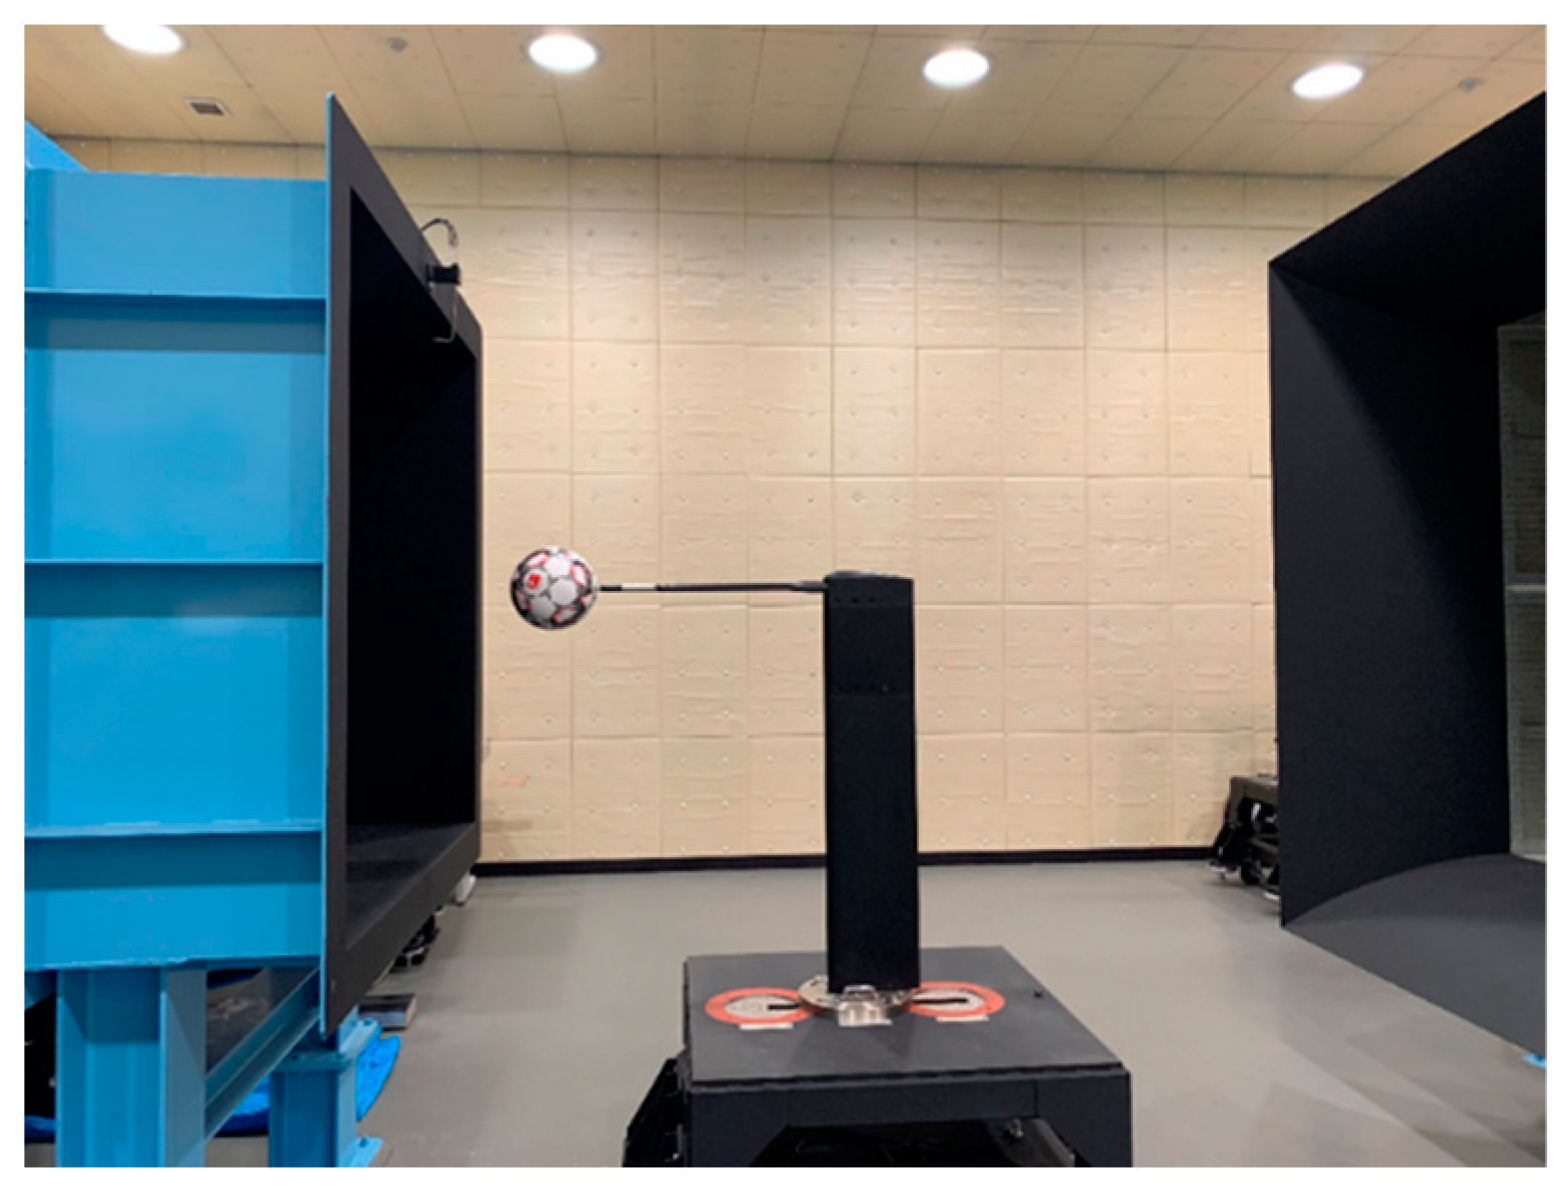
2.2. Wind Tunnel Tests

The tests were conducted using the closed-circuit, low-speed, and low-turbulence wind tunnel (San Technologies Co., Ltd., Tochigi, Japan) at the University of Tsukuba (Figure 3). The maximum flow speed of this wind tunnel is 55 m/s, the blower outlet surface is 1.5 m × 1.5 m, the flow speed distribution is within ±0.5%, and the turbulence is 0.1% or less. Furthermore, the blockage of the measured soccer ball was within 5% of the nozzle size. For example, when the wind speed was set to 25 m/s, the measured mean wind speed was 25.28 m/s, with the measurement position in the range of −0.46 to 0.45 and a wind speed distribution within ±0.5%. Similarly, the degree of turbulence downstream of the nozzle at a wind speed of 25 m/s was 0.05 to 0.06, within approximately 0.1%, so the error from the ball position was believed to have a negligible effect on the wind speed [17]. Furthermore, in this study, the dynamic pressure can be measured automatically with 0.1 Pa intervals using the Pitot-static tube placed above the measuring portion of the soccer ball. In addition, because the position of the ball during the measurement procedure is set almost at the center of the nozzle cross-section to adjust the distance between the nozzle and the ball to zero, the flow generated from the Pitot tube may not have a direct effect on the flow around the ball. Furthermore, the sting used in this study was 0.6 m long and 0.02 m wide. Moreover, because the effect of sting vibrations is reduced to a small value by placing the six-component force detector behind the soccer ball, the magnitude of the sting forces was ignored in this study. The tests were conducted by placing three used and three new balls in the wind tunnel. In this study, aerodynamic measurements for each soccer ball were performed for wind speeds (Reynolds number) from 7 m/s (approximately Re = 1.0 × 10⁵) to 35 m/s (approximately Re = 5.5 × 10⁵) at intervals of 1 m/s [17]. The relationship between the Reynolds number and wind speed is as follows:
Re = UD/v
where Reynolds number (Re) is a dimensionless number defined as the ratio of inertial force to viscous force, U is the wind speed (m/s), D is the ball diameter (m), and v is the kinematic viscosity (m2/s).
These forces were measured using a sting-type six-component force detector (LMC-61256, Nissho Electric Works). In addition, through the aerodynamic forces measured in the tests [1,5,6,7,8], the drag coefficient (CD), lift coefficient (CL), and side force coefficient (CS) were calculated using Equations (2)–(4):
C D = 2 D ρ U 2 A
C L = 2 L ρ U 2 A
C S = 2 S ρ U 2 A
where ρ is the air density, expressed as ρ = 1.2 kg/m3; U is the flow velocity, and A is the projected area of the soccer ball, expressed as A = π × 0.112 = 0.038 m2.

2.3. Simulation of the Flight Trajectory

The flight trajectory simulation was performed using the drag force measured in the wind tunnel tests. A 2D flight simulation [24] was used for the computations. Furthermore, the knuckling effect occurring in non-spinning soccer balls [25,26] and the lift and side forces acting on the ball were not considered in this study.
The following equations were used for the simulation:
m a h = D cos γ
m a v = D sin γ m g
where m is the mass of the football, a h is the horizontal acceleration of the ball, a v is the vertical acceleration of the ball, g is the gravitational acceleration, and γ is the initial attack angle of the ball flight trajectory.

3. Results

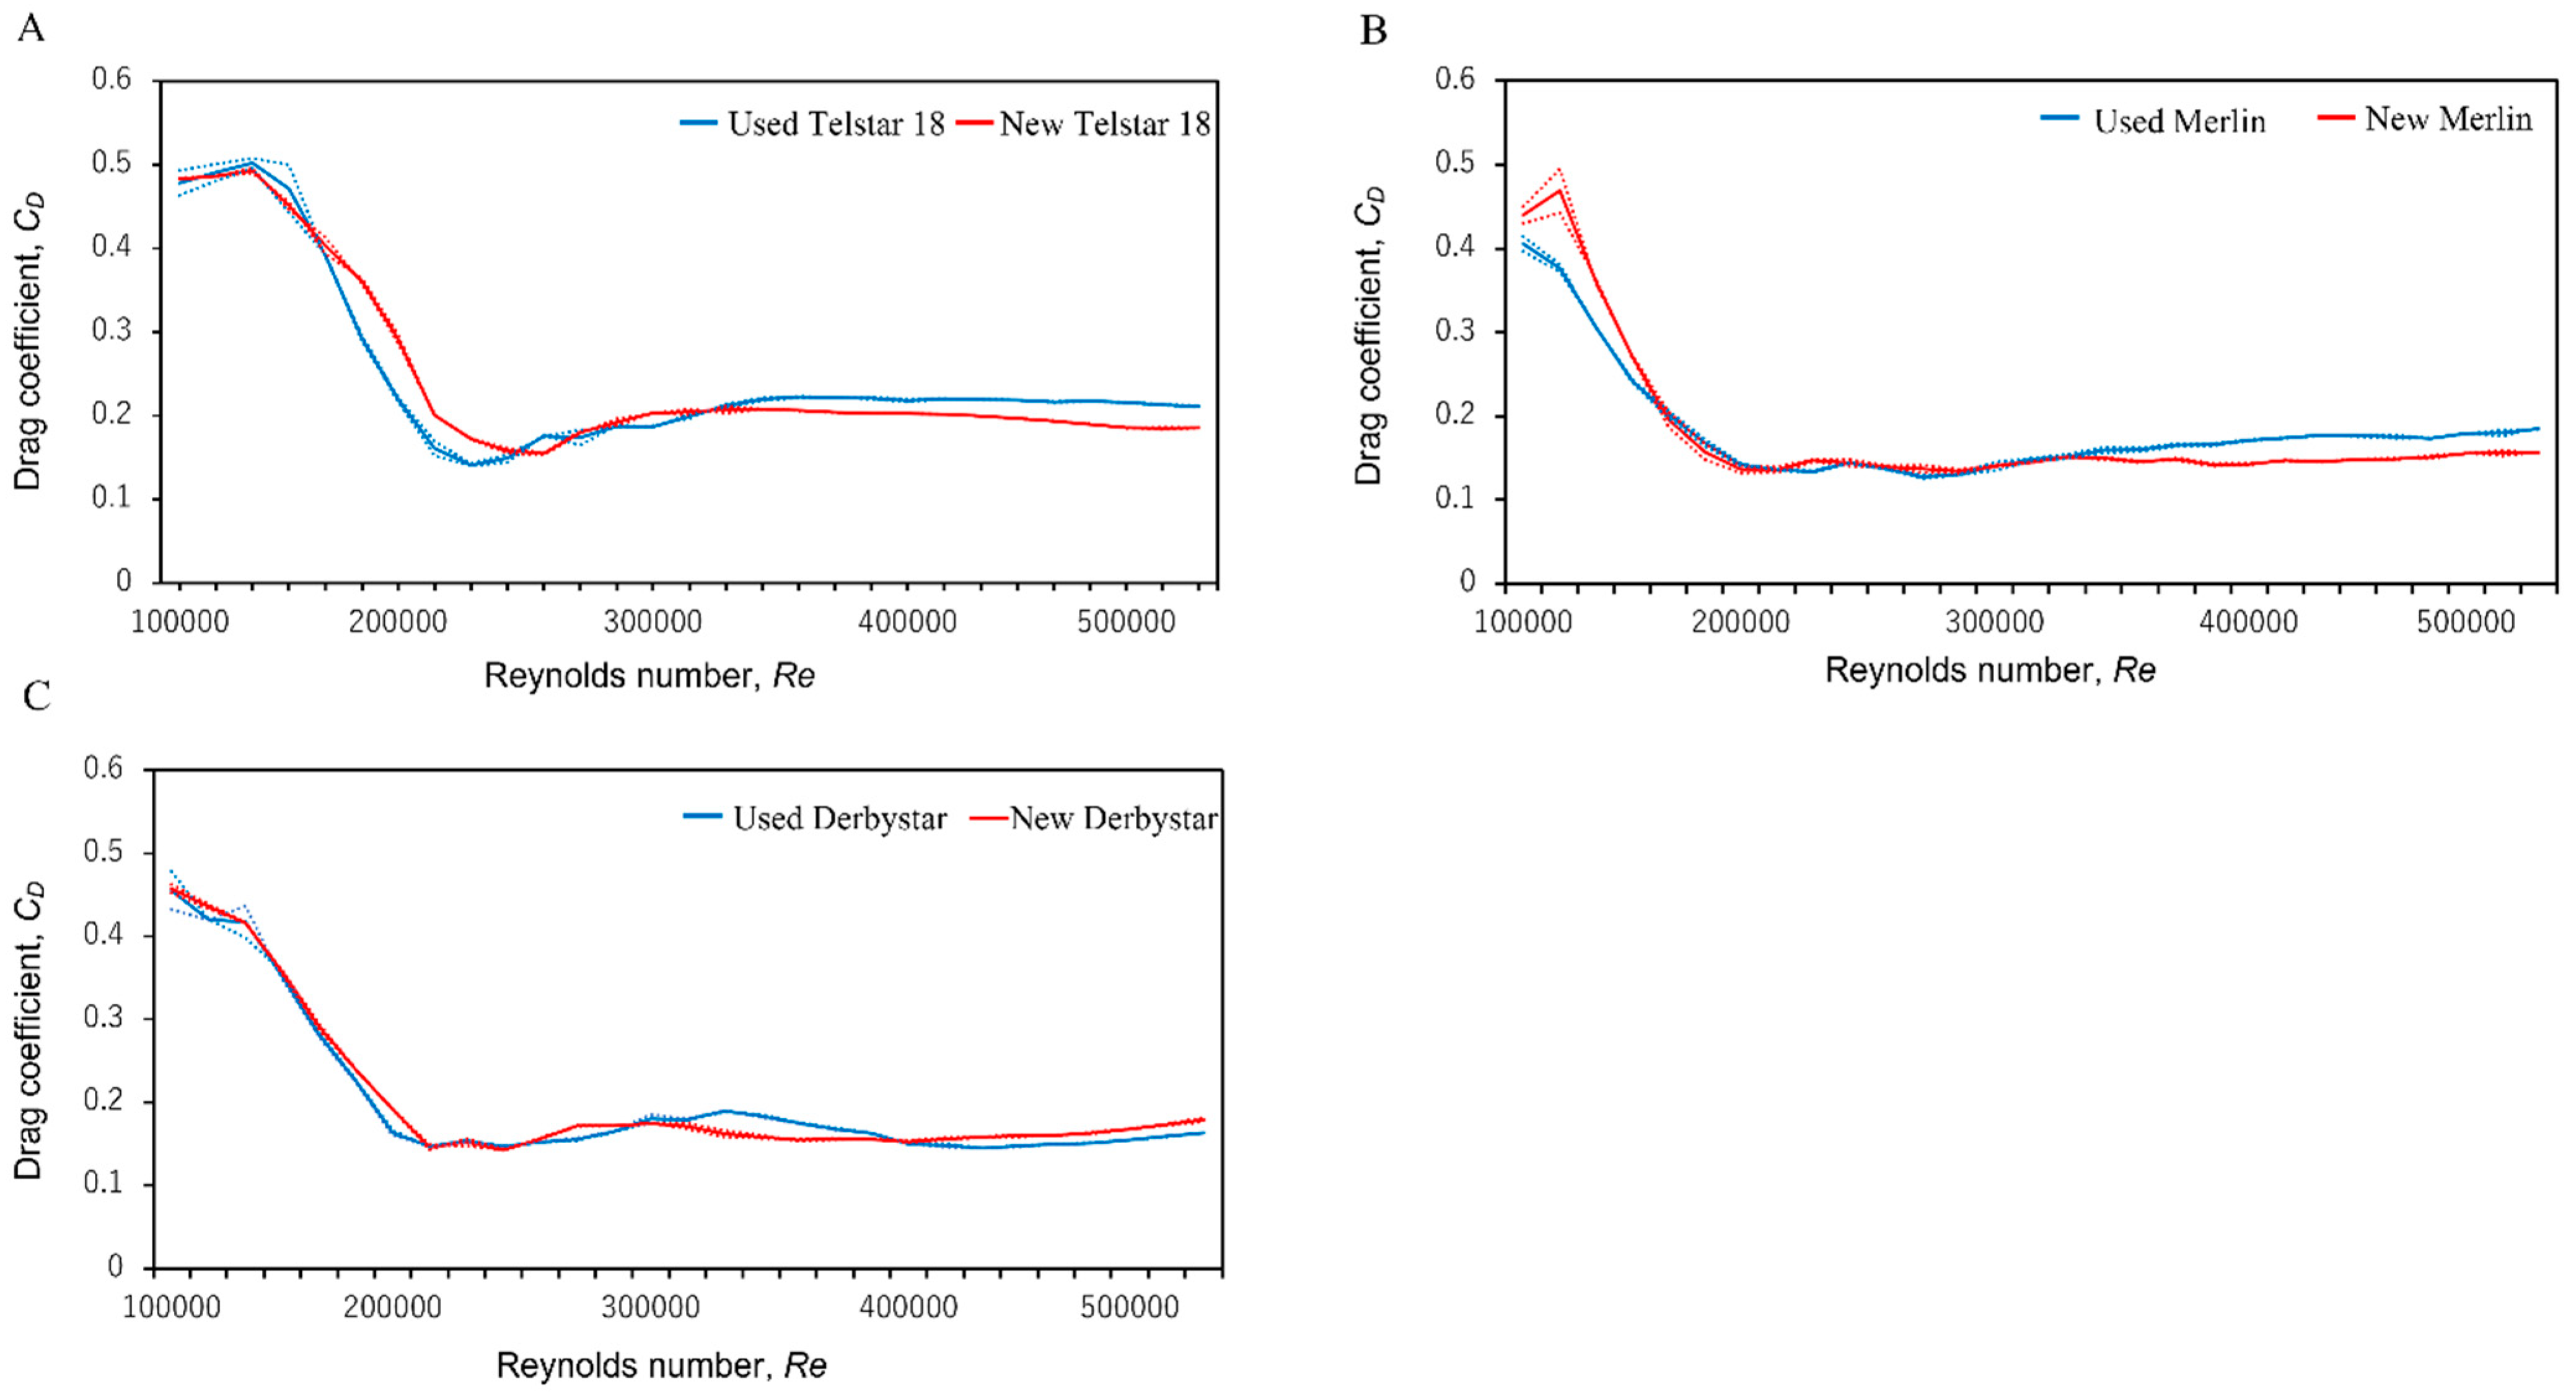
3.1. Drag Coefficient Obtained from the Wind Tunnel Tests

Figure 4 shows the drag coefficient curves of the soccer balls. The drag characteristic curves represent the mean values over three trials for each soccer ball. Additionally, the error of the CD value in each soccer ball is denoted by the dotted line (Figure 4). The comparison of the drag coefficients of the balls at the critical Reynolds number (Recrit) showed that the drag coefficients of the new and used Telstar18 balls were 0.15 (Re = 2.5 × 10⁵) and 0.14 (Re = 2.2 × 10⁵), respectively, those of the new and used Merlin were 0.13 (Re = 2.8 × 10⁵) and 0.13 (Re = 2.2 × 10⁵), respectively. Finally, those of the new and used Derbystar were 0.14 (Re = 2.1 × 10⁵) and 0.14 (Re = 2.1 × 10⁵), respectively.

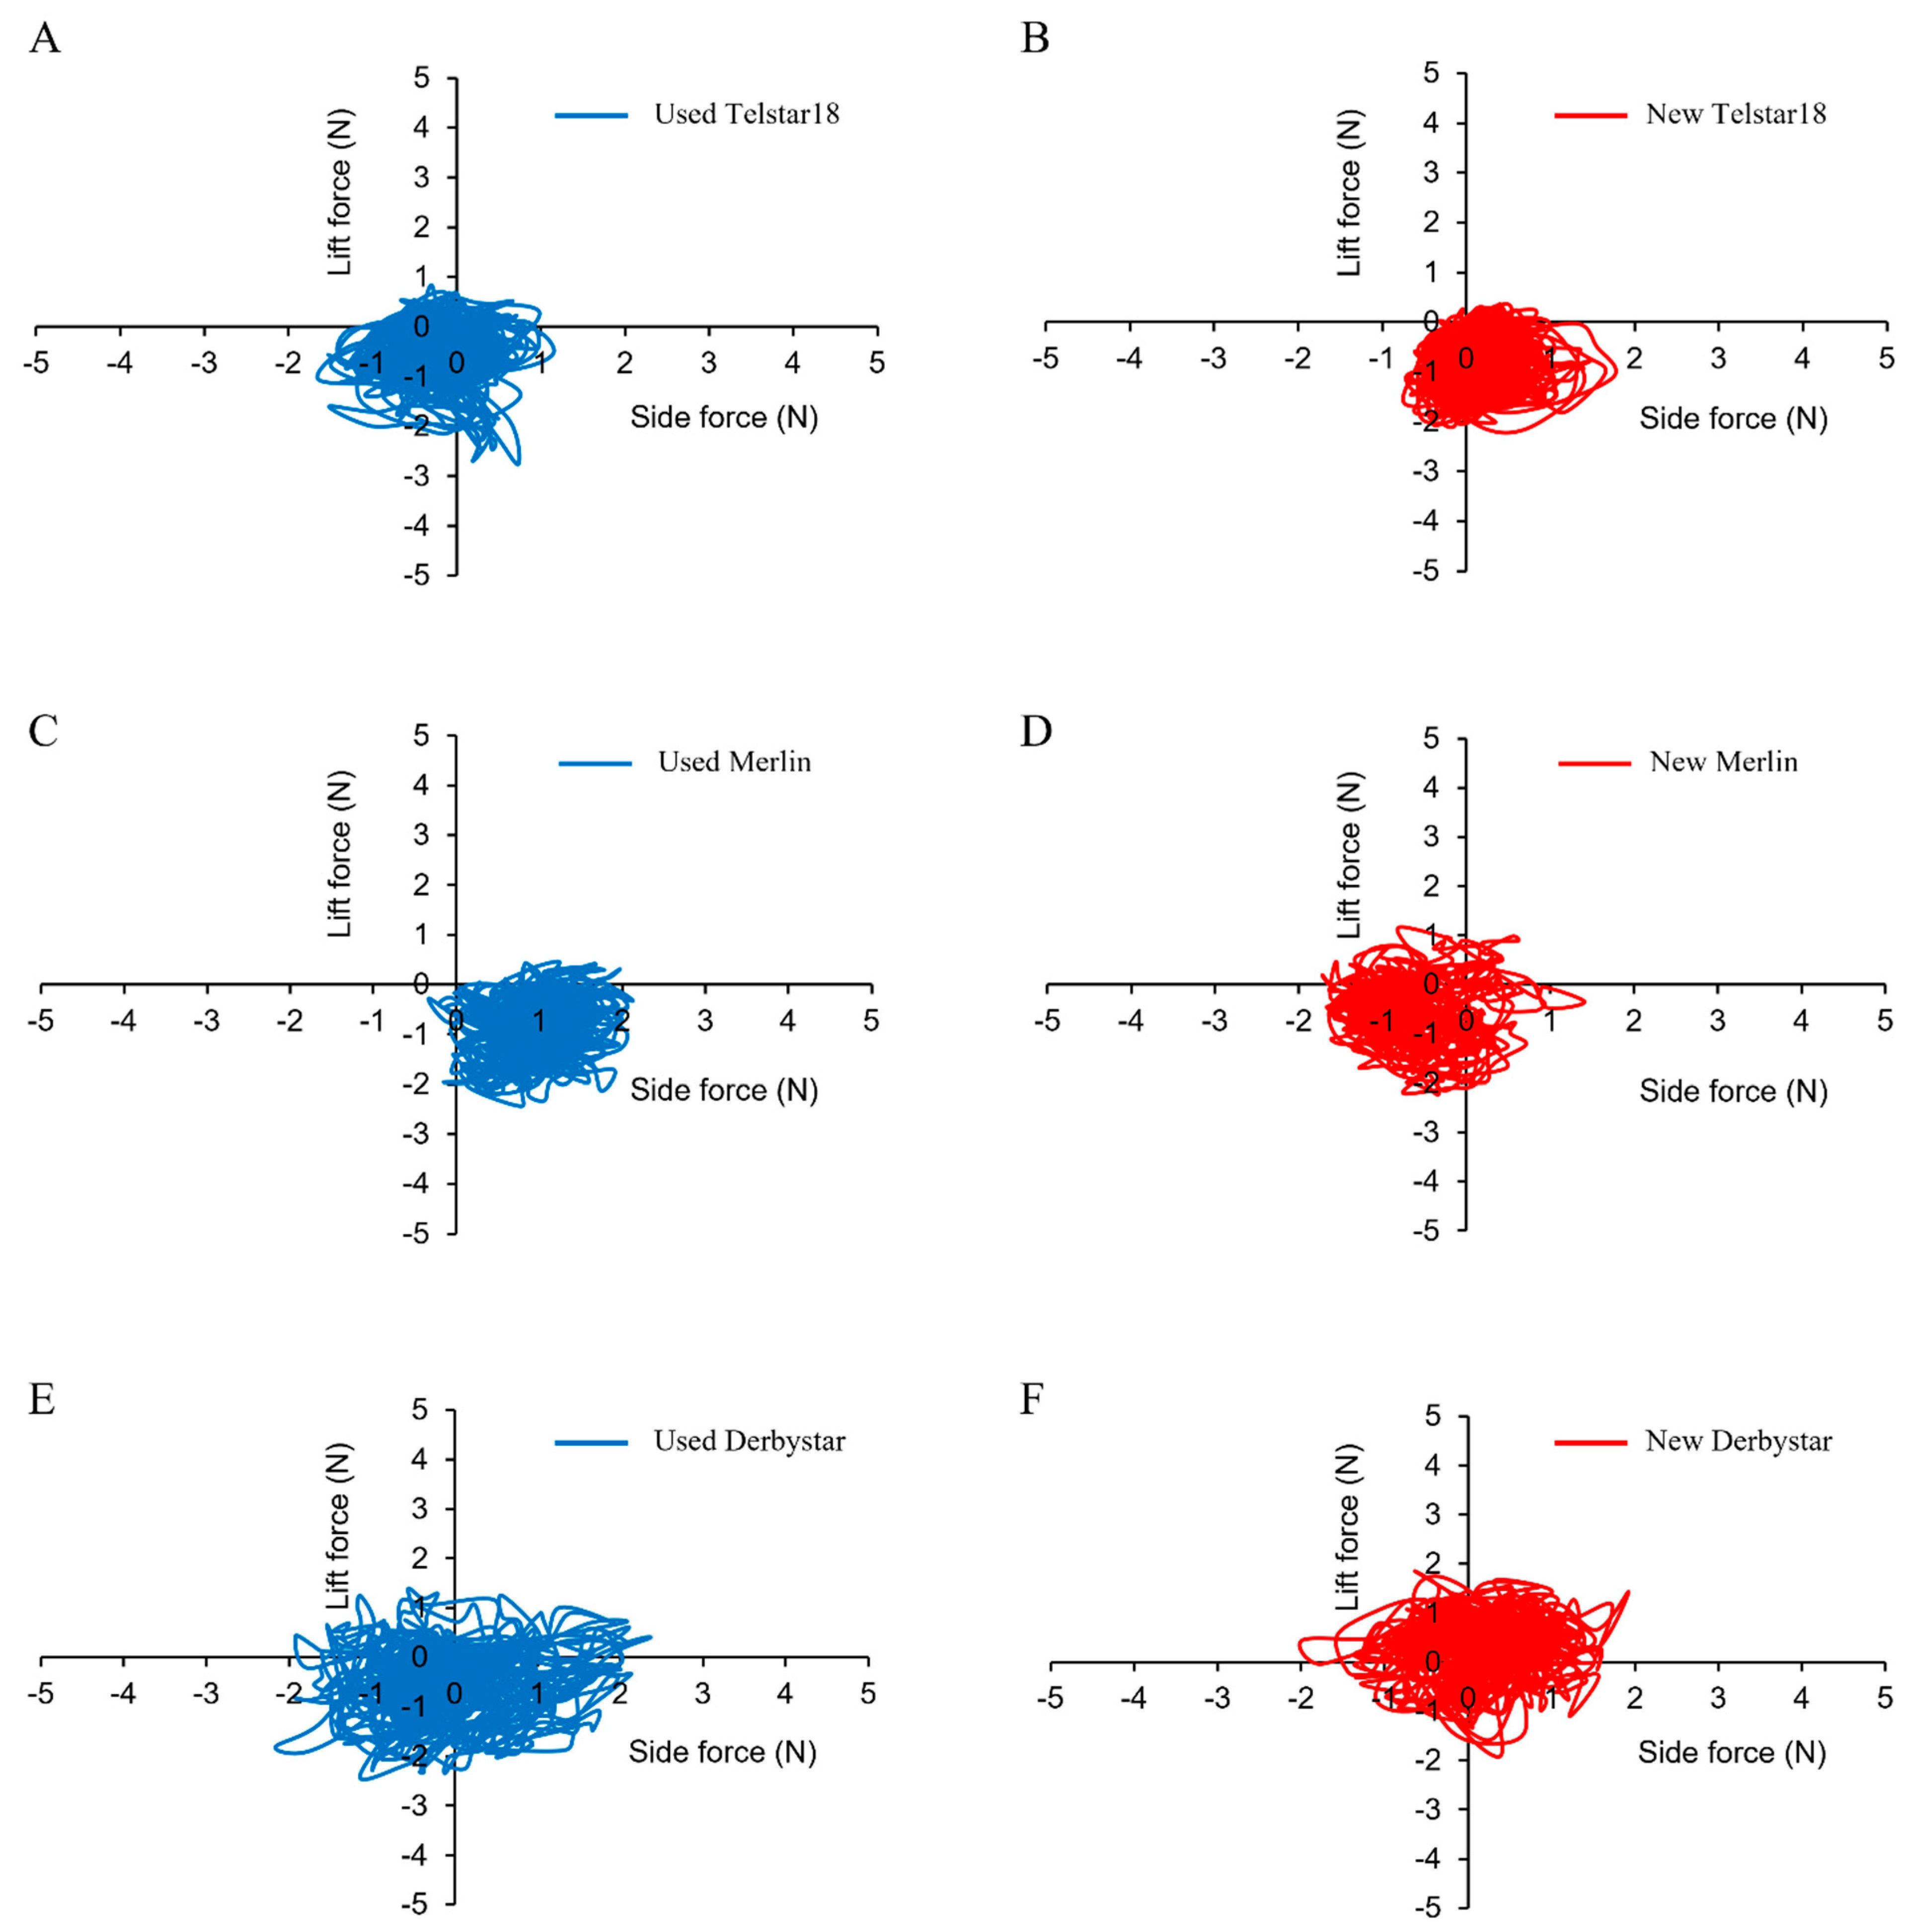
3.2. Changes in the Lift and Side Forces

Figure 5 shows the variations in lift and side forces acting on each ball. To illustrate the irregular movement of the soccer ball accurately, we used scatter plots for the lift and side forces instead of the lift and side coefficients. The graphs show the variations of the forces acting on the balls in the vertical (up–bottom) and lateral (left–right) directions measured in a 10 s interval with an airspeed of 20 m/s. A comparison between the standard deviations (SD) of the variations of the forces acting on the soccer balls showed that for the new Telstar18 the SD of the side and lift forces were 0.37 and 0.46, respectively, while for the used Telstar18, the SD of the side and lift forces were 0.42 and 0.53, respectively. For the new Merlin, the SD of the side and lift forces were 0.49 and 0.55, respectively, while for the used Merlin, the SD of the side and lift forces were 0.42 and 0.56, respectively. Similarly, for the new Derbystar, the SD of the side and lift forces were 0.57 and 0.58, respectively, while for the used Derbystar, the SD of the side and lift forces were 0.76 and 0.68, respectively. Thus, among the tested soccer balls, the used Derbystar showed the most irregular force changes.

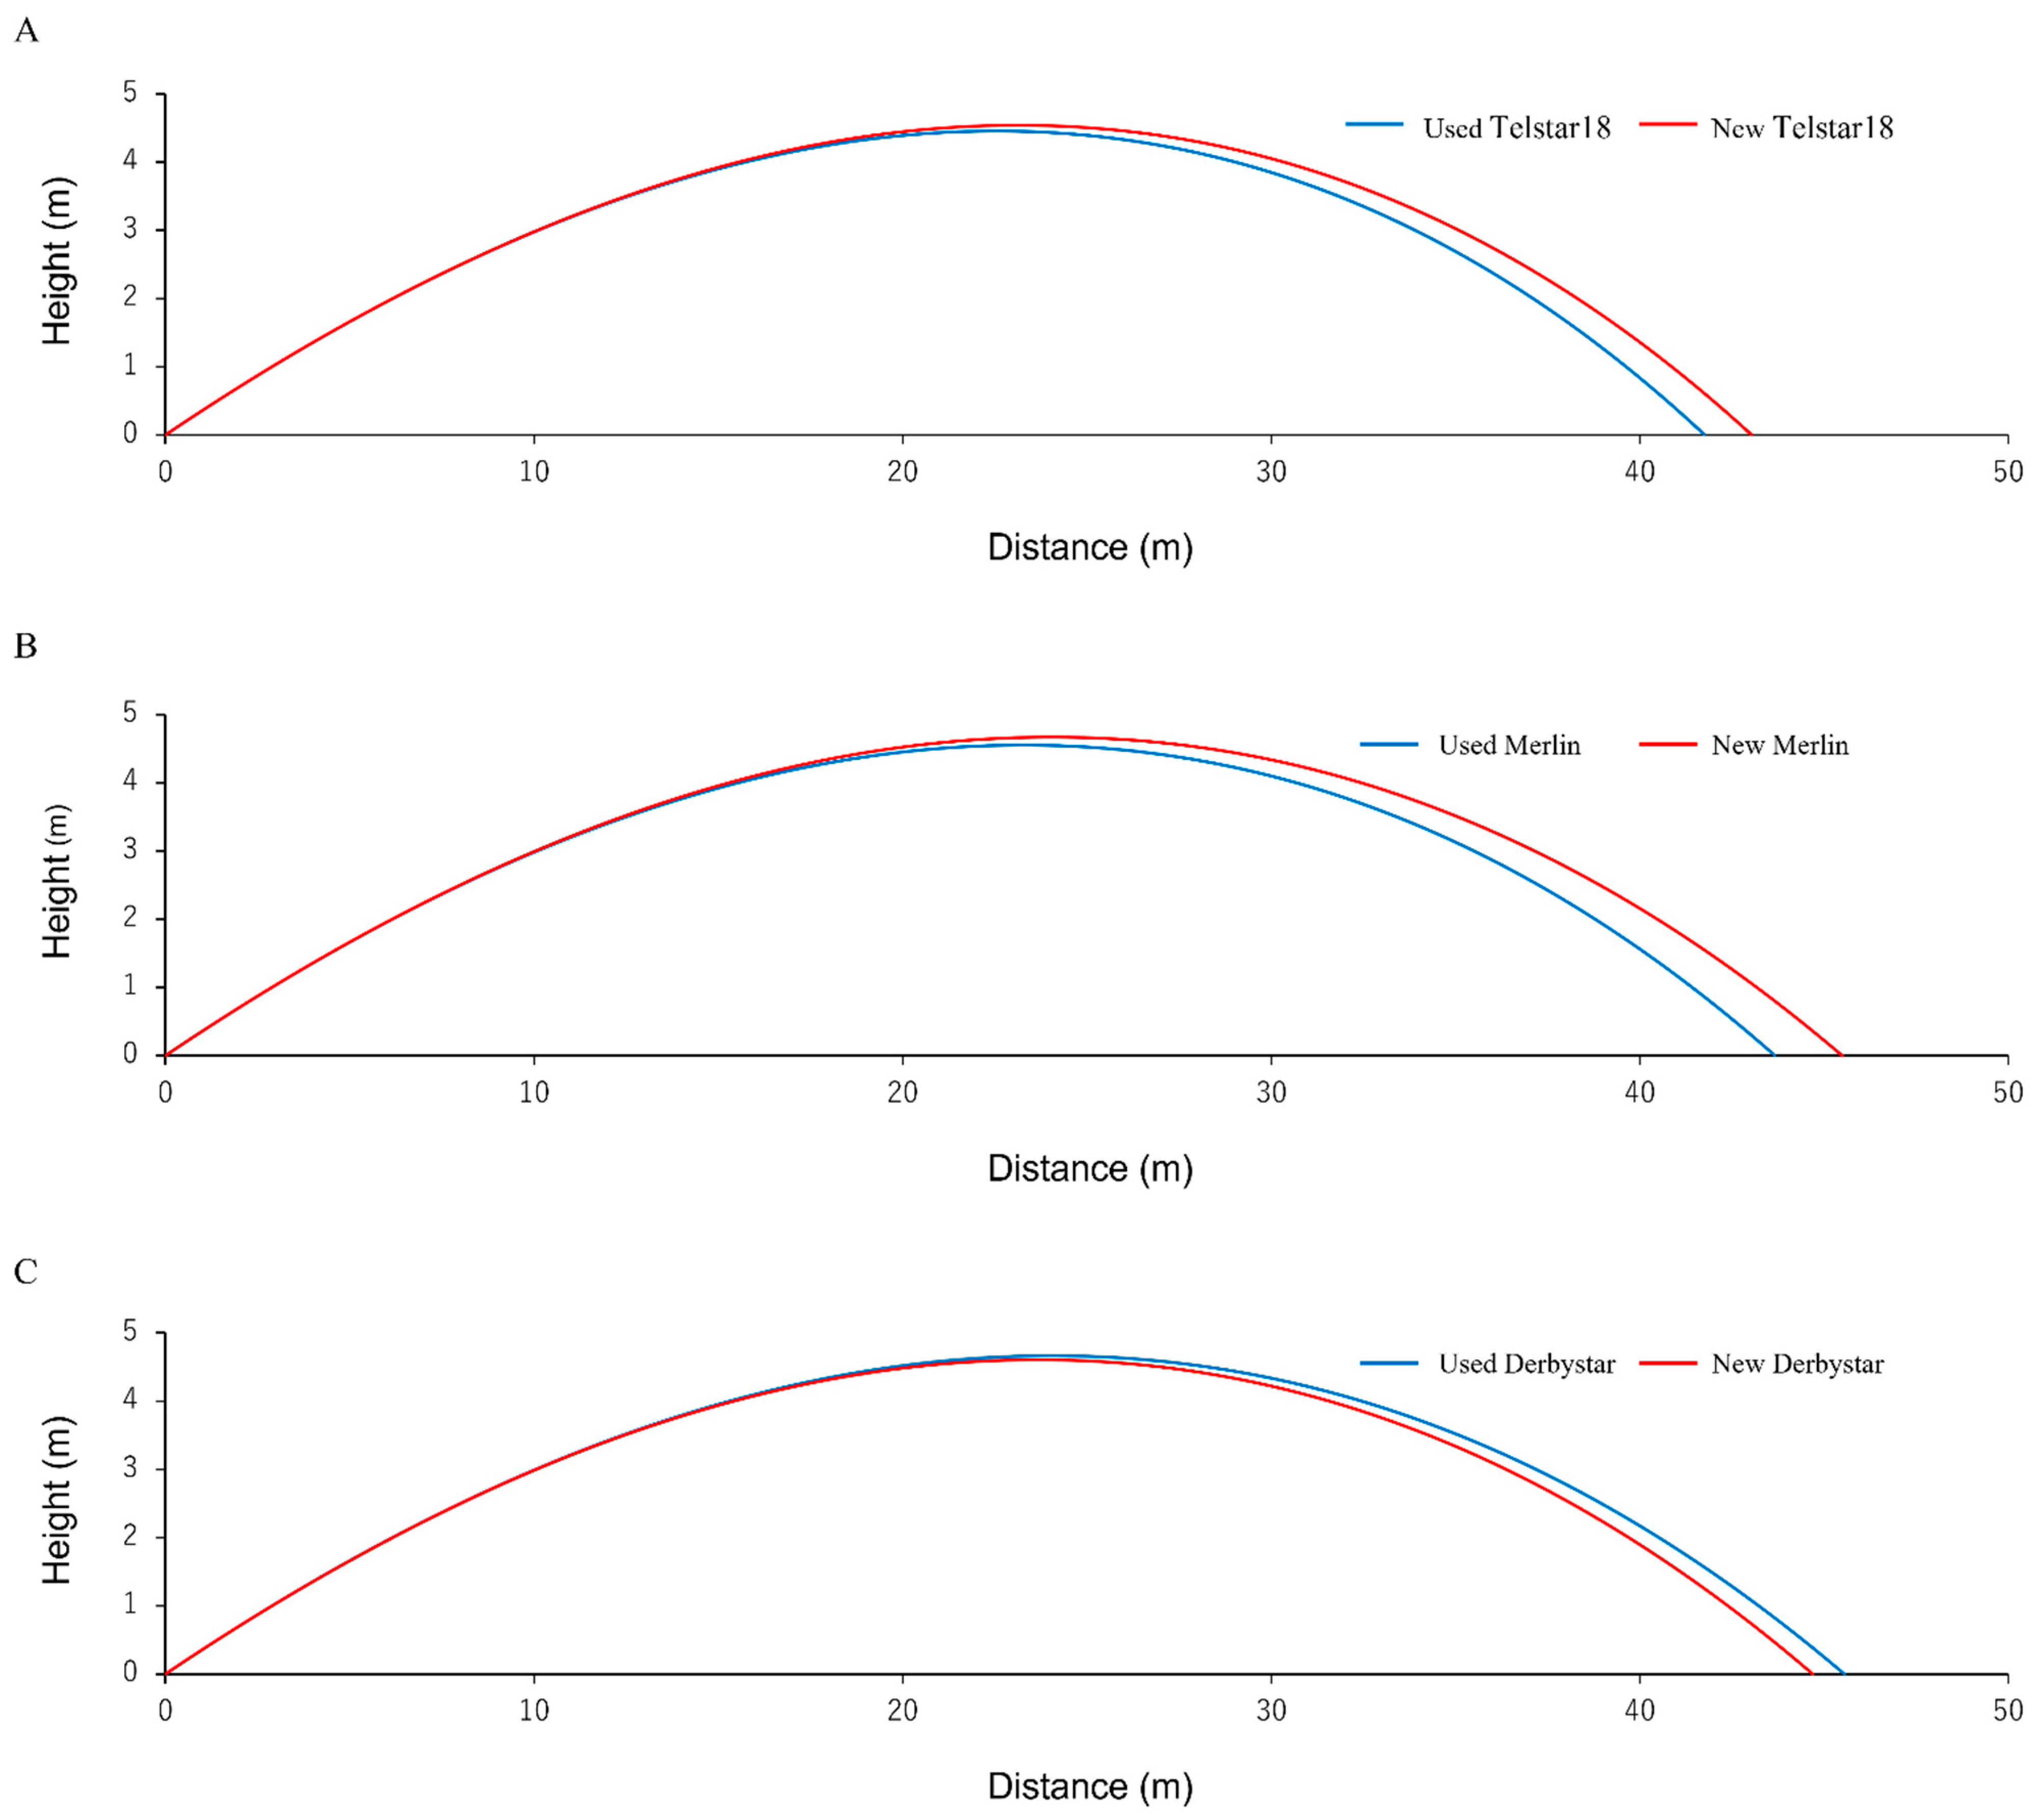
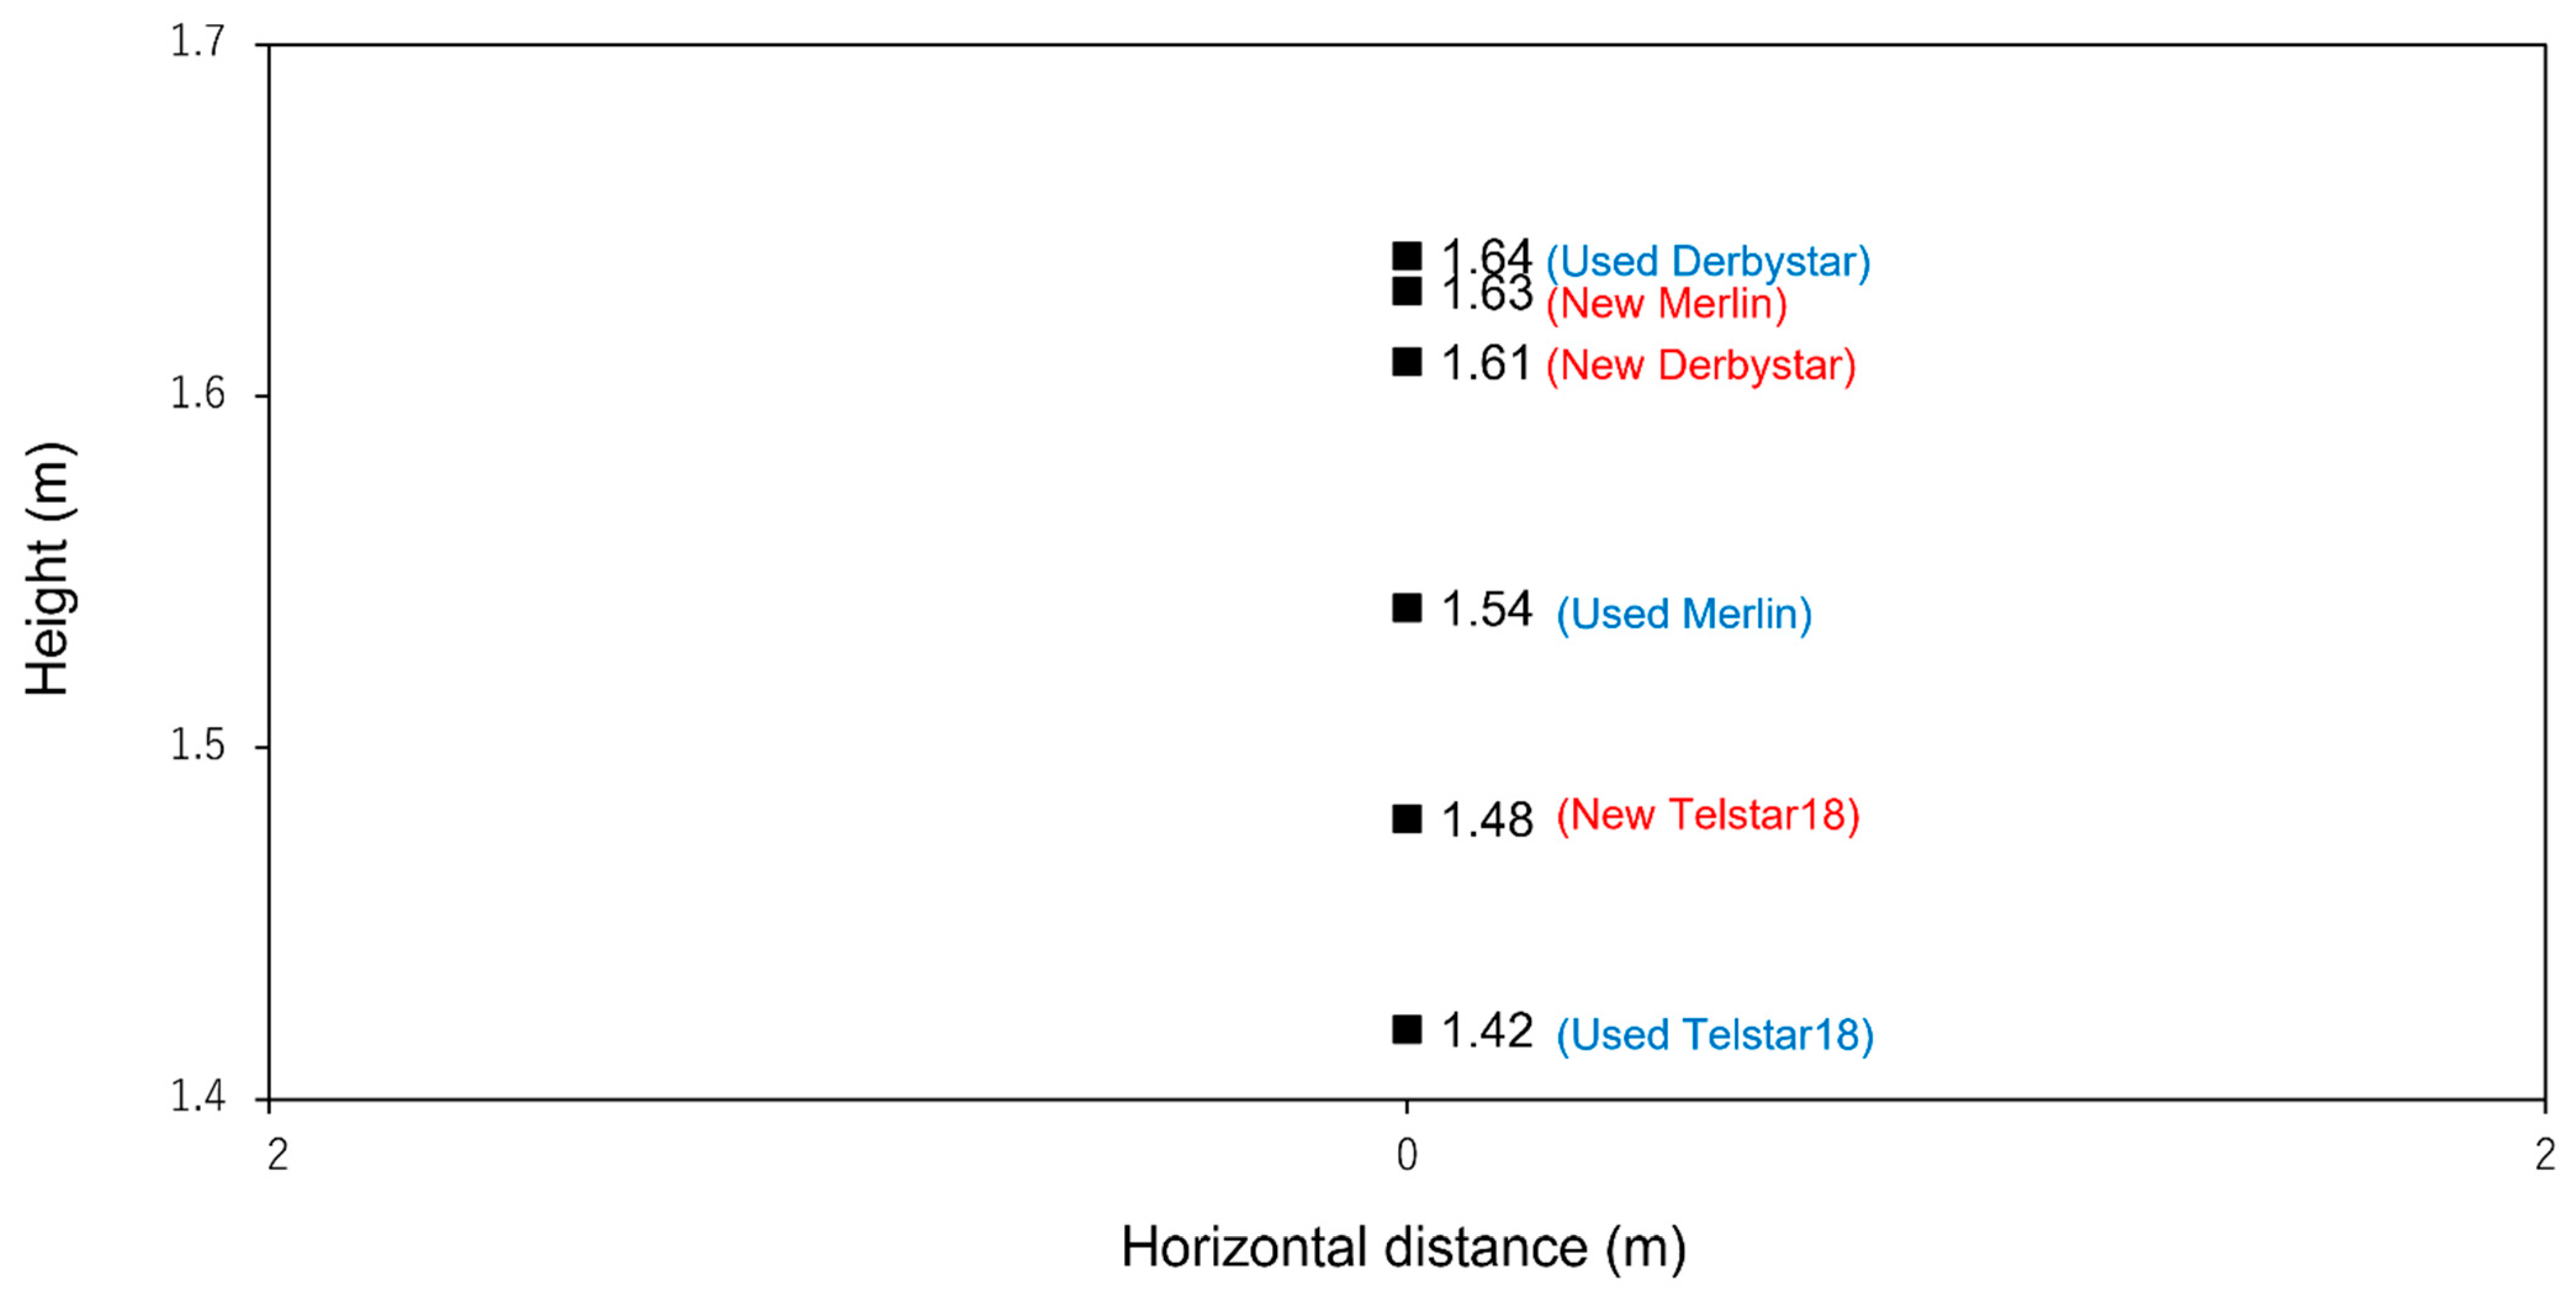
3.3. Results on the Soccer Balls Flight Trajectories

Figure 6 shows the flight trajectories of the soccer balls. In these graphs, the soccer ball flight trajectories were estimated using an initial speed of 30 m/s and a release angle of 20°, which are representative values of a strong kick [14]. For Telstar18, the horizontal trajectory lengths of the new and used balls were 43 m and 41.7 m, respectively, while for the new and used Merlin, the corresponding lengths were 45.5 m and 43.7 m, respectively. Finally, for the new and used Derbystar, the corresponding lengths were 44.7 m and 45.6 m, respectively.
Figure 7 shows the trajectories of the soccer balls when kicked from the starting point (0 m) to the impact point (height) with the net at 20 m. The trajectories were estimated using an initial speed of 20 m/s and a release angle of 15°. For Telstar18, the heights of the trajectories at the impact point of the new and used balls were 1.48 m and 1.42 m, respectively. For the new and used Merlin, the corresponding values were 1.63 m and 1.54 m, respectively. For the new and used Derbystar, the corresponding values were 1.61 m and 1.64 m, respectively.

4. Discussion

In this study, we investigated the aerodynamics and flight trajectories of used soccer balls for the first time. The balls were prepared by kicking them repeatedly 1000 times for a certain period of time using a kicking robot.

4.1. Usage Effects on the Ball Aerodynamics

The wind tunnel test results showed that the aerodynamic forces (drag coefficient) acting on the ball slightly differ between a new and used ball. Furthermore, it was observed that at Recrit, where the transitions from laminar to turbulent flows occur, the results differ depending on whether the ball is used or new. In fact, these transitions occur when the ball is used owing to the variations in the surface roughness produced by kicking the ball. As observed in Figure 4, the CD values of the new and used balls differ in the power-kicks speed range. A previous study on the aerodynamics of cricket balls has reported that when the air boundary becomes turbulent and unstable (at approximately Re = 3.5 × 10⁵), the CD of a used ball is 0.65, which is much larger than the CD of a new ball, which is 0.45. This result was attributed to the increase in the drag force owing to a worn surface [27]. Similar results were observed in our tests for speeds beyond the medium speed range (Re ≥ 3.5 × 10⁵) for the Telstar18 and Merlin soccer balls. However, for the Derbystar, although the CD value of the used ball increased in the medium speed range (3.0 × 10⁵ ≥ Re ≥ 4.0 × 10⁵), it decreased in the high-speed range (Re ≥ 4.0 × 10⁵), as shown in Table 1.
Furthermore, in previous studies on tennis ball aerodynamics, it was reported that as the fuzz of tennis balls has longer fibers, the drag force increases by about 10% [28,29,30]. In this study, the CD of used balls showed a tendency to increase by approximately 7–20%. The significant variations in the surface structures (number of panels and patterns) of the soccer balls used in this study caused a considerable variation in the CD values. The effects of a worn and damaged surface are similar to those of the fuzz of a tennis ball. They induce a faster transition from laminar to turbulent flows around the ball, shifting the airflow separation line towards the back of the ball. Detailed studies on the airflow around used and new soccer balls are considered necessary for future visualization tests such as the PIV (Particle Image Velocimetry) and CFD (Computational Fluid Dynamics). These studies have never been conducted before, and many concepts have not yet been understood. In this work, a comparative study was conducted using new balls, and balls kicked 1000 times. However, a study on the difference with unused balls based on a finer definition of used balls (for example, the state after 100, 1000, and 5000 kicks) is necessary to better quantify the data.

4.2. Usage Effects on the Flight Trajectories of the Balls

The simulations of the flight trajectories of the soccer balls show that in powerful long kicks (initial speed 30 m/s, release angle 20°), the flight distance (horizontal) differs depending on the ball type. In particular, the new Telstar18 and Merlin reach farther distances compared to the used ones. However, the flight distance of the new Derbystar was approximately 1 m shorter than the used one. Furthermore, the simulations of free kicks (initial speed 20 m/s, release angle 15°) show that the vertical positions (height) of the ball impact point at the net placed at 20 m from the kick position differed by approximately 0.2 m depending on the ball type. These differences are approximately comparable to the size of a soccer ball and are therefore significant from the goalkeeper’s position. Furthermore, depending on the ball type, the difference in height between the used and new balls varied significantly from 0.03 m (Derbystar) to 0.09 m (Merlin). These results are similar to the variations in the flight trajectories depending on the ball type reported in previous studies [9,19]. However, in these tests, the computation results were obtained using the CD values from the wind tunnel tests. Further studies are necessary to determine the flight trajectories of used balls through a launching device such as a kicking robot.
The differences in the flight distances may be attributed to the worn surface of the kicked ball, the ball type, and the properties of the leather used for the balls (Figure 8). The Telstar18 and Merlin balls are manufactured using rubber-based synthetic leather and adhesive bonds, while the Derbystar balls are manufactured using artificial leather-based synthetic leather and hand-stitching. However, a detailed study on this topic using a super-microscope is necessary for the future.
In summary, the surface conditions (roughness, worn and torn leather materials) of the modern soccer balls change with usage, causing variations in the airflow around the balls, which affect the aerodynamics and flight trajectories of the balls. Based on the variations of the aerodynamic forces acting on the ball depending on the surface structure, we assumed that the surface conditions of the ball are essential to study their aerodynamics in addition to the number and shape of panels, ball orientation, and surface structure reported in previous studies [6,8,18].

5. Conclusions

In this study, we employed soccer balls by kicking them for a certain period of time, compared the aerodynamics of these balls with the new soccer balls, and investigated their differences in aerodynamics. The results indicate that the surface conditions with materials such as leather and vinyl-based synthetic leather covering the soccer ball surface significantly affect the aerodynamic forces acting on the soccer ball. In other words, it is determined that with the increased use of the soccer ball, the flying distance of the ball becomes shorter or longer. It is necessary to understand these advantages and adjust the strength of the pass or kick according to the condition of the ball used during practice and play. This study, for the first time, shows that the surface conditions of the soccer balls could affect the aerodynamics of modern soccer balls. Hence, it is suggested that the aerodynamic characteristics and flight trajectory of a soccer ball change with use.

Author Contributions

S.H. and T.A. designed the study and experiments. Both authors conducted the experiments and analyzed the collected data. Both authors participated in the discussion of the experimental results and made contributions throughout the project and the writing of the manuscript. All authors have read and agreed to the published version of the manuscript.

Funding

This research was funded by the Ministry of Education, Culture, Sports, Science and Technology of the Japanese government, JSPS KAKENHI grant number 15K16442, 20K11413 and 20H04066.

Data Availability Statement

Data sharing not applicable.

Conflicts of Interest

The authors declare no conflict of interest.

References

  1. Hong, S.; Goff, J.E.; Asai, T. Effect of a soccer ball’s surface texture on its aerodynamics and trajectory. Proc. Inst. Mech. Eng. P 2019, 233, 67–74. [Google Scholar] [CrossRef]
  2. Adrian, L.K.; Derek, B.L. An aerodynamic analysis of recent FIFA World Cup balls. Eur. J. Phys. 2018, 39, 034001. [Google Scholar] [CrossRef]
  3. Alam, F.; Steiner, T.; Chowdhury, H.; Moria, H.; Khan, I.; Aldawi, F.; Subic, A. A study of golf ball aerodynamic drag. Procedia Eng. 2011, 13, 226–231. [Google Scholar] [CrossRef] [Green Version]
  4. Alam, F.; Chowdhury, H.; Stemmer, M.; Wang, Z.; Yang, J. Effects of surface structure on soccer ball aerodynamics. Procedia Eng. 2012, 34, 146–151. [Google Scholar] [CrossRef] [Green Version]
  5. Asai, T.; Seo, K. Aerodynamic drag of modern soccer balls. SpringerPlus 2013, 2, 171. [Google Scholar] [CrossRef] [Green Version]
  6. Goff, J.E.; Asai, T.; Hong, S. A comparison of Jabulani and Brazuca non-spin aerodynamics. Proc. Inst. Mech. Eng. P 2014, 228, 188–194. [Google Scholar] [CrossRef] [Green Version]
  7. Goff, J.E.; Hong, S.; Asai, T. Aerodynamic and surface comparisons between Telstar 18 and Brazuca. Proc. Inst. Mech. Eng. P 2018, 232, 342–348. [Google Scholar] [CrossRef]
  8. Naito, K.; Hong, S.; Koido, M.; Nakayama, M.; Sakamoto, K.; Asai, T. Effect of seam characteristics on critical Reynolds number in footballs. Mech. Eng. J. 2018, 5, 17-00369. [Google Scholar] [CrossRef] [Green Version]
  9. Hong, S.; Asai, T. Effect of panel shape of soccer ball on its flight characteristics. Sci. Rep. 2014, 4, 5068. [Google Scholar] [CrossRef]
  10. Hussain, S.B.; Shah, S.I.A.; Khan, M.K.A. Aerodynamic design considerations for a soccer ball. In Proceedings of the 2019 Sixth International Conference on Aerospace Science and Engineering (ICASE), Islamabad, Pakistan, 12–14 November 2019; pp. 1–16. [Google Scholar] [CrossRef]
  11. Mizota, T.; Kurogi, K.; Ohya, Y.; Okajima, A.; Naruo, T.; Kawamura, Y. The strange flight behaviour of slowly spinning soccer balls. Sci. Rep. 2013, 3, 1871. [Google Scholar] [CrossRef]
  12. Oggiano, L.; Sætran, L. Aerodynamics of modern soccer balls. Procedia Eng. 2010, 2, 2473–2479. [Google Scholar] [CrossRef] [Green Version]
  13. Passmore, M.; Rogers, D.; Tuplin, S.; Harland, A.; Lucas, T.; Holmes, C. The aerodynamic performance of a range of FIFA-approved footballs. Proc. Inst. Mech. Eng. P 2012, 226, 61–70. [Google Scholar] [CrossRef] [Green Version]
  14. Asai, T.; Hong, S. Aerodynamics of the newly approved football for the English Premier League 2020–21 season. Sci. Rep. 2021, 11, 9578. [Google Scholar] [CrossRef]
  15. Asai, T.; Nakanishi, Y.; Akiyama, N.; Hong, S. Flow visualization of spinning and nonspinning soccer balls using computational fluid dynamics. Appl. Sci. 2020, 10, 4543. [Google Scholar] [CrossRef]
  16. Hong, S.; Asai, T.; Seo, K. Visualization of air flow around soccer ball using a particle image velocimetry. Sci. Rep. 2015, 5, 15108. [Google Scholar] [CrossRef] [PubMed] [Green Version]
  17. Hong, S.; Asai, T. Aerodynamic effects of dimples on soccer ball surfaces. Heliyon 2017, 3, e00432. [Google Scholar] [CrossRef] [PubMed]
  18. Hong, S.; Asai, T. Effect of surface groove structure on the aerodynamics of soccer balls. Appl. Sci. 2020, 10, 5877. [Google Scholar] [CrossRef]
  19. Goff, J.E.; Hong, S.; Asai, T. Effect of a soccer ball’s seam geometry on its aerodynamics and trajectory. Proc. Inst. Mech. Eng. P 2020, 234, 19–29. [Google Scholar] [CrossRef]
  20. Goff, J.E.; Hong, S.; Asai, T. Influence of surface properties on soccer ball trajectories. Proceedings 2020, 49, 143. [Google Scholar] [CrossRef]
  21. Goff, J.E.; Hobson, C.M.; Asai, T.; Hong, S. Wind-tunnel experiments and trajectory analyses for five nonspinning soccer balls. Procedia Eng. 2016, 147, 32–37. [Google Scholar] [CrossRef] [Green Version]
  22. Haake, S.J.; Goodwill, S.R.; Carre, M.J. A new measure of roughness for defining the aerodynamic performance of sports balls. Proc. Inst. Mech. Eng. Part C J. Mech. Eng. Sci. 2007, 221, 789–806. [Google Scholar] [CrossRef]
  23. Mehta, R.D. Aerodynamics of sports balls. Annu. Rev. Fluid Mech. 1985, 17, 151–189. [Google Scholar] [CrossRef]
  24. Goff, J.E.; Carré, M.J. Trajectory analysis of a soccer ball. Am. J. Phys. 2009, 77, 1020–1027. [Google Scholar] [CrossRef]
  25. Asai, T.; Kamemoto, K. Flow structure of knuckling effect in footballs. J. Fluids Struct. 2011, 27, 727–733. [Google Scholar] [CrossRef] [Green Version]
  26. Hong, S.; Chung, C.; Nakayama, M.; Asai, T. Unsteady aerodynamic force on a knuckleball in soccer. Procedia Eng. 2010, 2, 2455–2460. [Google Scholar] [CrossRef] [Green Version]
  27. Alam, F.; Hillier, D.; Xia, J.; Chowhdhury, H.; Moria, H.; LaBroory, R.; Subic, A. Aerodynamics of Used cricket balls. In Proceedings of the 17th Australasian Fluid Mechanics Conference, Auckland, New Zealand, 1–4 December 2010. [Google Scholar]
  28. Mehta, R.; Alam, F.; Subic, A. Review of tennis ball aerodynamics. Sports Technol. 2008, 1, 7–16. [Google Scholar] [CrossRef]
  29. Haake, S.J.; Chadwick, S.G.; Dignall, R.J.; Goodwill, S.; Rose, P. Engineering tennis—Slowing the game down. Sports Eng. 2000, 3, 131–143. [Google Scholar] [CrossRef]
  30. Chadwick, S.G.; Haake, S.J. Methods to determine the aerodynamic forces acting on tennis balls in flight. In Tennis Science and Technology, Proceedings of the 1st International Conference on Tennis Science and Technology, London, UK, 1–4 August 2000; Haake, S.J., Coe, A., Eds.; Blackwell Science: Oxford, UK, 2000; pp. 127–134. [Google Scholar]
Figure 1. Kicking robot used to wear out soccer balls.
Applsci 11 07204 g001
Figure 2. Soccer balls used in the tests. (AC) are the Telstar 18, Merlin, and Derbystar used balls, respectively. (DF) are the Telstar 18, Merlin, and Derbystar new balls, respectively.
Applsci 11 07204 g002
Figure 3. Wind tunnel test setup.
Applsci 11 07204 g003
Figure 4. (AC) show the drag coefficients obtained for the Telstar18, Merlin, and Derbystar soccer balls, respectively.
Applsci 11 07204 g004
Figure 5. Changes in the lift and side forces of each soccer ball (airspeed 20 m/s, 10 s interval). (A,C,E) are the Telstar 18, Merlin, and Derbystar used balls, respectively. (B,D,F) are the Telstar 18, Merlin, and Derbystar new balls, respectively.
Applsci 11 07204 g005
Figure 6. Comparison of the flight trajectories of the soccer balls (initial speed 30 m/s, release angle 20°) (AC) show the results for Telstar18, Merlin, and Derbystar, respectively.
Applsci 11 07204 g006
Figure 7. Comparison of the height of the impact point of the soccer ball from the front (initial speed 20 m/s, release angle 15°).
Applsci 11 07204 g007
Figure 8. The surface of used soccer balls.
Applsci 11 07204 g008
Table 1. CD values of the new and used balls used in this experiment.
Airflow VelocityTypeTelstar18MerlinDerbystar
Re = 3.5 × 10⁵
(about 23 m/s)
Used ball0.22 (about 10% up)0.15 (about 7% up)0.18 (about 20% up)
New ball0.200.140.15
Re = 5.0 × 10⁵
(about 33 m/s)
Used ball0.21 (about 15% up)0.17 (about 15% up)0.15 (about 7% down)
New ball0.180.150.16
Publisher’s Note: MDPI stays neutral with regard to jurisdictional claims in published maps and institutional affiliations.

