Article

Aerodynamics Analysis of Speed Skating Helmets: Investigation by CFD Simulations

by
Guillermo Puelles Magán
1,*,
Wouter Terra
2 and
Andrea Sciacchitano
2
1
Department of Management and Engineering, Linköping University, SE-581 83 Linköping, Sweden
2
Faculty of Aerospace Engineering, Delft University of Technology, 2629HS Delft, The Netherlands
*
Author to whom correspondence should be addressed.
Appl. Sci. 2021, 11(7), 3148; https://doi.org/10.3390/app11073148
Submission received: 2 January 2021 / Revised: 15 January 2021 / Accepted: 19 January 2021 / Published: 1 April 2021
(This article belongs to the Special Issue Sports Fluid Mechanics)

Abstract

:
In this work, we investigate the flow field around speed skating helmets and their associated aerodynamic drag by means of computational fluid dynamics (CFD) simulations. An existing helmet frequently used in competition was taken as a baseline. Six additional helmet designs, as well as the bare-head configuration, were analysed. All the numerical simulations were performed via 3D RANS simulations using the SST k- ω turbulence model. The results show that the use of a helmet always reduces the aerodynamic drag with respect to the bare head configuration. Besides, an optimised helmet design enables a reduction of the skaters aerodynamic drag by 5.9%, with respect to the bare-head configuration, and by 1.6% with respect to the use of the baseline Omega helmet.

1. Introduction

In recent decades, high speed sports have put increasing attention in aerodynamics to strive for excellence. This is the case of speed skating, in which 90% of the total resistance comes from the aerodynamic drag when skating at 15 m/s [1]. In the last international championships, differences in standings were so small that a slight improvement in the aerodynamic performance could have led to a variation in the podium positions [2]. Speed skating has already been influenced by technological solutions targeting aerodynamic drag reduction. The so-called zig-zag strips and skin-suits helped improving the performance of the athletes by forcing the transition of the boundary layer from the laminar to the turbulent regime, thus postponing the flow separation about the athletes’ limbs [1,3,4,5]. At the Nagano 1998 Olympic winter games, the Dutch national team used the Delta-Flash suit developed with the experimental zig-zag strips [6], dominating the speed skating events with 11 medals in total and 3 world records [7]. After those Olympic winter games, manufacturers started to develop new suits to reduce drag force. One example is the Nike Swift Skin suit [8], which consisted of six selected fabrics of different roughness placed strategically on the body to minimize the aerodynamic drag. At the Salt Lake City 2002 Olympic winter games, this suit made skaters faster by up to 0.2–0.3 s per lap on a 400 m rink [6].
According to the International Skating Unition regulations and technical notes [9,10], skaters should and may use a helmet in short and long track disciplines, respectively. Such regulation has attracted much attention towards helmet shape design. Although many cycling helmet aerodynamics assessments are reported in the scientific literature [11,12,13], no systematic study has been conducted on the aerodynamics of speed skating helmets. Racing velocity and posture differ between cycling and speed skating, leading to different criteria when conducting aerodynamic optimisations. Nevertheless, cycling gives good insight into the influence of a helmet. In cycling, it is reported that the use of a helmet can cause 19% of the total drag area of a cyclist in time-trial posture at 60 km/h or 16.6 m/s [13]. The latter suggests that also in speed skating, the helmet can provide an aerodynamic advantage to the athlete.
This paper performs an aerodynamics assessment of several helmet designs with the objective of understanding which helmet designs provides the minimum aerodynamic drag. A generic skater model is built using an open-source software, and eight configurations are investigated, including a bare-head configuration and a baseline configuration with the Omega helmet from Cádomotus.

2. Skater Geometry

The skater model was generated using the MakeHuman software [14], which allows the user to create a detailed generic 3D human shape geometry. Within the morphological options provided by MakeHuman, a male of 1.85 m height, muscle percentage of 75% and neck height of 7.41 cm were selected. The evaluated posture corresponds to the push-off recovery posture [15], characterized by, among others, the knee θ 0 and trunk θ 1 angles (Figure 1a). They were defined as θ 0 = 90 degrees and θ 1 = 15 degrees, these being the optimal ones in terms of power extraction and aerodynamic drag reduction respectively for long track discipline [15]. The mannequin was manipulated into the desired posture using the Blender software [16]. It should be noted that, for the sake of simplicity in the computational fluid dynamics (CFD) simulations, the human model is not equipped with skates.

3. Tested Helmet Designs

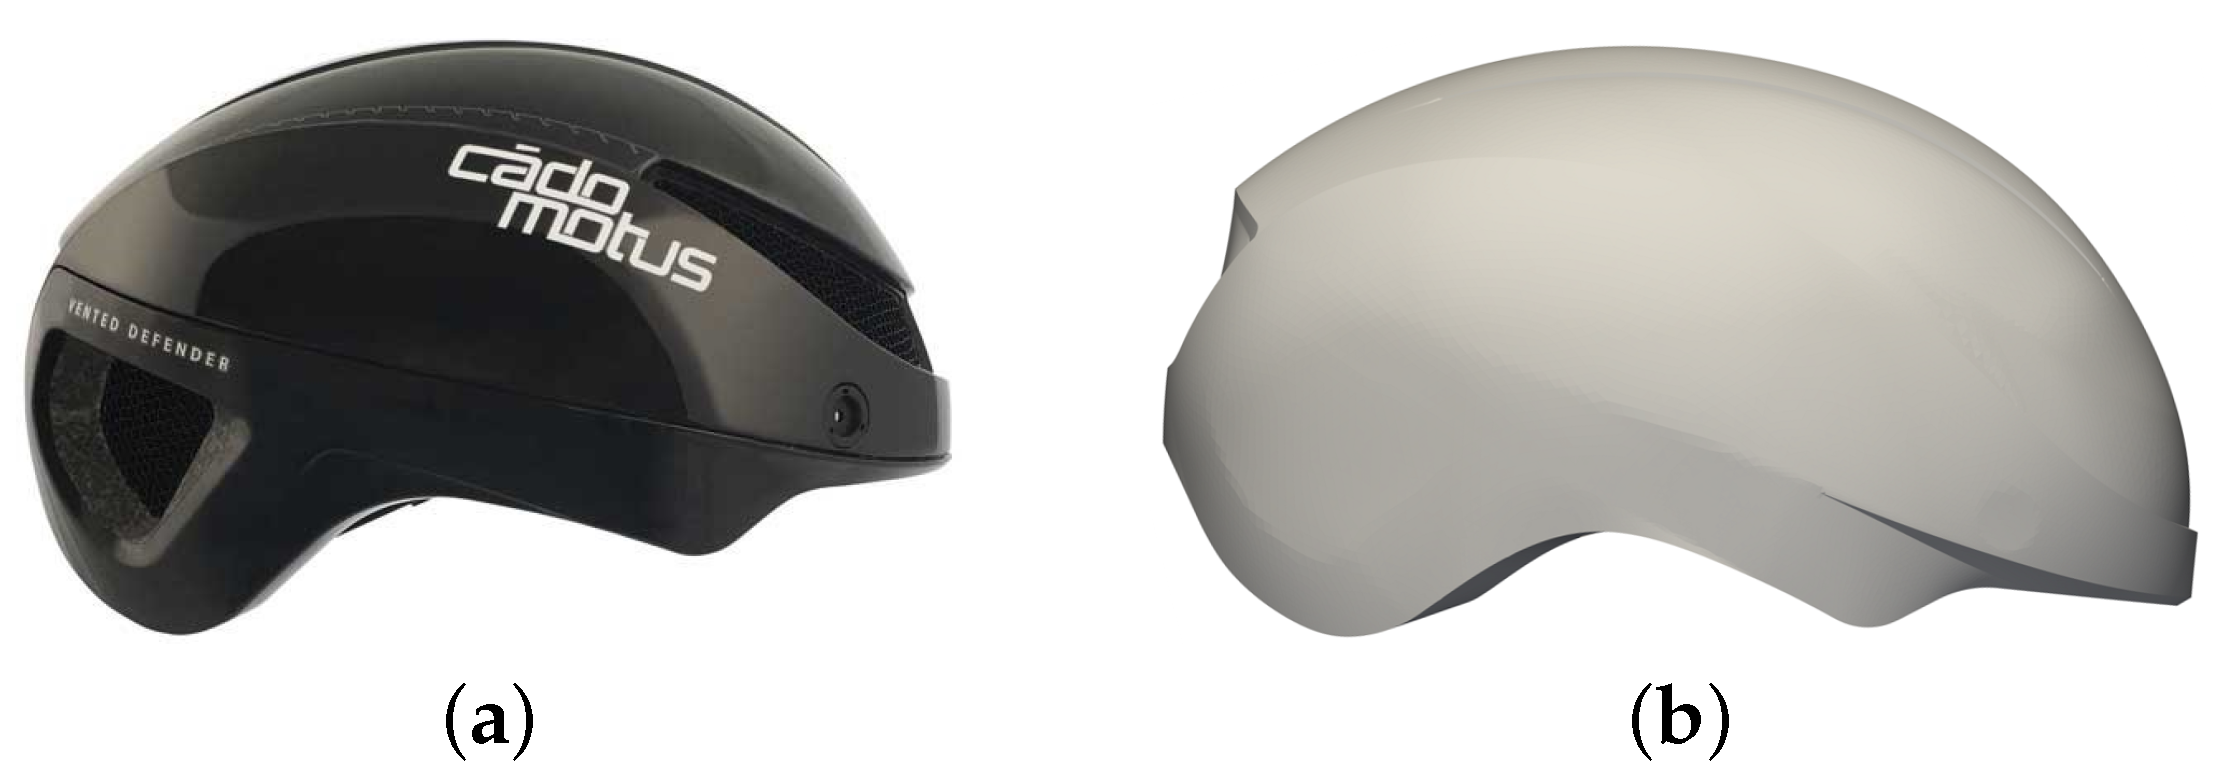
The Omega helmet from the Cádomotus company [17] was used as a benchmark, as it is illustrated in Figure 2a. The round shape and the longitudinally stretched aspect ratio are designed to fit exactly the user’s head. Its monocoque structure is composed of a hybrid honeycomb frame and expanded polystyrene foam (EPS) material, achieving a light weight and strong core. Also, the helmet is characterized by a large frontal ventilation gap and three at the back side, ensuring a proper head climatic control. Moreover, it features four longitudinal steps that travel from the frontal to the rearmost ventilation hollows. Its lateral shape aims to provide extra safety by protecting the temporo-sphenoidal and after temporo-parietal regions of the head. The baseline helmet model was obtained from the actual Omega design by applying several geometrical simplifications to guarantee the convergence of the numerical simulations, see in Figure 2b. The simplifications implied closing every external frontal and back ventilation hollows by performing tangential extensions of the adjacent surfaces using the Catia software, as well as the interiors, since no internal flow between head and helmet was assumed.
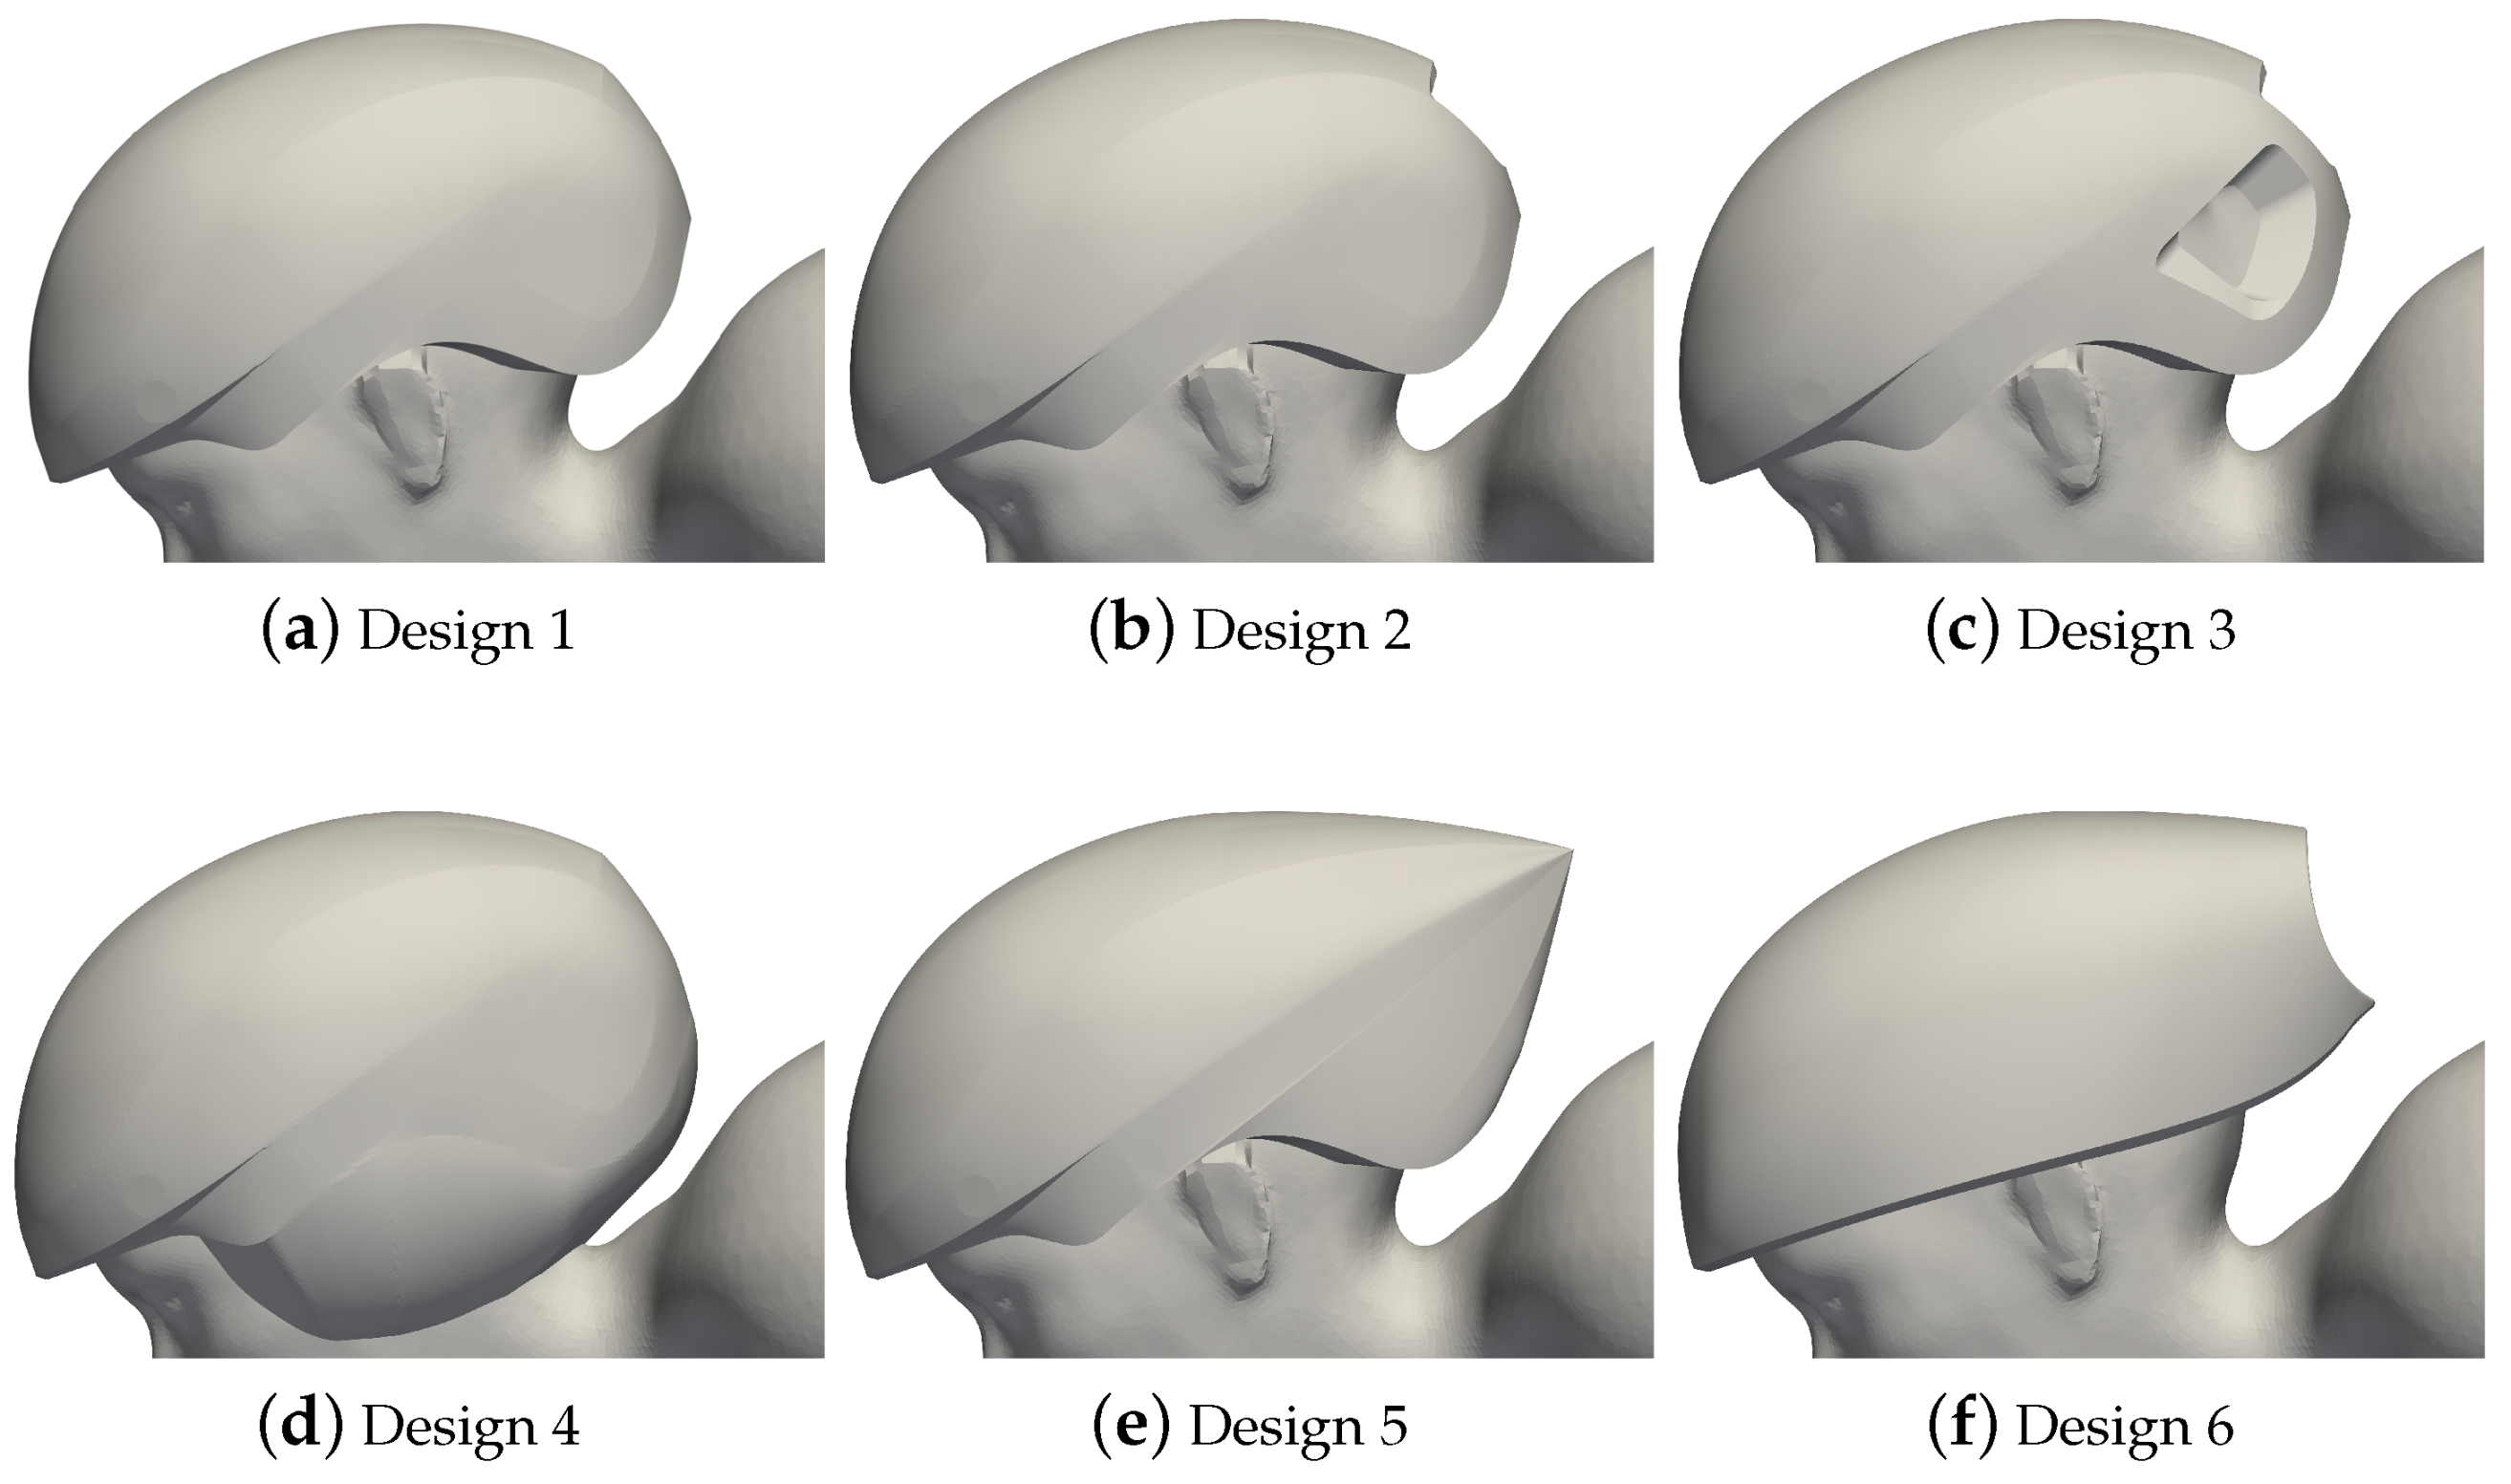
Figure 3 gathers the six extra helmets simulated within this study. Each design targeted a different purpose. Design 1 consisted of the same geometry as Omega, but applying an extra surface smoothing by removing every step in the surface. Design 2 aimed to analyse the influence of the back ventilation hollow over design 1. The goal of design 3 was to test the influence of the lateral ventilation openings over design 2. Design 4 added a solution to cover the ears and occipital over design 1, obtaining a more spherical shape. The purpose of design 5 was to increase the radius of curvature of the back side over design 1. Finally, design 6 went through several adjustments at once. It provided a smoother surface over design 5, reduced slightly its width, eliminated both temporo-sphenoidal and after temporo-parietal protections and implemented a concave truncation to the trailing edge.

4. Numerical Simulations

4.1. Fluid Domain

A full-scaled skater and helmets were considered. Inspired by 2D airfoil aerodynamics CFD simulations [18] and adjusted to sports aerodynamics field, the fluid domain consisted of a quarter-sphere and semi-cylinder, providing a meshing element reduction compared to a conventional prismatic domain [19,20,21], as seen in Figure 4. The domain size was defined based on the parameters a, b, c and L (see Figure 4b), with a = 10, b = c = 5 and L = 1.1 m being the distance between the most upstream and downstream points of the skater projected on the horizontal plane. These dimensions were based on prior CFD analysis, with the same turbulence model for cycling and downhill skateboarding aerodynamics [19,22]. The maximum blockage ratio was 0.65%, being lower than the threshold maximum 3% [23]. It has to be noted that the left foot of the skater is placed at a distance of 6.5 cm from the ground, being this the height of the blade of a professional clap-skate.

4.2. Domain Discretization

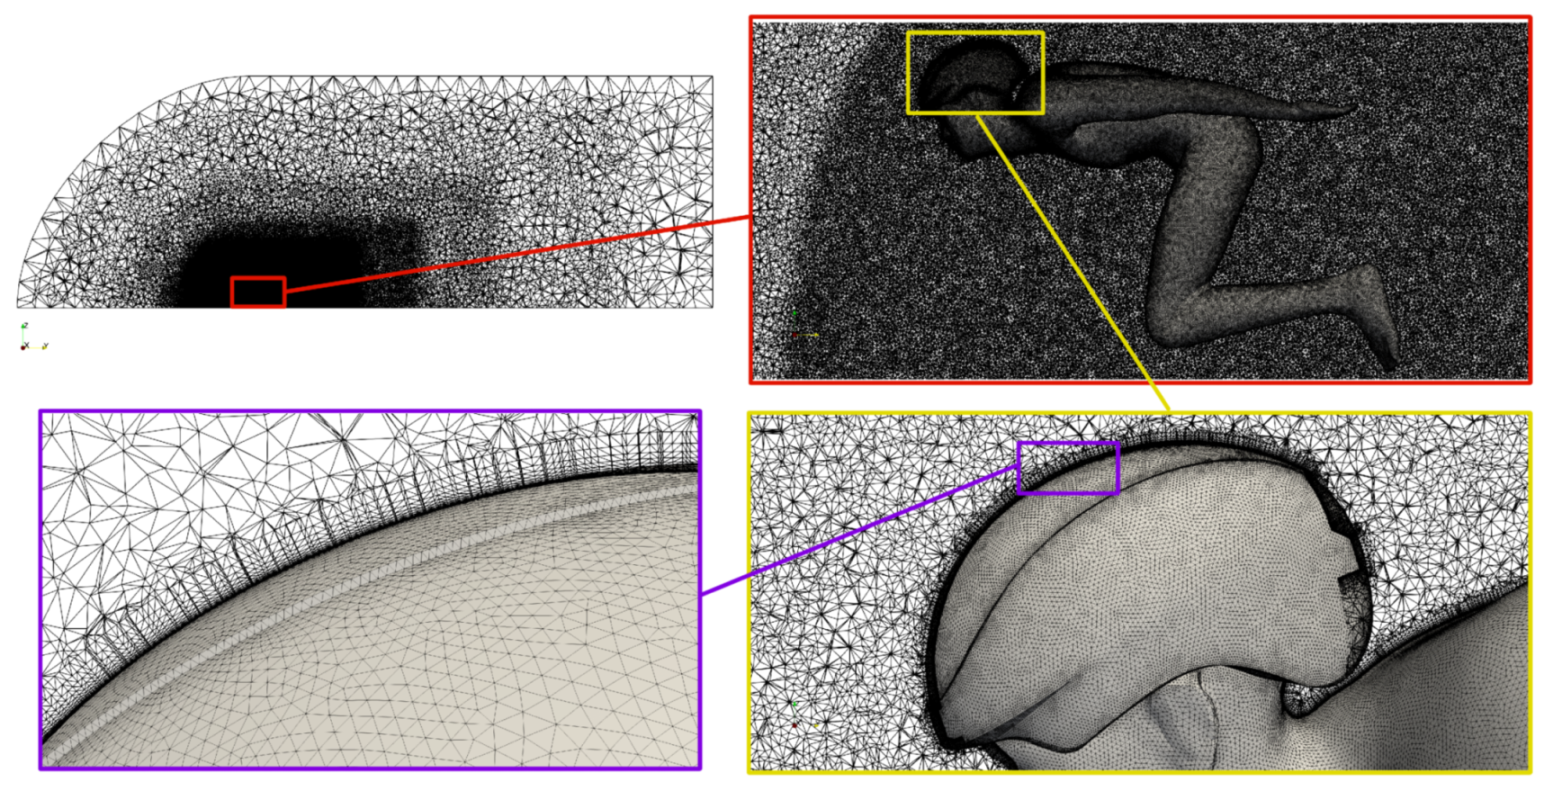
The discretization was performed with the Ansys Fluent software with the meshing mode option activated. A scheme (.scm) code was generated in order to automatize the volume domain meshing process. This code was fed with two separate files: a .stl file containing the external geometries of the refinement regions or bodies of influence (BOI) and a .msh file containing surface mesh of the domain exterior and skater geometry. A thorough grid sensitivity study was performed as part of the verification assessment for the bare-head case. Four grid densities (18, 21, 34 and 51 million elements) were tested monitoring total drag of the skater, mesh quality in terms of skewness and mean flow velocity profiles at several x and y direction rakes around the skater. All the previously mentioned parameters suffered minimal variations when the mesh was refined to 34 million elements. In particular, the 34 million element count simulation grid ensured a mesh average skewness quality [24] indicator of 0.21, which lies in the range (0, 0.25), which is indicative of excellent mesh quality [25]. A simulation with a larger number of elements (51 million element mesh) resulted in a variation of the skater’s C D of 0.45%, thus allowing one to conclude that mesh independence has been reached with 34 million elements. A total number of five bodies of influence or refinement volumes where strategically placed around the skater so as to reduce the number of meshing elements, as seen in Figure 4a. An unstructured discretization of tetrahedral elements was established with a global maximum, minimum element size and growth rates of 500 mm, 0.75 mm and 1.2 were defined respectively. The element sizes of the five bodies of influence were 250 mm, 140 mm, 70 mm, 20 mm and 10 mm, counting from outermost to closest to the skater respectively (Figure 5 top-left). A skater/helmet surface maximum, minimum element size and growth rates of 3 mm, 0.75 mm and 1.2, respectively, were selected. An extra refinement was applied to the skater/helmet near wall region, ensuring a correct application of the turbulence model [26]. This requirement was essential to resolve the viscous sublayer and buffer layer, correctly reproducing the nature of the boundary layer. Then, a prismatic inflation layer mesh of 15 layers with a growth rate of 1.4 [27] was implemented. The first node height was set at 0.02 mm. This configuration ensures a y + < 1.23 along the whole surface of the skater/helmet. Figure 5 illustrates the previously described mesh in the median-plane of the fluid domain.

4.3. Boundary Conditions

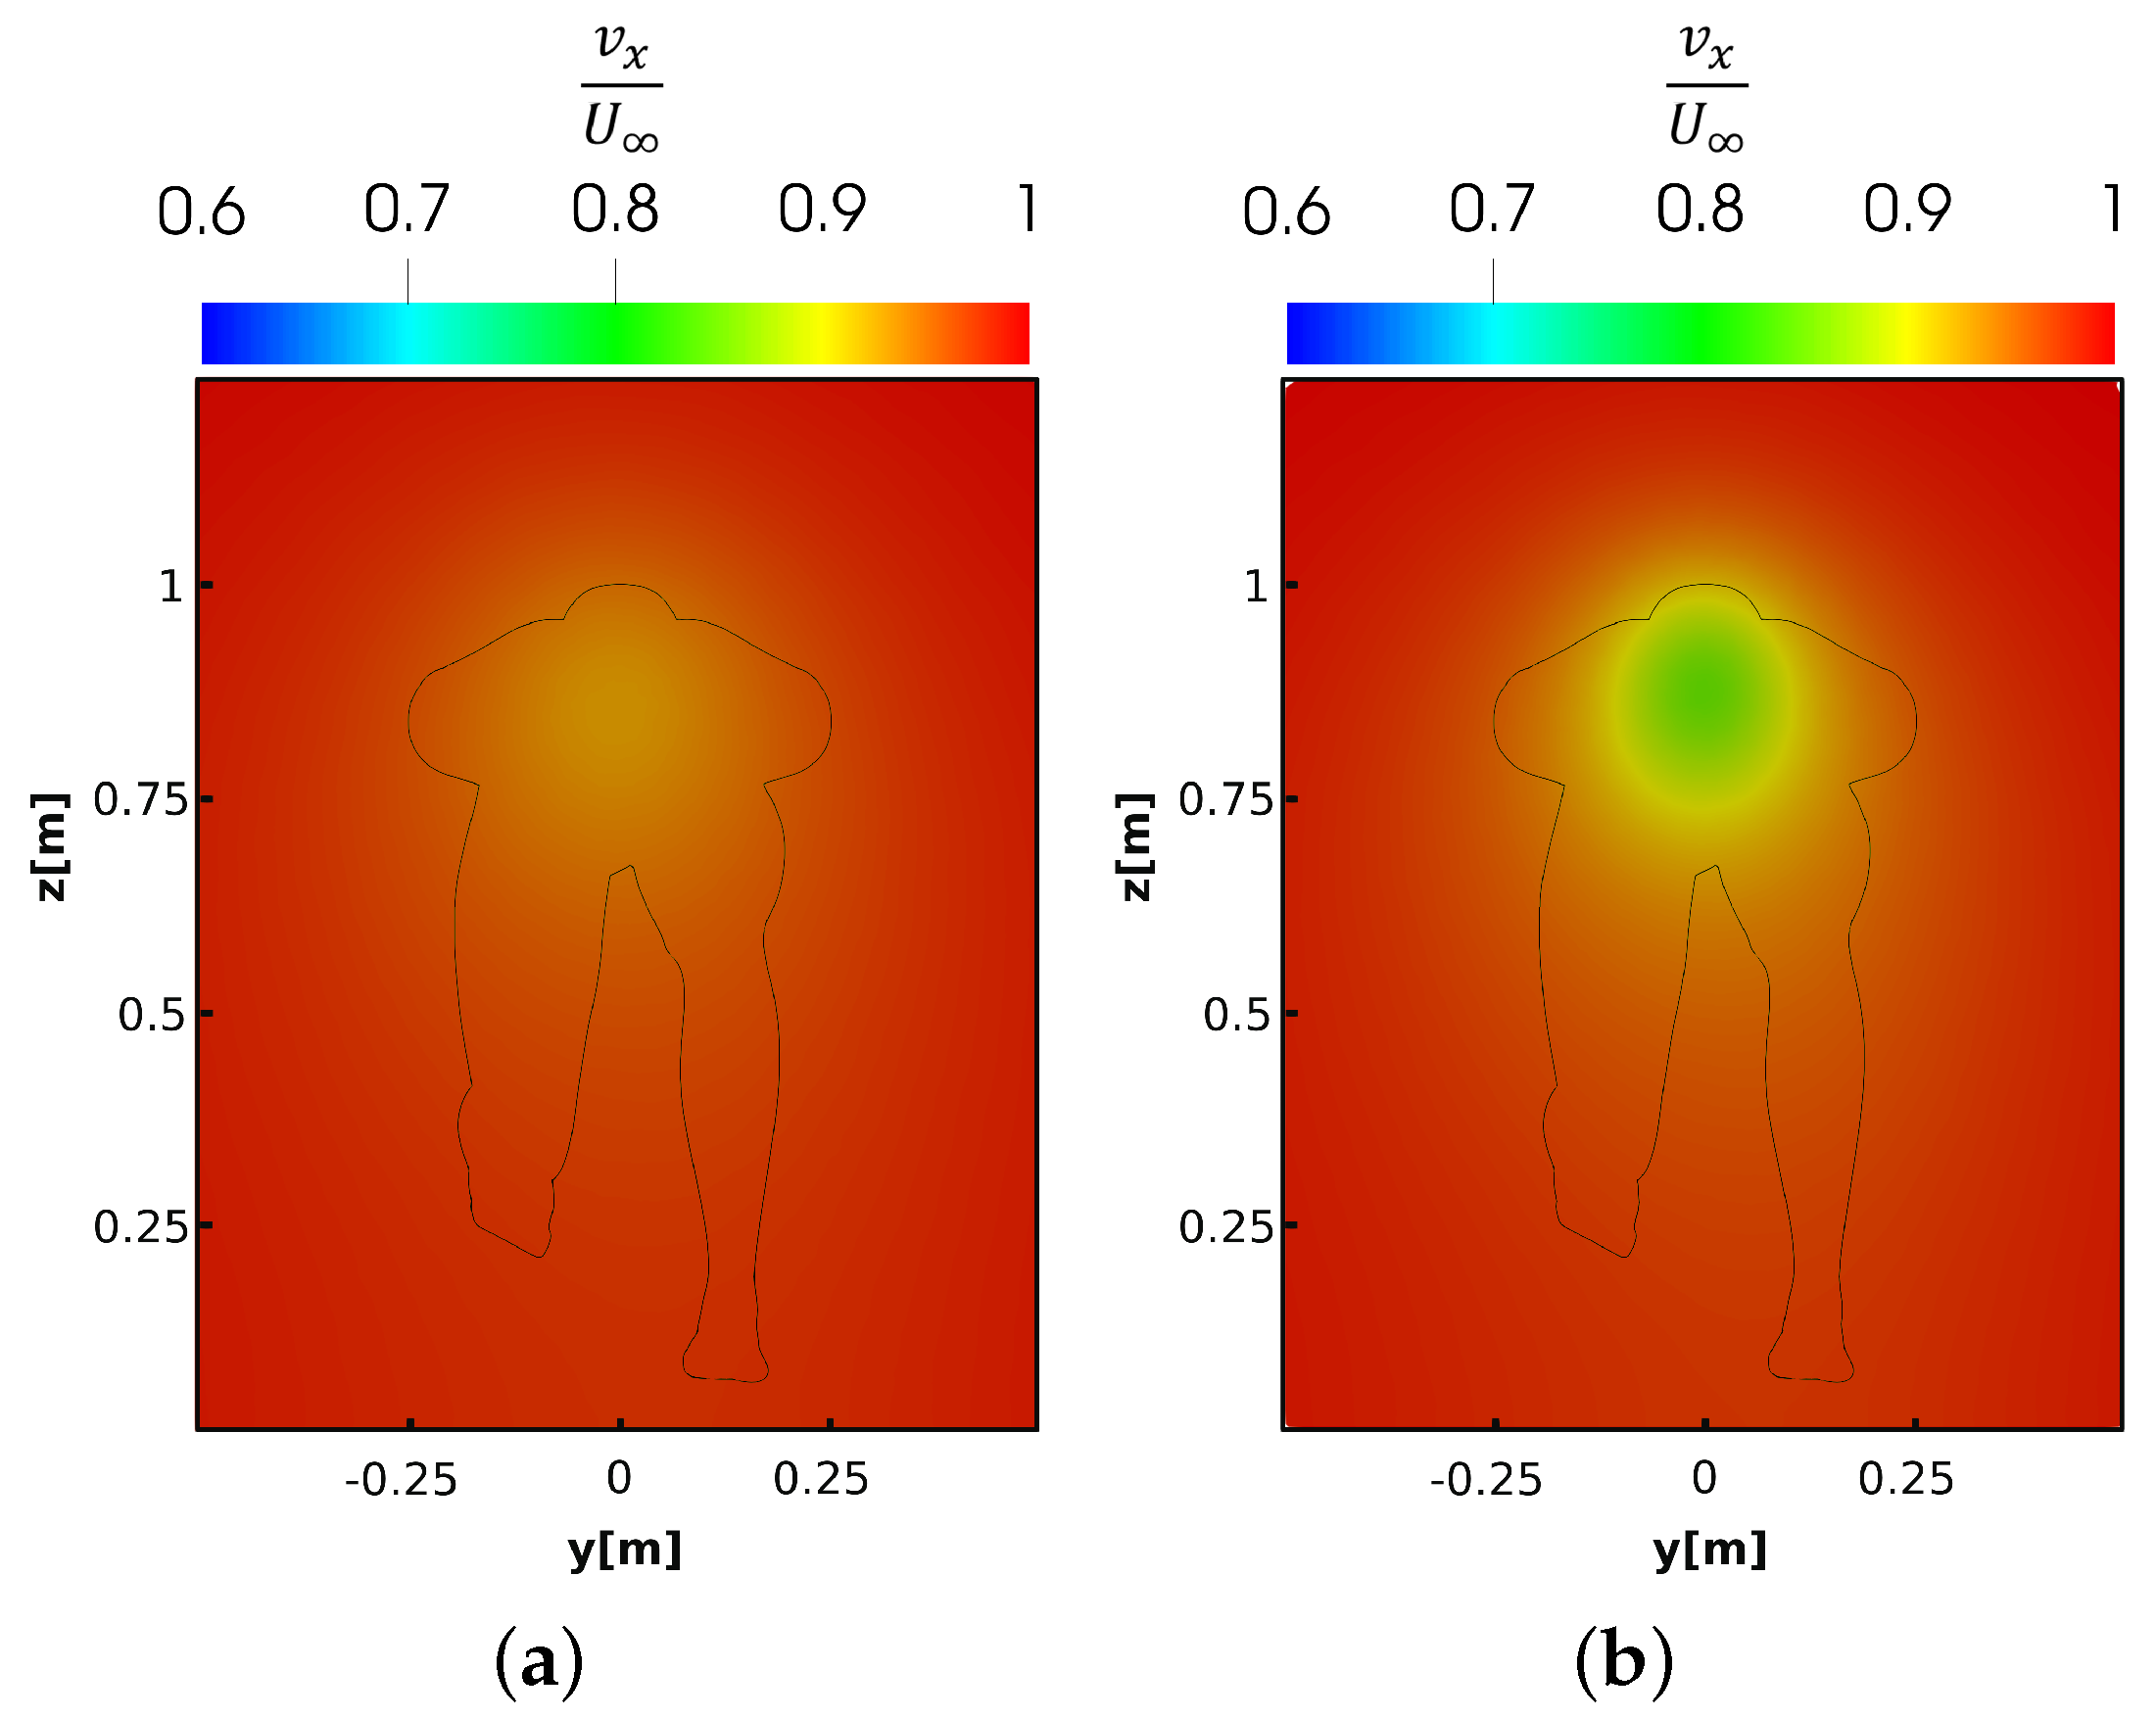
At the inlet face, a uniform streamwise 15 m/s velocity was defined, corresponding to R e = 1.1 × 10 6 based on L = 1.1 m (distance between horizontal projection of the most upstream and downstream points of the skater), with a turbulence intensity of 0.02% [20] and turbulent viscosity ratio of 10. The outlet face was defined as outflow with a flow rate weighting equal to 1 [26]. The skater and helmet surfaces were set as smooth no-slip walls, since the skater is assumed to be a fixed observer with respect to the free stream. Both ground and side faces were defined as symmetry, ensuring zero flux of all quantities across those faces. The above-mentioned faces are illustrated in Figure 4a. Reference density, temperature and pressure of 1.225 kg/ m 3 , 15 °C and 101,325 Pa were considered in the simulation, respectively. Figure 6 shows what the flow upstream of the skater looks like a consequence of the application of the aforementioned boundary conditions. At the plane 0.20 m upstream of the skater, the velocity features only minor disturbances due to the presence of the model, resulting in a velocity reduction of less than 10% with respect to the free-stream value. Instead, 0.10 m upstream of the skater, the velocity reduction in front of the skater’s head reaches 20% of the free-stream value.

4.4. Solver Settings

The simulations were performed with the Ansys Fluent software. The two-equation turbulence model Menter shear stress transport (SST) k ω was used to solve the 3D RANS equations [28]. This is a hybrid model that blends the k ϵ model far in the free stream with k ω near the wall. Low Reynolds number modelling was used as a boundary-layer modelling approach. This configuration was selected since it showed the best comparison with experimental results in similar cycling CFD assessments [22]. A pressure-based solver with coupled scheme was chosen in this methodology, since the coupled scheme exhibits better convergence performance [26]. Regarding the spatial discretization schemes, first order upwind schemes were defined for both turbulent kinetic energy and dissipation rate in order to promote convergence and increase the simulation speed [24]. On the other hand, pressure and momentum were discretized with a second order upwind scheme to reduce numerical discretization error due to grid misalignment. Gradients and derivatives were evaluated as least squared cell based gradients. In order to analyze the convergence of the simulations, the total drag of the skater, residuals and total pressure of the flow at strategic points around the skater were monitored. From the iteration of 200 onward, all the monitored parameters tended to stabilize. Moreover, residuals of the order of 10 3 for continuity, k and ω equations and 10 5 for x, y and z components of the momentum equation were ensured. Hence, it was concluded that the total number of 1000 iterations was sufficient to guarantee the convergence of the simulation results. Results were obtained by activating a data sampling option for the last 800 iteration, thus, averaging all the parameters for the last 800 iterations. The results presented some numerical instabilities along the averaged iterations; therefore, an uncertainty interval for the skater’s total drag coefficient was computed in terms of standard deviation. A coverage factor of k = 2 (providing a confidence level of 95%) and 50 uncorrelated samples over the 800 iterations gave an uncertainty of 0.39% of the total C D of each simulation [29].

4.5. Drag Coefficient Breakdown

The drag force is the composition of the integration of static pressure and shear stress distributions over the surface of a body in the free stream velocity direction, as indicated below [30]:
C D = 2 ρ U 2 A S n x p d S C P + 2 ρ U 2 A S t x τ w d S C f
where p is the pressure distribution at the surface, n x is the normal vector to the surface projected into free stream direction (positive when directed outwards with respect to the surface), t x is the tangential vector to the surface projected into free stream direction and τ w is the shear stress distribution acting over the surface, S is the skater’s exterior surface, A is the skater’s frontal area, ρ and U 2 are the free stream density and velocity, respectively.
As is typical in sports aerodynamics [13], the drag area A C D is also evaluated.

4.6. Time Gain Calculation

An estimation of the time gain a skater would achieve wearing each helmet in a long track 1500 m event was computed. Assuming that the skater moves at constant velocity only on a straight horizontal path, and that the mechanical power is dissipated by the aerodynamic drag and the friction between skates and ice, the expression of the skater’s mechanical power reads as:
P = 1 2 ρ V 3 A C D + m g V C f , i c e
where C f , i c e = 00.46 is the friction coefficient between ice and skate in straight phase [31], m = 85 kg is the skater’s mass, ρ = 1.225 kg/ m 3 is the density of the air and g = 9.81 m/ s 2 is the acceleration of gravity. Assuming the skater’s velocity equal to V = 14.97 m/s (average velocity of the Dutch skater Kjeld Nuis during the 1500 m world record, evaluated as racing distance divided by the racing time t 0 = 1:40.176 s [32]), the skater’s power output P can be computed. Then, by assuming that the power output remains constant, and that the drag area of the skater is reduced to A C D i by the application of the i-th helmet design, the new skater’s velocity V i can be obtained from:
P = 1 2 ρ V i 3 A C D i + m g V i C f , i c e
Finally, the new racing time t i is computed as:
t i = d V i
being d = 1500 m the racing distance. From t i , the gain is obtained as Δ t = t i t 0 .

5. Wind Tunnel Measurements

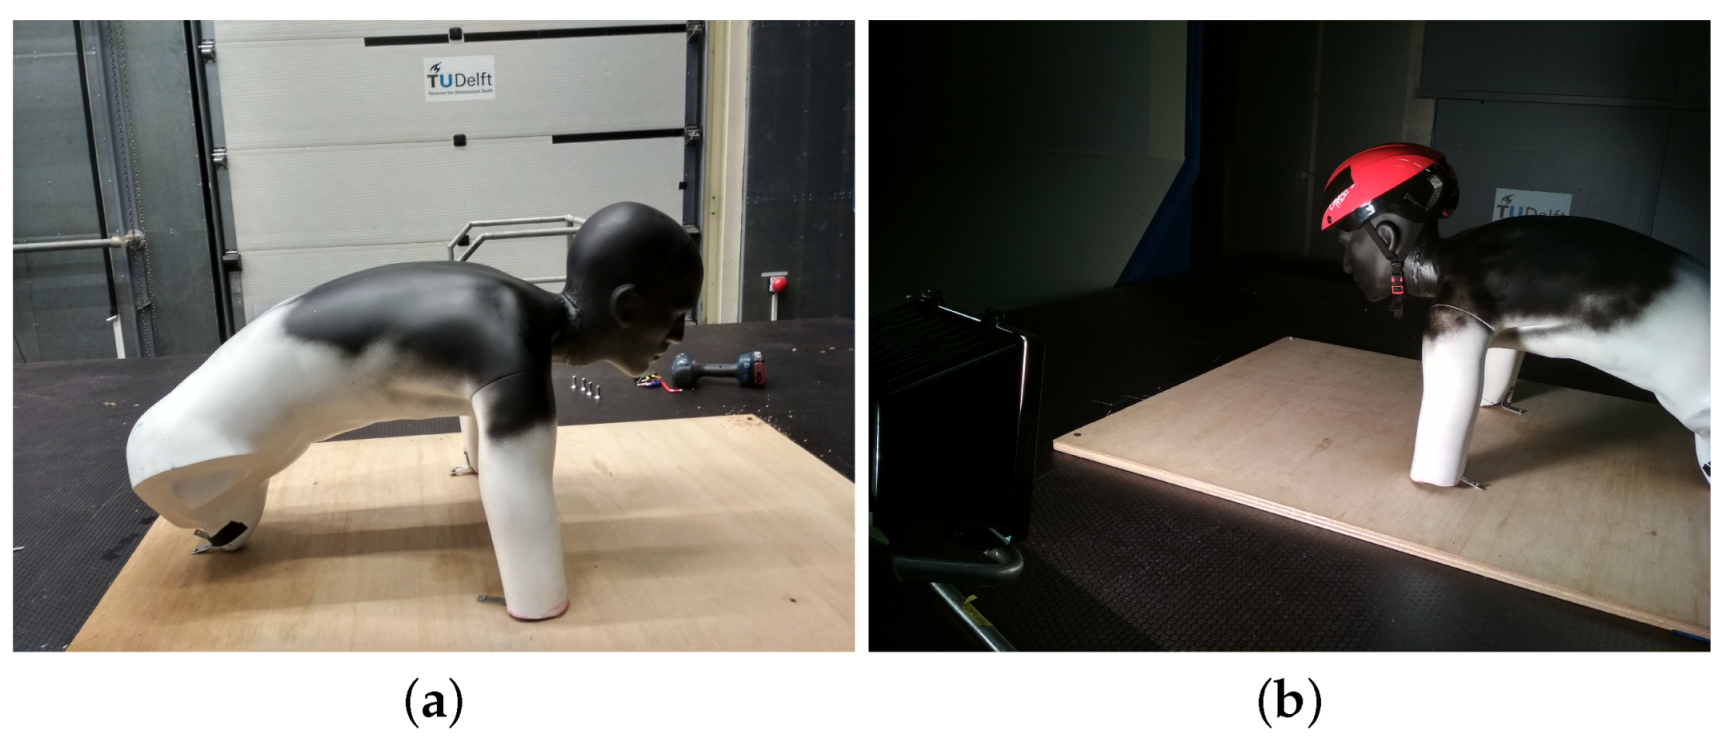
Wind tunnel measurements were performed with a skating mannequin in the Open Jet Facility of the Aerodynamics Laboratories of TU Delft. The measurements were conducted at 15 m/s free-stream velocity for both the bare-head case as for the Omega helmet case (notice that the other helmets were not manufactured, hence no wind tunnel measurements with those could be performed). However, it should be noticed that the mannequin represented only the upper body, and not the full body, of the skater, as seen in Figure 7.
Infrared thermography measurements were conducted on the head and helmet of the mannequin to determine the location of the separation line with and without the helmet. The camera OP PI-640 of the company Optris Infrared Thermometers was used. The camera was located at Δ x = 0 m, Δ y = −1.5 m and Δ z = 0.15 m taking the skater’s head as the reference point. The recording was performed in wind-off conditions (null free-stream velocity), as well as at 15 m/s free-stream velocity. Each recording retrieved 50 frames that were averaged to attenuate the noise in the data. By computing the difference in the averaged recorded data between 0 m/s and 15 m/s cases, the convection of the flow over the mannequin surface was captured.
Force balance measurements were conducted to evaluate the drag reduction between Omega helmet and bare-head configurations. As the experimental model differed from the numerical model, the comparison was carried out based on the relative results with respect to bare-head configuration of each case (numerical or experimental). A six component balance designed, manufactured and calibrated by the Dutch Aerospace Laboratory was used [33]. It was able to measure loads up to 250 N in the streamwise direction with an uncertainty of 0.06% of the full scale value [33]. The balance was placed under a ground plate that was shielded from the air stream.

6. Results and Discussions

6.1. Skater’s Flow Topology

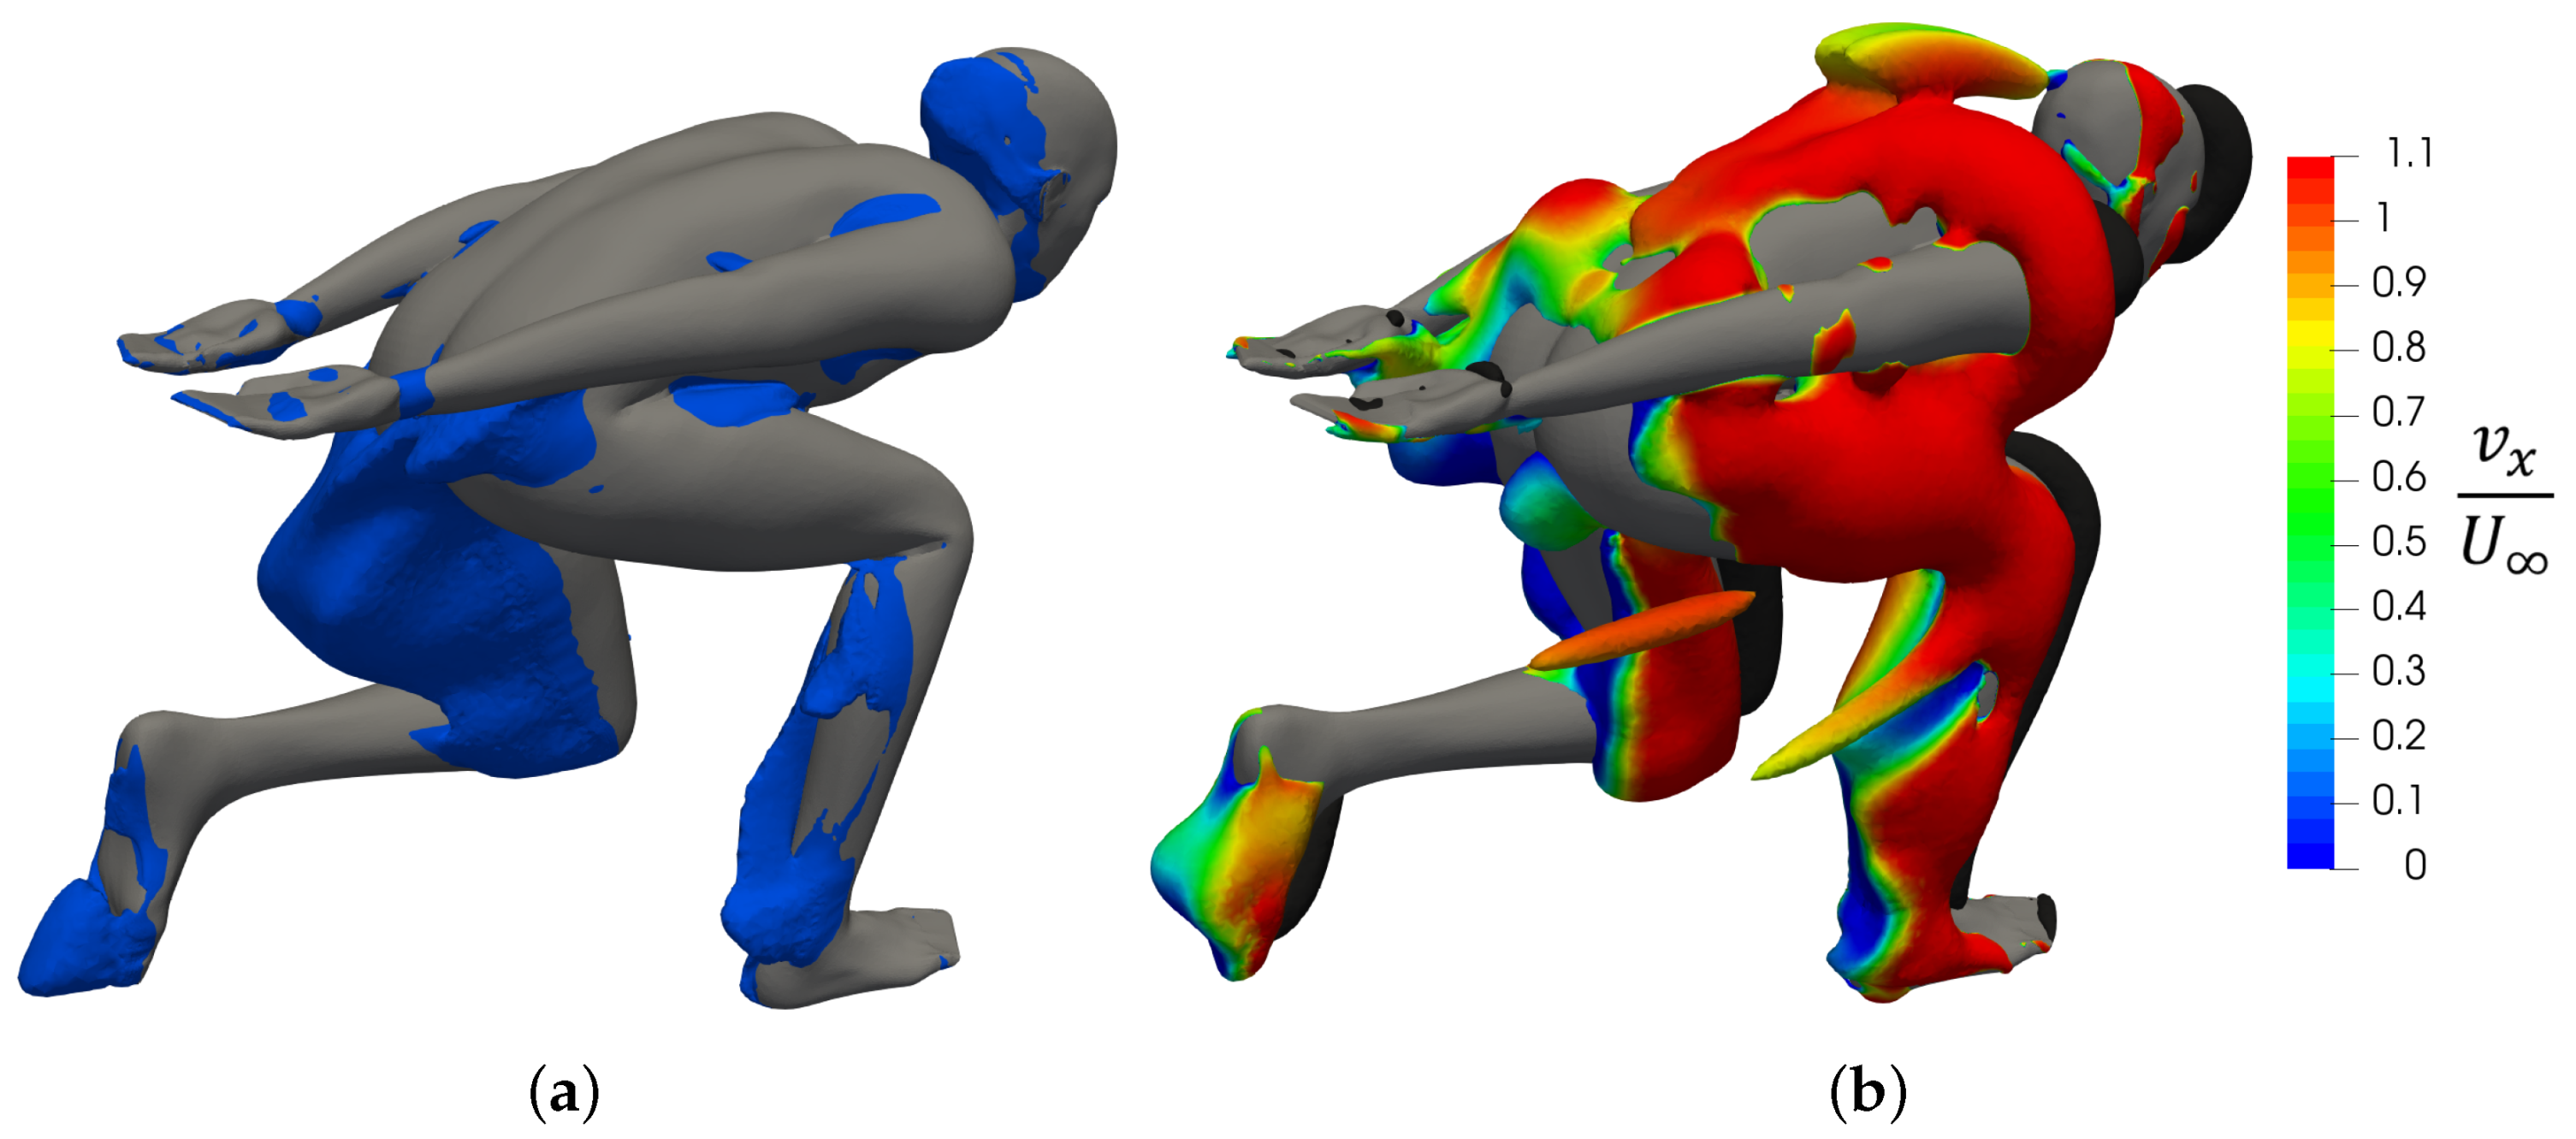
Figure 8a illustrates zero streamwise velocity regions around the skater without helmet. The size and shape of the recirculation regions can be visualized, in particular downstream the upper left leg, the lower right leg, the occipital and the ears.
Pressure coefficient C p iso-surface is shown in Figure 8b, in order to visualize the suction generated by the head. In black, positive pressure ( C p = 0.55) is visualized to identify the stagnation regions in front of the head, the shoulders and the legs. The negative pressure ( C p = −0.3) is color-coded by the streamwise velocity component to allow differentiating the natural acceleration of the flow around a curved surface (in red) and the boundary layer separation (blue–green–yellow). Large suction appears downstream the occipital, ears, upper left leg, lower right leg and left sole. It has to be noted that a large low pressure stream emerges from the head, as a consequence of the boundary layer separation at the upper head side.
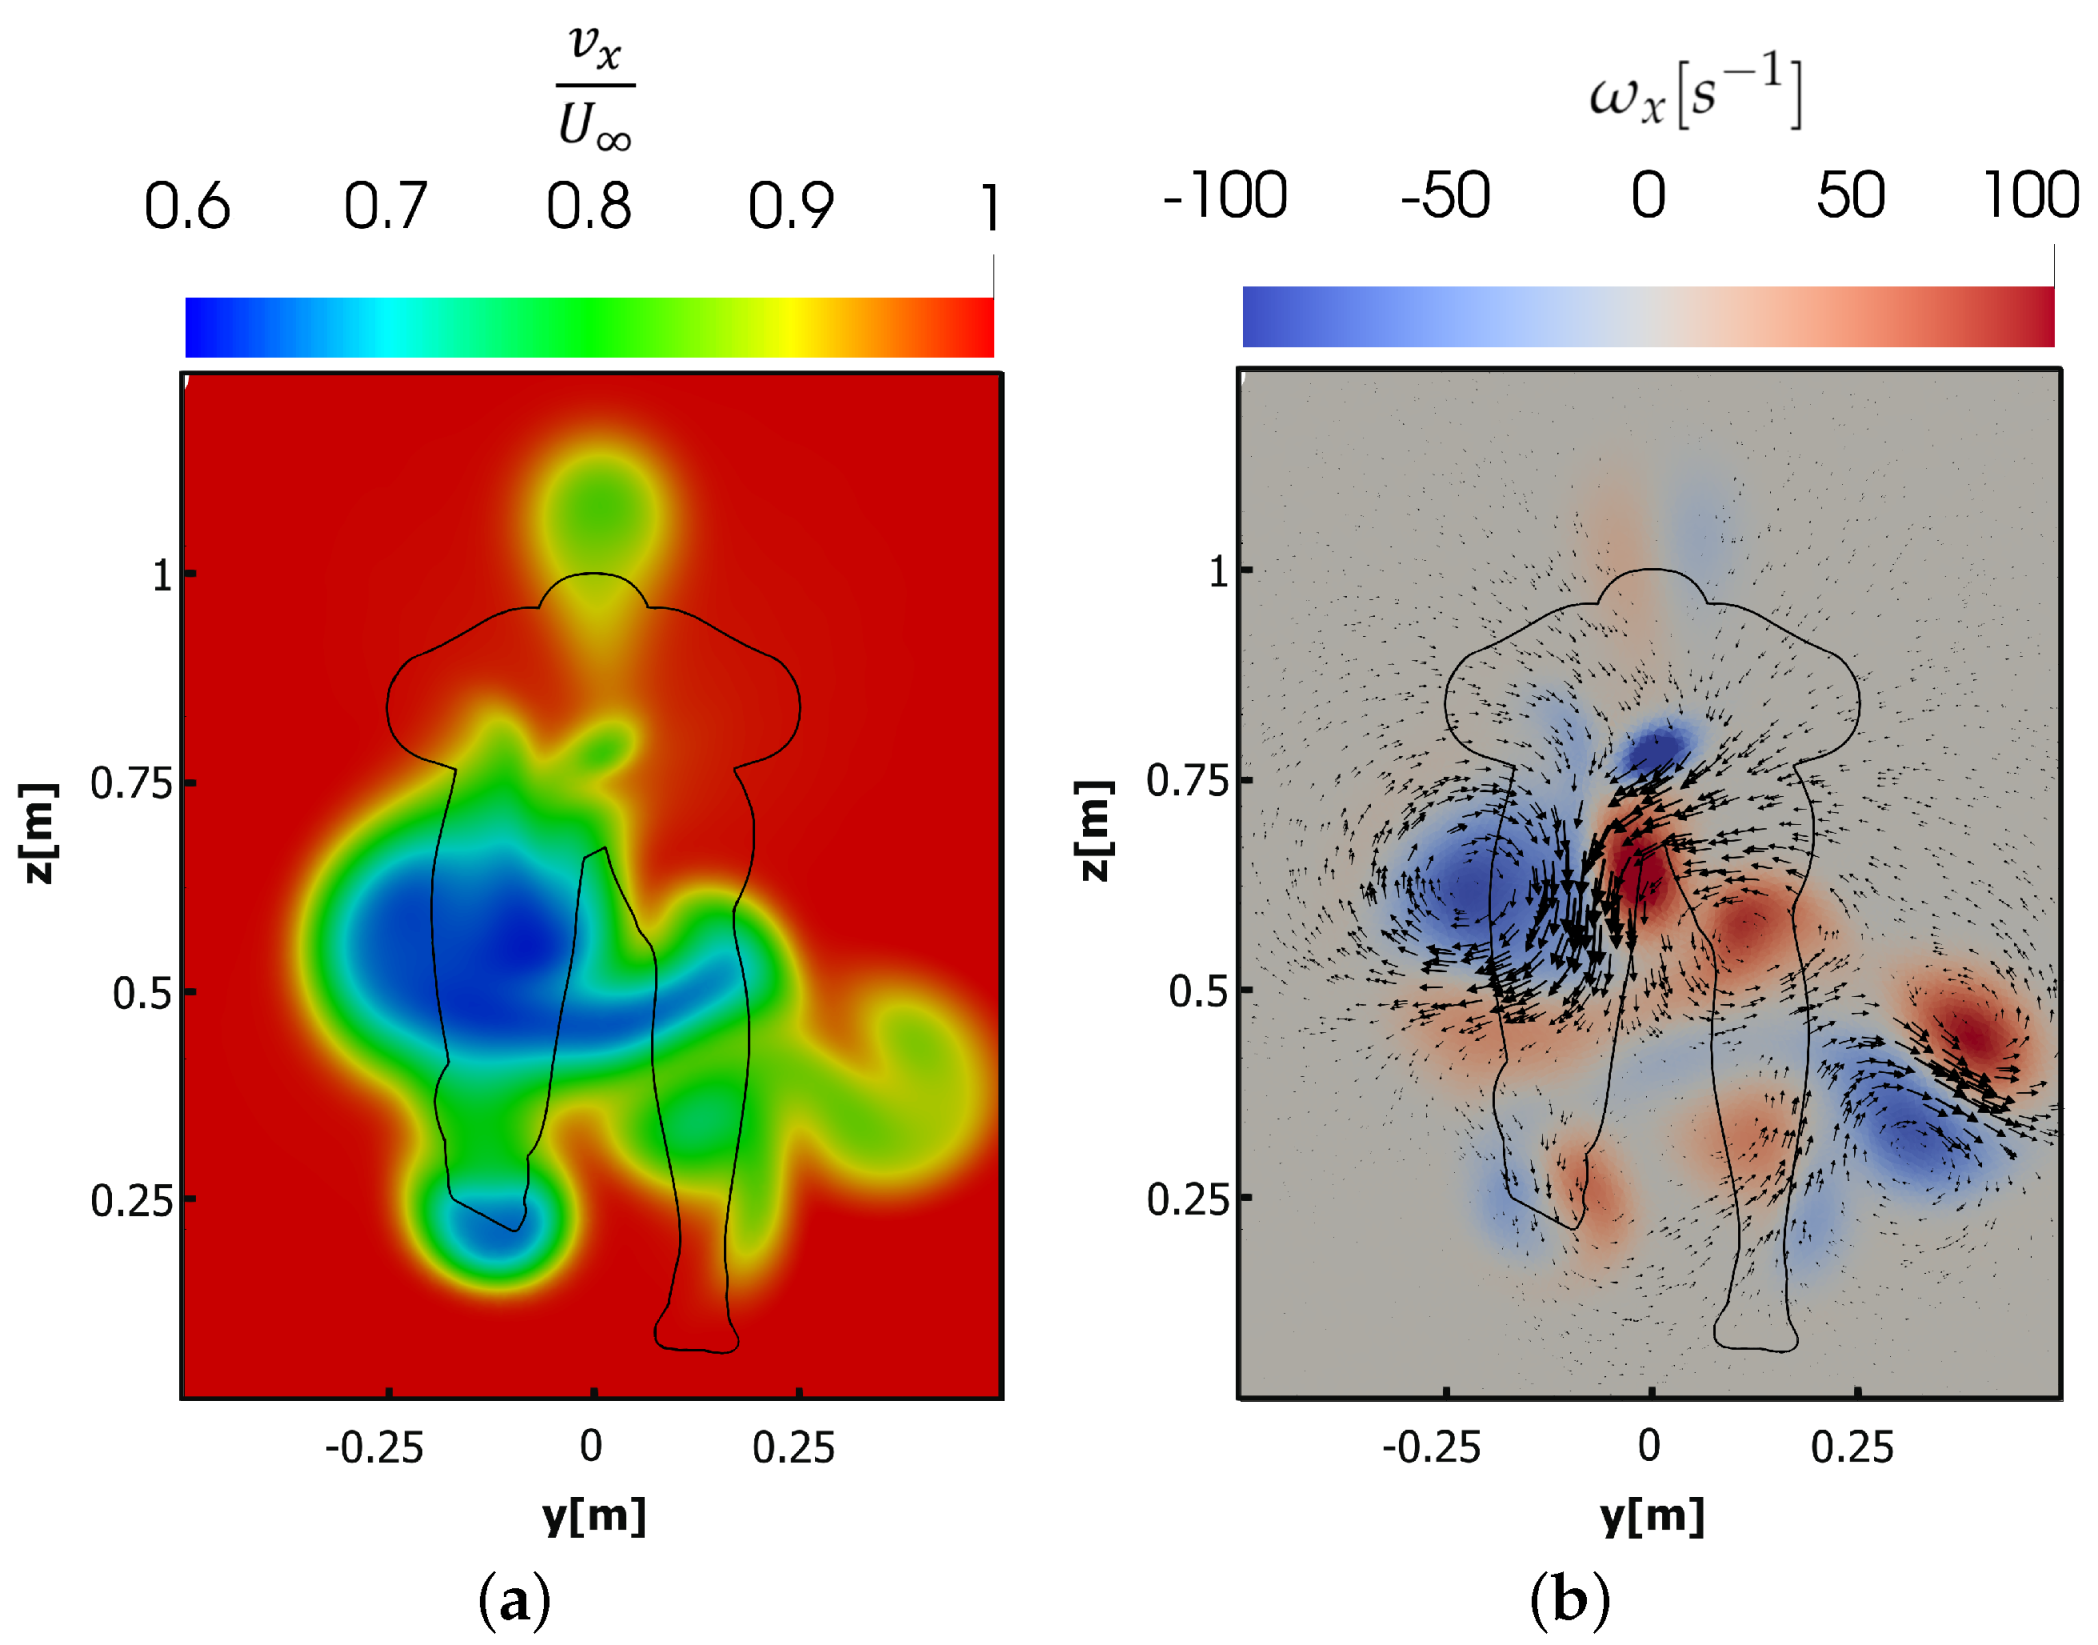
Besides, the flow topology in the wake of the skater is discussed in the form of spatial distribution of streamwise velocity (Figure 9) and vorticity with velocity field vectors. The vertical plane was located at x 0.85 distance downstream from the lower back of the model. The lateral asymmetry of both velocity and vorticity fields originate from the asymmetric posture of the mannequin. The streamwise velocity contour exhibits four main regions of relevant velocity deficit (Figure 9a). The first two are located behind the upper left leg ( z 0.5 m & y 0.125 m) and the left foot ( z 0.25 m & y 0.125 m), featuring a minimum velocity of v x / U 0.6 . The first one has a larger area, as the frontal area of the upper left leg is significantly larger. The remaining two regions characterized by velocity deficit are located behind the head ( z 1 m & y 0 m) and the lower right leg ( z 0.4 m & y 0.125 m) and feature a velocity of v x / U 0.8 . The velocity is higher in these last regions as the corresponding body segments are located more upstream from the evaluated vertical plane. A dominant region of strong downwash downstream of the upper left leg ( z 0.5 m & y 0.125 m) is identified in Figure 9b, with a peak vertical velocity of v z / U 0.4 . The absolute value is higher than the one observed in cycling ( v z / U 0.17 at x 0.8 from the bike saddle) [33]. This downwash occurs in the middle of a counter rotating streamwise vortex pair that is characteristic also for the flow across a cyclist [34]. Moreover, it has to be noted that a weaker counter-rotating vortex pair is originated behind the head ( z 1 m & y 0 m), indicating a weak upwash trend.

6.2. Drag for the Bare-Head Case

Table 1 presents both the total aerodynamic drag and the breakdown in terms of static pressure and friction of the bare head skater configuration. It is shown that the static pressure is the main contributor to the total drag of the skater, which is typical for bluff bodies at similar Reynolds numbers [35].
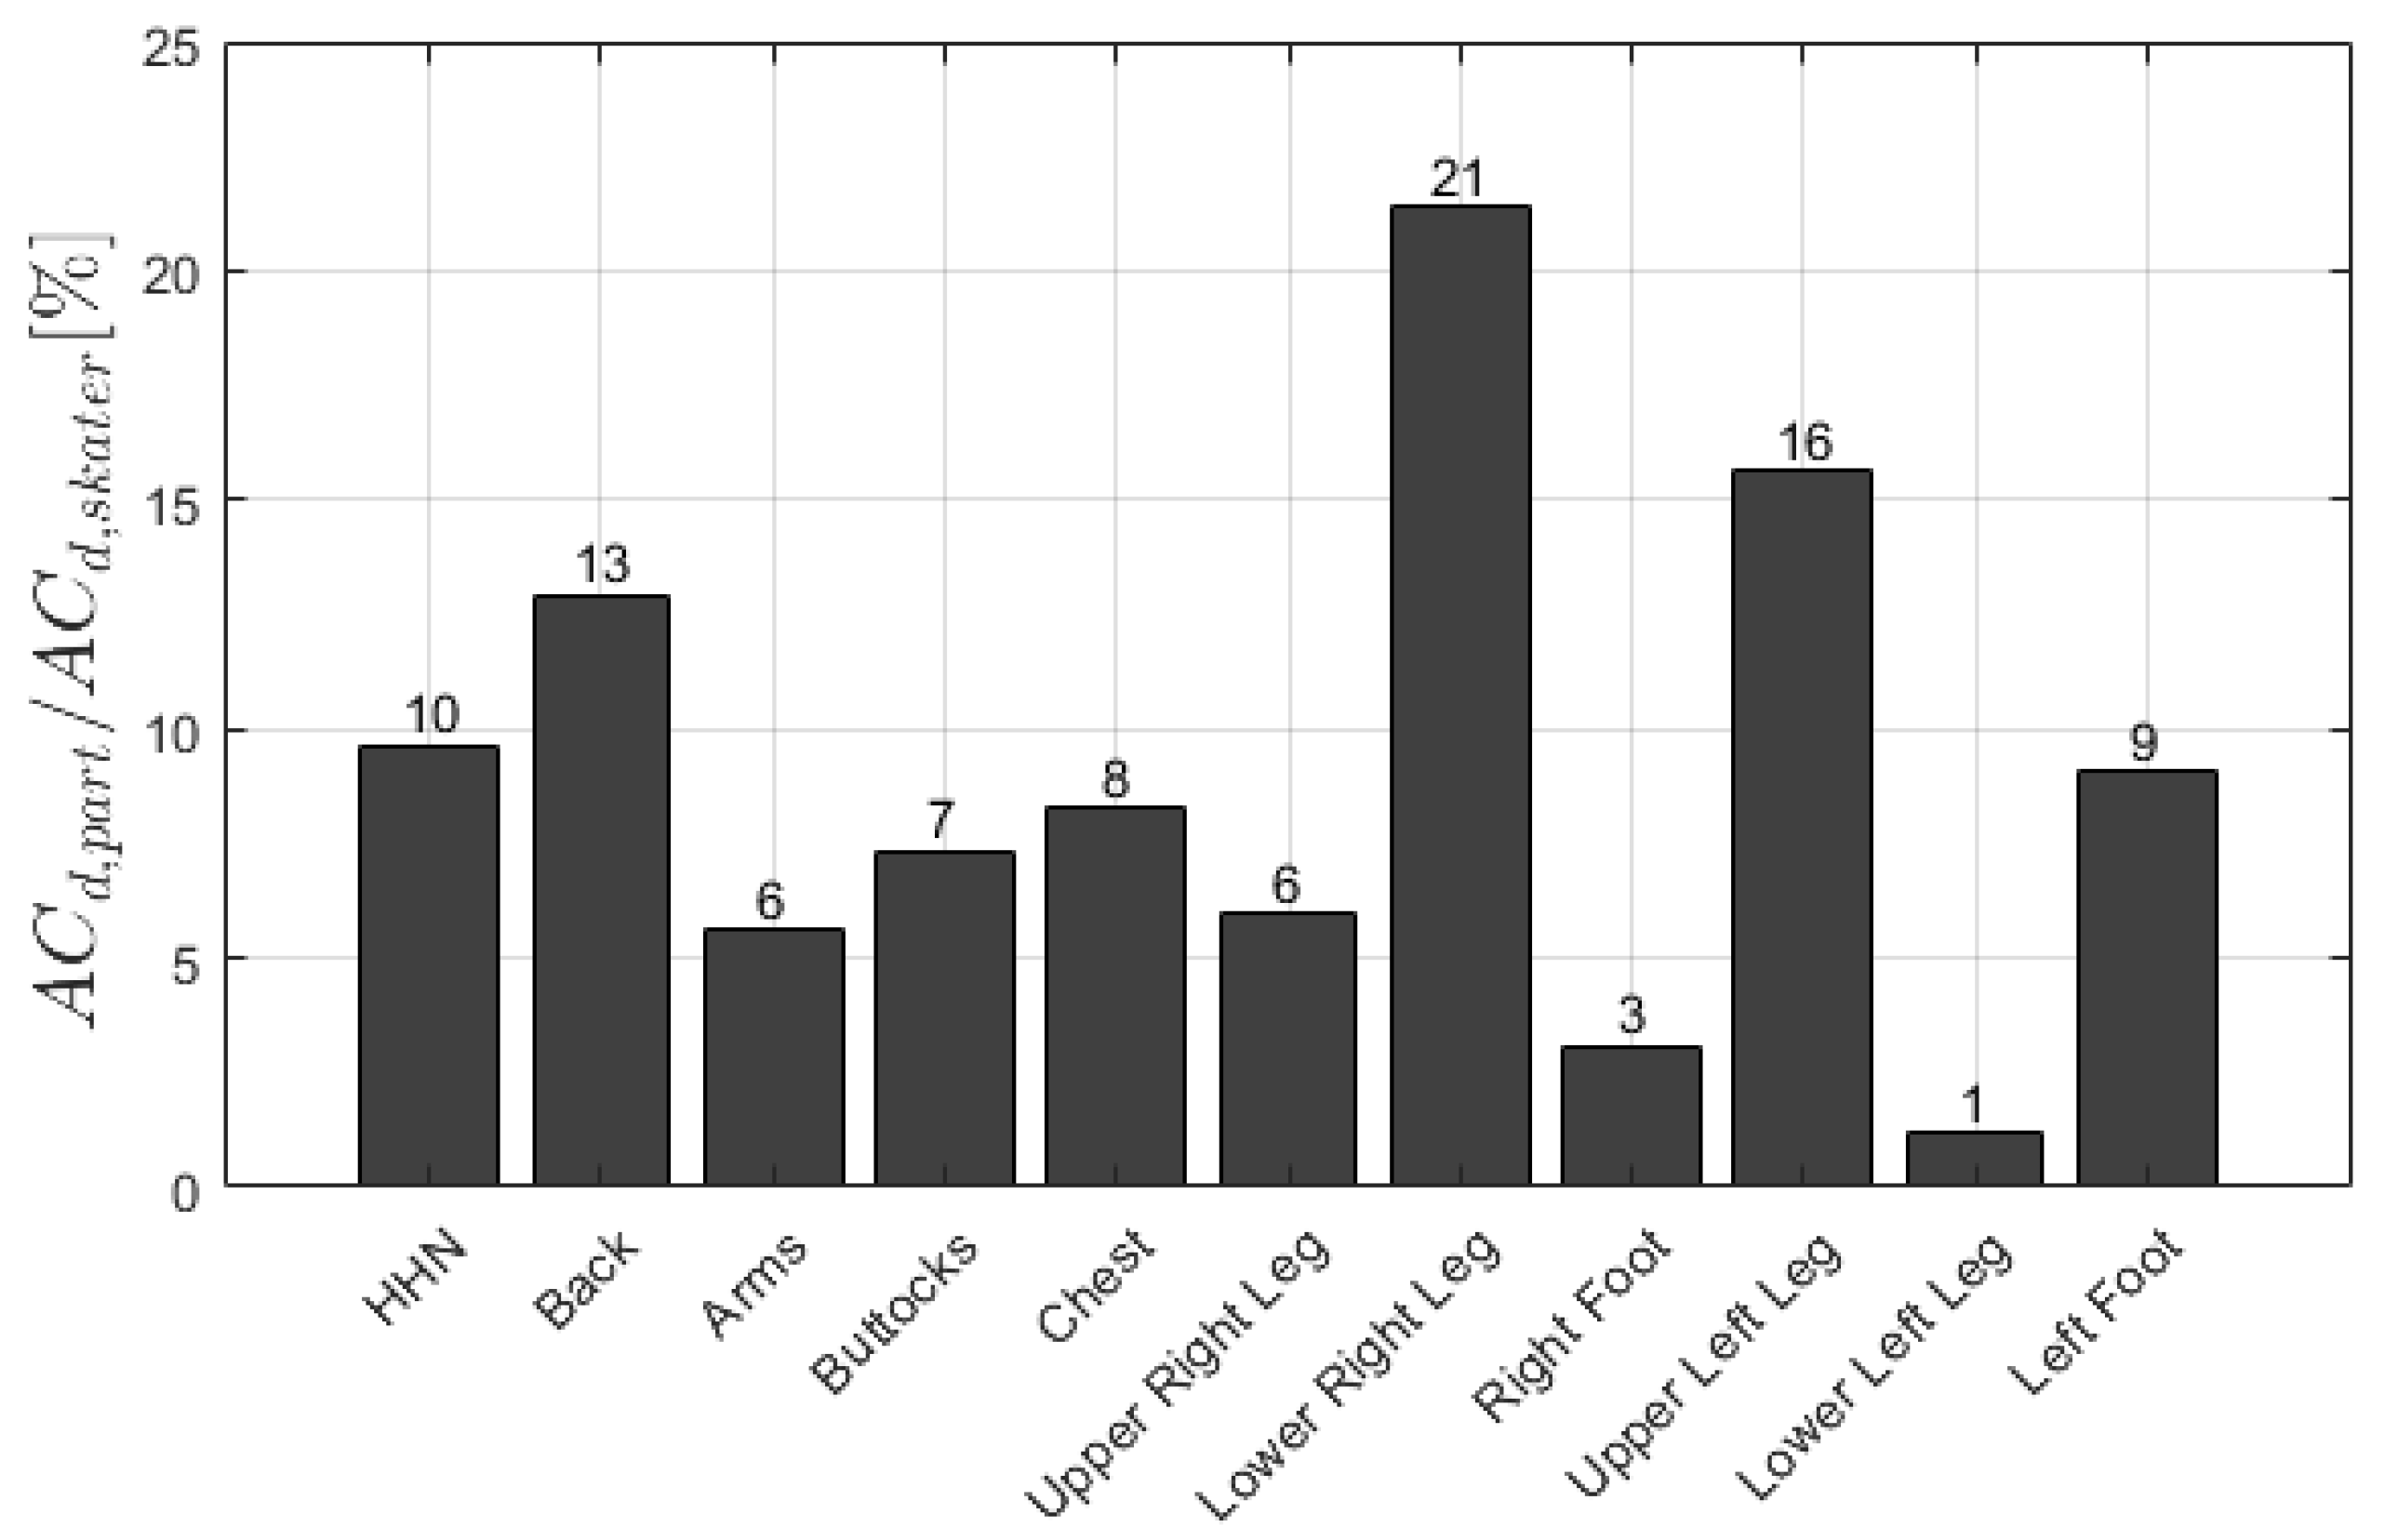
Figure 10 presents the drag area breakdown of the individual body segments of the bare-head skater configuration in order to better understand where the drag is generated (note that H H N stands for head–helmet–neck). The individual body segments are illustrated in Figure 1b. The skater’s total drag area without a helmet is A C D , s k a t e r = 0.1320 m 2 . The main contributors to the skater’s total drag area are the legs, in fact, the upper left and lower right leg, which correspond to the regions of significant streamwise velocity deficit observed in Figure 9a. These body segments are oriented almost vertically, thus, having a large frontal area. In addition, their cross-sectional profile is similar to the one of a cylinder, leading to a wide separation region. Therefore, they induce a strong drag force. The next most relevant segment is the back followed by the HHN. The relative contribution of these body segments to the aerodynamic drag is similar to that of a cyclist [13].

6.3. Helmet’s Comparison

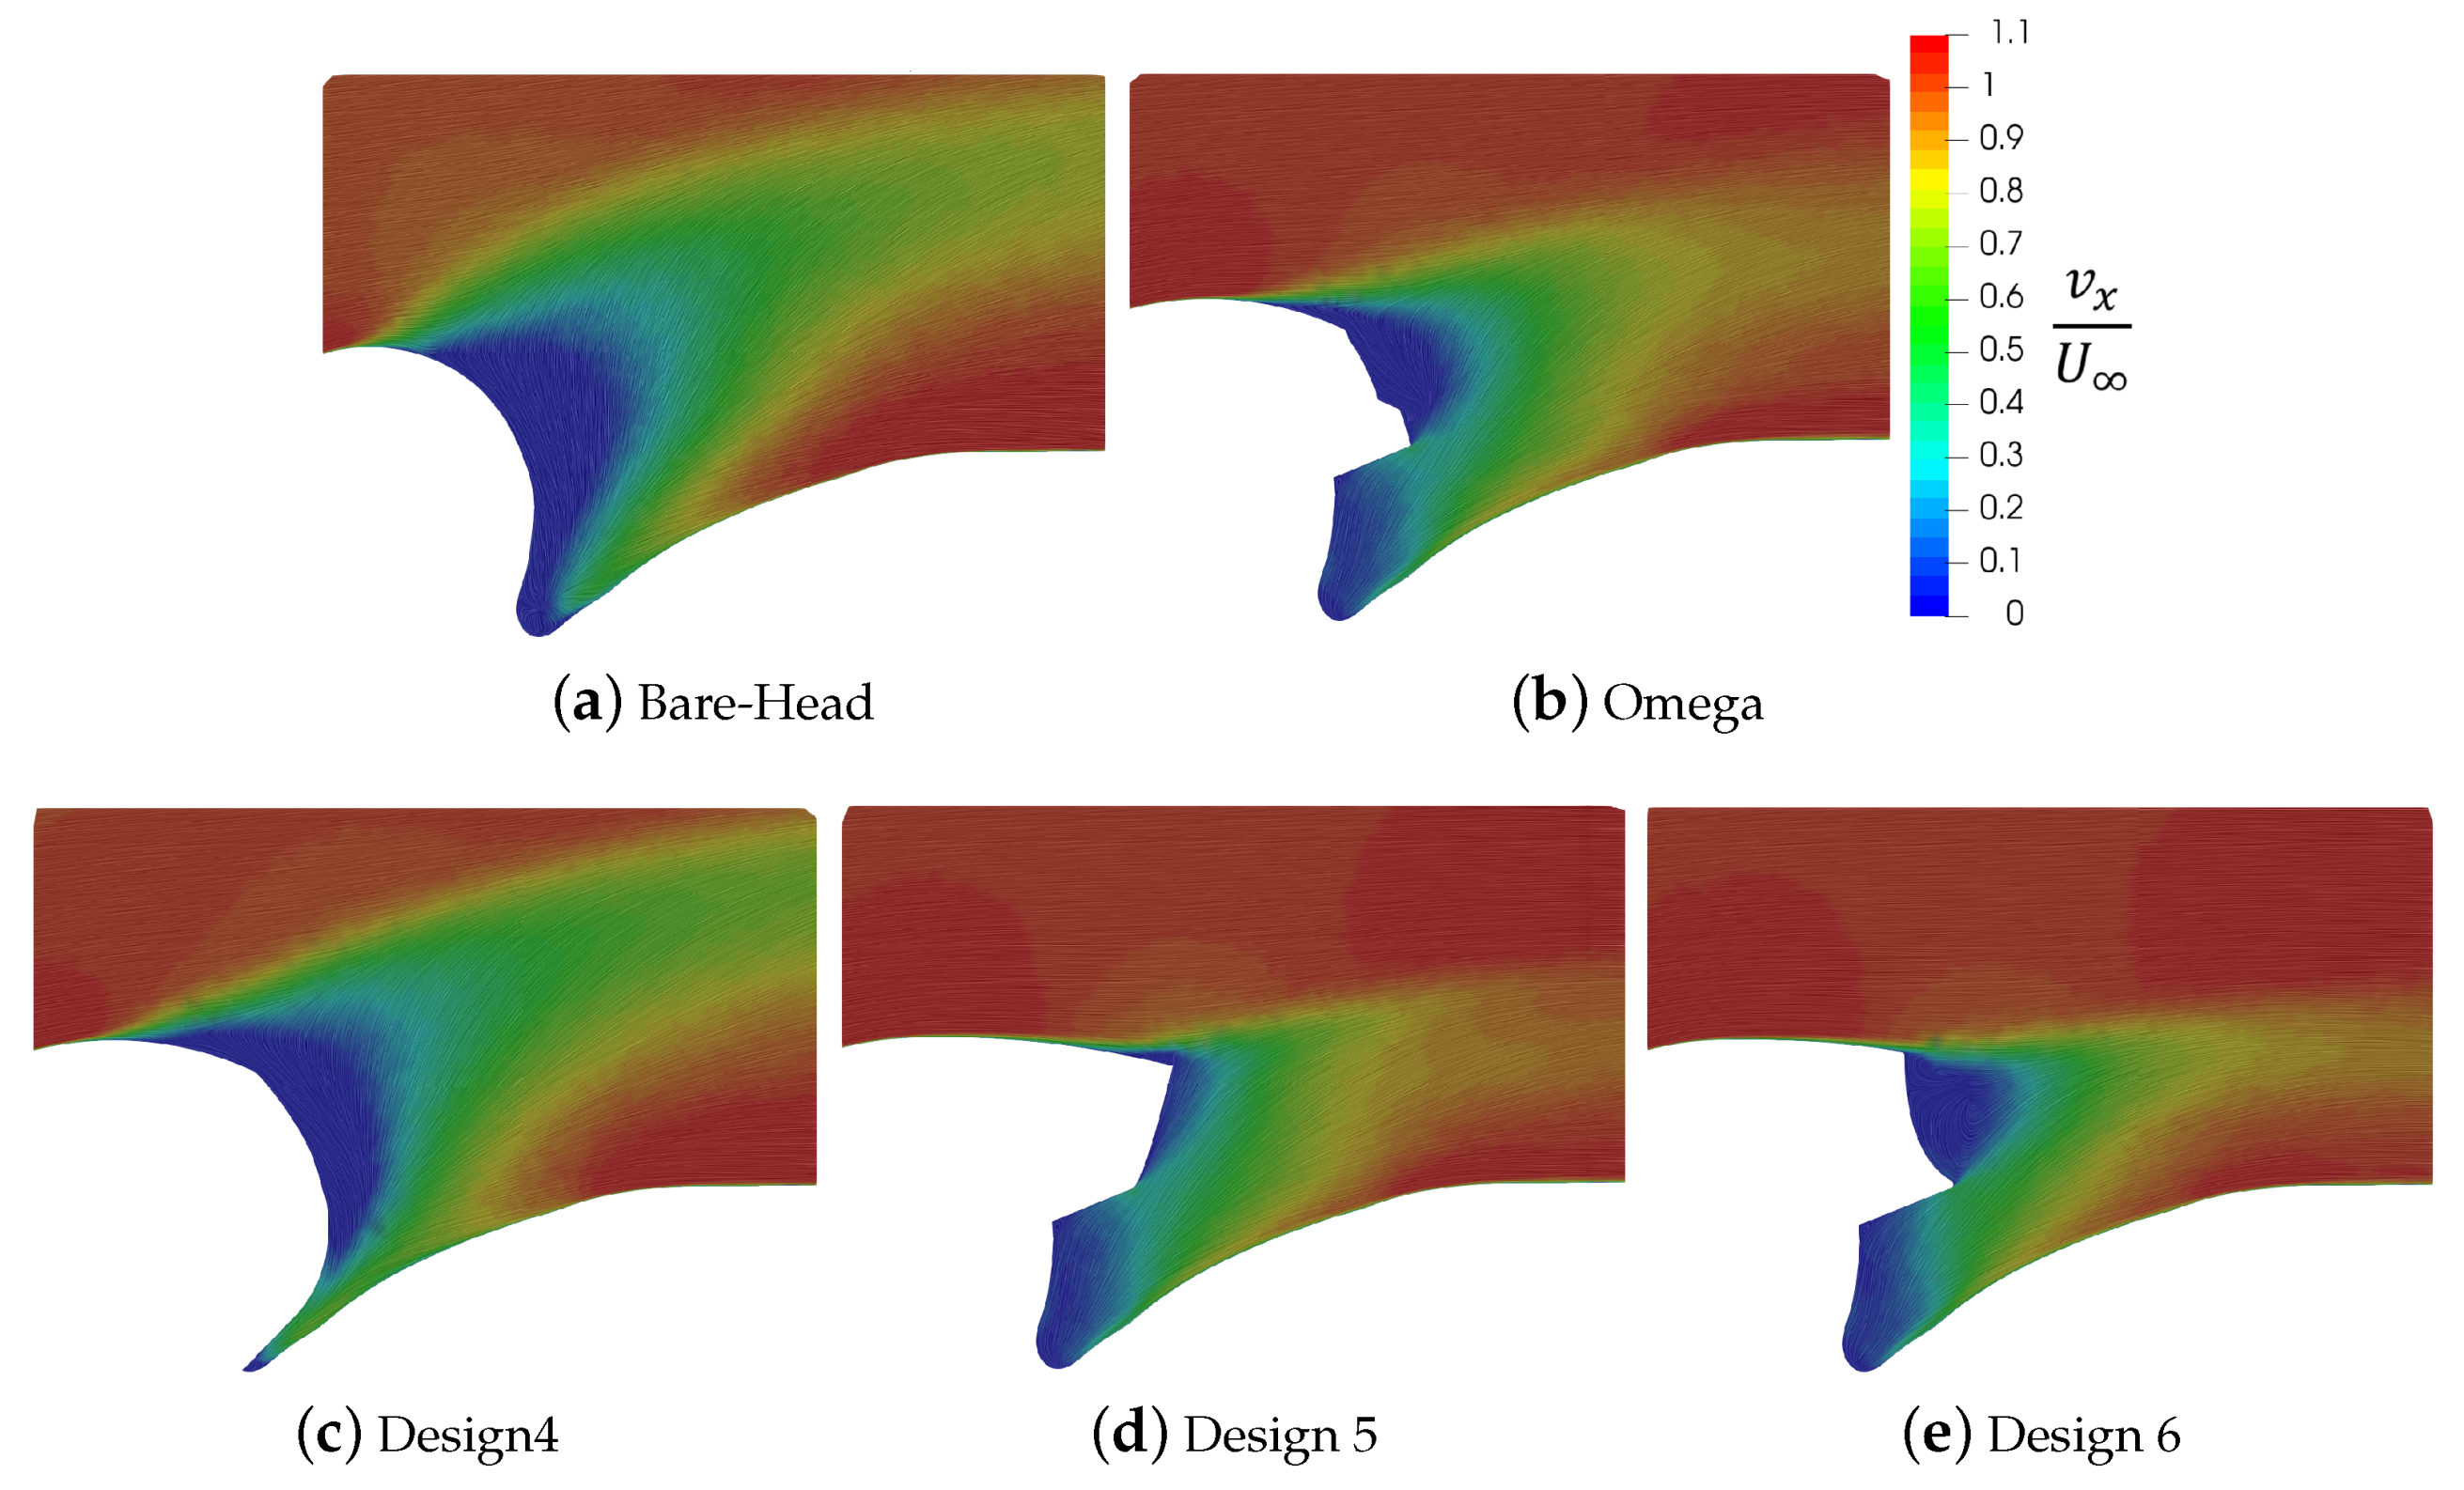
Figure 11 visualizes the head/helmet wake characteristics of the simulations by means of streamwise velocity v x / U at the median plane. There is a noticeable flow behaviour variance among the simulations, in particular in the wake’s height. The trailing edge shape strongly influences the separation point and, so, the orientation of the wake. In fact, the larger the radius of curvature of the upper head/helmet surface, the later the boundary layer separation occurs, reducing the height of the wake. On the other hand, spherically shaped trailing edges promote earlier boundary layer separation, pushing the wake upwards, as the bare head and the design 4 cases. Design 6 shows a slightly shorter wake height compared to design 5. Indeed, the truncated gap is filled up with recirculating flow, which acts as an artificial trailing edge surface. If a comparative analysis is done together with the drag reduction values gathered in Table 2, one can observe that the lower the vertical deflection of the wake, the lower the total drag of the skater is.
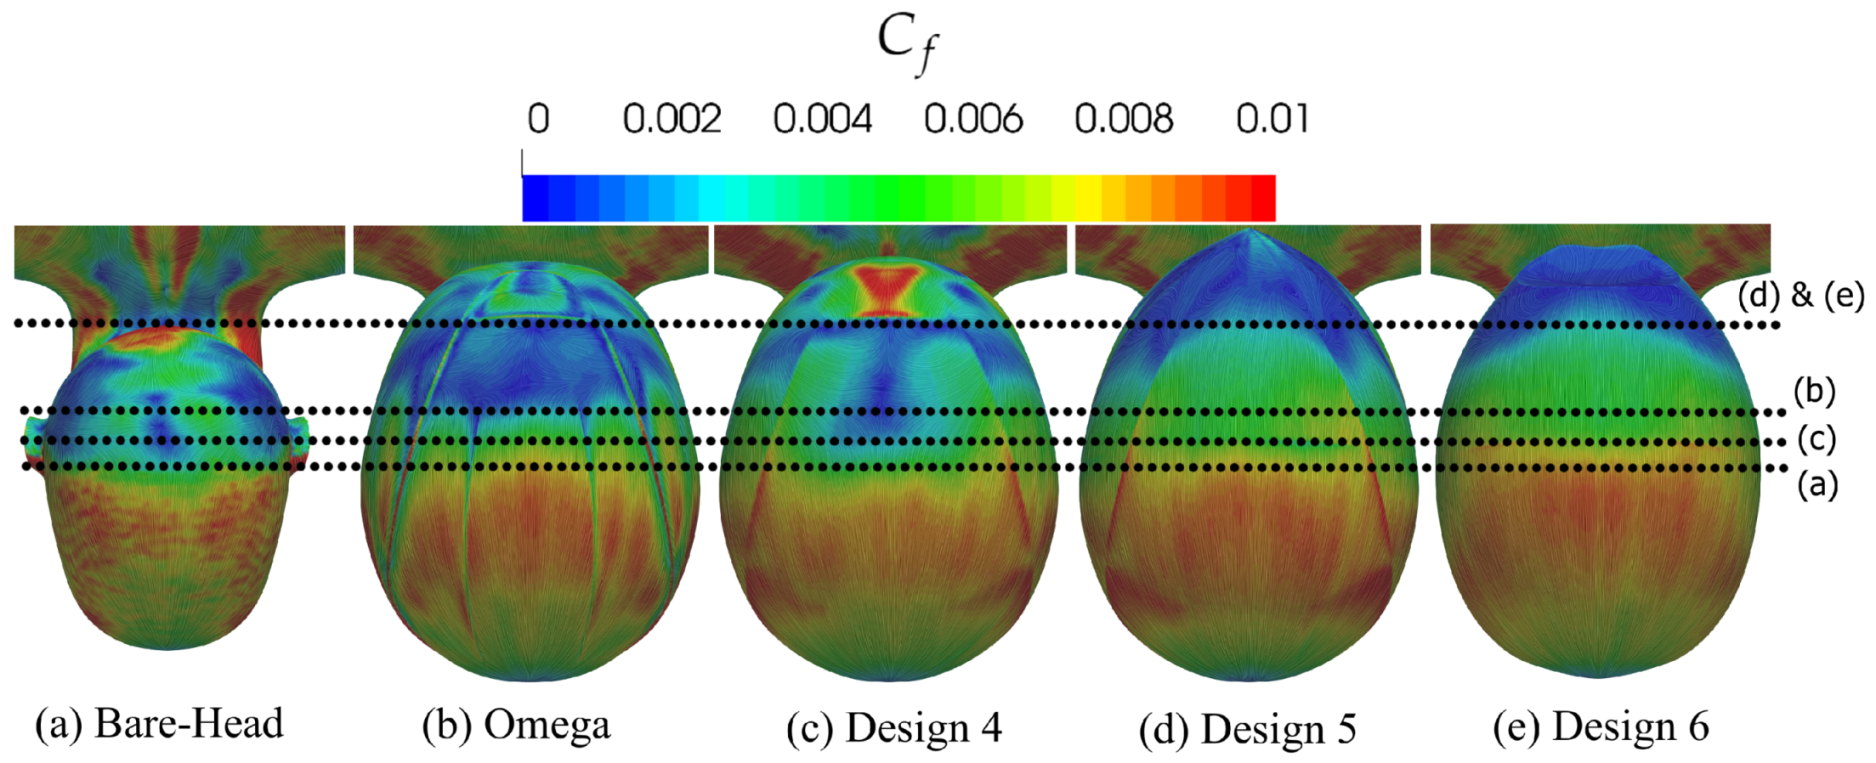
The skin friction C f contour plots over the upper side of the head/helmets are shown in Figure 12. This parameter was used to determine precisely where the boundary layer separates. If C f becomes zero, the wall-normal velocity derivative is null and, hence, separation takes place. Designs 5 and 6 are both capable of pushing the separation line the most downstream among all helmets, whereas the bare-head case exhibits the most upstream flow separation. The boundary layer separation is directly connected to the previously discussed wake height. The later the flow separated, the lower the wake height will be. This is also illustrated in Figure 13, where suction downstream of the head/helmets is shown.
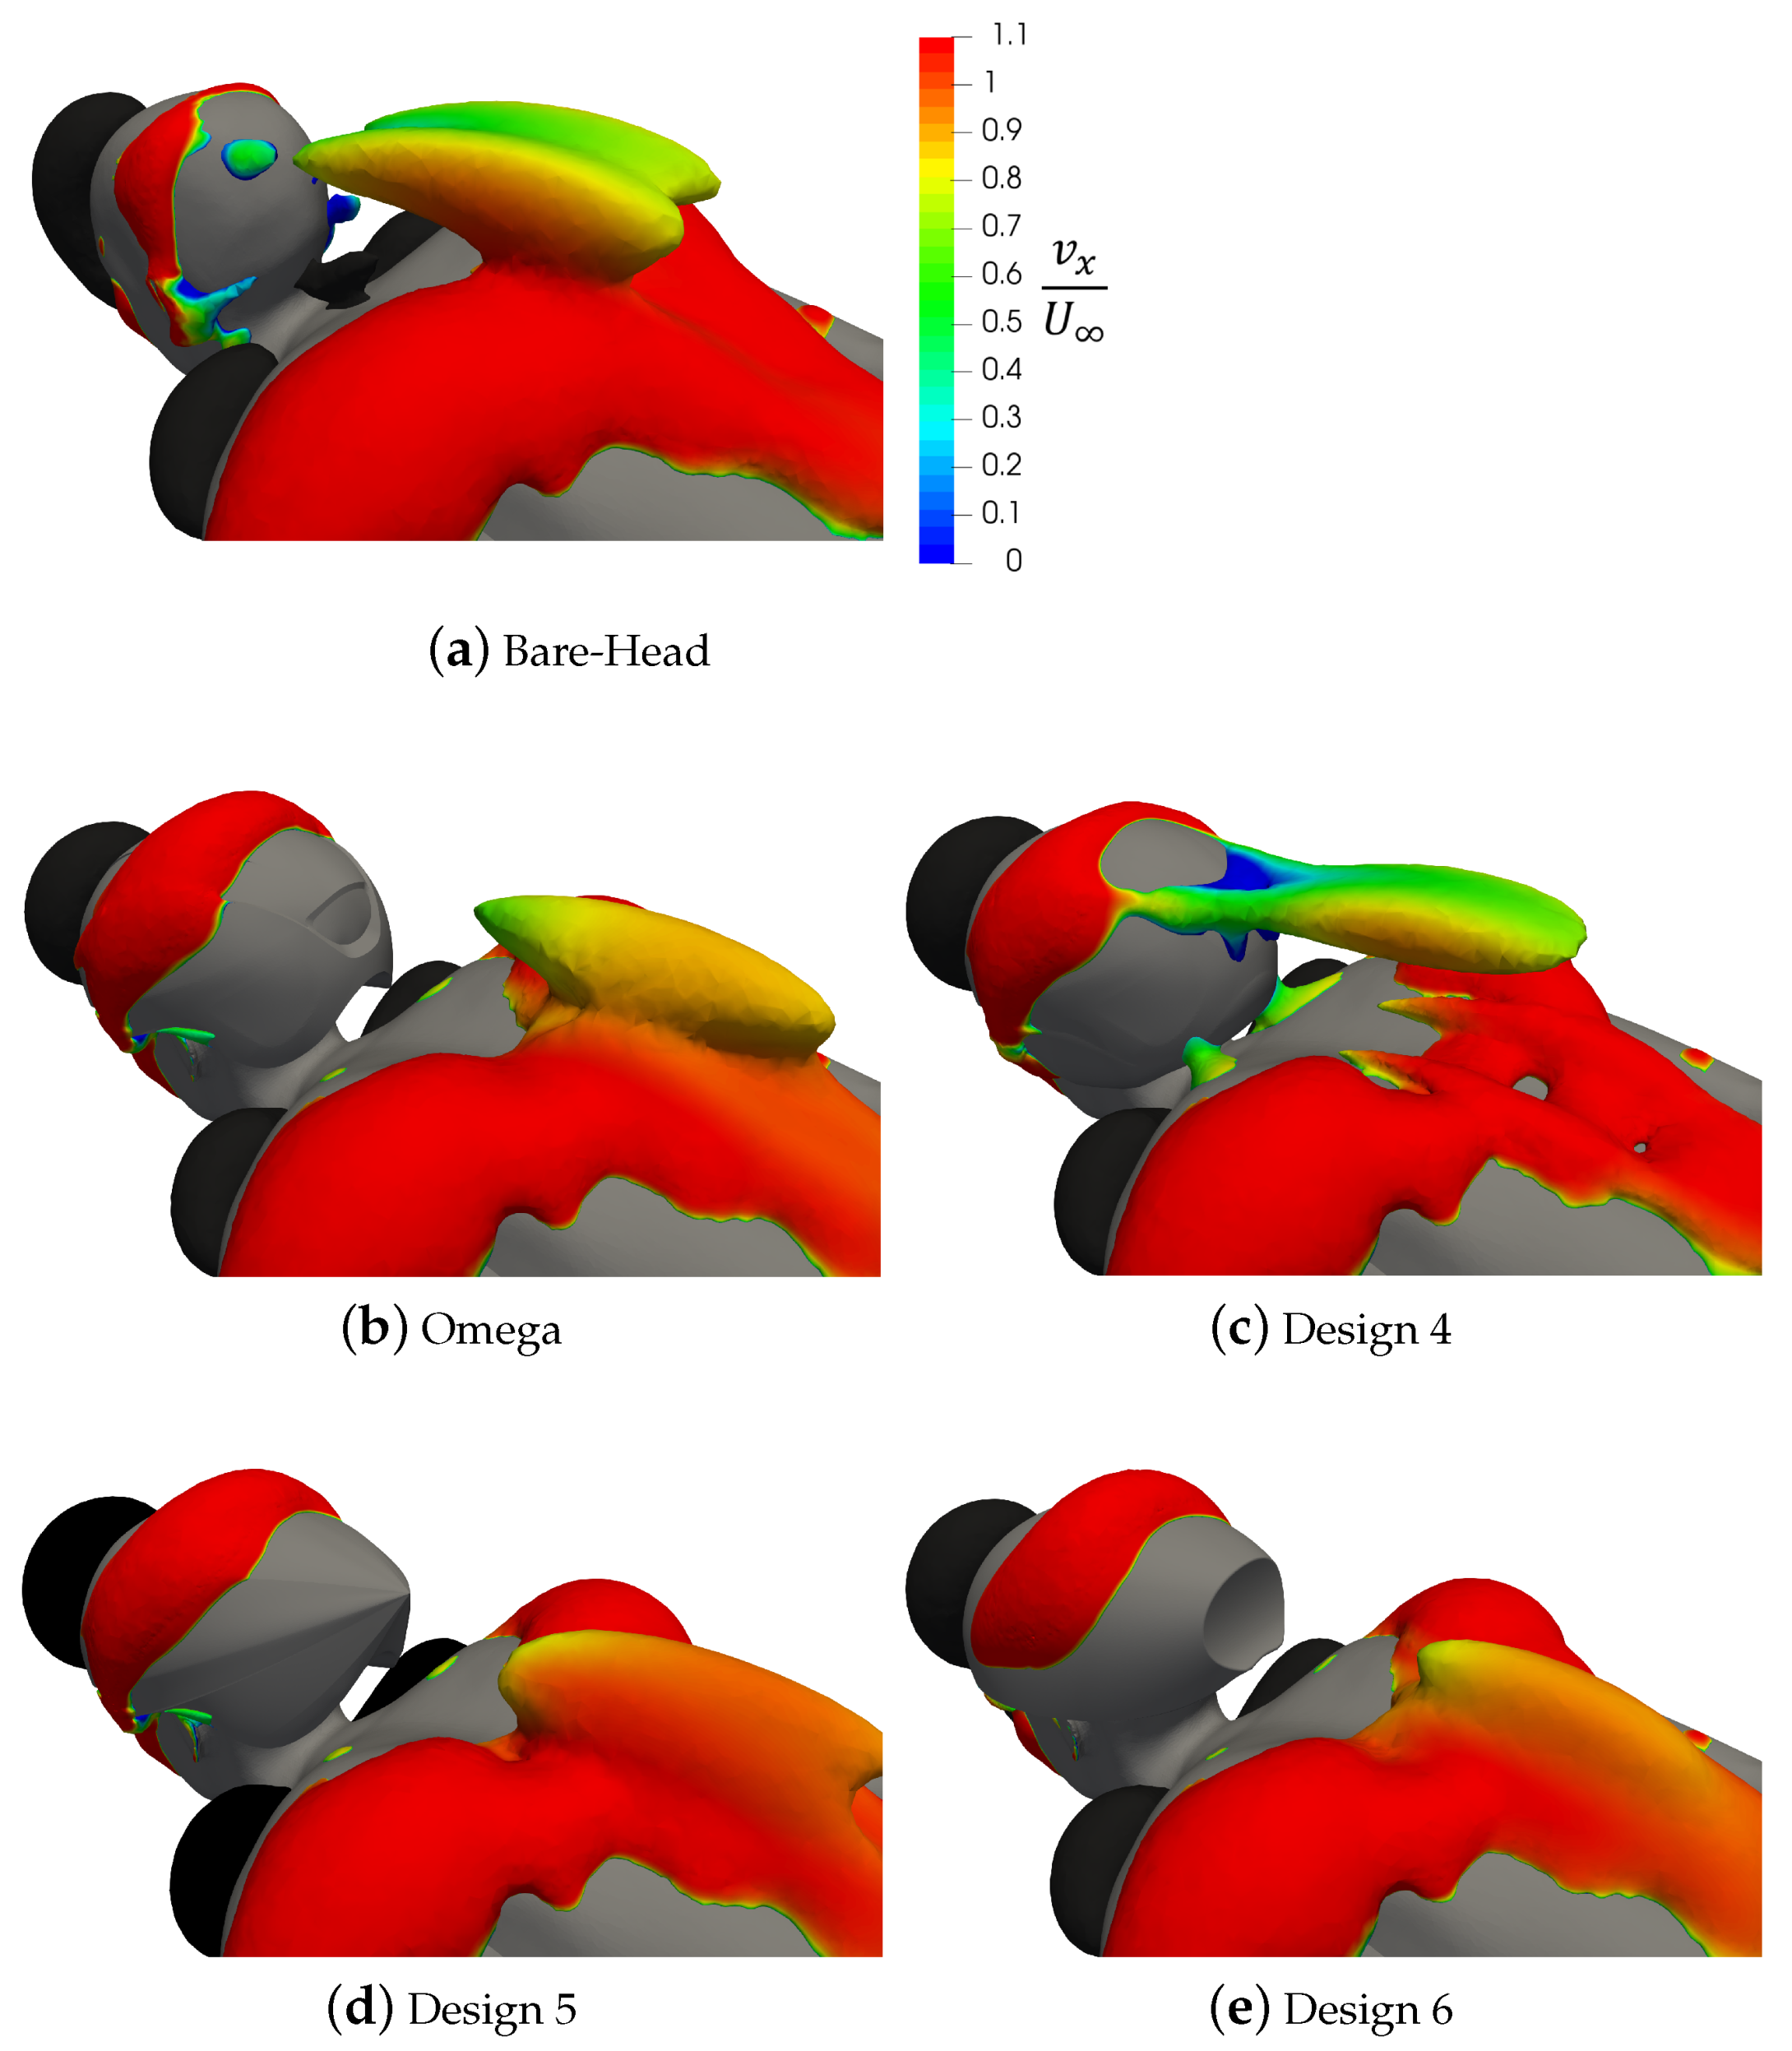
When no helmet is used (Figure 13a), a large low-pressure region is formed downstream of the head of the skater, which contributes significantly to the drag. The use of a round helmet (design 4, Figure 13c) increases the extent of the low-pressure region behind the head, but diminishes the low-pressure region behind the ears, thus causing a marginal improvement on the skater’s drag. The use of the other helmet designs, instead, enables one to postpone the flow separation on the skater’s head, and therefore suppresses the low-pressure region behind the skater’s head, yielding lower aerodynamic drag. The highest benefits are achieved with designs 5 and 6 (Figure 13d,e), where the low-pressure region is shifted away from the head and merges with the suction over the skater’s back, thus annihilating its contribution to the drag.
Every study case is compared to the bare-head case as percentage difference in Table 2. The use of all the helmets provided a performance enhancement compared to the bare head case, even if the frontal area increased. The baseline Omega and design 6 helmets showed a 4.3 % and a 5.9 % improvement respectively relative to bare head. Thus, design 6 upgraded by 1.6 % the overall performance of the skater instead of wearing Omega. In contrast, the helmet design with ear covers (design number 4) presented the worst results among every helmet. The drag coefficient of Omega, design 1, design 2 and design 3 cases lied within the uncertainty of the numerical simulation results. So, ventilation holes at the already separated helmet trailing edge cause a negligible variation of the total drag force. Likewise, drag coefficients of design 5 and design 6 were within the simulation uncertainty. Therefore, they could be considered to have the same performance.
The time gain of each helmet with respect to the bare head configuration for a long track 1500 m event is presented in Table 3. The use of all the helmets provided an improvement in the racing time. The baseline Omega and design 6 helmets showed a 0.83 s and a 1.30 s reduction in total racing time respectively, relative to bare head. Therefore, design 6 could improve by 0.47 s the overall timing of the 1500 m event instead of wearing Omega.

6.4. Experimental Comparison

As can be seen from the smoke flow visualization illustrated in Figure 14, in the absence of any helmet the bare head of the skater produces a wide wake; instead, when the Omega helmet is employed, the flow separation is postponed and the wake behind the head becomes narrower.
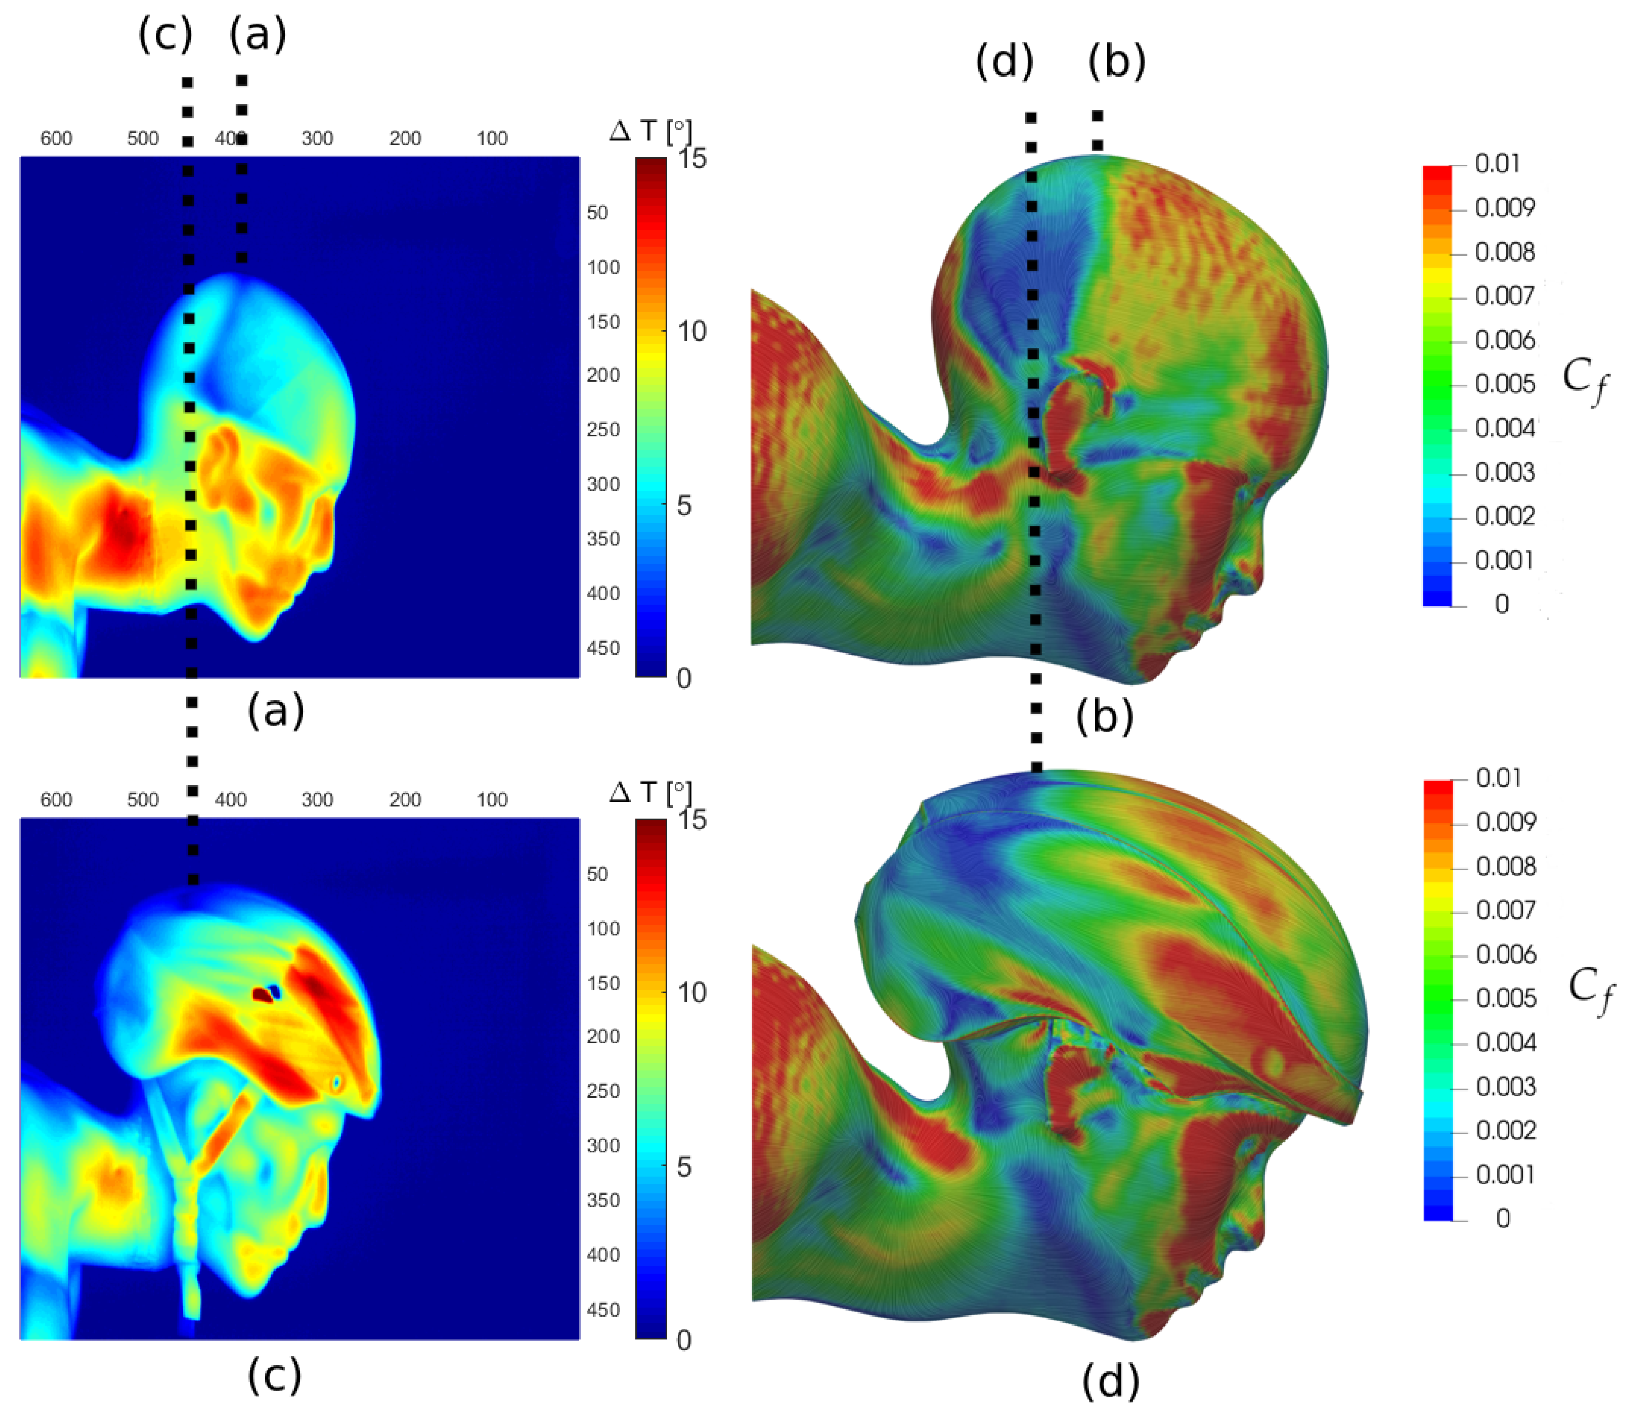
The results from the infrared thermography measurements, compared with the skin friction coefficient evaluated from the numerical simulations, are presented in Figure 15. It can be seen that the experimental and numerical results present clear similarities. In both cases, the separation line moves downstream in presence of the helmet, reducing the region of separated flow and thus yielding lower drag on the head.
Finally, the results from the force balance measurements are presented. While the numerical simulations returned a drag area reduction by 2.6% (see Table 2 in the manuscript), the experimental results yielded an even higher drag area decrease, namely by 4.7%. Therefore, the above results confirm that the use of the Omega helmet provides an aerodynamic benefit to the skater with respect to the bare-head configuration.

7. Limitations and Future Work

Although this study was based on high-resolution CFD simulations, there are limitations related to the skater model choice. The skater geometry was generated with MakeHuman software, instead of doing a real-human 3D scan. Despite the fact that values of drag coefficient, frontal area and drag area will vary for different athletes, it is expect that the trends captured in this study will be similar for different skaters. Besides, some geometrical simplifications were done to both Omega baseline helmet and skater model for simplicity and simulation convergence reasons, such as neglecting the clap-skates or ventilation gaps of the gaps of the helmets.
All CFD simulations in this study included steady-state calculations and the assumptions of the skater surfaces were smooth, neglecting the actual use of special skinsuits with roughness texture. Then, the use of such skinsuits may alter the boundary layer characteristics, thus reducing the drag.
Another simplification in this study is the assumption that the skater was racing in still air with zero jaw angle. Future studies should consider a range of different static positions along the race or the implementation of a dynamic meshing technique, fully capturing the movement of the skater.
In regard to the wind tunnel measurements, it should be noted that the mannequin represented only the upper body, and not the full body, of the skater. As a consequence, the experimental results cannot be considered as a validation of the CFD simulations, due to the difference in the simulated models. Nevertheless, the experimental results provide additional confidence to the outcome of the numerical simulations. Future studies should definitely address a more in-depth validation of the numerical results, manufacturing the same physical model and range of helmet designs.

8. Conclusions

The flow around an ice-skater model has been investigated via CFD simulations with focus on the flow field around the helmet and the effect of the latter on the skater’s aerodynamic drag. Eight different configurations have been analysed, including the bare-head case and a baseline configuration with a simplified helmet model from a sports equipment manufacturer. The analysis has been conducted via RANS simulations using the Menter shear stress transport k ω turbulence model. It was shown that all helmet designs yield a drag reduction with respect to the bare-head case. However, the use of a round helmet with hear covers causes only minor improvements, with a drag decrease by less than 2%. The other helmet designs enabled to postpone the flow separation on the skater’s head, thus reducing the low-pressure region close to the skater’s occipital and in turn the skater’s drag. The use of the Omega helmet from the Cadamotus manufacturer yielded a drag reduction by 4.3%, whereas the use of an optimized helmet design with truncated trailing edge enables a drag reduction by almost 6%. In terms of time gain at a 1500 m event, the use of the Omega and and truncated helmet designs would yield a total racing time reduction of 0.83 s and 1.3 s, respectively. Therefore, the selection of the helmet could lead to a variation in podium positions.

Author Contributions

Regarding the numerical and wind-tunnel results: Conceptualization, G.P.M., W.T. and A.S.; Investigation, G.P.M.; Methodology, G.P.M.; Software, G.P.M.; Supervision, W.T. and A.S.; Visualization, G.P.M.; Writing—original draft, G.P.M.; Writing—review & editing, G.P.M., W.T. and A.S. All authors have read and agreed to the published version of the manuscript.

Funding

This research is partly funded by the Netherlands Organisation for Scientific Research (NWO) Domain Applied and Engineering Sciences (TTW), project 15583 “Enabling on-site sport aerodynamics with the Ring of Fire”.

Institutional Review Board Statement

The study was conducted according to the guidelines of the Institutional Review Board at Delft University of Technology called HREC (Human Resource Ethics Committee).

Informed Consent Statement

Informed consent was obtained from all subjects involved in the study, with the exception of Section 6.3, which was based on publicly available information.

Data Availability Statement

The data presented in this publication is available online at 4TU.ResearchData repository with doi:10.4121/13536617.

Conflicts of Interest

The authors declare no conflict of interest.

References

  1. Oggiano, L.; Sætran, L. Experimental Analysis on Parameters Affecting Drag Force on Speed Skaters. Sport. Technol. 2010, 3, 223–234. [Google Scholar] [CrossRef]
  2. International Skating Union (ISU). ISU World Cup #6 2018-19. 2019. Available online: https://live.isuresults.eu/events/2019_USA_0001/schedule (accessed on 27 December 2020).
  3. De Simone, B. Chicago Tribune Staff Writer. Rubber Strips, Records Stripped in Speed Skating. 1998. Available online: https://www.chicagotribune.com/news/ct-xpm-1998-02-09-9802090123-story.html (accessed on 27 December 2020).
  4. Kuyt, C.B.; Greidanus, A.; Westerweel, J. Drag Reduction by Applying Speedstrips on Rowing Oars. Procedia Eng. 2016, 147, 110–115. [Google Scholar] [CrossRef] [Green Version]
  5. Chowdhury, H. Aerodynamic Design of Sports Garments. Appl. Aerodyn. 2012, 22–40. [Google Scholar] [CrossRef] [Green Version]
  6. Kuper, G.; Sterken, E. Do Skin Suits Increase Average Skating Speed? CCSO Centre for Economic Research, CCSO Working Papers; University of Groningen: Groningen, The Netherlands, 2004. [Google Scholar]
  7. International Olympic Committee. Speed Skating Nagano 1998 Olympic Winter Games. 1998. Available online: https://www.olympic.org/nagano-1998/speed-skating (accessed on 27 December 2020).
  8. Brownlie, L.; Kyle, C. Evidence that skin suits affect long track speed skating performance. Procedia Eng. 2012, 34, 26–31. [Google Scholar] [CrossRef] [Green Version]
  9. International Skating Union. Special Regulations and Technical Rules—Short Track Speed Skating. In Proceedings of the 57th Ordinary Congress, Seville, Spain, 4–8 June 2018. [Google Scholar]
  10. International Skating Union. Special Regulations and Technical Rules—Speed Skating. In Proceedings of the 57th Ordinary Congress, Seville, Spain, 4–8 June 2018. [Google Scholar]
  11. Fabien, B.; Polidori, G.; Trenchard, H.; Grappe, F. Aerodynamic study of time-trial helmets in cycling racing using CFD analysis. J. Biomech. 2017, 67, 1–8. [Google Scholar]
  12. Alam, F.; Chowdhury, H.; Elmir, Z.; Sayogo, A.; Love, J.; Subic, A. An Experimental Study of Thermal Comfort and Aerodynamic Efficiency of Recreational and Racing Bicycle Helmets. Procedia Eng. 2010, 2, 2413–2418. [Google Scholar] [CrossRef] [Green Version]
  13. Defraeye, T.; Blocken, B.; Koninckx, E.; Hespel, P.; Carmeliet, J. Computational fluid dynamics analysis of drag and convective heat transfer of individual body segments for different cyclist positions. J. Biomech. 2011, 44, 1695–1701. [Google Scholar] [CrossRef] [PubMed] [Green Version]
  14. MakeHuman—Open Source Tool for Making 3D Characters. 2020. Available online: http://www.makehumancommunity.org/ (accessed on 27 December 2020).
  15. Konings, M.; Elferink-Gemser, M.; Stoter, I.; Meer, D.; Otten, E.; Hettinga, F. Performance Characteristics of Long-Track Speed Skaters: A Literature Review. Sports Med. 2015, 45, 505–516. [Google Scholar] [CrossRef] [PubMed] [Green Version]
  16. Blender—Open Source 3D Creation Suite. 2020. Available online: https://www.blender.org/ (accessed on 27 December 2020).
  17. Cádomotus—Omega Aero Helmet for Speedskating and Cycling. 2020. Available online: https://www.cadomotus.com/en/omega-aero-helm-triathlon-red.html (accessed on 27 December 2020).
  18. Saraf, A.; Mahendra, P.; Chouhan, T.S. Aerodynamic Analysis of Naca0012 Airfoil Using CFD. Int. J. Mech. Prod. Eng. 2017, 5, 20–25. [Google Scholar]
  19. Hart, J.; Allen, T.; Holroyd, M. Downhill Skateboard Aerodynamics. Procedia Eng. 2010, 2, 2523–2528. [Google Scholar] [CrossRef] [Green Version]
  20. Defraeye, T.; Blocken, B.; Koninckx, E.; Hespel, P.; Carmeliet, J. Aerodynamic study of different cyclist positions: CFD analysis and full-scale wind-tunnel tests. J. Biomech. 2010, 43, 1262–1268. [Google Scholar] [CrossRef] [PubMed] [Green Version]
  21. Chi, S.; Pitman, J.; Crouch, T.; Burton, D.; Thompson, M. The application of body scanning, numerical simulations and wind tunnel testing for the aerodynamic development of cyclists. Proc. Inst. Mech. Eng. Part P J. Sport. Eng. Technol. 2020. [Google Scholar] [CrossRef]
  22. Defraeye, T.; Blocken, B.; Koninckx, E.; Hespel, P.; Carmeliet, J. Computational fluid dynamics analysis of cyclist aerodynamics: Performance of different turbulence-modelling and boundary-layer modelling approaches. J. Biomech. 2010, 43, 2281–2287. [Google Scholar] [CrossRef] [PubMed] [Green Version]
  23. Blocken, B.; Druenen, T.; Toparlar, Y.; Andrianne, T. CFD analysis of an exceptional cyclist sprint position. Sport. Eng. 2019, 22, 10. [Google Scholar] [CrossRef] [Green Version]
  24. ANSYS, Inc. ANSYS Fluent User’s Guide; ANSYS, Inc.:: Canonsburg, PA, USA, 2013; Release 15. [Google Scholar]
  25. ANSYS, Inc. ANSYS Meshing User’s Guide; ANSYS, Inc.: Canonsburg, PA, USA, 2017; Release 18. [Google Scholar]
  26. ANSYS, Inc. ANSYS Fluent Theory Guide; ANSYS, Inc.: Canonsburg, PA, USA, 2013; Release 15. [Google Scholar]
  27. ANSYS, Inc. Introduction to ANSYS Fluent-Lecture 7: Turbulence Modelling; ANSYS, Inc.: Canonsburg, PA, USA, 2014; Release 15. [Google Scholar]
  28. Versteeg, H.K.; Malalasekera, W. An Introduction to Computational Fluid Dynamics—The Finite Volume Method; Addison-Wesley-Longman: Boston, MA, USA, 1995; ISBN 9780582218840. [Google Scholar]
  29. Coleman, H.; Steele, W. Experimentation, Validation, and Uncertainty Analysis for Engineers, 3rd ed.; John Wiley & Sons: Hoboken, NJ, USA, 2009. [Google Scholar]
  30. Anderson, J.D. Fundamentals of Aerodynamics; McGraw-Hill Education: New York, NY, USA, 2010; ISBN 9780073398105. [Google Scholar]
  31. De Koning, J.; De Groot, G.; Van Ingen Schenau, G. Ice friction during speed skating. J. Biomech. 1992, 25, 565–571. [Google Scholar] [CrossRef]
  32. ISU. ISU World Cup Salt Lake City—Result 1500 m Men—Division A. 2019. Available online: https://media.isuresults.eu/downloads/men_1500_a_result_20190310202113.pdf (accessed on 27 December 2020).
  33. Terra, W.; Sciacchitano, A.; Shah, Y. Aerodynamic drag determination of a full-scale cyclist mannequin from large-scale PTV measurements. Exp. Fluids 2019, 60, 5. [Google Scholar] [CrossRef] [Green Version]
  34. Crouch, T.; Burton, D.; Brown, N.; Thompson, M.; Sheridan, J. Flow topology in the wake of a cyclist and its effect on aerodynamic drag. J. Fluid Mech. 2014, 748, 5–35. [Google Scholar] [CrossRef]
  35. D’Auteuil, A.; Larose, G.; Zan, S. Relevance of similitude parameters for drag reduction in sport aerodynamics. Procedia Eng. 2010, 2, 2393–2398. [Google Scholar] [CrossRef] [Green Version]
Figure 1. Skater mannequin model at kick-off recovery posture: (a) left view with reference angles, (b) different body parts.
Applsci 11 03148 g001
Figure 2. Lateral view of the baseline Omega Cádomotus helmet: (a) real and (b) simplified computer-aided design (CAD).
Applsci 11 03148 g002
Figure 3. Lateral schematic view of the additional helmets simulated.
Applsci 11 03148 g003
Figure 4. Schematic of the simulation fluid domain: (a) isometric view showing domain zones and bodies of influence; and (b) domain size.
Applsci 11 03148 g004
Figure 5. Breakdown schematic of the fluid domain grid. Total cell count of 34 million.
Applsci 11 03148 g005
Figure 6. Distribution of streamwise velocity at a vertical plane, (a) x = 0.20 m and (b) x = 0.10 m distance upstream from the head.
Applsci 11 03148 g006
Figure 7. Skater model used in the wind tunnel measurements for (a) bare-head and (b) Omega helmet cases.
Applsci 11 03148 g007
Figure 8. Flow topology around a skater without helmet, (a)zero velocity iso-surface schematic in blue colour and (b) C p iso-surface schematics, in black positive C p = 0.55 and in blue–red rainbow negative C p = 0.3 . Negative pressure coefficient iso-surface was coloured with streamwise velocity v x / U .
Applsci 11 03148 g008
Figure 9. Distribution of (a) streamwise velocity and (b) vorticity with in-plane velocity field vectors at a vertical plane, x 0.85 m distance downstream from buttocks.
Applsci 11 03148 g009
Figure 10. Drag area percentage of the skater without helmet for the individual body parts at U = 15 m/s. HHN indicates Head, Helmet (in this case not present) and Neck) and Neck.
Applsci 11 03148 g010
Figure 11. Non-dimensional streamwise velocity v x / U on the median plane behind the model head and helmet.
Applsci 11 03148 g011
Figure 12. Top view skin friction coefficient. Black dotted lines indicate where boundary layer separation occurs at the upper side of the head/helmet.
Applsci 11 03148 g012
Figure 13. Isometric C p iso-surface schematics, in black positive C p = 0.55 and in blue–red rainbow negative C p = 0.3 . Negative pressure coefficient iso-surface was colored with streamwise velocity v x / U .
Applsci 11 03148 g013
Figure 14. Smoke flow visualization on the head of the skater mannequin for the bare head case (left) and the Omega helmet case (right).
Applsci 11 03148 g014
Figure 15. Comparison between wind tunnel infrared thermography measurements (a,c) and skin friction coefficient form the simulations (b,d) for bared head and Omega helmet. The dashed lines mark the separation line.
Applsci 11 03148 g015
Table 1. Drag coefficient characteristics of the entire skater without helmet as well as friction and static pressure drag breakdown.
Case C D [ ] C D , p [ ] C D , f [ ] C D , p [ % ] C D , f [ % ]
Bare-Head0.529 ± 0.0020.5050.02495.44.6
Table 2. Total drag and area-drag coefficients comparison between bare head and every helmet design evaluated.
Helmet A [ m 2 ] C D [ ] A C D [ m 2 ] Δ C D [ % ] Δ A C D [ % ]
Bare Head0.249490.529 ± 0.0020.13198--
Omega0.253980.506 ± 0.0020.12851−4.3−2.6
Design 10.254060.506 ± 0.0020.12855−4.3−2.6
Design 20.254060.504 ± 0.0020.12804−4.7−2.9
Design 30.254060.506 ± 0.0020.12855−4.4−2.6
Design 40.254060.519 ± 0.0020.13185−1.8−0.1
Design 50.254110.499 ± 0.0020.12680−5.7−3.9
Design 60.254100.498 ± 0.0020.12654−5.9−4.1
Table 3. Estimated long track 1500 m racing timings of each helmet configuration. Bare head case was assigned as the reference 1500 m world record by the Dutch Kjeld Nuis [32].
Helmet t [ m i n : s ] t g a i n [ s ]
Bare Head1:40.17-
Omega1:39.34−0.83
Design 11:39.35−0.82
Design 21:39.23−0.94
Design 31:39.35−0.82
Design 41:40.14−0.03
Design 51:38.93−1.24
Design 61:38.86−1.30
Publisher’s Note: MDPI stays neutral with regard to jurisdictional claims in published maps and institutional affiliations.