1. Introduction
Major League Baseball (MLB) is the third most popular sport in the United States, with 20 million viewers during the 2017 World Series alone [
1]. The home run is an important aspect of the game and is often normalized as the number of home runs per batted ball (HR/BB). From 1960 to 2015, the HR/BB varied from 0.03 to 0.04, changing gradually from year to year with no apparent trend. The HR/BB increased abruptly starting in 2015, reaching 0.053 in 2017. The MLB commissioned a panel to study the unprecedented and dramatic change, which concluded that a small decrease in the ball’s aerodynamic drag (3%) was responsible for the increased offense [
2]. The high sensitivity of HR/BB to ball drag has motivated increased scrutiny of baseball drag and the methods used to measure it.
The aerodynamic drag force on an object,
Fd, is often measured in a wind tunnel. The object is held stationary on calibrated force sensors as a uniform airflow is introduced. The effects of drag can be described through a non-dimensional drag coefficient,
Cd, while the aerodynamic effect of speed is often normalized by the Reynolds number,
Re [
3]. The drag coefficient is not constant but changes with
Re. The relationship between
Cd and
Re for smooth spheres was discovered independently by Lukyanov and Eiffel [
4]. The drag of a smooth sphere as a function of speed has three distinct regimes [
5]. In the subcritical regime, (
Re ≤ 2 × 10
5)
Cd ~ 0.5, and it is nearly independent of
Re. The mostly laminar flow separates from the sphere relatively early, resulting in a large wake and the highest drag of the three flow regimes. In the critical regime (
Re ~ 3 × 10
5), an abrupt decrease in drag occurs where
Cd ~ 0.1, and is known as the “drag crisis”. This phenomenon is caused by the generation of laminar separation bubbles, whereby the laminar boundary layer separates, transitions to turbulence in the free shear layer, reattaches onto the sphere’s surface and then separates again, resulting in a smaller wake and the lowest drag of the three regimes [
6]. In the supercritical regime (
Re > 3 × 10
5) the boundary layer prior to separation is turbulent resulting in an intermediate drag in comparison to the other regimes. The drag coefficient increases gradually with
Re in the supercritical regime. Ball speeds representative of play are usually at the end of the drag crisis where flow is transitioning to fully turbulent.
Air speed is not the only factor affecting flow separation. Ball spin will cause the flow separation points to move, which can affect the drag and cause lift by what is known as the Magnus effect [
7]. The spin tends to move the separation points and wake in the direction of the ball rotation. The imbalance in pressure from asymmetric separation points causes a lift force. The distance the separation points move is roughly proportional to the spin rate [
8,
9]. The roughness, including seams on sports balls, increases the sensitivity to spin. Roughness may cause a transition in the boundary layer from laminar to turbulent flow, which reduces the speed for the onset of the critical regime while increasing drag in the supercritical regime. The dimples of golf balls are carefully designed to reduce drag over speeds used in play. The seams of a baseball also encourage turbulence at lower speeds and can alter the location of the flow separation points.
The dependence of drag on ball orientation was studied in wind tunnels, as depicted in
Figure 1, for 30 m/s (
Re = 1.5 × 10
5) [
10]. Since the four-seam spin axis has two planes of symmetry, the drag dependence repeats four times per revolution. While wind tunnels are commonly used to measure the drag of sports balls, they have a potentially adverse interference effect. The support used to hold the ball stationary and measure aerodynamic forces can interrupt the airflow and alter the aerodynamic forces that are being measured. In order to avoid this undesirable interference effect, supports are often attached downstream of the object, which minimizes their effect. To study the effect of ball orientation, however, the ball is supported on its spin axis, close to the flow separation. It is not clear how these attachments affect the location of the flow separation and drag measurements.
Baseballs have a characteristic white leather cover formed from two panels that are sewn together by hand with a single continuous seam. While they are similar in appearance, the construction and quality of baseballs vary widely between models. This work considers the Major League Baseball (MLB), given the high interest in ball response at this level of play and its high repeatability and quality. The effects of the drag are considered for
Re = 170,000 (36 m/s), which is representative of play. Wind tunnel measurements of non-spinning MLB baseballs have found its drag to be as low as
Cd = 0.3 [
11] and as high as
Cd = 0.6 [
12]. While baseball drag in play is likely closer to
Cd = 0.35 [
13,
14], the range in
Cd from wind tunnel measurements suggests that it is challenging, even for aerodynamic specialists to measure.
The first free-flight baseball drag measurements occurred during the 1996 Olympics [
15]. Balls were tracked with two 120 Hz cameras at a resolution of 640 × 480 pixels. While the drag crisis from this work was likely overestimated due to low camera resolution (
Cd = 0.15), it was an important advancement in aerodynamic measurement. In 2006, video-based ball tracking systems were installed in every Major League Baseball Park (PITCHf/x, Sportvision). The three components of each pitch trajectory are fit to second-order (constant acceleration) polynomials using a least-squares fit. The systems were primarily intended to track pitch speed, pitch movement and the strike zone location, but drag could also be extracted from the publicly available fit parameters. Drag measurements were susceptible to noise and environmental effects inherent with ballparks. These shortcomings were largely overcome by averaging the large amount of data collected over multiple seasons. One study reported
Cd = 0.346 [
16]. Another study measured the launch conditions and landing locations from balls projected 120 m from a pitching machine in an enclosed park and found
Cd = 0.36 [
17]. The balls were projected at 43 m/s, slowing to 27 m/s at their apex, with an average speed of 36 m/s over their trajectory
The general agreement in
Cd between the wind tunnel (no spin) and free flight (with spin) measurements is noteworthy. The drag coefficient is known to increase with ball spin, although the dependence is weak [
13,
18]. The agreement with the balls projected in the stadium also show that average drag properties have utility in describing ball trajectories. The following proposes a laboratory system to measure the drag of baseballs in free flight. The system avoids the large infrastructure and the potential effects of the sting and wall interference associated with wind tunnels. Baseball drag is measured as a function of orientation and compared to the drag of spinning balls.
2. Methods
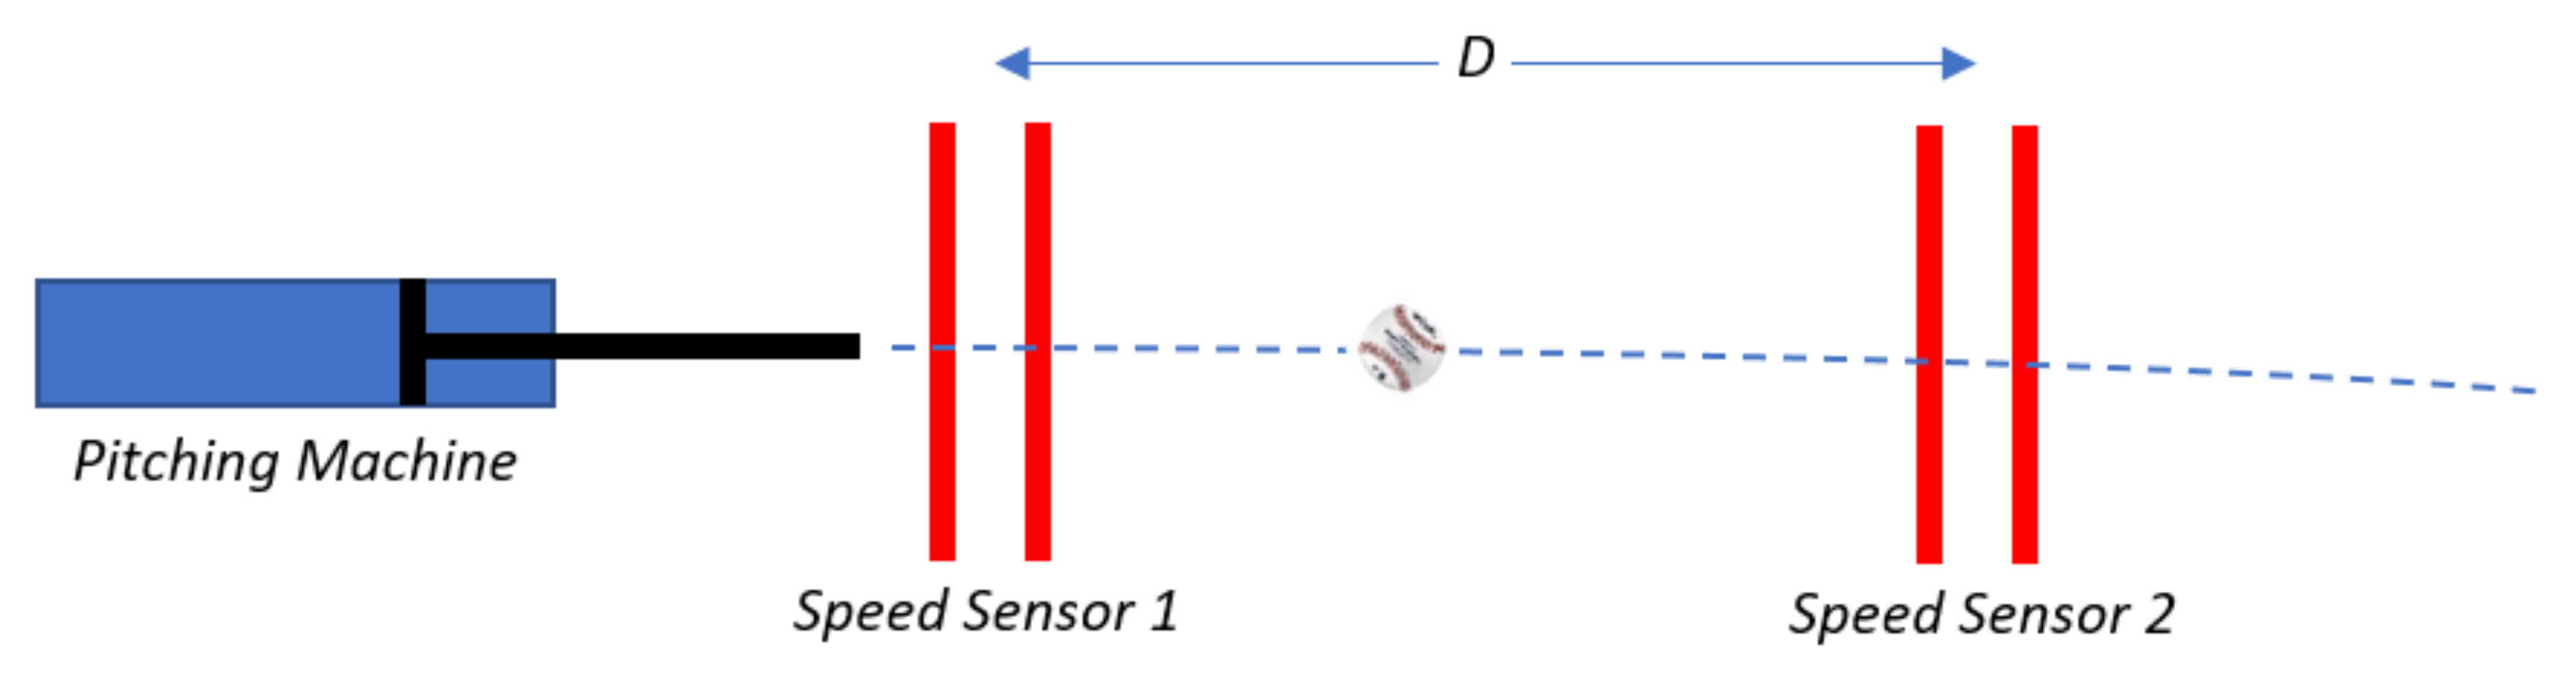
Balls were projected horizontally at 36 ± 1 m/s (
Re = 1.8 × 10
5) using a pneumatically actuated piston, as shown in
Figure 2. Ball speed was measured from a speed sensor from the time for the ball to pass between light screens (iBeam, ADC) spaced 0.4 m apart. Ball acceleration,
a, was found from subsequent speed measurements (
V1 and
V2), taken
D = 3 m apart along the ball’s trajectory, or
The drag force was found from the ball’s mass (145 g) and acceleration. The measured diameter of each ball was used to find Cd. The drag coefficient from three balls was taken from the average of four measurements per ball.
Balls are commonly projected with spin from a wheeled pitching machine. Rubber wheels, rotating at different speeds, accelerate the ball and impart spin. Baseballs used in play have a leather cover, which is abraded by the rapid acceleration from spinning pitching machine wheels. The aerodynamic properties of baseballs roughened by the pitching machine can be significantly different from those used in play. In this work, the spin was imparted to balls using a cradle attached to the end of the pneumatic piston [
19]. The cradle, shown in
Figure 3, had an opposing high and low friction surface, which imparted spin as the piston reached the end of its travel and the ball rolled out of the cradle. The spin rate increased with the cradle length. By adjusting the ball’s position in the cradle prior to firing, the spin rate was controlled. The orientation of the spin axis was controlled by the orientation of the cradle prior to firing. In this work, a horizontal spin axis was used to create a backspin and lift. Visual inspection and repeated drag measurements demonstrated an ability to impart spin without damaging the ball or altering its drag.
The accuracy of the drag measurement is a function of the air density, light screens, ball geometry and ball mass. The distance between the screens was controlled to within 0.2 mm, and the seam on the baseball was 0.9 mm high. If the ball rotates while passing through the screens, the seam can add an error to the drag measurement. The screen spacing error, the 36 m/s ball speed and 0.4 m screen spacing used here resulted in ΔCd = 0.004. The distance between screen pairs, D, was within 3 mm, where ΔCd = 0.0003. The average ball mass was 145 g and was within 15 mg, where ΔCd = 0.002. The average ball diameter was 75 mm and measured with a pi tape to within 0.2 mm, where ΔCd = 0.003. Temperature affects air density, which was within 1 °C along the ball path, where ΔCd = 0.002. The time between successive light screens was measured at 80 MHz (VG03, ADC), making the error in time negligible in comparison to the other factors considered here. By assuming the errors to be independent and normally distributed, their cumulative contribution can be estimated by the sum of their squares as ΔCd = 0.006.
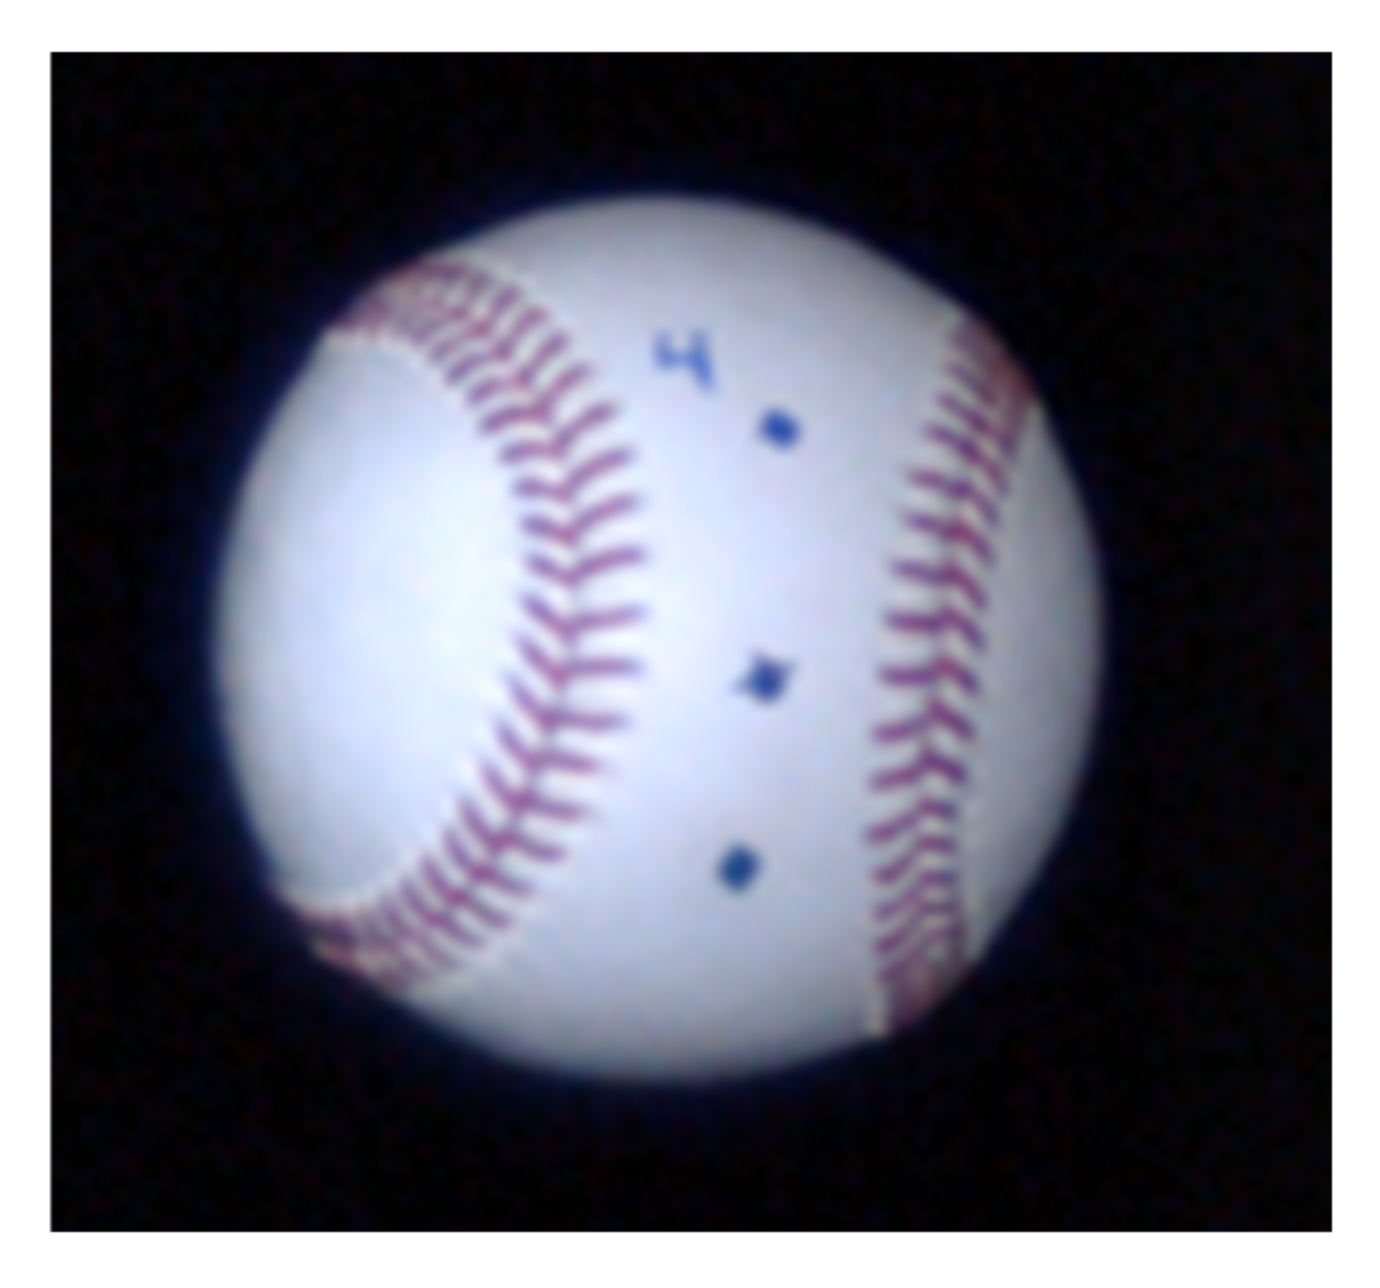
Ball orientation was measured by tracking three markers placed on each ball (ROMLB, Rawlings), as shown in
Figure 4. The ball trajectory was recorded at 1000 fps and 720 × 1280 pixels (V711, Phantom). Ball orientation was obtained from the inclination of the colinear points, while the spin rate was taken from the time between images of different orientations. In order to obtain an independent measure of drag, the ball trajectory could have been tracked with high-speed cameras. In order to measure ball orientation, a small field of view with a high camera resolution was needed. Unfortunately, the short ball trajectory observed in the video field of view prevented a meaningful measure of acceleration for comparison with the speed sensors.
Particle Image Velocimetry (PIV) measurements were conducted in the Aerodynamics Laboratory of TU Delft to visualize the baseballs’ wake in free flight for the non-spinning case. The air was seeded with micron-size water–glycol particles produced by a Safex seeding generator. The particles were illuminated via a Quantronix Darwin Duo Nd:YLF laser (25 mJ pulse energy at 1 kHz, 527 nm wavelength). Images were recorded by a LaVision HighSpeedStar6 camera (CMOS, 1024 × 1024 pixels, 20 mm pixel pitch, 12 bit) in frame-straddling mode (Δt = 40 ms), at a repetition rate of 500 Hz. The camera used a Nikkor lens with a focal length of 60 mm and an aperture f stop of 2.8. The image magnification was M = 0.12, resulting in a digital image resolution of 0.166 mm/pix. The images were processed using the cross-correlation-based algorithm (LaVision, DaVis 8.4) with image deformation and interrogation windows of 32 × 32 pixels with a 75% overlap factor.
3. Results and Discussion
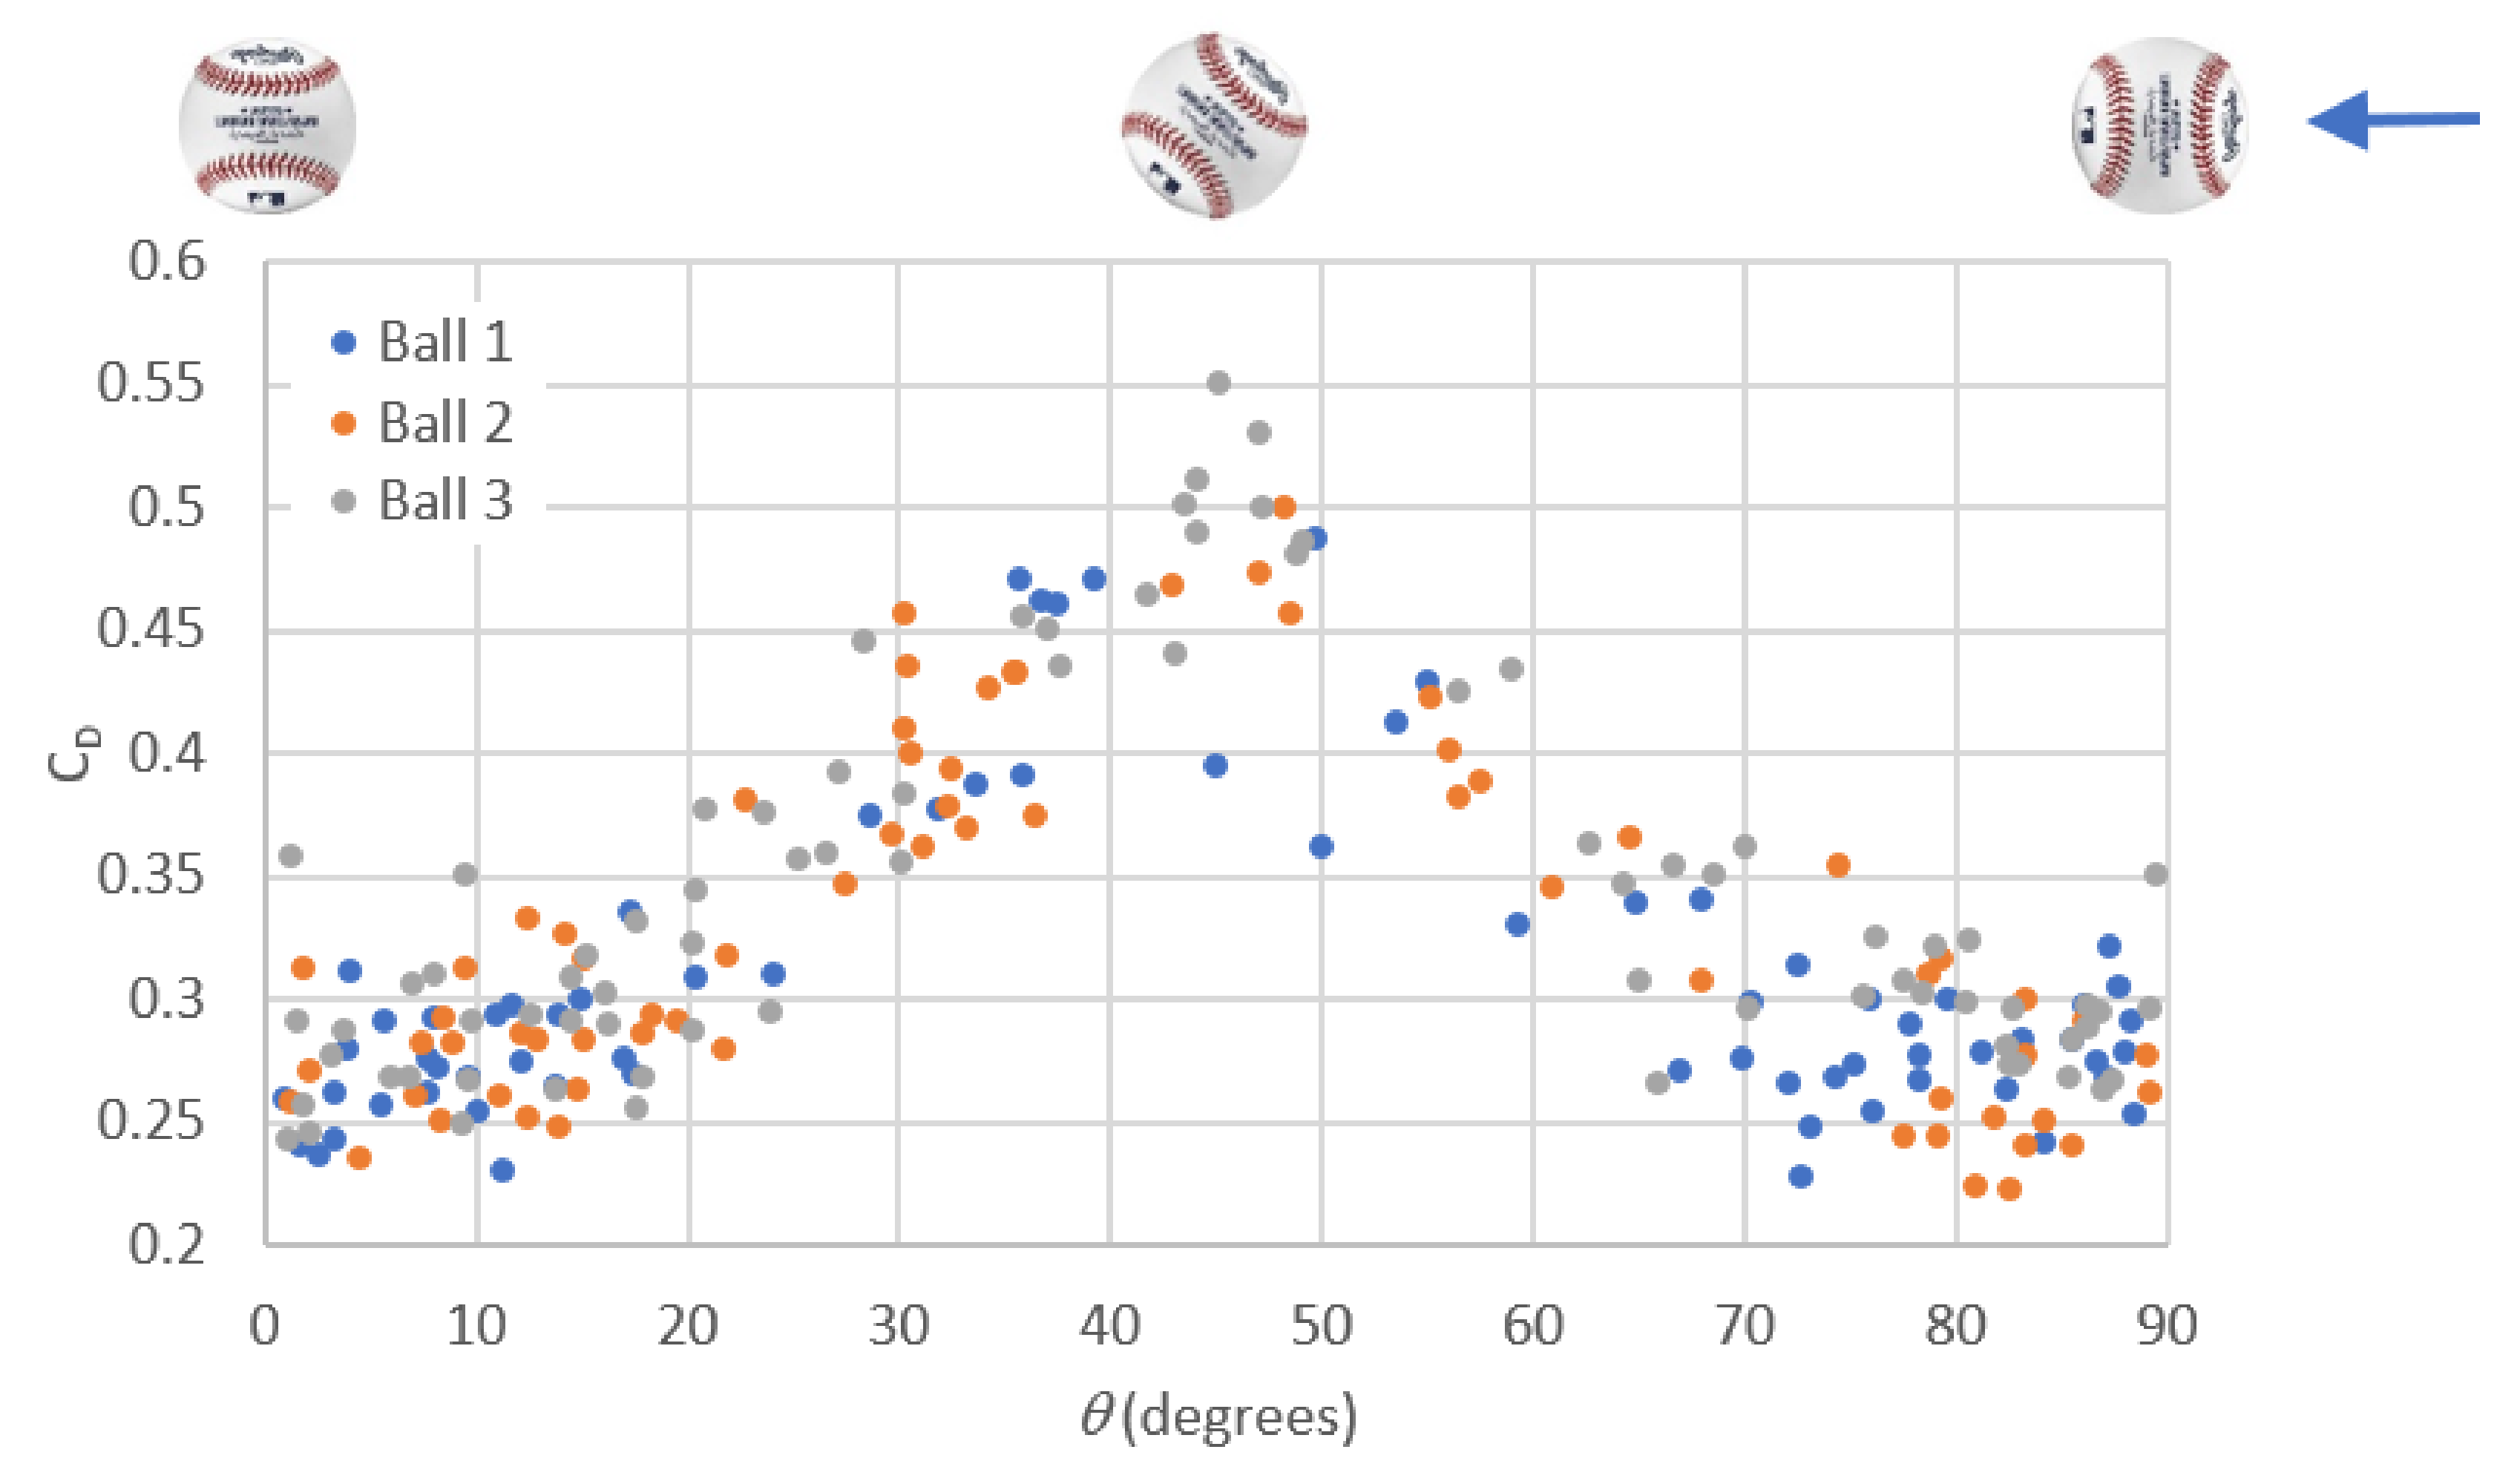
The drag coefficient for the non-spinning case is shown as a function of orientation (using a four-seam spin axis) for three new baseballs in
Figure 5. Each ball was projected between 94 and 108 times, and each projection had a unique orientation. Given the geometric symmetry of the four-seam spin axis, only orientations between 0 and 90° were measured. The ball orientation shows a consistent dependence on drag, with a minimum at 0 and 90° and a maximum at 45°. The peak drag at 45° is not unexpected, as the seams likely induce a flow separation location that maximizes the wake size at this orientation, as observed elsewhere [
10,
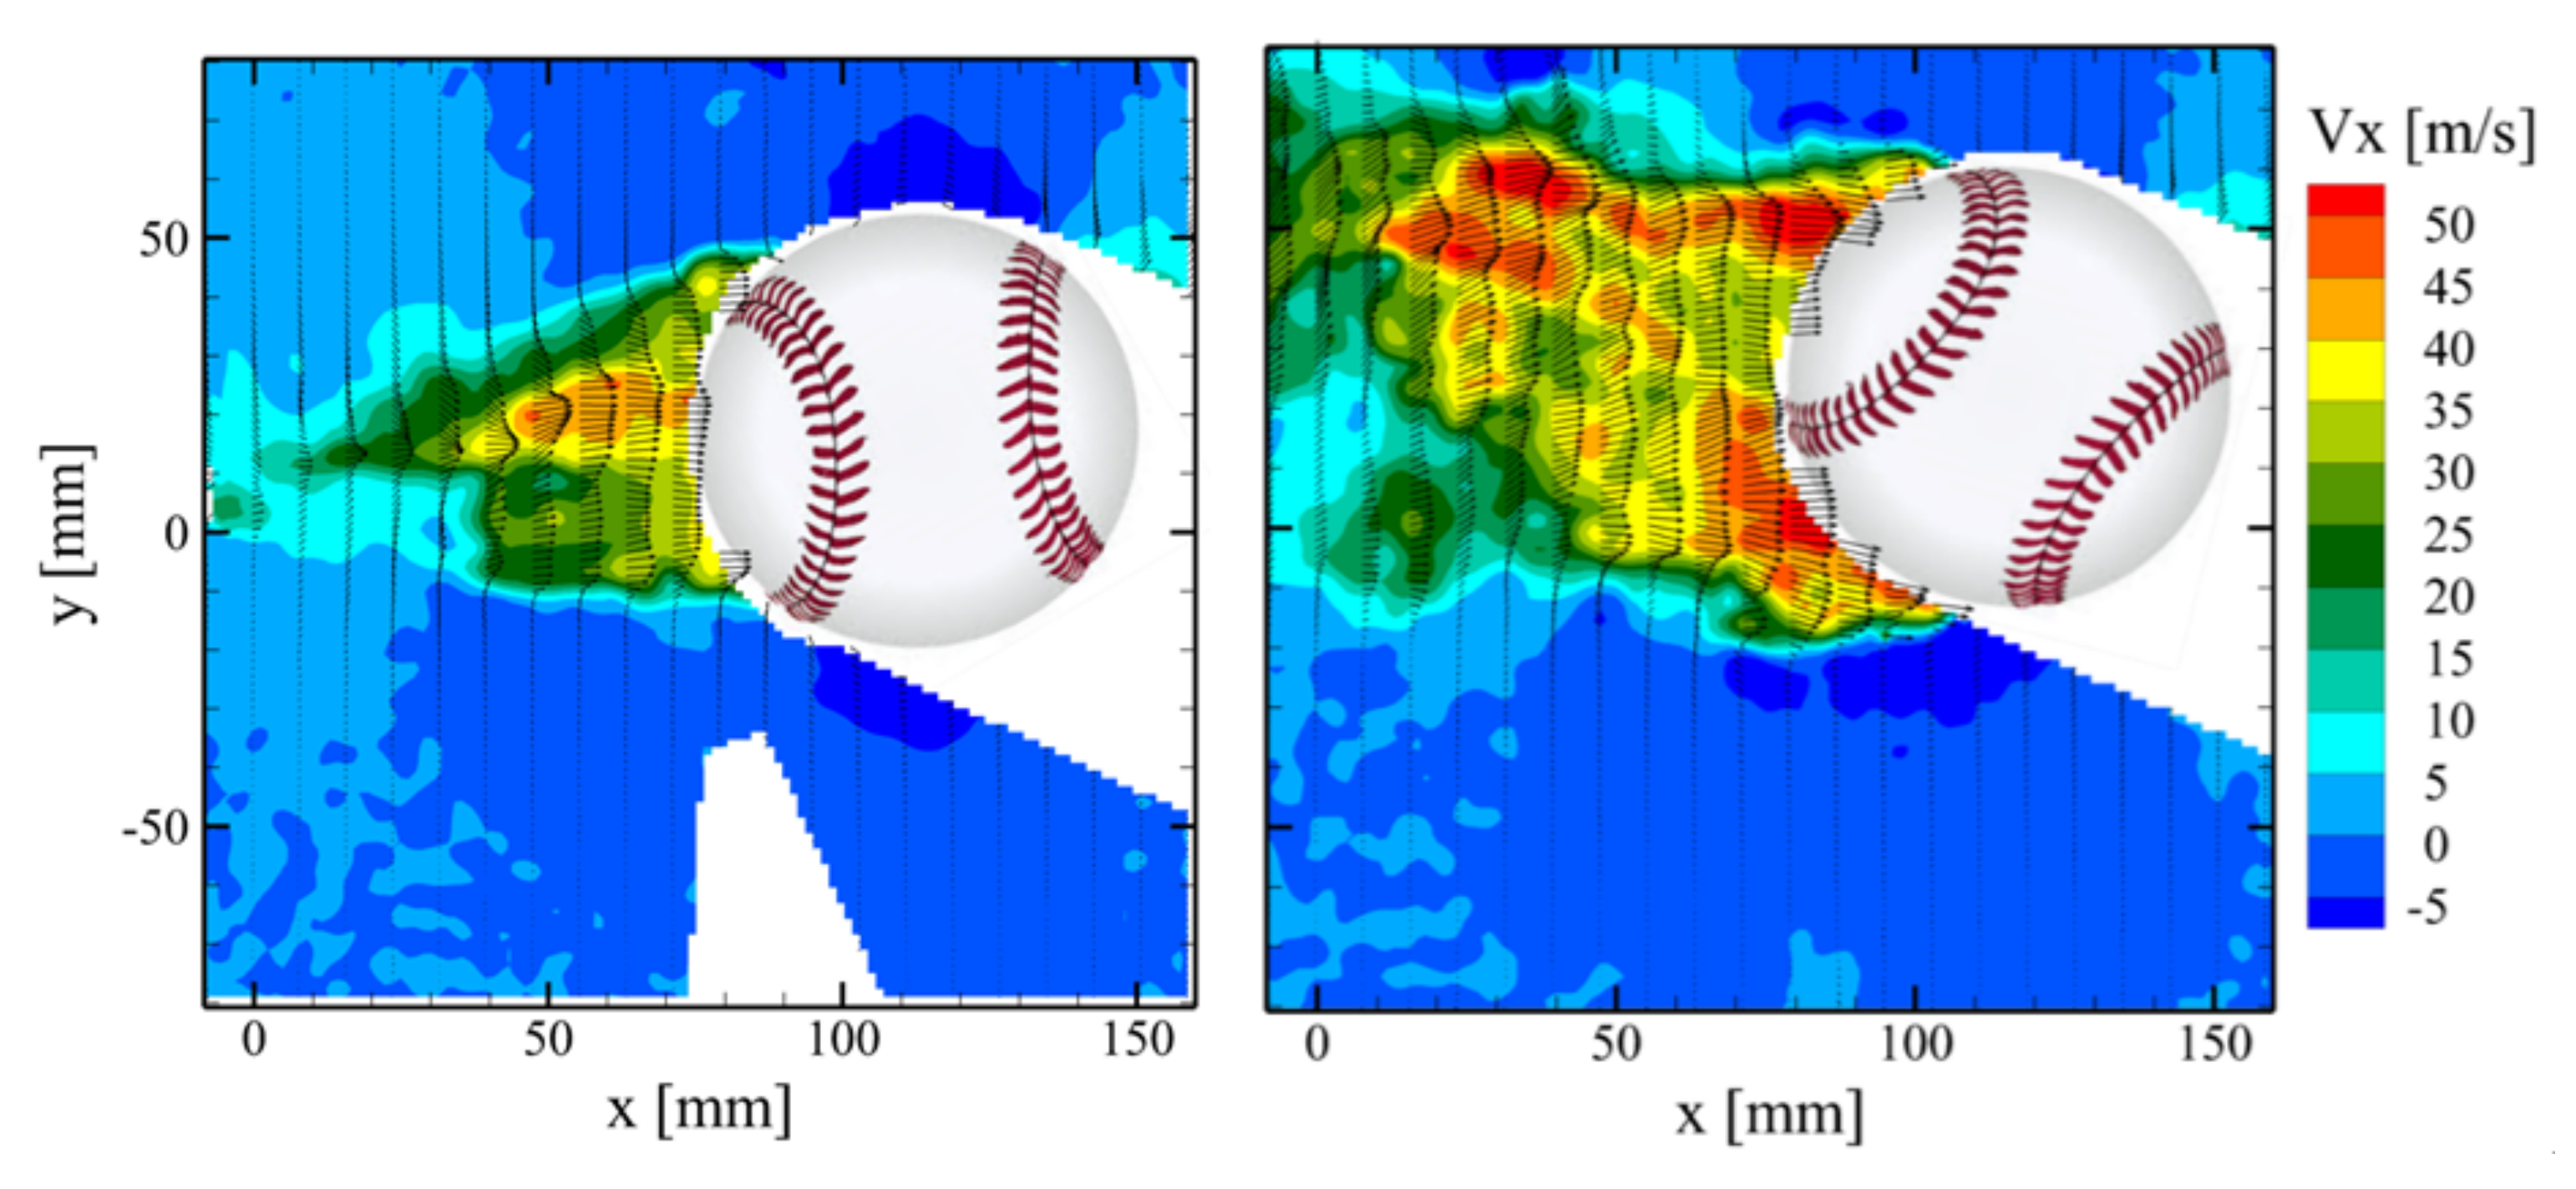
20]. This is confirmed by the velocity fields illustrated in
Figure 6 for the orientations of 85° (
Figure 6—left) and 45° (
Figure 6—right). At
θ = 85°, the flow remains attached to the baseball’s surface up to ±130° from the stagnation point, producing a narrow wake and low aerodynamic drag. Conversely, for the
θ = 45° orientation, flow separation occurs at ±100° from the stagnation point, yielding a wide wake and high aerodynamic drag.
The data in
Figure 5 were averaged to allow comparison to the drag of balls projected with spin. Since the number of shots at each orientation was not evenly distributed, a simple average of the data would bias the drag toward the 0 and 90° orientations. Drag as a function of ball orientation was fit to a fourth-order polynomial. The average drag coefficient from this fit was 0.348. In order to obtain a spinning drag coefficient, balls 1, 2 and 3 were projected through the same drag measuring system with a 2500 ± 250 rpm spin rate, using the cradle described in
Figure 3. The average drag coefficient from these balls was 0.358, in agreement with drag found elsewhere [
13,
14,
16,
17]. The spinning and non-spinning average drag coefficients are in close agreement, as was observed in the comparison of non-rotating wind tunnel and rotating free flight drag measurements presented in the introduction. The spinning drag measurements (0.358) are slightly higher than the non-spinning results (0.348), consistent with the effects of spin on drag [
18].
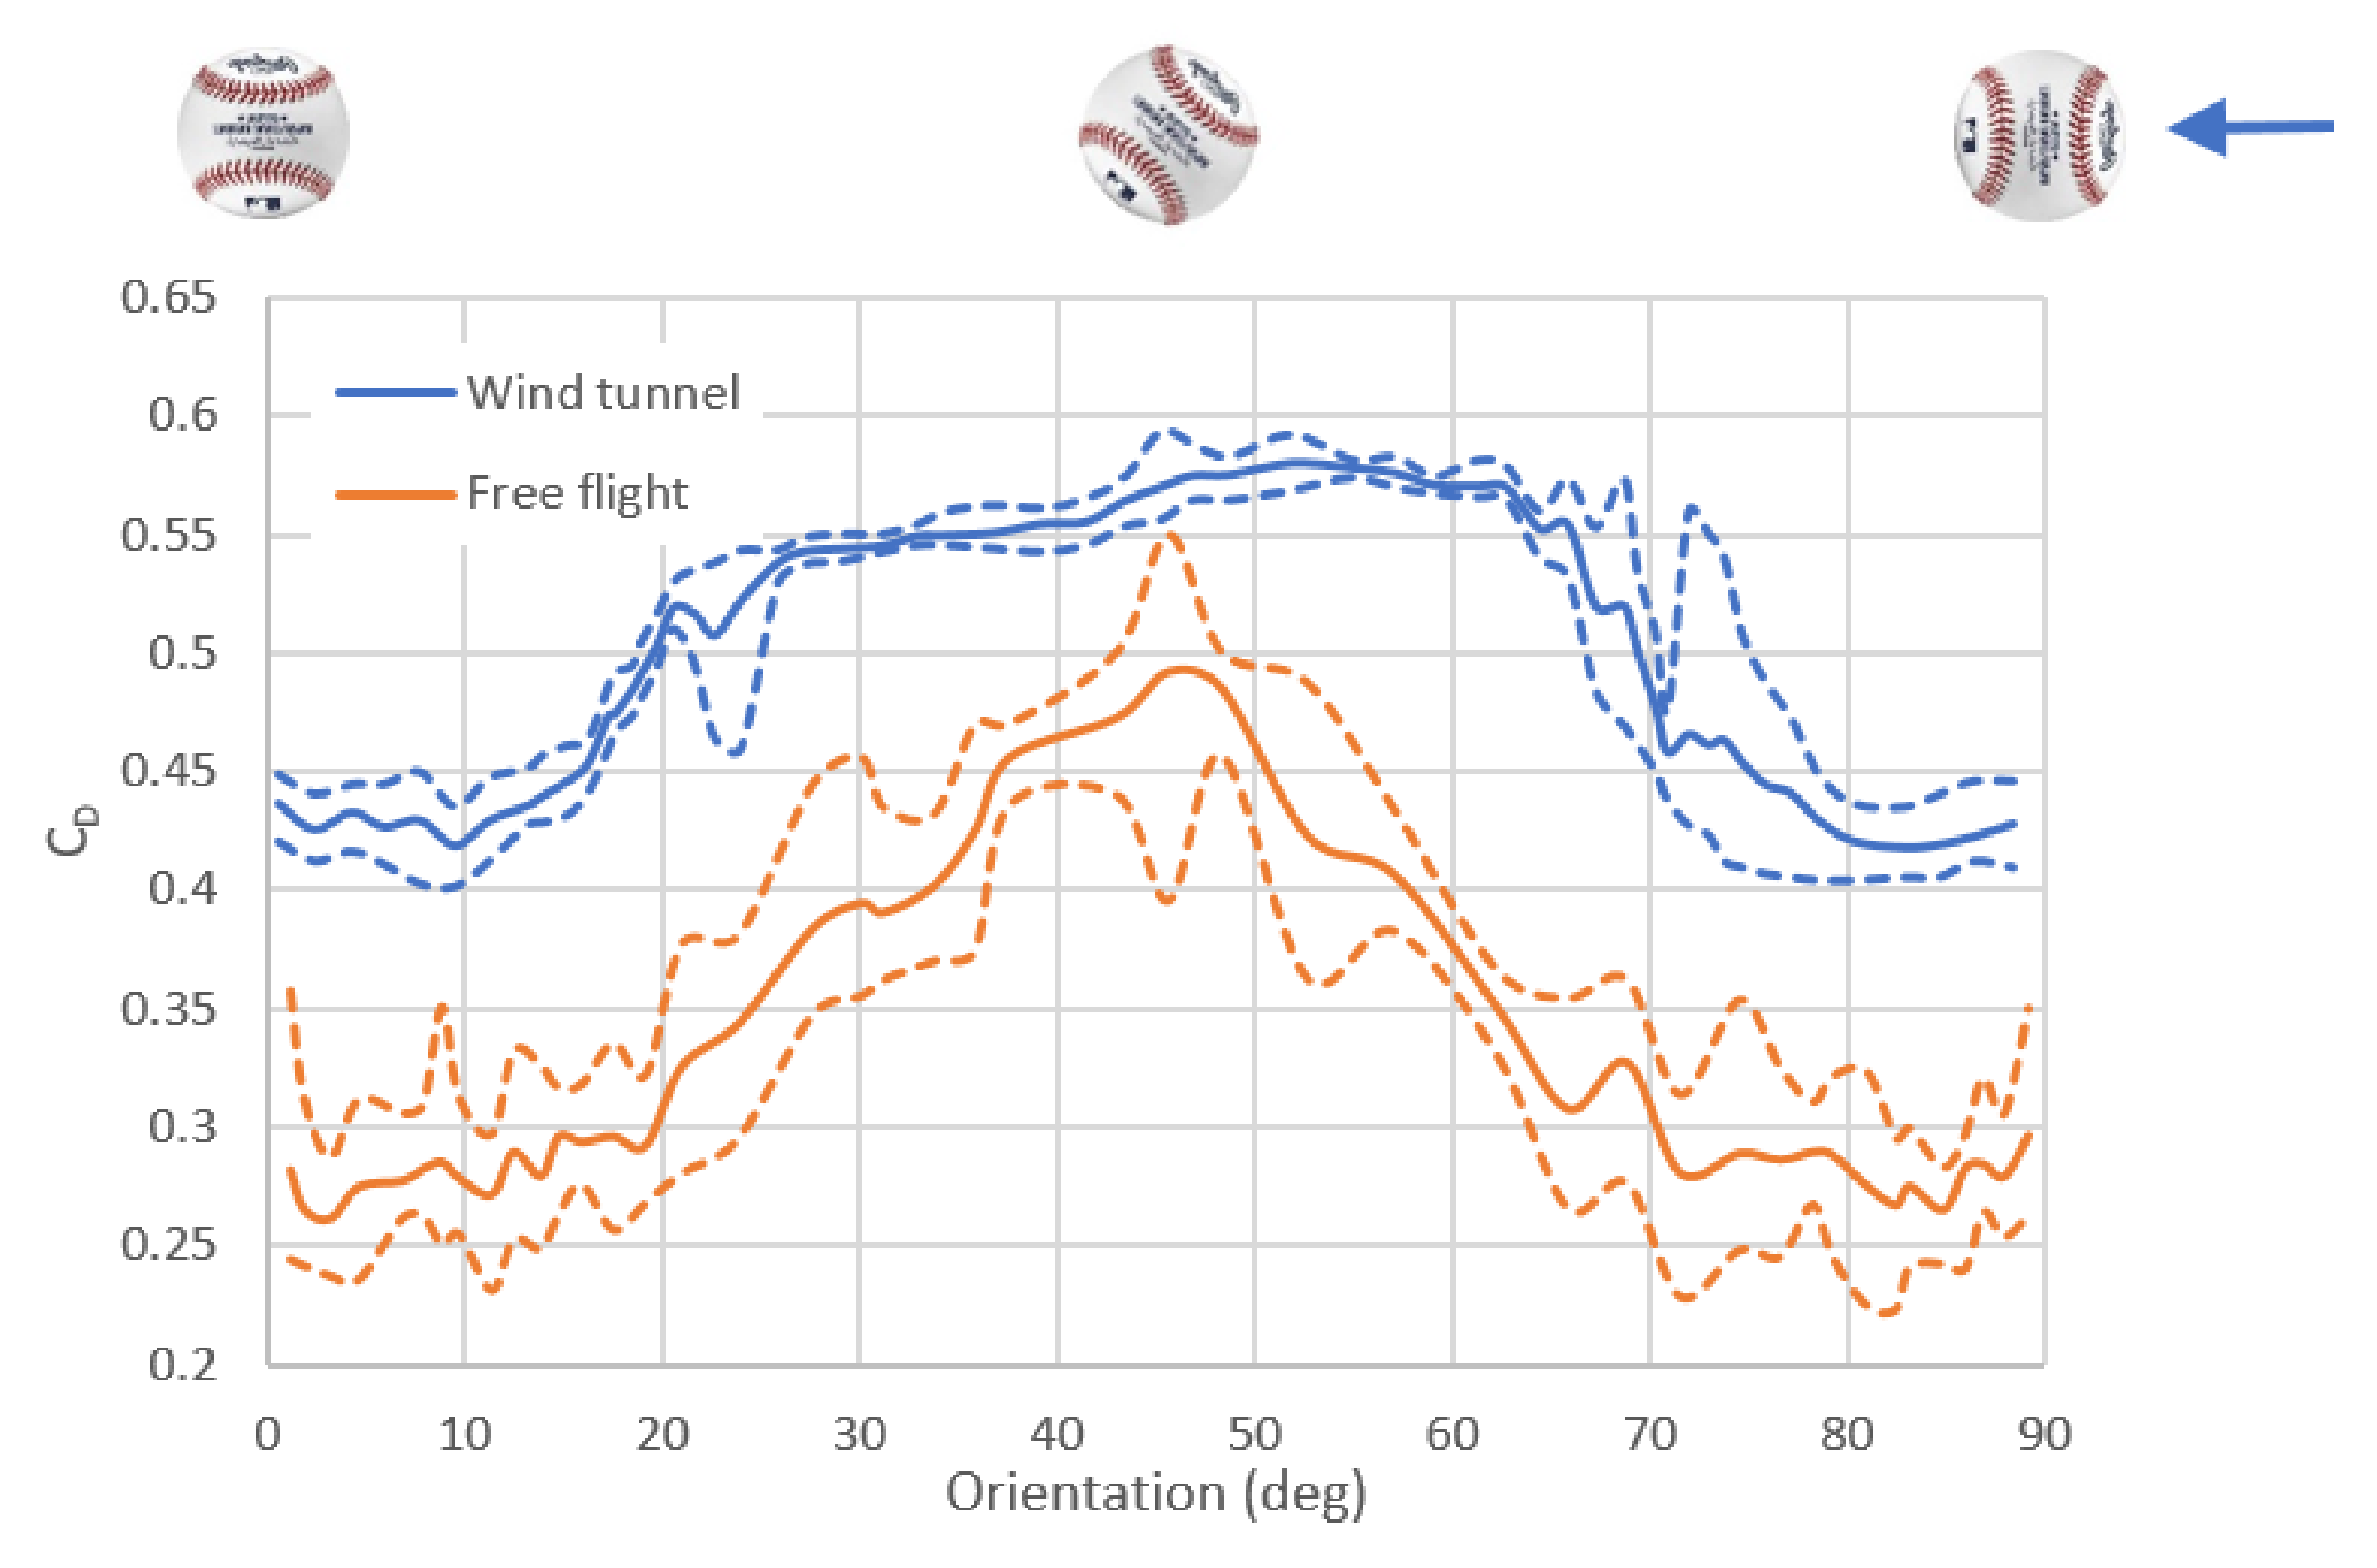
The data in
Figure 5 were smoothed using a moving five-point average, as shown in
Figure 7. The dotted lines represent the maximum and minimum over each five-point averaging span. The 0–90° symmetry condition was applied to the wind tunnel results from
Figure 1 (taken from [
10]) and are plotted in
Figure 7 using the same five-point averaging scheme applied to the free flight drag results. The wind tunnel and free flight drag measurements show a similar dependence on orientation, in that a peak drag coefficient is observed near 45°, and minima near 0 and 90°. The wind tunnel measurements appear to be more repeatable than the free flight measurements, which is attributed to the higher statistical convergence of the wind tunnel measurements and the different number of balls used for each study (the wind tunnel tests used one ball, while the free flight tests used three balls).
Drag from the wind tunnel tests was higher than that found from the free flight. The wind tunnel tests were performed at a slower speed than the free flight tests (30 vs. 36 m/s). The ball used in the wind tunnel tests was identified as “commercially available”, and may have had higher seams than the MLB balls used in the free-flight tests. These differences, along with the differences of the experimental setups (namely, the presence of model support in the wind tunnel measurements), are likely responsible for the lower drag measured in free flight.
The wind tunnel results exhibit a plateau between about 25 and 65°, while the free flight drag tends to peak at 45°, with no evidence of a plateau. The difference could be due to the different seam heights of the balls for each study or to a flow disturbance from the stinger used to support and rotate the ball. The stinger could fix the flow separation on the side of the ball, a location on the ball that maximizes drag.


