Article

Target Maintenance in Gaming via Saliency Augmentation: An Early-Stage Scotoma Simulation Study Using Virtual Reality (VR)

by
Alexandra Sipatchin
1,*,
Miguel García García
1 and
Siegfried Wahl
1,2
1
Institute for Ophthalmic Research, 72076 Tübingen, Germany
2
Carl Zeiss Vision International GmbH, 73430 Aalen, Germany
*
Author to whom correspondence should be addressed.
Appl. Sci. 2021, 11(15), 7164; https://doi.org/10.3390/app11157164
Submission received: 23 June 2021 / Revised: 27 July 2021 / Accepted: 28 July 2021 / Published: 3 August 2021
(This article belongs to the Special Issue Serious Games and Mixed Reality Applications for Healthcare)

Abstract

:
This study addresses the importance of salience placement before or after scotoma development for an efficient target allocation in the visual field. Pre-allocation of attention is a mechanism known to induce a better gaze positioning towards the target. Three different conditions were tested: a simulated central scotoma, a salience augmentation surrounding the scotoma and a baseline condition without any simulation. All conditions were investigated within a virtual reality VR gaming environment. Participants were tested in two different orders, either the salient cue was applied together with the scotoma before being presented with the scotoma alone or the scotoma in the wild was presented before and, then, with the augmentation around it. Both groups showed a change in gaze behaviour when saliency was applied. However, in the second group, salient augmentation also induced changes in gaze behaviour for the scotoma condition without augmentation, gazing above and outside the scotoma following previous literature. These preliminary results indicate salience placement before developing an advanced stage of scotoma can induce effective and rapid training for efficient target maintenance during VR gaming. The study shows the potential of salience and VR gaming as therapy for early AMD patients.

1. Introduction

The macula is the human eye’s richest area in terms of photoreceptors. This part of the retina is endeavoured to produce a sharp image of the objects we gaze upon. Hence, deterioration of this area may lead to the formation of scotomas or areas with partial or complete diminished visual acuity.
Amid the different conditions that can deteriorate the status of the macula, two are the conditions that appear more often: the myopic macular degeneration, which occurs in the presence of high myopia [1], and the age-related macular degeneration (AMD), which usually appears in the last decades of life [2]. Myopic macular degeneration and AMD combined affect approximately 11% of the world’s population [1,3].
Patients with macular degeneration are known to adapt to the central visual loss by modifying the so-called foveated behaviour, i.e., objects of interest will no longer be fixated within the macula. A peripheral behaviour substitutes this foveation, meaning that patients will learn to fixate away from the target of interest so that the target can be positioned on a healthy retinal location, and consequently acknowledged. This technique is called eccentric viewing, and the healthy part of the retina used to look at objects is referred to as the preferred retinal locus (PRL). This peripheral gaze behaviour is known to be the only way that patients have to continue their daily life [4].
However, the peripheral retina has a poor visual resolution [5], and it is not intended to acknowledge details in focused objects. It takes time to adapt and modify the natural foveation behaviour, but in the end, one or more eccentric PRLs develop naturally [6,7,8,9,10]. Correct adaptation and use of the retinal areas with intact visual quality are a key part of safely continuing day-life activities such as safely crossing the street [11,12].
New technologies such as virtual reality (VR) and augmented reality (AR) have recently proposed new assisting tools for patients suffering from macular degeneration [13,14,15]. These tools aim to improve the quality of life of patients by improving the eccentric viewing and assisting patients specifically during critical tasks.
Embracing these new technologies and applying them to patients can assist them in improving eccentric fixation. Likewise, these technologies can be used with healthy subjects to study improvements in gaze behaviour under simulated visual loss conditions.
Standardised gaze-contingent scotoma simulations can change gaze behaviour in healthy participants in the same way as patients do [16,17,18,19,20] and scotoma simulations can replicate visual loss in a standardised manner with a well-defined area and filling [21,22,23]. Thanks to this standardization, there is the advantage to overcome the variability of different shapes and positions the scotoma patients bring into studies [16,17] and investigate augmentations in a generalized manner that can get later validated when applied to patients [24].
In this study, a standardised gaze-contingent scotoma simulation was used to occlude the central vision bilaterally to test, for the first time, the effects of gaze placement before and after salience application. The study’s purpose was to test the hypothesis according to which preventive attention placement can lead to a better target positioning in relation to scotomas [4,25].
An augmented peripheral cue was designed to be perceived as salient, and induce the eyes to position a moving target outside the central occluded area. The circular cue was applied to the dominant eye only, in the periphery and gaze-contingent. A unique-eye-of-origin stimulus presented in the periphery is known to attract the gaze towards its position; it induces a popping-out effect, known as saliency [26]. Furthermore, the augmentation was gaze-contingent, with a constant position in the peripheral visual field. It is known that peripheral cues have an automatic component of attention allocation that once they have triggered it, its focus is preserved in that location [27,28]. For the present study, this means that once the eyes were attracted towards the peripheral cue, the target would start to be positioned in an annulus area where automatic attention is known to be focused [27].
Traditional tasks used for PRL development studies and therapy can be repetitive, exhaustive, and tedious, ending in a decrease in the subject’s motivation [29]. For the current study, a VR game that involved tracking and detecting changes in a moving object was introduced to re-definite these traditional tasks. Gamification, in this context, was intended as a leap from those training sessions to more engaging experiment blocks.

2. Materials and Methods

2.1. Participants

Thirteen participants took part in the study (7 females and 6 males, mean age 29, standard deviation (SD) ± 3 years, only one subject wearing eye-correction, eye contact lenses).

2.2. Set-Up

For the virtual experiment, the Unity 2019.3.0a5 version was used as a design tool, with C# as a programming language, running on a PC with Windows 10 Home, having a 64-bit operating system, an Intel Core i7 -7700HQ, 2.8 GHz, 16 GB RAM, and an NVIDIA GeForce GTX 1070 GDDR5 graphics card.
The HTC Vive Pro Eye [30] headset was used to present the virtual environment. This headset has an integrated eye tracker with a sampling frequency of 120 Hz and a known latency between 58 ms and 80 ms [31,32]. This HMD also has two AMOLED screens, with a resolution of 1.440 × 1.600 pixels to each eye (pixel density of 615 pixels per inch (PPI)), and a refresh rate of 90 Hz. Tobii Pro SDK v1.7.1.1081 [33] and Vive SRanipal SDK v1.0.3.0 [34] were used to save eye-tracking data and to present the gaze-contingent simulations, respectively. A Microsoft Xbox wireless controller was used for subject input.

2.3. Calibration Procedure

An initial semi-automated inter-pupillary distance (IPD) adjustment and a calibration of five points (SRAnipal) was carried out for all participants at the beginning of each condition. The participant sets the IPD through a knob that can be rotated to adjust the lenses distance. Based on the pupil position, the SRAnipal system provides feedback to the subject when the distance has been set correctly. Only after a correct IPD adjustment, the eye-tracking calibration can start. After a correct calibration output offered by the software, the subject could start with each condition type.

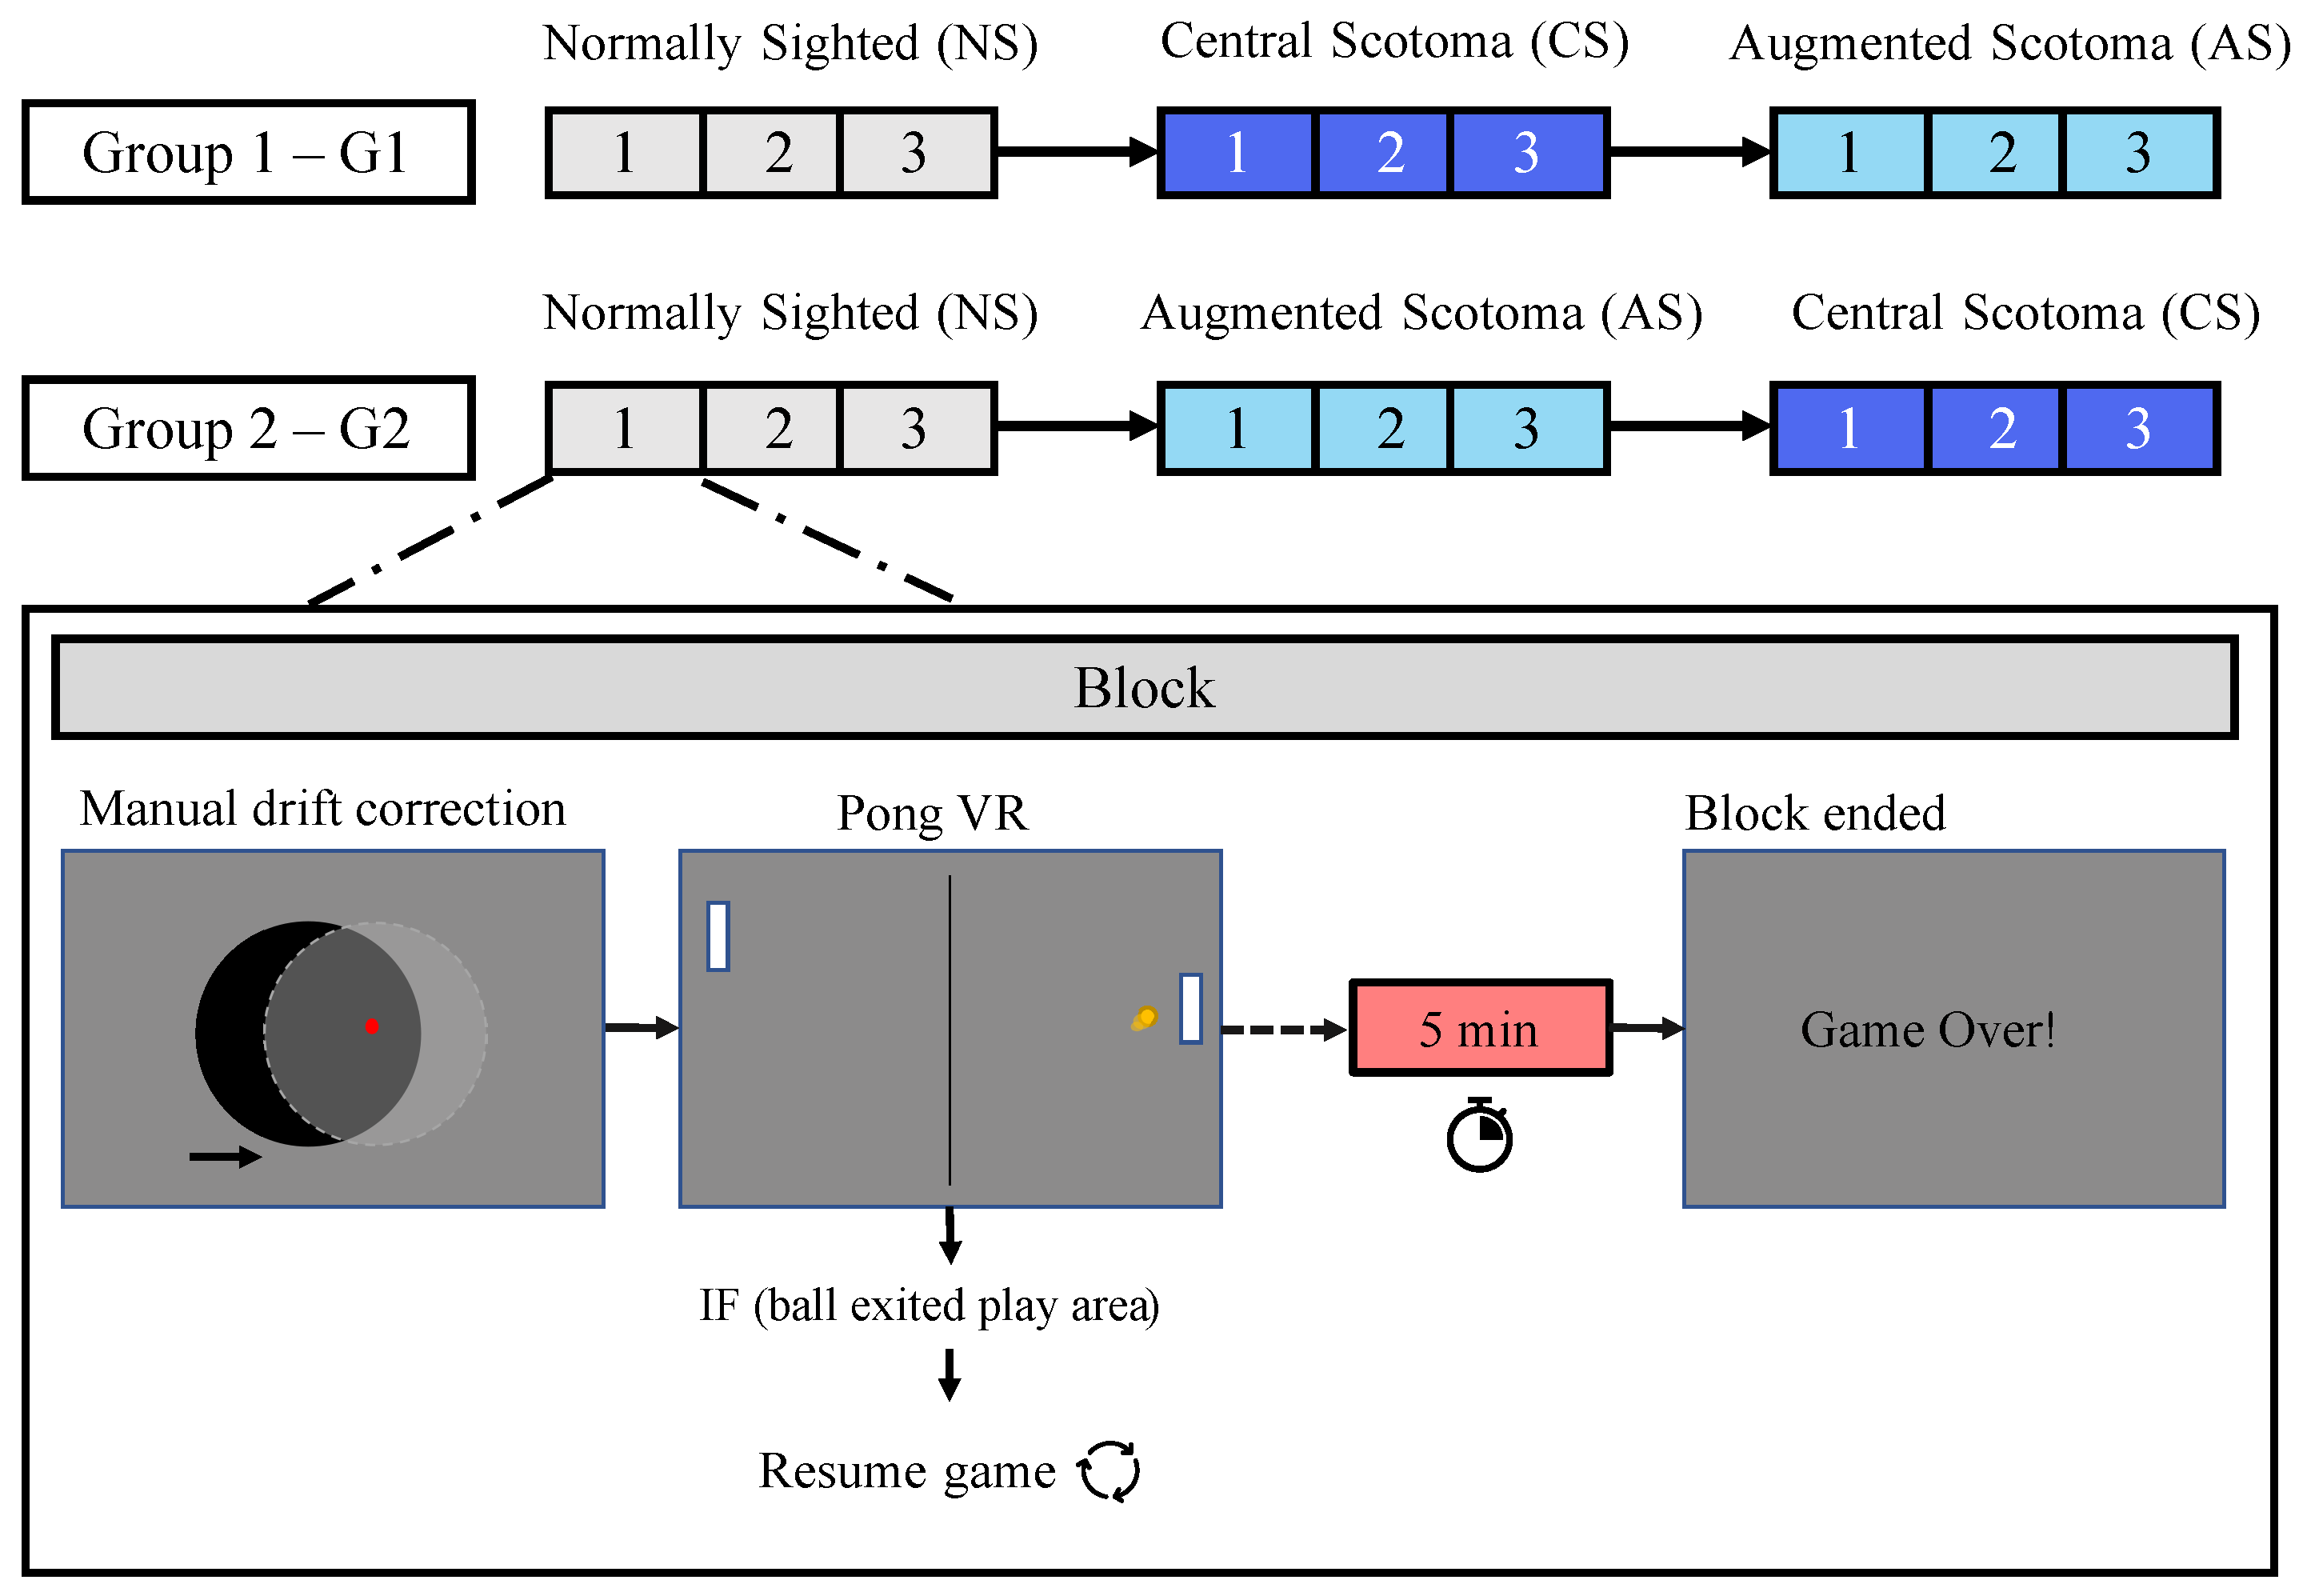
2.4. Experimental Procedure
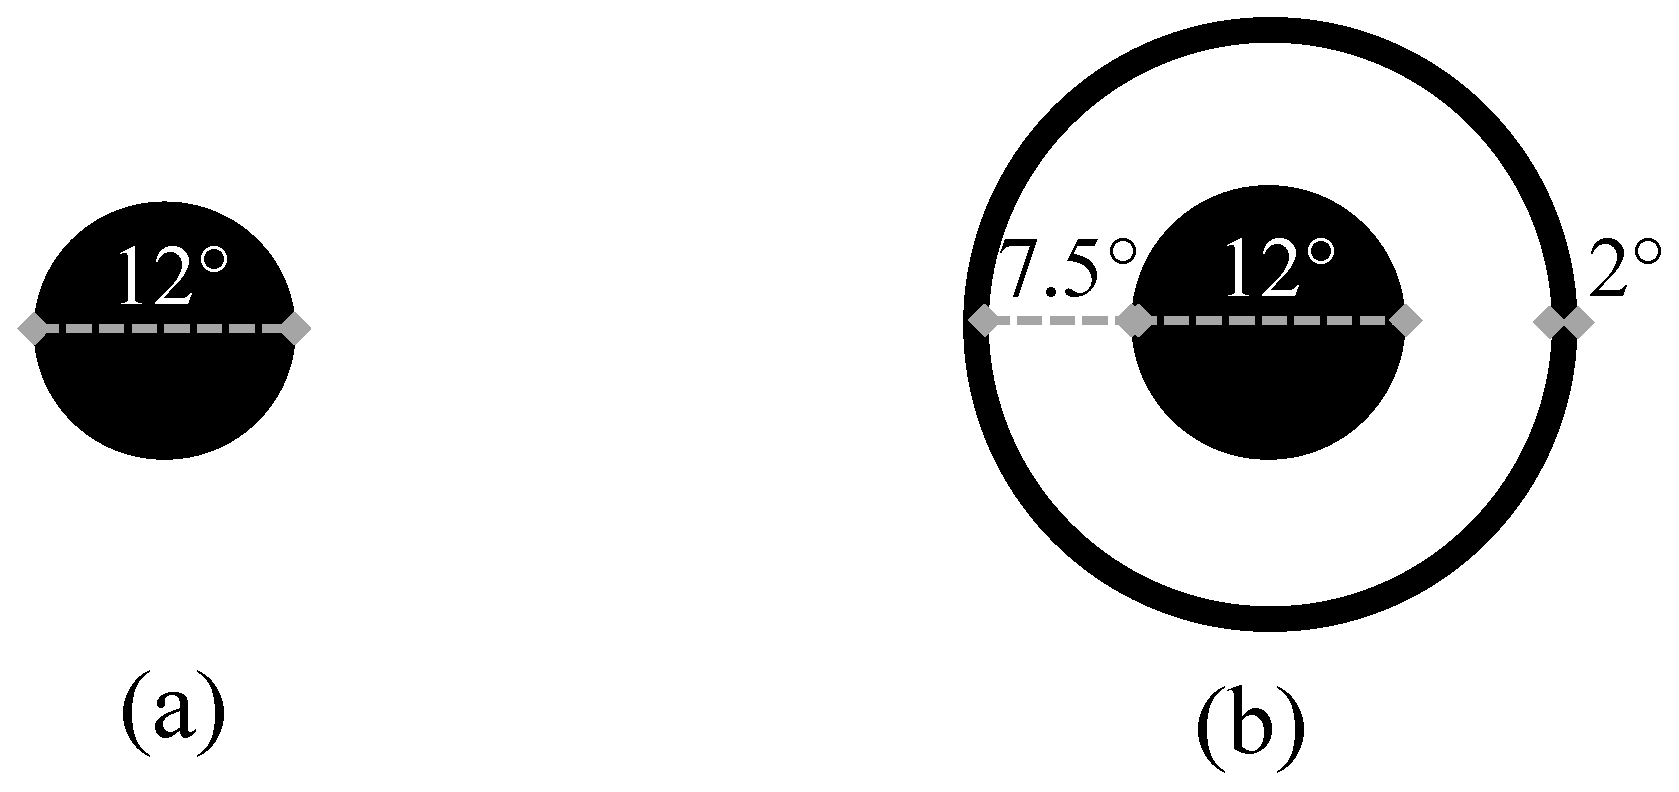
Participants were asked to pursuit a moving target with unrestricted head movement while playing a 2-D Pong game in VR. The playing area covered ±28 horizontally by ±26 vertically. The moving target consisted of a 3 ball moving at an average velocity of 21.74 s 1 (SD: ± 0.63 s 1 ) from one side to the other of the screen following a randomised triangular trajectory. The subjects controlled two paddles to keep the moving ball inside the playing area. If the ball left the playing area, the trial was re-started by the participant.
During the Pong game, the ball changed colour at random intervals. Participants were asked to press a button whenever they acknowledged that the ball stimulus changed colour, which, if recognised, it would increase their score. During the session, the participants could move their heads freely. In addition, a head-fixed rectangle of ± 14.25 horizontally and vertically was presented to motivate the subjects to move their heads.

2.4.1. Conditions

All participants were tested in three (3) conditions: normally sighted, central scotoma, and salience augmentation of scotoma simulation. In the normal condition, no simulation was used while playing the game. During the central scotoma condition, eye-tracking was used to simulate a 12 circular scotoma occluding the central visual field. In the augmented central scotoma condition, a 2 circular augmentation, with a diameter of 27 was implemented around the simulated scotoma and applied to the dominant eye.
Figure 1 shows of how the simulations in the scotoma and augmented condition looked like. Each condition was measured in three blocks of five (5) minutes. Before each block, a manual drift correction had to be performed by the subject.

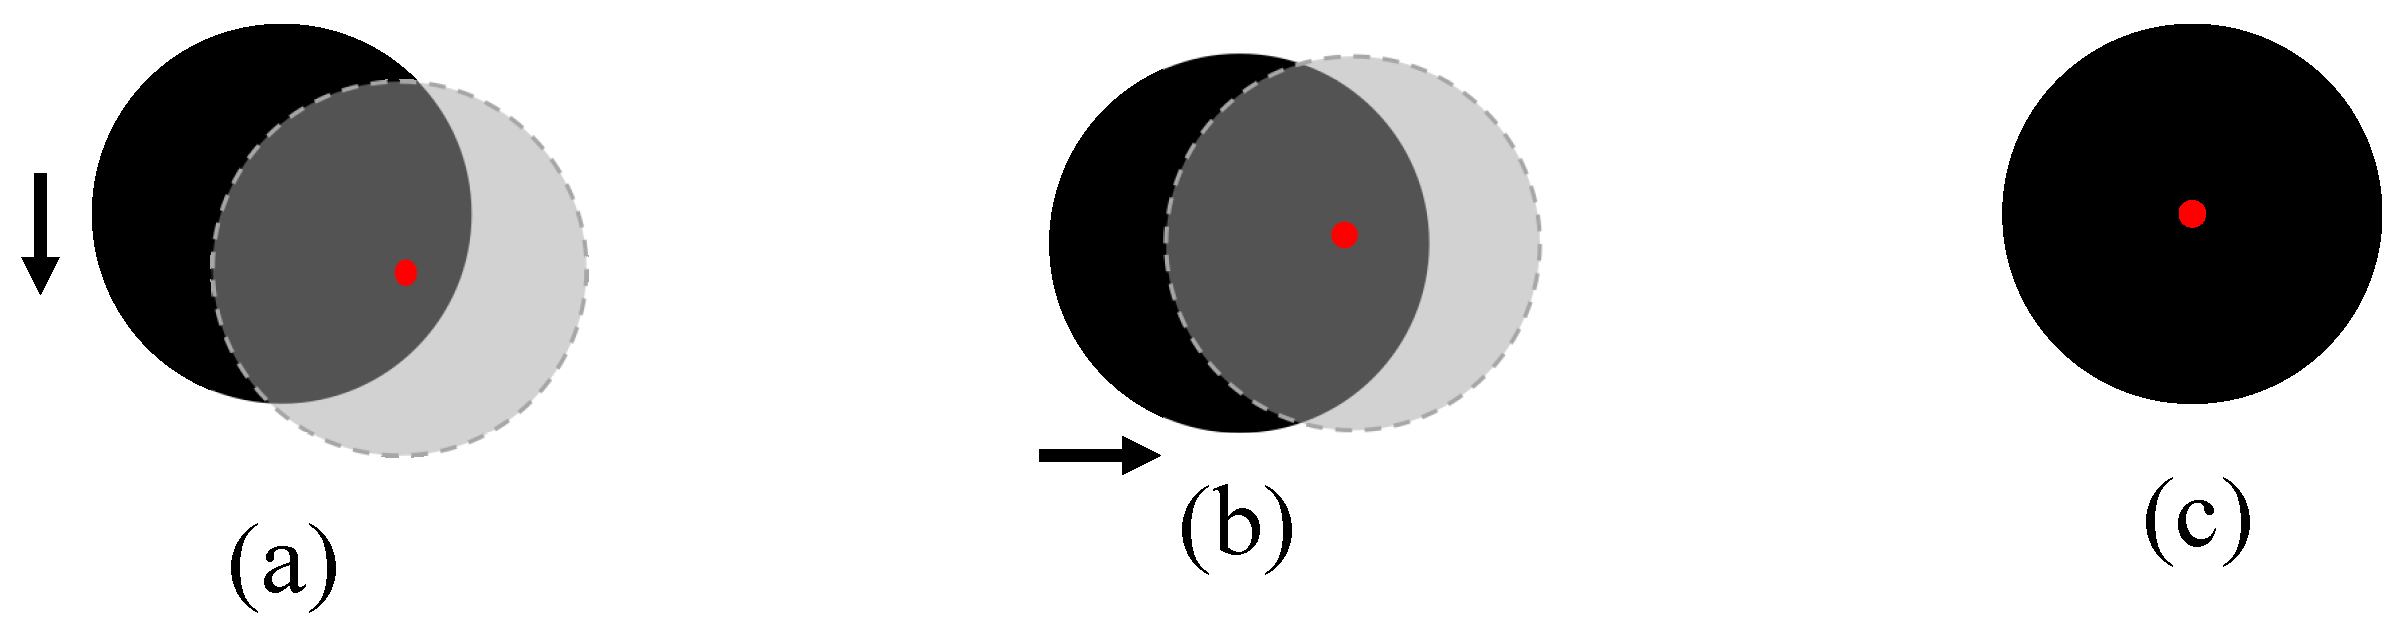
2.4.2. Manual Drift Correction

A manual drift correction was applied at the beginning of each block for all conditions. The manual drift correction (Figure 2) consisted of a manual scotoma adjustment performed by the participant. Each subject was presented with a scotoma simulation for each eye and a central red dot, attached to the eye camera. The red dot was used as a reference to centre the scotoma. Participants could correct the scotoma position using the Xbox controller. After the scotoma was correctly centred and checked by the experimenter, the experimenter pressed a key to start the next block. These offset values were then applied throughout the block session. The drift correction was designed to compensate for eye-tracking data quality decay in VR due to the movement of the participant, which is known to induce drifts into the precision of the eye tracker [35]. These drifts can influence scotoma positioning.

2.5. Groups

The participants were separated into two groups, defined by the order in which the different conditions were presented. Although the augmentation and scotoma conditions were randomized, all subjects started playing the game without any applied simulation first (normally sighted condition) (Figure 3).

3. Data Processing

3.1. Data Pre-Processing

3.1.1. Noise Cancellation: Fluctuation in the Sampling Data

Eye-tracking data were first checked for fluctuations in the sampling rate which can lead to noise in the eye-tracking data introducing spurious variation into the eye movements [36,37]. Sampling rate fluctuations were found if the time that passed between two samplings were bigger than the known inter-sample range ( 8.3 ms, with an error margin of ± 0.4 ms). Following common practice [37], when fluctuations were detected, two data points before, and two data points after the identified fluctuation were deleted from the dataset. After this filter, a percentage of total data exclusion was calculated.

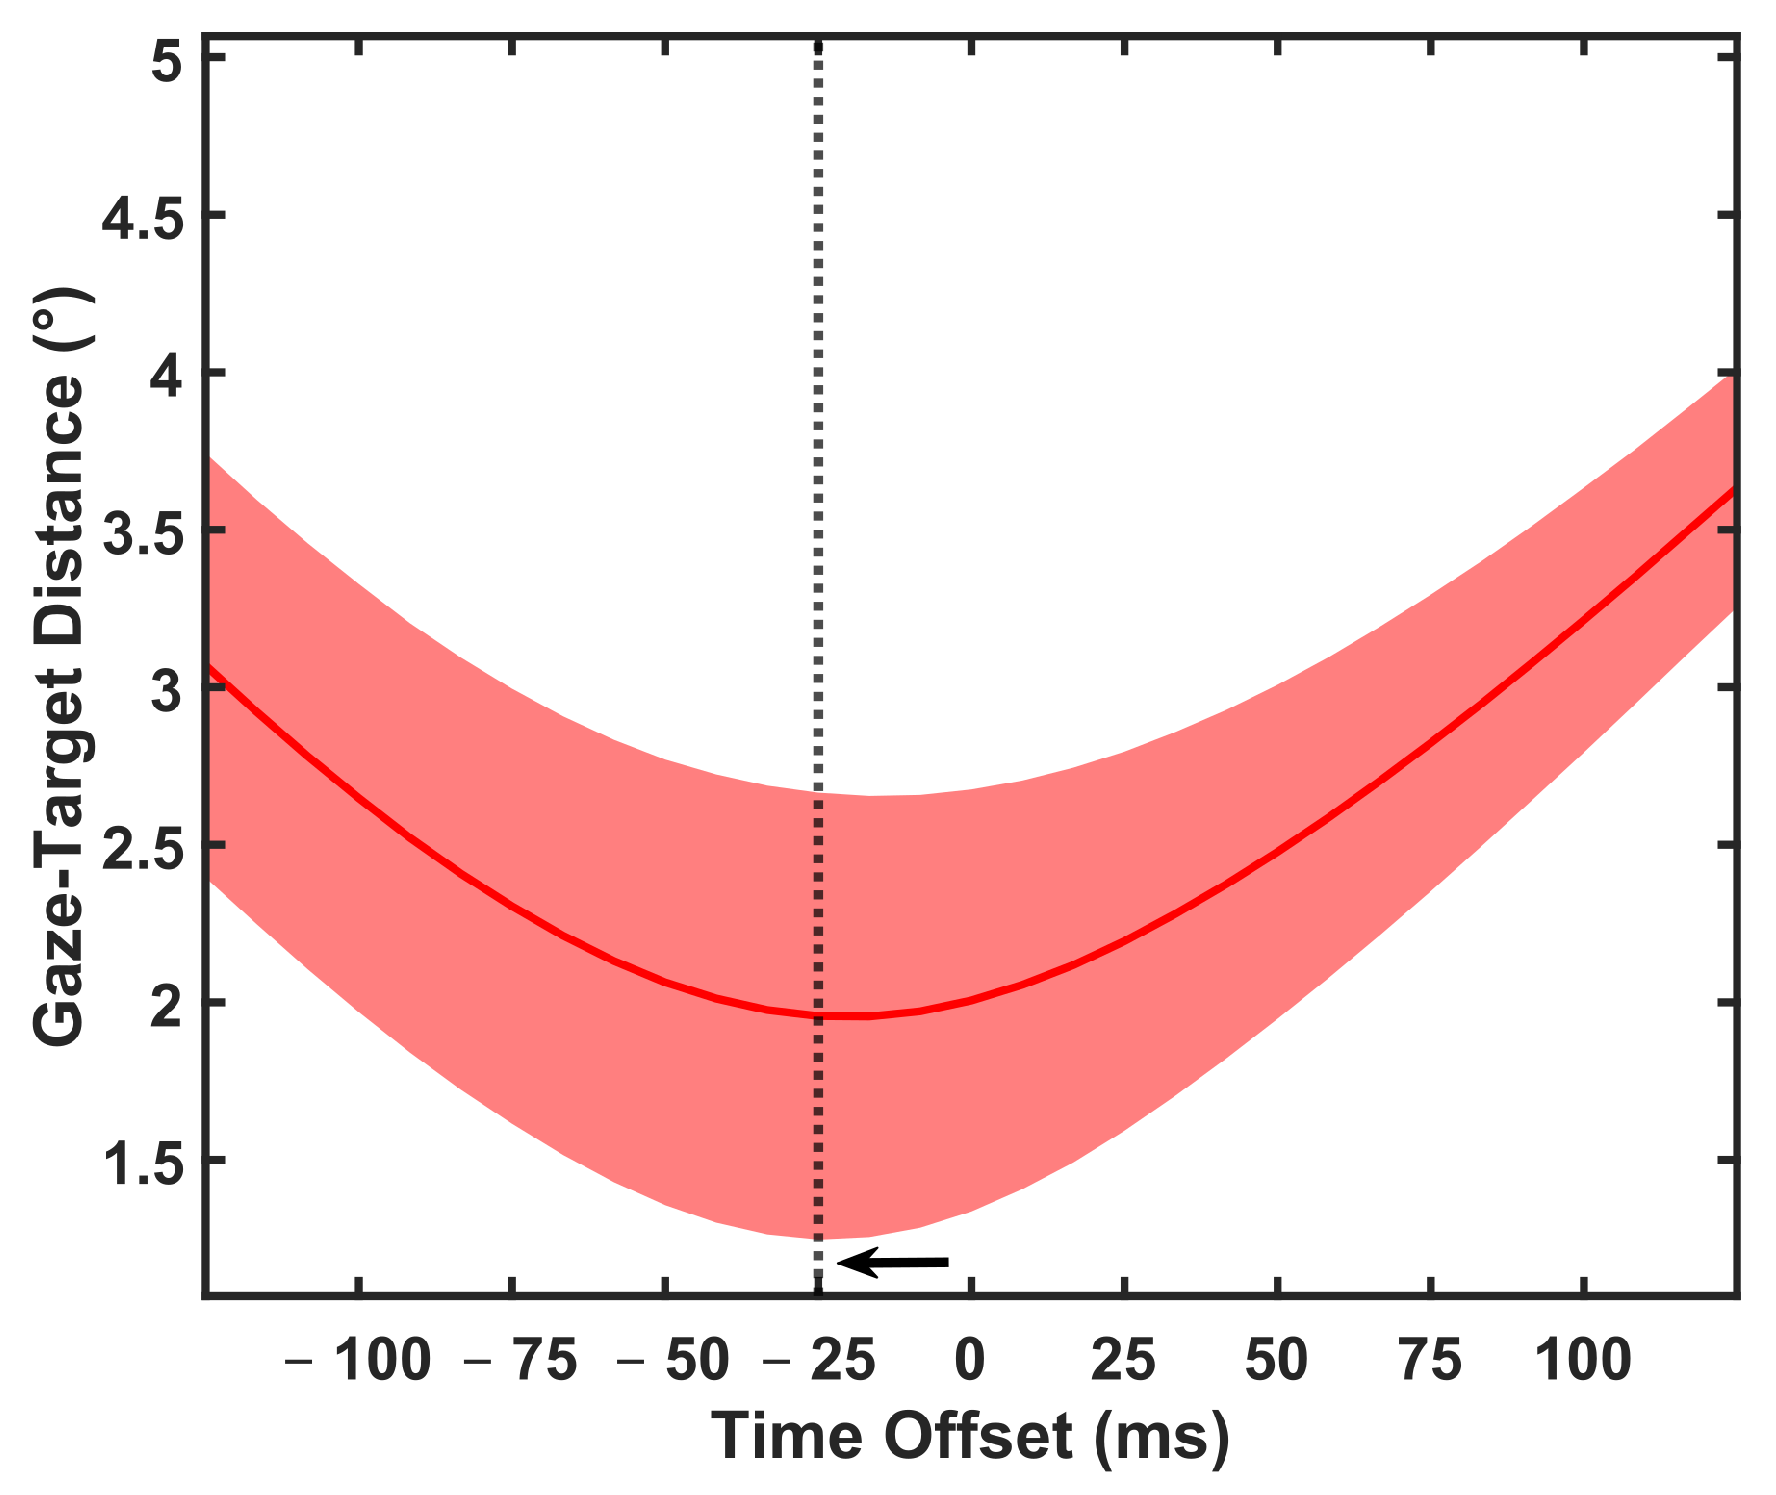
3.1.2. Latency Error Correction

All gaze-contingent paradigms are always subject to a lag between where the participant’s current eye position is and where the rendering of the scotoma is shown on display. This latency is related to the system’s processes to display the image based on the eye position. First, it needs to record the eye position and transmit it to the computer; the computer would receive it and shift the scotoma position, render the new image, and finally, it displays the new image on the headset screen [38]. This delay in the scotoma presentation means for the current experiment that the scotoma might not cover the exact 6 radius of the central vision at all time.
To account for the latency error between the actual eye’s position and the actual recording of the eye, the target position was used as an indicator of where the recording of the eye should have been. This error can be approximated in the distance between the gaze and target positions measured during the normal condition.
For every frame, the normalised target (re-referenced to the eye) and the dominant eye’s normalised gaze were transformed into two-dimensional Cartesian coordinates. Then, the eye-target distance was calculated using the Pythagorean theorem. For every target data sample, twenty-one eye data points (ten previous to the matching timestamp and ten forward) were registered. The median in the distances between these 21 points and the target position was considered the system standard error.
A mean and the standard deviation [39] for this error were calculated for each subject and assumed as the time delay between the recorded eye position and the actual eye location.

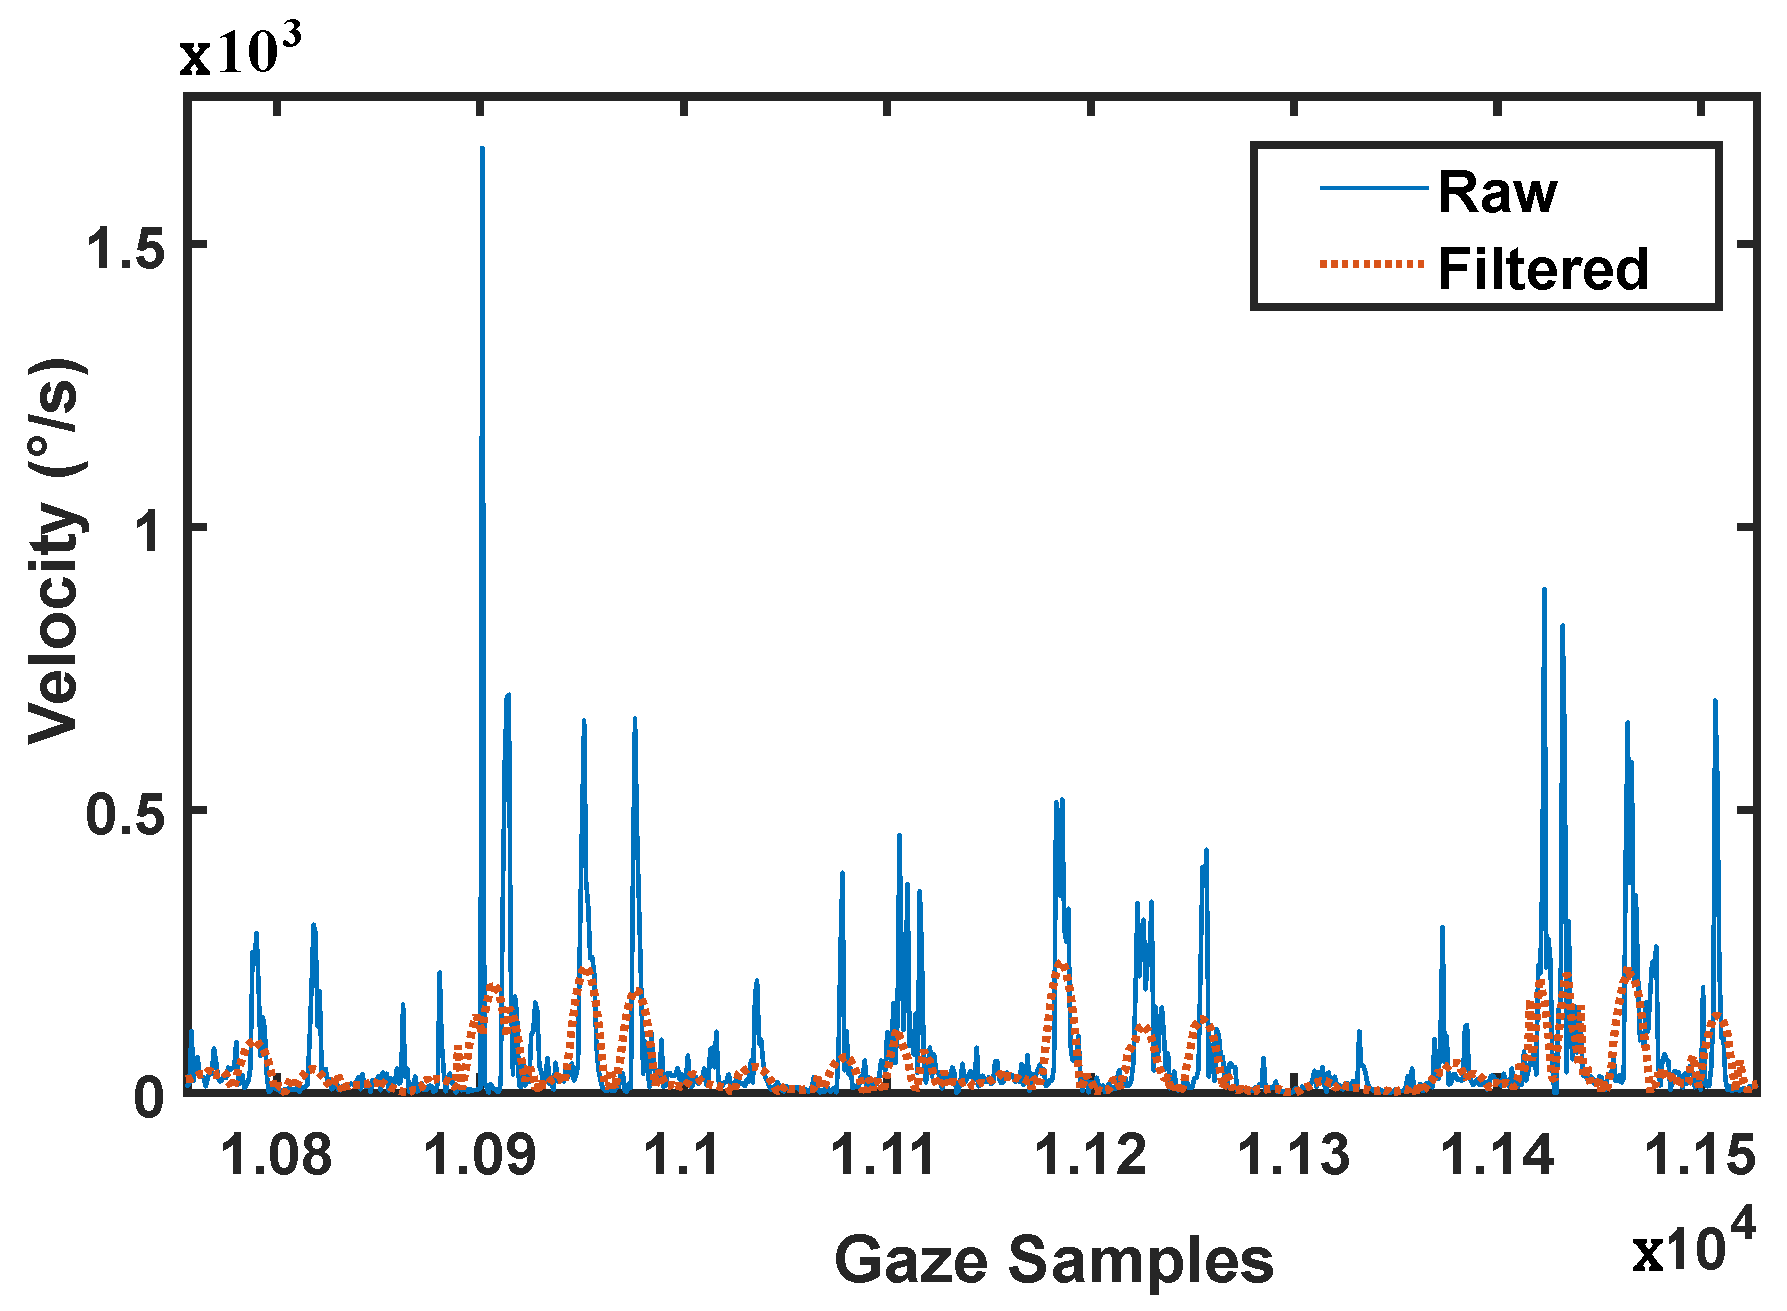
3.1.3. Eye-Tracking Data Filtering

The Nyström and Holmqvist [40] velocity-based algorithm was used to filter the high jumps in eye velocity caused by missing eye data. These jumps occur above the normal velocity of the eye during a saccade ( 300 s 1 ). The sgolay function in Matlab based on Savitzky and Golay [41] was used over the 3D raw gaze coordinates. Sample-to-sample velocity between two consecutive gaze coordinates in degrees was calculated for the raw and filtered data. These velocities were compared to observe the filtering effect of this algorithm.

3.1.4. Saccades Smoothing: Moving Median Window

As described by Shanidze et al. [42], to calculate the gaze-target distance, saccade information is usually kept. To smooth the saccade’s data and look for trends that could otherwise be overlooked due to a high number of saccades that occur during the initial phases of scotoma habituation [43], a moving median window was used. Different sliding windows of 5, 10, 20, and 40 s were compared until saccades smoothing was achieved, and a more clear trend with less volatility in gaze-target distance was observed.

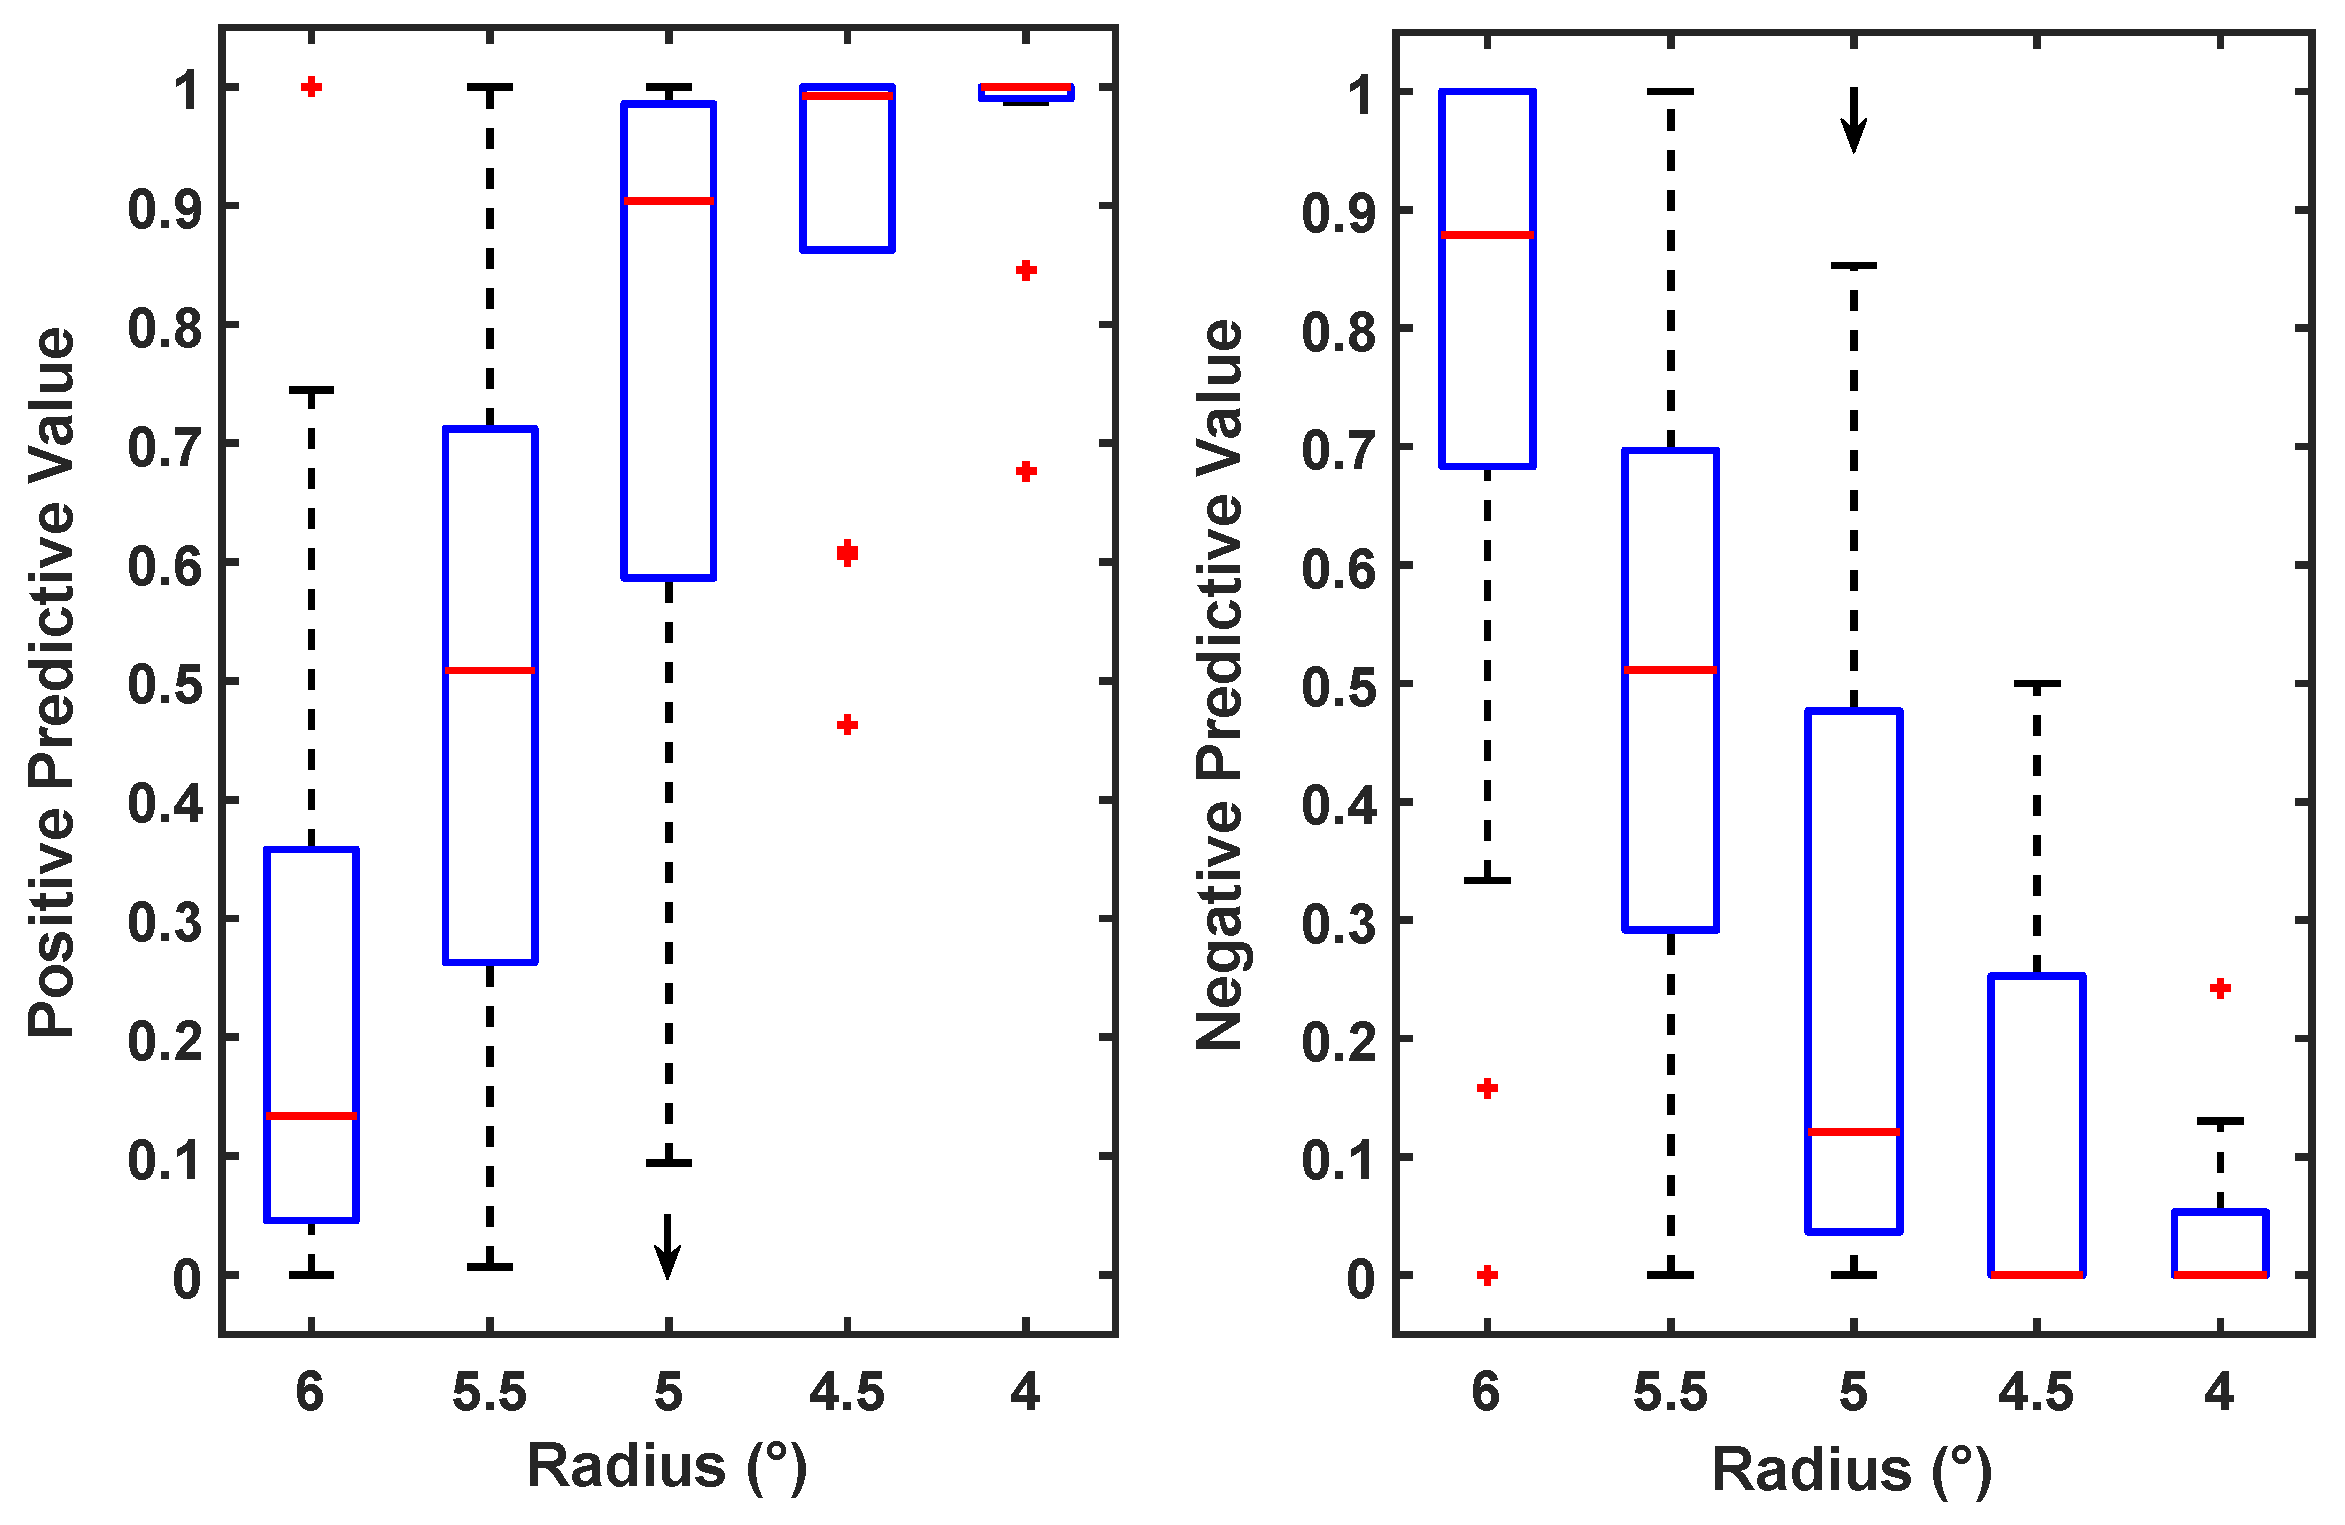
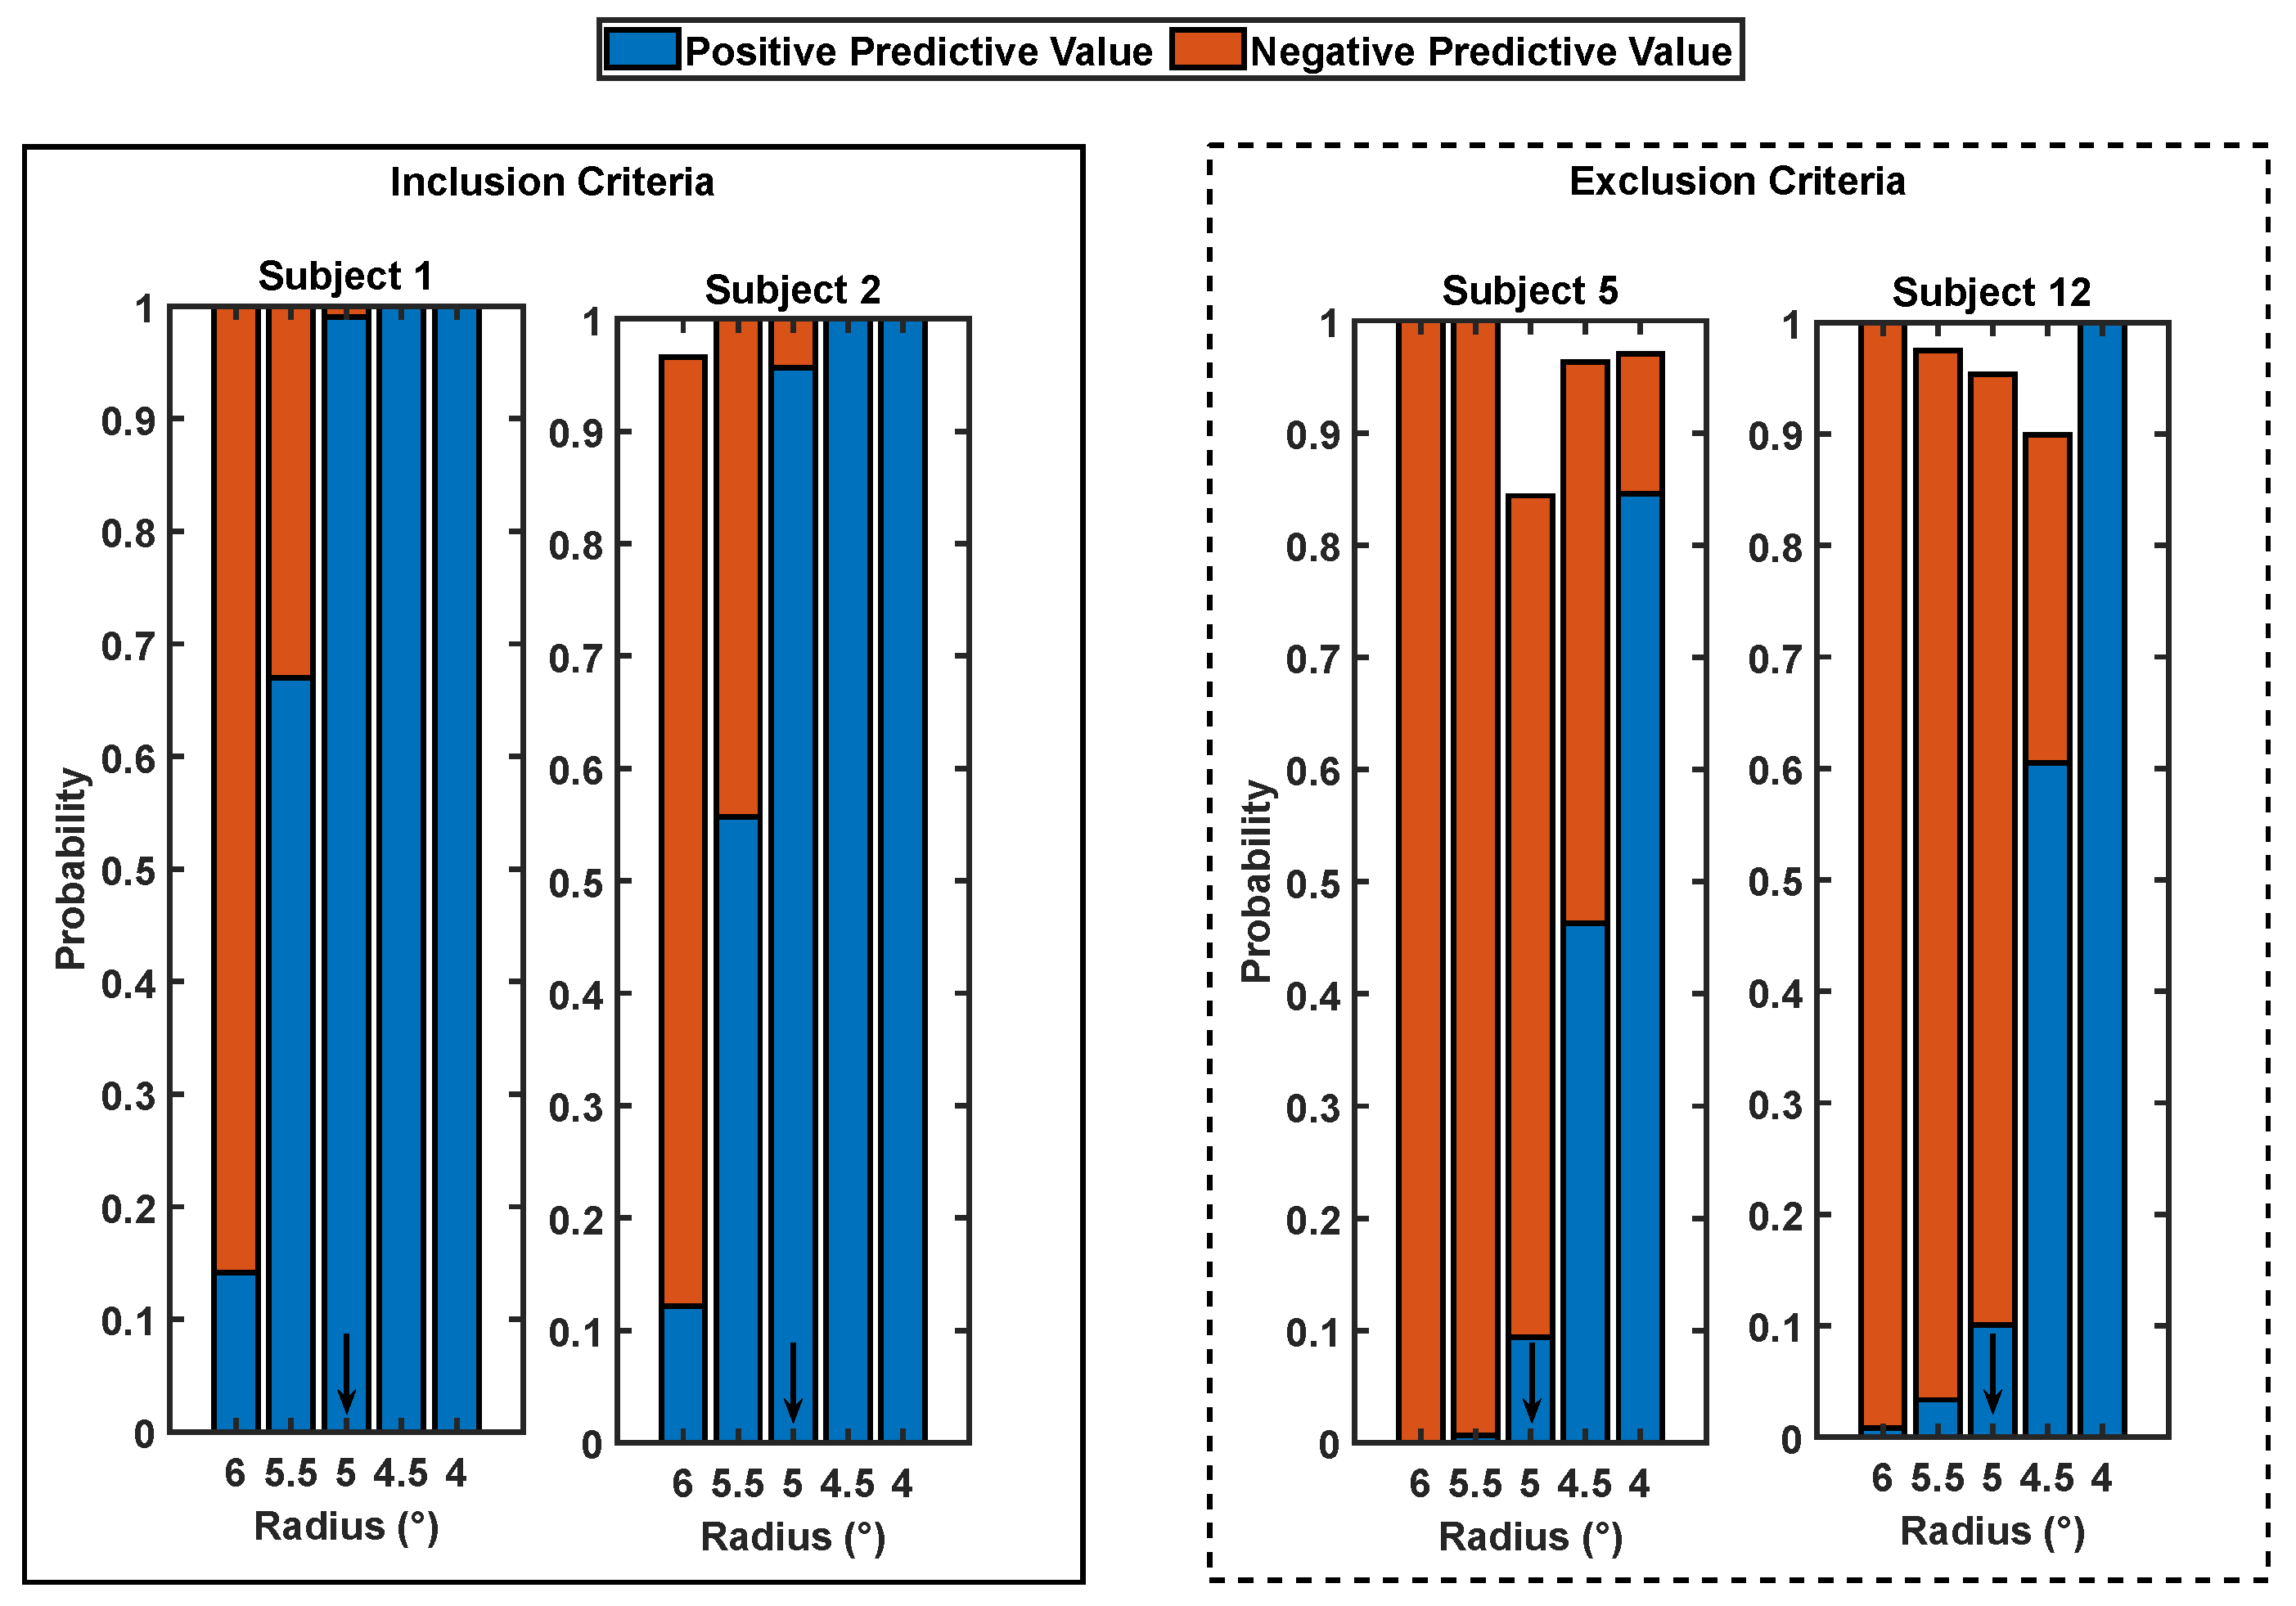
3.1.5. Colour Change Recognition Sub-Task and Scotoma Radius as Cutoff for the Maximum Positive and Negative Predictive Values

Bayes’ theorem was applied to test the probability of colour recognition due to scotoma coverage. The distance between gaze and the edge of the target and whether it was above the scotoma’s radii were used to indicate seen or not seen, and the colour change detection to determine correct or wrong.
Seen and correctly recognised was defined as true-positive, while non-seen and detected was false-positive. Similarly, if the colour change was not detected but the target was visible, it was considered a false-negative. If it was not visible and not detected, it counted as a true-negative. The probability of the positive and the negative predictive value were then calculated for the group and individually, and can indicate that the central vision might not be correctly occluded due to eye movements such as saccades and blinks [44,45]. Hence, the subject could have seen the target outside the intended radius of occlusion partially or entirely when he/she was not supposed to, influencing the correct and incorrect colour recognition task ratio. To test for possible errors in scotoma occlusion, five different scotoma radii extensions were considered, from 6 to 4 , in steps of 0.5 . Suppose an actual error due to partial occlusion of the central visual field was present. In that case, all subjects should present a low positive predictive value and a high negative predictive value for the 6 scotoma radii.
The lower the margin for the scotoma radii, the higher number of positive predictive values are expected. This increase will occur until the positive predictive value would reach a plateau. The opposite would be observed for the negative predictive value. Furthermore, this test allows us to identify the subjects who performed the task correctly from those who did not. Each subject was looked at individually to observe the trend. If the positive and negative predictive values did not show the same trend as the majority did, they were identified as having a bad performance, not in line with the experiment and therefore excluded.

3.2. Data Analysis

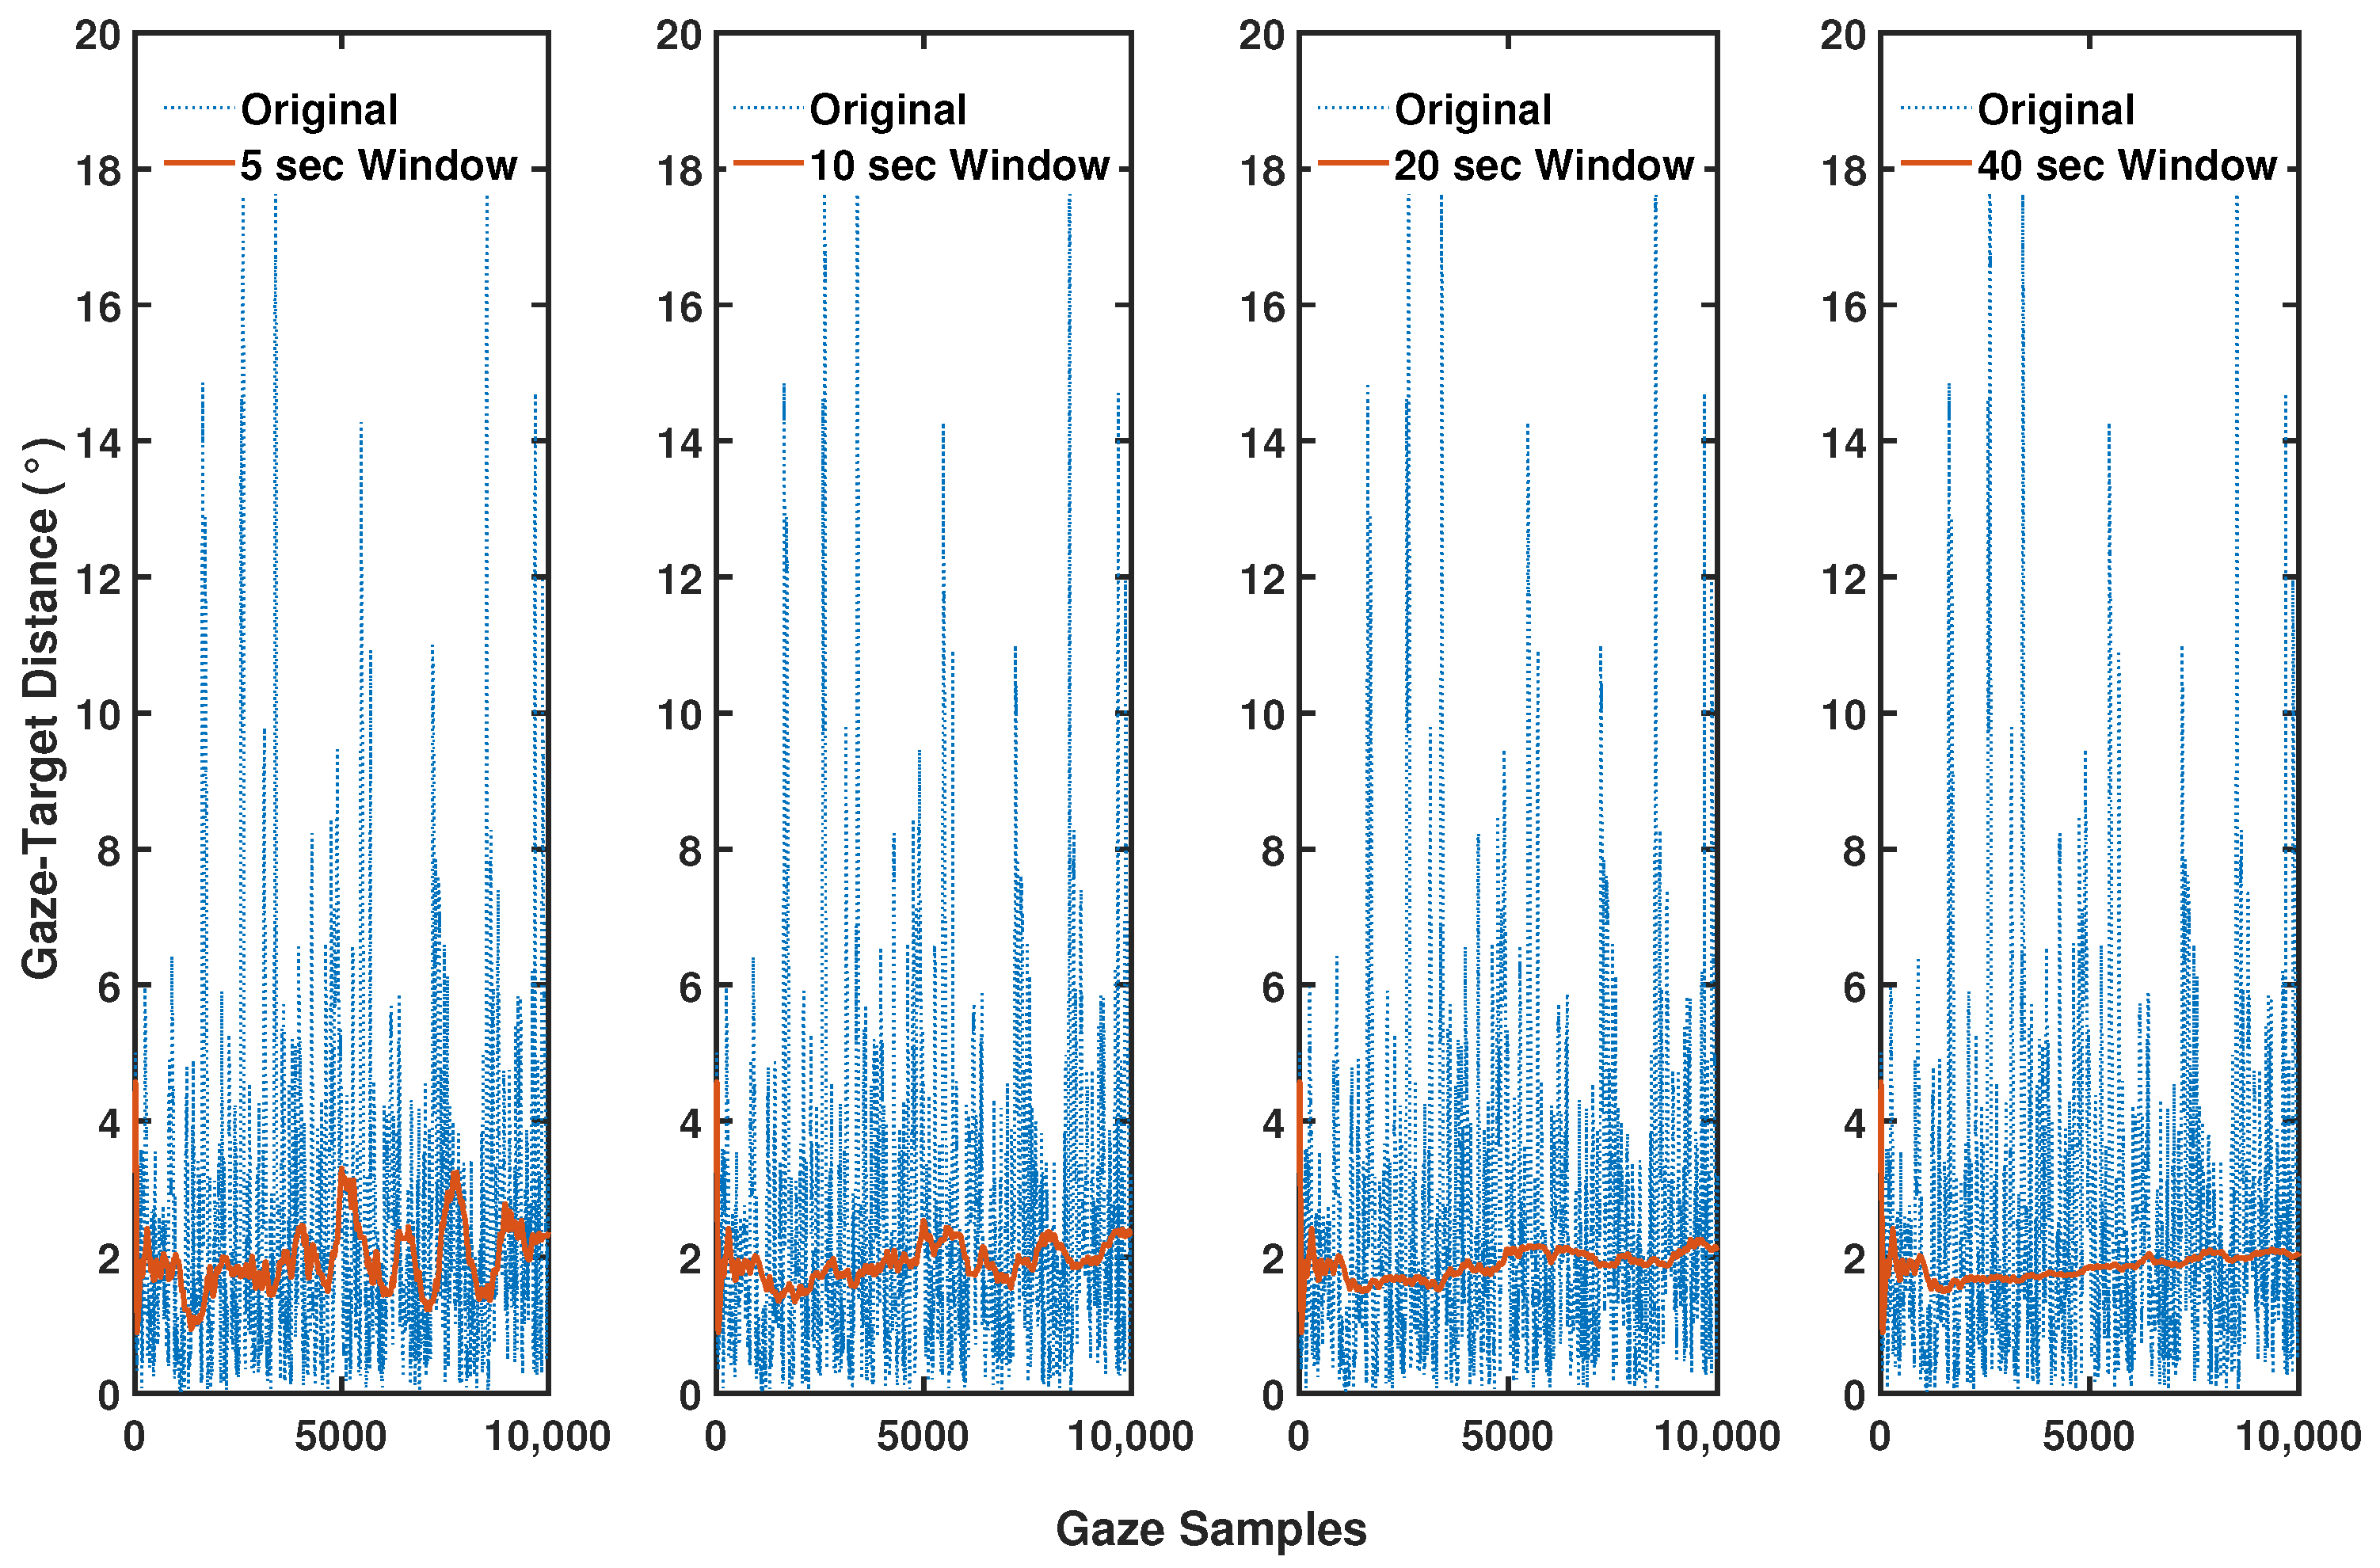
3.2.1. Gaze-Target Distancing: Condition Type Influence over Eye Position

After data pre-processing, the effect of the independent variable, condition type, was investigated over the dependant variable, the median distance between the gaze and the centre of the target. The normality of the sample was tested with the Kolmogorov–Smirnov one-sample test (p < 0.001). Given the absence of a normal distribution in our data, the non-parametric Kruskal–Wallis test was used. These results were further compared with an FWER test (Dunn–Šidák).

3.2.2. Gaze-Target Direction: Training Effect across Blocks

To examine whether there was a significant change in gaze behaviour, the gaze-target direction was plotted as a function of different blocks. Re-direction of eye positions in favour of the upper, lower, right, or leftwards hemifield indicated changes of gaze behaviour across time [18,25]. A polar histogram was used to look into the gaze direction and confront it to the target across blocks. Zittrell [46] polar histogram plot based on Berens [47] was used after calculating the wrap angle between gaze and target. Circular statistics were used, and the mean resultant vector (r) and the average direction were calculated for each block. The mean resultant vector values range between 0 and 1, where 0 indicates that data have a large spread while 1 means that the entire dataset is concatenated towards one point. This parameter was used to look into the spread of the gaze direction with respect to the target. The average angle indicates the potential directionality for the tested block.

4. Results

4.1. Data Pre-Processing

4.1.1. Noise Cancellation: Fluctuation in the Sampling Data

Only 0.83% of the data were omitted due to fluctuations in the sampling rate, meaning that these points had a sampling rate outside the normal range of sampling.

4.1.2. Latency Error Correction

The best gaze-target distance was found to be when gaze data points were 3 position updates behind the target data. Considering the sampling frequency of 120 Hz, in terms of latency, this indicates that the recorded eye position and the actual eye position had a delay error of 25 ms (Figure 4).

4.1.3. Eye-Tracking Data Filtering

A 24 sample Savitzky and Golay [41]’s algorithm was found to effectively refine the velocity between successive gaze data. This second-order polynomial interpolation smooths the gaze data gaps, where the velocity was above the normal saccades velocity, as reported by Nyström and Holmqvist [40]. The result of the filter can be seen in Figure 5 when comparing filtered data with raw data, sample-by-sample.

4.1.4. Saccades Smoothing: Moving Median Window

Four different moving median windows were tested to the gaze-target distance to de-noise it. In comparison to the original data, every sliding window proved to improve and smooth the gaze-target distance (Figure 6). Out of the four tested ones, the 40 s centred moving average window presented less volatility induced by saccadic behaviour and best smoothing in the data.

4.1.5. Colour Change Recognition Sub-Task and Scotoma Radius as Cutoff for the Maximum Positive and Negative Predictive Values

The test revealed that indeed there was a big variability when comparing positive and negative predictive values across different scotoma radii, starting already at 5.5 indicating that the actual radius of the coverage area was smaller than 6 . The probability of positive and negative predictive values had less considerable variability when reaching the 5 radius of scotoma coverage and started to reach a plateau (Figure 7). This indicated that the ball could have been perceived when the distance was ≤5 , and not 6 from the target.
On the other hand, it was observed that some subjects performed the task correctly across all conditions, while others did not. The probability of positive and negative predictive values did not show the same trend as the majority of subjects, with no plateau reached (Figure 8); those subjects were excluded from the analysis, as a poor performance in the test was suspected. A total of 5 subjects had to be excluded due to this criterion. For the analysis, a total of 8 subjects were included, four from each group.

4.2. Data Analysis

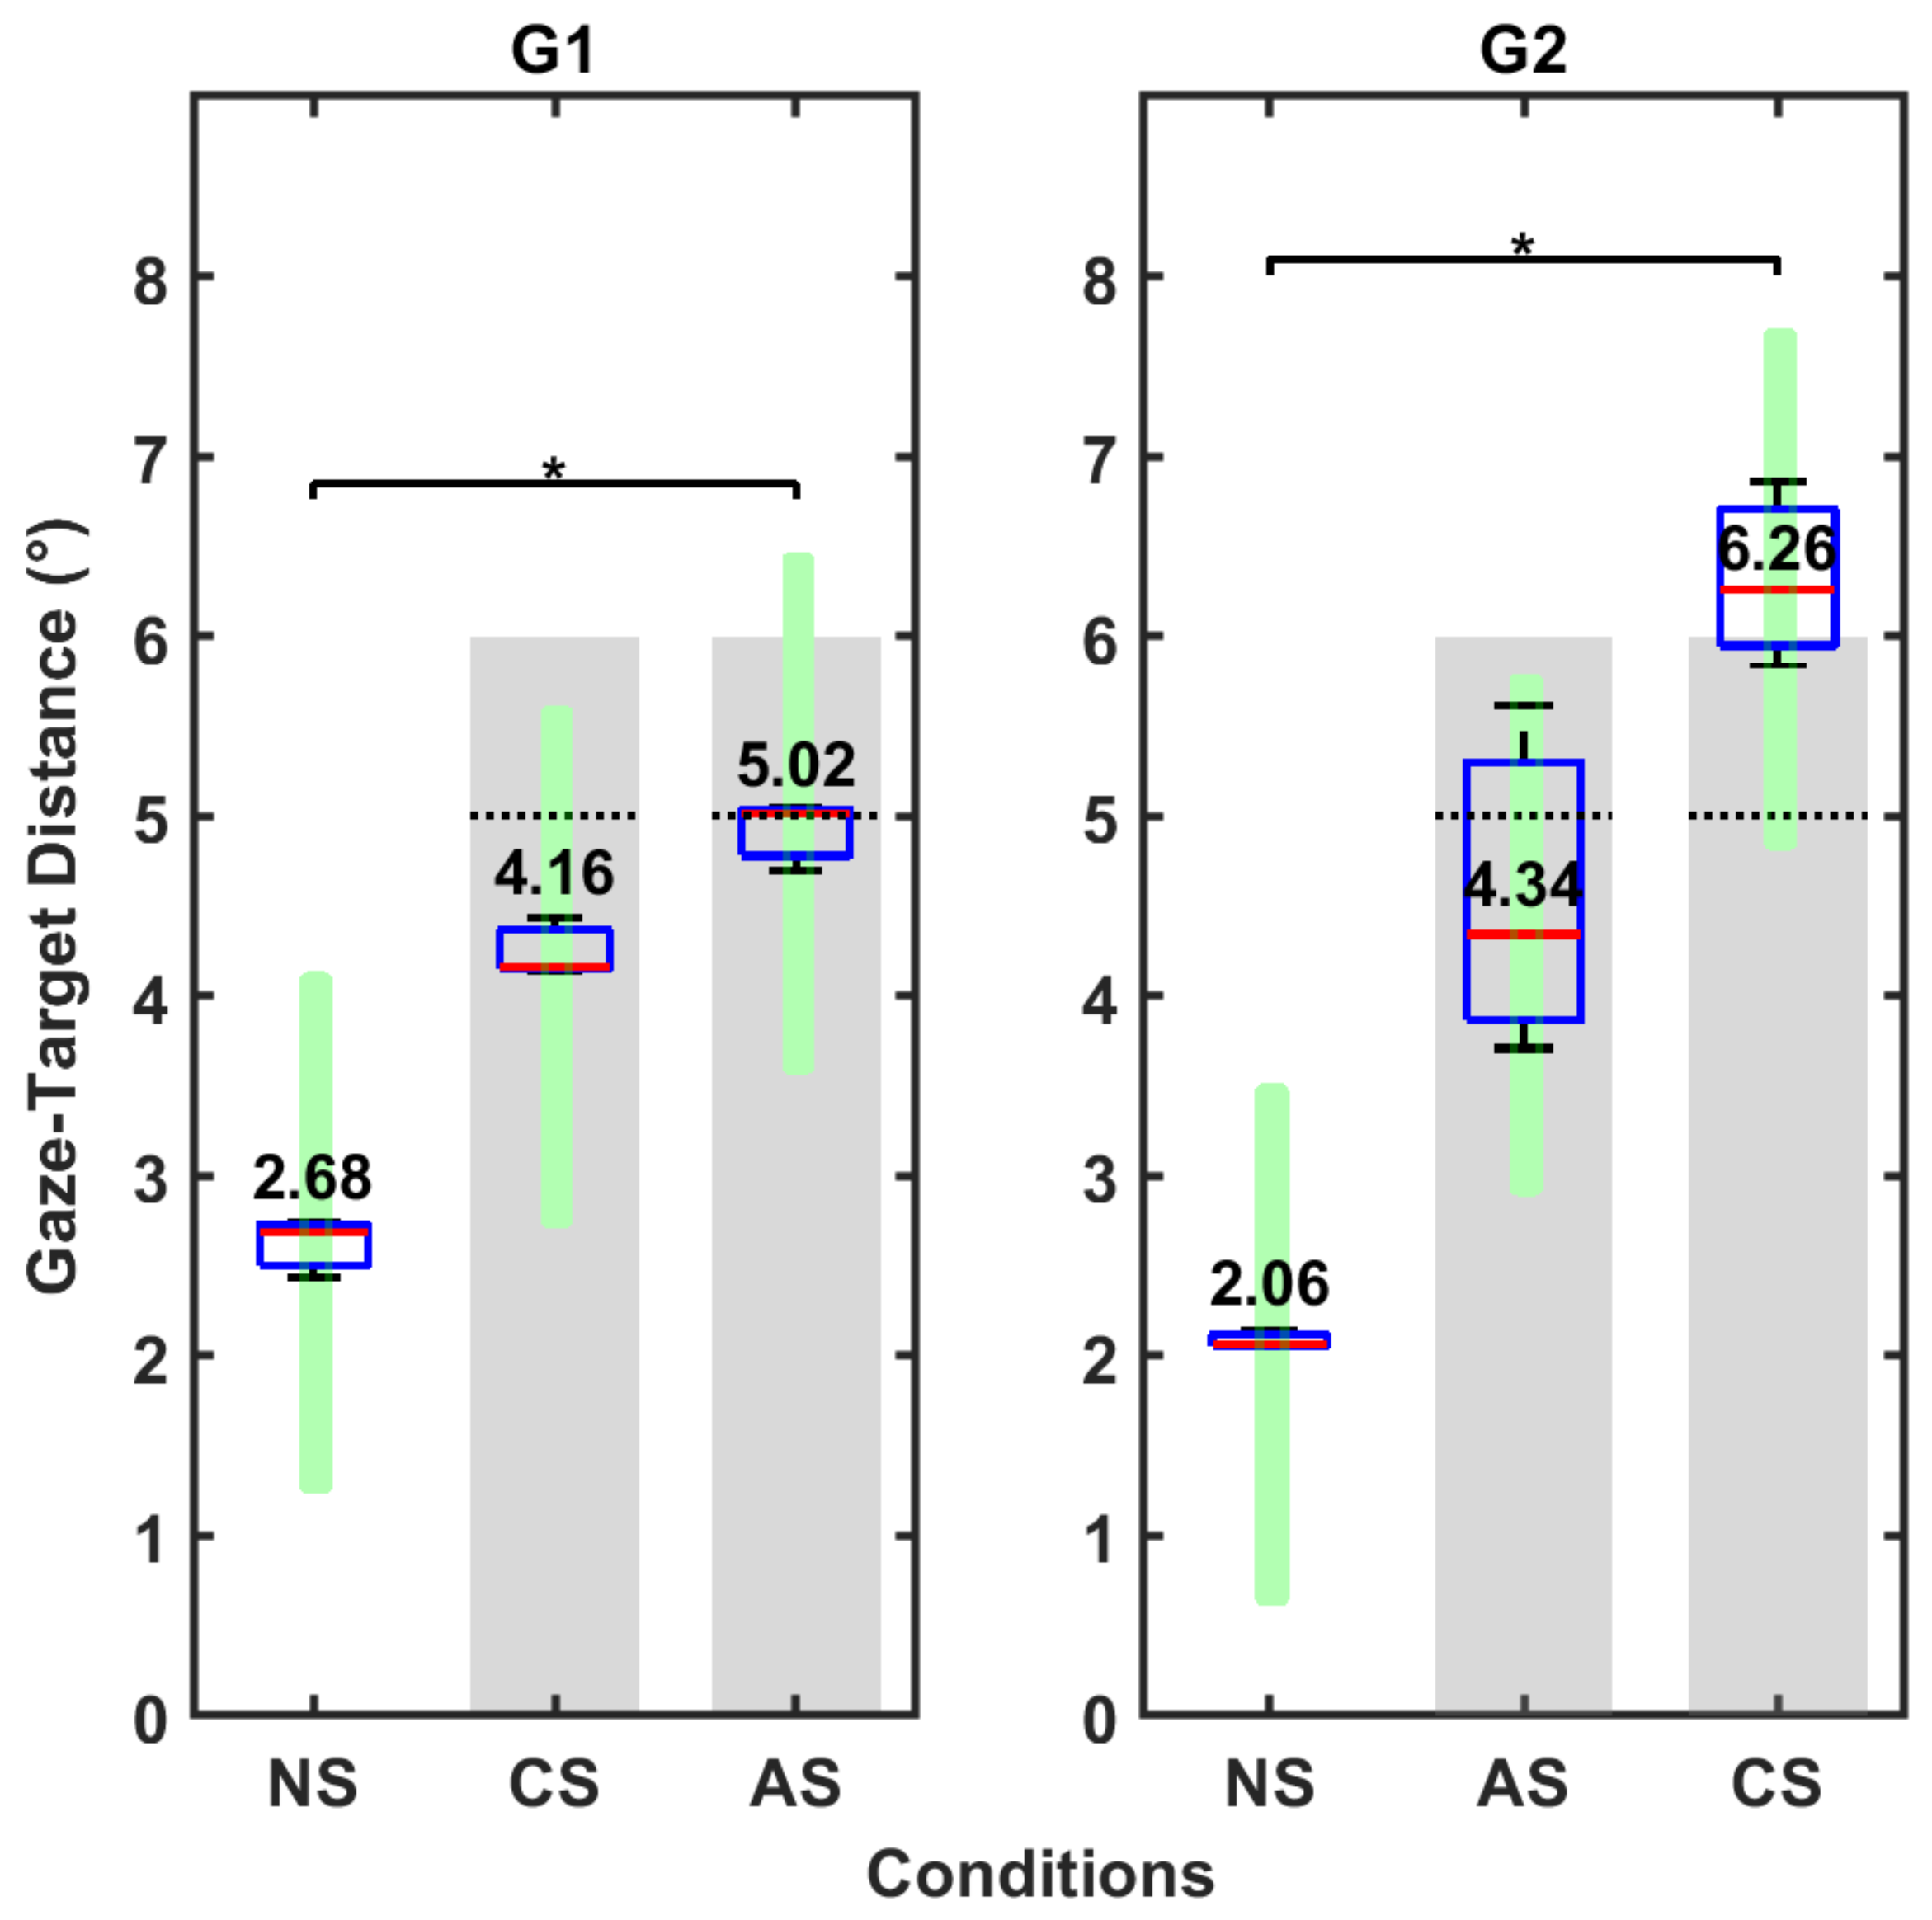
4.2.1. Gaze-Target Distancing: Condition Type Influence over Eye Position

In the first group, salience was applied after subjects had to adapt for 15 min to an advanced scotoma simulation. The Kruskal–Wallis test found that there is a significant difference between the three conditions ( χ 2 (2) = 7.19, p = 0.03) for the distance between gaze and target. The post-hoc Dunn’s revealed that the cued scotoma induced significant changes in the gaze-target distance (p = 0.02) compared to the normal condition. No significant difference was found for the scotoma condition compared to the other two conditions (Figure 9, G1).
For the second group, where subjects were presented first with the scotoma simulation together with the cued salience, there was a significant effect between the three conditions as well ( χ 2 (2) = 7.20, p = 0.03). The post-hoc Dunn’s revealed that compared to the normal condition, the central scotoma changed significantly the gaze-target distance (p = 0.02, Figure 9, G2).

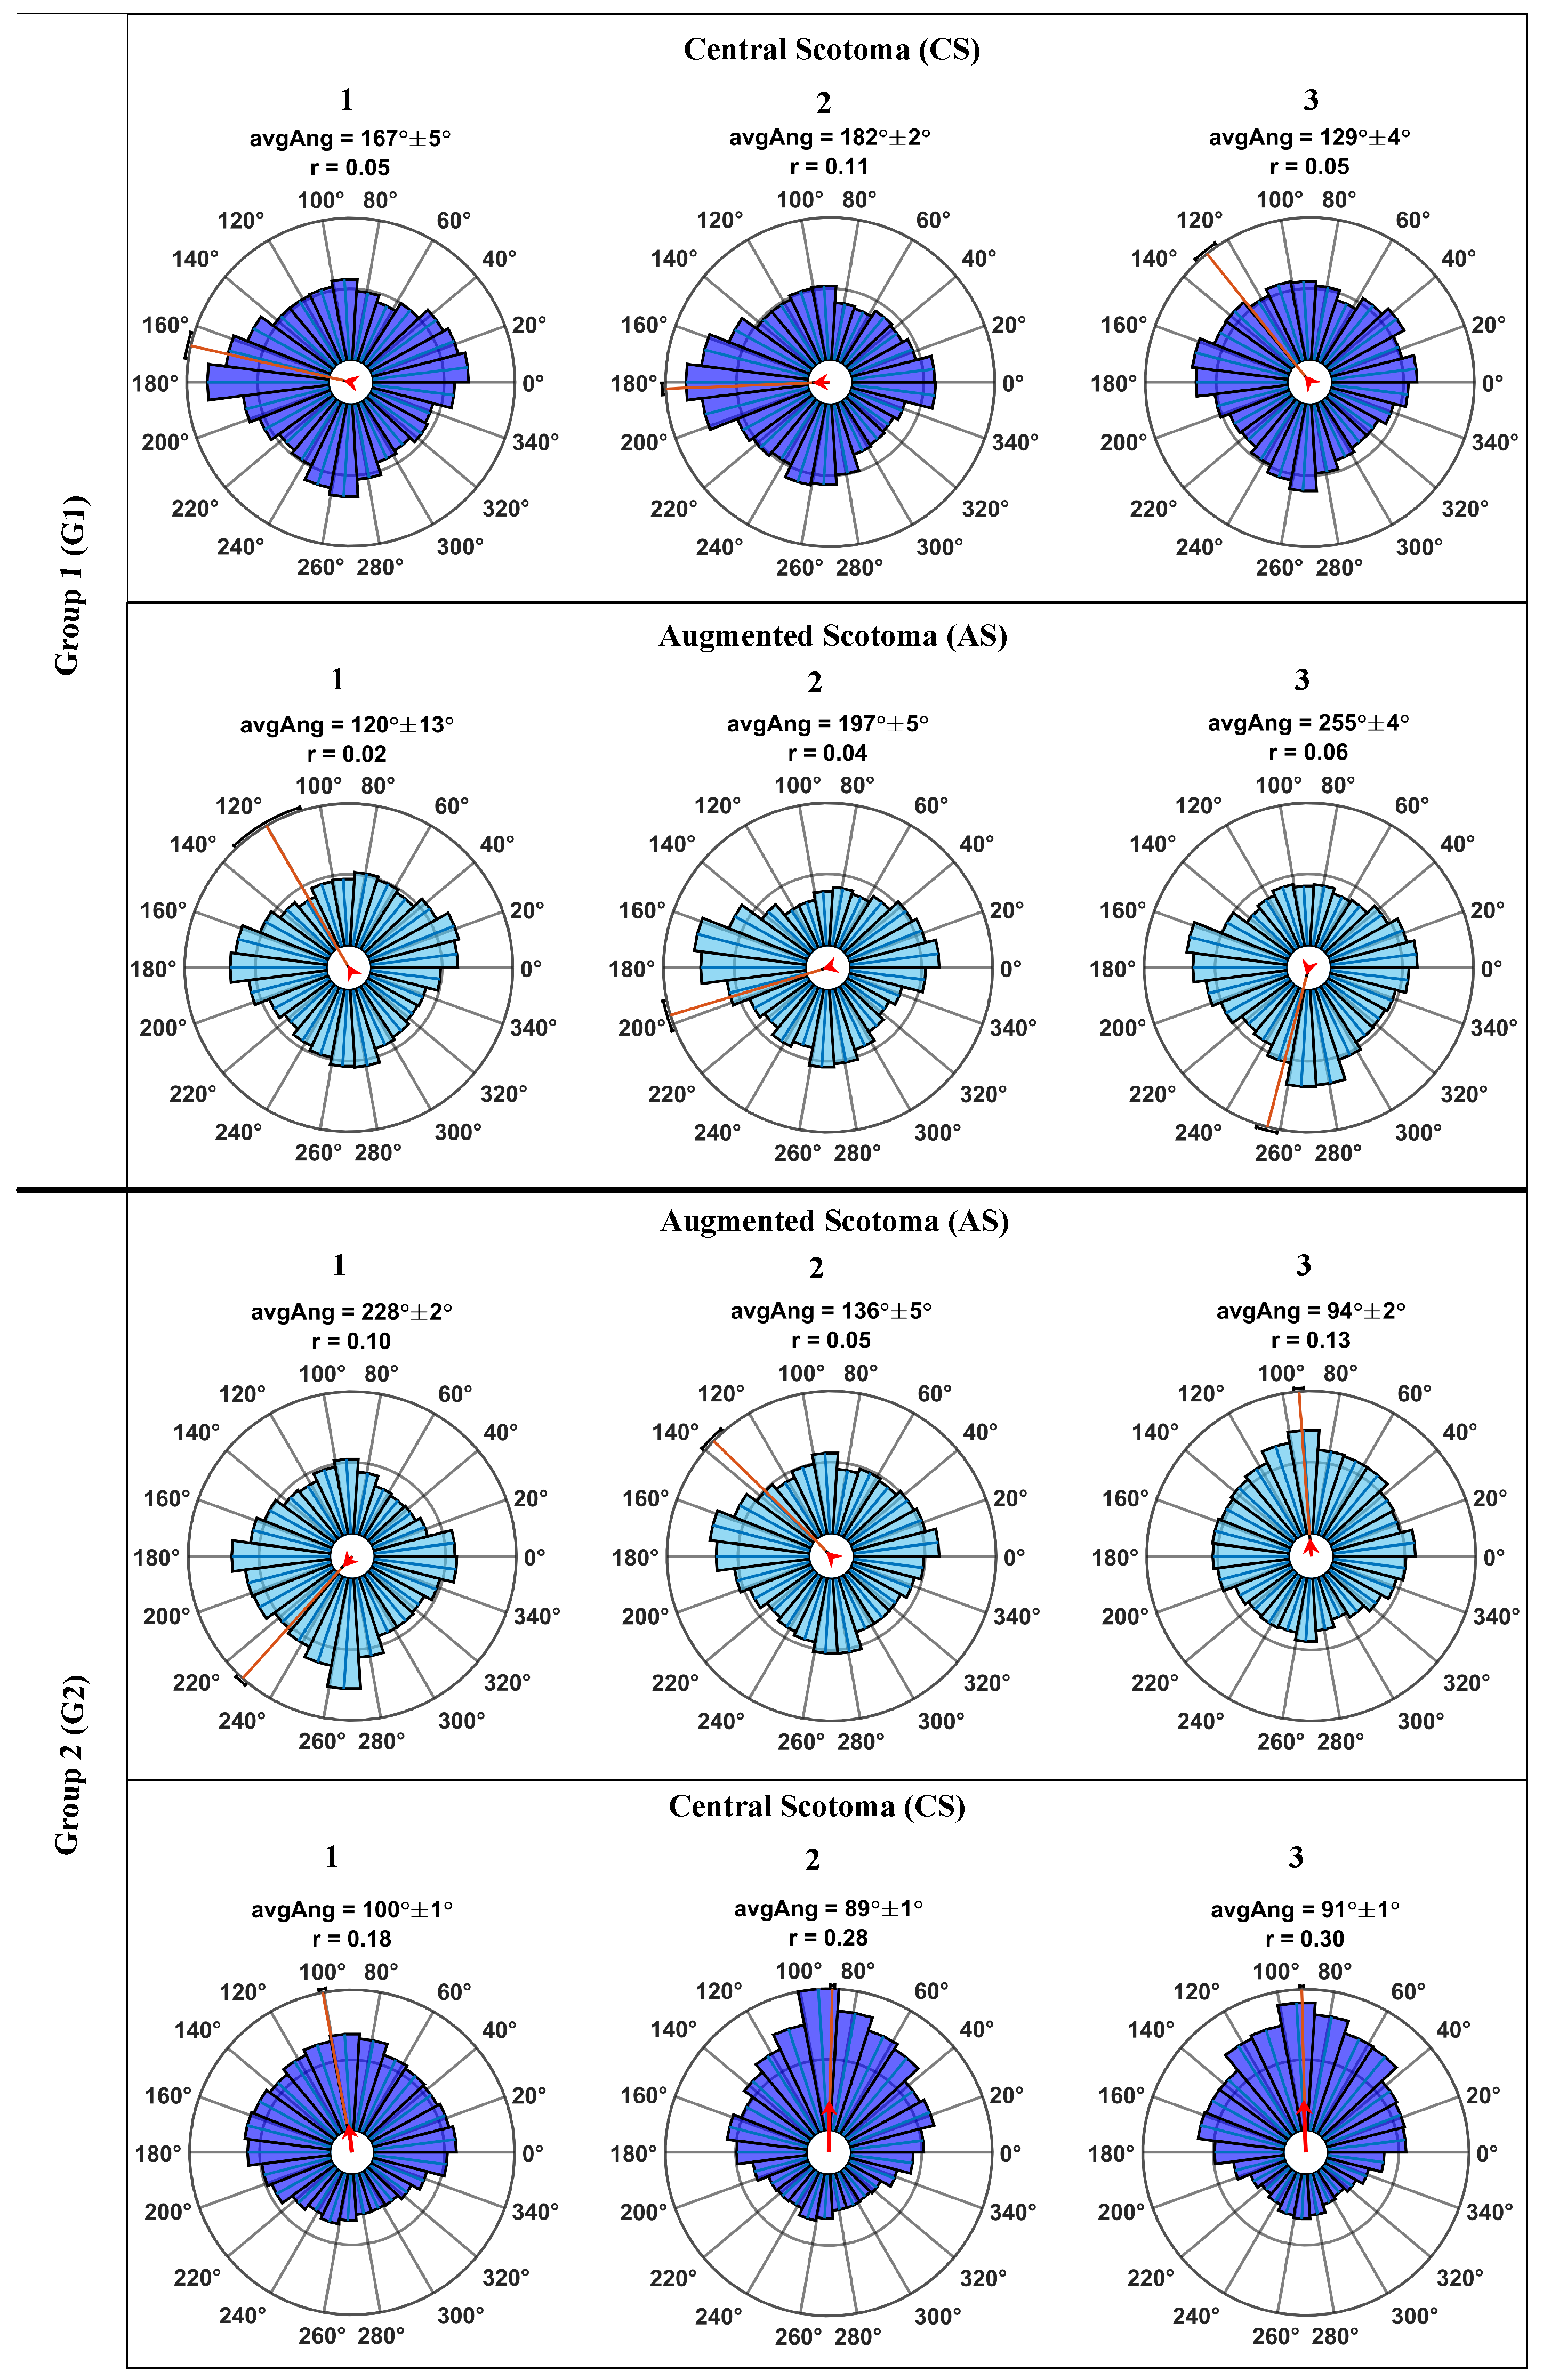
4.2.2. Gaze-Target Direction: Training Effect across Blocks

Circular statistics revealed that gaze had a directional tendency above the target in the second group, where subjects started first with the augmented scotoma. For both groups, when the augmentation was present (during the three blocks), the gaze starts showing a preferred direction, with a less homogeneous distribution in the gaze directions, across blocks. For the second group, the gaze shifts upwards, and during the third block, the resultant mean vector doubles its size for the second block, meaning a greater bias in the directionality. An upper direction starts to emerge, with an average angle of 92  ± 2 of gaze with respect to target. This trend is maintained when the augmentation is removed (central scotoma condition), becoming more pronounced across blocks of this new condition, maintaining the gaze-target direction at 89  ± 1 and at 91 ± 1 for the second and third block, respectively (Figure 10). The bias strength also increased across blocks. No such trend was observed for group one.

5. Discussion

Macular degeneration is a chronic disease that affects central vision; as the macular region deteriorates, it loses the ability to produce clear images of the focused objects. The visual system needs to re-adapt its behaviour to overcome this condition by shifting the gaze away from the object of interest and reallocating it in the periphery (outside the area of visual loss). Quickly developing a new adaptive mechanism is essential for patients suffering from macular degeneration to detect objects of interest, such as incoming cars or bicycles. Most patients with central visual loss take up to three (3) months to adapt, and only one out of three manages to direct their eyes correctly towards the object of interest [9,48].
Other authors have already used VR for rehabilitation and training of this eccentric fixation behaviour using patients [13,14,15]. However, one of the major challenges for these studies is that patients have different types of scotomas with different shapes and positions, and for this reason, patients require individualized augmentations. The mixed results obtained so far regarding individual augmentation on patients complicate its translation to clinical practice.
The current study investigates gaze behaviour during salience augmentation for standardised central scotoma simulation during tracking of a moving object. Previous studies only looked at changes in normally sighted participants with simulated scotomas without further testing how augmentations might change their behaviours. In our case, a modified version of a VR Pong game was presented to participants where they had to pursue a ball, stopping it from exiting the play area by moving the paddles, and they also had to acknowledge changes in the ball’s colour.
The group whose participants initially experienced an advanced scotoma simulation, and only afterwards salience around the scotoma was presented, a significant change in gaze behaviour was observed. In comparison to the normal condition, during the salience augmented scotoma condition, the target was placed above the scotoma edge both when considering 5 as well as 6 radius (Figure 9, G1). Furthermore, the polar histograms show that, even if the mean resultant vector did not increase across blocks, gaze position started to be directed more and more towards the lower hemifield in the augmented condition. On the other hand, no such trend could be observed across blocks for the scotoma simulation condition (Figure 10, G1). The tendency observed for the salient augmented condition is in accordance with previous findings [4] where 57% of macula degeneration patients had better attention preference for the lower hemifield and where most patients with central visual loss direct their gaze [21,48,49,50,51].
For the second group, a change in gaze behaviour for both simulated conditions was also achieved. A significant change was observed during the scotoma simulation, with the target being placed further away from the scotoma edge when taking into account 5 and also 6 extension in the coverage range (Figure 9, G2), when compared with the baseline condition (normal). The polar histogram revealed a similar trend for the augmented condition to the one observed by the first group. The gaze’s direction started having a specific directionality that was kept throughout the other two blocks. This direction was kept when scotoma simulated participants had to play the game without augmentation, and the value increased even more across the blocks. Additionally, by the end of the third block of the central scotoma condition, the bias strength tripled the value that subjects had when they finished the last block of the augmented condition (Figure 10, G2). The trend that emerged was to position the gaze above the target. However, even if in an uncommon position, the gaze position above the target was still in line with previous studies [25].
Based on the results, we hypothesise that presenting salient cues at the early stages of central visual loss can help build a preferred gaze location. In contrast, prior experiences of wild gazing in the presence of a scotoma may delay this choice. These results also point towards developing a preferred retinal locus (PRL) position for moving targets.
Subjects presented with advanced stages of a central scotoma who have not undergone any training and had not been presented with visual cueing usually develop an unclear and variable preferred gaze positioning. This variability is reduced when augmentation is implemented and the previously adopted positioning changes. However, this behavioural change might take longer due to this previously positioning that the subject already has.
Some potential limitations should be acknowledged, considering the pilot nature of the study. For instance, future studies will need to replicate our findings with greater samples. Moreover, the present study indicates that different adjustments on the augmentation might be needed depending on the stage of the macular degeneration.
In this study, the HTC Vive Pro Eye, which is known to have an end-to-end latency between 58.1 ms [31] and 80 ms [32] was used. Thanks to the colour recognition subtask and the scotoma radii thresholding, the data were corrected for eye-tracking delays (25 ms). However, this end-to-end latency [31,32,44] is not stable as it can be seen in the results, and therefore may have influenced the scotoma positioning similarly to previous gaze-contingent paradigms [44,45].
After data pre-processing, a 1 error in scotoma coverage for the majority of subjects tested was found. This finding allowed a better understanding of the occluded area and allowed us to correct for it when analysing the results. However, it also decreased the area that was intended to be covered.
An additional limitation of the current system are errors in the IPD estimation. This type of error can lead to a breakdown of binocular fusion, with errors in correctly focusing on a target [52]. However, as calibrations were performed before each condition and manual adjustments of the scotoma were performed on a trial basis, this error can be neglected.
Despite the limitations discussed above, a standardised scotoma simulation of 5 was still achieved for eight subjects. The simulation changed the gaze behaviour compared to normal conditions. In general, our results confirm what was previously published [16,17,18,19,20,24], i.e., standardised scotoma simulations and augmentations help study and train gaze behaviours. Virtual reality gaming proved to be a more entertaining task, resulting in greater participants’ engagement and rapid adaptation. The similar results obtained in a VR 2D world to previous literature is the first step for building a model for a future, more complex and immersive reference system. Once a model of PRL development with the key characteristics and behaviours has been established more immersive and realistic virtual scenarios can be used, such as, for example, crossing the street scenarios that involve tracking a moving target in the periphery.

6. Conclusions

Not only salience augmentation to standardised scotoma simulations in normally sighted participants was investigated for the first time in this study, but this study also looked and corrected for the latency effect these paradigms suffer from.
Displaying a gaze-contingent scotoma induces an eccentric gaze behaviour, and a ring augmentation on top of it can modify this behaviour. Early application of this augmentation enhances the gaze positioning and the development of a PRL, similar to what has been reported in the literature. Meanwhile, experiencing a scotoma without any cue can lead to a higher position disparity and may require more extended training periods.
This study needs to be replicated before clinical translation can be applied. Nonetheless, it shows potential for a new type of training for macular degeneration patients.

Author Contributions

Conceptualization, A.S., S.W., M.G.G.; methodology, A.S. and S.W.; formal analysis, A.S. and M.G.G.; investigation, A.S.; data curation, A.S.; writing—original draft preparation, A.S., M.G.G. and S.W.; writing—review and editing, A.S., M.G.G. and S.W.; visualization, A.S. and M.G.G.; supervision, S.W.; project administration, S.W. All authors have read and agreed to the published version of the manuscript.

Funding

The work of the authors is supported by the Institutional Strategy of the University Tübingen (Deutsche Forschungsgemeinschaft, ZUK 63), the German Excellence initiative from the Federal Ministry of Education and Research (BMBF) in the framework of IDeA (project number 16SV8104). This work was done in an industry on campus cooperation between the University of Tübingen and Carl Zeiss Vision International GmbH. The authors recognise intra-mutual funding of the University of Tübingen through the mini graduate school “Integrative Augmented Reality (I-AR)”. There was no other additional external funding received for this study.

Institutional Review Board Statement

The Ethics Committee at the Medical Faculty of the Eberhard Karls University and the University Hospital Tübingen approved to carry out the study within its facilities (Institutional Review Board number: 986/2020BO2). The study followed the tenets of the Declaration of Helsinki.

Informed Consent Statement

Written informed consent was obtained from all participants after the content and possible consequences of the study had been explained.

Data Availability Statement

Data are available at the following doi:10.6084/m9.figshare.14810301 (accessed on 23 June 2021).

Acknowledgments

We would like to thank Tamás Borbáth and NMY Mixed-Reality Communication GmbH, Frankfurt am Main for technical assistance. The authors gratefully acknowledge the helpful support of Carl Zeiss Vision International GmbH, Aalen, Katharina Rifai and to all our colleagues for offering their help. We acknowledge support by Open Access Publishing Fund of University of Tübingen.

Conflicts of Interest

Author A.S. and M.G.G. declare no potential conflicts of interest regarding this study. S.W. is a scientist at the University of Tübingen and is employed by Carl Zeiss Vision International GmbH. There is no conflict of interest regarding this study.

References

  1. Wong, W.L.; Su, X.; Li, X.; Cheung, C.M.G.; Klein, R.; Cheng, C.Y.; Wong, T.Y. Global prevalence of age-related macular degeneration and disease burden projection for 2020 and 2040: A systematic review and meta-analysis. Lancet Glob. Health 2014, 2, e106–e116. [Google Scholar] [CrossRef] [Green Version]
  2. Harvey, P.T. Common Eye Diseases of Elderly People: Identifying and Treating Causes of Vision Loss. Gerontology 2003, 49, 1–11. [Google Scholar] [CrossRef]
  3. Zou, M.; Wang, S.; Chen, A.; Liu, Z.; Young, C.A.; Zhang, Y.; Jin, G.; Zheng, D. Prevalence of myopic macular degeneration worldwide: A systematic review and meta-analysis. Br. J. Ophthalmol. 2020, 104, 1748–1754. [Google Scholar] [CrossRef] [PubMed]
  4. Altpeter, E.; Mackeben, M.; Trauzettel-Klosinski, S. The importance of sustained attention for patients with maculopathies. Vis. Res. 2000, 40, 1539–1547. [Google Scholar] [CrossRef] [Green Version]
  5. Curcio, C.A.; Sloan, K.R.; Kalina, R.E.; Hendrickson, A.E. Human photoreceptor topography. J. Comp. Neurol. 1990, 292, 497–523. [Google Scholar] [CrossRef] [PubMed]
  6. Cummings, R.W.; Whittaker, S.G.; Watson, G.R.; Budd, J.M. Scanning characters and reading with a central scotoma. Optom. Vis. Sci. 1985, 62, 833–843. [Google Scholar] [CrossRef]
  7. Timberlake, G.T.; Mainster, M.A.; Peli, E.; Augliere, R.A.; Essock, E.A.; Arend, L.E. Reading with a macular scotoma. I. Retinal location of scotoma and fixation area. Investig. Ophthalmol. Vis. Sci. 1986, 27, 1137–1147. [Google Scholar]
  8. Timberlake, G.T.; Peli, E.; Essock, E.A.; Augliere, R.A. Reading with a macular scotoma. II. Retinal locus for scanning text. Investig. Ophthalmol. Vis. Sci. 1987, 28, 1268–1274. [Google Scholar]
  9. White, J.M.; Bedell, H.E. The oculomotor reference in humans with bilateral macular disease. Investig. Ophthalmol. Vis. Sci. 1990, 31, 1149–1161. [Google Scholar]
  10. Schuchard, R.A. Validity and Interpretation of Amsler Grid Reports. Arch. Ophthalmol. 1993, 111, 776–780. [Google Scholar] [CrossRef]
  11. Hassan, S.E.; Snyder, B.D. Street-crossing decision-making: A comparison between patients with age-related macular degeneration and normal vision. Investig. Ophthalmol. Vis. Sci. 2012, 53, 6137–6144. [Google Scholar] [CrossRef] [PubMed] [Green Version]
  12. Almutleb, E.S.; Hassan, S.E. The Effect of Simulated Central Field Loss on Street-crossing Decision-Making in Young Adult Pedestrians. Optom. Vis. Sci. Off. Publ. Am. Acad. Optom. 2020, 97, 229–238. [Google Scholar] [CrossRef]
  13. Morales, M.U.; Limoli, P.G.; Limoli, C. Augmented reality eyewear for home-based vision training after biofeedback rehabilitation of eccentric fixation. Investig. Ophthalmol. Vis. Sci. 2015, 56, 548. [Google Scholar]
  14. Pratt, J.D.; Stevenson, S.B.; Bedell, H.E. Scotoma Visibility and Reading Rate with Bilateral Central Scotomas. Optom. Vis. Sci. Off. Publ. Am. Acad. Optom. 2017, 94, 279. [Google Scholar] [CrossRef] [PubMed]
  15. Deemer, A.D.; Swenor, B.K.; Fujiwara, K.; Deremeik, J.T.; Ross, N.C.; Natale, D.M.; Bradley, C.K.; Werblin, F.S.; Massof, R.W. Preliminary evaluation of two digital image processing strategies for head-mounted magnification for low vision patients. Transl. Vis. Sci. Technol. 2019, 8, 23. [Google Scholar] [CrossRef] [Green Version]
  16. Bertera, J.H. Oculomotor adaptation with virtual reality scotomas. Simulation 1992, 59, 37–43. [Google Scholar] [CrossRef]
  17. Bertera, J.H. The Effect of Simulated Scotomas on Visual Search in Normal Subjects. Investig. Ophthalmol. Vis. Sci. 1988, 29, 470–475. [Google Scholar]
  18. Kwon, M.; Nandy, A.S.; Tjan, B.S. Rapid and persistent adaptability of human oculomotor control in response to simulated central vision loss. Curr. Biol. 2013, 23, 1663–1669. [Google Scholar] [CrossRef] [PubMed] [Green Version]
  19. Wu, H.; Ashmead, D.H.; Adams, H.; Bodenheimer, B. Using Virtual Reality to Assess the Street Crossing Behavior of Pedestrians with Simulated Macular Degeneration at a Roundabout. Front. ICT 2018, 5, 27. [Google Scholar] [CrossRef] [Green Version]
  20. Pidcoe, P.E.; Wetze, P.A. Oculomotor tracking strategy in normal subjects with and without simulated scotoma. Investig. Ophthalmol. Vis. Sci. 2006, 47, 169–178. [Google Scholar] [CrossRef] [PubMed] [Green Version]
  21. Guez, J.E.; Le Gargasson, J.F.; Rigaudiere, F.; O’Regan, J.K. Is there a systematic location for the pseudo-fovea in patients with central scotoma? Vis. Res. 1993, 33, 1271–1279. [Google Scholar] [CrossRef]
  22. Lewis, J.; Shires, L.; Brown, D.J. Development of a Visual Impairment Simulator Using the Microsoft XNA Framework. In Proceedings of the 9th International Conference on Disability, Virtual Reality and Associated Technologies (ICDVRAT), Laval, France, 10–12 September 2012. [Google Scholar]
  23. Väyrynen, J.; Colley, A.; Häkkilä, J. Head mounted display design tool for simulating visual disabilities. In Proceedings of the ACM International Conference Proceeding Series, Association for Computing Machinery (MUM 2016), Rovaniemi, Finland, 13–15 December 2016; pp. 69–73. [Google Scholar] [CrossRef]
  24. Kwon, M.; Ramachandra, C.; Satgunam, P.; Mel, B.W.; Peli, E.; Tjan, B.S. Contour enhancement benefits older adults with simulated central field loss. Optom. Vis. Sci. 2012, 89, 1374–1384. [Google Scholar] [CrossRef] [PubMed]
  25. Barraza-Bernal, M.J.; Ivanov, I.V.; Nill, S.; Rifai, K.; Trauzettel-Klosinski, S.; Wahl, S. Can positions in the visual field with high attentional capabilities be good candidates for a new preferred retinal locus? Vis. Res. 2017, 140, 1–12. [Google Scholar] [CrossRef] [PubMed]
  26. Zhaoping, L. Attention capture by eye of origin singletons even without awareness—A hallmark of a bottom-up saliency map in the primary visual cortex. J. Vis. 2008, 8, 1. [Google Scholar] [CrossRef] [PubMed] [Green Version]
  27. Warner, C.B.; Juola, J.F.; Koshino, H. Voluntary allocation versus automatic capture of visual attention. Percept. Psychophys. 1990, 48, 243–251. [Google Scholar] [CrossRef] [PubMed]
  28. Parr, T.; Friston, K.J. Attention or Salience? Curr. Opin. Psychol. 2019, 29, 1–5. [Google Scholar] [CrossRef] [PubMed]
  29. Lumsden, J.; Edwards, E.A.; Lawrence, N.S.; Coyle, D.; Munafò, M.R. Gamification of Cognitive Assessment and Cognitive Training: A Systematic Review of Applications and Efficacy. JMIR Serious Games 2016, 4, e11. [Google Scholar] [CrossRef] [PubMed] [Green Version]
  30. Vive Pro Eye, VIVE Pro Eye|The Professional-Grade VR Headset. Available online: https://www.vive.com/eu/product/vive-pro-eye/overview/ (accessed on 11 November 2020).
  31. Sipatchin, A.; Wahl, S.; Rifai, K. Eye-Tracking for Clinical Ophthalmology with Virtual Reality (VR): A Case Study of the HTC Vive Pro Eye’s Usability. Healthcare 2021, 9, 180. [Google Scholar] [CrossRef]
  32. Stein, N.; Niehorster, D.C.; Watson, T.; Steinicke, F.; Rifai, K.; Wahl, S.; Lappe, M. A Comparison of Eye Tracking Latencies Among Several Commercial Head-Mounted Displays. i-Perception 2021, 12, 1–16. [Google Scholar] [CrossRef]
  33. Tobii Pro SDK, Tobii Pro SDK v1.7.1.1081. Available online: https://www.tobiipro.com/product-listing/tobii-pro-sdk/ (accessed on 22 June 2020).
  34. VIVE Eye Tracking SDK (SRanipal), SRanipal SDK v1.0.3.0. Available online: https://developer.vive.com/resources/vive-sense/sdk/vive-eye-tracking-sdk-sranipal/ (accessed on 23 September 2020).
  35. Clay, V.; König, P.; König, S. Eye tracking in virtual reality. J. Eye Mov. Res. 2019, 12. [Google Scholar] [CrossRef]
  36. Coey, C.A.; Wallot, S.; Richardson, M.J.; van Orden, G. On the structure of measurement noise in eye-tracking. J. Eye Mov. Res. 2012, 5, 5. [Google Scholar] [CrossRef]
  37. Liu, B.; Zhao, Q.C.; Ren, Y.Y.; Wang, Q.J.; Zheng, X.L. An elaborate algorithm for automatic processing of eye movement data and identifying fixations in eye-tracking experiments. Adv. Mech. Eng. 2018, 10, 2018. [Google Scholar] [CrossRef]
  38. Loschky, L.C.; Wolverton, G.S. How late can you update gaze-contingent multiresolutional displays without detection. ACM Trans. Multimed. Comput. Commun. Appl. 2007, 3. [Google Scholar] [CrossRef]
  39. Musall, S. Stdshade, MATLAB Central File Exchange. Available online: https://www.mathworks.com/matlabcentral/fileexchange/29534-stdshade (accessed on 23 June 2021).
  40. Nyström, M.; Holmqvist, K. An adaptive algorithm for fixation, saccade, and glissade detection in eyetracking data. Behav. Res. Methods 2010, 42, 188–204. [Google Scholar] [CrossRef] [Green Version]
  41. Savitzky, A.; Golay, M.J. Smoothing and Differentiation of Data by Simplified Least Squares Procedures. Anal. Chem. 1964, 36, 1627–1639. [Google Scholar] [CrossRef]
  42. Shanidze, N.; Ghahghaei, S.; Verghese, P. Accuracy of eye position for saccades and smooth pursuit. J. Vis. 2016, 16. [Google Scholar] [CrossRef] [PubMed] [Green Version]
  43. Whittaker, S.G.; Cummings, R.W.; Swieson, L.R. Saccade control without a fovea. Vis. Res. 1991, 31, 2209–2218. [Google Scholar] [CrossRef]
  44. Saunders, D.R.; Woods, R.L. Direct measurement of the system latency of gaze-contingent displays. Behav. Res. Methods 2014, 46, 439–447. [Google Scholar] [CrossRef] [PubMed] [Green Version]
  45. Aguilar, C.; Castet, E. Gaze-contingent simulation of retinopathy: Some potential pitfalls and remedies. Vis. Res. 2011, 51, 997–1012. [Google Scholar] [CrossRef] [PubMed]
  46. Zittrell, F. CircHist—Circular/Polar/Angle Histogram. Available online: https://de.mathworks.com/matlabcentral/fileexchange/66258-circhist-circular-polar-angle-histogram (accessed on 23 June 2021).
  47. Berens, P. CircStat: A MATLAB Toolbox for Circular Statistics. J. Stat. Softw. 2009, 31, 1–21. [Google Scholar] [CrossRef] [Green Version]
  48. Crossland, M.D.; Culham, L.E.; Kabanarou, S.A.; Rubin, G.S. Preferred retinal locus development in patients with macular disease. Ophthalmology 2005, 112, 1579–1585. [Google Scholar] [CrossRef] [PubMed]
  49. Sunness, J.S.; Applegate, C.A.; Haselwood, D.; Rubin, G.S. Fixation patterns and reading rates in eyes with central scotomas from advanced atrophic age-related macular degeneration and Stargardt disease. Ophthalmology 1996, 103, 1458–1466. [Google Scholar] [CrossRef] [Green Version]
  50. Trauzettel-Klosinski, S.; Tornow, R.P. Fixation behavior and reading ability in macular scotoma. Assessed by Tuebingen manual perimetry and scanning laser ophthalmoscopy. Neuro Ophthalmol. 1996, 16, 241–253. [Google Scholar] [CrossRef] [PubMed]
  51. Fletcher, D.C.; Schuchard, R.A. Preferred retinal loci relationship to macular scotomas in a low-vision population. Ophthalmology 1997, 104, 632–638. [Google Scholar] [CrossRef]
  52. Hibbard, P.B.; van Dam, L.C.; Scarfe, P. The implications of interpupillary distance variability for virtual reality. In Proceedings of the 2020 International Conference on 3D Immersion (IC3D), Brussels, Belgium, 15 December 2020; pp. 1–7. [Google Scholar]
Figure 1. (a) Specifications of the central scotoma (CS) and (b) augmented scotoma (AS) condition. In the CS condition the scotoma (a) had a diameter of 12 . In the AS condition (b) there was an concentric augmentation of 2 around the scotoma and an annulus area extending 7.5 .
Applsci 11 07164 g001
Figure 2. Drift correction was performed manually by the subject to have a centralized scotoma around the red dot at the beginning of each block. In the figure above, a hypothetical example of how a decentralized scotoma (in black) might look like (a) and hypothetical stages of position correction (b,c), black arrows, performed to have a concentric positioning of the scotoma around the red dot (c). The grey circle is used as a reference for this figure to indicate where the simulated scotoma should be positioned.
Applsci 11 07164 g002
Figure 3. Scheme of the experimental procedure. Participants were divided into two groups (G1 and G2). Both groups initiated playing the Pong game under normal vision conditions (normally sighted, NS). The difference between groups was defined by the order by which the scotoma (CS) and augmented scotoma (AS) simulations were presented. In group 1, the scotoma simulation followed the augmentation, in group 2 the opposite. During each condition, three blocks (1, 2, and 3) were tested. Each block was the same for all conditions. It started with a manual drift correction followed by a 5-min timer playtime. During the game, the ball could have exited the play area. In that case, the timer was frozen and the game re-started. When the timer ended, a new block started.
Applsci 11 07164 g003
Figure 4. Latency offset for best gaze-target distance across all subjects. The red line indicates the mean tested for all the different time offsets, and the shading red represented the SD around the mean. The black arrow indicates that the best gaze-target distance is at its lowest when gaze data are sifted by 25 ms.
Applsci 11 07164 g004
Figure 5. Gaze samples were filtered using the Savitzky–Golay filter, with second-order polynomials and 24 filter length. In the dataset, the effect (red) on simple, raw (blue), sample-to-sample velocity.
Applsci 11 07164 g005
Figure 6. Original gaze samples (blue) and different moving window medians applied to the original data smoothing the saccades (red).
Applsci 11 07164 g006
Figure 7. Bar plots of positive and negative predictive values of all subjects across different scotoma radii. The black arrow inside the box plots indicates the point from which a plateau is starting to emerge. The plateau is starting to emerge at 5 .
Applsci 11 07164 g007
Figure 8. Inclusion and exclusion criteria for different subjects. Positive and negative predictive values were looked at to identify the trend where, irrespective of the scotoma radius, both values reached a plateau (the positive predictive value did not increase and the negative predictive value did not decrease anymore). The black arrow indicates where this plateau was reached for the majority of subjects. In this example, a demonstration is shown for subjects 1 and 2. For those where this trend was not observed, they were excluded. This was the case, for example, for subjects 5 and 12.
Applsci 11 07164 g008
Figure 9. Box plots of the gaze-target distance for the two groups tested. A Kruskal–Wallis test indicated a significant difference between the three conditions for both groups. The post-hoc Dunn’s indicated differences in gaze behaviour when comparing the normal condition to the augmented scotoma (AS) for group 1 (G1) and the scotoma condition (CS) for group 2 (G2). Both p-values were below 0.05 (indicated by the asterisk). The target cover area (in green) is both above the intended scotoma cover area (in gray) and the scotoma area with cover errors (scotoma trailing area, above the dotted lines). The values above the median line (red) of the box plots are the median value of the pre-processed gaze-target distance for all subjects across all three blocks.
Applsci 11 07164 g009
Figure 10. Polar histograms of gaze direction in respect to target for group 1 (G1) and group 2 (G2) across the blocks (1, 2, and 3). Above each polar histogram, the mean resultant length (r) and the average angle (avgAng) with the corresponding SD of gaze-target direction are represented. The long red line represents the average angle, the black bold semicircle at the end of the red line indicates the SD. The red arrow overlapped on top of the long red line is the mean resultant vector.
Applsci 11 07164 g010
Publisher’s Note: MDPI stays neutral with regard to jurisdictional claims in published maps and institutional affiliations.

