Article

Transcriptome Analysis Identified Candidate Genes Involved in Fruit Body Development under Blue Light in Lentinula edodes

1
Department of Biosystems and Biotechnology, Korea University, Seongbuk-Gu, Seoul 02841, Korea
2
Department of Plant Resources, College of Industrial Science, Kongju National University, Yesan 32439, Korea
*
Author to whom correspondence should be addressed.
Appl. Sci. 2021, 11(15), 6997; https://doi.org/10.3390/app11156997
Submission received: 9 June 2021 / Revised: 22 July 2021 / Accepted: 26 July 2021 / Published: 29 July 2021
(This article belongs to the Special Issue Plant Biotechnology in Agriculture)

Abstract

:
Lentinula edodes is an edible mushroom that is rich in polysaccharides, glucan, and lentinan. It is famous for its earthy, sweet, umami flavor, and is used in various foods all over the world. Although Lentinula edodes does not carry out photosynthesis with light, its fruit body development is regulated by light. In this study, we analyzed the morphological changes of L. edodes strain Sanjo701ho and identified the global gene expression patterns using EdgeR of fruit body development under blue light. The phenotype analysis under different light sources revealed that the pileus diameter grew, while the stipe length was suppressed under blue light. To understand the changes in the transcriptome under different light sources in L. edodes, gene set enrichment analysis (GSEA), KOG functional categories, and KEGG pathways were used and compared to the no-light condition. Lignocellulose, CAZyme, and transcription factor classified DEGs (differentially expressed genes) were identified to better understand the significant DEGs affected by light sources in the synthesis, metabolism, and recognition of complex carbohydrates. Six glycoside hydrolases (GHs), four auxiliary activities (AAs), three carbohydrate esterases (CEs), and glycosyltransferases (GTs) were identified as upregulated in the CAZyme DEGs. Furthermore, four β-glucosidase, one glucose oxidase, and one multicopper oxidase-related gene for lignocellulolytic genes were upregulated in the blue light condition, and AT_hook transcription factor, CBFD_NFYB_HMF transcription factor, HMG_box transcription factor, and fungal specific transcription factor were upregulated in the blue light condition. This study helps us understand fruit body development in mushroom-breeding programs.

1. Introduction

Mushrooms are one kind of spore-producing fungi. Most mushroom genera belong to the basidiomycetes, but the others are classified as ascomycetes [1]. The energy production of fungi is characterized by nutrient absorption through oxygen respiration; otherwise, in the higher plant kingdom, photosynthesis is the primary energy production method. In addition, mushrooms are rich in minerals and have adequate proteins, so they have the nutritional ingredients of both vegetables and meat. In particular, mushrooms contain essential amino acids, vitamins, and inorganic salts [2]. Lentinula edodes, which is an edible mushroom belonging to the genus Basidiomycetes, mainly occurs in old broad-leaved trees such as oak and chestnut. Moreover, it is known as one of the world’s three major edible mushrooms, including Tricholoma matsutake and Sarcodon imbricatus [3]. As fungi are heterotrophic organisms, incapable of photosynthesis [4], it is considered that mushrooms do not have photoreceptors. However, Sano et al. [5] reported the presence of Le.phrA, which responds to blue light in Lentinula edodes, as the first photoreceptor. It has been reported that the main stipe is shorter, and the color of the shade is darker under blue and green light than under darkness [6]. However, these studies were on a few genes or in the mycelium. Research on all photoreactive genes in mushrooms is still unclear and has been inadequate.
A whole-genome sequencing analysis of Lentinula edodes was completed in 2016 [7]. Several transcriptome studies were reported using the genome sequencing data [8,9]. Additionally, a transcriptome analysis of Lentinula edodes mycelium according to light conditions reported that cell division-related genes, such as the chromosomal structure during DNA replication and recombination, showed an increase in their expression [10]. In this study, we performed genome-wide transcriptome analyses and identified DEGs (differentially expressed genes) in L. edodes under blue light cultivation. The blue light-induced fruit body developmental genes may be involved in functions, such as the cell wall, light response, and carbohydrate metabolic processing. These results can provide useful information on the mechanism of fruit body development.

2. Materials and Methods

2.1. Fungal Materials

The Shiitake mushroom (Lentinula edodes) strain Sanjo701ho (Accession no. ASI 3305) was obtained from the National Institute of Crop Science (RDA, Jeonju, Republic of Korea). After five days of incubation in PDA (potato dextrose agar) medium, the mycelium of Sanjo701ho was transferred onto the mushroom culture medium for 20 days. The mushroom culture medium was mixed with oak sawdust, rice bran, and oyster shell powder at 80%, 18, and 2%, respectively. The moisture was maintained at 58%. Browning formation for 50 days in the dark and 70 days in the light was performed according to Kim et al. [11]. For the morphological analysis under different light sources, the generated fruit bodies were provided with a fluorescent lamp, a white LED (light-emitting diode), a red (660 nm) LED, a green LED, a blue LED, a white–green (525 nm) LED mix, a white–blue (450 nm) LED mix, and no light in a growth chamber maintained at 20 °C and 80% humidity. Each light source was illuminated with 300 lux at the position of the mushrooms’ growth.
Morphological properties under different light sources were determined as described in Jang et al. [12]. The color difference of pileus under blue light or dark (no light) was measured by CM-2600d Spectrophotometer (Konica Minolta, Osaka, Japan).
For the expression profiles of the target genes, the L. edodes fruit body was incubated under blue light or dark (no light) with the same culture conditions for one week. The mushroom samples for the pilei or stipes of the fruit bodies under blue light or dark conditions were harvested every two days until six days after the initiation of the incubation. We designated the harvest times as pileus 1, pileus 2, pileus 3, stipe 1, stipe 2, and stipe 3, respectively. The harvested samples were stored at –80 °C until qRT-PCR analysis.

2.2. RNA Sequencing Analysis

Total RNA was extracted from the whole fruit body using the TRIzol reagent (Invitrogen, Waltham, MA, USA) and then used for the library construction with the RibospinTMII Kit (Geneall Biotechnology, Seoul, Korea) according to the manufacturer’s instructions. A total of six RNA-seq paired-end libraries were constructed from the control (no light) and blue light illuminated sample consisting of three biological replicates each, using the SMARTer Stranded RNA-Seq Kit (Clontech Laboratories Inc., Mountain View, CA, USA) following the manufacturer’s instructions. Each library was then loaded onto the Illumina Hiseq2000 platform, high-throughput sequencing was performed, and paired-end reads were generated. High-quality reads were obtained after several steps of quality checks, which included trimming and the removal of the adaptor/primer and low-quality reads using Trimmomatic v 0.35 [13], and sequence data with quality scores of Q ≥ 20 were extracted using SolexaQA. High-quality filtered reads of all samples were mapped to a draft genome sequence of Lentinula edodes W1–26 (v1.0) from the Joint Genome Institute (JGI) [14] using hisat2 [15], with all parameters set to the default. Then, HTSeq v0.6.1 was used to count the reads that were mapped to each gene and how many reads were mapped to the exons of each gene [16]. The differentially expressed genes between blue light and no-light conditions were identified by the EdgeR package [17], and up and downregulated genes with a p-value < 0.05 and an absolute fold change value of ≥2 were considered for differentially expressed genes (DEGS) and used for downstream functional analysis. Furthermore, assessment of the quality of the mapped reads was conducted by Qualimap for mapping alignment rates, the duplication rate, the GC content, and reads of genomic location [18].

2.3. Functional Analysis of Differentially Expressed Genes

After the data analysis procedure, the selected transcripts were validated and annotated by comparison to the NCBI NR (nonredundant protein) database with an e-value < 1 × 10⁻¹⁰ and annotated by Blast2GO with the default parameters [19]. To assess the GSEA (gene set enrichment analysis) [20] of the DEGs, gene ontology analysis was performed for the significantly expressed genes with a p-value < 0.05 using eggNOG 5.0 to categorize their molecular function, biological process, and cellular components [21]. To this end, the estimated expression levels of all genes were applied in the GSEA, and then enrichment scores were calculated according to the rank-ordered gene list. The GOs of the predefined gene sets were considered, GO terms containing a minimum of 15 genes were evaluated, and an enrichment map in Cytoscape was used for the visualization of the GSEA results. In addition, euKaryotic Orthologous Groups (KOGs) were analyzed by the KOG online tool (WebMGA, http://weizhongli-lab.org/metagenomic-analysis/server/kog/, accessed on 20 October 2020) using blastx (e-value < 1 × 10⁻³), and Kyoto Encyclopedia of Genes and Genomes (KEGG) analyses were carried out using BlastKOALA (https://www.kegg.jp/blastkoala/, accessed on 22 October 2020), assigning GO identifiers to the sequence data of up and downregulated genes. Transcription factor and lignocellulolytic genes were identified from the gene sets derived by Chen et al. [14].

2.4. DEG Expression Profiles and Quantitative RT-PCR Validation

Total RNA was separately extracted from the pili and stipes of mushroom samples 2, 4, and 6 days after incubation under blue light and dark conditions with Trizol (Invitrogen, Carlsbad, CA, USA). One microgram of total RNA was converted into first-strand cDNA using a Power cDNA Synthesis Kit (iNtRON Biotechnology, Seoul, Korea) according to the manufacturer’s instructions. The diluted cDNAs of each were used as a template for the synthesis of the second-strand cDNA with gene-specific primers. The gene-specific primers used in this study are listed in Table S2. Quantitative RT-PCR was carried out with the Rotor-Gene Q 2plex HRM (Qiagen, Hilden, Germany) using the Rotor-Gene SYBR Green PCR Kit (Qiagen, Hilden, Germany). The PCR program for the qRT-PCR used standard methods, and the Rpl4 gene was used as a housekeeping gene for normalization described by Kim et al. [11]. Three replicates of qRT-PCR were done and normalized with the expression of Rpl4 as the internal control gene (Rpl4). Eventually, the relative expression level was calculated using the 2-ΔΔCt method [22] compared to the expression of the pileus sample two days after incubation under blue light.

2.5. Statistical Analysis

All experiments for mushroom morphological properties were carried out by three repetitions, and the values of the mean and standard deviation in Table 1 were analyzed using the SPSS 24 program. A statistical significance test (p < 0.05) was performed for each experimental mean difference through Duncan’s multiple range test.

3. Results and Discussion

3.1. Blue Light-Induced Mushroom Phenotypes

The mushroom phenotypes, including the pileus diameter, pileus thickness, stipe length, and stipe diameter, are presented in Table 1. The diameter of the pileus had the most vigorous growth under blue light, but the least growth in the dark. The thickness of the pileus had the highest value under the white–blue mix light but the lowest value in the dark. The longest stipe length occurred under the red light and was the shortest under the blue light (Supplementary Materials Figure S1, Table 1). Interestingly, the mushrooms under the dark condition had the second longest stipe length. Moreover, the pileus diameter under red light had the second smallest value. The stipe diameter had the highest value under the fluorescent lamp but the lowest value under the blue light (Table 1). The mushroom phenotype under the red light was similar to the dark condition. Eventually, the ratio of the pileus diameter to the stipe length had the highest value under the blue light and the lowest value under the dark condition. Additionally, the second lowest value was under the red light. The configuration properties are shown in Figure S2. The lightness and yellowness of the pileus in the dark (no light) were higher than under the blue light. However, the redness under the blue light was higher than in the dark (Table S1).

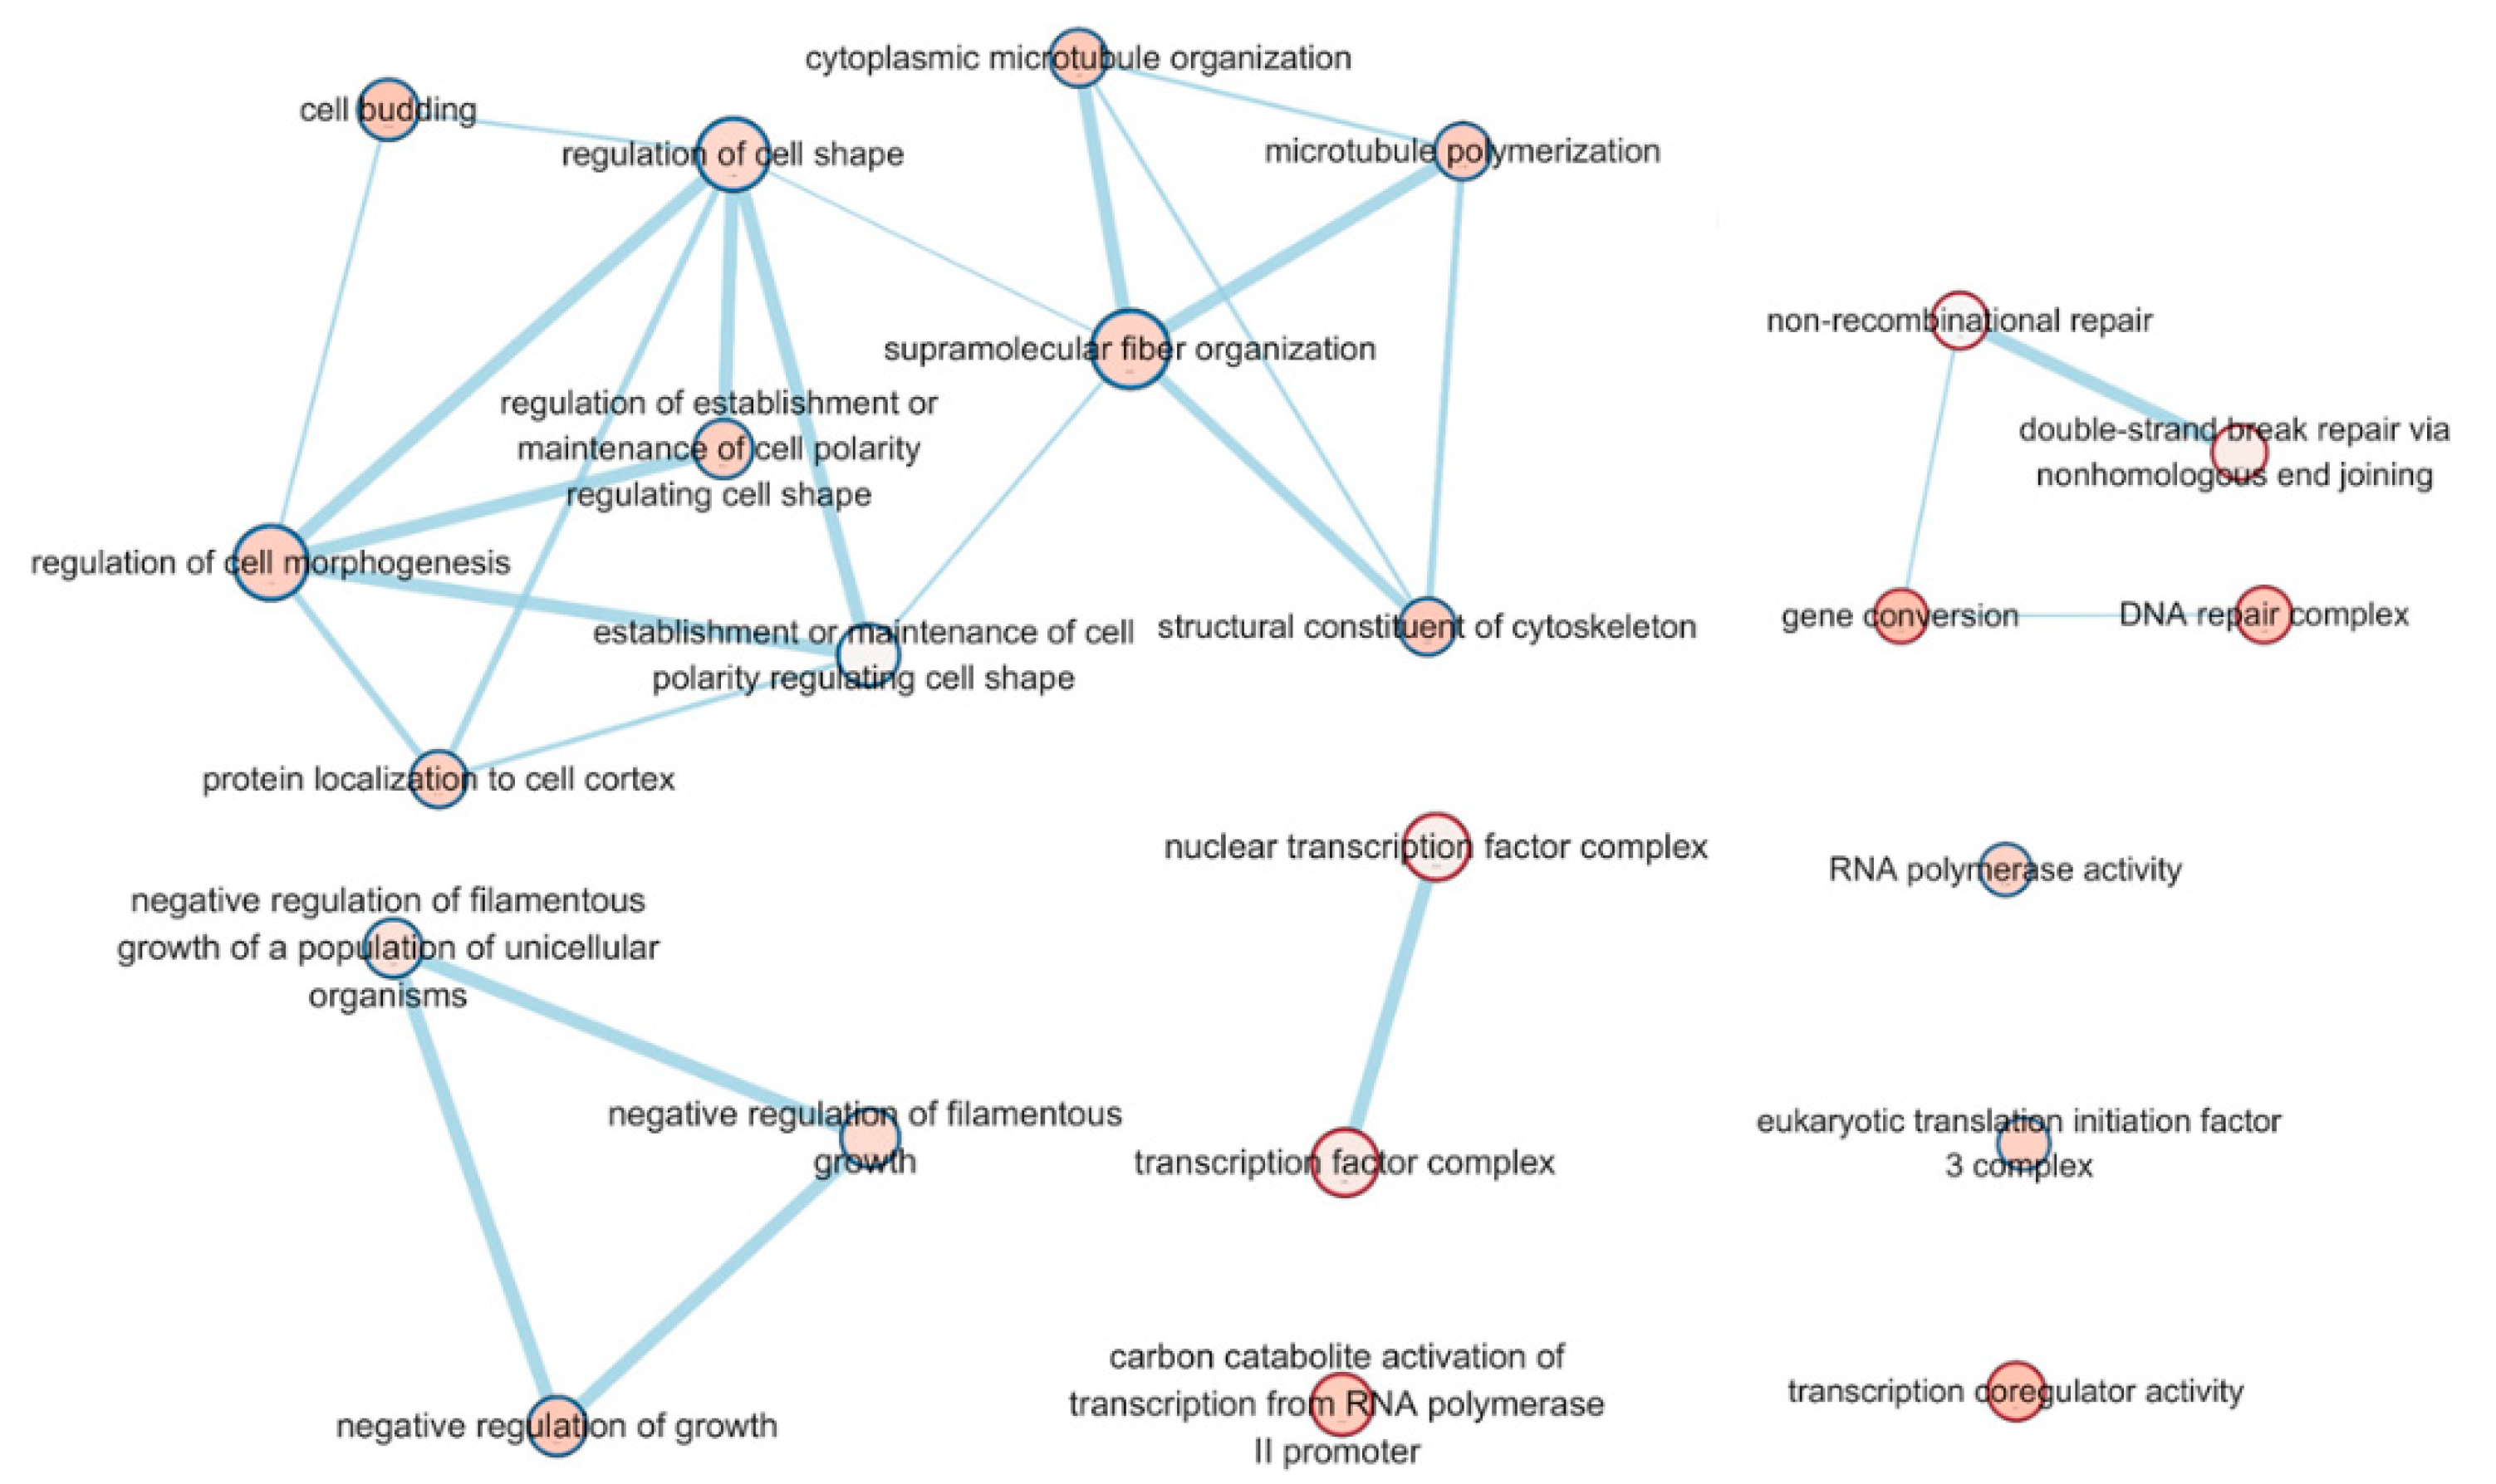
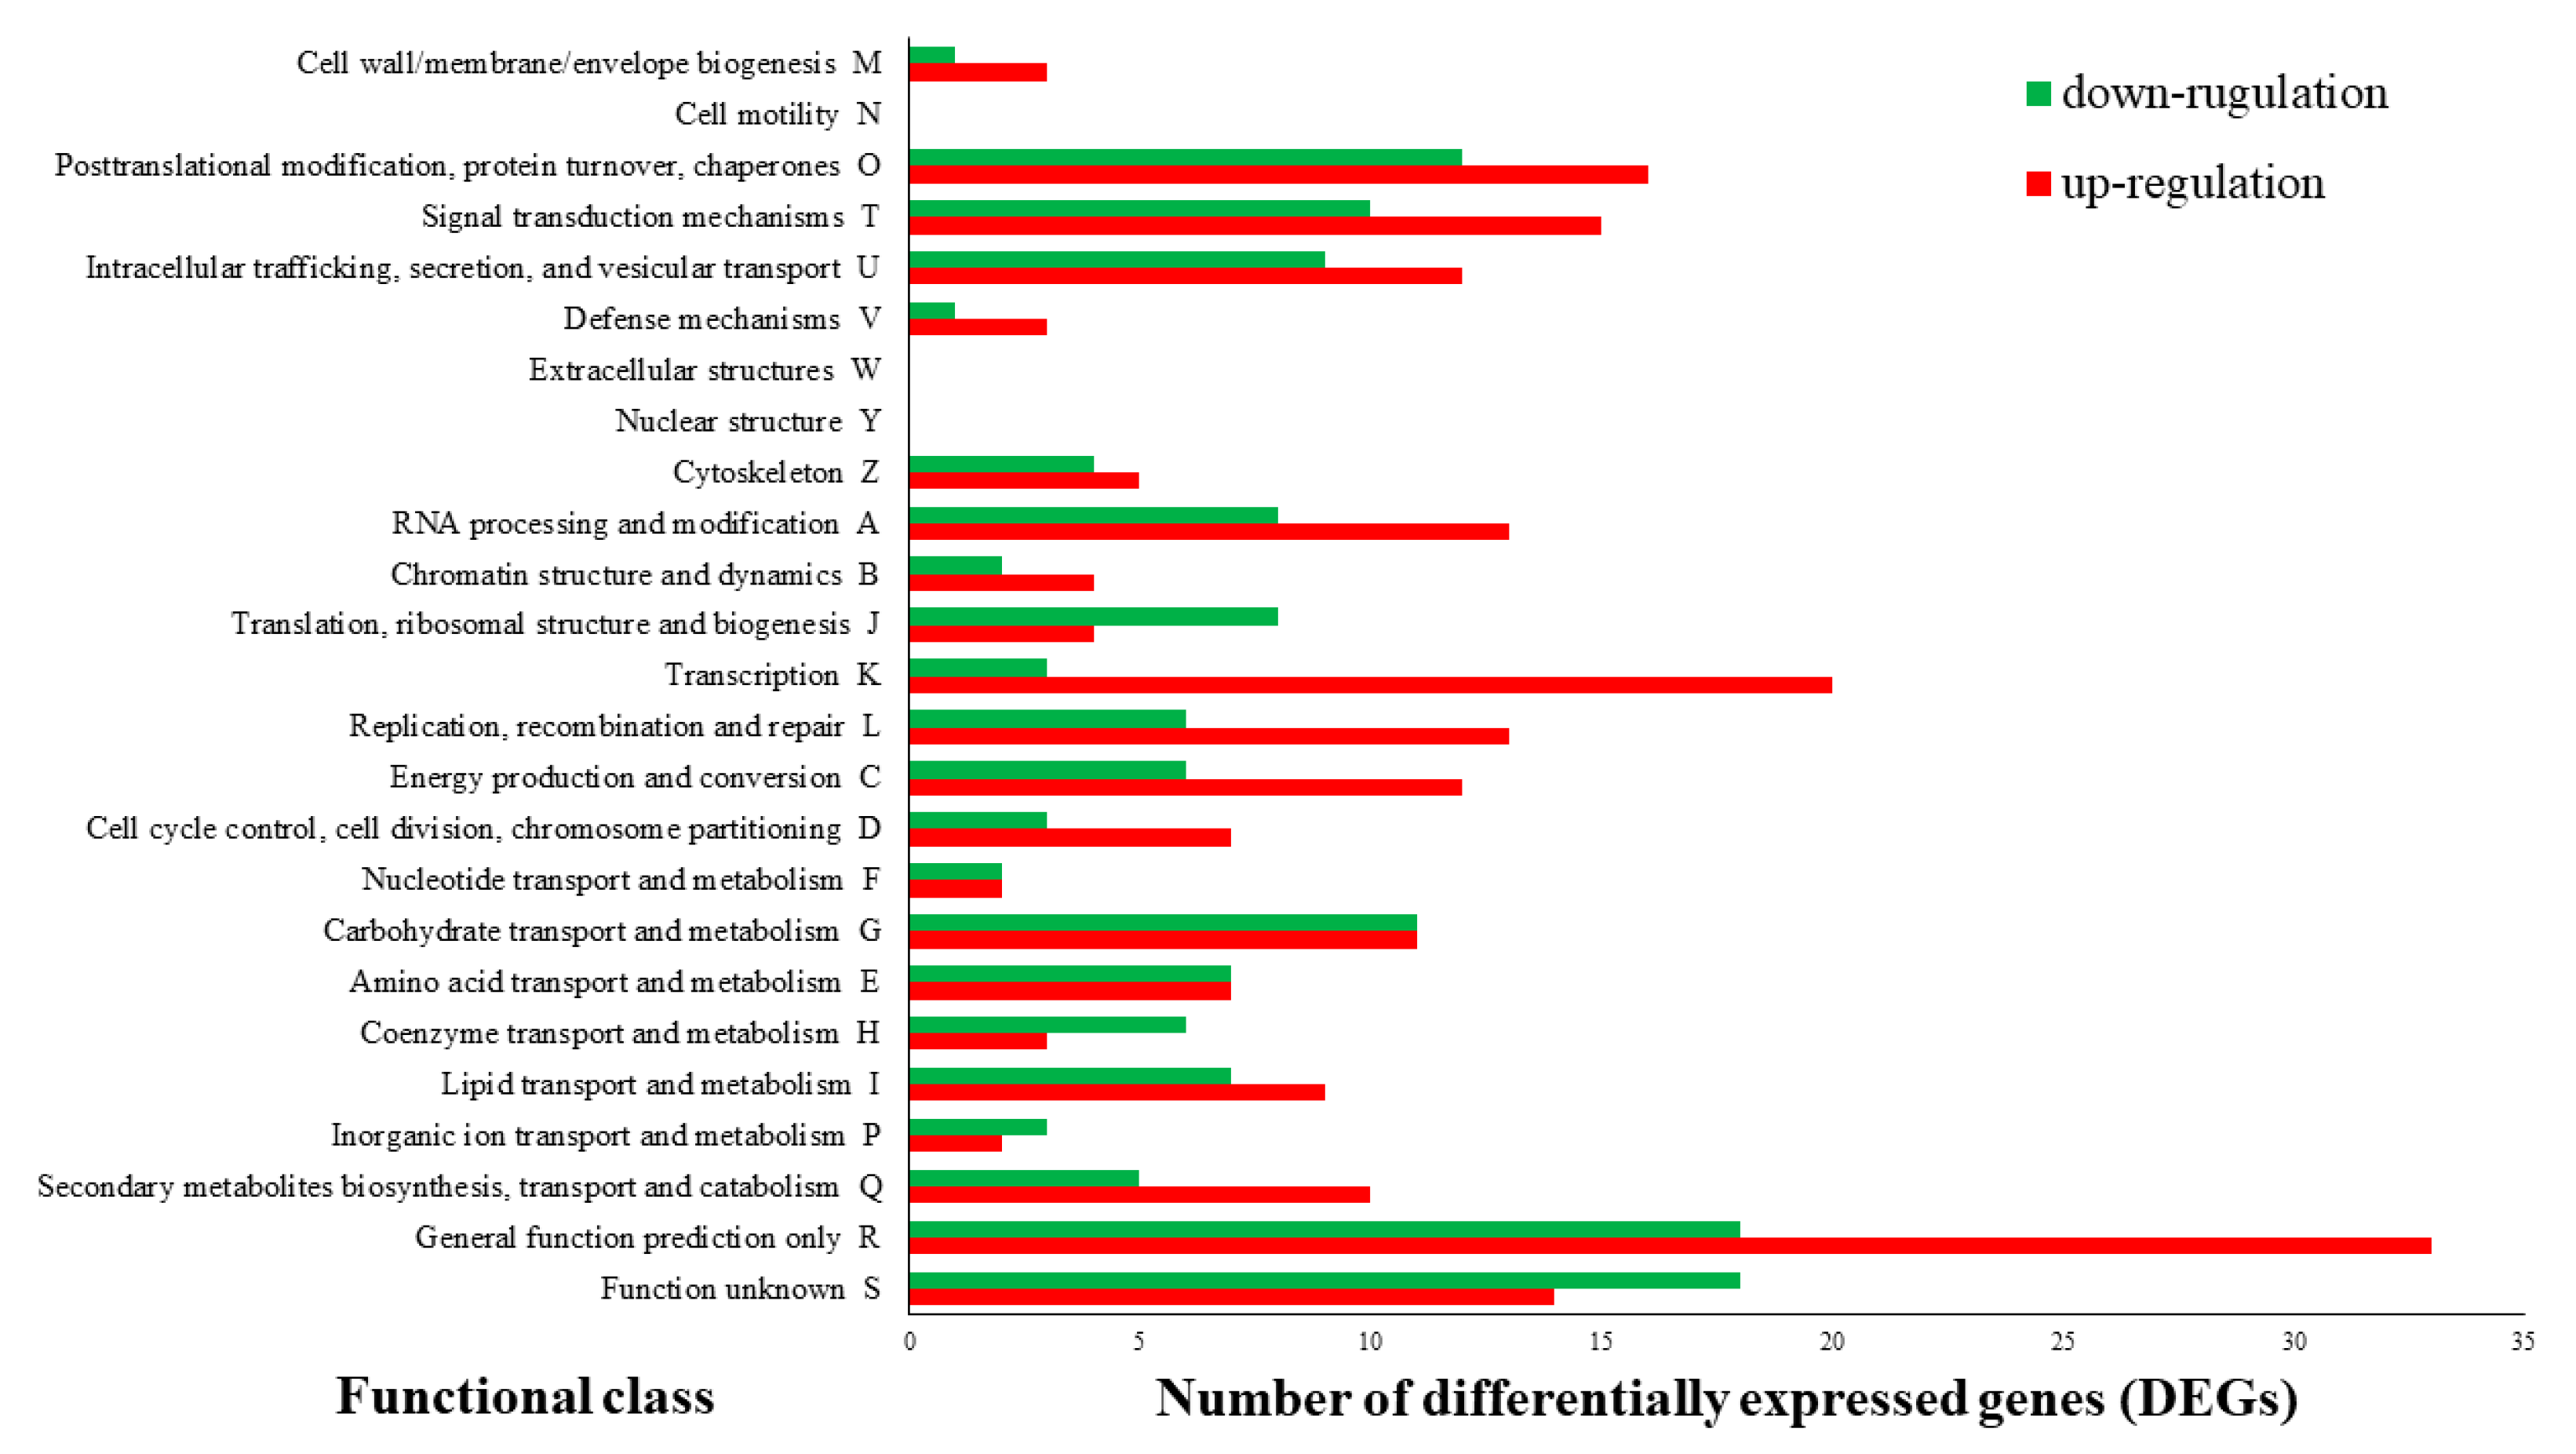
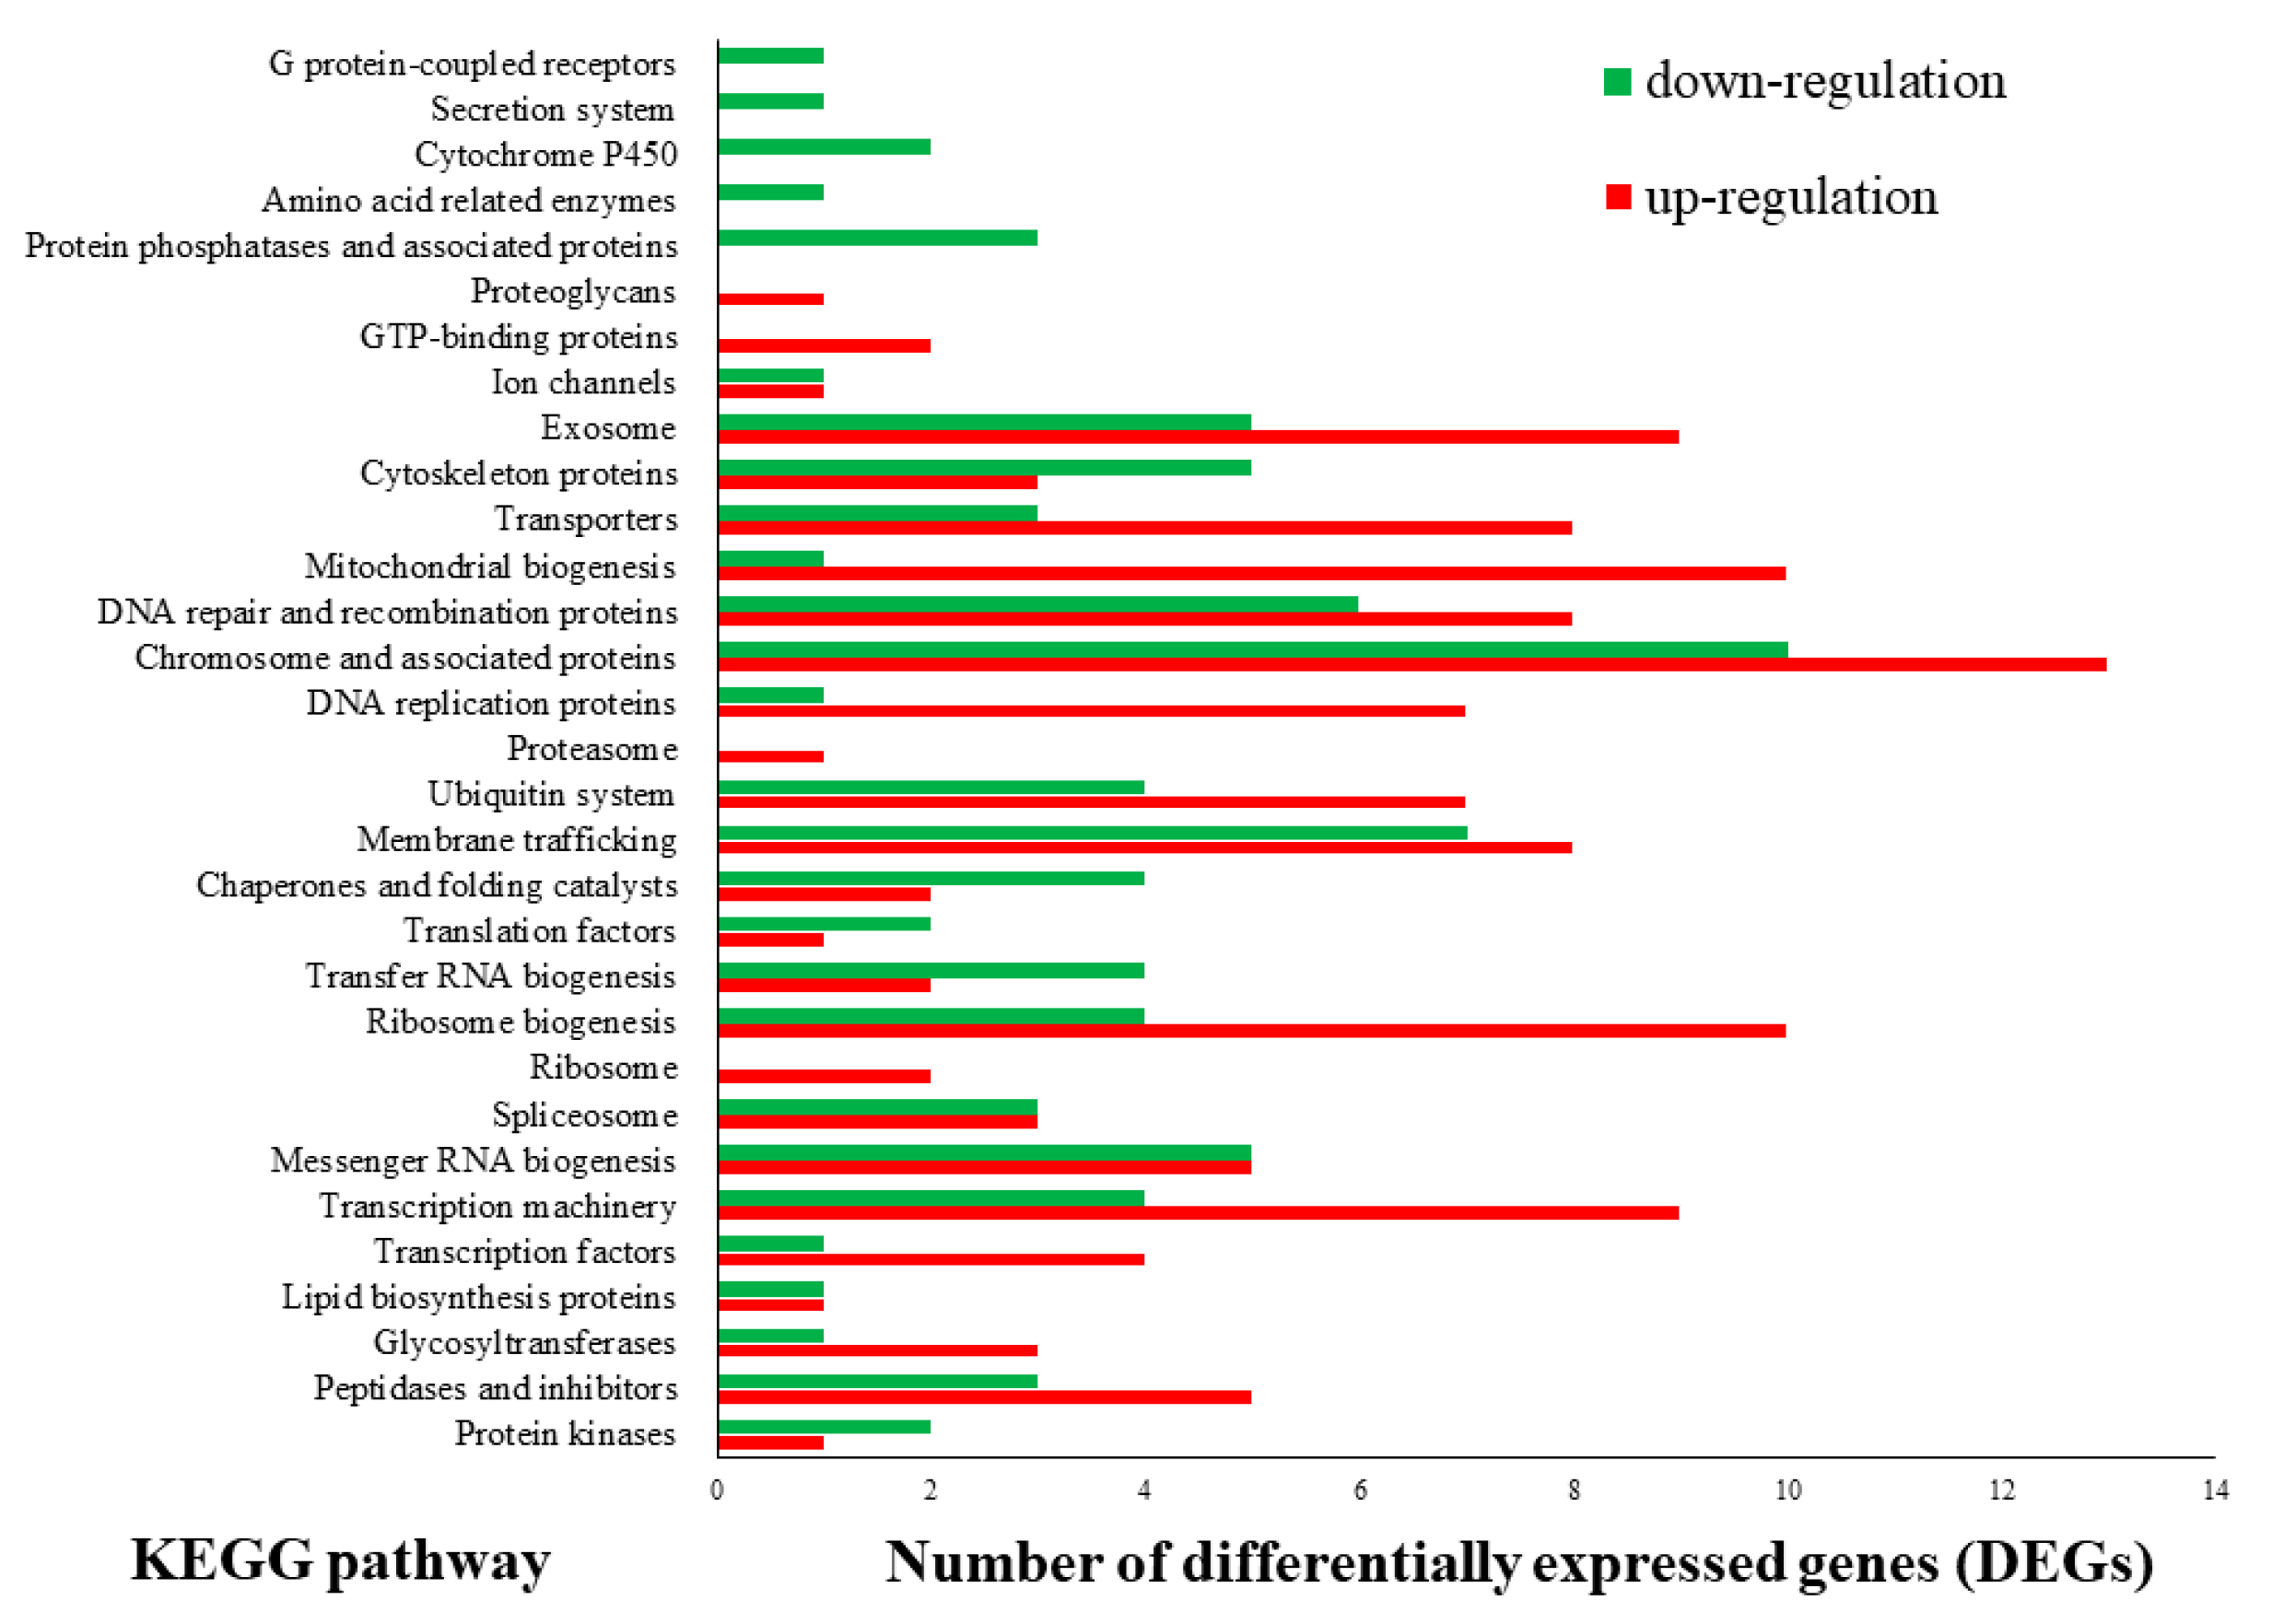
3.2. Transcriptome Sequencing and Functional Annotation of Differentially Expressed Genes (DEGs)

To understand the genome-wide transcriptional changes under different light sources in L. edodes, we carried out a RNA-seq analysis with different light conditions. After quality evaluation and trimming, over 2.2 million trimmed reads on average were generated from each mushroom sample in the dark (no light, NL) and blue light (BL) conditions (Table 2). Over 74% of the sequenced data (average mapping rate: 75.5%) were mapped to assemble the transcripts from the new reference genome sequence with the JGI database in this study. The duplication ratio and GC content ranged between 42.66–46.86% and 47.35–47.66%, respectively. The average 6.7 million, 1.4 million, 5.1 million, and 1.5 million reads of each sample mapped to the exonic region, intronic intergenic, and intronic/intergenic overlapping exon of the gene structure, respectively (Table 2). In addition, principal component analysis (PCA) was performed with specific features derived from alignment, including coverage, GC content, insert size, and mapping quality of each sample, and shown in Figure S2.
A total of 1,416 genes were expressed in at least one of six samples with a p-value less than 0.05. Among them, 338 and 246 genes showed a log2 fold change with up and downregulation in the BL condition, respectively (Table S3). The transcriptome data reported for DEGs specific to blue light cultivation condition in our previous study [11] were different from what is reported here for GSEA analysis, transcription factors, lignocellulose, and CAZyme for carbohydrates in mushrooms. To better understand the significant DEGs affected by the light sources, over-representation of the GO terms with the DEGs was determined by GSEA analysis (Figure 1 and Table S4). These were categorized into functional groups and displayed by an enrichment map in Cytoscape. Significant GO representations (p-value < 0.05, FDR < 0.25) were mainly related to the regulation of cell morphogenesis, such as cell shape, cytoskeleton, and DNA repair, including non-recombinational repair and double-strand repair. In addition, transcription- and translation-related genes, such as transcription factor complex, RNA polymerase activity, and translation initiation factor, were significantly expressed in different light sources.
Investigation of the KOG functional categories was performed for the genes upregulated under the BL condition (Figure 2). Most of the terms were upregulated in the BL condition; among them, “transcription,” “posttranslational modification,” “protein turnover,” “chaperones,” “signal transduction mechanisms,” “RNA processing and modification,” and “replication, recombination and repair” had higher correlations with upregulation in the BL condition than in the NL condition. These results correspond with the GSEA assay and imply that light plays a significant role in the basic development and division of L. edodes cells. To further evaluate the functional pathway derived by the BL condition, KEGG sub-classification was performed with the up and downregulated genes in different light sources. Coincident with the results of the GSEA and KOG analysis, “chromosome and associated proteins,” “mitochondrial biogenesis,” “ribosome biogenesis,” “transcription machinery,” and “DNA repair and recombination proteins” showed high matches with the upregulated genes in the BL condition (Figure 3).
Light is a key environmental factor that influences fruiting body development in many basidiomycetes. For several decades, it has been shown that fruiting body growth, development, and differentiation in basidiomycetes are regulated by blue light [23,24,25,26]. In addition, pileus differentiation and development require light stimulation, and different light qualities can produce different morphological features [27]. In this study, genes related to signal transduction, transcription/post-translation, and cell division, including DNA replication and repair, were upregulated in the blue light condition. The results indicate that blue light affected the growth and development at the cellular level and caused different morphogenesis compared with the no-light condition.

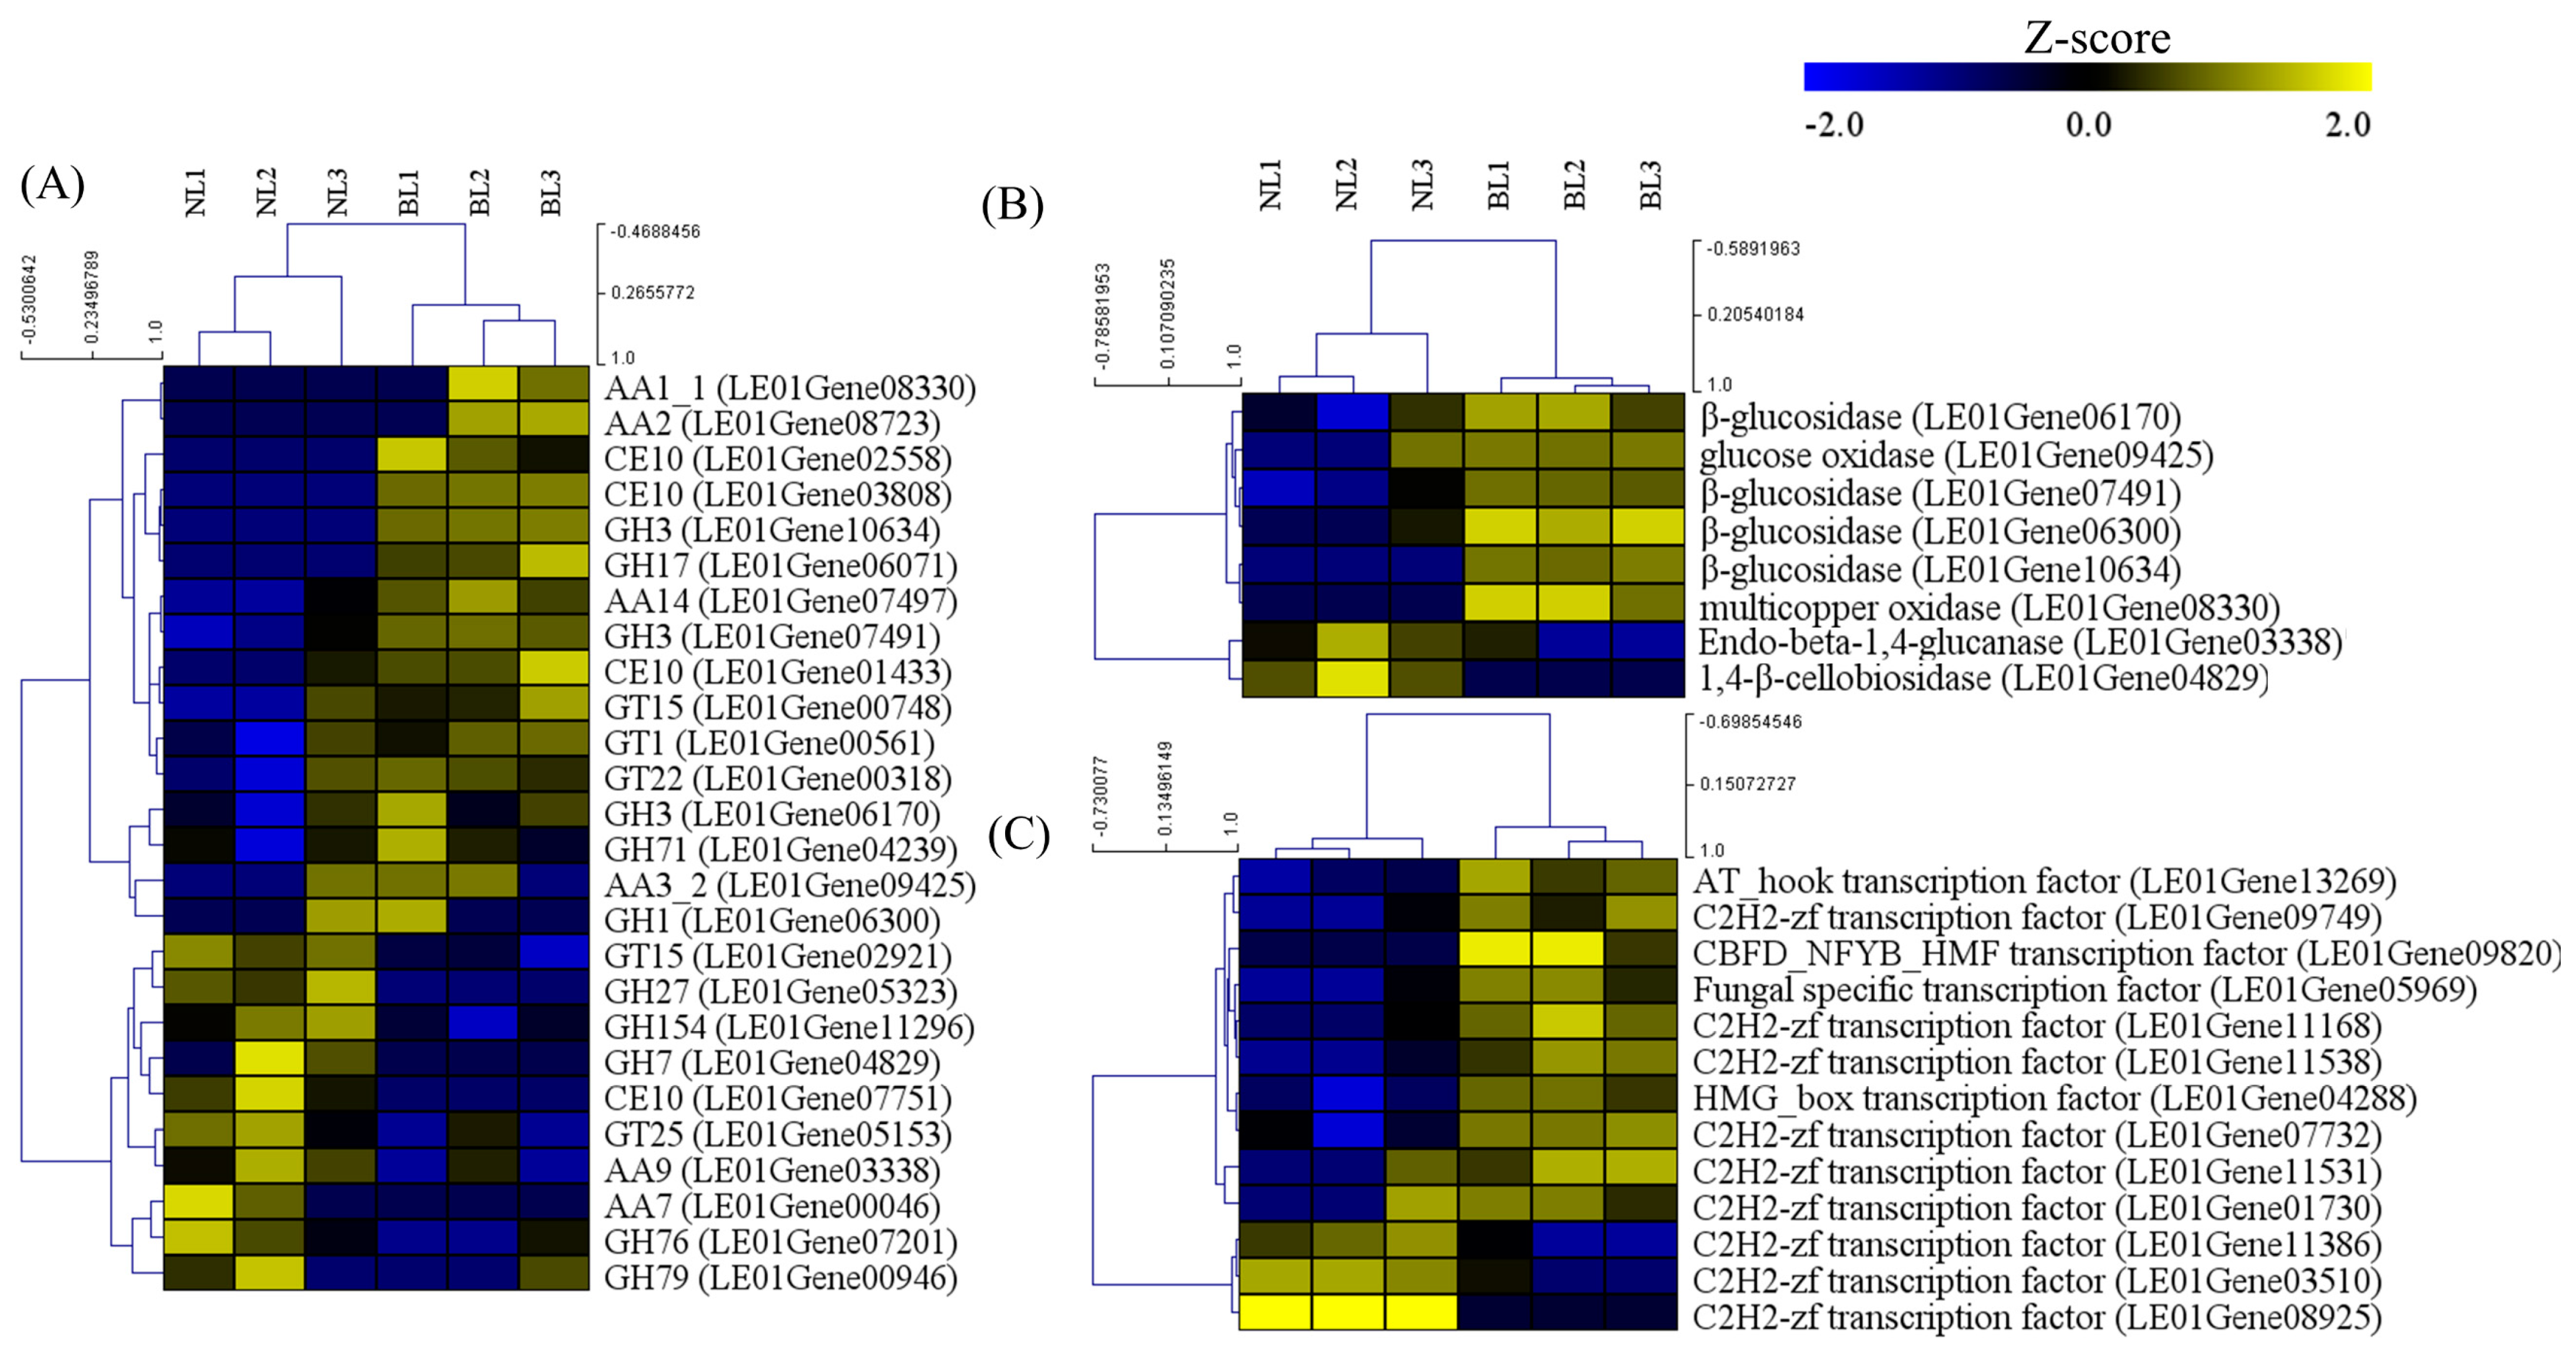
3.3. CAZyme Encoding Genes under Different Light Sources Mapped to the Differentially Expressed Genes (DEGs)

We analyzed families of structurally related catalytic and carbohydrate-binding modules of enzymes that degrade, modify, or create glycosidic bonds using CAZy in DEGs (Figure 4). A total of 16 and 10 genes related to the carbohydrate-binding modules of enzymes were identified as up and downregulated DEGs, respectively. In the upregulated genes, the highest distribution of DEGs belonged to superfamilies with six glycoside hydrolases (GHs), followed by four auxiliary activities (AAs), three carbohydrate esterases (CEs), and glycosyltransferases (GTs).
Among the CAZyme genes, GHs mainly hydrolyze glycosidic bonds between two or more sugars or a sugar and non-sugar moiety within carbohydrates or oligosaccharides and play important roles in the developmental process, such as cell wall modification, cellulosic biomass metabolism, energy metabolism, and stress resistance [28,29,30,31,32]. In this study, the GH1 (1 gene), GH3 (3 genes) GH17 (1 gene), and GH71 (1 gene) families were upregulated under the blue light condition (Figure 4A), and the ratio of the pileus diameter to the stipe length had the highest value under the blue light condition and the lowest value under the dark condition (Figure S1, Table 1). In previous reports, the GH1 family was found to participate in a number of developmental processes and stress responses, including cell wall modification, plant hormone activation or deactivation, and herbivore resistance [29]. GH3 enzymes carry out a range of functions, including cellulosic biomass degradation, plant and bacterial cell wall remodeling, energy metabolism, and pathogen defense [30,31], and the family GH17 mediates diverse processes that include growth, callose deposition, and pathogen defense [32]. Therefore, it is suggested that upregulated GH families under blue light could positively affect the pileus diameter. In addition, AA1 (1 gene), AA2 (1 gene), AA3 (1 gene), and AA14 (1 gene) of the AA family, and GT1 (1 gene), GT15 (1 gene), and GT22 (1 gene) of the GT family were upregulated under the blue light condition (Figure 4A). Auxiliary activity (AA) classification consists of the potential ability to help the original GH, PL, and CE enzymes gain access the carbohydrates encrusted in the plant cell wall [33]. In addition, glycosyltransferases (GTs) influence growth, development, cell division, and environmental responses [34]. Therefore, we can suggest that the upregulated CAZyme gene family, such as GHs, AAs, and GTs under blue light condition, are positively related to pileus development and differently affect the ratio of pileus diameter to the stipe length.
Using the lignocellulolytic genes of L. edodes annotated by Chen et al. [14], we show that four β-glucosidases, one glucose oxidase, and one multicopper oxidase-related gene, also called GH1/GH3, AA3, and AA1, respectively, were upregulated in the blue light condition (Figure 4B), and these results corresponded with the CAZyme analysis. As described above, we showed that the CAZyme and lignocellulolytic genes are upregulated during the early development stage of L. edodes, induced by blue light, suggesting that these enzymes play important roles in lignocellulose degradation to provide sufficient nutrition for the development and differentiation of L. edodes; however, the functions of these genes still require further research.
In molecular biology, a transcription factor is a protein that controls the rate of transcription of genetic information from DNA to messenger RNA by binding to a specific DNA sequence [35]. In this study, 10 out of 13 transcription factors were upregulated in the blue light condition. Among them, six and three C2H2-zf (zinc finger) transcription factors were up and downregulated in the blue light condition, respectively. In addition, the AT_hook, CBFD_NFYB_HMF, and HMG_box transcription factors and fungal-specific transcription factor were upregulated in the blue light condition (Figure 4C). Zinc-finger proteins are the largest family of transcription regulators and differ widely in their structures and functions in many species. Many zinc-finger proteins function as a transcription factor, and these proteins are considered to mainly interact with DNA or chromatin and bind to RNA and proteins [36,37,38]. Therefore, C2H2-Zfs not only participate in transcriptional regulation but also act in RNA metabolism and other biological activities. They are involved in a broad area of processes, such as growth, development, biotic and abiotic stress responses, and external stimulus in living organisms, participating not only in transcriptional regulation but also in RNA metabolism and other biological processes. The AT_hook motif proteins regulate gene expression through the interaction of the motif with the narrow minor groove of AT-rich DNA sequences through both local and global changes in the chromatin structure [39]. AT_hook proteins are involved in meristem maintenance and flowering regulation [40], leaf longevity [41], and hypocotyl growth [42].

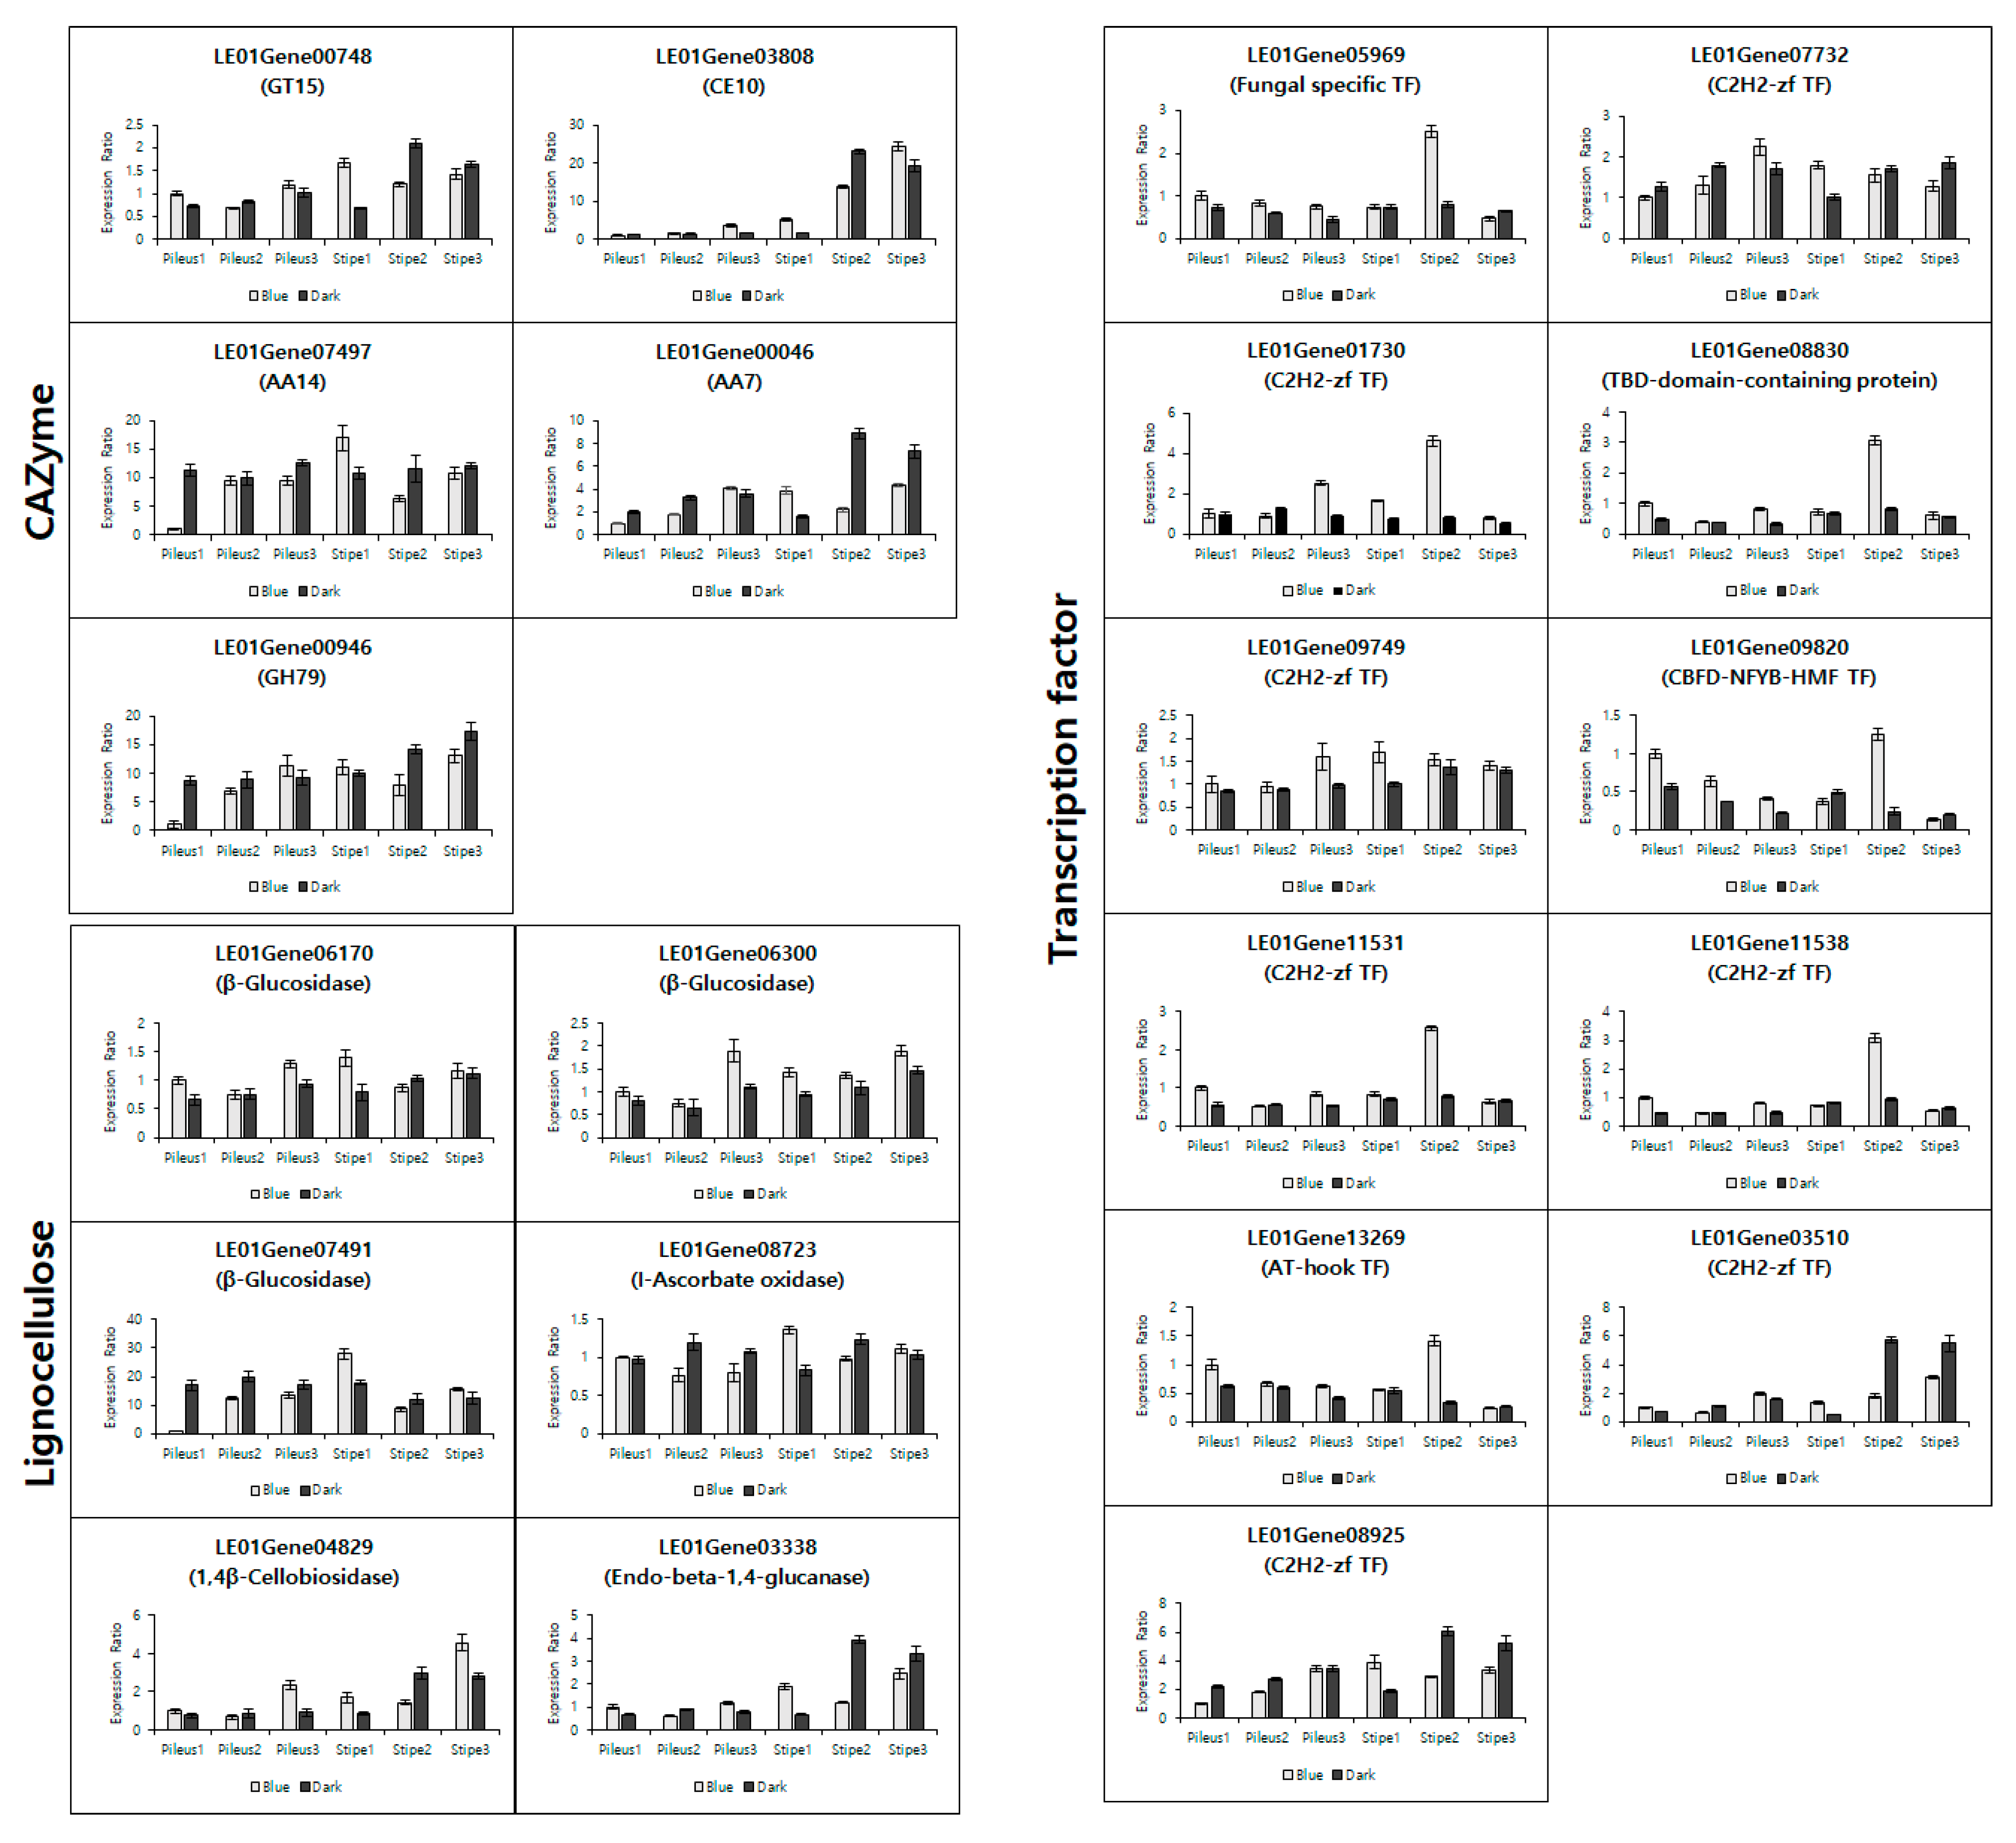
3.4. Validation of the Transcriptome Data by qRT-PCR

To validate the RNAseq results, the expression levels of selected DEGs for transcription factors, lignocellulose, and CAZymes were quantified using qRT-PCR analysis. As shown in Figure 5, the RNA-seq fold change values were basically consistent with the qRT-PCR expression patterns. Seven DEGs for upregulation and two for downregulation in the CAZymes overlapped with lignocellulose. Therefore, the duplicated qRT-PCR results for GH1, 3, AA1, 2, and 3 in the upregulated DEGs, and GH7 and AA9 in the downregulated DEGs were removed from Figure 5. The comparison of the RNAseq and qRT-PCR data implied the accuracy of the sequencing methods (Table S5).
GT15 (LE01Gene00748), CE10 (LE01Gene03808), AA14 (LE01Gene07497) in CAZyme were observed to have upregulated expression, while AA7 (LE01Gene00046) and GH79 (LE01Gene00946) in CAZyme were downregulated in qRT-PCR. β-glucosides (LE01Gene06170, 06300, and 07491) and L-ascorbate oxidase (LE01Gene 08723) were shown to have upregulated expression in lignocellulose, while 1,4-β-cellobiosidase (LE01Gene04829) and endo-beta-1,4-glucanase (LE01Gene03338) were downregulated. Interestingly, the upregulated expression rates under blue light compared to the dark in pileus samples were superior to those in the stipe sample. As shown in Figure S1, the growth of pilus under blue light was more vigorous than in the dark. However, the length of the stipe was greater in the dark. The growth in stipe elongation in the dark may be more significant than under blue light. That is one indirect reason for the low expression of upregulated DEGs in the stipe. On the other hand, the upregulated DEGs for transcription factors, such as fungal-specific transcription factor (LE01Gene05969), C2H2-zinc finger transcription factor (LE01Gene07732, 01730, 09749, and 11531), TBP-domain-containing protein (LE01Gene08830), and AT-hook transcription factor (LE01Gene 13269), were dominantly expressed in both the pileus and the stipe.
Generally, the DEG expression of CAZyme increased according to fruit body development, but the DEG expression of lignocellulose did not. The downregulated DEGs, AA7, GH79, 1,4-β-cellobiosidase, and endo-beta-1,4-glucanase were significantly expressed in the stipe 2 sample under the dark. Remarkably, cell wall degradation enzyme endo-1,4-glucanase increased its expression in Lentinula edodes under blue light [9], and enzyme activity increased in Pleurotus eryngii [43]. However, the increase in expression and activity was determined only at the primordial formation stage. In this study, endo-1,4-glucanase was observed to be highly expressed in a stipe sample in the dark during fruit body development. This may provide additional information for mushroom breeders regarding fruit body development.
As for transcription factors, seven out of nine upregulated DEGs in the stipe 2 sample under blue light were detected to have the highest expression. Several studies reported upregulated expression of transcription factors in mushrooms under blue light. Sakamoto et al. [44] reported that a fungal-specific transcription factor was upregulated after blue light exposure at the mycelium stage in Coprinopsis cinerea. C2H2 zf transcription factor was also reported to have upregulated expression under blue light in Schizophyllum commune [45,46]. C2H2 zf transcription factor had the highest expression in the fruit body compared to the mycelium, aggregate, and primordia stages [45], and drastically increased the expression in dikaryon under blue light [46]. Therefore, C2H2 zf transcription factor may be most expressed in the stipe at stage 2 under blue light.
C2H2 zf transcription factors are considered an abundant family. Shelest [47] stated that C2H2-like zf is one of three major transcription factor families in fungi. Verma [48] classified transcription factors into 32 fungal-specific families, and reported an abundance of C2H2 zf transcription factor from 28 to 112 in fungi. In this study, seven C2H2 zf transcription factors were used to validate the expression with qRT-PCR. Although four C2Hc zf transcription factors in upregulated DEGs were vigorously expressed at stipe 2 under blue light, one C2H2 zf transcription factor (LE01Gene09749) was uniformly expressed during fruit body development. Moreover, two other C2H2 zf transcriptions (LE01Gene03510, LE01Gene08925) detected the highest expression in stipe 2 in the dark. The contradictory results may be caused by the abundant C2H2 zf transcription factors in mushrooms. Because of the limitations on genome annotations in mushrooms, several DEGs remain unclear. However, our results may be useful for mushroom breeders and researchers.

4. Conclusions

In conclusion, we performed RNAseq to identify DEGs involved in blue light-induced fruit body development in L. edodes. The fruit body formation is involved in cells’ morphological and molecular functions such as cell division, cell wall, and the carbohydrate metabolic process. In the phenotypic analysis, the pileus diameter grew, and the stipe length was suppressed under the blue light. The transcriptomic analysis using GSEA, KOG analysis, and KEGG pathways identified categories for the central processes of molecular biology as upregulated genes, including transcription factors in the BL condition. Among the 13 DEGs in the transcription factor category, 10 DEGs including the AT_hook, CBFD_NFYB_HMF, and HMG_box transcription factors and the fungal-specific transcription factor were upregulated in the blue light condition.
CAZyme classifications of the DEGs were conducted to better understand the significant DEGs affected by the light sources on the synthesis, metabolism, and recognition of complex carbohydrates. Selected CAZyme DEGs showed six superfamilies of glycoside hydrolases (GHs) followed by four auxiliary activities (AAs), three carbohydrate esterases (CEs), and glycosyltransferases (GTs), which implies a functional change related to the cell wall polysaccharide metabolism. Furthermore, four β-glucosidases, one glucose oxidase, and one multicopper oxidase-related gene were upregulated in the blue light condition as DEGs for lignocellulose genes. Interestingly, several DEGs overlapped in both the CAZyme and lignocellulose genes. These results provide important information to further our understanding of fruit body development under blue light.

Supplementary Materials

The following are available online at https://www.mdpi.com/article/10.3390/app11156997/s1, Figure S1: Morphological transforms according to different light cultivation conditions, Figure S2: Principal component analysis of Multi-sample BAM QC analysis by Qualimap based on specific features derived from the alignment, including coverage, GC content, insert size and mapping quality of blue (red circles) and no (blue circles) light conditions., Table S1: Summary of color difference of pileus under blue light or dark (no light)., Table S2: The list of DEG primers with 2-fold change under blue light for qRT-PCR, Table S3: The list and annotation of up and downregulated genes with 2-fold change under blue light, Table S4: The list of the differentially expressed genes enriched in GSEA analysis, Table S5: The list of the differentially expressed genes related to the carbohydrate-active enzymes (CAZyme) family, lignocellulose, and transcription factors.

Author Contributions

Data curation, D.Y.K.; writing—original draft preparation, D.Y.K. and J.Y.K.; investigation, J.Y.K.; validation, J.Y.K.; writing—reviewing, J.Y.K.; editing, M.-J.J. and Y.-J.P.; Conceptualization, J.Y.K.; methodology, D.Y.K., M.-J.J. and J.Y.K.; funding acquisition, J.Y.K.; supervision, J.Y.K. All authors have read and agreed to the published version of the manuscript.

Funding

This study was carried out with the support of the R&D Program for Forest Science Technology (Project No. 2021400C10-2125-CA02) provided by Korea Forest Service (Korea Forestry Promotion Institute).

Institutional Review Board Statement

Not applicable.

Informed Consent Statement

Informed consent was obtained from all subjects involved in the study.

Data Availability Statement

Raw sequencing data have been deposited in the NCBI Sequence Read Archive (https://www.ncbi.nlm.nih.gov/sra/, accessed on 19 February 2020) under the accession numbers SRR11110298, SRR11110299, SRR11110300, SRR11110301, SRR11110302, and SRR11110303.

Acknowledgments

This research was supported by the National University Development Project by the Ministry of Education in 2021.

Conflicts of Interest

The authors declare no conflict of interest.

References

  1. De Mattos-Shipley, K.M.J.; Ford, K.L.; Alberti, F.; Banks, A.M.; Bailey, A.M.; Foster, G.D. The good, the bad, and the tasty: The many roles of mushrooms. Stud. Mycol. 2016, 85, 125–157. [Google Scholar] [CrossRef] [Green Version]
  2. Yoo, Y.B.; Kong, W.S.; Oh, S.J.; Cheong, J.C.; Jang, K.Y.; Jhune, C.S. Trends of mushroom science and mushroom industry. J. Mushrooms 2015, 3, 1–23. [Google Scholar]
  3. Han, S.R.; Kim, M.J.; Oh, T.J. Antioxidant activities and antimicrobial effects of solvent extracts from Lentinus edodes. J. Korean Soc. Food Sci. Nutr. 2015, 44, 1144–1149. [Google Scholar] [CrossRef]
  4. Tayer, D.L. Myco-heterotroph-fungus marriages-is fidelity over-rated? New Phytol. 2004, 163, 217–221. [Google Scholar]
  5. Sano, H.; Narikiyo, T.; Kaneko, S.; Yamazaki, T.; Shishido, K. Sequence analysis and expression of a blue-light photoreceptor gene, Le.phrA from the basidiomycetous mushroom Lentinula edodes. Biosci. Biotechnol. Biochem. 2007, 71, 2206–2213. [Google Scholar] [CrossRef] [PubMed] [Green Version]
  6. Baek, I.S.; Lee, Y.H.; Jang, M.J.; Jeoung, Y.K.; Lee, H.B.; Chi, J.H. Effects of cultural characteristics of Lentinula edodes according to LED wavelength with sawdust substrate cultivation. J. Mushrooms 2013, 11, 226–229. [Google Scholar] [CrossRef] [Green Version]
  7. Shim, D.; Park, S.G.; Kim, K.M.; Bae, W.S.; Lee, G.W.; Ha, B.S.; Ro, H.S.; Kim, M.K.; Ryoo, R.; Rhee, S.K.; et al. Whole genome de novo sequencing and genome annotation of the world popular cultivated edible mushroom, Lentinula edodes. J. Biotechnol. 2016, 223, 24–25. [Google Scholar] [CrossRef] [PubMed]
  8. Sakamoto, Y.; Nakade, K.; Sato, S.; Yoshida, K.; Miyazaki, K.; Natsume, S.; Konno, N. Lentinula edodes genome survey and postharvest transcriptome analysis. Appl. Environ. Microbiol. 2017, 83, e02990-16. [Google Scholar] [CrossRef] [PubMed] [Green Version]
  9. Yoo, S.I.; Lee, H.Y.; Markkandan, K.; Moon, S.; Ahn, Y.J.; Ji, S.; Ko, J.; Kim, S.J.; Ryu, H.; Hong, C.P. Comparative transcriptome analysis identified candidate genes involved in mycelium browning in Lentinula edodes. BMC Genom. 2019, 20, 121. [Google Scholar] [CrossRef] [PubMed] [Green Version]
  10. Song, H.Y.; Kim, D.H.; Kim, J.M. Comparative transcriptome analysis of dikaryotic mycelia and mature fruiting bodies in the edible mushroom Lentinula edodes. Sci. Rep. 2018, 8, 8983. [Google Scholar] [CrossRef]
  11. Kim, J.Y.; Kim, D.Y.; Park, Y.J.; Jang, M.J. Transcriptome analysis of the edible mushroom Lentinula edodes in response to blue light. PLoS ONE 2020, 15, e0230680. [Google Scholar]
  12. Jang, M.J.; Lee, Y.H.; Ju, Y.C.; Kim, S.M.; Koo, H.M. Effect of color of light emitting diode on development of fruit body in Hypsizygus marmoreus. Mycobiology 2013, 41, 63–66. [Google Scholar] [CrossRef] [Green Version]
  13. Bolger, A.M.; Lohse, M.; Usadel, B. Trimmomatic: A flexible trimmer for Illumina sequence data. Bioinformatics 2014, 30, 2114–2120. [Google Scholar] [CrossRef] [Green Version]
  14. Chen, L.; Gong, Y.; Cai, Y.; Liu, W.; Zhou, Y.; Xiao, Y.; Xu, Z.; Liu, Y.; Lei, X.; Wang, G.; et al. Genome sequence of the edible cultivated mushroom Lentinula edodes (Shiitake) reveals insights into lignocellulose degradation. PLoS ONE 2016, 11, e0160336. [Google Scholar]
  15. Kim, D.; Langmead, B.; Salzberg, S.L. HISAT: A fast spliced aligner with low memory requirements. Nat. Methods 2015, 12, 357–360. [Google Scholar] [CrossRef] [PubMed] [Green Version]
  16. Anders, S.; Pyl, P.T.; Huber, W. HTSeq—A Python framework to work with high-throughput sequencing data. Bioinformatics 2015, 31, 166–169. [Google Scholar] [CrossRef] [PubMed]
  17. Robinson, M.D.; McCarthy, D.J.; Smyth, G.K. edgeR: A Bioconductor package for differential expression analysis of digital gene expression data. Bioinformatics 2010, 26, 139–140. [Google Scholar] [CrossRef] [Green Version]
  18. Okonechnikov, K.; Conesa, A.; García-Alcalde, F. Qualimap 2: Advanced multi-sample quality control for high-throughput sequencing data. Bioinformatics 2016, 32, 292–294. [Google Scholar] [CrossRef] [PubMed]
  19. Conesa, A.; Götz, S.; García-Gómez, J.M.; Terol, J.; Talón, M.; Robles, M. Blast2GO: A universal tool for annotation, visualization and analysis in functional genomics research. Bioinformatics 2005, 21, 3674–3676. [Google Scholar] [CrossRef] [Green Version]
  20. Subramanian, A.; Tamayo, P.; Mootha, V.K.; Mukherjee, S.; Ebert, B.L.; Gillette, M.A.; Paulovich, A.; Pomeroy, S.L.; Golub, T.R.; Lander, E.S.; et al. Gene set enrichment analysis: A knowledge-based approach for interpreting genome-wide expression profiles. Proc. Natl. Acad. Sci. USA 2005, 102, 15545–15550. [Google Scholar] [CrossRef] [Green Version]
  21. Huerta-Cepas, J.; Szklarczyk, D.; Heller, D.; Hernández-Plaza, A.; Forslund, S.K.; Cook, H.; Mende, D.R.; Letunic, I.; Rattei, T.; Jensen, L.J.; et al. eggNOG 5.0: A hierarchical, functionally and phylogenetically annotated orthology resource based on 5090 organisms and 2502 viruses. Nucleic Acids Res. 2019, 47, D309–D314. [Google Scholar] [CrossRef] [Green Version]
  22. Livak, K.J.; Schmittgen, T.D. Analysis of relative gene expression data using real-time quantitative PCR and the 2−ΔΔCT method. Methods 2001, 25, 402–408. [Google Scholar] [CrossRef]
  23. Aschan-Åberg, K. The production of fruit bodies in Collybia velutipes III. Influence of the quality of light. Physiol. Plant. 1960, 13, 276–279. [Google Scholar] [CrossRef]
  24. Eger-Hummel, G. Blue-light photomorphogenesis in mushrooms (Basidiomycetes). In The Blue Light Syndrome; Eger-Hummel, G., Ed.; Springer: Berlin/Heidelberg, Germany, 1980; pp. 555–562. [Google Scholar]
  25. Idnurm, A.; Heitman, J. Light controls growth and development via a conserved pathway in the fungal kingdom. PLoS Biol. 2005, 3, e95. [Google Scholar] [CrossRef]
  26. Yu, Z.; Fischer, R. Light sensing and responses in fungi. Nat. Rev. Microbiol. 2019, 17, 25–36. [Google Scholar] [CrossRef]
  27. Du, F.; Zou, Y.; Hu, Q.; Zhang, H.; Ye, D. Comparative transcriptomic analysis reveals molecular processes involved in pileus morphogenesis in Pleurotus eryngii under different light conditions. Genomics 2020, 112, 1707–1715. [Google Scholar] [CrossRef] [PubMed]
  28. Nelson, D.L.; Cox, M.M. Carbohydrates and glycobiology. In Lehninger Principles of Biochemistry, 4th ed.; Lehninger, A.L., Nelson, D.L., Cox, M.M., Eds.; W H Freeman & Co.: New York, NY, USA, 2005; pp. 305–325. [Google Scholar]
  29. Cao, Y.Y.; Yang, J.F.; Liu, T.Y.; Su, Z.F.; Zhu, F.Y.; Chen, M.X.; Fan, T.; Ye, N.H.; Feng, Z.; Wang, L.J.; et al. A Phylogenetically Informed Comparison of GH1 Hydrolases between Arabidopsis and Rice Response to Stressors. Front. Plant. Sci. 2017, 8, 350. [Google Scholar] [CrossRef] [PubMed] [Green Version]
  30. Johnson, J.W.; Fisher, J.F.; Mobashery, S. Bacterial cell-wall recycling. Ann. N. Y. Acad. Sci. 2014, 1277, 54–75. [Google Scholar] [CrossRef] [Green Version]
  31. Lee, R.C.; Hrmova, M.; Burton, R.A.; Lahnstein, J.; Fincher, G.B. Bifunctional Family 3 Glycoside Hydrolases from Barley with α-L-Arabinofuranosidase and β-D-Xylosidase Activity: Characterization, primary structures, and COOH-terminal processing. J. Biol. Chem. 2003, 278, 5377–5387. [Google Scholar] [CrossRef] [PubMed] [Green Version]
  32. Lashbrook, C.C.; Cai, S. Cell wall remodeling in Arabidopsis stamen abscission zones. Plant Signal. Behav. 2008, 3, 733–736. [Google Scholar] [CrossRef] [PubMed] [Green Version]
  33. Levasseur, A.; Drula, E.; Lombard, V.; Coutinho, P.M.; Henrissat, B. Expansion of the enzymatic repertoire of the CAZy database to integrate auxiliary redox enzymes. Biotechnol. Biofuels 2013, 6, 41. [Google Scholar] [CrossRef] [PubMed] [Green Version]
  34. Gloster, T.M. Advances in understanding glycosyltransferases from a structural perspective. Curr. Opin. Struct. Biol. 2014, 28, 131–141. [Google Scholar] [CrossRef] [Green Version]
  35. Latchman, D.S. Transcription factors: An overview. Int. J. Biochem. Cell Biol. 1997, 29, 1305–1312. [Google Scholar] [CrossRef] [Green Version]
  36. Takatsuji, H. Zinc-finger proteins: The classical zinc finger emerges in contemporary plant science. Plant Mol. Biol. 1999, 39, 1073–1078. [Google Scholar] [CrossRef]
  37. Gamsjaeger, R.; Liew, C.K.; Loughlin, F.E.; Crossley, M.; Mackay, J.P. Sticky fingers: Zinc-fingers as protein-recognition motifs. Trends Biochem. Sci. 2007, 32, 63–70. [Google Scholar] [CrossRef] [PubMed]
  38. Lee, B.M.; Xu, J.; Clarkson, B.K.; Martinez-Yamout, M.A.; Dyson, H.J.; Case, D.A.; Wright, P.E. Induced fit and “lock and key” recognition of 5 S RNA by zinc fingers of transcription factor IIIA. J. Mol. Biol. 2006, 357, 275–291. [Google Scholar] [CrossRef]
  39. Xiao, C.; Chen, F.; Yu, X.; Lin, C.; Fu, Y.F. Over-expression of an AT-hook gene, AHL22, delays flowering and inhibits the elongation of the hypocotyl in Arabidopsis thaliana. Plant Mol. Biol. 2009, 71, 39–50. [Google Scholar] [CrossRef] [PubMed]
  40. Su, Y.; Kwon, C.S.; Bezhani, S.; Huvermann, B.; Chen, C.; Peragine, A.; Wagner, D. The N-terminal ATPase AT-hook-containing region of the Arabidopsis chromatin-remodeling protein SPLAYED is sufficient for biological activity. Plant J. 2006, 46, 685–699. [Google Scholar] [CrossRef] [PubMed]
  41. Lim, P.O.; Kim, Y.; Breeze, E.; Koo, J.C.; Woo, H.R.; Ryu, J.S.; Park, D.H.; Beynon, J.; Tabrett, A.; Buchanan-Wollaston, V.; et al. Overexpression of a chromatin architecture-controlling AT-hook protein extends leaf longevity and increases the post-harvest storage life of plants. Plant J. 2007, 52, 1140–1153. [Google Scholar] [CrossRef]
  42. Street, I.H.; Shah, P.K.; Smith, A.M.; Avery, N.; Neff, M.M. The AT-hook-containing proteins SOB3/AHL29 and ESC/AHL27 are negative modulators of hypocotyl growth in Arabidopsis. Plant J. 2008, 54, 1–14. [Google Scholar] [CrossRef]
  43. Xie, C.; Gong, W.; Zhu, Z.; Yan, L.; Hu, Z.; Peng, Y. Comparative transcriptomics of Pleurotus eryngii reveals blue-light regulation of carbohydrate-active enzymes (CAZymes) expression at primordium differentiated into fruiting body stage. Genomics 2018, 110, 201–209. [Google Scholar] [CrossRef]
  44. Sakamoto, Y.; Sato, S.; Ito, M.; Ando, Y.; Nakahori, K.; Muraguchi, H. Blue light exposure and nutrient conditions influence the expression of genes involved in simultaneous hyphal knot formation in Coprinopsis cinerea. Microbiol. Res. 2018, 217, 81–90. [Google Scholar] [CrossRef]
  45. Pelkmans, J.F.; Patil, M.B.; Gehrmann, T.; Reinders, M.J.; Wösten, H.A.B.; Lugones, L.G. Transcription factors of Schizophyllum commune involved in mushroom formation and modulation of vegetative growth. Sci. Rep. 2017, 7, 310. [Google Scholar] [CrossRef]
  46. Onm, R.A.; de Jong, J.F.; de Bekker, C.; Wösten, H.A.B.; Lugones, L.G. Transcription factor genes of Schizophyllum commune involved in regulation of mushroom formation. Mol. Microbiol. 2011, 81, 1433–1445. [Google Scholar]
  47. Shelest, E. Transcription factors in fungi: TFome dynamics, three major families, and dual-specificity TFs. Front. Genet. 2017, 8, 53. [Google Scholar] [CrossRef] [PubMed] [Green Version]
  48. Verma, S.; Gazara, R.K.; Verma, P.K. Transcription factor repertoire of necrotrophic fungal phytopathogen Ascochyta rabiei: Predominance of MYB transcription factors as potential regulators of secretome. Front. Plant Sci. 2017, 8, 1037. [Google Scholar] [CrossRef] [PubMed] [Green Version]
Figure 1. Gene set enrichment analysis (GSEA) of differentially expressed genes. Cytoscape and an enrichment map were used for visualization of the GSEA results.
Applsci 11 06997 g001
Figure 2. EuKaryotic Orthologous Groups (KOG) function classifications of differentially expressed genes (DEGs, absolute fold change value set to ≥2 and p < 0.05) under blue light. Functional predictions of DEGs were classified into 25 functional classes by the KOG database, and the functional classes are shown according to the number of DEGs.
Applsci 11 06997 g002
Figure 3. Categories classified by Kyoto Encyclopedia of Genes and Genomes (KEGG) of differentially expressed genes (DEGs, absolute fold change value set to ≥2 and p < 0.05) under blue light. Pathways are shown according to the number of DEGs.
Applsci 11 06997 g003
Figure 4. Heat map analysis and hierarchical clustering of up and downregulated genes under blue light and no-light conditions for (A) CAZyme, (B) lignocellulose, and (C) transcription factor. Each column represents an experimental mushroom sample under a different light source (no light and blue light), and each row represents an identified gene. Yellow and blue indicate the upregulation and downregulation of each gene, respectively. Expression values of genes were transformed into Z-score values.
Applsci 11 06997 g004
Figure 5. Expression validation of selected DEGs for CAZyme, lignocellulose, and transcription factor using qRT-PCR in mushrooms under blue light and dark (no light) conditions. Each relative expression was normalized by the mushroom Rpl4 housekeeping gene.
Applsci 11 06997 g005
Table 1. Summary of morphological properties of the fruit body under different light sources.
Light SourcePileusStipePileus Diameter/Stipe Length
Diameter (mm)Thickness (mm)Length (mm)Diameter (mm)
Fluorescent lamp53.25 ± 2.87 b19.42 ± 1.19 cd42.77 ± 1.00 c13.83 ± 1.00 ab1.25 ± 0.07 c
White LED55.68 ± 2.38 ab20.07 ± 1.13 bcd41.28 ± 0.44 c13.45 ± 1.06 abc1.35 ± 0.06 bc
White–Green LED57.27 ± 0.68 ab22.63 ± 0.44 ab40.73 ± 2.06 c11.37 ± 0.45 d1.42 ± 0.07 bc
White–Blue LED59.38 ± 1.95 ab24.62 ± 0.79 a39.10 ± 1.66 c14.03 ± 0.35 a1.54 ± 0.10 b
Red LED46.17 ± 1.68 c20.85 ± 0.20 bc51.45 ± 1.65 a11.93 ± 0.19 bcd0.90 ± 0.03 d
Green LED54.27 ± 1.09 ab20.93 ± 0.70 bc43.63 ± 1.59 bc12.78 ± 0.40 abcd1.25 ± 0.04 c
Blue LED60.13 ± 0.72 a22.70 ± 0.19 ab32.43 ± 1.05 d10.93 ± 0.31 d1.87 ± 0.08 a
Dark (no light)35.63 ± 5.24 d17.89 ± 1.76 d48.62 ± 5.17 ab11.56 ± 0.25 cd0.73 ± 0.04 d
Values followed by the same letter do not differ significantly at p > 0.05 according to Duncan’s multiple range test.
Table 2. Summary of sequencing and mapping results.
SampleTotal
Reads
Mapped Reads
/Rate (%)
Duplication
Rate (%)
GC
Content (%)
Reads of Genomic Origin
ExonicIntronicIntergenic Intronic/Intergenic Overlapping Exon:
blue light_121,176,45115,896,792
/75.1
44.1947.456,371,6491,323,0944,725,6291,453,657
blue light_221,053,35516,067,707
/76.3
46.8647.576,681,5711,380,8424,680,7331,516,080
blue light_317,564,30713,356,006
/76.0
42.6647.525,656,4741,149,8173,785,0021,271,736
no light_123,688,20117,545,089
/74.1
43.9147.316,285,9841,276,8135,857,4901,413,930
no light_225,593,81519,262,298
/75.3
46.8647.47,417,6141,544,4136,028,4251,704,375
no light_323,973,17018,274,632
/76.2
4547.517,649,2211,525,1415,298,5951,694,124
Average22,174,88316,733,754
/75.5
44.9147.466,677,0861,366,6875,062,6461,508,984
Publisher’s Note: MDPI stays neutral with regard to jurisdictional claims in published maps and institutional affiliations.

