1. Introduction
In behavioral theories of leadership theory [
1], research findings [
2] show that leadership characteristics are translated into behavioral patterns within social networks. Therefore, social network analysis becomes another emerging area in leadership research. In [
3], Bruce Hoppe examines four types of leadership networks and makes use of social network analysis (SNA) to evaluate leadership networks. Scholars define each social network as a graph that consists of nodes (person) connected by edges (relationship). By analyzing the graphs, we can understand more about how the leaders (managers) behave differently from the followers (workers) in an organization. In contrast to the work done by Bruce Hoppe, our study focuses on identifying the leaders by evaluating node importance in social communication networks.
Hussain [
4] provides three centrality measures for social network analysis, namely degree, betweenness, and closeness. The core idea of these measures is centrality. With the advantage of being central to the social network, leaders can influence other peers in the network. In other words, potentially, it can control the flow of information. Smith et al. [
5] use social network analysis to identify instructional teacher leaders. Unlike social networks built on cyberspace, their social network relies on a simple survey that questions teachers how frequently they seek advice from their peers. By assessing the social network density/in-degree and out-degree of a node, it can help the school find out which individual teacher in the network seeks out advice when they need assistance, how often advice is needed, and who is giving help to the others. The work illustrates how SNA can be applied in a school context to identify instructional teacher leaders.
The rapid development of enterprise resources planning (ERP) systems during the last decades has also boosted the development of electronic human resource management (e-HRM). Academic interest in e-HRM has increased and an extensive amount of research in e-HRM could be found [
6,
7,
8,
9,
10,
11,
12,
13].
Performance appraisal is one of the key components in e-HRM; in [
6], Al-Raisi et al. evaluates the performance and acceptance of electronic performance management systems (e-PMS) adopted by organizations in the United Arab Emirate (UAE). Ullah et al. [
7] surveyed 400 people from the healthcare sector with close-end questionnaires. Their result affirms the contributions of the electronic performance appraisal system toward organizational sustainability. Works in [
8] set out three conditions that relaxing the employees’ concerns by the rater’s bias and unfair evaluations.
Assessment on the potential of personnel by using social network analysis is also another research area that draws academia’s attention. In [
12], Hollenbeck and Jamieson explain phenomena and outcomes related to human capital, such as recruiting and onboarding, teamwork and communication, knowledge management, and employee satisfaction, which are all dependent on social capital and the relational networks that exist among employees. They present how SNA can be applied to both research and practice, to develop new ways of thinking about human capital, social capital, and the important interaction between the two. In ref. [
13], Billah and Gauch present that the co-authorship graph with CiteSeer data reveals a great deal of information about the potential of young researchers. They analyze the graph using SNA and demonstrate that the success of young researchers can be predicted more accurately based on their professional network than their established track records.
Fabbri et al. [
9] propose to use the SNA approach to analyze the digital collaboration data. In this work, they found some interesting relationship between employee attitudes and their acts performed on the company’s digital platforms (i.e., digital collaboration data). In contrast to Fabbri et al.’s use of internal data from the company to evaluate the employee attitude, Ricardo Buettner [
10] propose to make use of data from online social networks (OSNs) such as Facebook, LinkedIn and Xing, developing an interdisciplinary framework for online social network-recruiting which helps in the assessment of the suitability of job candidates for a given vacancy.
Identifying potential managerial staff in an organizational network is a very important task, as it allows to know who are the nodes belonging to the corporate social network that provide various benefits, such as strategic information, social support, power, ease to help in solving problems, decisions influence and status [
3]. Managerial personnel are considered valued contributors to the organization because they have more connections with other members, have more task-specific knowledge and confidential information on work-related issues. Therefore, they are less dependent on a single individual [
4,
5]. Following this, through the centrality measures of social network analysis, Probierz [
14] conducted an investigation to study the flow of emails among the employees of Enron organization. This research sought to create and analyze a map of relationships among Enron employees to identify and split out managers or most important people in the network to ensure how to build both efficient spread-out information and to analyze how those managers influence others.
Table 1 summarizes the related works with their research goal, domain and dataset.
In this paper, our approach is to differentiate managerial staff from the general staff. From the HR point of view, if we can identify members of staff in the whole organization who behave like a manager, our approach helps organizations retain managerial talent with the potential to join the management team in the future. This is the reason why identification of potential manager is proposed through the management classification, and it offers another objective assessment of employees in e-HRM.
Contributions
To assess employees’ potential, a traditional appraisal is done by a rater who makes comments on employee’s performance. This mechanism is perceived to be subjective with bias from the rater [
8]. We propose a method to separate the behavioral pattern of managerial staff from the general staff. In the method, apart from those temporal and textual node features, we propose to derive new features by: (1) PageRank to assess the importance of an employee within the corporate social network; (2) word2vec to generate word embeddings to assess the underlying meanings in phrasal values; (3) graph convolutional network to aggregate information from the adjacency nodes in the corporate social network.
2. Our Method
We describe our method to determine the importance of members in a corporate network. In our method, we collect non-sensitive attributes of staff due to privacy concerns and communications records among colleagues. We form different types of graphs reflecting different types of interactions among staff during their work. We use PageRank to identify the important nodes with the different interactions and we also use word embedding with word2vec to turn important phrases into sensible features. By combining the node features from these two pieces of information, we built classifiers using traditional learning methods as well as state-of-the-art graph convolutional network to estimate the different ranks of staff in the organization.
We first describe the different types of interactions from the perspective that we deal with. With human interactions in an organization including emails, face-to-face meetings, and virtual meetings through conference calls, email logs, and calendar schedules, a model is built to analyze social behavioral patterns for staff. In addition, we adopt PageRank and word embedding as new features for modeling the interaction graph. Besides, the importance of a member in an organizational interaction graph is not only determined by the relationship level with the others, but also by other node attributes of the members in the organization such as their divisions/departments or their demographic information.
Traditional learning methods are used including the support-vector machine (SVM) with various kernels, k-nearest neighbor (k-NN), multi-layer perceptron (MLP), and the graph convolutional network (GCN). Empirical results are obtained from these algorithms. This is the first piece of work to use graph neural networks to identify the managerial staff in an organization in addition to PageRank and word embedding features to the best of our knowledge.
2.1. Social Network Analysis for Different Types of Interactions Using PageRank
Five directed graphs are created to model the five different types of interactions in an organization, and a graph can be described with nodes connected by edges with direction. A node represents a member of staff, and an edge between two nodes represents the relationship between two staff. A graph of the staff represents relationships among staff within the organization.
The PageRank algorithm is used to compute the importance of any web page by analyzing:
In our method, the importance of a particular member of staff is found by PageRank values with different types of interactions. This is similar to the importance of the web pages as a manager is usually informed by all kinds of colleagues at different levels and managerial staff or managers usually communicate with other managers. Therefore, we propose to compute PageRank values to estimate the importance of staff within the graph by analyzing:
There are different types of interactions within an organization. In our experiments, five separate types of interaction graphs are built. The graphs are used to record different types of interactions among staff. For example, when receiving a carbon copy email with attachments, the behavior of a managerial and a non-managerial member of staff may be very different. Therefore, we compute separate PageRank values for each of these interaction graphs to maintain as much information as possible for different types of interactions.
In PageRank algorithm [
14], nodes in the same graph are in a set
. There are
nodes
∈
(
is the label of node
), and for each
, it will have a damping factor
. The
is a constant parameter.
is a set of nodes that point to
.
is the number of edges which
points to other nodes. PageRank of node
is formulated as:
The five types of interactions graph represent five types of interactions among staff. We compute the PageRank of each node in each graph. In other words, for any given member of staff, there are five PageRank values representing the importance of the staff in these five separate graphs. After the five PageRank values are computed, instead of comparing PageRank among members, we take these five values as features and fit them into classification algorithms for predictions.
2.2. Node Features
Employee data is always private and confidential. Because of information privacy, it is unlikely for a company to provide us with detailed employee data for model building. In light of this, only non-sensitive employee attributes are selected for our experiments, such as native language, modularity class, organizations, office, and divisions. As there are different types of node features of an employee, classification algorithms only accept numerical features, categorical features are handled with one-hot encoding, and we use word embedding for phrases in employee attributes using word2vec.
2.2.1. One-Hot Encoding
In this work, there are four categorical node attributes. We use one-hot encoding to transform these four attributes into numerical feature vectors before feeding them into the models. These four attributes are “Communication Language”, “Native Language”, “Linguistic Group”, and “Ethnic Group”. After the encoding, we create a feature vector of 24 dimensions with the following
Table 2 summarizing the one-hot encoding with the attributes.
There can be issues with one-hot encoding to turn textual features into numerical features:
There could be a large number of possible of phrases in the textual attributes. The dimensionality grows according to the number of possible phrases.
Curse of dimensionality: when dimensionality increases, the volume of the space increases quickly such that data points become sparse in the high-dimensional space. The increased sparsity becomes problematic for classification methods with the curse of dimensionality.
Words with similar meanings could be considered close to each other. With one-hot encoding, word similarity is ignored. For example, “bigger” is close to “big”.
2.2.2. Word Embedding Using word2vec with Phrases
Unstructured textual features cannot be fed directly into machine learning methods. Word embedding is a way to transform textual features into numerical vectors in the embedding space, that embeds semantic similarity between words to be computed by simple mathematical functions such as the cosine similarity. For example, there is an employee attribute containing some text describing the functional department of staff. We transform this textual attribute into a numerical representation by using word2vec. With word2vec, words that share similar meanings will be mapped close to each other in the word2vec space. Therefore, “Office of Finance” is close to “Account Department”. In this subspace, the machine learning model is made to understand the similarity of staff from these two departments, while one-hot encoding only considers them as different departments without the concept of similarity.
To be more specific with an example, there is an attribute “Label” which contains textual descriptions for the working location of staff. It is believed that there should be some indicative information we may extract from the text that helps for the classification. On the other hand, the word2vec algorithm maps words into a subspace of hundreds of dimensions. Given the phrases in the “Label” attribute, one keyword is chosen from the text to compute the word embedding with the following steps as it is shown in our experiments that this method works well in practice.
Step 1: Stop-words removal
In this step, we remove all unnecessary stop words that have no indicative information.
Table 3 shows a few examples of stop-words.
Step 2: Removal of words not very informative
In this step, we remove words that are commonly used but not very informative.
Table 4 shows a few examples of common-words.
Step 3: Keyword selection
Without non-informative words, keywords are chosen for word embedding.
Table 5 shows a few examples words picked from the “Label” attribute; these are just the first words as the keywords from the phrases in the attribute.
The word2vec model that we use is Continuous Bag-of-Words, with Hierarchical Softmax activation, vector size of 500. The model could be found in
https://github.com/maxoodf/word2vec#basic-usage (accessed on 27 July 2021). As a result, a feature vector of a fixed size of 500 dimensions would be created for each data point.
2.3. Traditional Machine Learning Methods
After the feature extraction stage, we have the following independent features extracted per each point in the dataset
- ∘
5 numerical features from the raw data
- ∘
24 dimensional features created by one-hot encoding
- ∘
5 PageRank values from the five interaction graphs
- ∘
500-dimensional word embedding features from word2vec
For the traditional learning algorithms, we fit the data with the following methods
- ∘
Support-vector machine
- ▪
Linear kernel
- ▪
Gaussian kernel
- ▪
Sigmoid kernel
- ∘
k-nearest neighbors
- ∘
Multi-Layer Perceptron (MLP)
2.4. Graph Convolutional Network
PageRank is taken as one of the features to build the classification model, extracting information about the importance of the nodes. On the other hand, PageRank only accounts for the incoming edges, as well as the importance of the referencing nodes. Outgoing edges with the managerial staff sending out email and arranging meetings with colleagues maybe overlooked. In addition, PageRank is not a supervised learning method, which cannot be directly used for classification purposes. Therefore, we propose to extract graph properties using graph neural networks as a graph supervised learning method to provide complementary information.
Graph neural networks (GNNs) are variants of deep learning architecture that captures the dependence of graphs between the nodes of graphs. Because of the expressive power of graphs, GNNs are receiving increasing attention from researchers. The major objectives of graph analysis include node classification, graph classification, sub-graph clustering, and link predictions. In this paper, the managerial staff identification problem is tackled using node classification with graph neural networks.
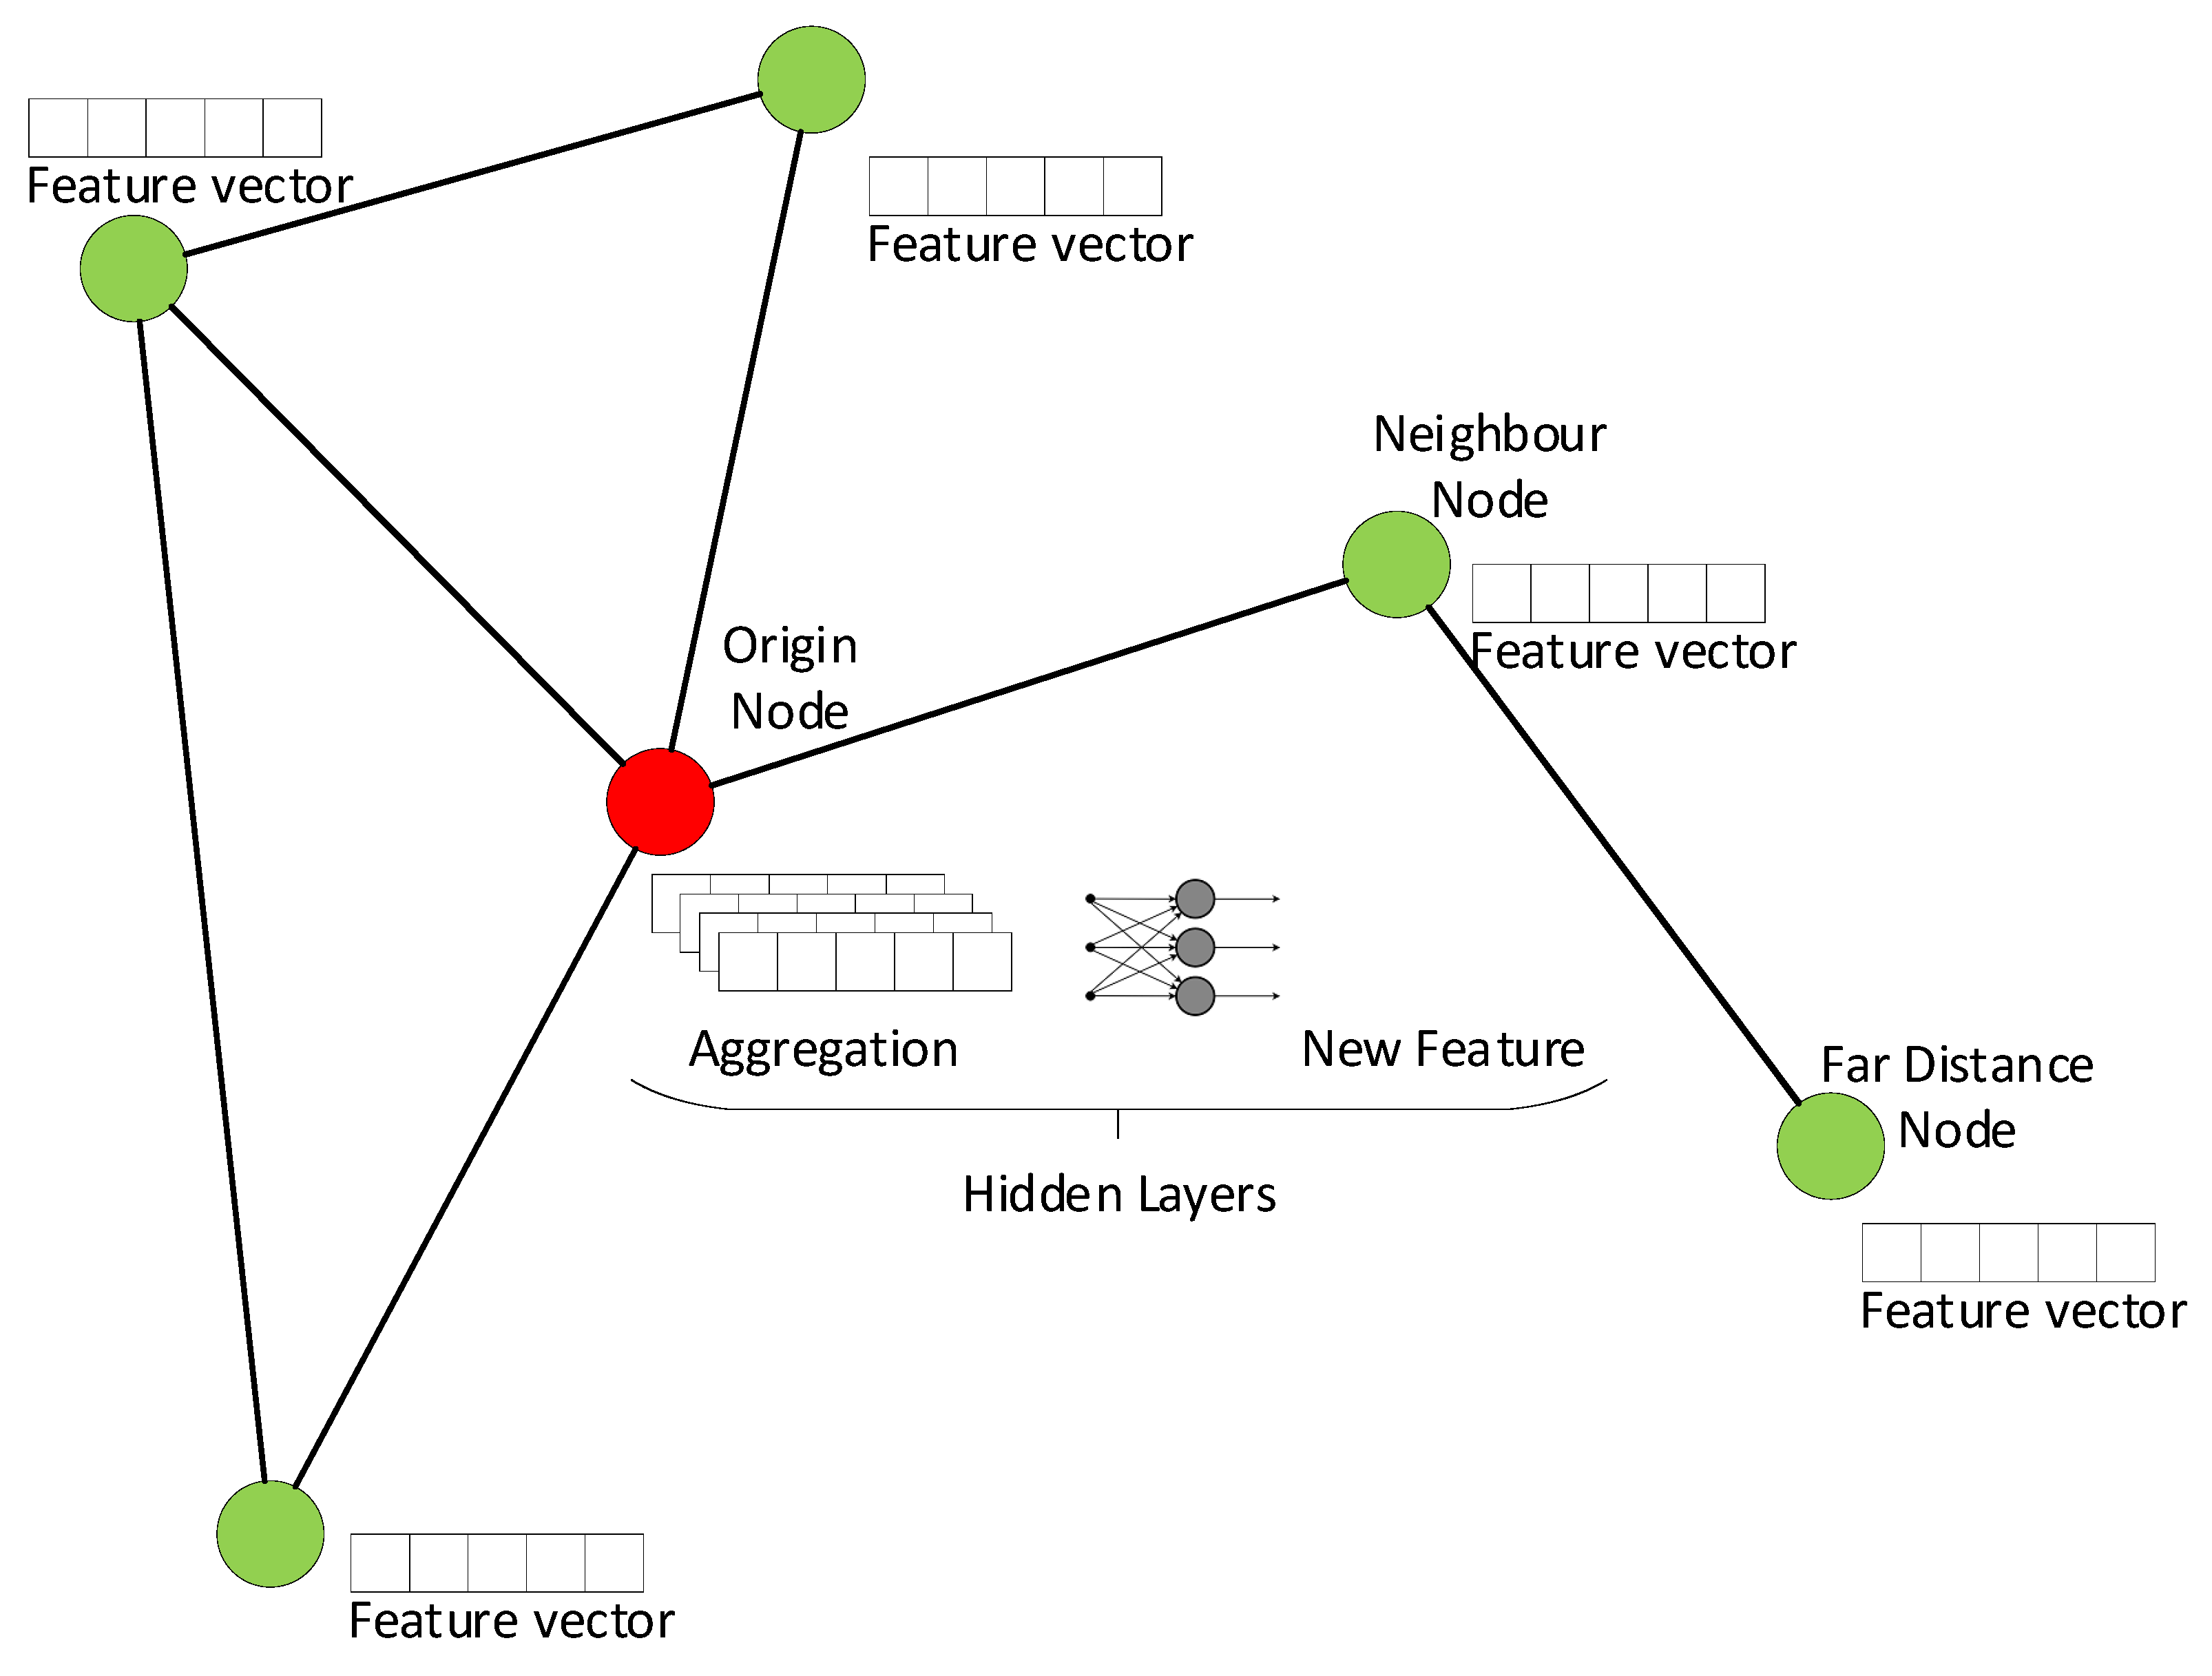
The efficient architecture of a convolutional neural network (CNN) is capable to extract highly representative features in high dimensional data. This led to revolutions of the artificial intelligence development in many areas including image, video, and sound processing. On the other hand, the convolution and pooling mechanisms of CNN are only designed for regular grids. That makes it difficult to analyze data represented in the graph structure. Therefore, graph convolutional network (GCN) is proposed as a variant of convolutional neural network that can be used for graphs to take advantage of their structural information. The general idea of GCN is to extract graph information with the hidden layer by aggregating information from a node and all its neighbor nodes. By stacking the hidden layers, the architecture can aggregate graph information from nodes that are far away from any particular node.
Figure 1 illustrates the general idea of GCN.
Apart from traditional machine learning algorithms, a graph convolutional network is built with the data. Unlike the node features extracted for different methods, interaction graphs are fed into GCN. As described in the previous section, there are five types of interactions to build the five corresponding graphs. An intensity graph is used to represent different interactions among staff. A directed graph with each node of the graph representing staff, and a directed edge from node A to node B representing the interaction initiated from A to B. The weight on each directed edge with a value from one to five corresponds to the top intensity level from A to B. For instance, if person A carbon copies an email (Type-1 interaction), and also sent an email with attachments (Type-4 interaction) to B, the weightings of the edge from A to B would be 4. We call this graph an intensity graph. Apart from the information extracted from the intensity graph, all node and PageRank features are fed into our GCN model for training, whereas only node and PageRank features are used for training of the traditional learning methods.
3. Experiments
In our experiment, we use a real-world dataset from an Austrian IT company, Knapp System Integration as a leader of intra-logistics solutions and warehouse automation in the global market. This company is a part of the international Knapp Group, which counts with a network of 53 locations worldwide. It aims to provide customized smart and innovative logistics solutions and integrated logistics software for numerous partners in health care, fashion, retail, media, optics, mail-order business, and logistic service. This company works under a project management where different transnational organizations and companies are involved in the group. The company works on global supply chain projects, providing automation technology and software solutions for logistics and production facilities.
We extract the required features from the dataset as described in the
Section 2. We use three traditional methods and a graph neural network for comparison. The three algorithms are support vector machine (SVM) with different kernels, k-nearest neighbors (k-NN), multi-layer perceptron (MLP). The graph neural network we propose to use is graph convolutional network (GCN).
3.1. Dataset
Data was collected the year of 2017 and involved two stages. The first corresponds to meetings between researchers and company executives to allow access to the email database of the project managers of this case study. The second stage corresponds to the exportation of email relationships, and calendaring and scheduling information (scheduling messages for online and face-to-face meetings) interchanged during the project’s life into a flat-file (data). Due to the project managers of each project that manages all information related to it, the company gave us the folder of the email account of them, with all emails, calendaring, and scheduling information related to each project. Then, we applied a heuristic to extract two files: the first contains the total amount of nodes or members of staff (nodes file), and the second contains the links among project team role (PTR) belonging to each network.
The data consists of two parts: attribute information and contact information. Attribute data includes native language, modularity class (this attribute detects subgroups of nodes working together in the network using the community detection algorithm proposed by Blondel et al. (2008)), organizations (this attribute measures the kind of organization of the staff involved in the project such as headquarters, subsidiary offices, overseas branch offices, customers and providers), divisions (this attribute measures the organizational structure that groups the different staff involved in the project such as acquisition, operation and logistics, customer service, engineering and manufacturing), and the rank of employees (this attribute refers to the line of division that exists between various managerial positions in an organization who are responsible for the work performance). For the contact data, we obtained some contact information through emails or meeting schedules. The contact data records the direction and the contact intensity from person A to person B. Contact intensity is defined by five increasing levels (see
Table 6) and explained.
In this work, there are five types of inter-colleague relationships (i.e., graphs), representing different means of collaboration as shown in
Figure 2. The relationship categories are respectively: (1) nodes which simply share some information by exchanging emails (without attachments) to each other with their counterparty email address in the carbon copy (i.e., “cc”) field; (2) nodes exchanging emails (without attachments) to each other with their counterparty email address in the recipient (i.e., “to”) field; relationships (3) and (4) are similar to the relationship (1) and (2), but the email was sent with attachment; and relationship (5) represents a relationship between staff via being engaged in audio/video conferences or face-to-face meetings. This conference/meeting information is collected through the calendar/schedule of the staff (correct). In this work, we consider graphs with five different social relationship for each member of staff, as shown in
Figure 2.
In
Figure 2, the closer the node to the center, the more the edges connecting to that particular node. In other words, members closer to the center are more likely to have a stronger connection to other staff members in the organization. For teams in a mature company, various managerial personnel are always located in the central area of the interaction graph.
It can be observed that in
Figure 2, in the
Figure 2a,b with the types of interactions (1) and (2), there are a lot of nodes located in the central area of the graph. As mentioned above, the more the edges connected to a node, the closer the node is to the center of the graph. As exchanging emails is an efficient means of communication among staff, many nodes are located in the central area of the graph. While exchanging emails with attachments is less common than interactions (1) and (2), there are fewer nodes in the
Figure 2c,d with interactions (3) and (4). In addition, the
Figure 2e with interactions (5) contains even fewer nodes than all the previous graphs because arranging a virtual/face-to-face meeting is the most time-consuming way to communicate.
In this dataset, there are two hundred and three members of staff from eight different divisions. Most participant staff have relationships of type (2), i.e., an email as a carbon copy recipient without attachments. Only 35.47% of members of staff have relationships of type (5), i.e., meeting schedule, as illustrated in
Table 5. The total relationships within the organization are 4167.
With the features of any given node, there is an attribute “Rank” which represents their rank in the organization of the given staff. In this work, we take this “Rank” attribute as the class label of the classification problem.
Table 7 shows the distribution of staffs by their rank in the organization.
3.2. Results
To quantify the improvement with the features including PageRank with different levels of interactions and word embedding with phrases, we fit our models with different combinations of features, and the results are shown in
Table 8.
It is found that by adding PageRank and word embedding features, most of our models are improved significantly with better accuracies. Significant improvements can be observed with the accuracy going from 65% to 77% using word embedding and the linear kernel. An improved accuracy of 4.4% is observed with PageRank and the linear kernel. Experiments demonstrate that the accuracies with different models could be optimized by including features with both PageRank and word embedding.
The results from the graph convolutional networks are shown in
Table 9. It is also found that the model achieves its best accuracy when the size of hidden neurons increases to 1024. Moreover, when there is a very limited learning capacity in the model, e.g., hidden neurons = 4, the features of PageRank and word embedding improve the classification performance. When the learning capacity of the model is large enough, these feature does not lead to better accuracies. The graph convolutional network is able to achieve better accuracy by extracting sufficient information from the edge relationships among nodes.
It is shown in our experiments that features calculated using PageRank with different interactions and word2vec features improve the classification accuracy in general. Moreover, the graph convolution network extracts complementary graph information from the intensity graph. GCN achieves the best accuracy among all methods in this work. All experiments are repeated 100 times with random shuffled training and test sets. The average accuracy is calculated for a better estimation of all accuracies.


 ,
, 

