Article

QRS Detection Based on Medical Knowledge and Cascades of Moving Average Filters

1
Institute of Life Sciences, Sant’Anna School of Advanced Studies, 56127 Pisa, Italy
2
Institute of Clinical Physiology, National Council of Research, 56124 Pisa, Italy
*
Author to whom correspondence should be addressed.
Appl. Sci. 2021, 11(15), 6995; https://doi.org/10.3390/app11156995
Submission received: 9 June 2021 / Revised: 16 July 2021 / Accepted: 27 July 2021 / Published: 29 July 2021
(This article belongs to the Special Issue Research on Biomedical Signal Processing)

Abstract

:
Heartbeat detection is the first step in automatic analysis of the electrocardiogram (ECG). For mobile and wearable devices, the detection process should be both accurate and computationally efficient. In this paper, we present a QRS detection algorithm based on moving average filters, which affords a simple yet robust signal processing technique. The decision logic considers the rhythmic and morphological features of the QRS complex. QRS enhancing is performed with channel-specific moving average cascades selected from a pool of derivative systems we designed. We measured the effectiveness of our algorithm on well-known benchmark databases, reporting F1 scores, sensitivity on abnormal beats and processing time. We also evaluated the performances of other available detectors for a direct comparison with the same criteria. The algorithm we propose achieved satisfying performances on par with or higher than the other QRS detectors. Despite the performances we report are not the highest that have been published so far, our approach to QRS detection enhances computational efficiency while maintaining high accuracy.

1. Introduction

Electrocardiography is the recording of the electrical activity originated by the heart in its duty cycle. The analysis of both rhythm and shape of the characteristic PQRST pattern can reveal altered conditions of the cardiac system. Software-based analysis of the electrocardiogram is a valuable tool, even more so with the increased presence of portable and wearable systems. The first and foremost step of ECG software analysis is heartbeat detection, specifically the ventricular systole which is represented by the combination of the Q, R, and S characteristic waves, the QRS complex. In the ECG analysis pipeline the accuracy of heartbeat detection determines the result quality of the following stages. Thus, this first step should be as accurate as possible. The main limiting factors in QRS detection accuracy are undesired noise, prominent T waves, and abnormal (non-sinus) beats.
Scientific literature on heartbeat detection is rich, and several approaches have been proposed over time. The most notable and referenced is Pan and Tompkins’ algorithm [1], to which newer approaches are still compared to. Their work is based on differentiation, rectification and integration of the filtered ECG signal and a decision threshold calculated from the estimates of signal and noise levels. Several techniques have been applied to QRS detection [2], like filter banks, neural networks, wavelets, and other means of signal decomposition. Recently, Phukpattaranont [3] introduced quadratic filtering to QRS detection that attempts a thorough frequency characterization of the ECG. Wavelet-based processing has been a mainstay of ECG processing and heartbeat detection [4,5,6,7]. Pal et al. [8] and Hossain et al. [9] proposed methods based on empirical mode decomposition while Bashar et al. [10] proposed an algorithm consisting in a set of rules applied on variable frequency complex demodulation, a time-frequency representation. Another time-frequency representation was applied in QRS detection by Zidelmal et al. [11], the S-Transform. Manikandan et al. [12] proposed a QRS peak search logic based on the Hilbert transform applied to the single-step derivative of frequency-filtered ECG. Gutiérrez-Rivas et al. [13] used a finite state machine as a dynamic threshold for QRS complexes. Data-driven machine learning methods have also been applied in this field, notably convolutional neural networks [14,15]. Cai and Hu [16] reported very high performances on two databases using convolutional neural networks.
Lately, researchers have published several QRS detection algorithms specifically designed for wearable applications [17,18,19] due to the increasing interest towards ambulatory, daily monitoring [
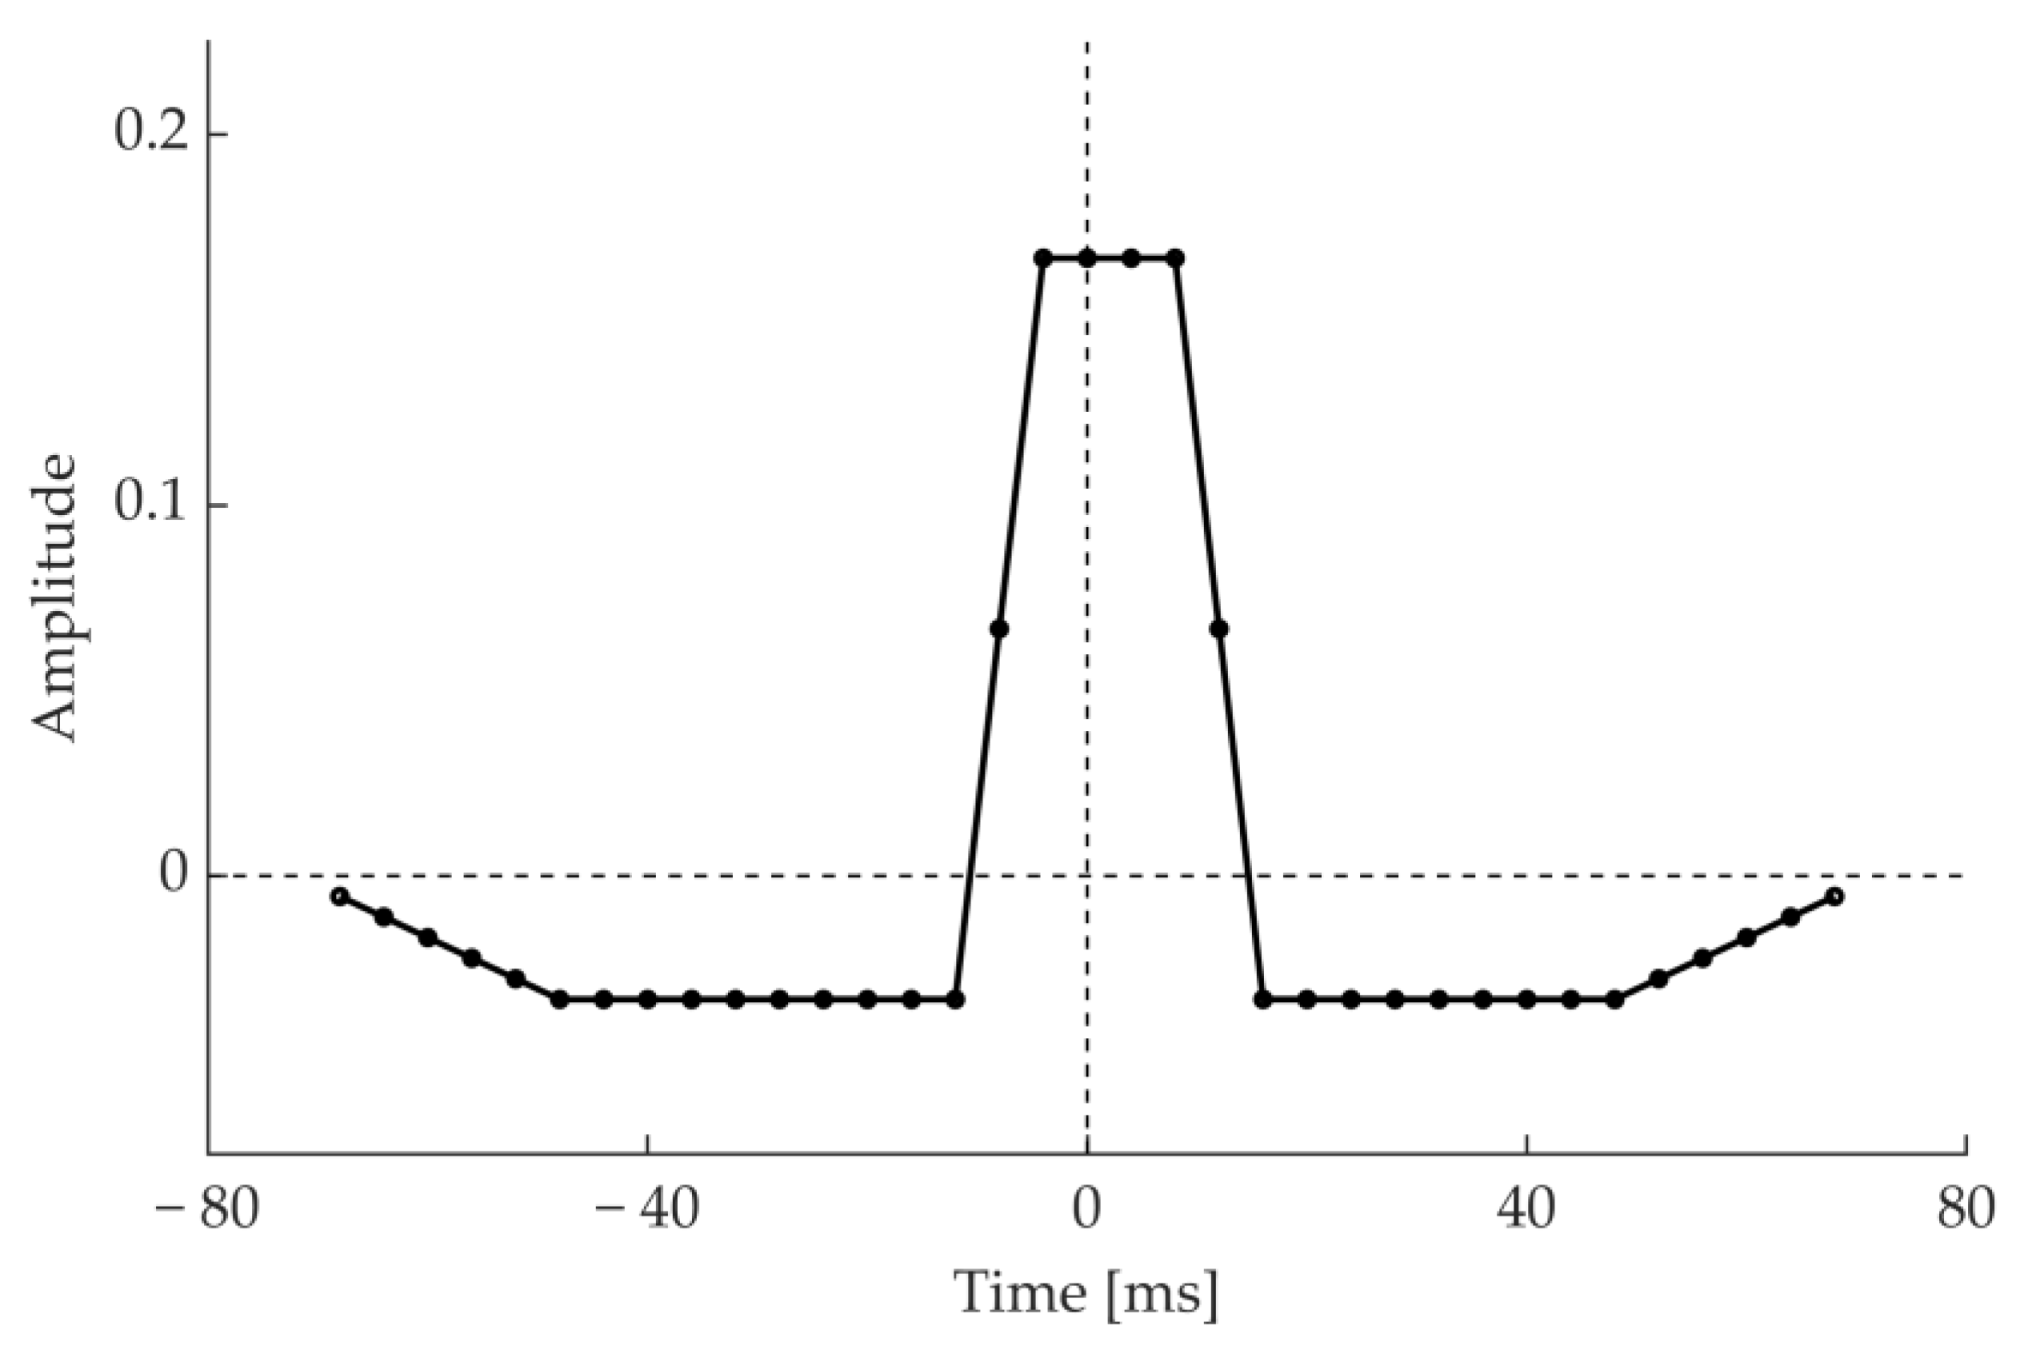
20]. Early detection of cardiac abnormalities may significantly improve the outcome of therapeutic efforts and the general quality of life of the patient. Often, these algorithms designed for wearable applications are based on established, low complexity ECG processing techniques as bandpass filters, single-step derivatives, signal integration, and adaptive amplitude and/or length thresholds. Derivative transforms are often used to enhance the QRS complex [1,21,
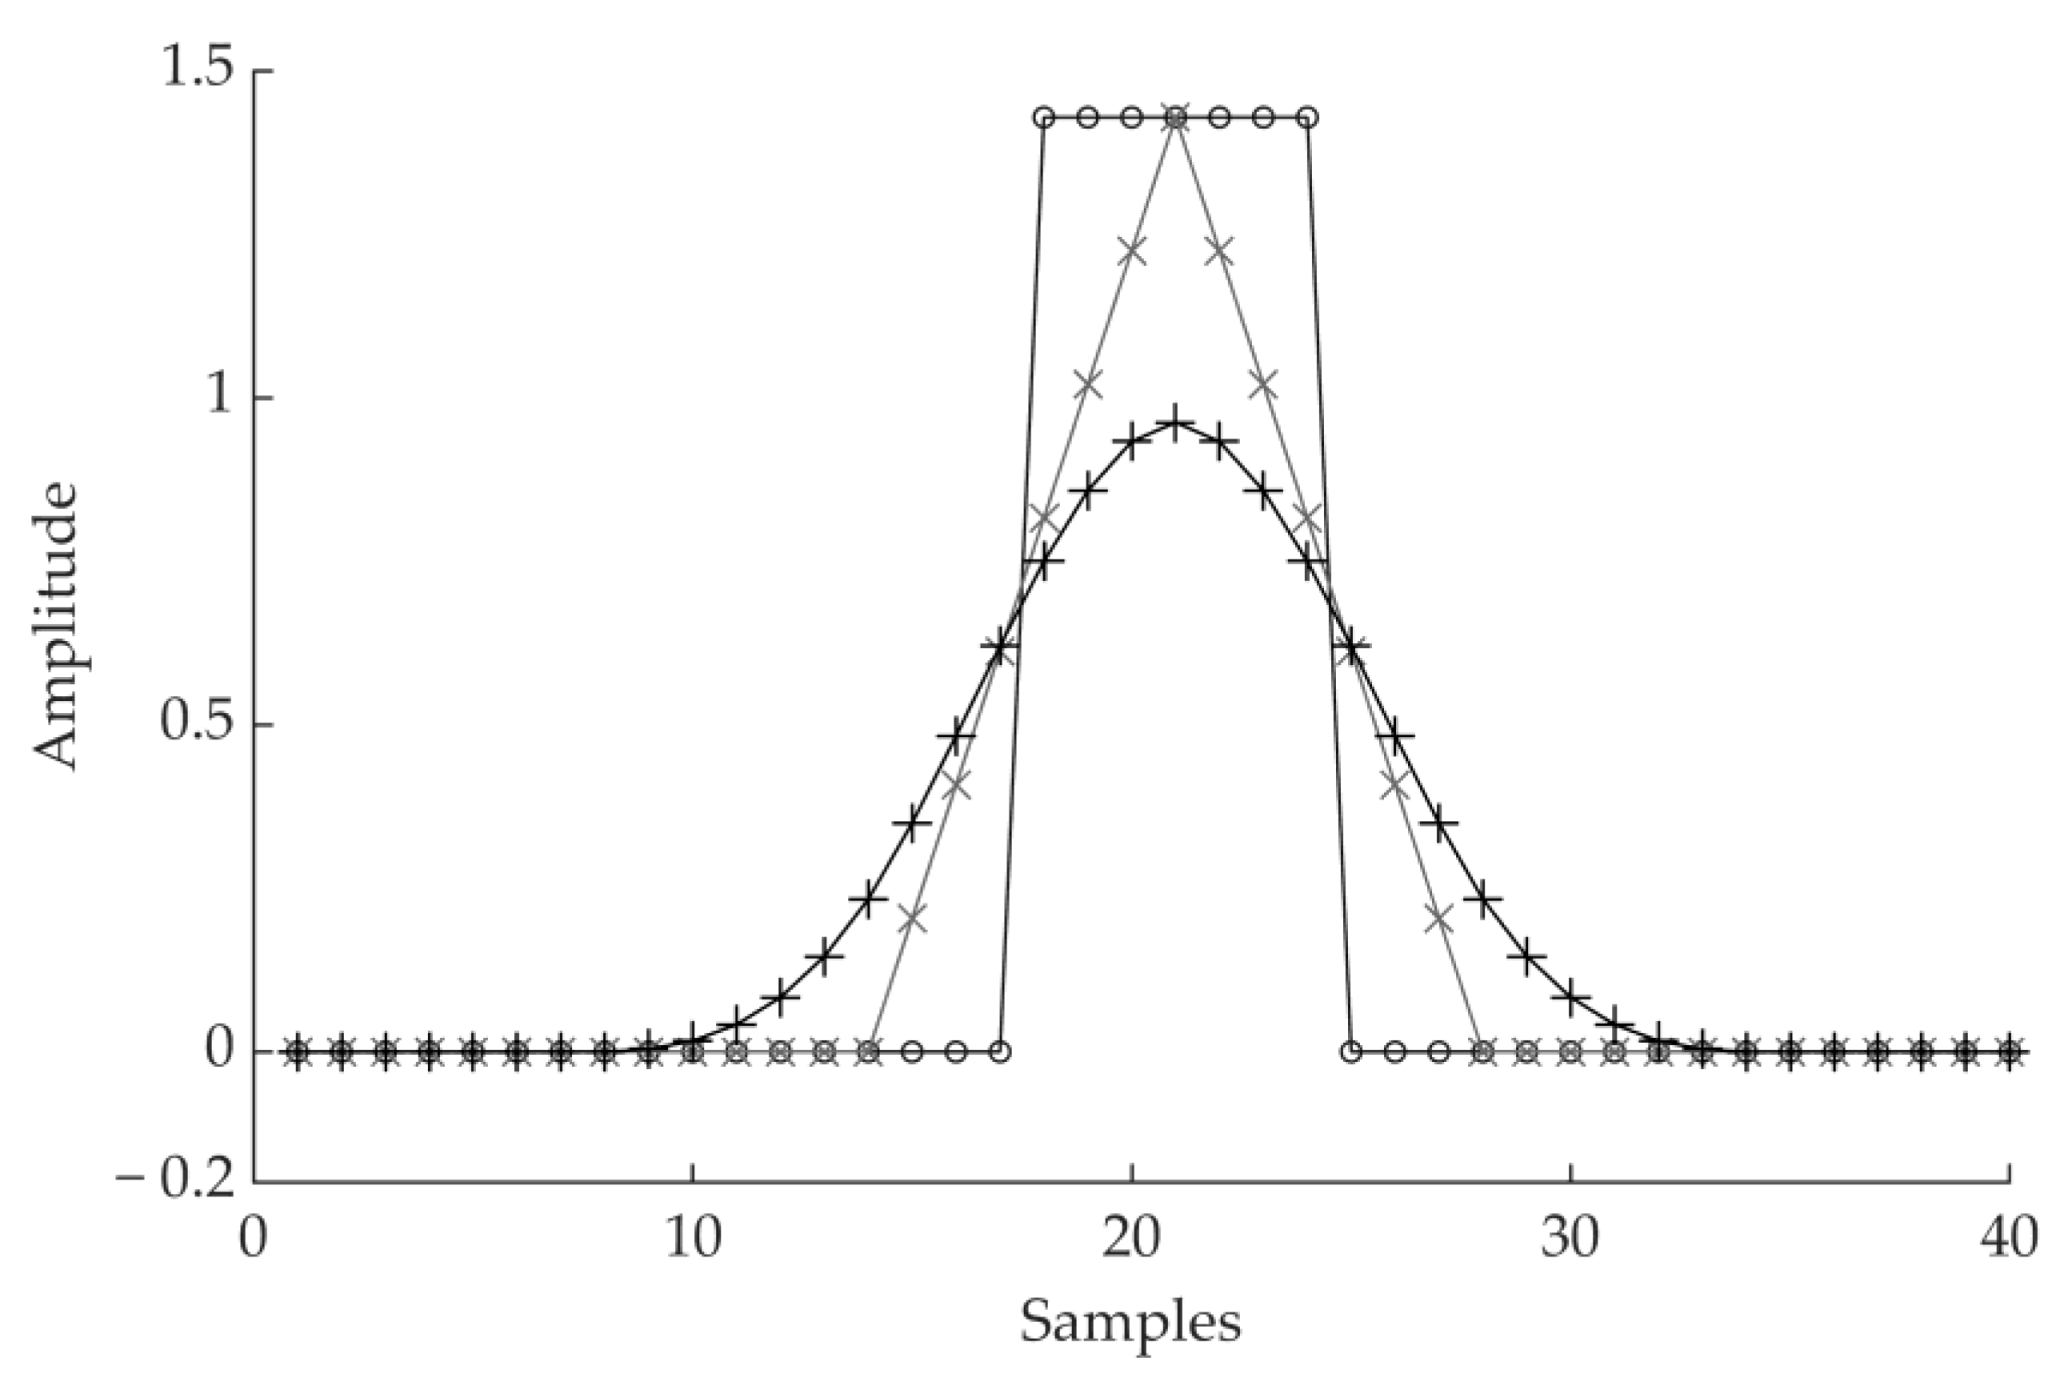
22], however in the discreet time domain there are several ways to compute the derivative [2]. Single-step derivative transformations, as in s[n] − s[n − 1], are inherently susceptible to noise. Wider derivative transforms that take in account multiple samples reduce this tendency due to their band-pass behavior.
Complex approaches may afford the highest of performances, at the cost of increased computational load. When heartbeat detection is performed in battery-driven devices, the computational cost of the QRS detection algorithm should also be contained. One of the possible approaches for a lightweight QRS detection is a combination of moving average filters. Moving average filters require few operations and have been shown to be viable in ECG processing. Elgendi [23] proposed an algorithm where two moving averages were used to determine blocks of interests. Knowledge-based thresholds on the duration of the blocks assessed the presence of the QRS complex. Considering 109,985 beats in the MIT-BIH Arrhythmia database [24], Elgendi reported an F1 score for his work of 99.82%. Kim et al. [25] proposed a method based on the energy of the signal and its rate of change. This was done by applying moving average filters to the squared and differentiated ECG filtered signals. QRS complexes were detected though a set of amplitude and duration thresholds in both energy level and energy rate of change. On the MIT-BIH Arrhythmia database the reported F1 score for this method was 99.91%, considering 109,494 beats. Szi-Wen Chen et al. [4] used the moving average as a high-pass filter, combined it with wavelet denoising and then squared the high-pass filtered signal. QRS complexes were found with an adaptive threshold on the squared signal. This algorithm achieved an F1 score of 99.52% on the MIT-BIH Arrhythmia database, considering 102,654 beats. In Chiarugi et al. [26], the ECG signal was filtered with a moving average, band-pass filter and then differentiated. A noise index automatically excluded noisy channels which would reduce detection accuracy. This algorithm achieved an F1 score of 99.78% on the MIT-BIH Arrhythmia database, considering 109,494 beats. All the aforementioned methods employ moving average filters in some form.
The performance scores of QRS detectors are customarily computed on standard databases, like the MIT-BIH Arrhythmia database. In theory, such practice should allow a straightforward comparison between different methods. Yet, different authors often adopt different inclusion criteria for the records in the databases. As an example, records 108 and 207 are sometimes excluded from the evaluation of the confusion matrix due to the abnormal shapes taken by the ECG signal [2]. Moreover, different authors may use different acceptance window values for QRS complex positives. For these reasons, comparing published results could be incorrect, as they may have been calculated on different records and/or with a different acceptance window. On the other hand, some authors compare the algorithm they propose with pertinent literature by rewriting the corresponding routines. However, the description is often not complete enough and the re-written routines do not replicate the published performances. In this paper, we directly compare performances of different QRS detection methods computed using the same rules. To this end we considered the best performing QRS detection softwares we found available to our knowledge. We did not edit the code of the detection routines of other authors in any way.
Authors of QRS detection literature often report performances on a single database. This is the case for many of the works mentioned above. While the printed results may be excellent, the generalizability of the proposed methods to real world data remains indeterminate. For this reason, we included several databases in the evaluation of our work. When optimizing an algorithm on several data sources, overperforming on a single data source may considerably reduce the accuracy achieved on the other databases.
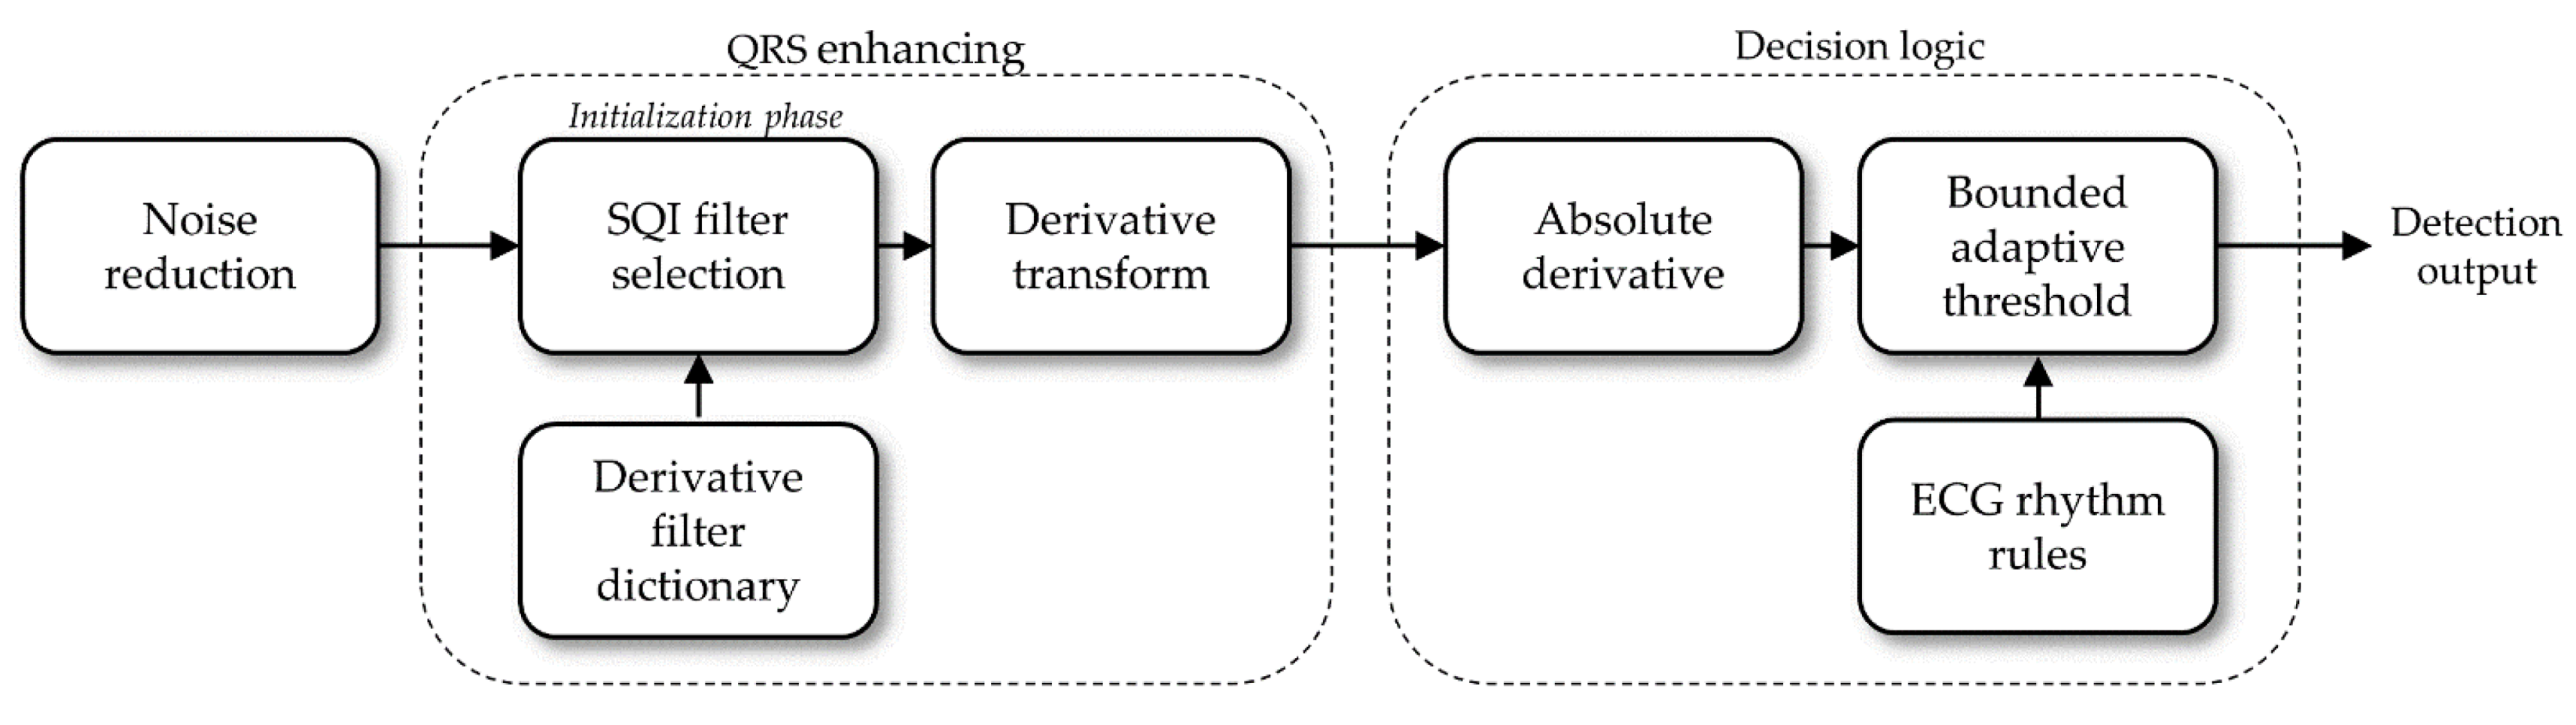
In this paper, we propose a fast, accurate approach to QRS detection based on combining simple unweighted moving averages. In particular, the basic elements of our ECG signal processing are cascades of moving averages (MACs). Our algorithm enhances the QRS complex by selecting a MAC from a pool of wide, derivative MACs that are inherently resistant to noise. We compare the performance of the QRS detector with those of three public algorithms, both in terms of accuracy and execution time, on the same calculator and the same initial conditions. The algorithm we propose aims to be an efficient, accurate, and generalizable method for QRS detection that improves on the concept of derivative transforms.
Our software was developed with MATLAB (The Mathworks Inc., Natick, MA, USA). A preliminary version of this work has been reported in [27]. The algorithm has since then been further optimized, and one of the algorithms we considered for comparison has been changed to Kim’s detection approach, as it performed better. In this paper, we also elaborate with greater detail on the decision logic. Additionally, we report results on additional databases: the INCART, T Wave Alternans, and MIT-BIH Noise Stress Test databases.

2. Materials and Methods

2.1. Data

The algorithms we describe were tested on five public datasets available on the Physionet repository [28]: the MIT-BIH Arrhythmia (here abbreviated as MIT-BIH) database, the European ST-T (Eu ST-T) database, INCART database, the MIT-BIH Noise Stress Test (NST) database, the T Wave Alternans (TWA) database and the QT database. Table 1 is a summary of their features. These databases are often the common ground of performance validation for studies on detection of ECG characteristic waves. Considering multiple databases entails the advantage of testing the algorithms on a wide range of possible scenarios influenced by noise and physiological variability.
The MIT-BIH Arrhythmia database [24] is a collection of 48 records sampled at 360 Hz. Each record is 30 min long and comprises two channels. The first channel is a modified lead II. The second channel is often akin to lead V 1 and occasionally to V 2 , V 4 , or V 5 . We report the performances for QRS detection without excluding any record.
The European ST-T Database [29] is a collection of ambulatory ECGs developed for the study of ST tract and T wave changes in myocardial ischemia and other abnormalities. The collection consists of 90, 2-h long excerpts, sampled at 250 Hz. The first channel is usually a modified limb lead (I or III), where the QRS complex is evident. The second channel is usually a precordial lead, where the ST episodes are prominent ( V 1 5 ).
The St. Petersburg INCART 12-lead Arrhythmia Database [28] includes 75 excerpts sampled at 257 Hz, 30 min long each. The excerpts were extracted from 32 Holter recordings of different patients testing for coronary artery disease. The included annotations were first produced by an algorithm and then corrected manually. Each recording in the database is a full 12-lead recording.
The MIT-BIH Noise Stress test database [30] combines two clean recordings of the MIT-BIH Arrhythmia database with excerpts of noise. Noise sources include baseline wandering, miographic noise and electrode motion artifacts. The resulting collection consists of 12 half-hour ECG records, sampled at 360 Hz, with two channels each.
The T Wave Alternans database [31] is composed by 100 records, each with a number of channels that can vary from 2 to 12, sampled at 500 Hz. The recordings have been obtained from both healthy patients and patients with risk factors for sudden cardiac death. Additionally, some records are synthesized to display calibrated amounts of T wave alternans. Each record is about 2 min long.
The QT Database [32] is an anthological database composed by 105 ECG excerpts, extracted from seven other public databases. However, only 82 records are accompanied by the ‘.atr’ files containing the beat annotations. Each record is 15 min long, is resampled at 250 Hz and includes two channels. A total of 15 records of the QT Database are derived from the MIT-BIH Arrhythmia Database, while 33 of them are extracted from the Eu ST-T database. In our study, the annotations for the sel232 record of the QT Database were replaced by the corresponding ones from record 232 of the MIT-BIH Arrhythmia Database.

2.2. Methods

ECG signal analysis has often been approached with methods and mindsets pertaining to the field of telecommunications—i.e., frequency characterized signals and linear systems. As a consequence, signal analysis experts who approached ECG signal analysis were trained in that area and therefore applied methods and techniques of the frequency domain to the ECG signal.
It should be noted that the information of physiological and pathophysiological interest in the ECG signal is concentrated in localized and separable events in time. The P wave is associated with atrial depolarization, the QRS complex with ventricular depolarization and the T wave with ventricular repolarization. On the contrary, in the frequency domain, there is significant overlap of this information and it is not separable. For this reason substantial frequency-based ECG signal analysis is unjustified. There are, however, a few instances of specific frequency components in the ECG like powerline disturbance at 50 or 60 Hz and atrial or ventricular fibrillation.
Therefore, we designed the signal preprocessing and QRS detection by taking into account the time domain properties of the QRS complex with respect to other events. In addition, to achieve a small processing time, we used combinations of moving average cascades (MACs). A MAC is composed by applying two or more unweighted moving averages in series. When two moving averages of the same length are combined in cascade, the resulting system will exhibit a triangular impulsive response. If two moving averages of different length are combined, the resulting impulsive response will take a trapezoidal shape. As the number of moving averages in cascade increases, the shape of the resulting impulsive response will get smoother, wider, and increasingly similar to the Gaussian bell function. This effect is shown in Figure 1. These cascades of moving averages are equivalent to linear FIR filters. However, we remark that they are designed in time, by taking advantage of the knowledge of the pattern of the target ECG event. Moreover, their application does not require any convolution, which is a time-consuming operation.
We built two types of linear systems by combining MACs. The first linear system consists in the difference of two centered MACs of different length (Section 2.2.1), which was used to enhance events characterized by mono-directional changes whose time duration is comprised between the lengths of the two MACs. The second linear system (Section 2.2.2) consists in the difference of two time-shifted MACs and was designed to enhance events whose ascending or descending fronts’ duration is greater than the shift of the two MACs. This second system enhances QRS complexes and has a derivative behavior.
The proposed QRS detection algorithm is articulated in three steps: noise reduction—i.e., non QRS signal changes; enhancing QRS events with a derivative transform; detecting heartbeats. The absolute value of the derivative transform will also be referred to as the feature signal. Figure 2 shows a diagram of the algorithm. This algorithm does not resample the signal. The filters automatically scale at the sampling frequency of the ECG record that is being processed.

2.2.1. Noise Reduction

The target of this step is to reduce the effects of two non-QRS components on the signal. The first one is undesired noise, which is a ubiquitous aspect of biosignals. In ECG, noise can be observed as baseline wander, power line interference, spike noise, and myographic noise. The other undesired aspect in heartbeat detection are prominent T waves, as they could be mistaken for a QRS complex. Thus, the first step of the algorithm reduces the amplitude of these two sources of error.
In the algorithm we present reduction of noise and undesired waves is performed by applying to the signal two different moving average cascades (MACs) of different length. The synchronized outputs of the two MACs are then subtracted. The first MAC consists of the cascade of a 20 ms moving average with a 8 ms one. Thus, we refer to it as MAC(0.02, 0.008). At a sampling frequency of 250 Hz, the impulsive response of MAC(0.02, 0.008) is 24 ms long. This length reduces narrow peaks of noise, while only slightly impacting QRS peaks. The second MAC is MAC(0.12, 0.024). For a sampling frequency of 250 Hz, this filter has a 140 ms long impulsive response interval. The output of MAC(0.12, 0.024) tracks baseline wandering and, partially, T waves. Thus, their amplitude at the output of the synchronized difference of the two MACs is reduced. Figure 3 shows the resulting impulsive response of the noise reduction filter.
The design of this QRS detector is based on examination of the shape, time of occurrence and duration of the waves that represent ventricular depolarization. These waves are distinguished from artifacts and the P, T characteristic waves that concern other events. The QRS complex is typically 70–110 ms long, with two to four rising and falling fronts. Considering the largest amplitude wave (either Q R or S), its duration can vary from 30–70 ms. Therefore, a MAC(0.02, 0.008) system that performs a moving average over approximately 24 ms reduces the fast variations caused by noise without consistently reducing the QRS peaks. The MAC(0.12, 0.024) system is designed to follow the slow baseline variations but not the fast QRS variations. In fact, this system averages over 120 ms of signal and does not track the variations of the QRS waves.

2.2.2. Derivative Filter Selection

The next step of the algorithm further enhances the QRS complex with respect to the other waves. The QRS complex features a high derivative which involves an interval of about 100 ms. Thus, a derivative transform enhances the prominent characteristic of the QRS complex. However, the degree of enhancement will depend on how the derivative matches the QRS shape. Hence, a specific derivative transform may better enhance the QRS complex in some ECG recordings than others. For this reason, the authors designed a dictionary of 18 different derivative filters. Each filter results from the subtraction between two MACs, involving about 8–30 ms of the signal each and shifted by 8–30 ms. These derivative filters will be referred to as dMACs. A few examples of such derivative filters (dMACs) are shown in Figure 4.
These derivative filters are designed to match the rising or falling fronts of the QRS complex. Thus, the output of these filter is highest when the length of the longest (rising or falling) front of the QRS complex matches the main front of the derivative filter’s impulsive response. This characteristic makes these filters inherently specific for the target signal, and less susceptible to noise. Since the QRS complexes do not have a perfectly fixed duration and shape in each ECG recording, different shapes of derivative filters may perform better than others in different recordings.
The dMAC that better enhances the QRS complexes of a specific record is automatically chosen for each channel in the initialization phase of the algorithm. This choice is performed by maximization of the signal quality index (SQI) defined as
SQI = k s + mD s k n + mD n
where mD s is the trimmed mean of the derivative signal maxima computed in successive windows of 1.8 s, aimed at representing the QRS-specific high derivative values. In 1.8 s at least one heartbeat is expected. The trimmed mean discards undesired outliers. The term mD n is the trimmed mean of the derivative signal maxima computed in successive windows of 0.1 s that accounts for the background noise. Most of the 0.1 s long windows of signal will not include a heartbeat. The trimmed mean discards the few high values that relate to the windows containing a heartbeat. When the input of the SQI is an ECG or a derivative of an ECG, the term mD s estimating the QRS derivative is high, resulting in a high signal quality index. When the input is noise, mD s and mD n have a similar value and the SQI is approximately unitary. The SQI is calculated in a selected 15 s interval for each of the 18 derivative filters we designed. The derivative filter that featured the highest SQI value is chosen as the derivative filter for the remainder of the record.
The SQI previously described was defined from basic fuzzy considerations on ECG. Thus, the values of all the parameters involved in SQI definition are not critical. The window length for mD s can range between 1 and 2 s. The window length for mD n can range between 0.05 and 0.3 s. The constant k s can be omitted, while k n has a very small value and should be included to avoid occasional divisions by zero.
Figure 5 shows an example of the derivative filters selected with SQI maximization for different records of the MIT-BIH Arrhythmia database. Each row refers to the first channel of a different record: top row refers to record 100, middle row refers to record 200 and the bottom row refers to record 203. Narrow derivative filters are selected to enhance narrow QRS complexes (top row), while wide derivative filters are selected for records that display wider QRS complexes (middle and bottom row).
The 15 s interval where the derivative filter is chosen is, ideally, the beginning of the record. However, it is common to find flatlines or transitory interference at the very beginning of an ECG record. For this reason, the selected 15 s interval is identified in the initialization phase of the algorithm using a signal quality index similar to the previous one that includes an additional artifact-specific term. The index is computed for successive intervals of 15 s using a non-specific raw dMAC. In this process, the algorithm looks for an interval of acceptable ECG quality. The duration of the initialization phase, 15 s, is an arbitrary number. It should be high enough to capture at least five mD s windows, but low enough to avoid the computational burden of an unnecessarily long SQI maximization phase.

2.2.3. Decision Logic

The decision logic of the QRS detection algorithm compares a dynamic threshold T with the absolute value of the derivative signal (the feature signal). Figure 6 shows the result of the processing stages described above for a sample ECG excerpt, from input signal to absolute derivative.
When the absolute derivative crosses the detection T, a detection is registered. T is first defined in the initialization phase, and then updated in a bounded fashion depending on its initial value, after each successful QRS detection. Let   D ¯ 0   be the trimmed mean of the derivative maxima during the initialization phase. Let M be the maximum value of the derivative signal corresponding to the last successful detection. Let us consider   D ¯ n   as a variable that reflects the average of the local derivative maxima at detection n. Sudden rising spikes in M could interfere with the detection process, and therefore changes to M are limited
M b = max ( min ( M ,   1.5     D ¯ 0   ) , 0.5     D ¯ 0   )
The threshold T is updated in the following fashion:
  D ¯ n + 1   = max ( 0.2   D ¯ 0   , min (   0.97   D ¯ 0   + ( 1 0.97 ) M b ,   2.5   D ¯ 0   )   )
T n + 1 = c   D ¯ n + 1
where c is a control parameter operating on the detection threshold. The term   D ¯ n   estimates the local average of the QRS complex derivative maxima at detection n. The value 0.97 that multiplies   D ¯ n   determines the memory factor of recursive updating. Additionally, the 0.2   D ¯ 0 limit prevents D ¯ n from diminishing to zero while the 2.5   D ¯ 0 limit prevents excessive overshoots. After each successful detection, the value of T is set to 2.4 times its new value to prevent detecting more than once the same heartbeat. This value decreases as the time elapsed from the last QRS detection increases. Occasionally, the threshold T n + 1 could get excessively high and prevent detection of the following QRS complexes. For example, when a premature ventricular contraction is followed by normal sinus beats of lower amplitude. To avoid this occurrence, the threshold value T continues to decrease as the time with no detections increases. These temporal thresholds are dependent on the mean interval between two consecutive R peaks, the mean RR. As the mean RR decreases, the threshold evolves faster. Figure 7 shows the decreasing dynamic of the detection threshold for a sample mean RR interval of 1000 ms. The gray area denotes a refractory period, where no detection is registered.
The time signature or fiducial point of the detected QRS complexes is placed on the maximum signed derivative of the QRS complex. During the initialization phase, the algorithm chooses the positive or negative derivative depending on their maximum amplitude. This choice is kept throughout the record.

3. Results

The detection performances are reported as F1 scores, which is a global metric of performance. F1 is the harmonic mean of Sensitivity (Se) and Positive Predictive Value (+P)
Se = TP TP + FN
+ P = TP TP + FP
F 1 = 2   TP 2   TP + FN + FP
where TP are the true positives, FP are the false positives and FN are the false negatives of QRS detection.
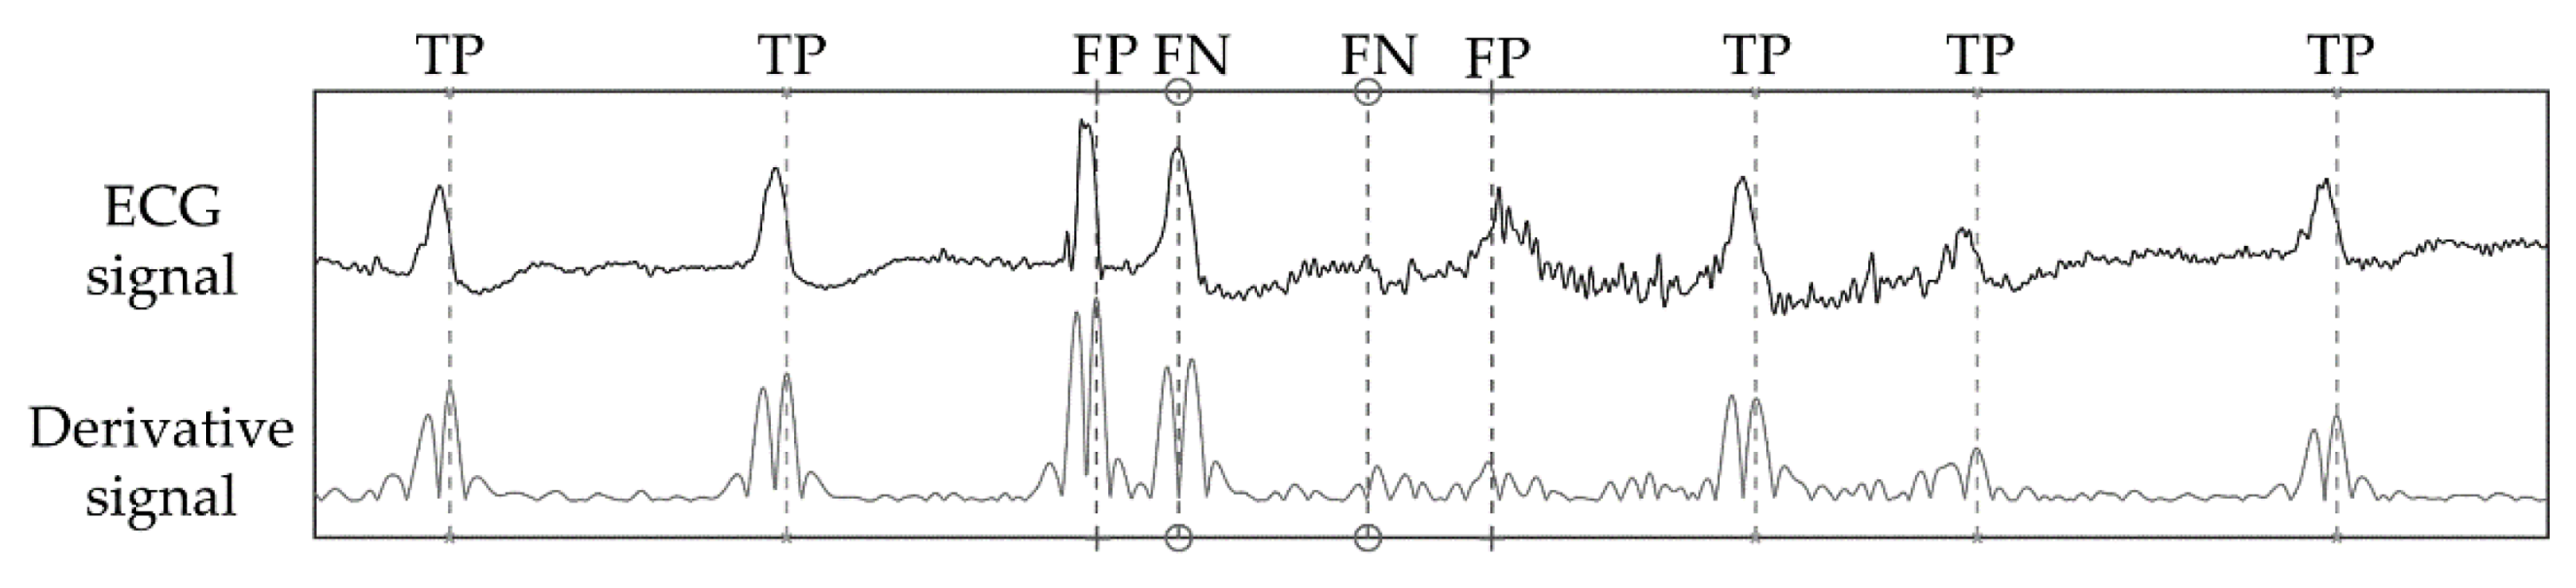
Figure 8 shows a strip of ECG signal, its respective absolute derivative, and detection markers for a strip of signal where true positives, false positives, and false negatives are registered. This is an example of a critical instance of signal. The first false positive of Figure 8 is caused by an artifact that closely resembles a QRS complex. This misdetection causes the algorithm to enter its refractory period, thus the next true heartbeat is missed resulting in a false negative. The second false negative is a heartbeat with very low amplitude which is challenging to spot even by eye. As this beat is missed, the adaptive threshold decreases until the second false positive is detected, despite its relatively low amplitude. While these instances of error are not common, they represent the challenging aspects of QRS detection.
Heartbeats can be divided in two groups: (1) normal beats, which are originated from the dominant pacemaker, the sinus node and (2) ectopic beats, which are generated by secondary (ectopic) pacemakers. Ectopic beats are often premature and can be atrial, supraventricular or ventricular in origin. Sometimes, sinus beats and ventricular beats collide in a fusion beat. Ectopic beats are expression of cardiac automaticity disorders and can be the hallmark of life-threatening conditions like ventricular tachycardia. The shape of these heartbeats on the ECG can differ substantially from normal beats, and are thus more challenging to detect. This is especially true for beats of ventricular origin. Moreover, conduction disorders like bundle branch blocks can also significantly alter the shape of the normal, healthy ECG pattern. Since bundle branch blocks and ventricular beats are clinically relevant for diagnosis and therapy, we also report sensitivity to these abnormal beats (Se-A)
Se - A = TP A TP A + FN A
where TP A and FN A are true positive and false negatives of confusion matrix computed only by considering the heartbeats annotated as: bundle branch block, premature ventricular contractions, R-on-T premature ventricular contractions, fusion beats and ventricular escape beats.
Comparing algorithm results to annotations requires the definition of an acceptance window. This is a two-sided interval of appropriate size, centered around annotated beats. When a detected beat falls inside the acceptance window of an annotated beat it is considered a true positive. The following QRS detection results are obtained with a window of 300 ms (+/− 150 ms). This is the same window size used in Physionet’s bxb annotation comparator.
To evaluate the performances of the QRS detector we introduced we implemented and operated three publicly available detectors. They are Behar’s jqrs [33], Kim’s [25] and Sedghamiz’s [34] detectors. Behar’s QRS detector features a Mexican hat pre-processing filter, maximization of the signal’s energy in local windows, a fixed threshold and a backward search phase for missed heartbeats. In Kim’s approach the QRS detection is performed on the signal’s energy as well, by checking both the quantity and the dynamic of the QRS complex’ energy with adaptive thresholds. A valid heartbeat detection requires both criteria to be satisfied. Sedghamiz’s algorithm is structured on two adaptive thresholds that distinguish between signal and noise peaks, a decision logic that corrects multiple detections due to noise or T waves and a backward search procedure.
These algorithms were made available by their authors. We did not edit their code, but we did optimize their control parameter(s). Usually, each QRS detector is controlled by one or more control parameters that operate on the decision thresholds. The results we report were calculated using the control parameters that yielded the best performances for each algorithm.
Each of these programs was run in MATLAB, on the same calculator (2013 notebook with I7-dual [email protected] GHz, 6 Gb RAM), with the same background conditions, at the same time of day, each one in succession. Table 2 reports the gross and average F1 score achieved by the QRS detectors on all the considered. No record was excluded. Table 3 shows the gross and average Se-A results. The T Wave Alternans database is not feature in this table, as it lacks annotations for non-sinus beats. The highest F1 and Se-A scores for each channel of each database and for the whole dataset are highlighted in bold.
Regarding the computational cost of the algorithms, in Table 4 we show that our approach was faster than the other QRS detectors we considered. The comparison was made with the same background conditions. Each detector was run on all the databases we introduced, in succession. We report the average execution time. Our moving average-based approach took on average three times less to process an hour of ECG recording than Sedghamiz’s algorithm: 0.1137 s against 0.3388 s, effectively resulting in a reduction of 0.1137/0.3388 = 33.56% of required CPU time. The processing time of Kim’s algorithm was unexpectedly high.

4. Discussion

In this paper, we presented a QRS complex detection algorithm based on the knowledge of the electrocardiographic phenomena. The algorithm was evaluated on well-known databases and the performances we report are comparable to the best ones published in the literature. We considered several databases, in order to avoid overfitting on a single data source. It should be noted that some published approaches reach higher performances on specific databases, but caution should be exercised in direct comparison between published results. Different papers may adopt different subsets of records from the same databases and different acceptance windows. For this reason, the performances of the algorithm we proposed was compared to three available QRS detectors. As a performance metric, we computed the F1 scores as well as execution speed. We also reported sensitivity on ventricular beats and beats where bundle branch blocks were present, which we defined as Se-A, as they are more challenging to detect. As stated above, we chose to compare available QRS detectors instead of implementing other methods from literature, which was beyond the scope of this work. Additionally, rewriting a method is a developing effort itself. The resulting algorithm is not likely to reach the same accuracy and/or computational efficiency reported by the authors, as algorithms employ a set of specific parameters and rules that the authors have fine-tuned but do not end up in the final paper. We considered available QRS detectors for a direct comparison, so that results are reported for the same set of records, with the same acceptance rule for true positives. We chose the QRS detectors of Behar [33], Sedghamiz [34], and Kim [25] as they were performing best among those we found available to our knowledge.
We evaluated the QRS detection algorithm on the MIT-BIH Arrhythmia, EU ST-T, INCART, MIT-BIH Noise Stress Test, T Wave Alternans, and QT databases. They are popular databases in the topic of automated analysis, and especially for heartbeat detection. Our algorithm outperformed the others, reaching 99.18% gross F1 and 94.81% gross Se-A. Despite this, Kim’s detector obtained a higher F1 score on the first channel of the MIT-BIH database. Detection accuracy for the second leads of the MITH.BIH Arrhythmia, Eu ST-T, and NST databases are lower for each algorithm. This happens as channel 2 is often chosen to highlight specific ECG features, like ST tract elevation, while the QRS complex is prominent in channel 1.
The Se-A score was lower than the overall sensitivity, as anticipated. This is due to the different shape of this subset of beats, as the slopes of the QRS waves are low and so are the corresponding derivatives. For our algorithm the worst-case scenario of Se-V is 86.16%, for the first channel of the INCART database. This particular result is, however, substantially different from the other Se-V scores we report on the other databases (Table 4), or even the second channel of the same database. This may be caused by the annotation criteria on abnormal beats for channel 1 of the INCART database. For channel 2 of the INCART database and the other databases, sensitivity on abnormal beats lies between 94% and 99%. This means that up to 1 in every 20 abnormal beats is not detected correctly. Future work on this algorithm could address these instances of detection failure. Since identification of abnormal beats is one of the main goals in Holter exams and other lengthier ECG recordings, we feel that sensitivity on abnormal beats is a key characteristic of any QRS detector.
To highlight the light computational cost of the proposed QRS detection algorithm, we measured its execution time. On average, 0.1137 s were required to process an hour of ECG recording on our test machine, which is 33.56% of the time required by the quickest of the other programs. This result confirms the low processing power required by the algorithm we propose. While the detection accuracy of any method remains the fundamental performance metric, low execution time is nonetheless relevant for low-power devices such as wearable and portable devices.
In our algorithm, the derivative filter that maximizes the signal quality index is chosen on a selected 15 s signal interval at the beginning of the record. On longer records, e.g., 24-h-long Holter ECG, the derivative that maximizes the quality index could change throughout the record. Posture changes of the patient can alter the relative position of the heart and the electrodes, thus changing the amplitude and shape of the signal in each lead. To tackle this effect, the derivative filter selection could be repeated at regular intervals. As an alternative, the signal quality index of each derivative filter could be updated iteratively. This would remove the need to maximize the signal quality index multiple times. A derivative filter updating rule is a possible future development of this algorithm.
In the existing literature, the performance reported in some papers achieved higher scores than our algorithm. For example, Cai and Hu [16] reported higher F1 scores on the first channel of the MIT-BIH Arrhythmia (99.95% vs. 99.84%), the MIT-BIH Noise Stress Test (99.53% vs. 91.71%) and QT (99.98% vs. 99.92%) databases using convolutional neural networks. Machine learning, and specifically deep learning, have been applied with great effect to many biomedical topics, and rightly so. Yet, these approaches come at a cost in both in terms of processing time and memory requirements. Moreover, machine learning algorithms crucially depend on the training data and must satisfy specific regulatory demands to be implemented in commercial devices. The scope of our algorithm is instead to propose an accurate algorithm with an emphasis on execution efficiency and a clear, explainable decision logic.
The literature on QRS detection is rich. Many approaches have been proposed over time, and results are often reported using heterogeneous criteria. Moreover, database annotations are another source of confusion in results comparison, as human observers occasionally disagree on annotation protocols. For this reason, the question of finding the ‘best’ QRS detection approach has no simple, unambiguous answer and comparison of published results may not be equitable.
Elgendi [8] developed a QRS detection approach that aimed to be efficient and accurate, with moving averages, considering multiple databases, and is thus closer to the scope of our algorithm. Elgendi reported the performances for only the first channel of several databases, including the databases we considered. The comparison with our work is favorable for the MIT-BIH Arrhythmia (99.82% vs. 99.84%) and QT (99.81% vs. 99.92%) databases. Conversely, the performances of the algorithm we propose are lower on the INCART (98.05% vs. 96.51%), MIT-BIT Noise Stress Test (92.75% vs. 91.71%), and T Wave Alternans (99.00% vs. 98.20%) databases. A future comparison of execution time between these two algorithms would be of interest.
Kim [25] reported performances as high as 99.91% F1 on the MIT-BIH database, which have been confirmed in our implementation of their code (99.88% F1) and are higher than our score (99.84% F1). Despite this, on all the other databases we included their algorithm reached lower performances. This may possibly be an effect of overfitting an algorithm on a small pool of data. For this reason, comparing implemented algorithms on multiple databases can offer greater insight on the characteristics of a QRS detection algorithm. This task, however, is easier when code is shared by its authors. When an algorithm must be re-written from scratch following the pertinent literature, its performances may vary significantly from the published ones.
The algorithm we present inherits the legacy left by the work of Carlo Marchesi and Alessandro Taddei [35]. At the time, fast QRS detection was a necessity as calculators had limited processing power, which had to be optimized. Today, fast QRS detection remains a relevant topic for all applications involving battery-driven or portable devices.

5. Conclusions

In this paper, we presented a knowledge-based QRS detection algorithm that emphasizes both computational efficiency and accuracy. This algorithm features a preprocessing stage in the time domain, a decision logic based on medical knowledge, and an adaptive derivative behavior. While more accurate approaches exist in literature, this algorithm could be a useful tool in performing on-line ECG heartbeat detection in limited CPU environments.

Author Contributions

Conceptualization, M.V.; Methodology, M.V. and L.B. (Lucia Billeci); Software, M.V. and L.B. (Lorenzo Bachi); Validation, L.B. (Lorenzo Bachi), L.B. (Lucia Billeci) and M.V.; Formal Analysis, L.B. (Lorenzo Bachi) and M.V.; Investigation, L.B. (Lorenzo Bachi) and M.V.; Resources, M.V.; Data Curation, M.V.; Writing—original draft preparation, L.B. (Lorenzo Bachi); Writing—review and editing, L.B. (Lorenzo Bachi), L.B. (Lucia Billeci) and M.V.; Visualization, L.B. (Lorenzo Bachi) and M.V.; Supervision, L.B. (Lucia Billeci) and M.V.; Project Administration, L.B. (Lucia Billeci) and M.V.; Funding Acquisition, L.B. (Lucia Billeci). All authors have read and agreed to the published version of the manuscript.

Funding

This work was funded by CARDIOLINE S.P.A. and by the Italian MIUR through the PRIN project “Preclinical Tool for Advanced Translational Research with Ultrashort and Ultraintense X-ray Pulse”, grant number 20154F48P9.

Institutional Review Board Statement

Not applicable.

Informed Consent Statement

Not applicable.

Data Availability Statement

Each database we included in this work is freely accessible on the Physionet online repository, https://www.physionet.org/about/database/ (accessed on 28 July 2021). The MATLAB code of the QRS detector algorithm proposed in this paper can be received by contacting any of the authors.

Conflicts of Interest

The authors declare no conflict of interest.

References

  1. Pan, J.; Tompkins, W.J. A Real-Time QRS Detection Algorithm. IEEE Trans. Biomed. Eng. 1985, BME-32, 230–236. [Google Scholar] [CrossRef]
  2. Kohler, B.-U.; Hennig, C.; Orglmeister, R. The Principles of Software QRS Detection. IEEE Eng. Med. Biol. Mag. 2002, 21, 42–57. [Google Scholar] [CrossRef]
  3. Phukpattaranont, P. QRS Detection Algorithm Based on the Quadratic Filter. Expert Syst. Appl. 2015, 42, 4867–4877. [Google Scholar] [CrossRef]
  4. Chen, S.-W.; Chen, H.-C.; Chan, H.-L. A Real-Time QRS Detection Method Based on Moving-Averaging Incorporating with Wavelet Denoising. Comput. Methods Programs Biomed. 2006, 82, 187–195. [Google Scholar] [CrossRef]
  5. Zidelmal, Z.; Amirou, A.; Adnane, M.; Belouchrani, A. QRS Detection Based on Wavelet Coefficients. Comput. Methods Programs Biomed. 2012, 107, 490–496. [Google Scholar] [CrossRef]
  6. Narayana, K.V.L.; Rao, A.B. Wavelet Based QRS Detection in ECG Using MATLAB. Innov. Syst. Des. Eng. 2011, 2, 60–69. [Google Scholar]
  7. Martinez, J.P.; Almeida, R.; Olmos, S.; Rocha, A.P.; Laguna, P. A Wavelet-Based ECG Delineator: Evaluation on Standard Databases. IEEE Trans. Biomed. Eng. 2004, 51, 570–581. [Google Scholar] [CrossRef]
  8. Pal, S.; Mitra, M. Empirical Mode Decomposition Based ECG Enhancement and QRS Detection. Comput. Biol. Med. 2012, 42, 83–92. [Google Scholar] [CrossRef]
  9. Hossain, M.B.; Bashar, S.K.; Walkey, A.J.; McManus, D.D.; Chon, K.H. An Accurate QRS Complex and P Wave Detection in ECG Signals Using Complete Ensemble Empirical Mode Decomposition with Adaptive Noise Approach. IEEE Access 2019, 7, 128869–128880. [Google Scholar] [CrossRef]
  10. Bashar, S.K.; Noh, Y.; Walkey, A.J.; McManus, D.D.; Chon, K.H. VERB: VFCDM-Based Electrocardiogram Reconstruction and Beat Detection Algorithm. IEEE Access 2019, 7, 13856–13866. [Google Scholar] [CrossRef]
  11. Zidelmal, Z.; Amirou, A.; Ould-Abdeslam, D.; Moukadem, A.; Dieterlen, A. QRS Detection Using S-Transform and Shannon Energy. Comput. Methods Programs Biomed. 2014, 116, 1–9. [Google Scholar] [CrossRef] [PubMed] [Green Version]
  12. Manikandan, M.S.; Soman, K.P. A Novel Method for Detecting R-Peaks in Electrocardiogram (ECG) Signal. Biomed. Signal Process. Control 2012, 7, 118–128. [Google Scholar] [CrossRef]
  13. Gutiérrez-Rivas, R.; García, J.J.; Marnane, W.P.; Hernández, Á. Novel Real-Time Low-Complexity QRS Complex Detector Based on Adaptive Thresholding. IEEE Sens. J. 2015, 15, 6036–6043. [Google Scholar] [CrossRef]
  14. Jia, M.; Li, F.; Wu, J.; Chen, Z.; Pu, Y. Robust QRS Detection Using High-Resolution Wavelet Packet Decomposition and Time-Attention Convolutional Neural Network. IEEE Access 2020, 8, 16979–16988. [Google Scholar] [CrossRef]
  15. Šarlija, M.; Jurišić, F.; Popović, S. A Convolutional Neural Network Based Approach to QRS Detection. In Proceedings of the 10th International Symposium on Image and Signal Processing and Analysis, Ljubljana, Slovenia, 18–20 September 2017; pp. 121–125. [Google Scholar]
  16. Cai, W.; Hu, D. QRS Complex Detection Using Novel Deep Learning Neural Networks. IEEE Access 2020, 8, 97082–97089. [Google Scholar] [CrossRef]
  17. Tekeste, T.; Saleh, H.; Mohammad, B.; Ismail, M. Ultra-Low Power QRS Detection and ECG Compression Architecture for IoT Healthcare Devices. IEEE Trans. Circuits Syst. Regul. Pap. 2019, 66, 669–679. [Google Scholar] [CrossRef]
  18. Liu, C.; Zhang, X.; Zhao, L.; Liu, F.; Chen, X.; Yao, Y.; Li, J. Signal Quality Assessment and Lightweight QRS Detection for Wearable ECG SmartVest System. IEEE Internet Things J. 2019, 6, 1363–1374. [Google Scholar] [CrossRef]
  19. Chen, C.-L.; Chuang, C.-T. A QRS Detection and R Point Recognition Method for Wearable Single-Lead ECG Devices. Sensors 2017, 17, 1969. [Google Scholar] [CrossRef] [Green Version]
  20. Ding, E.Y.; Marcus, G.M.; McManus, D.D. Emerging Technologies for Identifying Atrial Fibrillation. Circ. Res. 2020, 127, 128–142. [Google Scholar] [CrossRef] [PubMed]
  21. Arzeno, N.M.; Deng, Z.-D.; Poon, C.-S. Analysis of First-Derivative Based QRS Detection Algorithms. IEEE Trans. Biomed. Eng. 2008, 55, 478–484. [Google Scholar] [CrossRef] [Green Version]
  22. Ning, X.; Selesnick, I.W. ECG Enhancement and QRS Detection Based on Sparse Derivatives. Biomed. Signal Process. Control 2013, 8, 713–723. [Google Scholar] [CrossRef]
  23. Elgendi, M. Fast QRS Detection with an Optimized Knowledge-Based Method: Evaluation on 11 Standard ECG Databases. PLoS ONE 2013, 8, e73557. [Google Scholar] [CrossRef] [Green Version]
  24. Moody, G.B.; Mark, R.G. The Impact of the MIT-BIH Arrhythmia Database. IEEE Eng. Med. Biol. Mag. 2001, 20, 45–50. [Google Scholar] [CrossRef] [PubMed]
  25. Kim, J.; Shin, H. Simple and Robust Realtime QRS Detection Algorithm Based on Spatiotemporal Characteristic of the QRS Complex. PLoS ONE 2016, 11, e0150144. [Google Scholar] [CrossRef] [PubMed]
  26. Chiarugi, F.; Sakkalis, V.; Emmanouilidou, D.; Krontiris, T.; Varanini, M.; Tollis, I. Adaptive Threshold QRS Detector with Best Channel Selection Based on a Noise Rating System. In Proceedings of the 2007 Computers in Cardiology, Durham, NC, USA, 30 September–3 October 2007; pp. 157–160. [Google Scholar]
  27. Bachi, L.; Billeci, L.; Varanini, M. Knowledge-Based QRS Detection Performed by a Cascade of Moving Average Filters. In Proceedings of the 2020 Computing in Cardiology, Rimini, Italy, 13–16 September 2020; pp. 1–4. [Google Scholar]
  28. Goldberger, A.L.; Amaral, L.A.N.; Glass, L.; Hausdorff, J.M.; Ivanov, P.C.; Mark, R.G.; Mietus, J.E.; Moody, G.B.; Peng, C.-K.; Stanley, H.E. PhysioBank, PhysioToolkit, and PhysioNet. Circulation 2000, 101, e215–e220. [Google Scholar] [CrossRef] [PubMed] [Green Version]
  29. Taddei, A.; Distante, G.; Emdin, M.; Pisani, P.; Moody, G.B.; Zeelenberg, C.; Marchesi, C. The European ST-T Database: Standard for Evaluating Systems for the Analysis of ST-T Changes in Ambulatory Electrocardiography. Eur. Heart J. 1992, 13, 1164–1172. [Google Scholar] [CrossRef]
  30. Moody, G.B.; Muldrow, W.; Mark, R. A Noise Stress Test for Arrhythmia Detectors. Comput. Cardiol. 1984, 11, 381–384. [Google Scholar]
  31. Moody, G.B. The Physionet/Computers in Cardiology Challenge 2008: T-Wave Alternans. In Proceedings of the 2008 Computers in Cardiology, Bologna, Italy, 14–17 September 2008; pp. 505–508. [Google Scholar]
  32. Laguna, P.; Mark, R.G.; Goldberg, A.; Moody, G.B. A Database for Evaluation of Algorithms for Measurement of QT and Other Waveform Intervals in the ECG. In Proceedings of the Computers in Cardiology 1997, Lund, Sweden, 7–10 September 1997; pp. 673–676. [Google Scholar]
  33. Behar, J.; Johnson, A.; Clifford, G.D.; Oster, J. A Comparison of Single Channel Fetal ECG Extraction Methods. Ann. Biomed. Eng. 2014, 42, 1340–1353. [Google Scholar] [CrossRef]
  34. Complete Pan Tompkins Implementation ECG QRS Detector. Available online: https://it.mathworks.com/matlabcentral/fileexchange/45840-complete-pan-tompkins-implementation-ecg-qrs-detector (accessed on 28 July 2021).
  35. Taddei, A.; Marchesi, C.; Landucci, L. Performance Comparison of Fast QRS Detection Algorithms. In Ambulatory Monitoring; Marchesi, C., Ed.; Developments in Cardiovascular Medicine; Springer: Dordrecht, The Netherlands, 1984; Volume 37, pp. 189–207. ISBN 978-94-009-6012-1. [Google Scholar]
Figure 1. Impulsive response of a moving average cascade. The straight line with the ◦ marker is a single moving average. The triangular shape with the × markers results from two moving averages of the same length in cascade. The curve with the + markers results from a cascade of four moving averages.
Applsci 11 06995 g001
Figure 2. Detection algorithm diagram.
Applsci 11 06995 g002
Figure 3. Impulsive response of MAC(0.02, 0.008)–MAC(0.12, 0.024) at a sampling frequency of 250 Hz.
Applsci 11 06995 g003
Figure 4. Example of the impulsive response of three among the derivative filters we designed.
Applsci 11 06995 g004
Figure 5. (a) Three ECG excerpts from the MIT-BIH database. From top to bottom: record 100, 200, 203. (b) Absolute derivative resulting from the application of three distinct dMACs, portrayed in (c). The dMAC used for each record is chosen with SQI maximization (Equation (1)).
Applsci 11 06995 g005
Figure 6. Stages of the detection process. (a) Raw input ECG signal, plagued by baseline wander and network interference. (b) Noise rejection with the application of MAC(0.02, 0.008)–MAC(0.12, 0.024). (c) Derivative of the signal resulting from the application of the selected dMAC. (d) Rectification of the derivative.
Applsci 11 06995 g006
Figure 7. Decreasing dynamic of the detection threshold. At time = 0, a QRS detection has just occurred. Initially, the threshold   T decreases from 2.4   T n + 1 to T n + 1 . During the refractory period, portrayed by the gray area, no detection is registered. As the time elapsed without a detection increases,   T decreases from T n + 1 to 0.6   T n + 1 , then plateaus again.
Applsci 11 06995 g007
Figure 8. Detection markers for a strip of channel 2 in record 203 of the MIT-BIH Arrhythmia database. This is an example of a critical instance of signal, were both false positives and false negatives are generated.
Applsci 11 06995 g008
Table 1. Database features.
DatabaseNo. of RecordsRecord LengthNo. of Beats
MIT-BIH4830′109,494
Eu ST-T90120′790,565
INCART7530′175,906
NST1230′25,590
TWA100~2′18,991
QT8215′86,995
Table 2. QRS detection F1 score.
DatabaseF1 %
This WorkBeharKimSedghamiz
MIT-BIH ch199.8499.0899.8899.36
MIT-BIH ch298.4796.9897.2895.00
Eu ST-T ch199.6599.4899.1299.10
Eu ST-T ch299.4698.2198.6998.34
INCART ch196.5194.9590.6794.24
INCART ch299.6599.1497.8498.20
NST ch191.7189.8791.0188.41
NST ch294.2493.3878.6292.37
TWA ch198.2097.6094.7293.94
TWA ch299.7790.3897.4699.20
QT ch199.9299.9599.3299.47
QT ch299.9198.6499.0399.57
Gross99.1898.3197.9498.05
Average98.1196.4795.3096.43
Table 3. QRS detection Se-A score.
DatabaseAbnormal BeatsSe-A %
This WorkBeharKimSedghamiz
MIT-BIH ch123,45696.4795.7796.5696.08
MIT-BIH ch223,45694.9193.9393.5790.41
Eu ST-T ch1482298.1897.5397.8697.93
Eu ST-T ch2482294.1193.3891.5293.59
INCART ch123,40786.1682.4976.5091.48
INCART ch223,40799.2098.4497.0398.77
NST ch115,75695.6995.1791.4594.28
NST ch215,75696.2296.9181.8797.51
QT ch1263196.8595.9796.6695.13
QT ch2263196.1294.5695.0694.45
Gross 94.8193.7190.4194.70
Average 95.3994.4291.8194.96
Table 4. QRS detection execution time.
DatabaseExecution Time (Seconds Per Hour of Signal)
This WorkBeharKimSedghamiz
Average0.11370.446033.18080.3388
Publisher’s Note: MDPI stays neutral with regard to jurisdictional claims in published maps and institutional affiliations.

