1. Introduction
Thermal protection system (TPS) is one of the most important sub-systems for hypersonic vehicles suffering extremely high aerodynamic heating and pressure during flights. For the purpose of performing both thermal protection and load-bearing functions, the integrated thermal protection system [
1] was developed. Compared to a parasitic TPS with cold structures and hot structures with insulations, the ITPS has better weight efficiency under the same thermal and structural loads [
2,
3]. Traditional ITPSs are mostly fabricated by metallic materials [
4] with the service temperature around 1300 K. By using C/SiC and SiC/SiC composites, the operable temperature of such systems can be extended to 1800 K [
5]. All these advantages make the ITPS a promising concept for future hypersonic vehicles.
A typical ITPS consists of three components: a top face sheet (TFS), a bottom face sheet (BFS) and insulation cores (webs and insulation materials). The webs not only connect and integrate the TFS and the BFS but also transfer the thermal and mechanical loads between two surfaces [
6]. Although the webs help enhance the structural stiffness and maintain the configuration of the ITPS, they simultaneously induce the thermal short effect due to the high thermal conductivity. Furthermore, when the TFS reaches a high temperature during flight, the BFS remains at a relatively low temperature, leading to the thermal expansion mismatch of the webs [
7]. For some configurations of the ITPS, local buckling occurs on the webs due to the existence of thermal compressive stresses and in-plane mechanical compressive loads, which might lead to catastrophic failure indirectly. The layout design of the web is the key factor in the design of the ITPS.
Many analytical and numerical methods have been developed focusing on analyzing and optimizing the structure of the ITPS. Martinez et al. [
8,
9,
10] developed a micromechanical method to homogenize the sandwich panel as an equivalent orthotropic plate to calculate the structural responses of the ITPS. Zhuang et al. [
11] conducted coupled fluid-structure thermal analysis on an innovative layer-wise finite element model of a hybrid corrugated sandwich panel and found that mechanical instability would be aggravated by the cross-coupling effect. Xie et al. [
12,
13] established an optimization procedure to optimize the geometric dimensions of the ITPS with the globally convergent method of moving asymptotes. Cao et al. [
14] strengthened the thermal protection performance of the ITPS by incorporating shape-stabilized composite phase-change material into corrugated cores. Villanueva et al. [
15] explored the use of space partitioning in the optimization problem of the ITPS to avoid local optima. Uncertainties in thermal loads [
16,
17] and geometric and material properties [
18,
19,
20] were characterized and analyzed. By incorporating uncertainty analysis into the optimization, the reliability and robustness of the ITPS could be improved.
A study carried out by Fang et al. [
21] showed that different core options have a significant influence on the structural responses of the ITPS. Various core topologies, such as the open-cell foam [
22], pin-reinforced cores [
23], honeycomb cores [
24,
25], lattice cores [
26,
27,
28], folded cores [
29] and corrugated cores [
30], have been applied and show great thermal and mechanical performance. Multi-layer insulation structures [
31,
32,
33,
34] were proposed, and optimization results show they are superior to one-layer core ITPSs. However, optimization based on a specific core configuration might not result in the optimum design due to the initial layout limitation. Since the core is the design driver for the ITPS, there is credible evidence to suggest that by solely focusing on the design of the core layout, the ITPS design could be refined. The objective of this paper is to obtain the best core design for the ITPS that can balance thermal and mechanical performance as far as possible. This problem can be efficiently solved by using the topology optimization method, which is widely employed in aircraft and aerospace structures [
35]. A review of the application of cellular materials and topology optimization in customizing mechanical properties was presented in [
36]. Reference [
37] summarized the topology optimization of heat transfer systems. Under the combination of mechanical and thermoelastic loads, the topology optimization method was adopted by Deaton et al. to reduce thermal expansion with prescribed stress limits [
38,
39], by Takezawa et al. to reduce thermal stress [
40] and by Zhang et al. to minimize the mean compliance and elastic strain energy [
41]. For TPS configuration, Penmetsa [
42] et al. presented a topology optimization methodology that couples frequency and stress analysis, and Yang et al. [
43] derived a bride-like ITPS design by minimizing equivalent thermal conductivity and total strain energy of the core area. Structural responses of the optimal designs were effectively improved. However, these designs are usually too complicated to be manufactured and the risk of buckling could be increased due to the existence of thin plates.
This paper focuses on the application of the topology optimization method in the ITPS and the re-design of core structures. The objective of the current work was to develop techniques to optimize the core of ITPS panels. Inspired by the topology optimization result, an innovative core configuration was extracted and modified. With the application of this core layout, thermal insulation capacity of the ITPS is expected to be improved without weakening its strength. Thermal buckling failure was also taken into account in this work. This paper is organized as follows: in
Section 2, the background of thermo-mechanical analysis is described, and the topology optimization method considering both thermal and mechanical performance is established. In
Section 3, an innovative ITPS model with cell configuration obtained from previous topology optimization is built and further optimized considering its thermal buckling characteristics. In
Section 4, comparisons of the structural responses between the original and optimized designs are presented. Finally, conclusions and future research recommendations are given.
2. Topology Optimization Method
Different core options have been proposed for the ITPS; however, what is the best core design under different conditions is hard to define. In this section, a corrugated sandwich structure ITPS used in a specific load condition was selected and analyzed as a reference. A topology optimization method applied to the unit cell of the ITPS was then established against thermal and mechanical performance in this condition. The objective of this section was to determine the structural responses of the initial ITPS and get a better core configuration for the ITPS through topology optimization.
2.1. Thermo-Mechanical Analysis Model
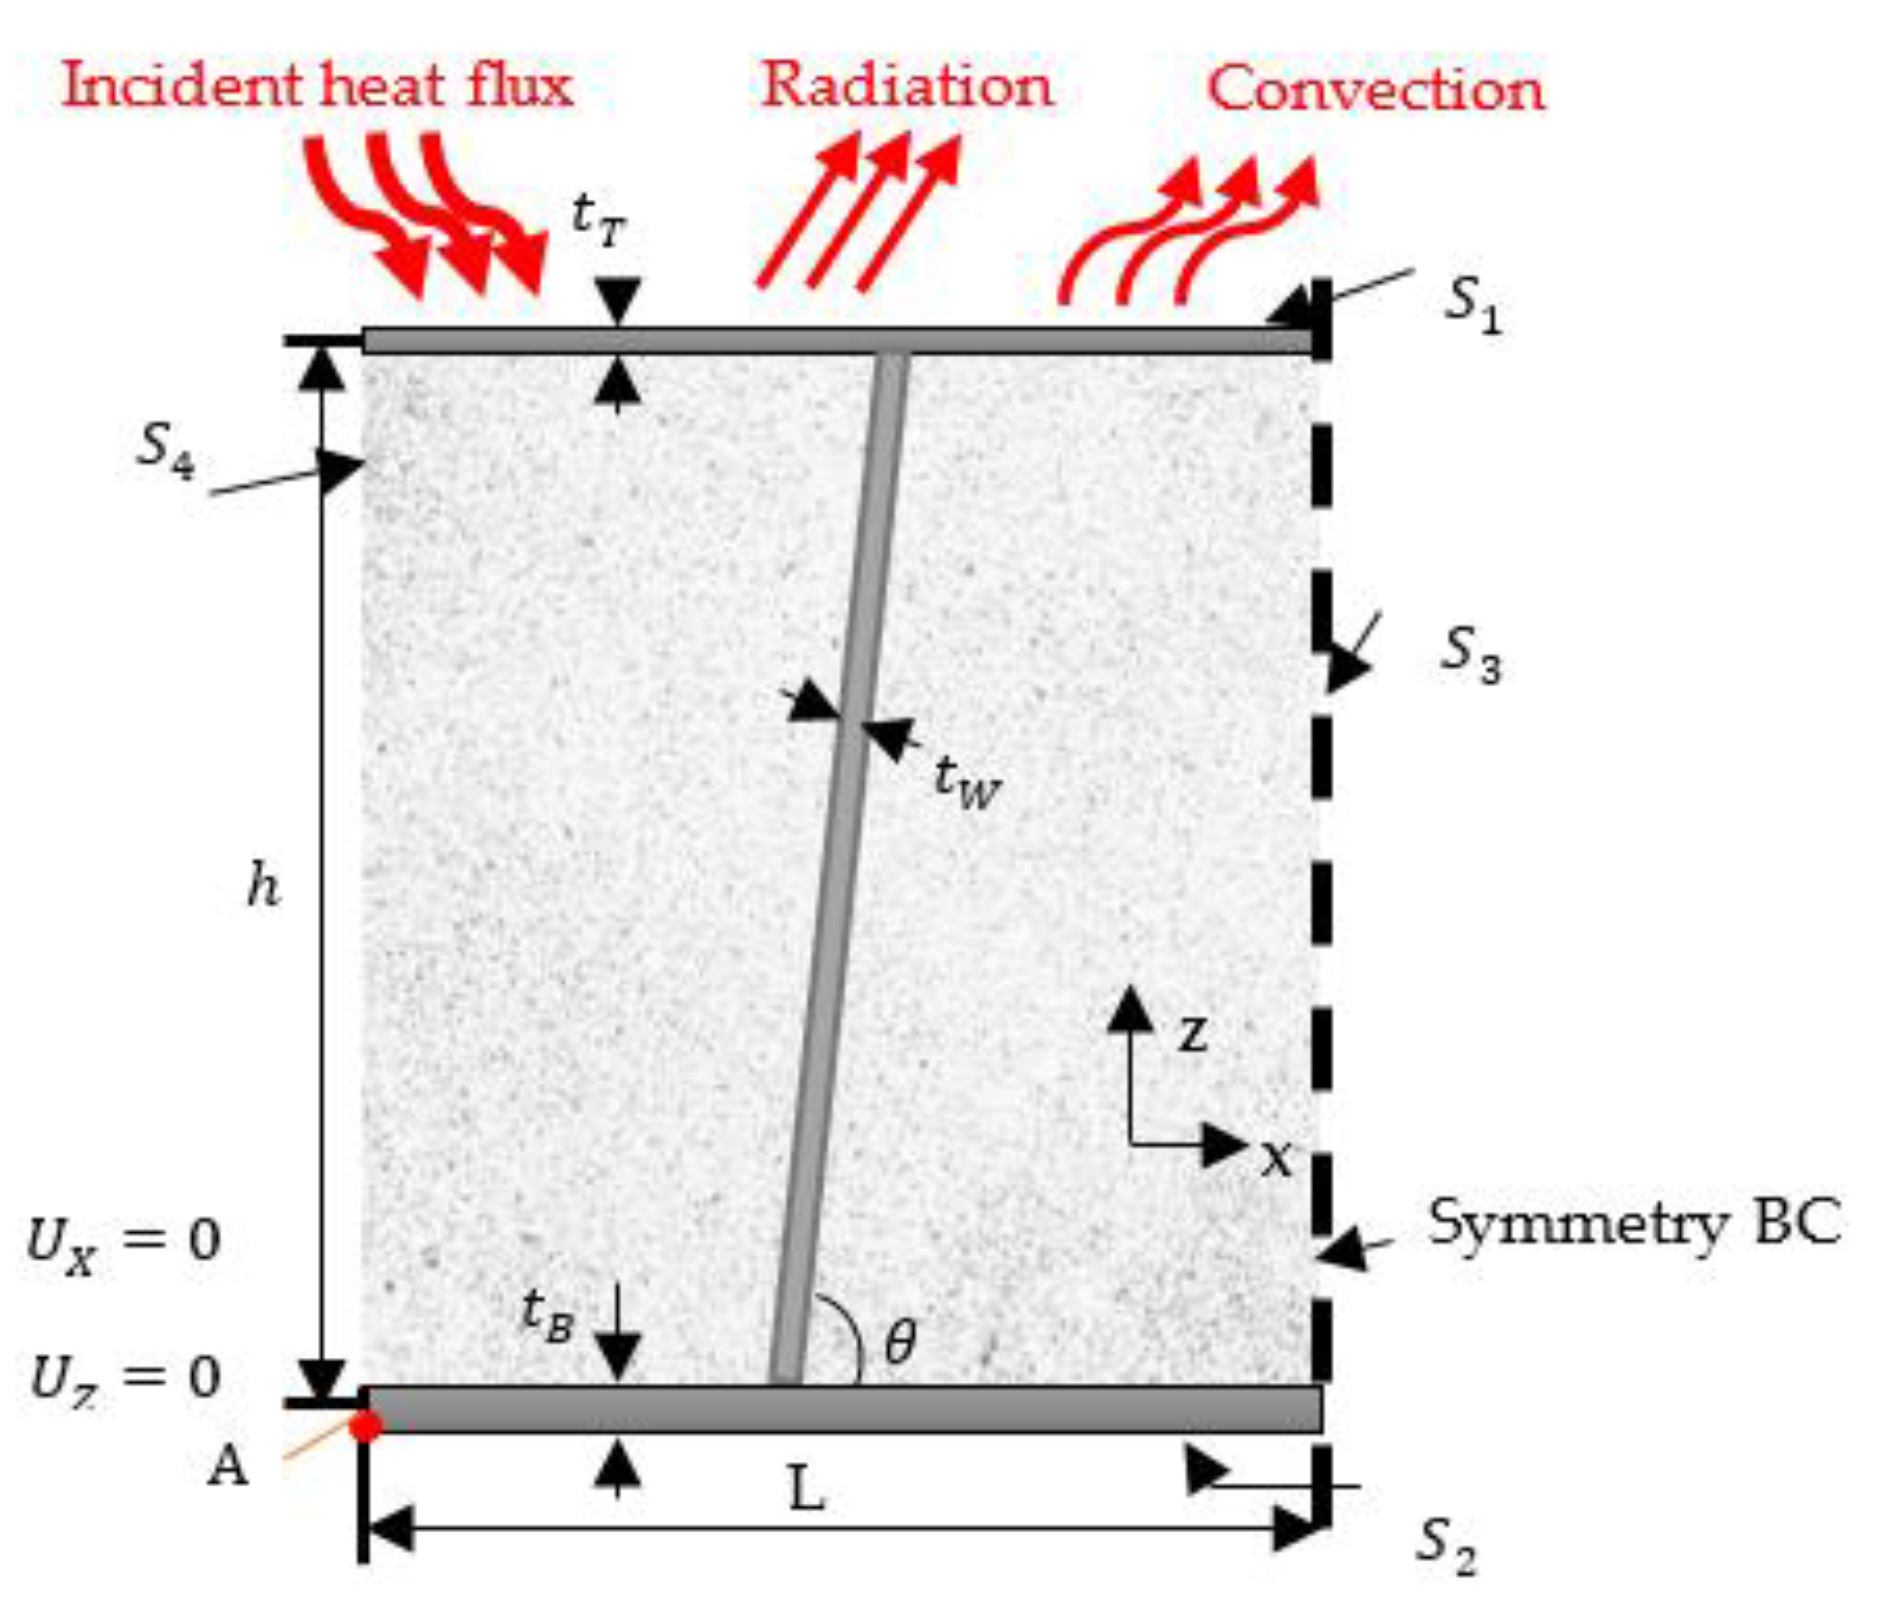
Thermal-mechanical analysis models were used to determine the structural responses of ITPSs under aerothermal heat and aerodynamic pressure load. In this paper, a corrugated sandwich-structure ITPS was selected as reference design. The initial ITPS unit cell consists of: an Inconel 718 top face sheet (TFS) panel; two Ti-6Al-4V webs; an Al 2024 bottom face sheet (BFS) panel; and Saffil insulation that fills the space between the TFS and the BFS. The material properties are plotted in
Appendix A (
Figure A1,
Figure A2 and
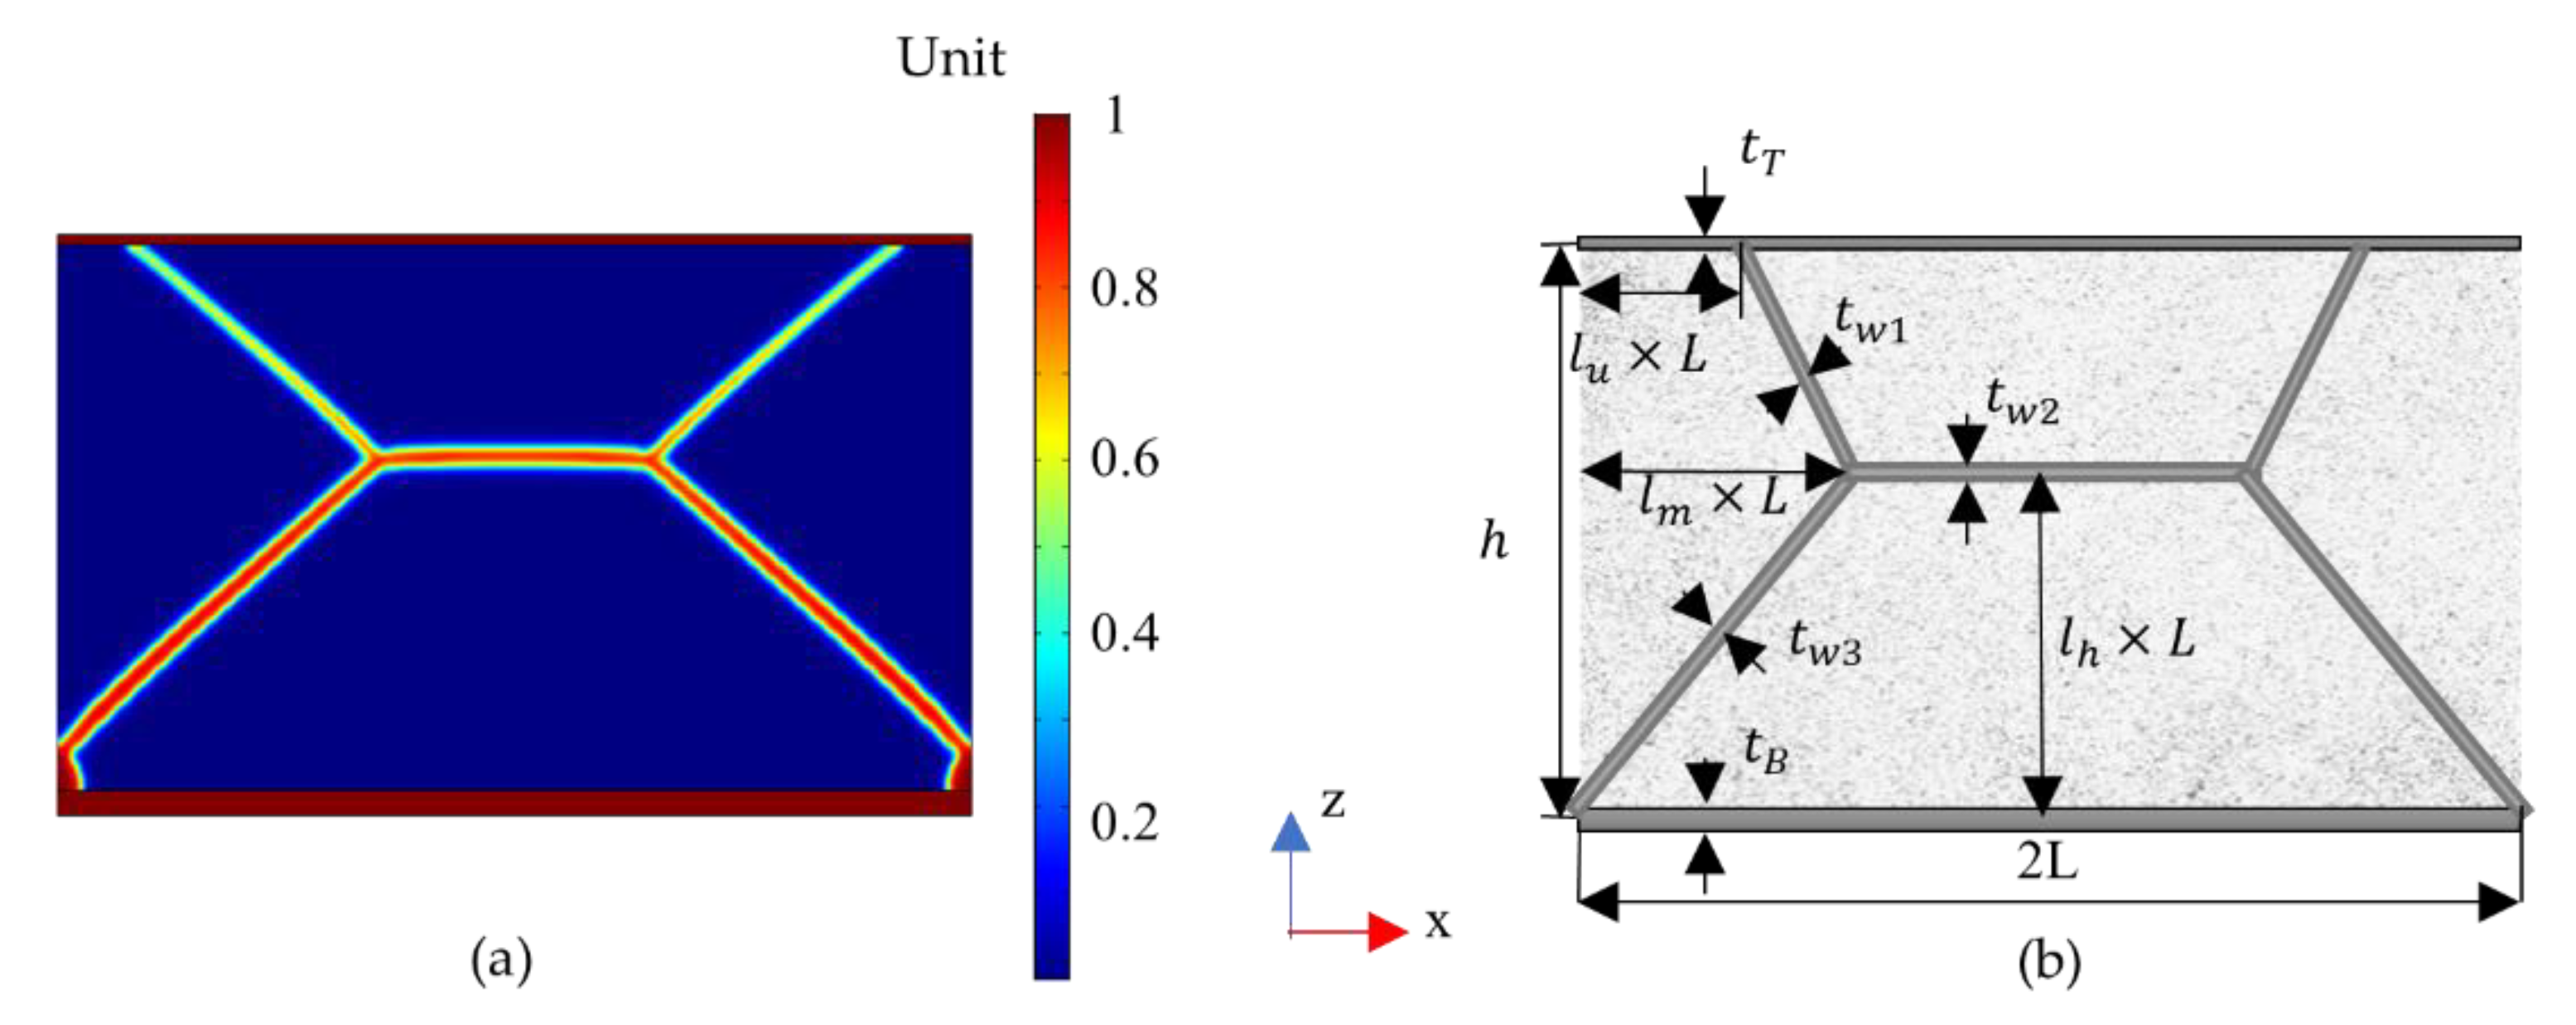
Figure A3). Half of the unit-cell model and corresponding geometry parameters are shown in
Figure 1. L is the half-width of the unit cell, h is the height of the panel, θ is the inclination of the web, and
,
and
are the thickness of the TFS, BFS, and web, respectively. The initial parameters were obtained from [
1], as shown in
Table 1.
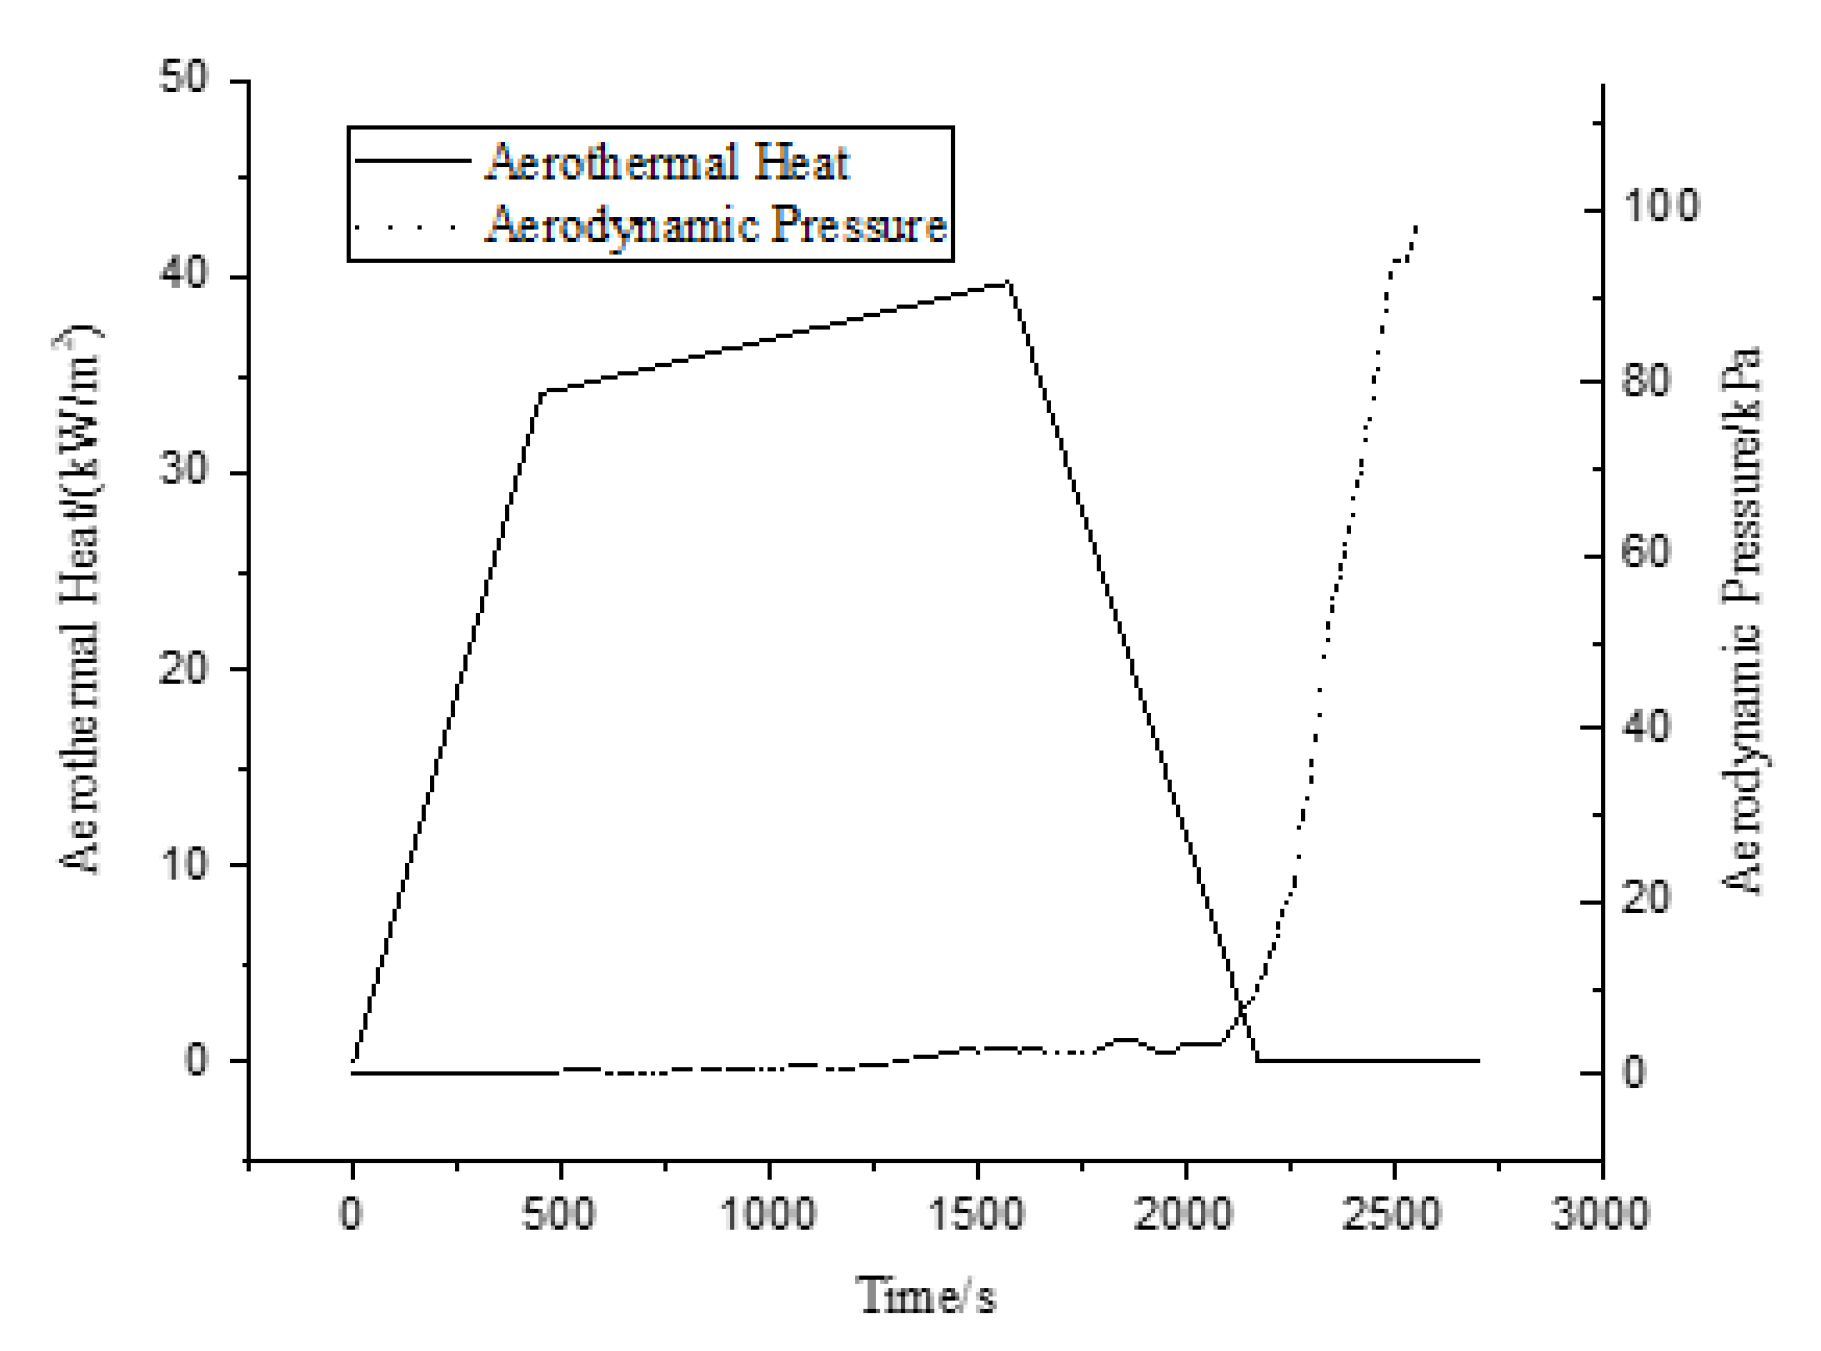
ITPSs are developed not only to perform the function of thermal protection but also to withstand loads to a large extent. Load condition varies far from each other according to different operating environments. The thermal load and the aerodynamic load applied to the initial structure were based on the simulation at the specific location in the X-33, as depicted in
Figure 2.
Heat transfer analysis was conducted to derive the thermal response of the ITPS. A typical incident heat flux, as presented in
Figure 2, was imposed on the external surface of the TFS. The governing equation is as follows, where
x and
z are coordinates,
t is time,
k is conductivity,
is density,
c is specific heat and
T is temperature.
A large portion of aerothermal heat is radiated out to the ambient space by the TFS; still, part of that heat is conducted to the BFS through webs and insulation material. It is assumed that there is no lateral heat flow out of the unit cell and the BFS is perfectly insulated, which indicates the BFS temperature would rise to a maximum after vehicle touchdown. During this period, in addition to radiation, convective heat transfer is imposed on the TFS as boundary conditions. Ambient temperatures during the re-entry period are listed in
Table 2. Boundary conditions on S
1 are:
In the above equations,
and
are TFS temperature and environment temperature, respectively, h is convective heat transfer coefficient and
is the heat flux depicted in
Figure 2.
is the Stefan–Boltzmann constant, and
is emissivity; a typical value of 0.85 is selected in this study according to [
3].
Thermo-mechanical coupling analysis was carried out to derive mechanical performance of the ITPS. Temperature fields derived from heat transfer analysis were applied to the coupling analysis model as body loads. The stress–strain relationships are:
,
and
are strains,
and
are displacements,
is the coefficient of thermal expansion,
is temperature difference, and E, G and
are tension modulus, shear modulus and Poisson’s ratio, respectively. Besides the thermal loads, aerodynamic pressure load shown in
Figure 2 was imposed on the outer surface of the TFS. It was presumed that the internal pressure of the ITPS is equal to the atmospheric pressure. Given this hypothesis, a pressure load of 1 atm was applied to the inner surface of the TFS. The ITPS was supposed to be fixed on the underlying structures by edges. For this reason, point A, as depicted in
Figure 1, was fixed as a boundary condition. The above equations were solved in the multi-physics software package COMSOL.
2.2. Performance Characterization of ITPS
ITPS panels form the outer skin of the aircraft to protect the underlying structure from a severe environment at high speed. They are designed to fulfill both thermal insulation and load-bearing function.
The thermal insulation capacity of the ITPS can be characterized by the equivalent thermal conductivity. The smaller the equivalent thermal conductivity, the better ITPS thermal insulation capacity. According to Fourier’s law, heat flux across
z-direction in a steady state is:
In these functions,
is the heat flux,
is the temperature difference between the TFS and BFS, and
is the equivalent thermal conductivity of the ITPS. The heat transfer rate can be represented as:
The heat transfer rate Q is proportional to . When Q is minimized, is minimized as well, and the best thermal insulation capacity of the ITPS can be achieved.
As for optimizing the load-bearing capacity of the ITPS, it can be realized by maximizing equivalent stiffness. This problem can be transformed into the problem of minimizing elastic strain energy. The strain energy for thermo-mechanical coupling problem can be expressed as:
D is the stiffness matrix of material:
The best way to reduce thermal short is to remove the webs. Under such conditions, thermal stress can be eliminated as well since there would be no thermal expansion mismatch. However, the load-bearing capacity could be diminished dramatically as a consequence. Therefore, appropriate objectives and constraints should be employed for ITPS optimizations.
2.3. Optimization Model Setup
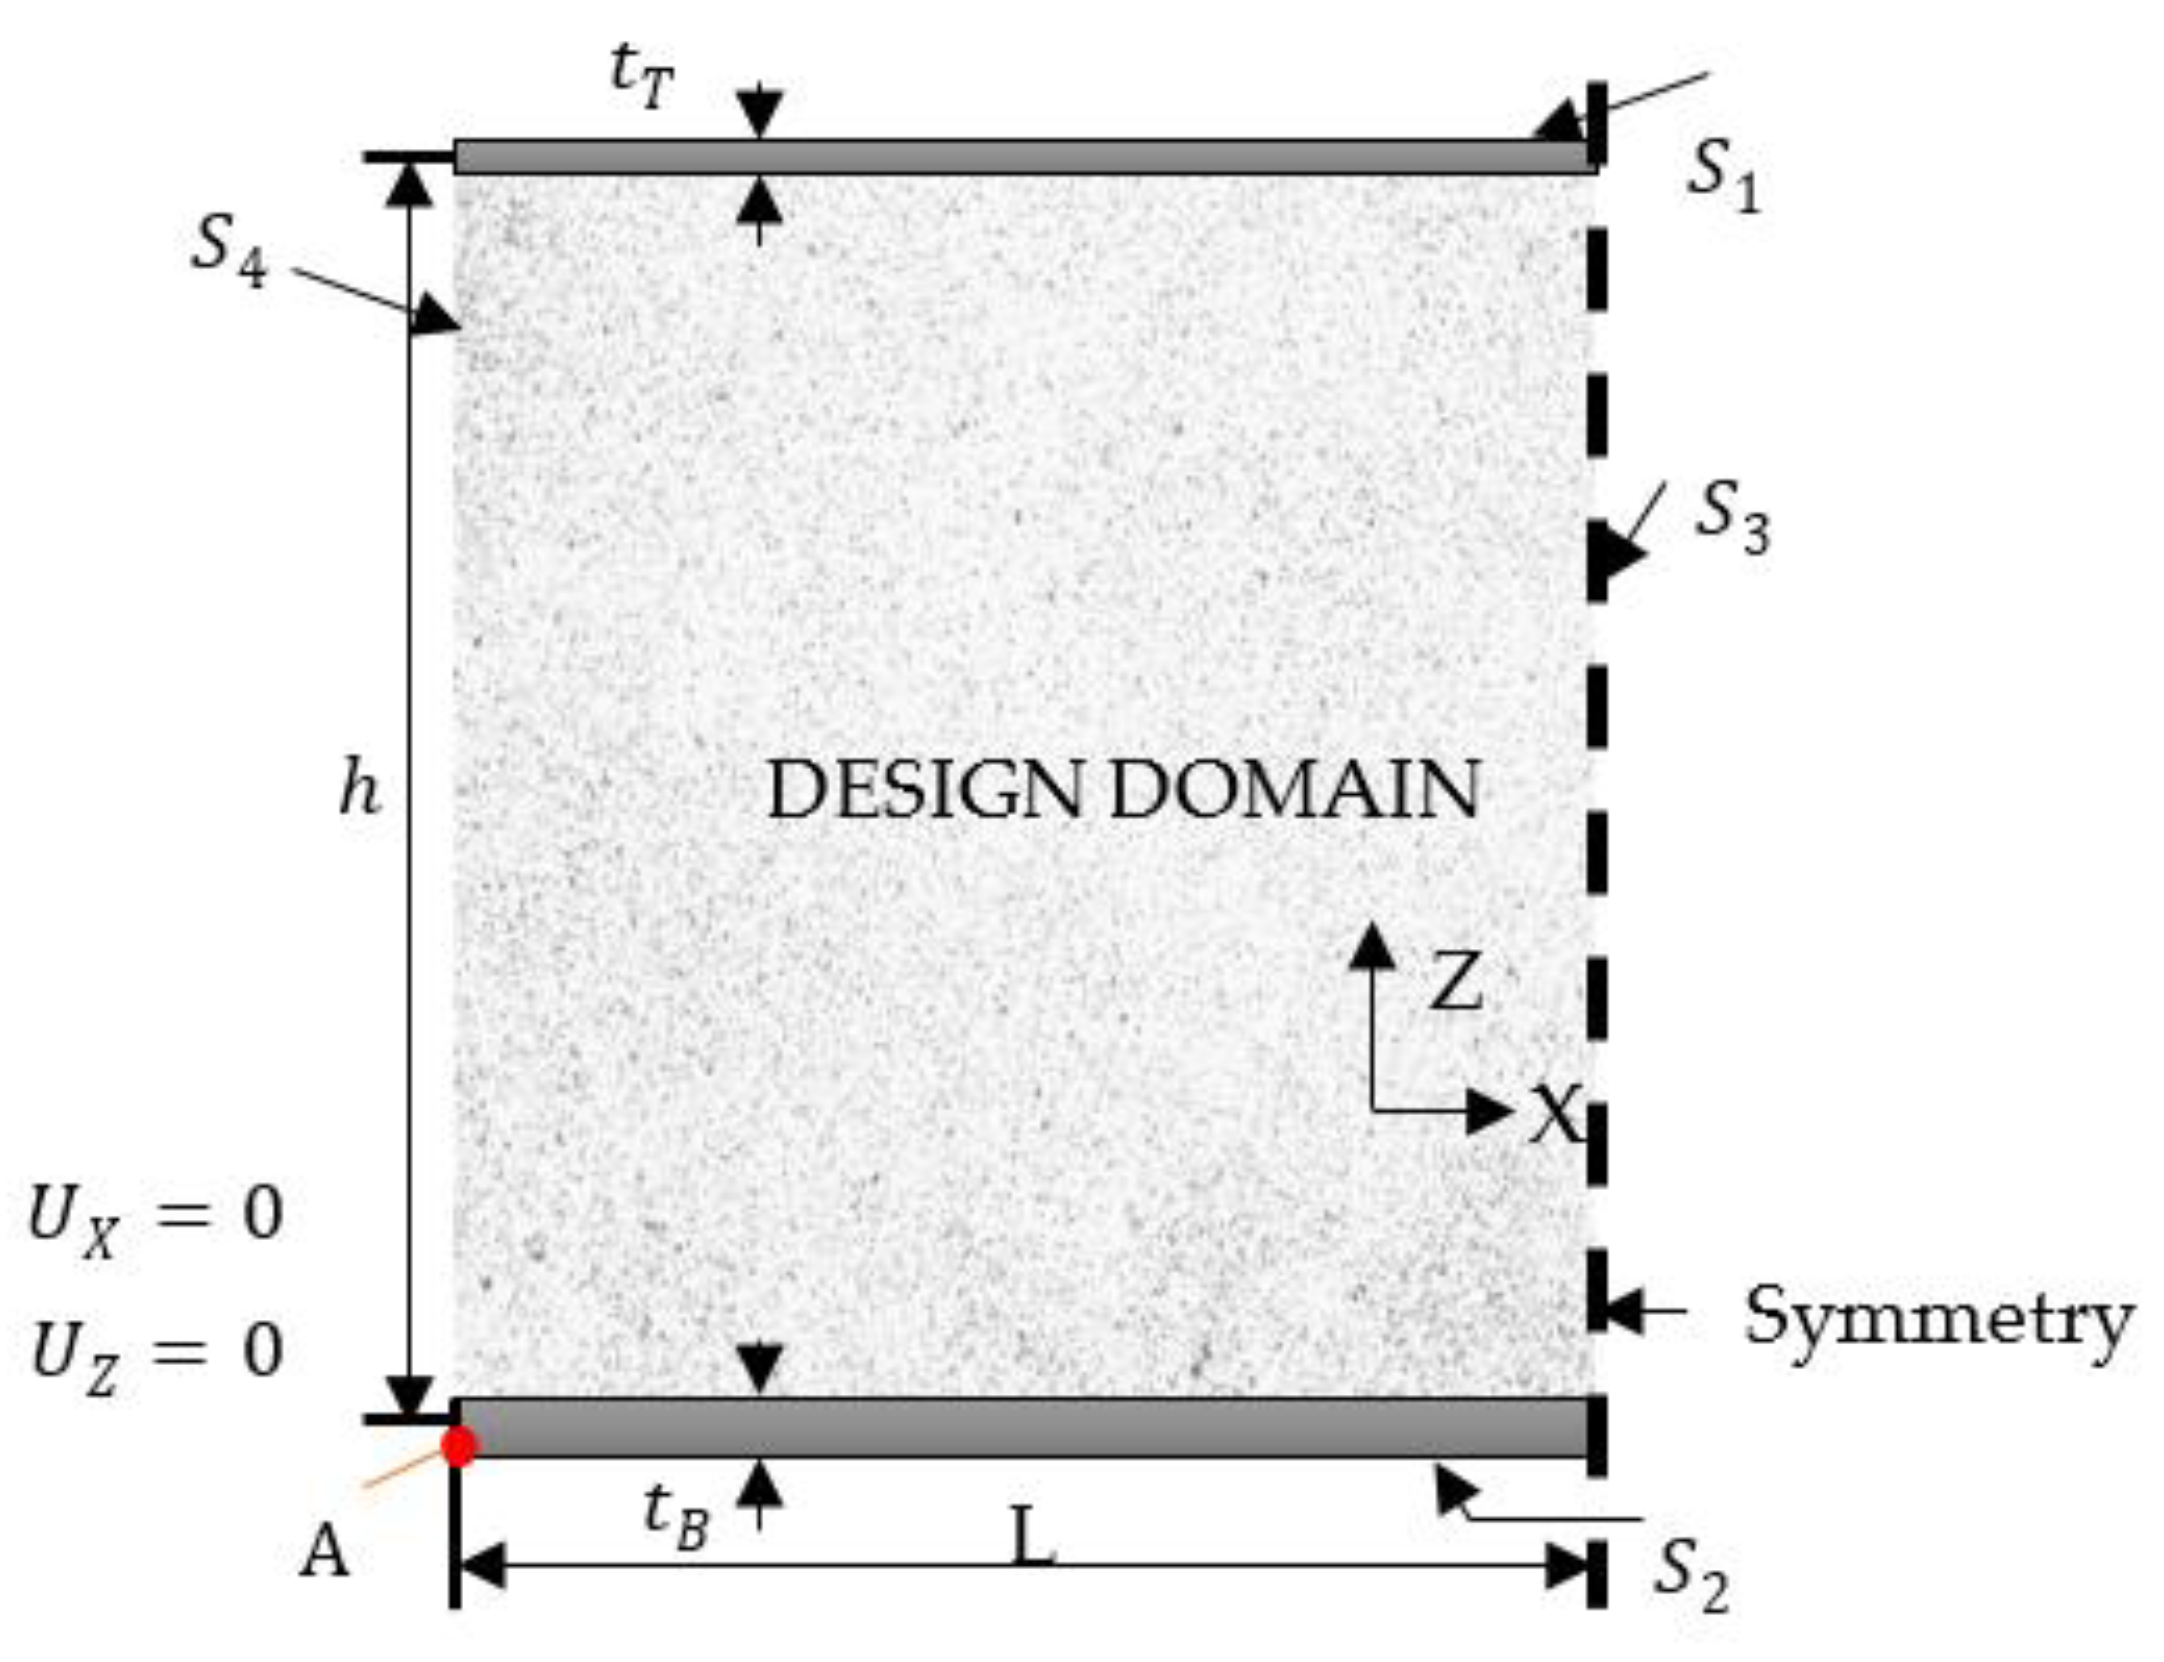
This work focuses on optimizing the core section of the ITPS as presented in
Figure 3. Parameters defining the thickness of the ITPS panel,
,
and h, are fixed during optimization. According to the analysis mentioned in the previous section, temperature of the TFS and BFS were fixed at 950 K and 450 K, respectively. In addition, aerodynamic pressure loads with a magnitude of 1 atm were imposed on the TFS. The solid isotropic material with penalization (SIMP) method was adopted to solve the problem. A pseudo-density
was adapted to define the elastic and thermal properties:
, and are the initial elastic modulus, thermal conductivities and densities of materials, respectively. The penalty factor is chosen to be 3 in this problem.
With the purpose of improving thermal and mechanical performance of the ITPS as far as possible, both equivalent conductivity and strain energy were considered in the objective function formulation. Two critical constraints were adopted in the preliminary design: (1) weight of the optimized design should not be heavier than the initial design to maintain the launch cost; and (2) maximum deflection of the top face sheet (TFS) should be limited to avoid severe local aerodynamic heating. The optimization problem can be denoted by:
The subscript ‘ini’ represents the value of the reference design shown in
Figure 1, ‘T’ represents the TFS,
and
are the maximum and minimum deflection of the TFS, respectively,
is the volume fraction of the webs, and
is the minimum density employed to avoid numerical singularities. N is the weight factor introduced to balance two objectives. It is assumed that thermal insulation and load-bearing performance are of the same importance for ITPS design, and N is set to 0.5 in this study.
3. Thermal Buckling Analysis and Optimization
The ITPS panels are supposed to withstand significant aerodynamic load and extreme thermal gradients. The load-carrying parts of ITPS panels are thin plates, which implies that there would be large unsupported sections subject to thermal compressive stresses and in-plane mechanical compressive loads. These plates would be highly sensitive to buckling. When local buckling occurs, it might lead to catastrophic failure indirectly. The idealized 2D cell attained from previous optimization did well in balancing insulation and mechanical performance. However, when it comes to 3D structure, the possibility of buckling still exists. In order to achieve a reliable 3D structure, finite analyses for thermal buckling and optimization were carried out in this section using COMSOL.
3.1. Thermal Buckling Analysis Model
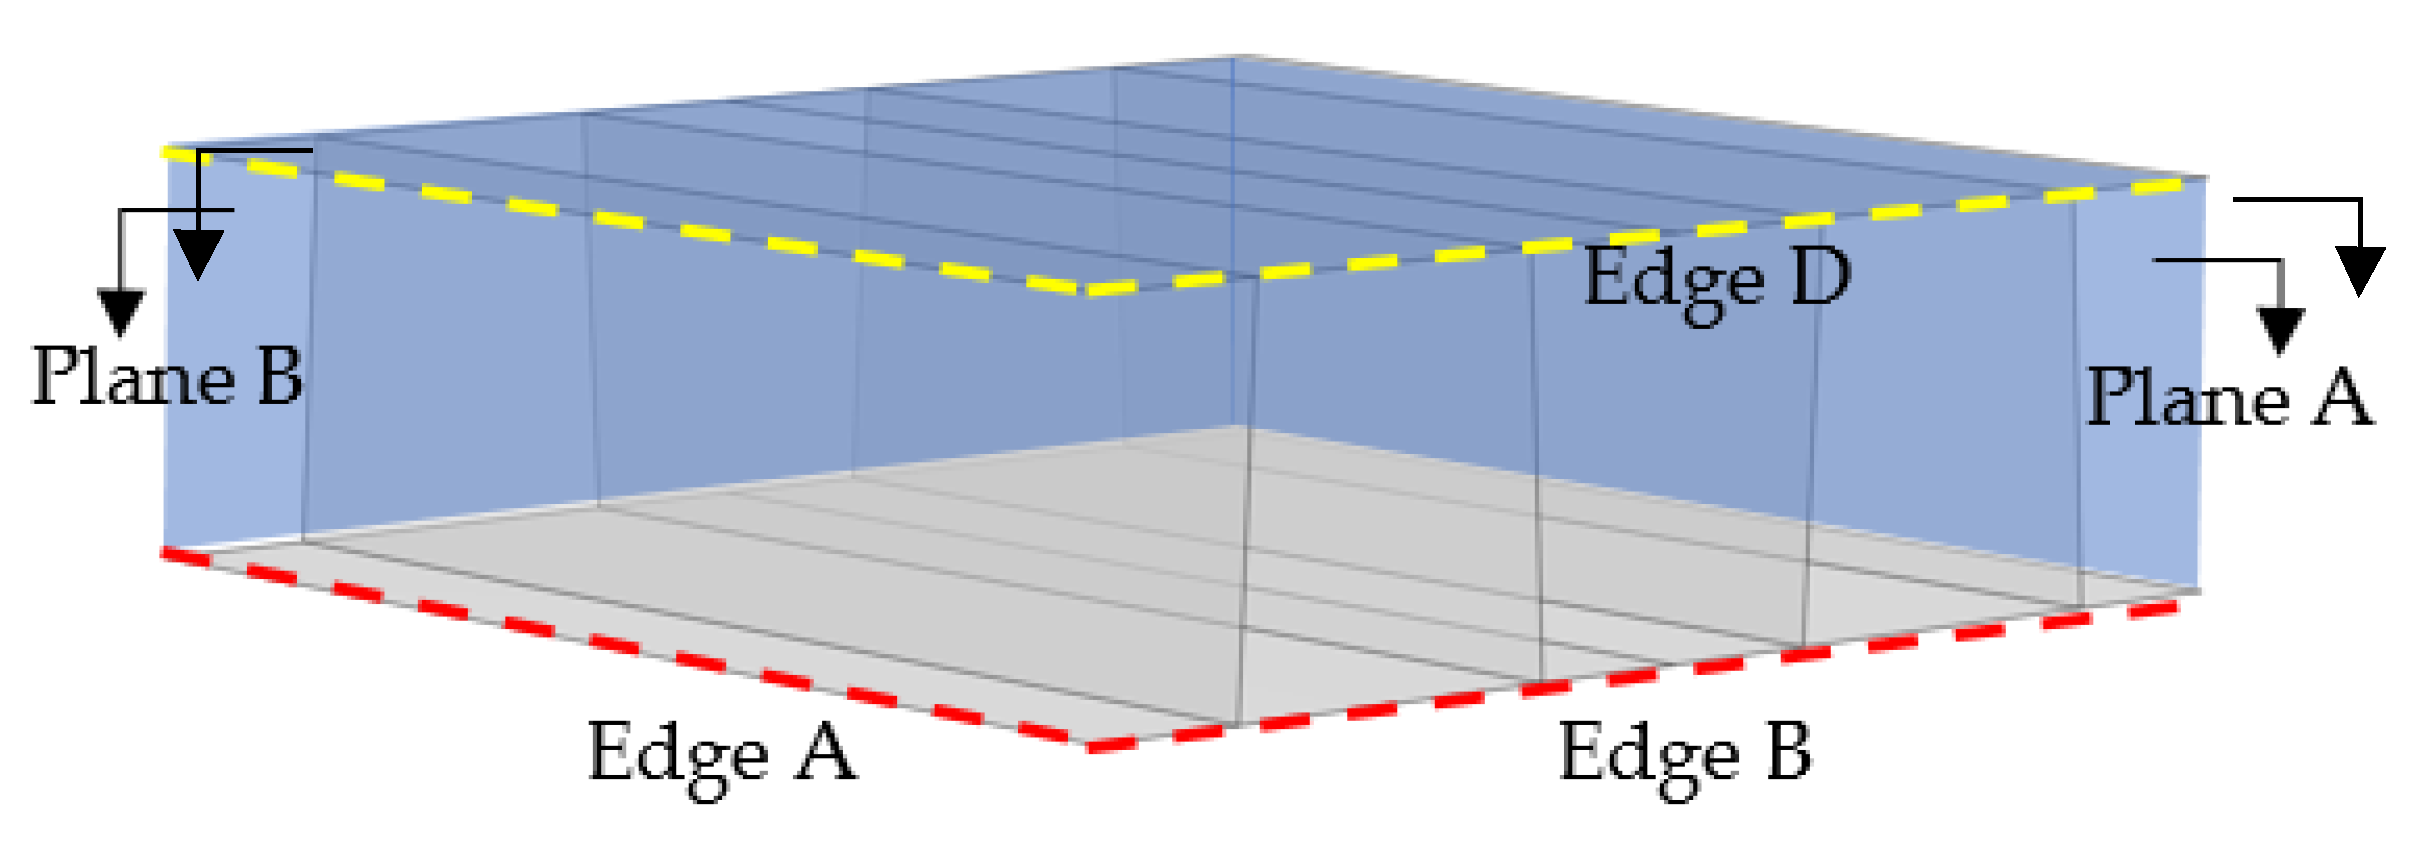
In the finite element model, the insulation material is not considered since Saffil insulation is much softer than other materials that make up the webs and face sheets. Therefore, it can be safely omitted from all structure analyses without introducing any palpable error. While the 2D configuration of the unit cell is determined, the length of the panel is still undefined. The length can be characterized by the number of unit cells instead. In this study, the number of unit cells in one panel was fixed at four and the shape of the panel was assumed to be square. In this case, bucking analysis should be carried out by including the whole ITPS panel because the boundary conditions for a unit cell were not defined. By imposing symmetric boundary conditions, two cells are sufficient to model the overall panel. An eight-node shell element with six degrees of freedom at each node is used for the buckling FE model.
Figure 4 shows one-quarter of an ITPS panel. In this study, edge A and edge B are actual panel edges; the BFS edges were fixed in all three displacements and all three rotations. TFS edges C and D were fixed in all three rotations while allowing all three displacements. Plane A and plane B are symmetric planes. Edges on plane A were fixed in
x-direction displacement and
y- and
z-direction rotations. Similarly, edges on plane B were fixed in
y-direction displacement and
x- and
y-direction rotations.
The loads for the buckling problem are temperature loads and aerodynamic pressure loads. Temperature distributions were obtained from previous 2D analysis at different re-entry times in the form of interpolation functions in one variable (
z-coordinate). These functions are plotted in
Figure 5. By using interpolation, the temperatures were assigned to each node of the 3D shell mesh according to the
z-coordinates. The buckling problems were separately analyzed for different re-entry times. In this study, four critical times were chosen: (1) Time 1: when TFS reaches maximum temperature; (2) Time 2: when the mid-point of the web reaches maximum temperature; (3) Time 3: when the BFS reaches maximum temperature; and (4) Time 4: when the temperature difference between the TFS and BFS reaches the maximum. It is worth noticing that temperature distribution in Time 1 and Time 4 is very similar. Moreover, the overall temperature in Time 4 is lower than Time 1. Considering that thermal stresses caused by the temperature load were the critical load in this problem, thermal buckling analysis at Time 4 can be removed.
In the thermal buckling analysis, 40 smallest vectors and eigenvectors were extracted in case of negative values. For this design, negative values do not make any sense and could be ignored. When the smallest positive eigenvalue is above 1, the structure is presumed to be safe; otherwise, structural buckling occurs.
3.2. Thermal Buckling Optimization Model Setup
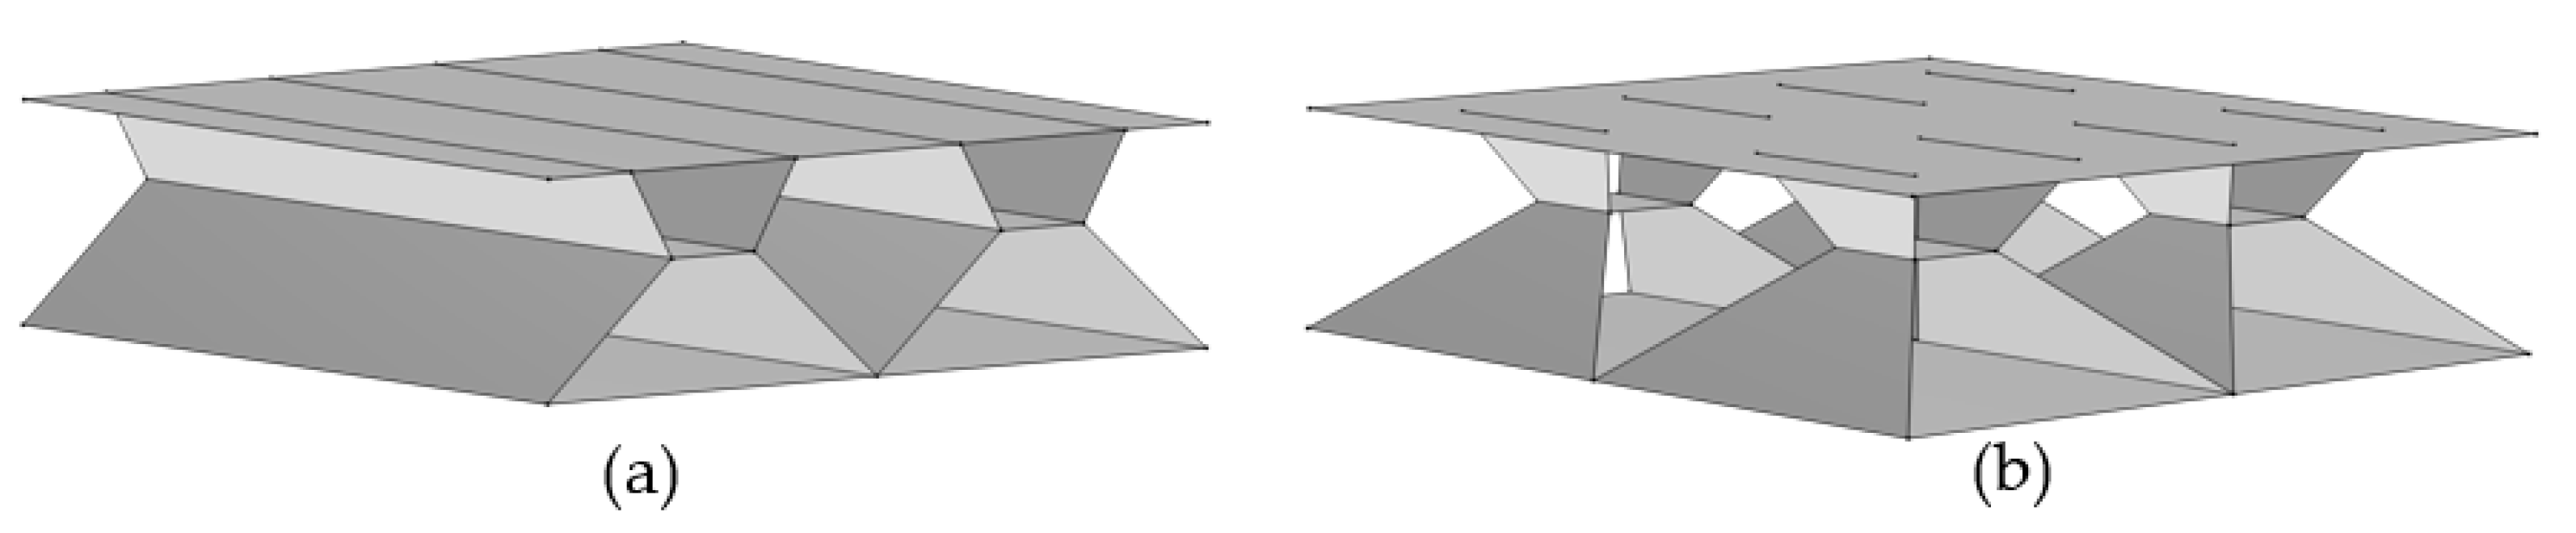
Two different ITPS configurations were constructed based on 2D optimizations as shown in
Figure 6 where OPT1 and OPT2 stand for two configurations, respectively.
Thermal buckling analysis at three critical times was conducted on these models, and results are given in
Table 3, in which
,
and
are upper-, mid- and lower-web thickness, respectively.
,
and
are the critical load factors calculated at Times 1, 2 and 3, respectively. At Time 3, when BFS temperature reaches maximum, buckling occurs at the bottom surface of the ITPS and has little influence on the occurrence of unexpected deformation on the TFS. Buckling mode at Time 3 is mainly driven by
, which is not one of the design variables in this study. Furthermore, by analyzing all the 40 buckling modes, it can be concluded that when the webs buckled under the conditions at Time 3, the corresponding load factors were always greater than 1 and can be assumed to be safe for the ITPS. For this reason, Time 3 was removed from the following optimization process.
It is obvious that both OPT1 and OPT2 should be optimized to avoid buckling. Comparison between OPT1 and OPT2 indicates that the buckling stability can be improved by redistributing the material of webs in y-direction. On the other hand, when webs’ thickness of OPT2 was increased, the buckling stability increased as well. This design was denoted by OPT3. It can be concluded that ITPS buckling stability would be improved in two ways: modifying the webs’ thickness or reshaping the webs in y-direction. Taking mass restriction into account, OPT3 was selected as basis for further optimization.
3.2.1. Size Optimization
For size optimization, quadratic response surface approximations of critical load factors at Time 1 and Time 2 were adopted. The approximations are functions of design variables
,
and
. With 3 variables, the quadratic functions would have 10 coefficients, and hence at least 10 function evaluations are required. Latin hypercube sampling (LHS) was used for the design of experiments. Range of variables is listed in
Table 4.
Size optimization can be formulated as:
The approximated critical load factors at two times are denoted by
,
,
and
are the upper and lower bounds of the design variables, respectively, and
is the mass of the initial design depicted in
Figure 4. The optimized design is expected to be lighter than the initial design to maintain the structural efficiency of the ITPS.
3.2.2. Shape Optimization
A parametric model as presented in
Figure 7 was built for shape optimization. Three new parameters, a, b and c, were introduced for constructing the structure. It is assumed the boundaries of webs remain straight, and a, b and c were modified during optimization. The objective functions, critical load factors at two times were calculated by the finite element thermal buckling analysis. With the constraint on ITPS weight, the COBYLA (constrained optimization by linear approximation) was employed to establish an optimization solution.
3.3. Optimization Procedure
The flowchart of the optimization procedure of the ITPS is shown in
Figure 8. The procedures are presented in the following:
First of all, a corrugated sandwich-structure ITPS was selected as a reference configuration. By simplifying the geometry of the initial ITPS, a 2D model was built for thermo-mechanical coupling analysis and a 3D model was built for thermal buckling analysis. Temperature distribution versus time was obtained. These nodal temperature data were processed to determine the maximum TFS and BFS temperature. In the following topology optimization process, temperature boundary conditions were determined referring to these two temperatures.
Secondly, 2D topology optimization was conducted to obtain the ideal configuration of the ITPS core section. In order to achieve the most reasonable design in this process, extreme service condition, including the maximum service temperature and the maximum aerodynamic load during flight, was employed. In topology optimization, the objective function was calculated as follows: (1) Q was calculated under thermal analysis; (2) W was obtained from the thermo-mechanical analysis; and (3) objective function value was calculated according to Equation (14). The globally convergent method of moving asymptotes (GCMMA) was employed to establish an optimization solution. The optimization is considered converged when the maximum difference of material density between two iterations is less than 0.01. The optimal 2D core configuration can be obtained in this part.
Subsequently, the 3D thermal buckling analysis model was created. The core of the new ITPS design was inspired by the aforementioned 2D optimal configuration. Two sensible structures were built and analyzed. These innovative designs show better thermal protection and load-bearing capacities; however, they are at risk of buckling. Several geometric parameters were selected as variables, and parametric models were built. From the thermal buckling analysis, the smallest buckling eigenvalues at different re-entry times were obtained. According to Equation (15), the objective function value can be calculated. In order to maximize the smallest eigenvalues, variables were altered until convergence. The optimal 3D ITPS design can be achieved in this part.
In summary, the core configuration was obtained from topology optimization firstly. Then it was applied to 3D structures and was further optimized to avoid the risk of buckling. By using this optimization strategy, innovative ITPS concepts with better thermal and mechanical performance can be achieved without weight cost.
4. Results and Discussion
In this section, the 2D optimized designs are presented first. Based on the 2D configuration, several 3D structures were built and analyzed under the coupled thermal loads. Heat transfer and thermo-mechanical analyses were carried out with detailed 3D solid models for original and optimized designs. Results are given below.
4.1. Two-Dimensional Topology Optimization
The optimized layout using both aerothermal heat and aerodynamic pressure loads is displayed in
Figure 9. Compared to the origin design, the angles between the webs and the inner surfaces of the optimized design decreased in order to have a longer heat transfer path. In this way, more of the heat flux could be absorbed by the insulation materials before reaching BFSs. In contrast to improving thermal performance, the decline of angles is likely to weaken the support of webs to the TFSs. As a result of balancing thermal and mechanical performance of the ITPS, a horizontal web emerged to suppress the deformation. It should be noted that materials of intermediate density occur in the optimized design. Even though the existence of materials with medium thermal conductivity and modulus might be a method for resolving the conflict between thermal and mechanical performance, as supported by [
45], these results are not favorable to topology optimization. Nonetheless, a clear morphology was obtained. According to this morphology, two configurations were presented and analyzed in this study. OPT-T was exactly the same as in
Figure 9a, and OPT-P was slightly modified to reduce deformation based on OPT-T. Parameters are listed in
Table 5. Thermal and mechanical responses, including maximum temperatures at each component of the ITPSs (
for TFSs,
for BFSs and
for mid-point on webs) and maximum deformation at TFSs (
), are plotted in
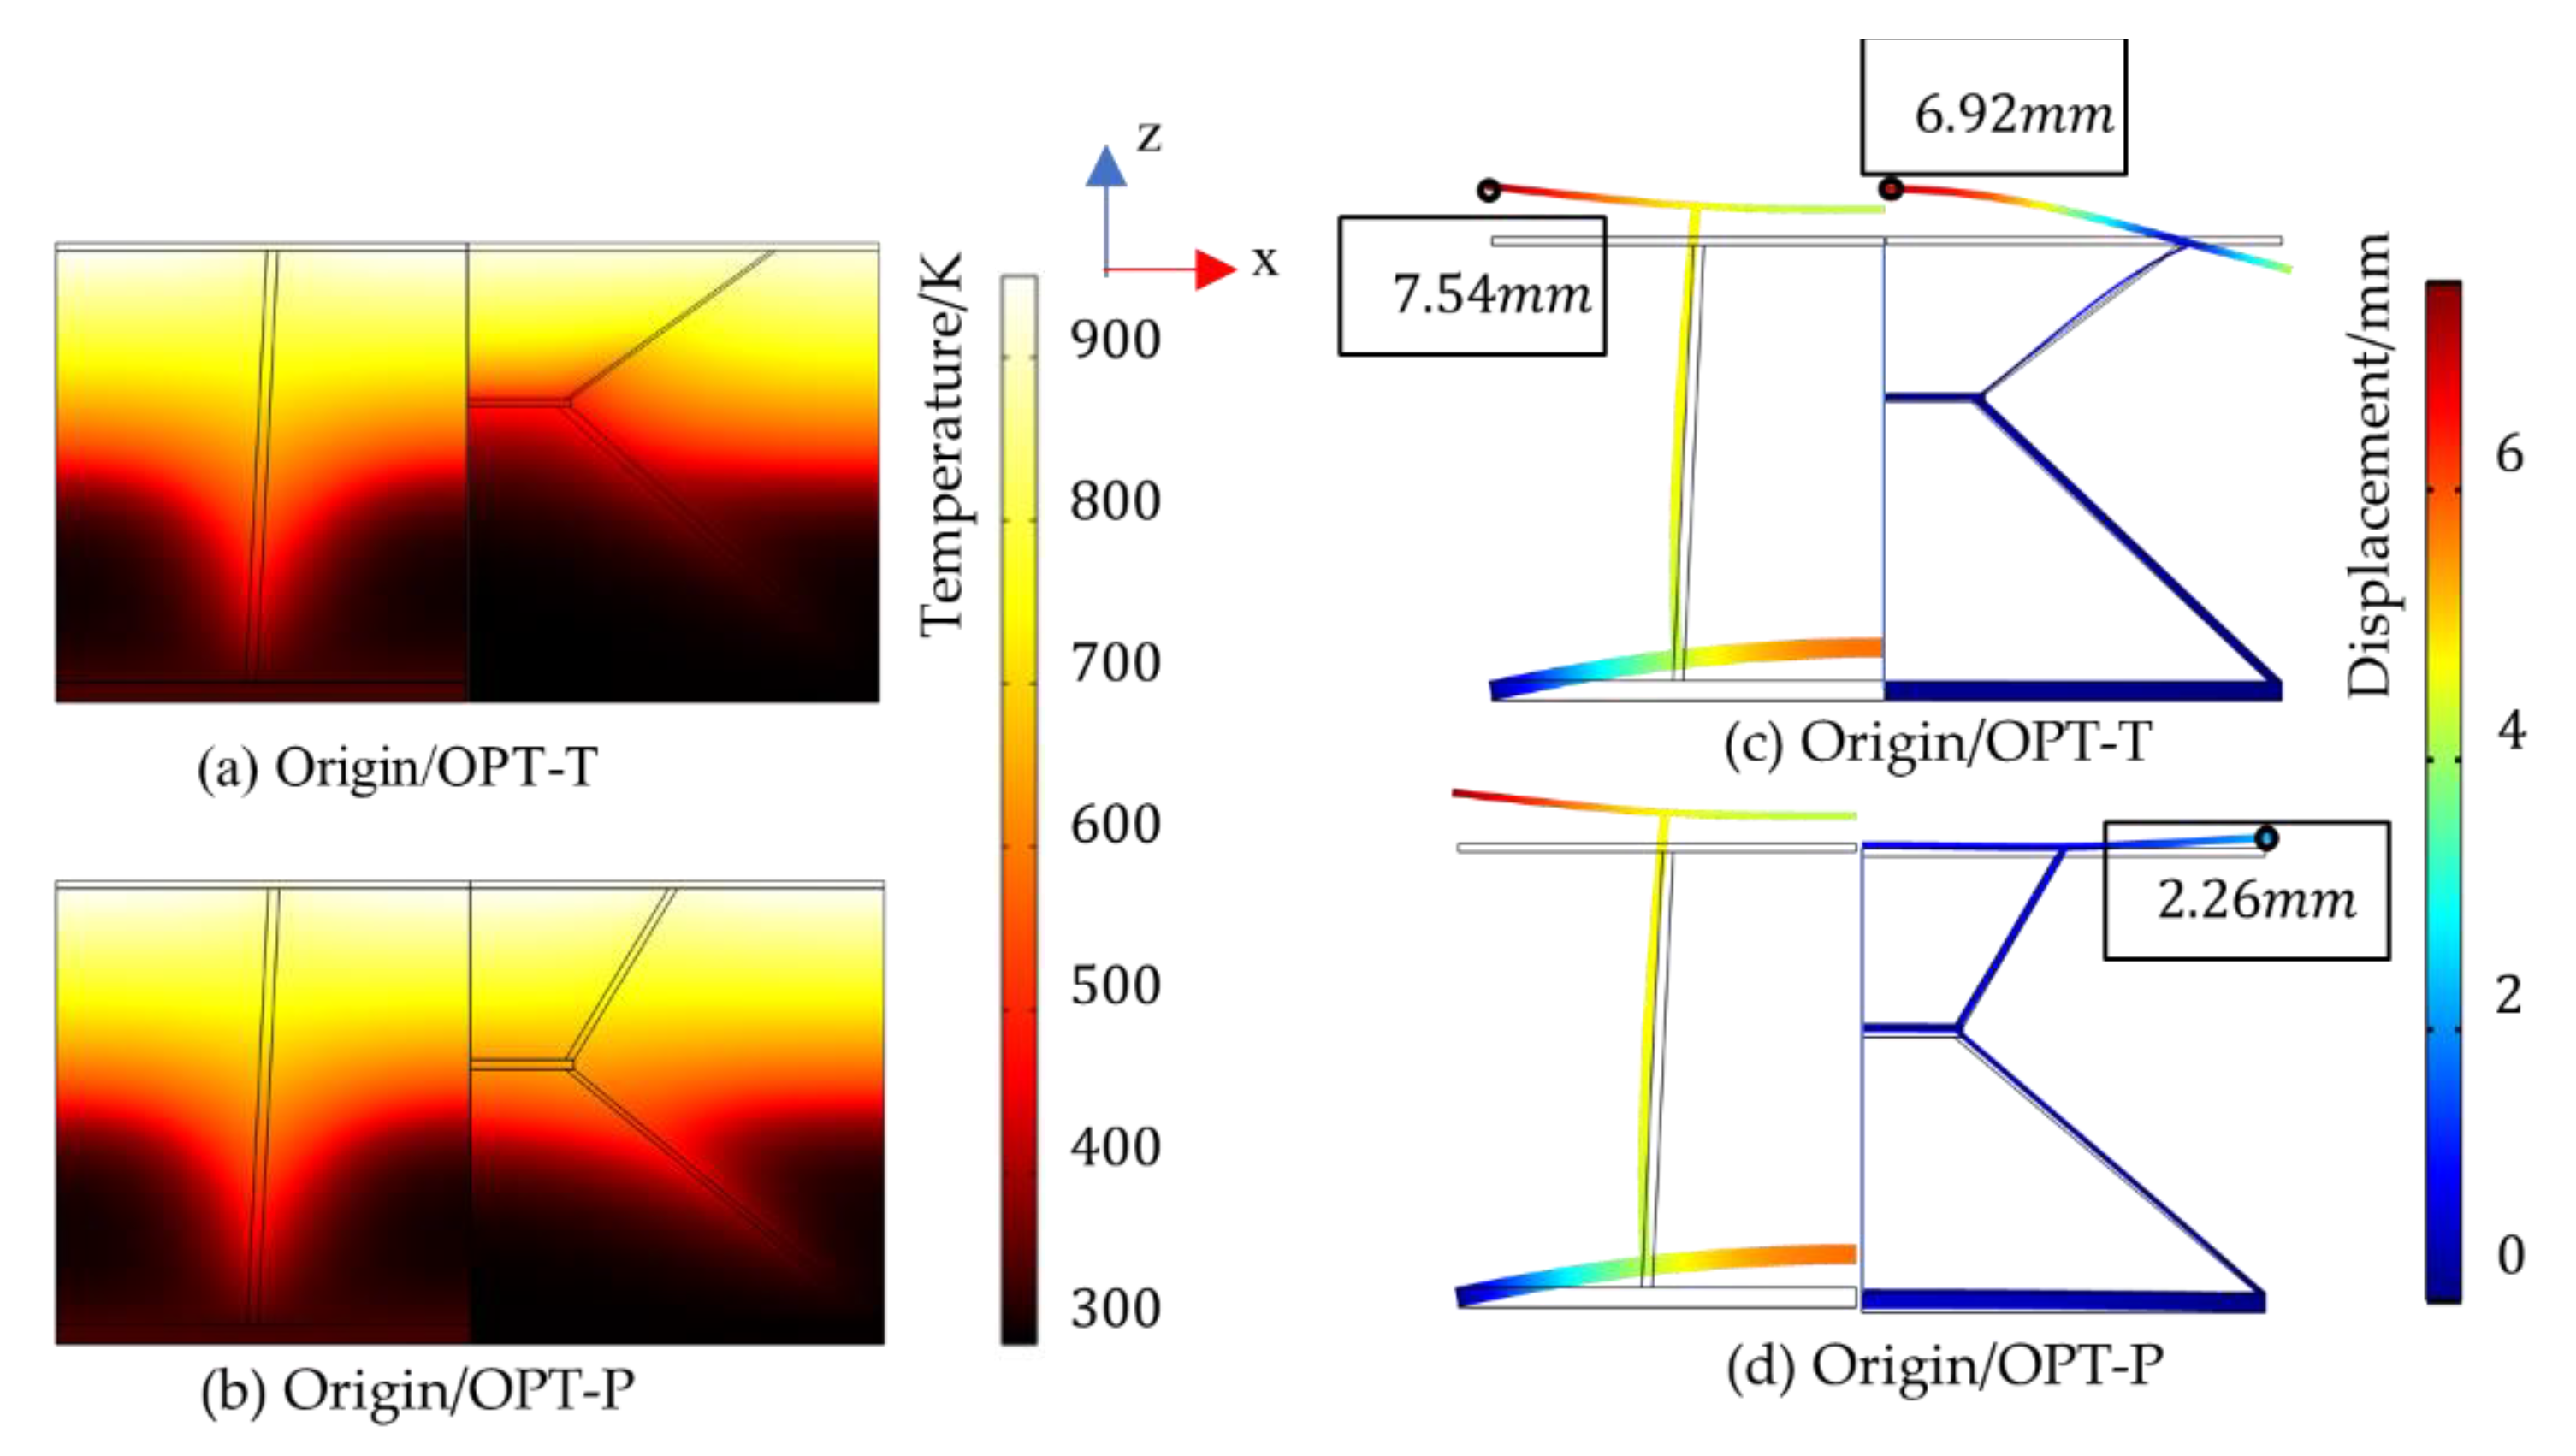
Figure 10. Temperature and displacement distributions for the original and optimized design are given and compared in
Figure 11.
Peak temperature of the TFS is always close to the equilibrium temperature which is determined by the emissivity of TFSs. Prior to the time of 2175 s, since radiation on the TFS is the only way for heat dissipation, temperatures on TFSs are approximately the same during this period. After time 2175 s, heat transfer boundary conditions are imposed on the TFS. By comparing temperature distribution of three designs in
Figure 10, it is possible to argue that more heat is absorbed by the upper materials in OPT-T. For this reason, heat in OPT-T can be transferred to the surroundings more rapidly than other designs and temperature of TFSs drops faster than others.
The maximum temperature of the BTS,
, reveals the severity of the thermal short effect. Webs with high conductivity are the main path for heat transfer and are the reason for thermal short effect. In the optimized design, the web material is redistributed, and more heat can be absorbed by the surrounding insulation materials. Consequently, the thermal short effect was alleviated as shown in
Figure 11. Although
of OPT-P is similar to the original design,
is still lower than that in the initial concept. The
of the original model is 439 K and of OPT-T and OPT-P is 345 K and 361 K, with the reduction of 21.4% and 11.8%, respectively.
Deformations were controlled by the coupled thermal and mechanical loads before the time of 2100 s. After 2100 s, pressure load on the outer surface of TFS gradually elevated and counterbalanced the pressure on the inner surface. Thus, along with the temperature decrease of the TFS, declines rapidly during the period around 2100 s to 2500 s. The main difference between the initial design and optimized designs lies in the interaction between TFSs and BFSs. The lower webs were connected to the end of BFSs, which is the fixed point in this problem, in the optimized design. In this case, deformations of TFSs would not lead to the deformation of BFSs, and vice versa. After time 2500 s, deformations were mainly controlled by thermal expansion. Deflections of the BFSs increased since kept increasing. Through the webs between the TFS and BFS, the TFS was pushed to deform during this period for the initial design. The of the initial model is 7.54 mm and of OPT-T and OPT-P is 6.92 mm and 2.26 mm, with the reduction of 8.2% and 70.0%, respectively.
Compared to the initial design, both optimized designs show better load carrying and insulating performance. The mass of OPT-T slightly increases by 3.8%, while OPT-P is lightened by 0.3%. Taken all factors into account, OPT-P was believed to be the optimal result for this problem.
4.2. Three-Dimensional Thermal Buckling Optimization
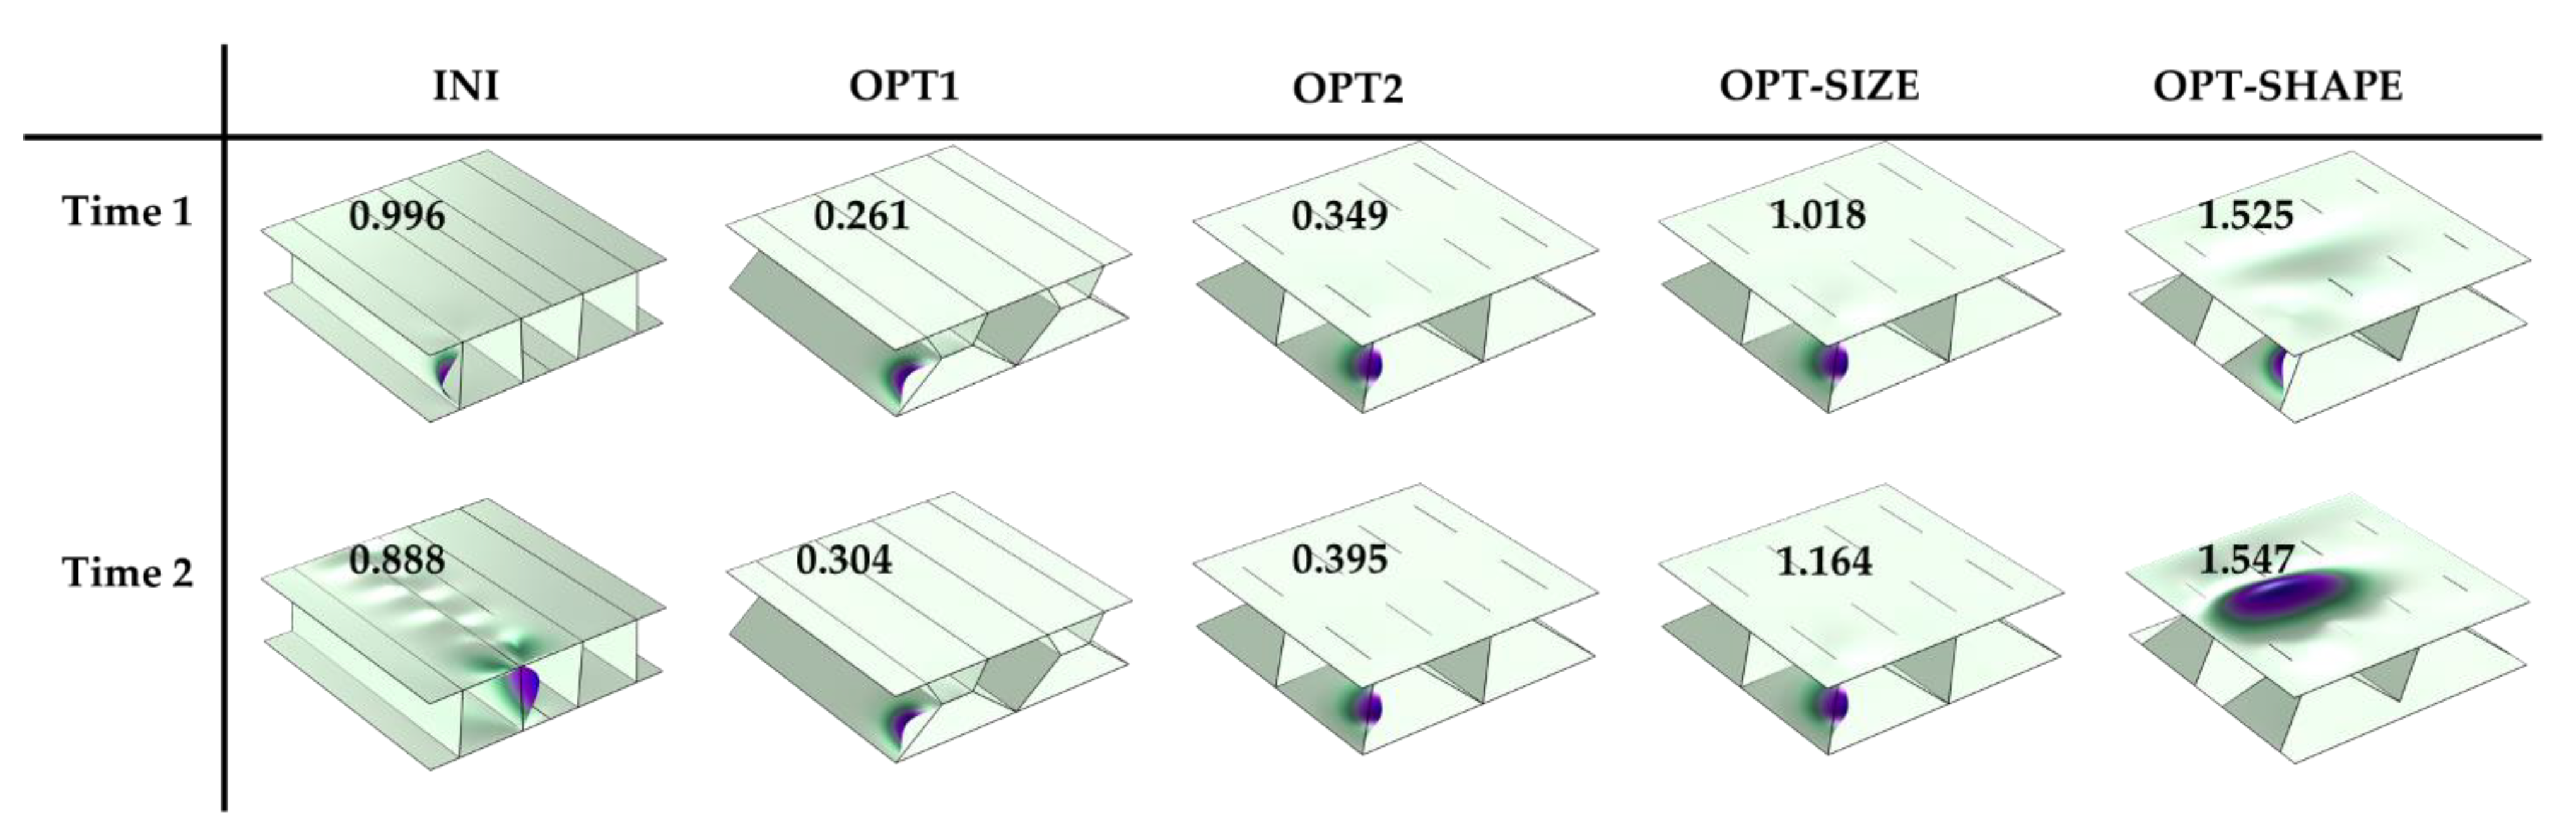
Thermal buckling analysis was conducted under two critical conditions separately in this study. The smallest eigenvalues and corresponding buckling modes of the initial design and proposed optimized structures are displayed in
Figure 12. Local buckling is the major design driver for the ITPS. Web buckles at both Time 1 and Time 2, which could affect the deflection of the TFS to a large extent. Focusing on the lower webs that buckled in OPT1 and OPT2, while the angle between the web and face sheet declines, the load-bearing capacity in
z-direction declines. Furthermore, compared to the original design, the thickness of the web in the optimized design was reduced. Consequently, the critical load factor values decreased.
It is still worth noticing that, as shown in
Figure 12, critical load of the ITPS increased when parts of the web material were removed. It is possible to argue that by appropriately distributing materials on the webs, the stress distribution could be optimized, and then the buckling characteristics could be improved. Therefore, two possible approaches were provided in this study to modify the ITPS structural performance. Geometric parameters for the optimized 3D configurations are listed in
Table 6, and the corresponding geometry is as shown in
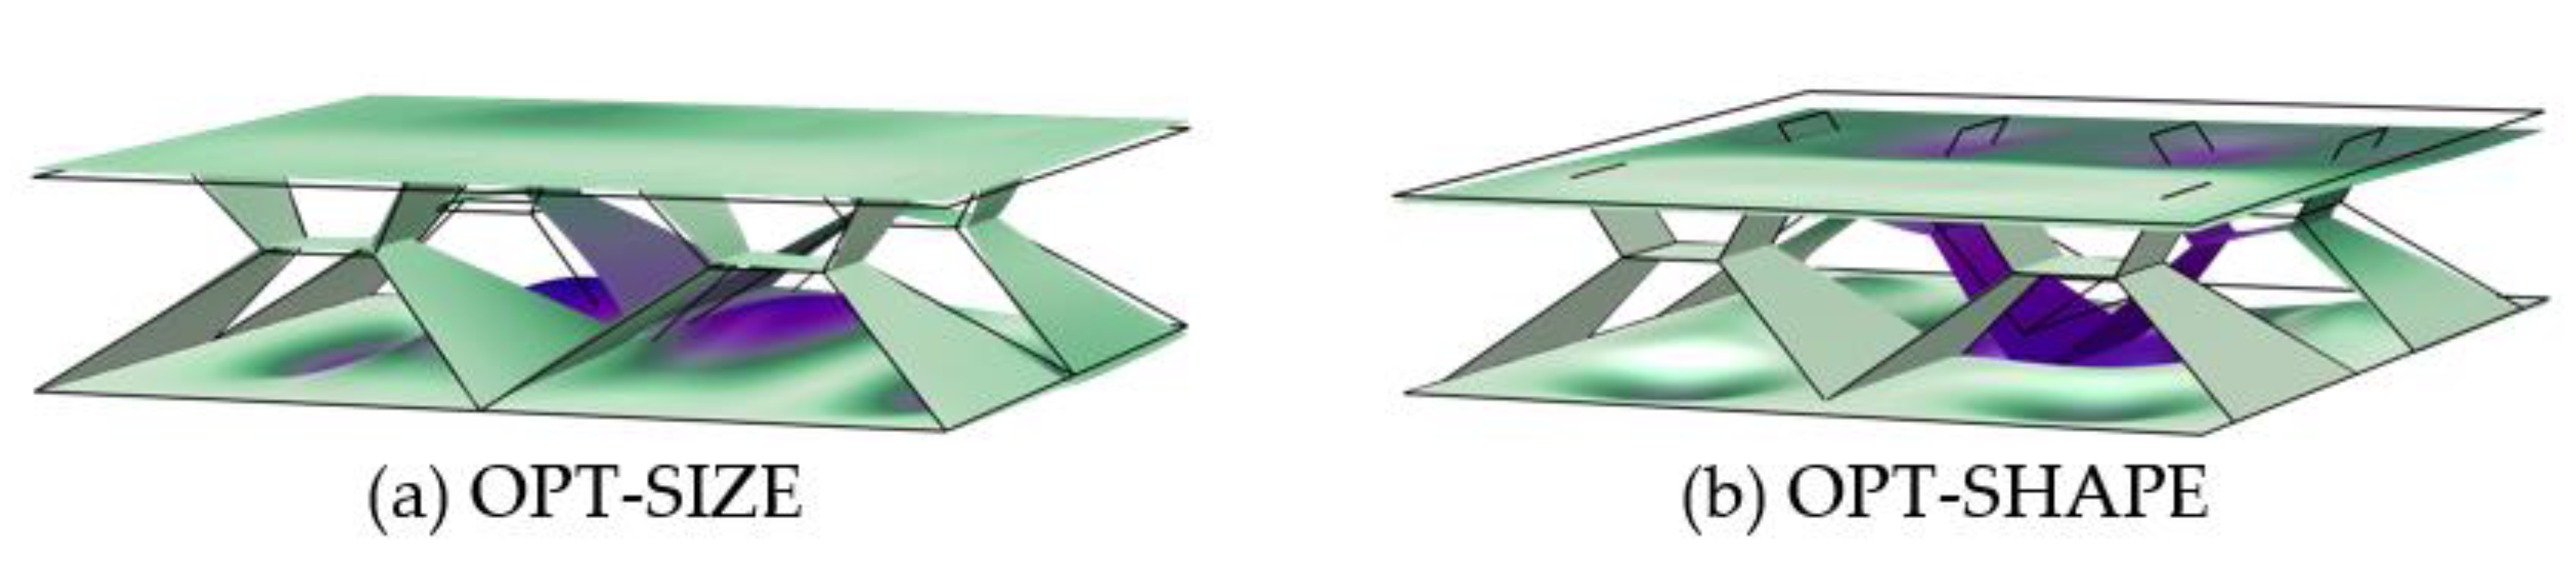
Figure 7. Results obtained from size optimization and shape optimization are denoted as OPT-SIZE and OPT-SHAPE, respectively.
The critical load factors for OPT-SIZE at Time 1 and Time 2 are 1.018 and 1.164, increased by 2.2% and 31.1%, respectively. For OPT-SHAPE, the critical load factors,
and
, are improved by 53.1% and 74.2%, respectively. This result indicates that shape optimization might be a better approach for strengthening the buckling capacity of the ITPS. On the other hand, the optimized webs may change the buckling mode of the members as depicted in
Figure 12. The buckling mode corresponding to the smallest eigenvalue for OPT-SHAPE at Time 2 shows that local buckling occurred at the top surface of the ITPS. Compared to the webs, the top face sheet of OPT-SHAPE is more sensitive to the buckling load, which is distinct from other structures. Thus, special attention was paid to the buckling analysis at Time 3 for two optimized structures to validate the reliability under that condition. Leaving out the buckling that occurred on the bottom surface, the smallest local buckling eigenvalue of OPT-SIZE and OPT-SHAPE is 1.490 and 1.348, respectively, as shown in
Figure 13. This value is slightly decreased compared to the initial design; nonetheless, it is still possible to suggest that the optimized structures fulfilled all design requirements as noted before.
4.3. Re-Analysis of Optimized Designs
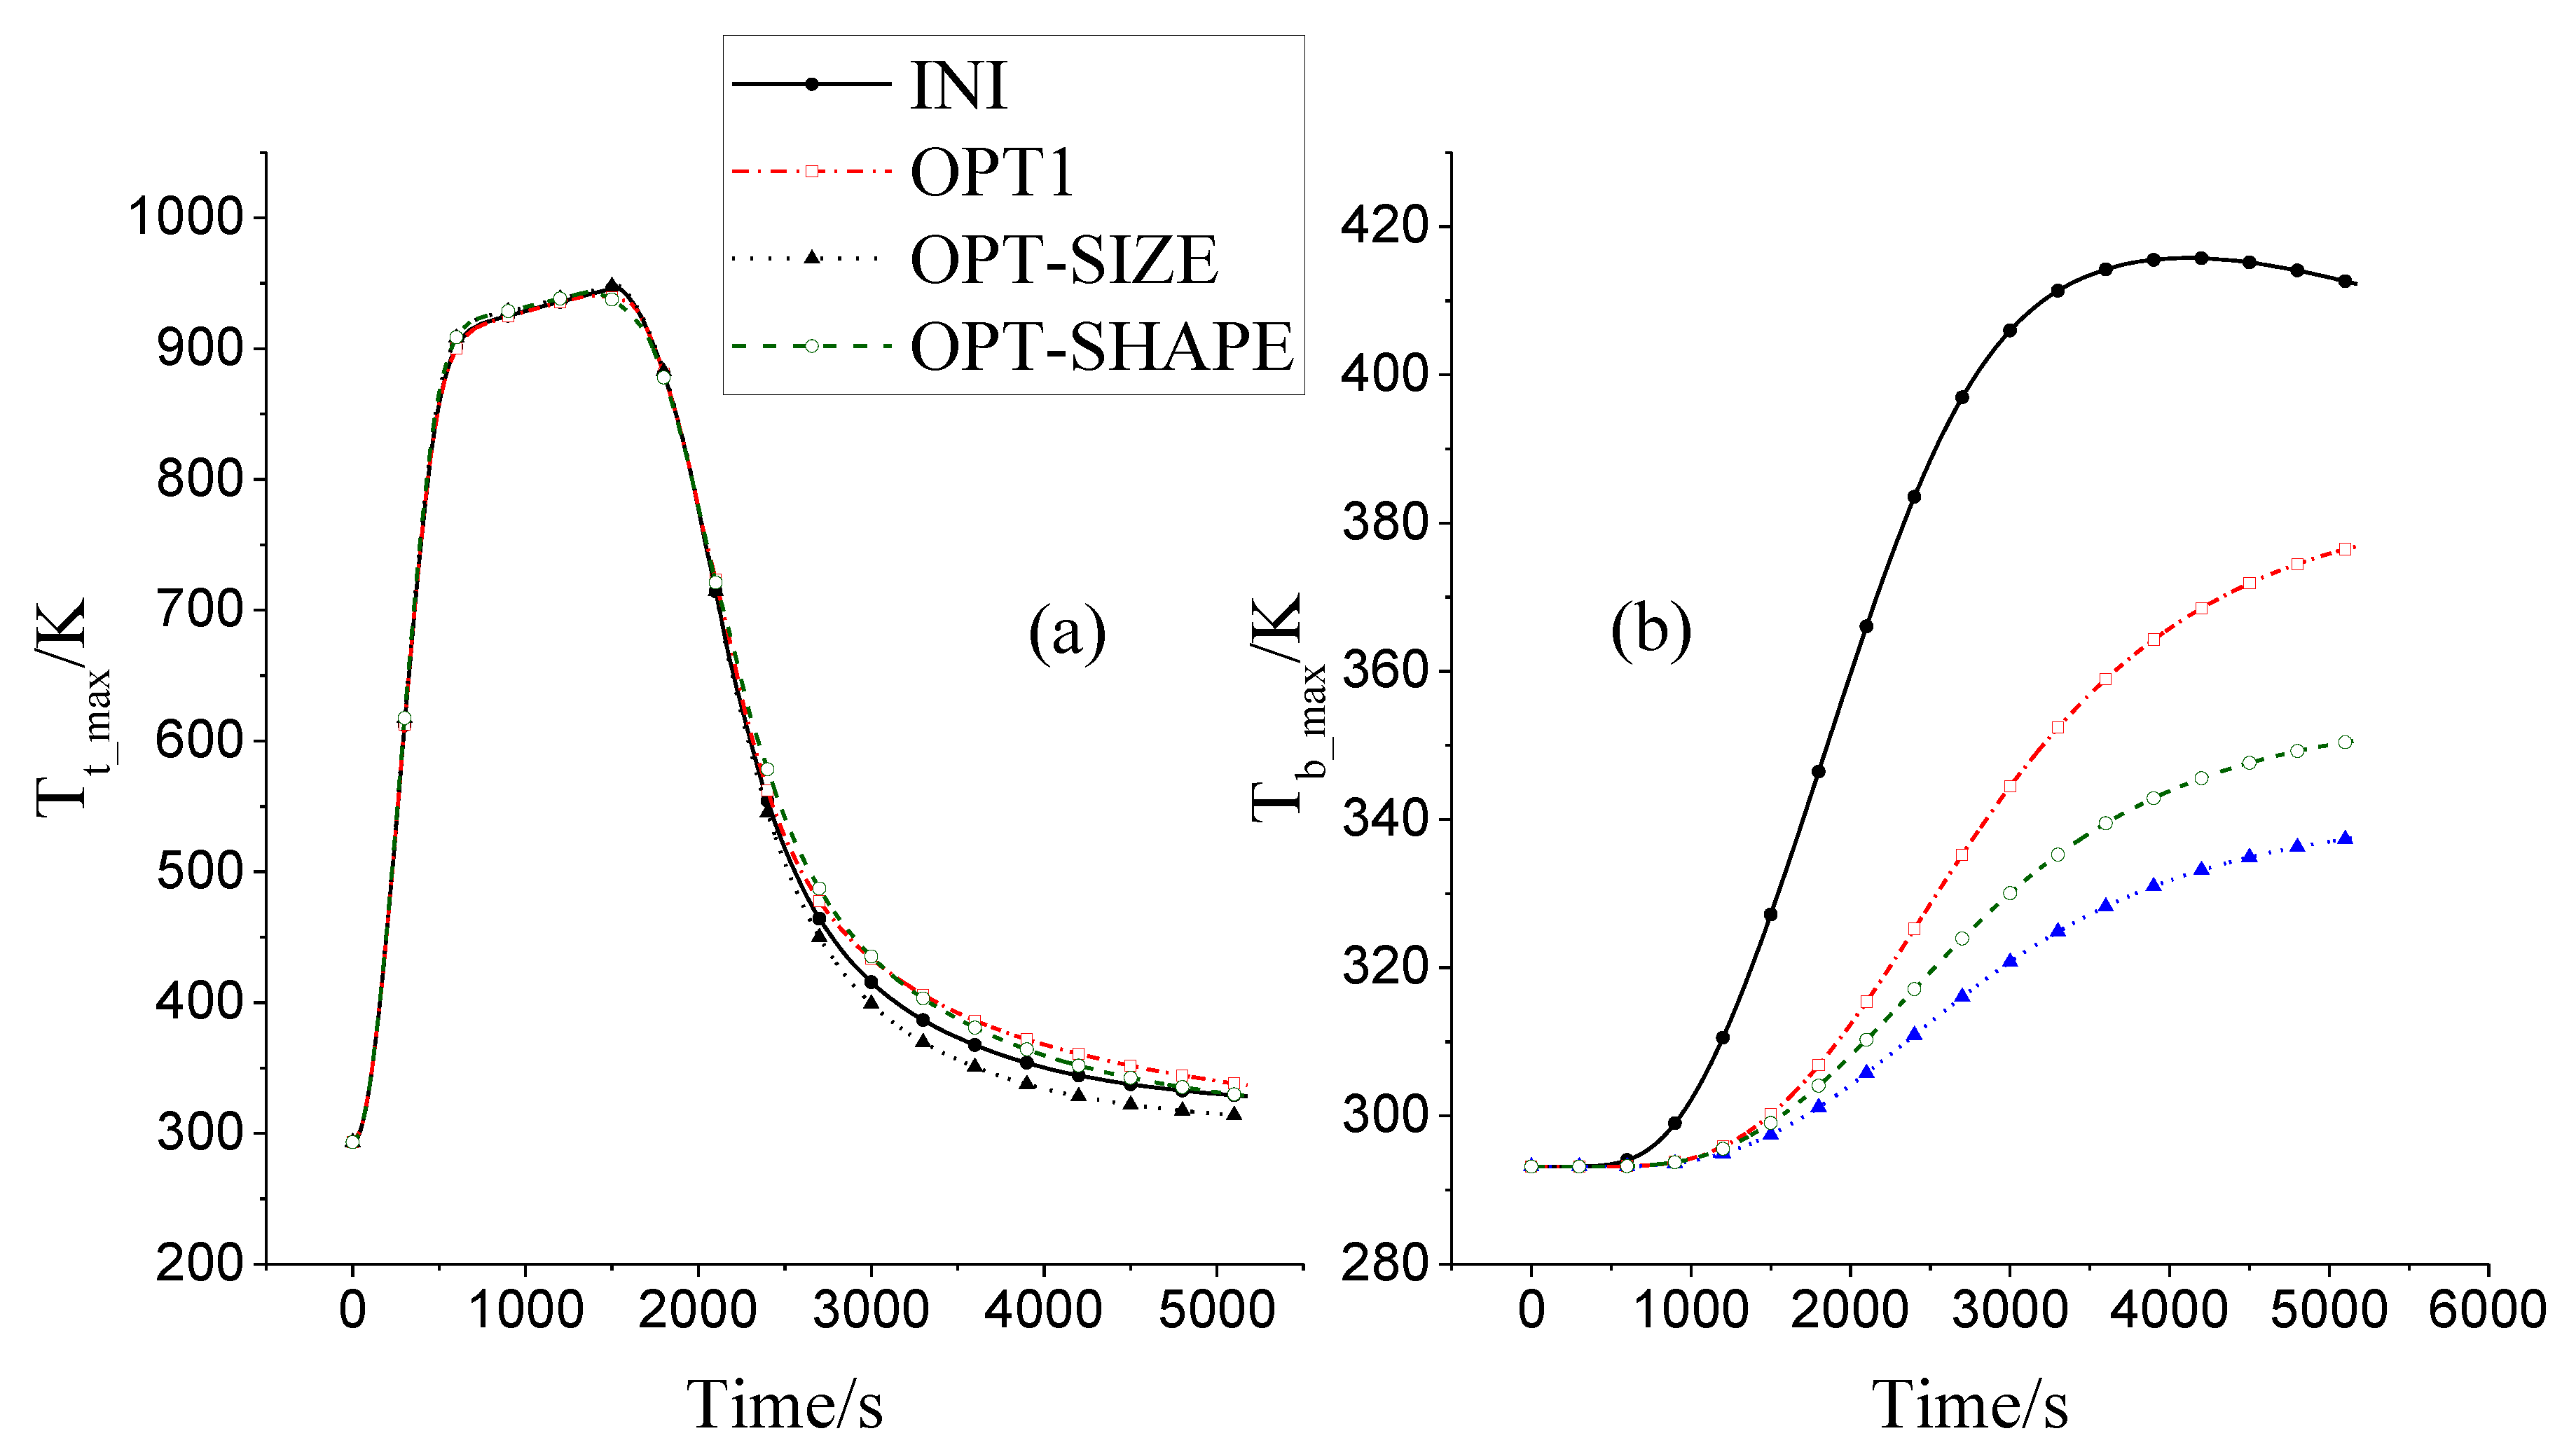
Detailed 3D solid models were built and analyzed to validate the structural responses of the optimized ITPSs. Maximum temperatures at TFSs (
) and BFSs (
) are extracted and plotted in
Figure 14.
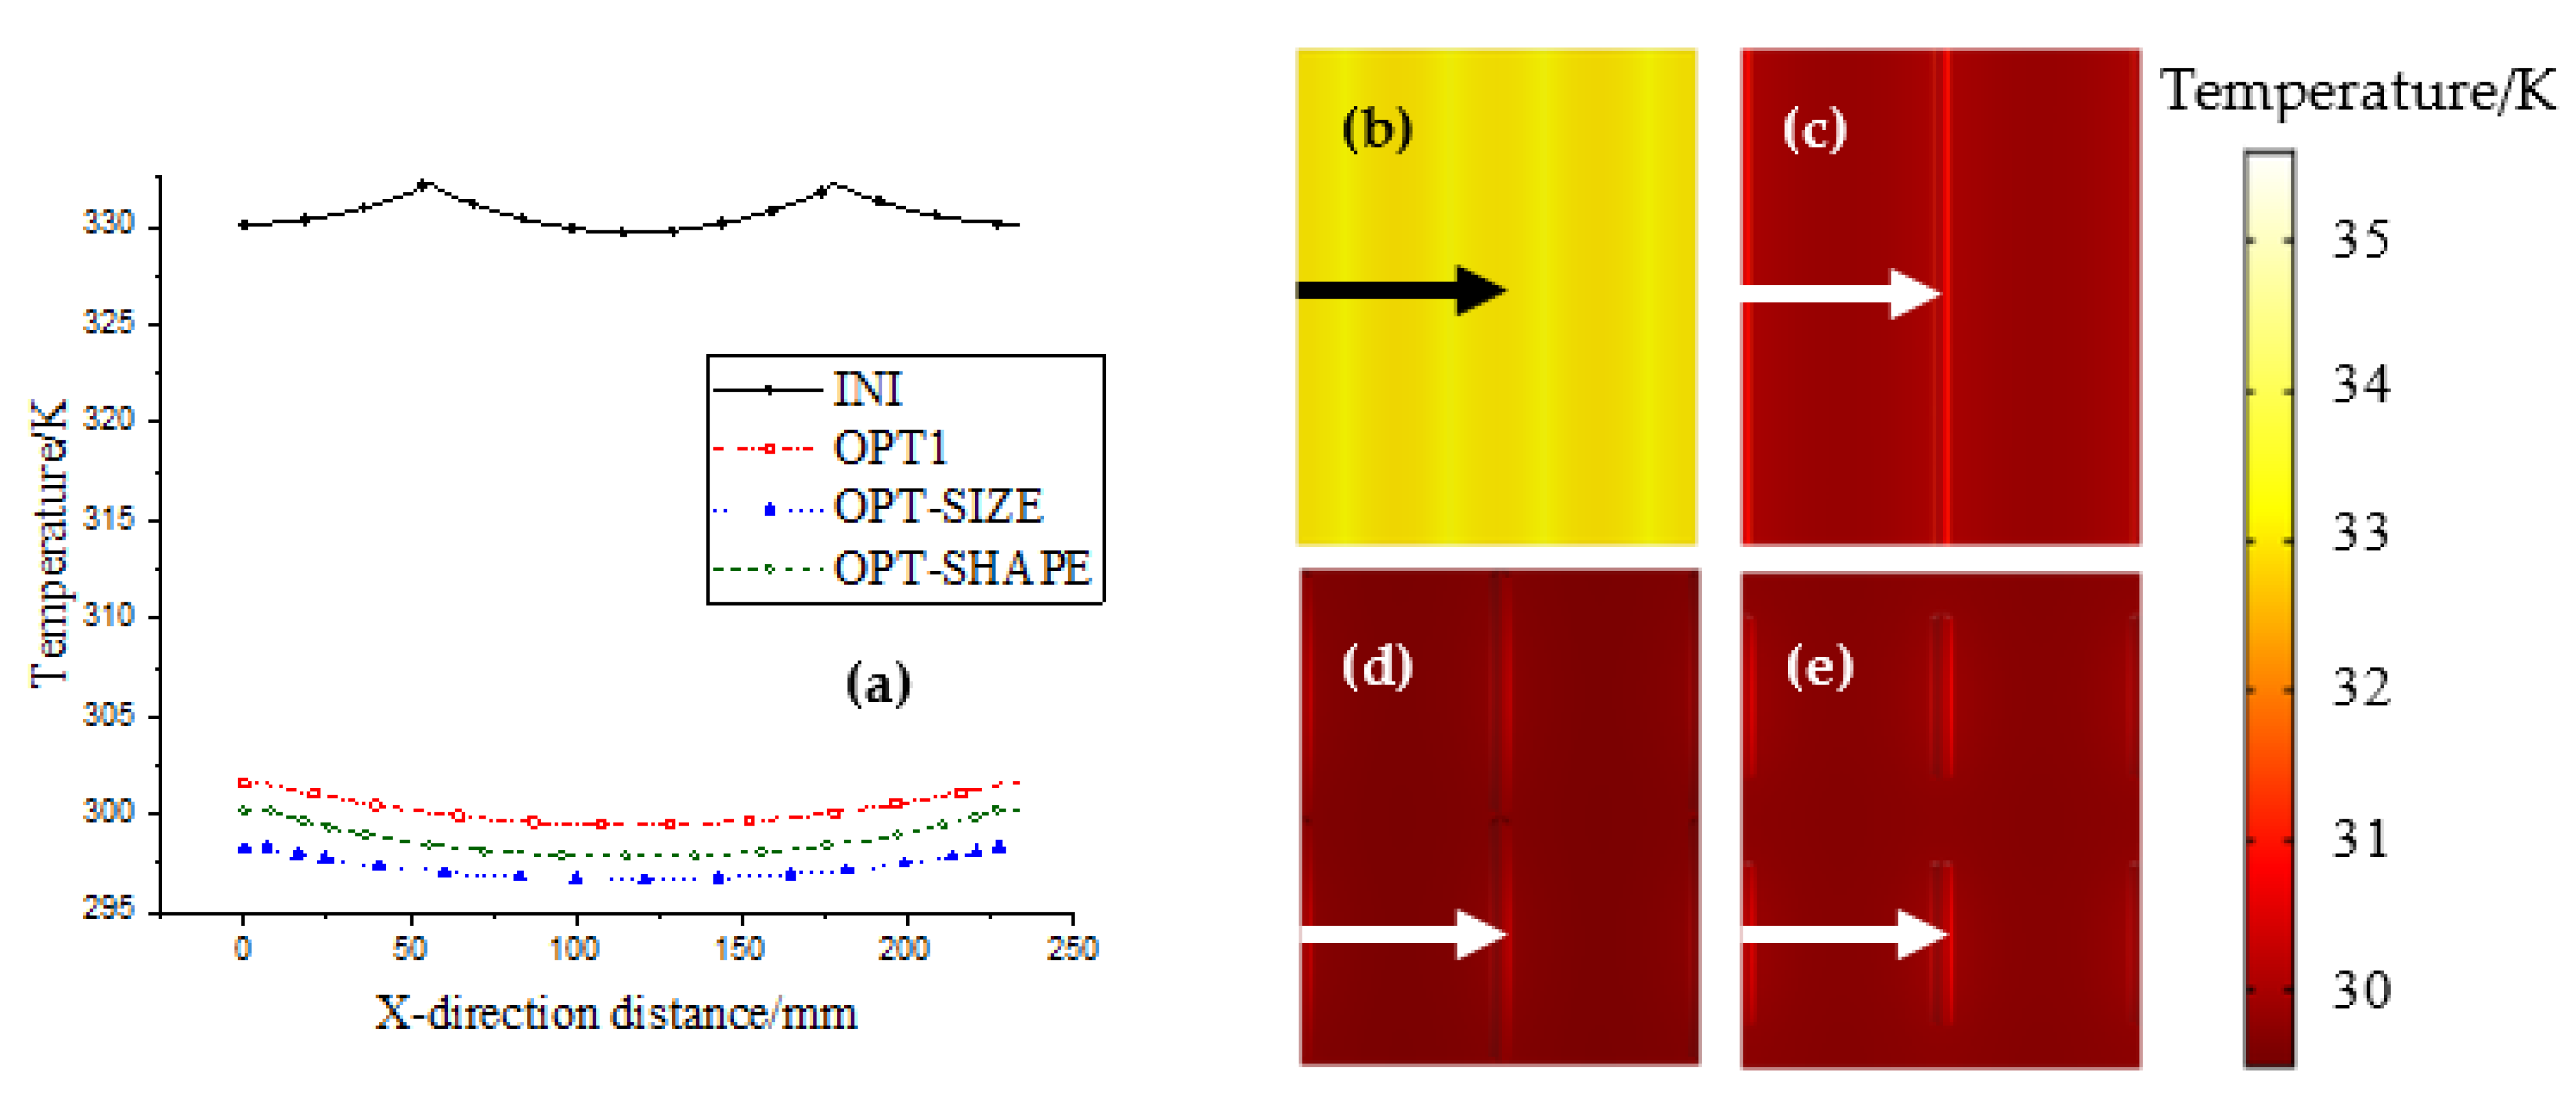
Figure 15 provides the temperature distribution along
x-directions on the bottom surfaces at Time 1 when the temperature of the TFS reaches maximum. The maximum temperature location can be indicated by the corresponding contour plots. It is obvious that in the optimized designs, more heat was absorbed by insulation materials and less heat was conducted to the bottom surface through webs. The maximum BFS temperature was reduced from 416 K to 377 K, 338 K and 351 K in OPT1, OPT-SIZE and OPT-SHAPE, respectively, illustrating that all the optimized designs have better insulation capacity than the initial design.
The maximum deformations of TFSs are plotted in
Figure 16. Trend of deformation approximately agreed with the TFS temperature, indicating that the deformation is mainly controlled by thermal expansion. As shown in the figure, for OPT-SIZE and OPT-SHAPE, the maximum deformation of the TFS was slightly increased by 0.16 mm and 1.2 mm, respectively, which is acceptable considering the overall height of the ITPS. Correspondingly, the maximum thermal stress was reduced from 1.08 GPa to 446.4 MPa and 420.1 MPa, respectively, indicating fewer thermal expansion effects in optimized designs.
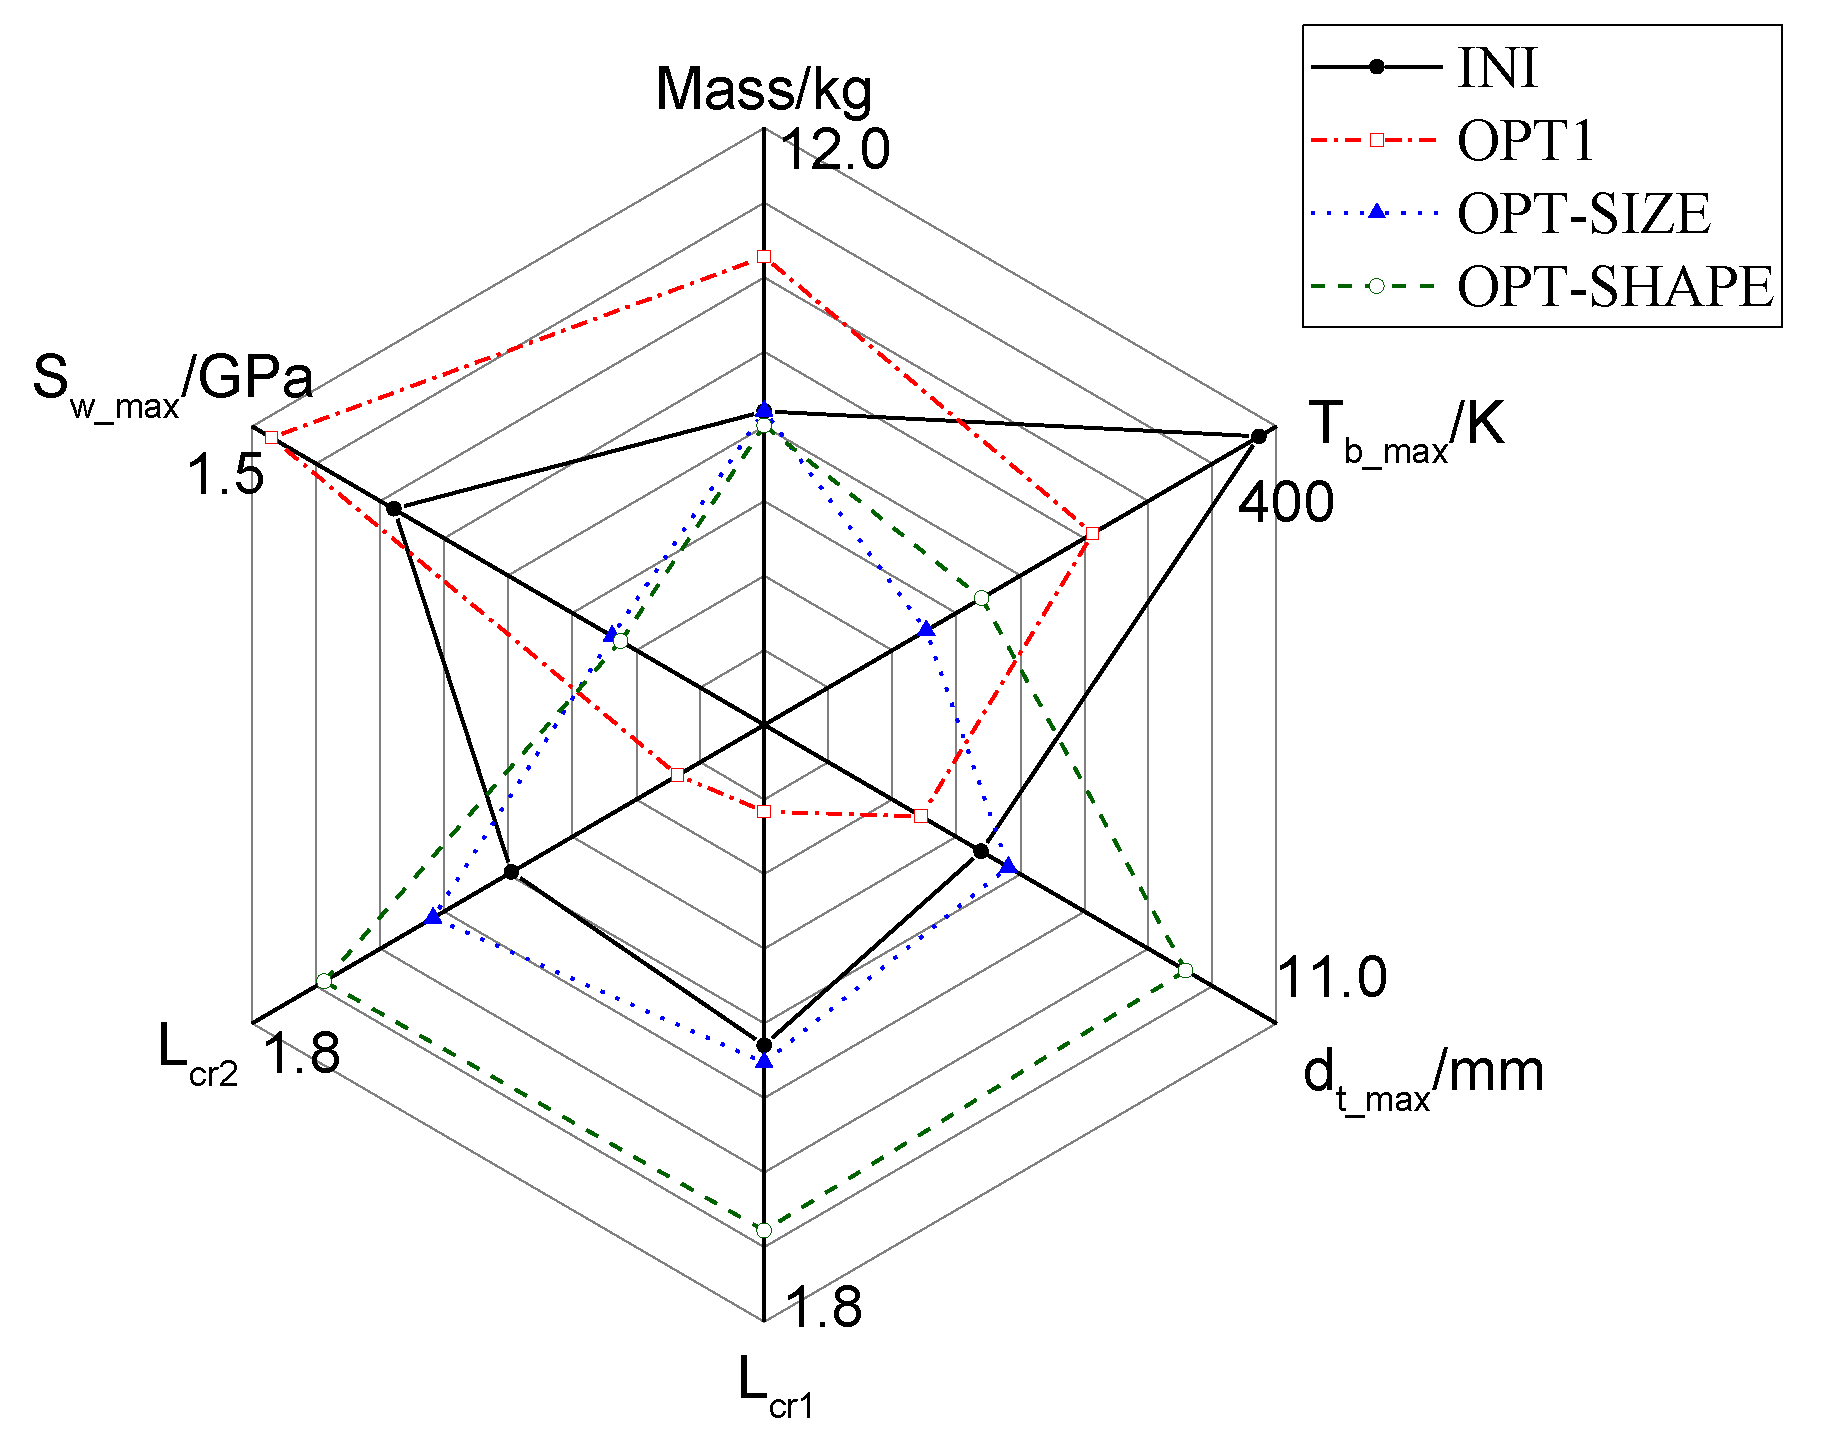
Figure 17 presents the comprehensive summary of the thermal and mechanical characteristics of the initial and optimized designs. OPT1 stands for the direct application of 2D optimized configuration in 3D structures. It shows better insulation performance, however, worse buckling resistance capacity. Both 3D optimized designs performed better in the thermal and mechanical responses, indicating that they are superior to the initial design.
5. Conclusions
This study presented an innovative integrated thermal protection structure based on optimization methods. By minimizing equivalent thermal conductivity and elastic strain energy of the core area, a topology optimization method was established and a brand new core configuration for unit-cell core was derived. Three-dimensional four-cell ITPS structures were then built on the basis of this new configuration. In order to control the buckling phenomenon induced by thermo-mechanical coupling loads, size and shape optimization was conducted. Three critical design factors, the maximum bottom surface temperature, the maximum top surface deformation and the smallest critical load factor, were studied in detail for both initial and optimized designs. Both optimized ITPSs show better thermal and structural performance without mass cost. The maximum bottom surface temperature drops from 416 K to 338 K and 351 K, with a reduction of 18.8% and 15.6%, respectively. Thermal short effect was alleviated due to the better usage of insulation materials. The maximum displacement of the top surface slightly increased from 9.27 mm to 9.43 mm and 10.47 mm, respectively. However, the buckling strength was greatly enhanced. The critical load factors for the initial design were lower than 1, while for both optimal designs were greater than 1. This result demonstrates that the optimized structures are more reliable under severe thermal conditions. The load-bearing capacity under aerodynamic pressure is improved due to better core stiffness. The weight of optimized designs remains almost the same as the initial design. The existence of material with medium density indicates the possibility of altering the material of upper webs, which could drastically decrease the weight. Additionally, it should be noted that the webs were very briefly optimized in this study, and it is still far from the best layout for 3D structures. For the purpose of reducing weight while maintaining the thermo-mechanical performance of ITPSs, more attention should be paid to the detailed optimization model of the webs in the progress of our further work. In the present work, the topology optimization method was validated to be an effective approach for ITPS design.


