Abstract
The aim of this study was to investigate the effects of rectus abdominis (RA) fatigue on the jumping performance and landing loads of volleyball players during countermovement jumps (CMJs) and spike jumps (SPJs). Twelve healthy university volleyball players were evaluated using a three-dimensional motion analysis system, force plates, and surface electromyography (EMG). The lowest center of mass (Min-CoM), maximum jumping height (Max-JH), angles of joints at take-off and landing, joint moment of the lower limbs, and EMG parameters of the RA, erector spinae, and lower limb muscles, when performing the CMJs and SPJs, were recorded before and after a 10 min RA muscle fatigue intervention. After RA fatigue, the Max-JH was significantly reduced, and the lowest Min-CoM was significantly increased. The take-off angles changed significantly at the ankle (SPJ), knee (CMJ), and hip (SPJ), and the plantar flexion torque changed significantly at the SPJ touchdown. The contribution ratio of the feet during SPJs and CMJs changed after fatigue. Temporary RA fatigue decreases the jump height of athletes and causes a change in the landing strategy.
1. Introduction
The main actions of volleyball players are jumping and moving. In a game, volleyball athletes need to jump more than 100 times [1]. The jumping height that they can achieve due to their height and bounce ability is an important factor in scoring [2,3]. The vertical jump test is frequently used as a performance assessment method for lower limbs and to evaluate the impulse generated by an athlete [4,5]. It has a positive relationship with the force-generation rate [6]. Therefore, in many studies, the countermovement jump (CMJ) has been chosen as an assessment tool for jumping performance [7,8]. In addition to performing a traditional vertical jump (CMJ or a squat jump), athletes perform spike jumps (SPJs) with two legs to accelerate their centers of mass (CoM). Past research has shown that during SPJs, athletes swing their arms down before jumping; this swing contributes 10% of the take-off velocity [9], which increases the vertical ground reaction force and additional impulse (the product of arm mass and swing speed) before the jump. Additionally, the change in arm position raises the CoM and increases the instantaneous speed when departing the ground [10].
The movement of a human body is a continuous chain process called a kinetic chain. The lumbar vertebrae and the lumbosacral area are the turning points of the upper and lower segments of the body; they bear the weight of the body and transmit strength to the lower limbs [11]. The abdominal muscles are located in front of the lumbosacral area and include the rectus abdominis (RA), internal oblique, external oblique, and transverse abdominis muscles. Strong abdominal muscles are important for maintaining stability during intense or rapid movements. Research has shown that before the lower limbs move to produce force, the transverse abdominis and multifidus muscles contract to help stabilize the spine and assist the lower limbs in producing strength during movements [12]. The RA is a stabilizing muscle group on the surface. It mainly allows the spine to produce large movements, such as trunk flexion, rather than stabilizing a single vertebral joint [13]. Sadeghi et al. [14] reported that after eight weeks of core-muscle training, athletes achieved improvement in dynamic-balance ability and that the core muscle group affected the transmission of limb strength. When athletes perform shoulder movements, both the RA and the external oblique muscles are activated simultaneously to complete the action, thereby affecting the load; this activation has the potential to decrease excessive forces on the lower limbs when landing after a jump [14,15].
Muscle fatigue refers to a decrease in the ability of the neuromuscular system to produce strength [16,17]. In previous studies, different methods were used to determine whether the muscles had reached a fatigue state [18,19,20,21]. One method involved using electromyography (EMG) on repeated movements performed with the same intensity, wherein a decrease in the median frequency (MDF) and an increase in the mean amplitude (AMP) of the myoelectric signal showed a fatigue state [20]. Other studies determined fatigue when the output of a muscle decreased to 50% of its maximum strength [18,19,21]. When muscle fatigue occurs, both the ability to control movement [21,22] and the muscle activation ability [19] decrease. The ability to control muscles also decreases, with the greatest influence on maximum muscle strength, muscle power, and speed of movement [23]. When athletes experience abdominal muscle fatigue during competition or training, they are unable to transmit strength to the limbs steadily; this affects the stability of the core muscles and changes the movement style, which may increase the incidence of sports injuries [24]. Previous studies have reported that core-muscle training or abdominal-muscle training can effectively increase athletes’ balance of movement or stabilize their limb strength [12,14,15,25]. However, the effects of abdominal muscle fatigue on lower limb jumping performance and landing load in volleyball players remain unknown. In the current study, RA, a global abdominal stabilizer located in the superficial abdomen, was selected to study this effect. It is hypothesized that, when taking off after fatigue, first, the angle of hip, knee flexion, and ankle dorsiflexion are significantly different for CMJs and SPJs. Second, the maximum jumping height (Max-JH) significantly decreases for both types of jumps (CMJ and SPJ) following fatigue. Third, during the CMJ and SPJ touchdown, the sagittal joint torque of the lower limbs increases after RA fatigue. Fourth, the activation degree of the rectus abdominis muscle decreases, and the activation degree of the lower extremity muscle groups increases.
2. Materials and Methods
2.1. Sample Size Determination and Participants
For the measurement of Max-JH, the minimum number of participants required to achieve an effect size of 1.2, a power of 0.8, and an alpha level of 0.05 was calculated, using G*power 3.1, to be eight. To overcome a predicted dropout of at least half of these, the anticipated sample size was increased to 12 participants.
Twelve healthy male volleyball players (university division I) participated in this study. The average age, playing experience, height, and weight were 19 ± 0.8 years, 9.75 ± 1.7 years, 183 ± 6.0 cm, and 75.5 ± 8.4 kg, respectively. The dominant hand was the right in eight participants and the left in four. All participants were assessed to ensure that they had no abdominal or back disorders and that they had not suffered any major injuries of the lower limbs in the six months preceding the commencement of this study. All participants were informed of the purpose of the study, the procedures, and their rights before obtaining their written consent, in accordance with the Declaration of Helsinki.
2.2. Equipment
The kinematic data were collected using a three-dimensional motion analysis system (T20S, VICON, Oxford, UK). This system is composed of eight infrared high-speed cameras with a capture frequency of 300 Hz, two 3-axis force plates with an area of 90 × 60 cm2 (9287, Kistler, Chennai, India; 5507, AMTI, Watertown, MA, USA), two 3-axis force plates with an area of 60 × 40 cm2 (9281, Kistler, Chennai, India), and four amplifiers to measure joint moments and ground reaction forces. The measurement frequency of the four 3-axis force plates was 1500 Hz. The muscle activation status was collected at a sampling rate of 1500 Hz using a wireless electromyography system (2400-G2, Noraxon, Scottsdale, AZ, USA), as described in the following subsection. The experimental setup is illustrated in Figure 1a.
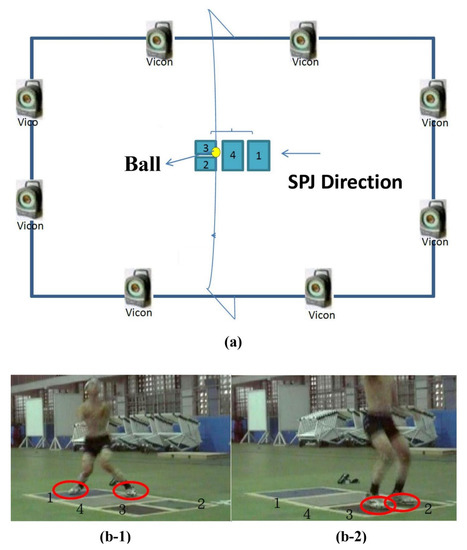
Figure 1.
(a) The experimental set-up of spike jump; (b-1) take-off and (b-2) touchdown during spike jump.
2.3. Experimental Procedure
At the beginning of the study, 51 reflective spherical markers were adhered to the participants’ anatomical landmarks based on the Plug-in-Gait marker setting (VICON, UK) for full-body models [26]. After 10 min of warm-up, the body hairs over the RA, erector spinae (ES), rectus femoris (RF), biceps femoris (BF), tibialis anterior (TA), and gastrocnemius (GN) muscles of each athlete were removed, and the surface electrodes were adhered to the skin in the area of these muscles to record maximal voluntary isometric contraction (MVIC) values for each muscle group [27,28,29]. The electrodes were positioned as suggested by Konrad [30]. Subsequently, three sessions of pre-test data for successful CMJs and SPJs were collected. The jumping conditions (CMJ and SPJ) were randomized by drawing lots. To achieve RA fatigue, the participants first laid flat on the ground, lifted their thighs 90 degrees to the torso, and placed their feet on a chair. Then, they raised their shoulders by approximately 10 cm, 50 times, at a rate of 45 repetitions per minute (rpm). This procedure was repeated thrice, with 30 s rest intervals, to induce abdominal fatigue. The abdominal fatigue was assessed through EMG signals. Then, post-test data for three trials of successful CMJs and SPJs were collected (kinematic, kinetic, and EMG data).
The required actions for the CMJ and SPJ are described as follows.
A successful CMJ test required both feet to be on the 1st force plate when taking off and on the 4th force plate on touchdown.
For the SPJ, the participants began from the starting line and could take a two-step approach. They had one foot each on the 1st and 4th force plates. Then, they took off vertically with their hands swinging forward to attempt a spike. On touchdown, they had one foot each on the 2nd and 3rd force plates (Figure 1b). In this study, one leg was the braking leg and the other was the jumping leg, which is characteristic of the SPJ. During the two-step approach, the braking leg made the first step in the SPJ (the dominant leg), and the jumping leg made the second step (non-dominant leg).
2.4. Data Processing
The kinematics and kinetic data were analyzed using the Visual3D software (C-Motion, Rockville, MD, USA). A Butterworth 4th order zero-phase-shift filter was used to smooth the reflective sphere trajectory and ground reaction force data. The noise was filtered using a 10 Hz low-pass filter [31]. Reflective markers were used to establish the lower limb segment and to determine the instantaneous joint angles (hip, knee, and ankle) during take-off and touchdown. The minimum position of the CoM, and the maximum jump height (the highest point reached by the CoM minus the height of the CoM when the participant stood naturally) were also calculated. The lower limb joint angle of 0° was defined as the position when the participants were in a neutral standing posture.
“Instantaneous take-off angles of lower limb joints” are the angles of each joint at the moment when the foot leaves the ground during take-off.
“Instantaneous touchdown angles of lower limb joints” are the angles of the joints at the end of the vacancy period, when any foot touches the ground and enters the ground period.
The kinetic data represent the joint moment at landing. In the landing period, when both feet stepped on the force plates and the ground reaction force reached the first peak, the instantaneous moments of all joints were calculated by inverse dynamics using Visual3D. Considering the weight differences between the participants, these values were normalized by personal weight in Newton-meter/kg (N·m/kg). In addition, the ground reaction forces from the 1st and 4th force plates were divided by the total ground reaction force to calculate the contribution of the braking leg and the jumping leg at landing.
The wireless EMG system was used to collect the muscle signals of 12 muscles, including the bilateral RA, ES, RF, BF, and TA and the medial GN, at a frequency of 1500 Hz. The signals were band pass filtered at 10–500 Hz and smoothed using the root mean square [27]. The trend of AMP and MDF with time for each participant was calculated by linear regression to confirm the RA fatigue state [32]. In addition, normalization of the average amplitude of the MVIC was used to observe the degree of muscle activation during the take-off and touchdown stages.
2.5. Statistical Analysis
The statistical package for the social sciences (SPSS) version 20.0 software (IBM Corp., Armonk, NY, USA) was used to perform the various statistical analyses. The Shapiro–Wilk test was performed to examine normality for all outcome variables. All continuous variables were approximately normally distributed, except for some EMG data. Paired sample t-tests were used to compare differences in CMJ and SPJ parameters before and after RA fatigue. The parameters included the lowest point of the CoM, the Max-JH, the angles of each joint at take-off and touchdown in the sagittal plane, the sagittal moment of the joints of the lower limbs, the contribution of the braking leg/jumping leg, and the standardized EMG amplitudes (for RA, ES, RF, BF, TA, and GN). We also calculated mean values, standard deviations, and confidence intervals. The significance level was set at α = 0.05.
3. Results
Each participant in this experiment completed the post-test measurement of the CMJs and SPJs within 30 min (14.6 ± 4.3 min).
3.1. Rectus Abdominis Muscle Fatigue
The decrease in MDF and increase in AMP demonstrated the effects of RA fatigue [20,33], as shown in Figure 2.
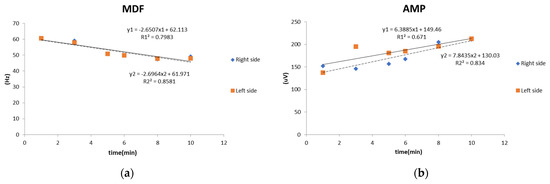
Figure 2.
EMG parameters of rectus abdominis muscle during rectus abdominis muscle fatigue involvement: (a) MDF (median frequency); (b) AMP (mean amplitude).
3.2. The Lowest Point of the CoM (Min-CoM)
After RA muscle fatigue, the positions of the Min-CoM during both the CMJ and the SPJ were significantly higher than they were before the abdominal muscle fatigue (Table 1).

Table 1.
The lowest point of the CoM (Min-CoM) and the maximum jump height (Max-JH).
3.3. The Maximum Jump Height
For both the CMJ and the SPJ, the Max-JH after fatigue was significantly lower than that before fatigue (Table 1).
3.4. Instantaneous Take-off and Touchdown Angles of Lower Limb Joints
After the RA fatigue, the instantaneous take-off angles of the knee joints of the braking and jumping legs were significantly reduced during CMJs, and the degrees of the other joints showed no significant difference compared to the pre-test values. During the SPJ, after the RA fatigue, the dorsiflexion angle of the ankle joint of the braking leg significantly increased, the angle of the hip joint of the braking leg significantly decreased, and there was no significant difference in the other joint angles. There was no significant difference in the instantaneous touchdown angles of the joints before and after RA muscle fatigue in either of the jumps (Table 2).
Table 2.
The angles of joints at take-off and touchdown (°).
3.5. Lower Limb Joint Moment at Landing
During both jumps, the ankle joint of the braking leg showed no differences between the moments before and after the RA fatigue. Likewise, during the CMJ, the ankle joint of the jumping leg showed no differences in the joint moments before and after the RA fatigue. However, during the SPJ, after fatigue, the moment of the ankle joint of the jumping leg decreased (p < 0.05). For both jumps, the knee and hip joints of the braking and jumping legs showed no differences in the moments before and after RA fatigue (Table 3).
Table 3.
Joint moments at touchdown (Nm/kgw).
3.6. Contribution of Each Leg at Landing
Before the RA fatigue, during the CMJ, the contributions of both legs were similar (braking leg:jumping leg = 49:51); however, after the fatigue, the braking leg contributed more (56:44). This was more evident during the SPJ, where before the fatigue, the landing was supported primarily by the jumping leg (30:70), and after the fatigue, it was supported mostly by the braking leg (56:44).
3.7. The Degree of Muscle Activation during Take-Off and Touchdown
During take-off, the degrees of activation of the RA on both the braking and the jumping sides were significantly reduced after the fatigue (p < 0.05). The degree of activation of the ES increased, although not significantly. The degrees of activation of the RF, BF, TA, and GN on the braking and jumping sides showed no differences before and after muscle fatigue (Table 4).
Table 4.
Muscle activation during take-off (%MVIC).
At landing, the degrees of activation of the RA and ES on the braking and jumping sides decreased insignificantly. In the lower limbs, only at landing during the CMJ, the RA, RF, and TA muscles showed lower degrees of activation. At landing for the SPJ, the activation degree of the BF for the jumping leg decreased. There was no difference in the degree of activation of the other muscles before and after the RA fatigue (Table 5).
Table 5.
Muscle activation at touchdown (%).
4. Discussion
In this study, the RA muscle fatigue was a result of the concentric eccentric contraction exercise of the RA muscle. Therefore, the decrease in MDF and the increase in AMP can represent the muscle fatigue response [20,33]. The fatigue involved in this exercise can return to baseline within 30–60 min [32]. Our study was based on this premise. During the post-test, the fatigue of the RA muscles did not return to baseline. The main purpose of this study was to determine the effects of fatigue on kinematics, kinetics, and EMG parameters in volleyball athletes. After RA fatigue, the dorsiflexion angle of the ankle joint of the braking leg during SPJs increased significantly, and the hip joint angle decreased significantly. During CMJs, the angles of the knee joints of both legs significantly decreased, the amplitude of the squat was reduced, and the body was more upright, causing the CoM to not fall below the ideal lower point. We also found that the lowest positions of the CoM in both the CMJ and SPJ significantly increased after the RA fatigue. This showed that the athletes may not be able to squat to the expected lowest CoM position during the reverse movement phase to accumulate elastic energy, which may cause an inability to provide additional energy for muscle contraction during take-off. A previous study reported that when the athletes started to take off after fatigue, the transformation of gravitational potential energy decreased; thus, they could not reach the maximum jump height [34]. This corresponds with our finding of significantly reduced maximum jump heights.
After fatigue, during CMJs, the athletes had a significant decrease in the knee joint angle at take-off, which means that they used stiff motions to take off [35] and that they reduced knee flexion to complete the jump action. During the SPJ, there were no significant differences in the joint angles of the jumping leg. Additionally, during both SPJs and CMJs, after RA fatigue, there was a significant decrease in the activation of the RA, and there was no significant change in the myoelectric signals of the ES and lower extremity muscles; thus, there was no improvement in the degree of activation of the muscle groups of the lower limbs. The RA is considered to be a globally stabilizing muscle group. Its main function is to generate a large moment to balance the impact of external forces [13]. The take-off is an active movement, and the abdomen does not bear a large external force. Therefore, it may be directly affected by fatigue exercise, which reduces the activation of the RA. However, other muscles that were not affected by the fatigue exercise didn’t exhibit significant changes. During the SPJ, after the RA fatigue, when the athlete landed, the plantar-flexor moments of the ankle joint of the jumping leg were significantly reduced. A previous study showed that, at landing, the largest angle of plantar flexion demonstrated the greatest shock absorption [36]. Our results showed that after RA fatigue, the ankle joint moment may be reduced due to the decrease in jump height, resulting in the landing strategy of the ankle reducing the plantar flexion angles. This also causes the torque of the plantar flexion to be significantly reduced. The results of this study also showed that the braking leg of athletes had a slightly increased tendency of the ankle joint plantar flexor moment (Table 3). It is speculated that the body’s center of gravity shifts to the braking leg at landing during the SPJ.
The contributions of both feet at landing during CMJs before fatigue were very similar (49:51); after fatigue, there was a tendency for deviation toward the braking leg (56:44). After the RA fatigue, the originally symmetrical jump of the CMJ deviated toward the braking leg at landing. Asymmetries between limbs potentially increase the risk of injury to the lower extremities [37]. During the SPJ at landing, before fatigue, the contribution of the legs deviated toward the jumping leg; after fatigue, it deviated toward the braking leg, with only a small difference between the two feet, indicating the nullification of the asymmetric character of the SPJ. This may reduce the ground reaction force during landing. It can be inferred that the athlete not only cannot reach the maximum height while jumping, but is also unable to shift weight to the jumping leg at landing.
We studied the various parameter differences before and after fatigue but not the jumping stages during CMJs and SPJs. We consider the major difference between the CMJ and SPJ to be the use of the upper body, which means that the movements of the upper trunk and the arms, etc., will affect the overall action. However, during the CMJ, the torso is not completely unrelated [38]. Before the jumping stage, during the CMJ, the subject begins to squat and lowers the center of mass, and the abdominal muscles are activated. The torso movements during the SPJ were similar to those during the CMJ. Therefore, it is impossible to completely eliminate the movement correlation between the CMJ and SPJ [7].
The results of this study showed that temporary fatigue of the RA does not directly affect the activation of the lower limb muscles during take-off jumps. Instead, fatigue first affects the jump angles of the knees during the CMJ and the braking leg jump angles of the hip and ankle dorsiflexion during the SPJ and causes a decrease in the Max-JH during the CMJ and SPJ. The RA fatigue also results in a decrease in ankle plantar flexion moment and a change in the load ratio of both legs during landing. A previous study reported that abdominal muscle fatigue degrades the standing posture control [39]. The impact of abdominal muscle fatigue on movement, posture control, and athletic performance should be taken into consideration during training or competition. Therefore, the avoidance of RA muscle failure and sufficient recovery time are recommended.
5. Limitations
First, the rectus abdominis fatigue protocol, instead of a volleyball-specific fatiguing protocol, was used in this study, which might be considered as a limitation for the practical relevance of the findings. In a volleyball match, when a player moves and jumps to lower the center of gravity, his abdominal curling action is similar to the fatigue protocol pattern of this study. However, the fixed rate of 45 rpm in this study may be different from the actual movements in a volleyball game. Previous pilot studies have found that muscle fatigue caused by continuous muscle contraction over a short period of time returns to its original level within 30 min [32]. If a volleyball-specific fatigue protocol is implemented, the core muscles of volleyball players may take a long time to reach fatigue levels, and because of recovery time limitations (30 min), the present study did not adopt a volleyball-specific fatiguing protocol that fatigues both abdominal and back muscles. Second, this study focused on the superficial core muscle group, RA, to examine the effects of fatigue on jump height, CoM performance, and lower extremity biomechanical parameters. In the future, the effects of other superficial and deep core muscles, and even the upper extremity biomechanical parameters, can be studied to investigate which component has the greatest effect on lower extremity jumping performance and landing load.
6. Conclusions
Temporary RA fatigue decreases the jump height of athletes and causes a change in the landing strategy. Due to abdominal fatigue, the volleyball players were unable to squat to a lower position to accumulate energy to take off, resulting in a decrease in the maximum jump height and ankle moment and a change in the load ratio of both legs during landing.
Author Contributions
Conceptualization, Y.-C.H. and J.-H.C.; Data curation, Y.-C.H. and Y.-Y.L.; Formal analysis, H.-T.L., Y.-C.H. and Y.-Y.L.; Methodology, H.-T.L., Y.-C.H. and J.-H.C.; Project administration, J.-H.C.; Resources, J.-H.C.; Software, Y.-C.H.; Supervision, J.-H.C.; Writing—original draft, Y.-C.H. and J.-H.C.; Writing—review and editing, H.-T.L. and J.-H.C. All authors have read and agreed to the published version of the manuscript.
Funding
This research received no external funding.
Institutional Review Board Statement
The study was conducted according to the guidelines of the Declaration of Helsinki.
Informed Consent Statement
Informed consent was obtained from all subjects involved in the study.
Data Availability Statement
The data presented in this study are available on request from the corresponding author.
Conflicts of Interest
The authors declare no conflict of interest.
References
- Tillman, M.D.; Hass, C.J.; Brunt, D.; Bennett, G.R. Jumping and Landing Techniques in Elite Women’s Volleyball. J. Sports Sci. Med. 2004, 3, 30–36. [Google Scholar]
- Kioumourtzoglou, E.; Michalopoulou, M.; Tzetzis, G.; Kourtessis, T. Ability profile of the elite volleyball player. Percept. Mot. Ski. 2000, 90, 757–770. [Google Scholar] [CrossRef]
- Kundert, A.M.L.; Di Gangi, S.; Nikolaidis, P.T.; Knechtle, B. Jumping and throwing performance in the World Masters’ Athletic Championships 1975–2016. Res. Sports Med. 2019, 27, 374–411. [Google Scholar] [CrossRef]
- Ruddock, A.D.; Winter, E.M. Jumping depends on impulse not power. J. Sports Sci. 2016, 34, 584–585. [Google Scholar] [CrossRef] [PubMed]
- Caruso, J.F.; Hari, P.; Leeper, A.E.; Coday, M.A.; Monda, J.K.; Ramey, E.S.; Hastings, L.P.; Golden, M.R.; Davison, S.W. Impact of acceleration on blood lactate values derived from high-speed resistance exercise. J. Strength Cond. Res. 2009, 23, 2009–2014. [Google Scholar] [CrossRef] [PubMed]
- Bojsen-Moller, J.; Magnusson, S.P.; Rasmussen, L.R.; Kjaer, M.; Aagaard, P. Muscle performance during maximal isometric and dynamic contractions is influenced by the stiffness of the tendinous structures. J. Appl. Physiol. 2005, 99, 986–994. [Google Scholar] [CrossRef] [PubMed]
- Wagner, H.; Tilp, M.; von Duvillard, S.P.; Mueller, E. Kinematic analysis of volleyball spike jump. Int. J. Sports Med. 2009, 30, 760–765. [Google Scholar] [CrossRef] [PubMed]
- Pinfold, S.C.; Harnett, M.C.; Cochrane, D.J. The acute effect of lower-limb warm-up on muscle performance. Res. Sports Med. 2018, 26, 490–499. [Google Scholar] [CrossRef] [PubMed]
- Luhtanen, P.; Komi, R.V. Segmental contribution to forces in vertical jump. Eur. J. Appl. Physiol. 1978, 38, 181–188. [Google Scholar] [CrossRef]
- Feltner, M.E.; Bishop, E.J.; Perez, C.M. Segmental and kinetic contributions in vertical jumps performed with and without an arm swing. Res. Q. Exerc. Sport 2004, 75, 216–230. [Google Scholar] [CrossRef]
- Michael, B. Functional Training for Sports: Superior Conditioning for Today’s Athlete; Human Kinetics: Champaign, IL, USA, 2004. [Google Scholar]
- Hodges, P.W.; Richardson, C.A. Contraction of the abdominal muscles associated with movement of the lower limb. Phys. Ther. 1997, 77, 132–142, discussion 142–134. [Google Scholar] [CrossRef]
- Liu, Y.-T.; Chang, J.-H.; Lin, H.-T. The effect of core muscle training with different training intensity on athletes’ performance. Q. Chin. Phys. Educ. 2014, 28, 117–123. [Google Scholar]
- Sadeghi, H.; Shariat, A.; Asadmanesh, E.; Mosavat, M. The Effects of Core Stability Exercise on the Dynamic Balance of Volleyball Players. Int. J. Appl. Exerc. Physiol. 2013, 2, 1–10. [Google Scholar]
- Tarnanen, S.P.; Ylinen, J.J.; Siekkinen, K.M.; Malkia, E.A.; Kautiainen, H.J.; Hakkinen, A.H. Effect of isometric upper-extremity exercises on the activation of core stabilizing muscles. Arch. Phys. Med. Rehabil. 2008, 89, 513–521. [Google Scholar] [CrossRef]
- Bigland-Ritchie, B.; Woods, J.J. Changes in muscle contractile properties and neural control during human muscular fatigue. Muscle Nerve 1984, 7, 691–699. [Google Scholar] [CrossRef]
- Rhodes, D.; McNaughton, L.; Greig, M. The temporal pattern of recovery in eccentric hamstring strength post-soccer specific fatigue. Res. Sports Med. 2019, 27, 339–350. [Google Scholar] [CrossRef] [PubMed]
- Bilodeau, M.; Schindler-Ivens, S.; Williams, D.M.; Chandran, R.; Sharma, S.S. EMG frequency content changes with increasing force and during fatigue in the quadriceps femoris muscle of men and women. J. Electromyogr. Kinesiol. 2003, 13, 83–92. [Google Scholar] [CrossRef]
- Beltman, J.G.; Sargeant, A.J.; Ball, D.; Maganaris, C.N.; de Haan, A. Effect of antagonist muscle fatigue on knee extension torque. Pflug. Arch. 2003, 446, 735–741. [Google Scholar] [CrossRef] [PubMed]
- Masuda, K.; Masuda, T.; Sadoyama, T.; Inaki, M.; Katsuta, S. Changes in surface EMG parameters during static and dynamic fatiguing contractions. J. Electromyogr. Kinesiol. 1999, 9, 39–46. [Google Scholar] [CrossRef]
- Johnston, R.B., III; Howard, M.E.; Cawley, P.W.; Losse, G.M. Effect of lower extremity muscular fatigue on motor control performance. Med. Sci. Sports Exerc. 1998, 30, 1703–1707. [Google Scholar] [CrossRef]
- Mendes, B.; Palao, J.M.; Silverio, A.; Owen, A.; Carrico, S.; Calvete, F.; Clemente, F.M. Daily and weekly training load and wellness status in preparatory, regular and congested weeks: A season-long study in elite volleyball players. Res. Sports Med. 2018, 26, 462–473. [Google Scholar] [CrossRef]
- Buttelli, O.; Seck, D.; Vandewalle, H.; Jouanin, J.C.; Monod, H. Effect of fatigue on maximal velocity and maximal torque during short exhausting cycling. Eur. J. Appl. Physiol. 1996, 73, 175–179. [Google Scholar] [CrossRef]
- Abt, J.P.; Smoliga, J.M.; Brick, M.J.; Jolly, J.T.; Lephart, S.M.; Fu, F.H. Relationship between cycling mechanics and core stability. J. Strength Cond. Res. 2007, 21, 1300–1304. [Google Scholar]
- Richardson, C.A.; Jull, G.A.; Hodges, P.W.; Hides, J.A. Therapeutic Exercise for Spinal Segmental Stabilization in Low Back Pain: Scientific Basis and Clinical Approach; Churchill Livingstone: Edinburgh, UK, 1999. [Google Scholar]
- Davis, R.B.; Õunpuu, S.; Tyburski, D.; Gage, J.R. A gait analysis data collection and reduction technique. Hum. Mov. Sci. 1991, 10, 575–587. [Google Scholar] [CrossRef]
- Hermens, H.J.; Freriks, B.; Disselhorst-Klug, C.; Rau, G. Development of recommendations for SEMG sensors and sensor placement procedures. J. Electromyogr. Kinesiol. 2000, 10, 361–374. [Google Scholar] [CrossRef]
- Sun, W.; Zhang, C.; Song, Q.; Li, W.; Cong, Y.; Chang, S.; Mao, D.; Hong, Y. Effect of 1-year regular Tai Chi on neuromuscular reaction in elderly women: A randomized controlled study. Res. Sports Med. 2016, 24, 145–156. [Google Scholar] [CrossRef]
- Hislop, H.J.; Montgomery, J. Daniels and Worthingham’s Muscle Testing:Techniques of Manual Examination, 8th ed.; W.B. Saunders: Philadelphia, PA, USA, 2007. [Google Scholar]
- Konrad, P. The ABC of EMG: A Practical Introduction to Kinesiological Electromyography; Noraxon: Scottsdale, AZ, USA, 2005. [Google Scholar]
- Sinclair, J.; Taylor, P.J.; Hobbs, S.J. Digital filtering of three-dimensional lower extremity kinematics: An assessment. J. Hum. Kinet. 2013, 39, 25–36. [Google Scholar] [CrossRef] [PubMed]
- Huang, Y.-C. Differences in rectus abdominis recovery from fatigue among different levels of players. In Proceedings of the Asian Society of Sport Biomechanics, Hokkaido, Japan, 11–13 September 2012. [Google Scholar]
- Halder, A. Evaluation of Physical Work Capacity and Leg Muscle Fatigue during Exhaustive Stair Ascending Evacuation Lund; Lund University: Lund, Sweden, 2017. [Google Scholar]
- Struzik, A.; Zawadzki, J. Estimation of potential elastic energy during the countermovement phase of a vertical jump based on the force-displacement curve. Acta Bioeng. Biomech. 2019, 21, 153–160. [Google Scholar] [PubMed]
- Hughes, G.; Watkins, J. Lower limb coordination and stiffness during landing from volleyball block jumps. Res. Sports Med. 2008, 16, 138–154. [Google Scholar] [CrossRef] [PubMed]
- Self, B.; Paine, D. Ankle biomechanics during four landing techniques. Med. Sci. Sports Exerc. 2001, 33, 1338–1344. [Google Scholar] [CrossRef]
- Peek, K.; Gatherer, D.; Bennett, K.J.M.; Fransen, J.; Watsford, M. Muscle strength characteristics of the hamstrings and quadriceps in players from a high-level youth football (soccer) Academy. Res. Sports Med. 2018, 26, 276–288. [Google Scholar] [CrossRef] [PubMed]
- Cushion, E.J.; Goodwin, J.E.; Cleather, D.J. Relative Intensity Influences the Degree of Correspondence of Jump Squats and Push Jerks to Countermovement Jumps. J. Strength Cond. Res. 2016, 30, 1255–1264. [Google Scholar] [CrossRef] [PubMed][Green Version]
- Larson, D.J.; Brown, S.H.M. The effects of trunk extensor and abdominal muscle fatigue on postural control and trunk proprioception in young, healthy individuals. Hum. Mov. Sci. 2018, 57, 13–20. [Google Scholar] [CrossRef] [PubMed]
Publisher’s Note: MDPI stays neutral with regard to jurisdictional claims in published maps and institutional affiliations. |
© 2021 by the authors. Licensee MDPI, Basel, Switzerland. This article is an open access article distributed under the terms and conditions of the Creative Commons Attribution (CC BY) license (https://creativecommons.org/licenses/by/4.0/).