1. Introduction
The application of High Speed Cutting (HSC) technology in machining requires, among others, machine tools with much higher kinematic parameters. One consequence of the increase in rotational speed is the greater amount of heat in the spindle rolling bearings, and thus higher temperatures. Higher temperatures mean, among other things, greater thermal deformation of the spindles and thus greater machining errors. Most of the literature reports on heat in bearings are devoted to this issue.
On the other hand, the increase in temperature also affects the resistance to movement of the bearing itself. This issue will be the subject of the article.
Sum-Min et al. [
1] show thermal study results concerning the machine tool spindle equipped with rolling bearings and modelled with FEM. The authors focused on the influence of mounting clearances of a bearing on the shaft, and the bearing in its seating on bearing preload changes. The authors considered only hydrodynamic resistances and all other resistances determined with the traditional Palmgren model [
2]. In their thermal model, they took into consideration radial deformations in the internal bearing ring and the drive shaft caused by centrifugal loads due to orbital bearing balls.
Kim et al. [
3] demonstrate the method of electrospindle thermal modelling. It has been assumed that the heat source are the resistances resulting from lubricant and motion resistances resulting from a bearing load. The developed numerical model allows for prognoses of temperature distribution, as well as thermal deformations.
Holkup et al. [
4] illustrate a thermo-mechanical spindle model with angular bearings according to FEM. The heat was generated in bearings and motor. The experimentally verified spindle model makes it possible to predict temperature and heat distribution, as well as contact load. The article shows experimental study results in the form of an experimental model.
Wang et al. [
5] present a dynamic thermal-mechanical model to investigate the thermal characteristics in a spindle-bearing system. In this model, transient thermal analysis, static structure analysis and calculation of the boundary conditions are conducted as a solution loop. The transient boundary conditions, such as bearing heat generation and thermal contact conductance, are calculated with the appropriate formulas. The thermal equilibrium experiment is conducted on a test rig.
Damian and Paleu [
6] present a method for the computation of the power loss in angular contact ball bearings. Dynamic effects, generated at high-speed, are also included as centrifugal forces and gyroscopic moments, balls and cage interactions, ball and cage drag and churning in the lubricating bath oil.
De-xing et al. [
7] present estimation of thermal performances of angular contact ball bearings. Considering the centrifugal force, gyroscopic moment and thermal expansion, the ball loads equilibrium model was first established to analyze the bearing loads. The radial and axial heat transfer, especially the effect of structural constraints on bearings temperature, was well characterized. Compared with the presented models, the deviation between the calculation results and the test values is reduced to less than 9%.
Sum-Min et al. [
1] present a simulation method to establish a comprehensive prediction model for the thermal and mechanical behavior of a spindle–bearing system. By introducing a lumped element into the system, not only mechanical properties but also thermal behaviors can be predicted. In this study, three different simplified assemblies are investigated. One is the bearing inner race–shaft subassembly that includes a negative assembly clearance, and another is the outer race–housing assembly that includes a positive assembly clearance. The third is the entire system that is composed of a rolling element bearing, an inner race–shaft subassembly and an outer race subassembly.
Zivkovic et al. [
8] present the performances of high-speed machine tools depend not only on the mechanical, but also on the thermal behavior of the spindle. A 3D FE thermal model is presented. Based on thermo-mechanical analysis, generated heat and thermal contact resistance (TCR) are determined. The aforementioned constraints have been applied to the 3D FEM model which allowed for establishing temperature field distribution, and spindle thermal balance. Experimental measurements of spindle and bearing temperatures were done.
Muszyński et al. [
9] present a way of modelling the heat and temperature distribution on a test rig using the Finite Element Method. An extended bearing contact model was adopted to model the magnitude of the contact forces which motion resistance and power of the heat source were determined from. Correct determination of heat source power and convection coefficients is a key issue in temperature field modelling. The paper contains sample results of model and experimental research for preload of a selected values and various bearing speeds.
Modeling thermal phenomena in a rolling bearing by the Finite Element Method requires at least two difficult decisions that significantly affect heat flows and temperature distribution. These are:
In addition, an important issue that also requires precise definition is the correct identification of heat convection and heat conduction processes, which in rolling bearings dominate other heat flow mechanisms.
2. Selection of Surfaces to Which the Heat Source Is Assigned
The heat source in the bearings are:
Determining the size of these resistances in an analytical manner is a difficult and not fully resolved issue. Regardless of the estimation of the value of these resistances, the issue itself is to define the areas in which they occur.
Mechanical friction resistances result from the rolling of the balls on the raceways, so it can be assumed that they should be attributed to raceways and balls. The computational models available in the literature [
10,
11] allow to estimate what part of these resistances results from the interaction of the outer race with the ball and what part of the inner race with the ball. It can be assumed that the heat generated due to the mechanical friction resistance should be attributed to both the raceways and the balls. Such a rule is not always found in the literature.
Viscous resistances resulting from the wading of the balls in the lubricant make it difficult for the balls to move, i.e., they are a source of heat assigned more to the balls than to the track.
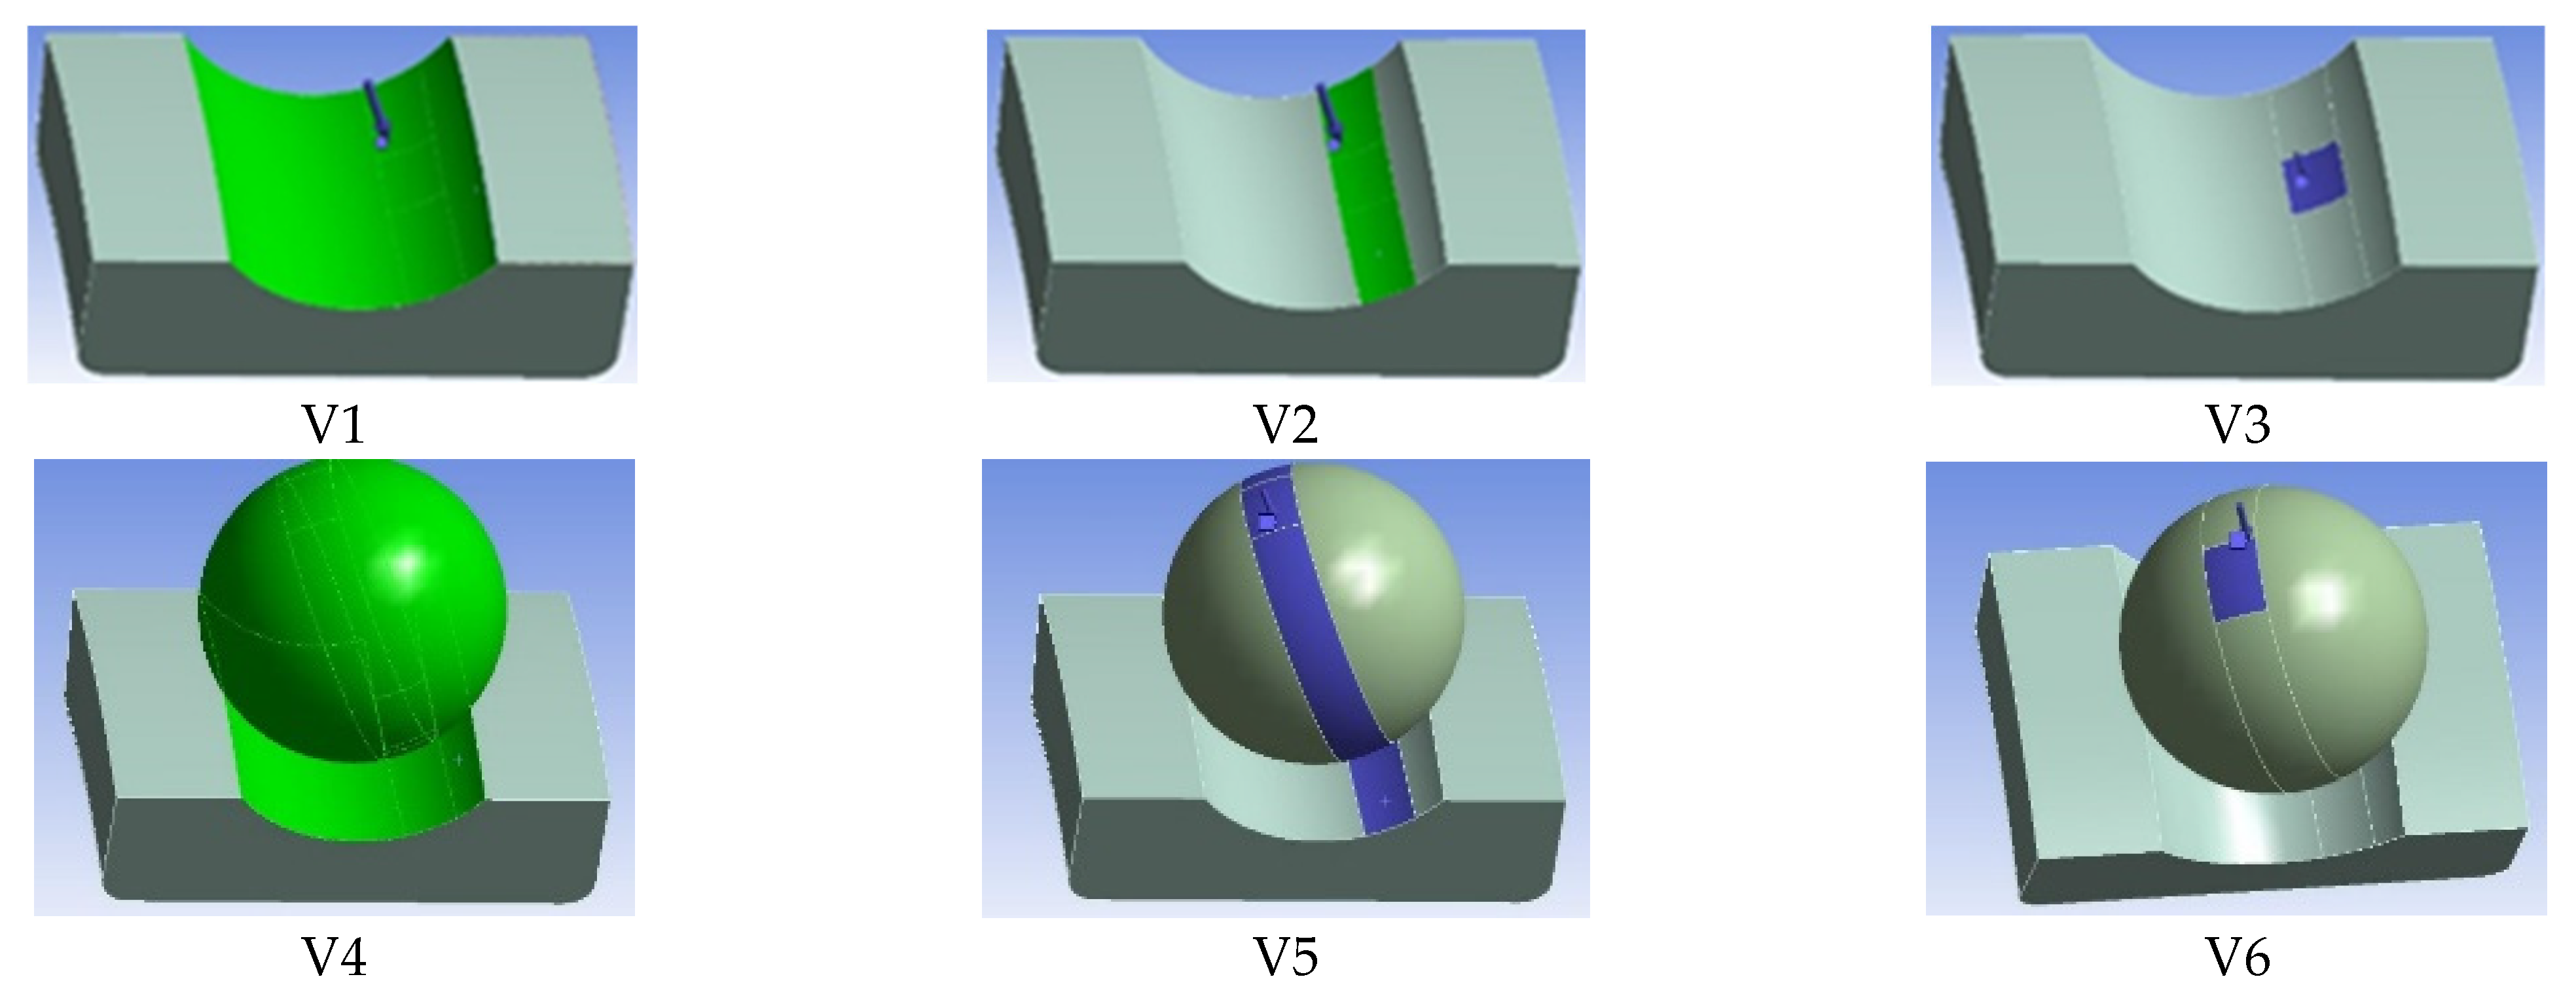
The literature reports show that the simplest (from the modeling point of view) method of modeling heat sources is more often used, i.e., assigning them only to both raceways. In the most general case, we can talk about the following methods of modeling heat sources:
Assigning heat sources to the surfaces of the outer race and inner race, without assigning heat sources to the balls (
Figure 1 (V1)). This is the simplest way of modeling heat sources, hence the most common one.
Assigning heat sources to parts of the surface of the outer and inner raceways, the size of which (surface) results from the contact area of the ball with raceways (
Figure 1 (V2)). This method seems more realistic as the balls are not in contact with the raceways over their full width, but only over a portion resulting from the contact deformation.
Assigning heat sources, the so-called contact ellipses, i.e., areas of real contact of the ball with the raceways (
Figure 1 (V3)).
The three above-mentioned methods of assigning heat sources can be duplicated, taking into account that the heat sources are assigned to raceways and balls (
Figure 1 (V4–V6)). As a result, there are six ways to model heat sources in a rolling bearing.
Figure 1 shows symbolically all six methods of modeling heat sources in a bearing, and the symbols V1, V2, V3, V4, V5 and V6 assigned to them.
It is understandable that different heat source variants will have different power intensities, expressed in W/m2. An issue that must be logically justified and which concerns variants V2, V3, V5 and V6 is the definition of the field of areas to which heat sources will be assigned. For this reason, it was considered justified to conduct thermal tests in terms of temperature distribution depending on the adopted modeling of heat sources.
3. Selection of the Contact Model—The Influence of Heat Conduction
When using Finite Element Method (FEM) modeling, an equally important but difficult issue is the adoption of the ball-raceway contact model. This model has a significant impact on the heat transfer in the form of conduction between the bearing elements, i.e., balls and raceways.
The intensity of heat conduction in solids is a function of the temperature difference between the points, the distance between them and the material properties that the thermal conductivity coefficient represents.
The mechanism of heat conduction between two bodies in contact is somewhat more complex. In the literature [
5], this issue is referred to as Thermal Contact Conductance (
TCC). The intensity of heat conduction through the contact area can be represented as follows
where
qTCC—heat flux per unit area [Wm
−2],
Tt, Tc—temperatures of the contact points on the target (
t) and contact (
c) surfaces,
TCC [Ws
−1m
−2K
−1].
The Thermal Contact Conductance (
TCC) is used to evaluate the heat flux resistance caused by the joint surface. The influential factors of the
TCC include surface roughness, contact pressure, thermal conductivity and material hardness. The
TCC value is input through a real constant, which is a function of temperature, pressure, time and initial contact detection point location [
12].
The determination of the
TCC coefficient is a complex issue, and in the literature [
5], one can find relationships that allow for their estimation.
TCC are function of the effective
RMS roughness, of the thermal conductivity
k, elastic modulus and flow stress of the material, of the contact pressure, strain and microhardness.
Nakajima [
13] presented the analytical form of the dependence that allows to calculate the
TCC value for rolling bearings. This dependence, after the transformations made by the author, takes the form
where
k1,
k2—conductivity coefficients of the materials of both bodies,
a,
b—axes of the contact deformation ellipse.
The author has shown by means of numerical simulations that for angular contact rolling bearings for which the quotient
b/
a is within the range 0.0–0.20, the integral:
Assuming that
k1 =
k =
k (due to the same material),
TCC can be determined as
The intensity of heat conduction for bodies in contact significantly depends on the initial contact model [
12]. Therefore, the aim of this research is to verify this assumption.
Commercial FEM systems such as, for example, ANSYS, offer two variants of defining the Thermal Contact Conductance coefficient TCC:
default, called Program Controlled, when the system automatically calculates the current TCC value according to an undefined algorithm
manual, when the user enters a numerical TCC value.
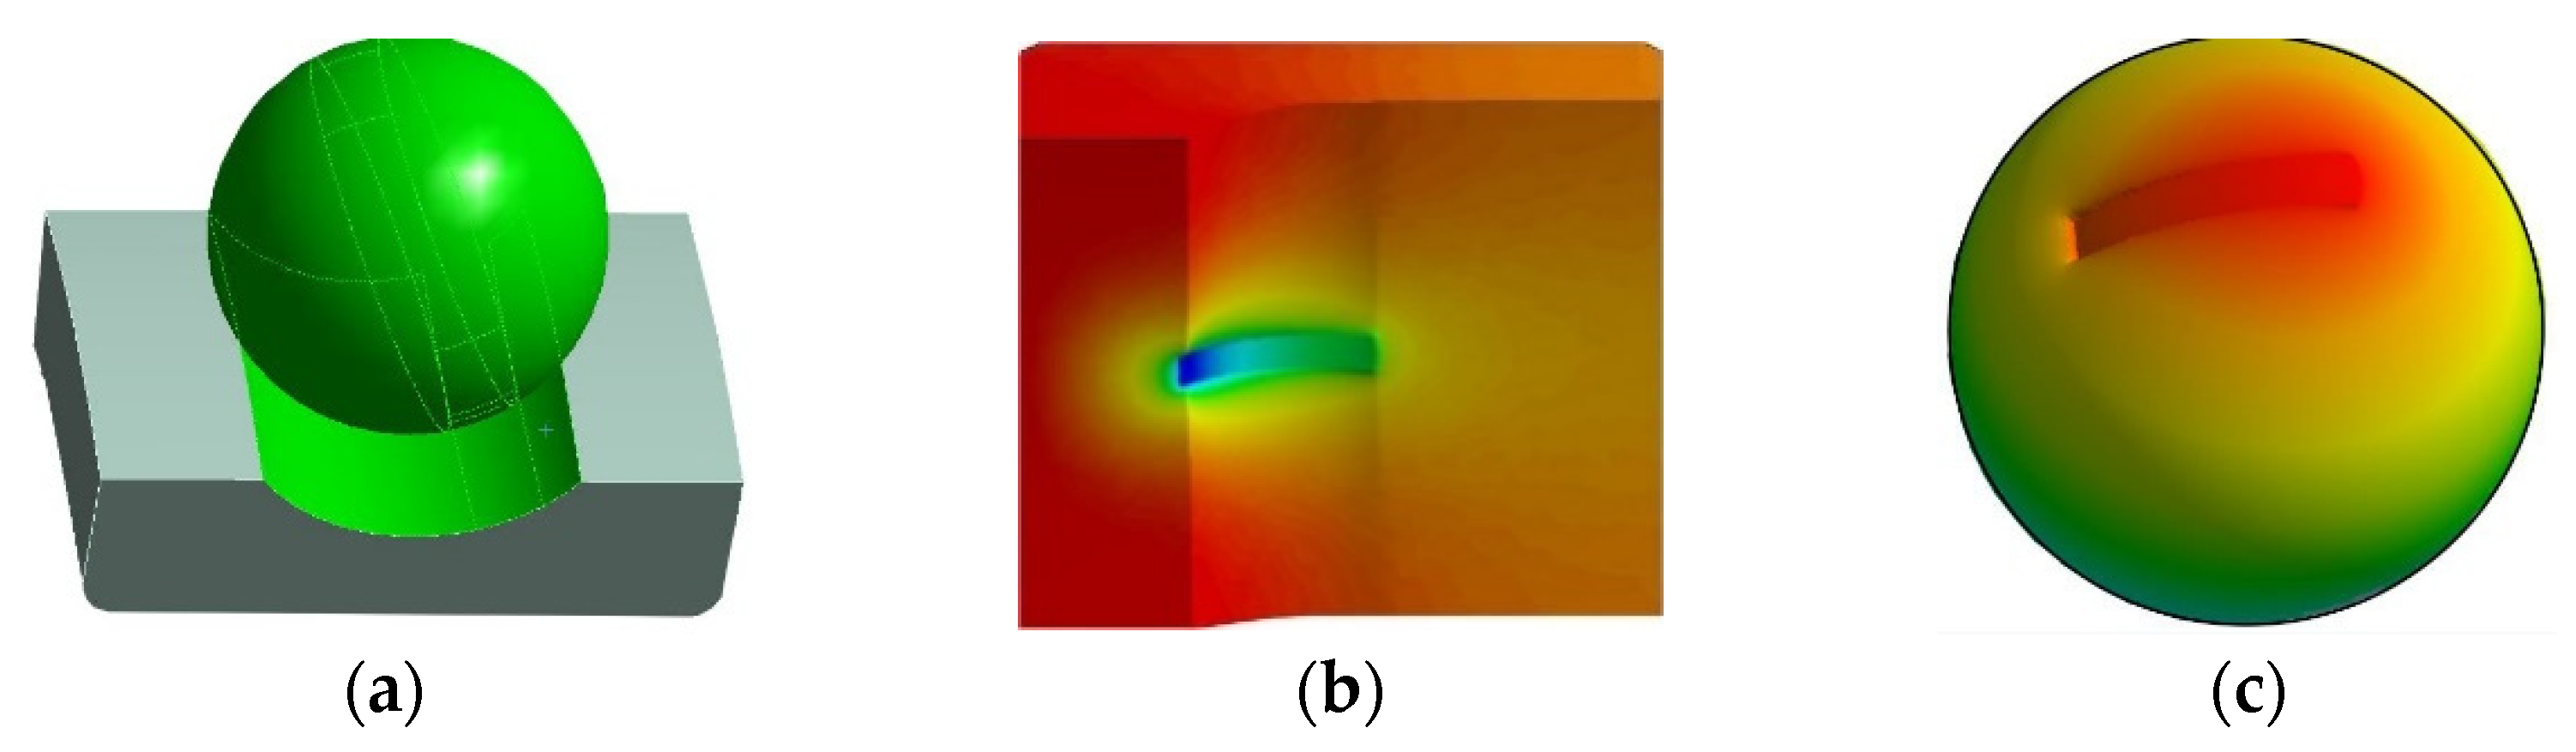
Figure 2a shows an example of the default contact area for the tested FAG B7013-E test bearing. The Bonded contact in this example covers the entire surface of the inner race and the ball.
On the other hand,
Figure 2b,c illustrate the areas of contact of the ball with the outer race as a result of the bearing preload. One can formulate the view that in a bearing subjected to external and internal loads, the area of contact deformation significantly differs from the default one (
Figure 2a) and, importantly, it will undergo changes with the change of loads. Thus, the area of heat conduction between the balls and the raceways will depend on the actual contact area. For this reason, it was considered reasonable to conduct thermal studies for the temperature distribution for the most common default Bonded contact model, but for different contact areas.
It was assumed that the contact areas will be considered according to the heat source models (
Figure 1), i.e., for the V1–V6 variants.
4. Influence of Convection Conditions on the Temperature
Convection is the dominant mechanism for heat flow from bearing components to the environment. Other heat flow mechanisms, such as radiation, have less impact on the thermal condition of the bearing, and will therefore not be taken into account.
Convection, in addition to modeling heat sources and the accepted contact model of balls with raceways, has a decisive influence on the temperature distribution.
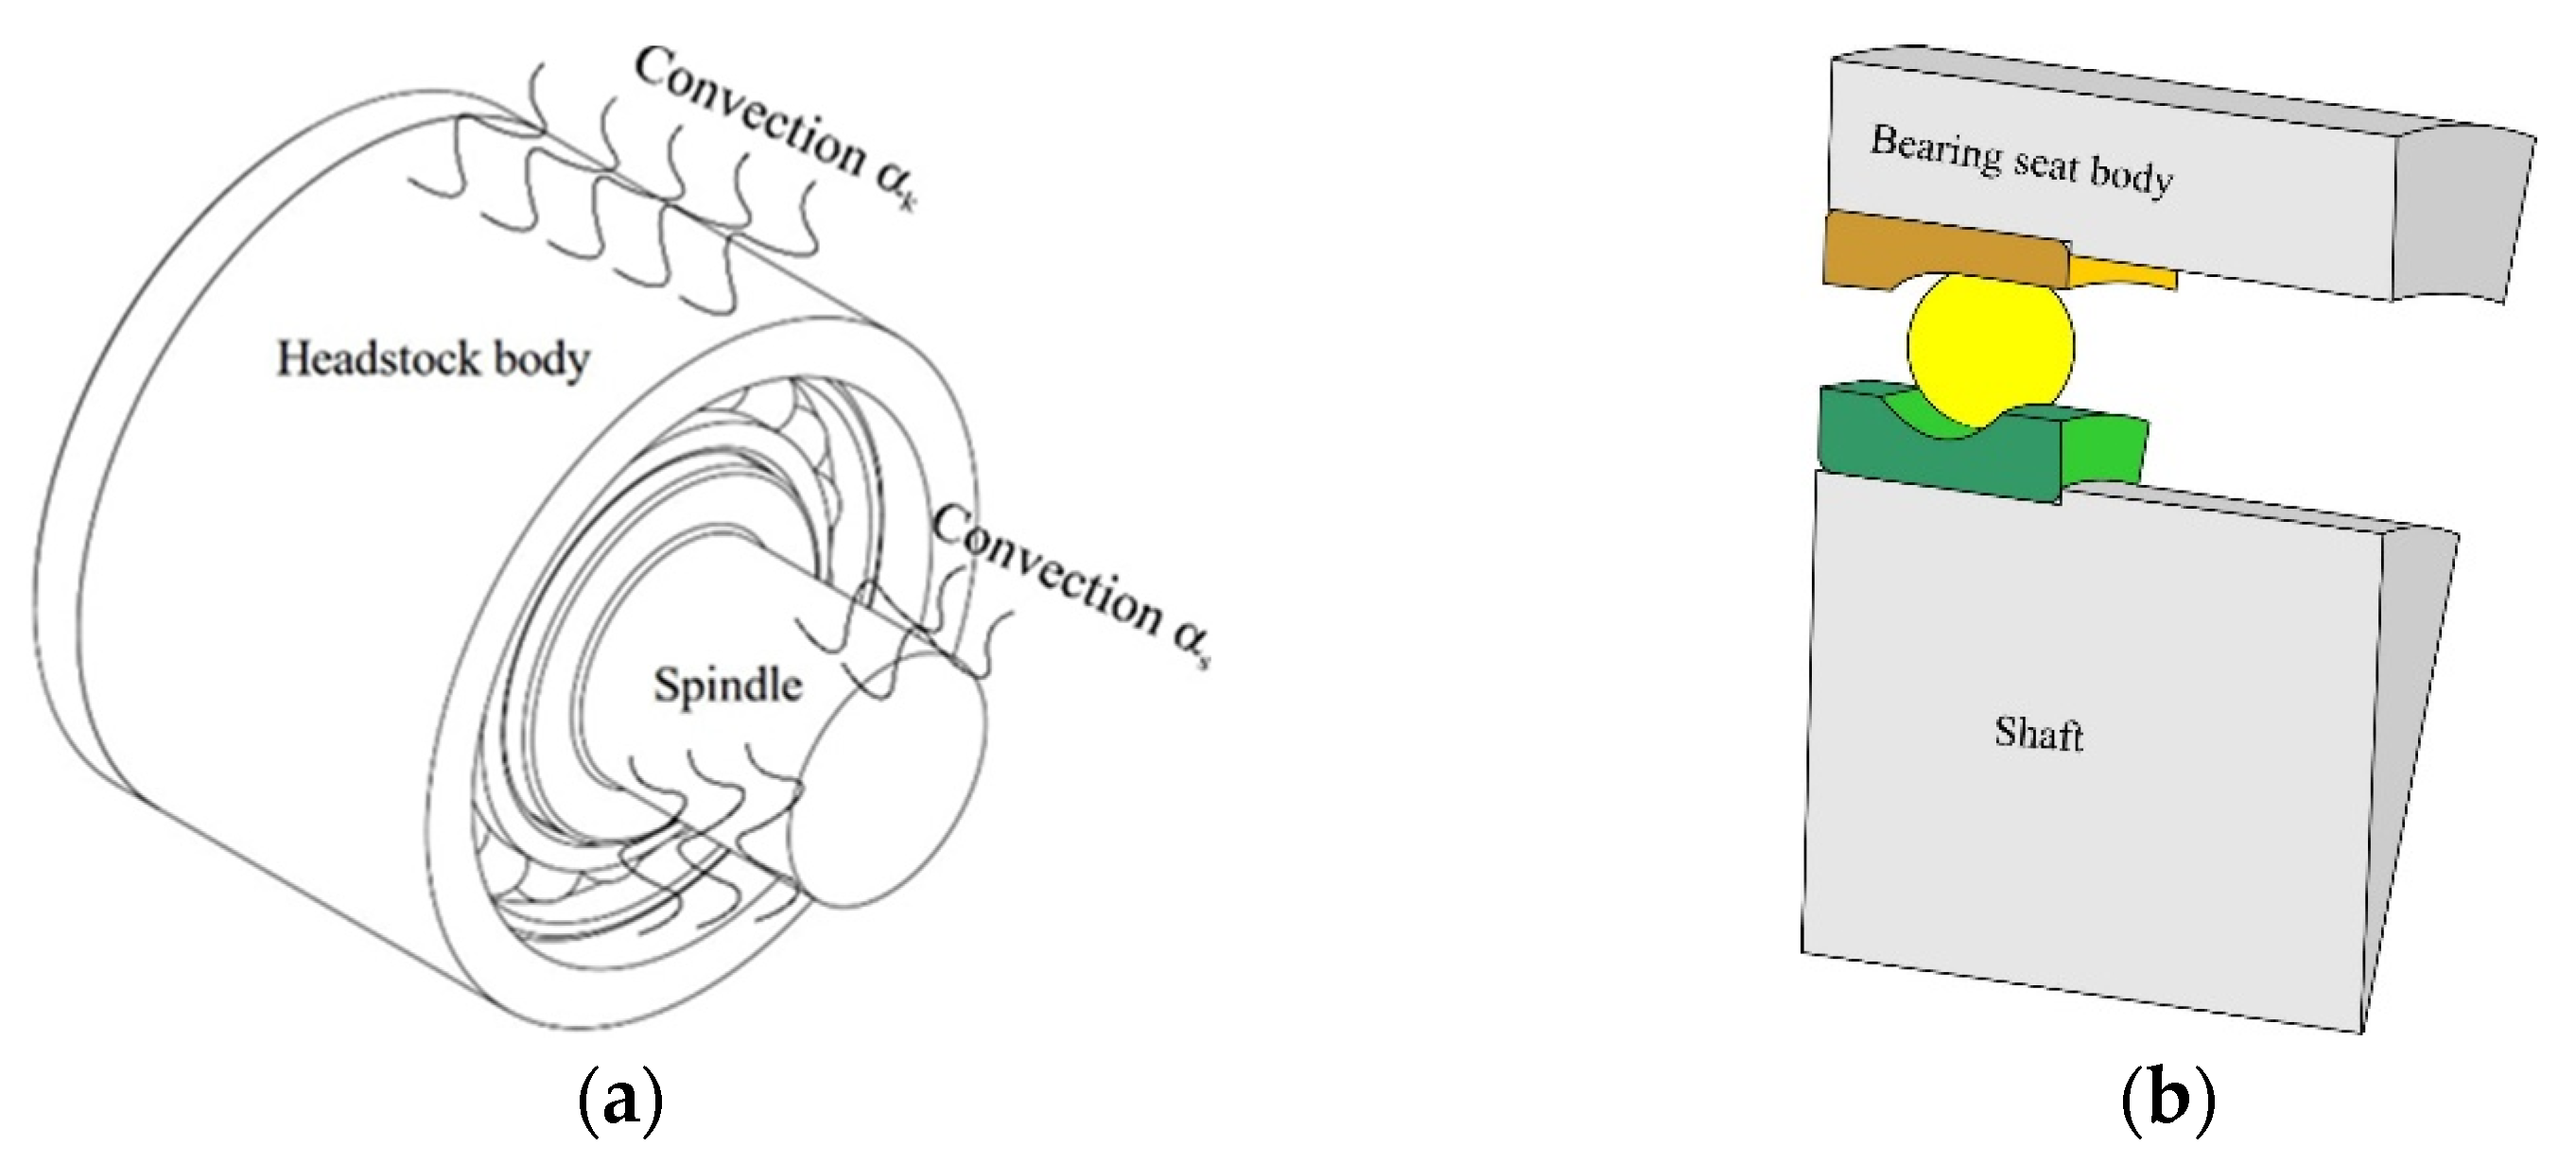
The bearing, from the point of heat transfer with the environment, is a specific assembly because some of its components are stationary (e.g., the body of the seat of bearing) and the other part is movable (the shaft on which the bearing rests). This is important from the point of view of the convection mechanism (
Figure 3a).
There are generally two types of convection, the so-called free and forced. The first concerns elements that are stationary or moving at lower speeds. The heat flow is due to the temperature difference. The second is characteristic of moving parts.
The amount of heat due to free convection is proportional to the size of the surface and the so-called convection coefficient α
s, which can be determined from the relationship [
14]
where
T,
Tout—surface and ambient temperate, and
c,
n—constants depending on the multiplication of Grashof number Gr and Prandtl Pr.
For the considered test bearing (for a solid body of the stand in the form of a cylinder)
c = 1.7 and
n = 0.33 [
14]. Such coefficients will be taken into account in the FEM simulation tests.
If we assume that the temperatures in the bearing are within the range of 25 °C–100 °C, the convection coefficient αs = (2.44 − 7.31) W/m2.
The amount of heat of forced convection is proportional to the size of the surface and the convection coefficient
αk, which can be determined from the relationship [
14]
where
V—linear speed of the moving element [ms
−1],
n—rotational speed of the moving element [rpm] and
d—diameter of the rotating element [m].
The author showed that the influence of the temperature difference between the movable element and the environment is small, hence the αk coefficient may finally be presented as a function of the rotational speed and the diameter of the movable element. In the considered example of the test bearing, the αk coefficient in the speed range 1000 to 9000 rpm is within the range of 26.7 to 119 Wm−2T−1, which is significantly greater than the coefficient αs. This means that, with comparable heat convection surfaces, much more heat will flow into the environment through shaft than through the seat body in which the bearing rests. This can significantly differentiate the bearing outer and inner ring temperatures.
5. Subject of Study
Conducting research with the FEM method requires the definition of a specific research object. In this case, it will be the FAG B7013-E P5 class angular contact test bearing. This bearing was the subject of analytical, simulation and experimental studies by the author [
10,
11,
15,
16], which results in a large amount of information that can be used for simulation thermal studies.
The main goal of simulation research is a question: does the modeling of heat sources in the bearing and the modeling of the phenomenon of contact of balls with raceways have a significant impact on heat flows, especially on the temperature distribution?
There are no references to this in the literature on heat flow and temperature distribution in a rolling bearing. On the other hand, the author, based on his own simulation and experimental studies of the test bearing, has reason to believe that the influence of the above-mentioned factors may be significant.
The long-term goal of this research is to answer the question: does the bearing temperature have a significant influence on the resistance to motion? For years, the author has been conducting research on the creation of analytical models that allow the designer of the bearing seat to relatively simple and quick estimation of the resistance to motion resulting only from mechanical and viscous friction [
10,
11]. On the other hand, some literature reports allow for the formulation of an opinion about the existence of the influence of heat on the mechanical resistance to motion. This impact would result from thermal deformations of the bearing elements, and therefore in this research, the relationship between the size of these deformations and the temperature will be sought.
A rolling bearing is a mechanical assembly with a large number of axes and planes of symmetry. Therefore, to model this bearing by the FEM, a simplified geometric model can be used (
Figure 3b).
The geometric FEM model of the bearing was limited to an object representing only 1/N (N—the number of balls in the bearing) of the entire bearing. Moreover, in order to take into account the effects of heat convection, geometric models of the body of the bearing seat and the shaft were taken into account. These elements of the bearing were primarily assigned convective properties related to the flow of heat to the environment. Basic simulation studies of heat flow were carried out for the rotational speed of 6000 rpm, because for this speed it was possible to conduct experimental studies until reaching a steady state.
6. FEM Model for Thermal Research
The simulation tests were carried out in the ANSYS 2020R2 Transient Thermal. The simplified geometric model (
Figure 3b) was prepared in such a way that it was possible to arrange Heat Flux sources there (
Figure 1).
Power losses due to viscous resistance were calculated as follows
where Δ
Nn—power losses due to viscous resistance,
ω,
n—angular and rotational speed of the bearing,
ν—kinematic viscosity of the lubricant,
dm—the mean diameter of the bearing and
k0—constant (for single-row angular contact ball bearings 0.6–2.0).
The lubricant’s viscosity index was updated according to the bearing temperature. The preliminary tests consisted in determining the temperatures which were then used to modify the viscosity coefficient. In the main tests, the modified value of the lubricant viscosity coefficient was taken into account.
Power losses due to mechanical friction of balls and raceways were determined on the basis of analytical models developed by the author [
10], in which the rolling and sliding friction resistances were taken into account, as well as the resistance to rolling friction in an angular contact bearing, both on the outer and inner raceways, according to the relation
where Δ
N(T)o, Δ
N(T)i—power losses due to mechanical friction of balls with the outer and inner race, and
M(T)o,
M(T)i—cumulative moments of friction between the balls and the outer and inner raceways.
The determined power losses due to resistance to motion were treated as the power of heat sources.
The external surfaces of the bearing seat body and the shaft were assigned the heat transfer to the environment, while the bearing seat body was assigned the features of free convection and the shaft the features of forced convection. The numerical values of convection coefficients were determined according to the dependence (4) and (5).
All contact models, both between the ball and the bearing raceways, and between the bearing seat body and the outer ring, and between the shaft and the inner ring, were Bonded type. Depending on the considered variant of the contact model between the ball and the raceways, the contact area was either default (variants V1 and V4) or suitable for variants V2, V3, V5 and V6.
7. Results of Simulation
7.1. The Impact of Heat Source Modeling
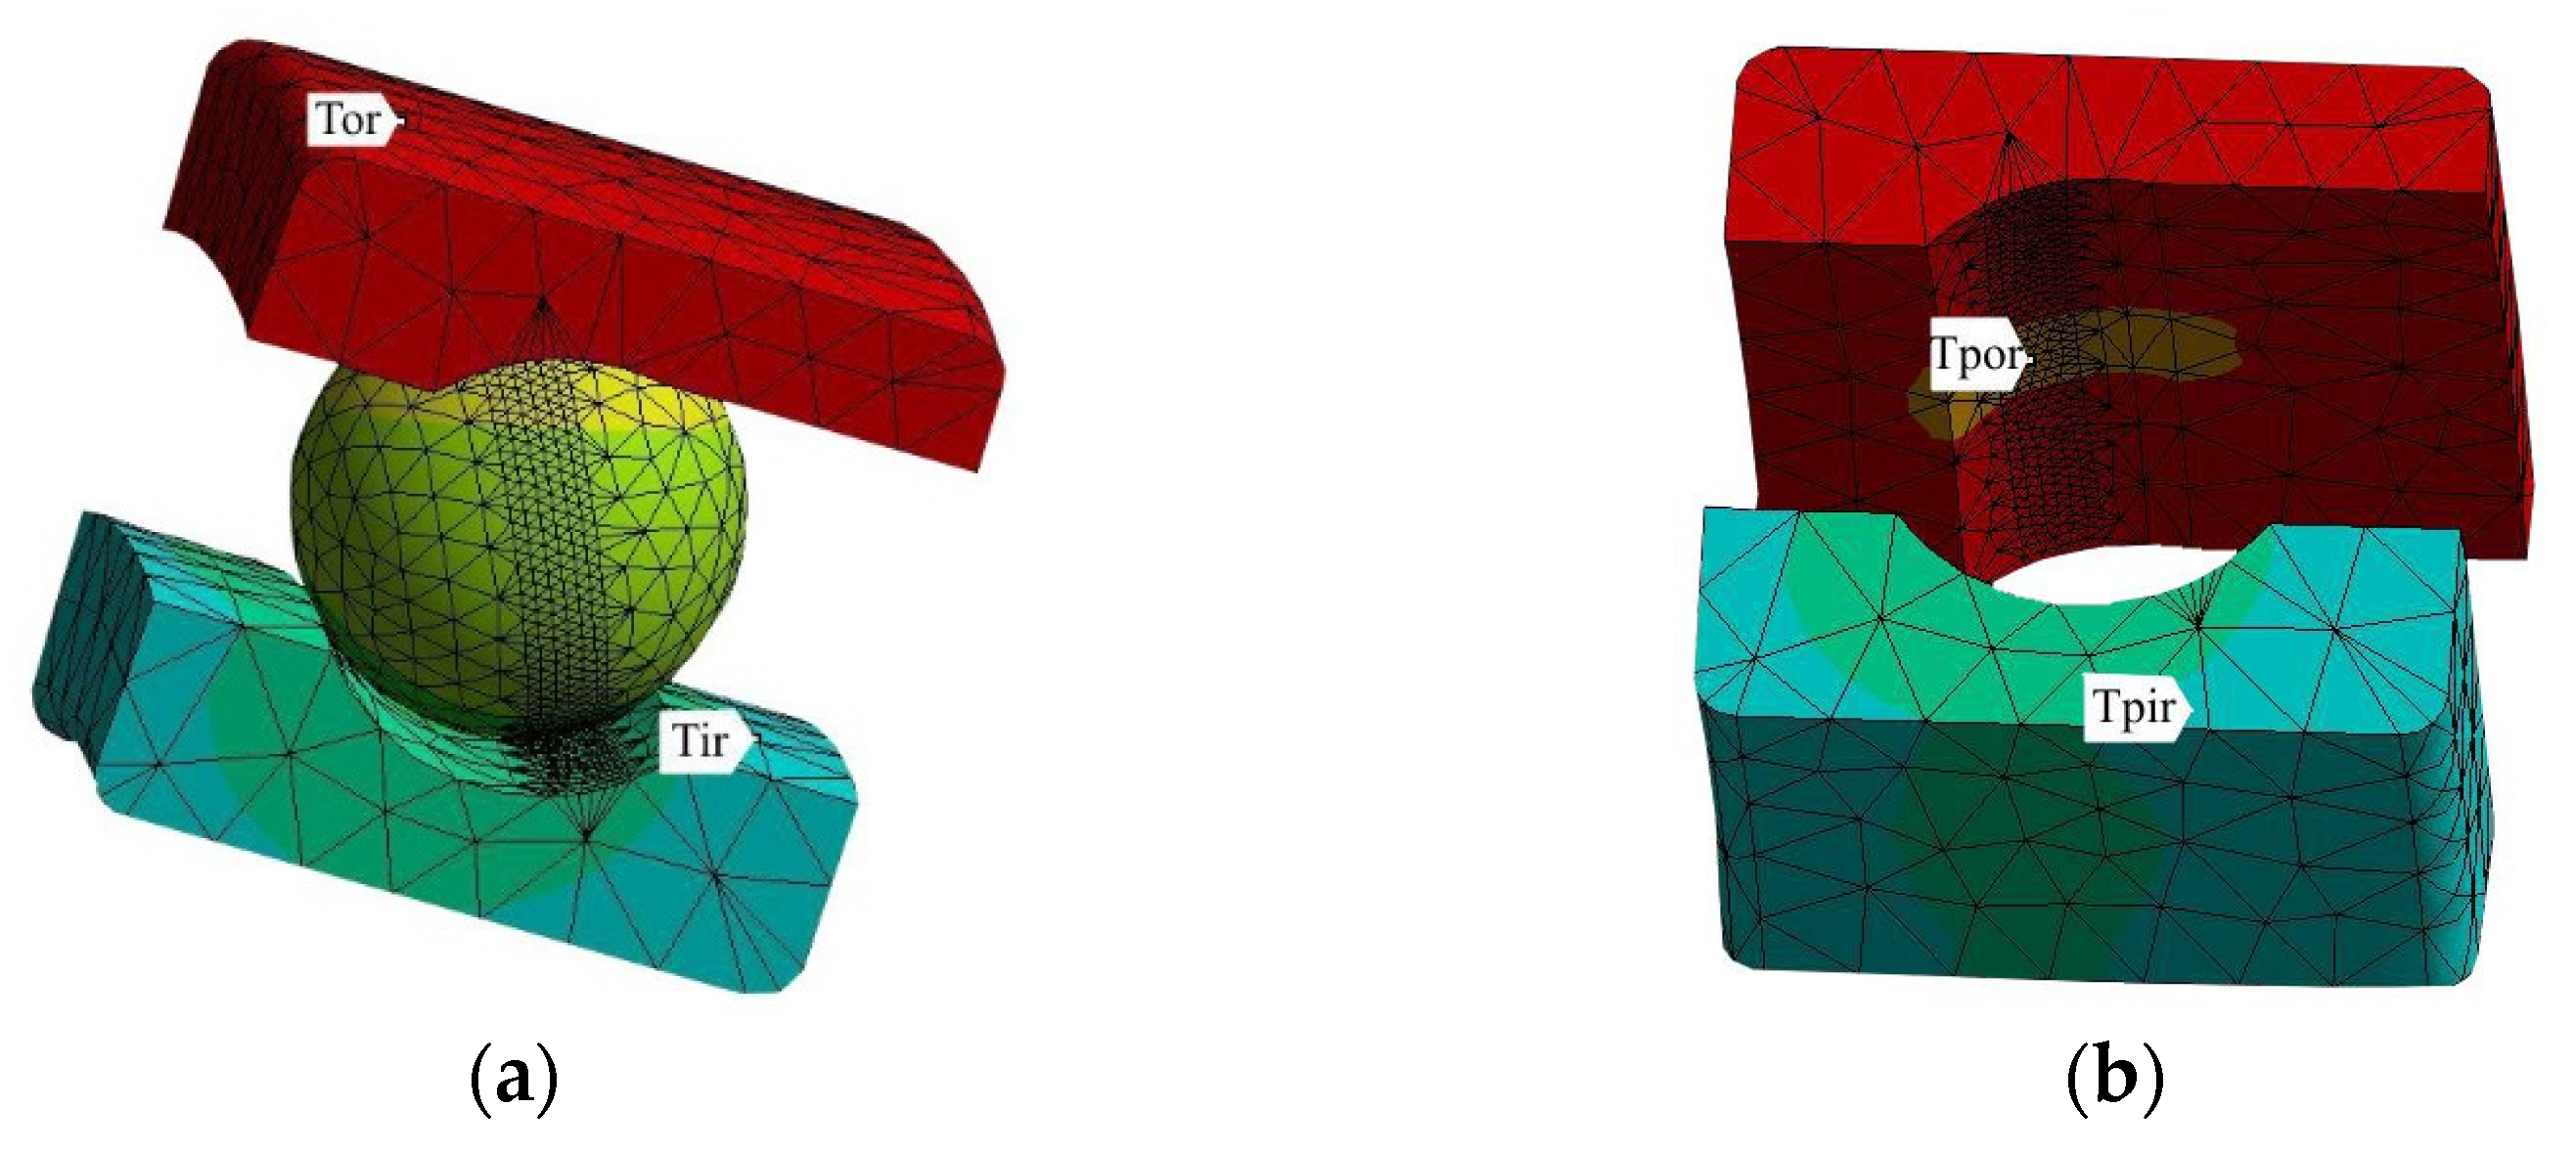
The simulation tests consisted in registering the temperature course at selected points (
Figure 4).
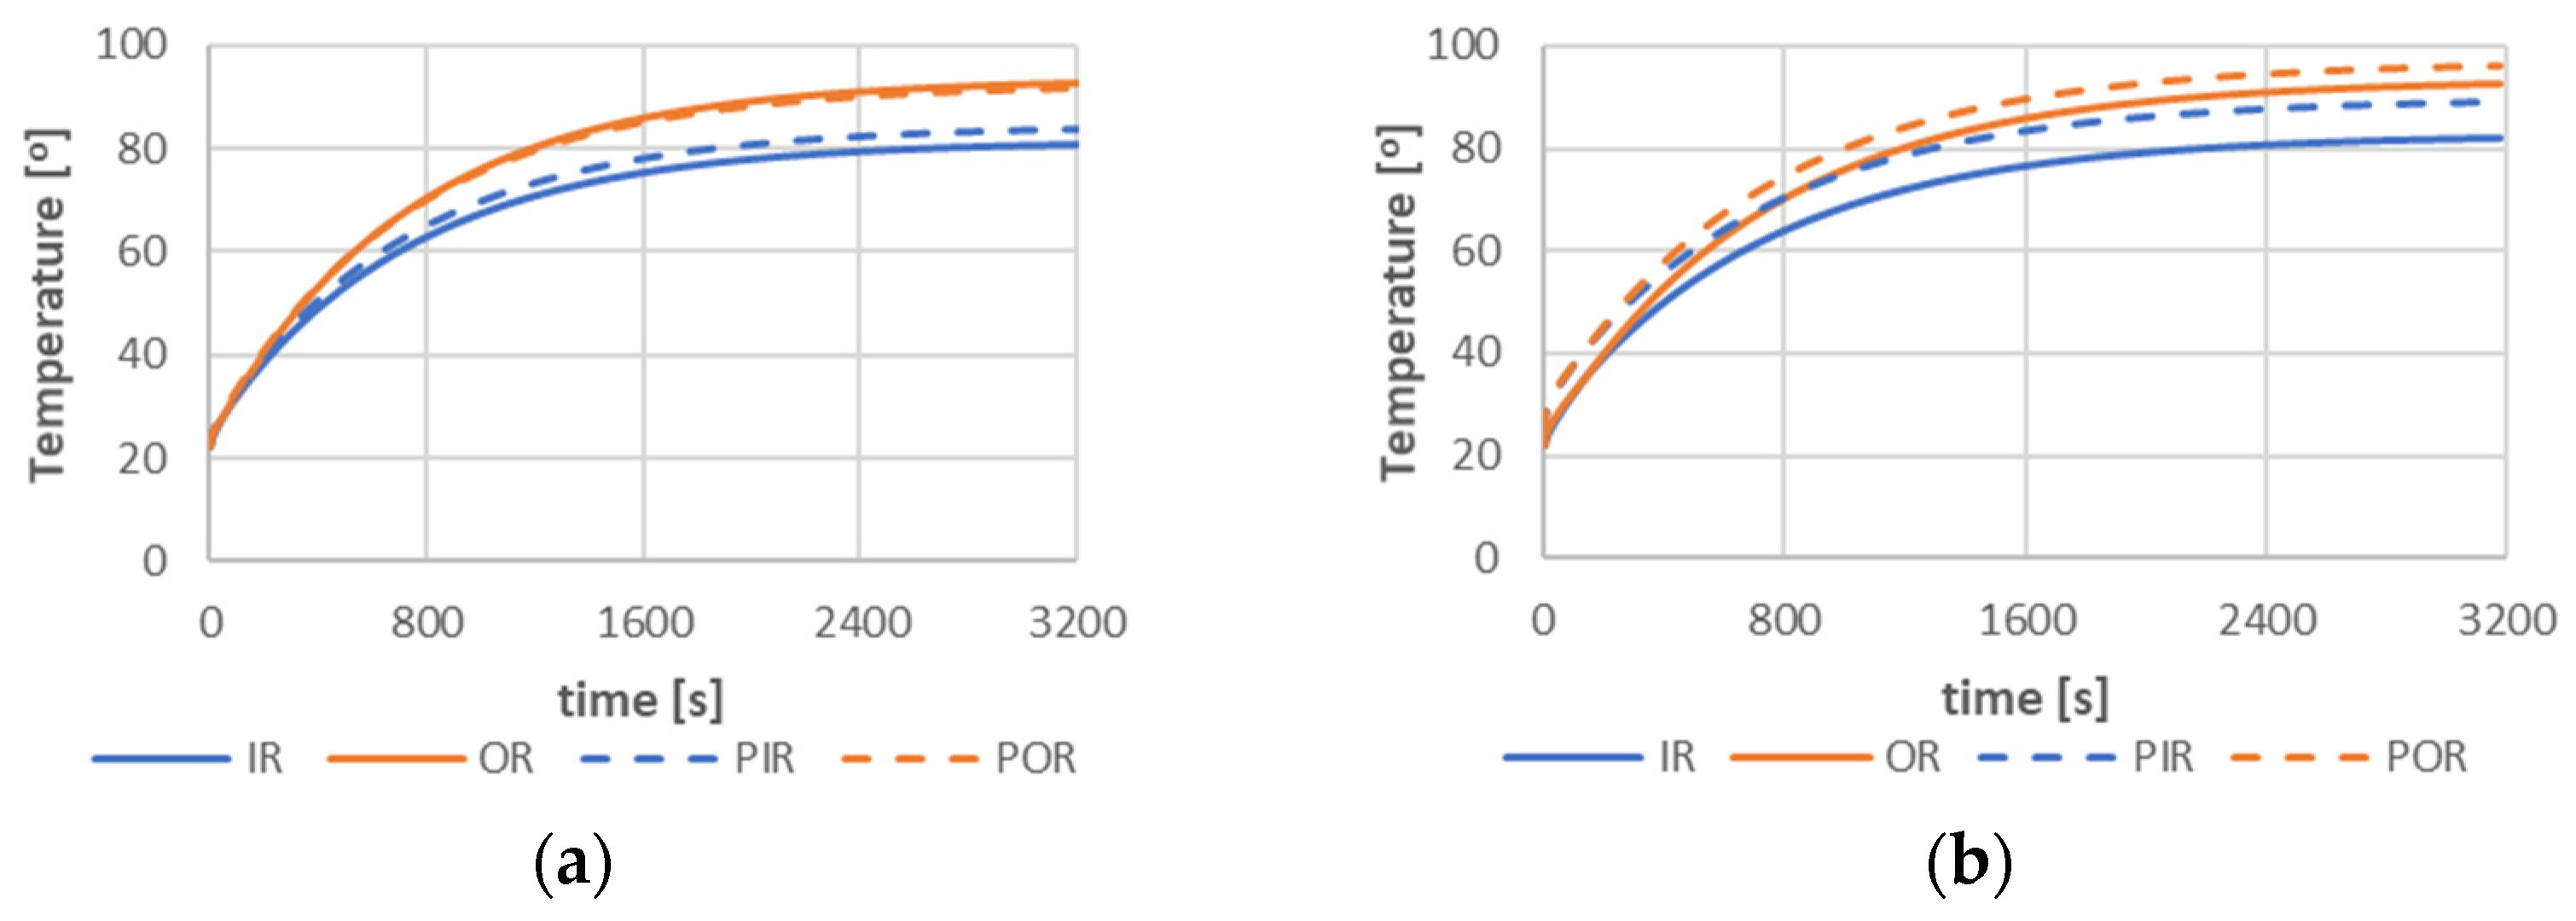
Figure 5 shows two examples of the temperature course for the variants of the heat source V1 and V6, for the bearing rotational speed of 6000 rpm.
The most important conclusions from these runs are:
temperatures on the outer and inner raceways reach the values of 80–92 °C and differ by approx. 11 °C
temperatures in the places of contact of the balls with raceways differ from the temperatures on the outer and inner rings by approx. 1–2 °C
the time to reach the steady state is about 1 h
Similar simulations were carried out to evaluate the modeling of heat sources for variants V2–V5.
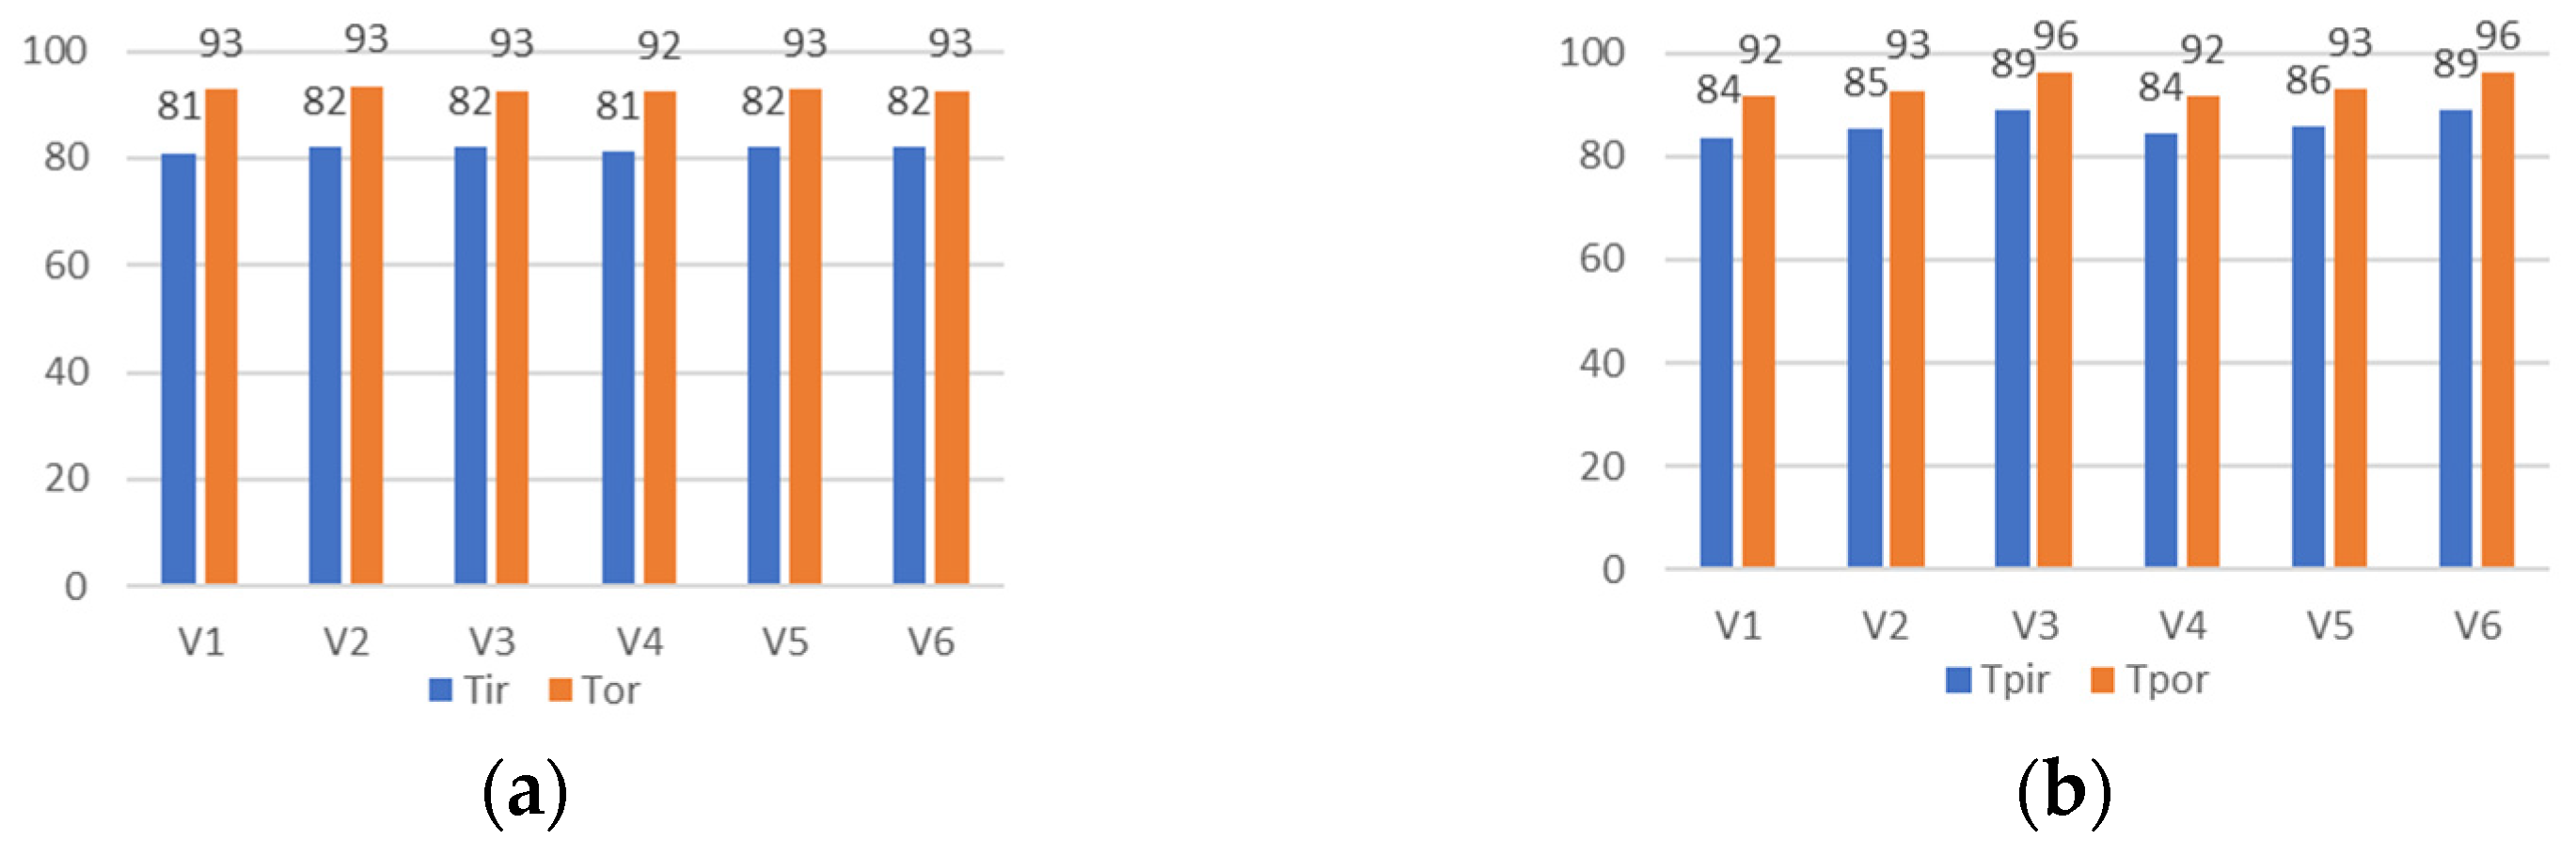
The summary of the results is presented in
Figure 6.
The results in
Figure 6 allow for the following conclusions:
the temperature on the outer and inner rings does not significantly depend on the method of modeling heat sources, represented by variants V1–V6
the temperature difference on the outer and inner rings also does not depend on the arrangement of the heat sources and amounts to approx. 11 °C
for the temperatures at the point of contact of the balls with the raceways, an increase in temperatures on the outer and inner rings is observed as the area to which heat sources are assigned decreases (surfaces to which heat sources are assigned meet the condition V1 > V2 > V3, similarly to V4 > V5 > V6). However, the temperature differences at the points of contact of the balls with the raceways are at the level of 7–8 °C.
On the basis of the simulation tests carried out, a recommendation can be made to model the heat sources in the bearing in the simplest variant, i.e., assigning heat sources only to the entire raceway surfaces, without assigning it to the surface of balls.
In order to estimate the influence of the bearing rotational speed on its temperatures, simulation tests were carried out for the V1 variant. The results of these tests are extremely important for the modeling of heat sources in the bearing, as the viscous resistance significantly depends on the temperature (the viscous resistance depends on the viscosity of the lubricant, which significantly changes with temperature). The tests were carried out in the speed range of 1000–9000 rpm, and as part of the preliminary tests, the temperatures in the bearing were estimated for which viscous resistances were then determined, and then, as part of the main tests, the influence of speed on temperatures was estimated. During the research, the forced convection coefficients were also corrected (5), respectively to the rotational speed.
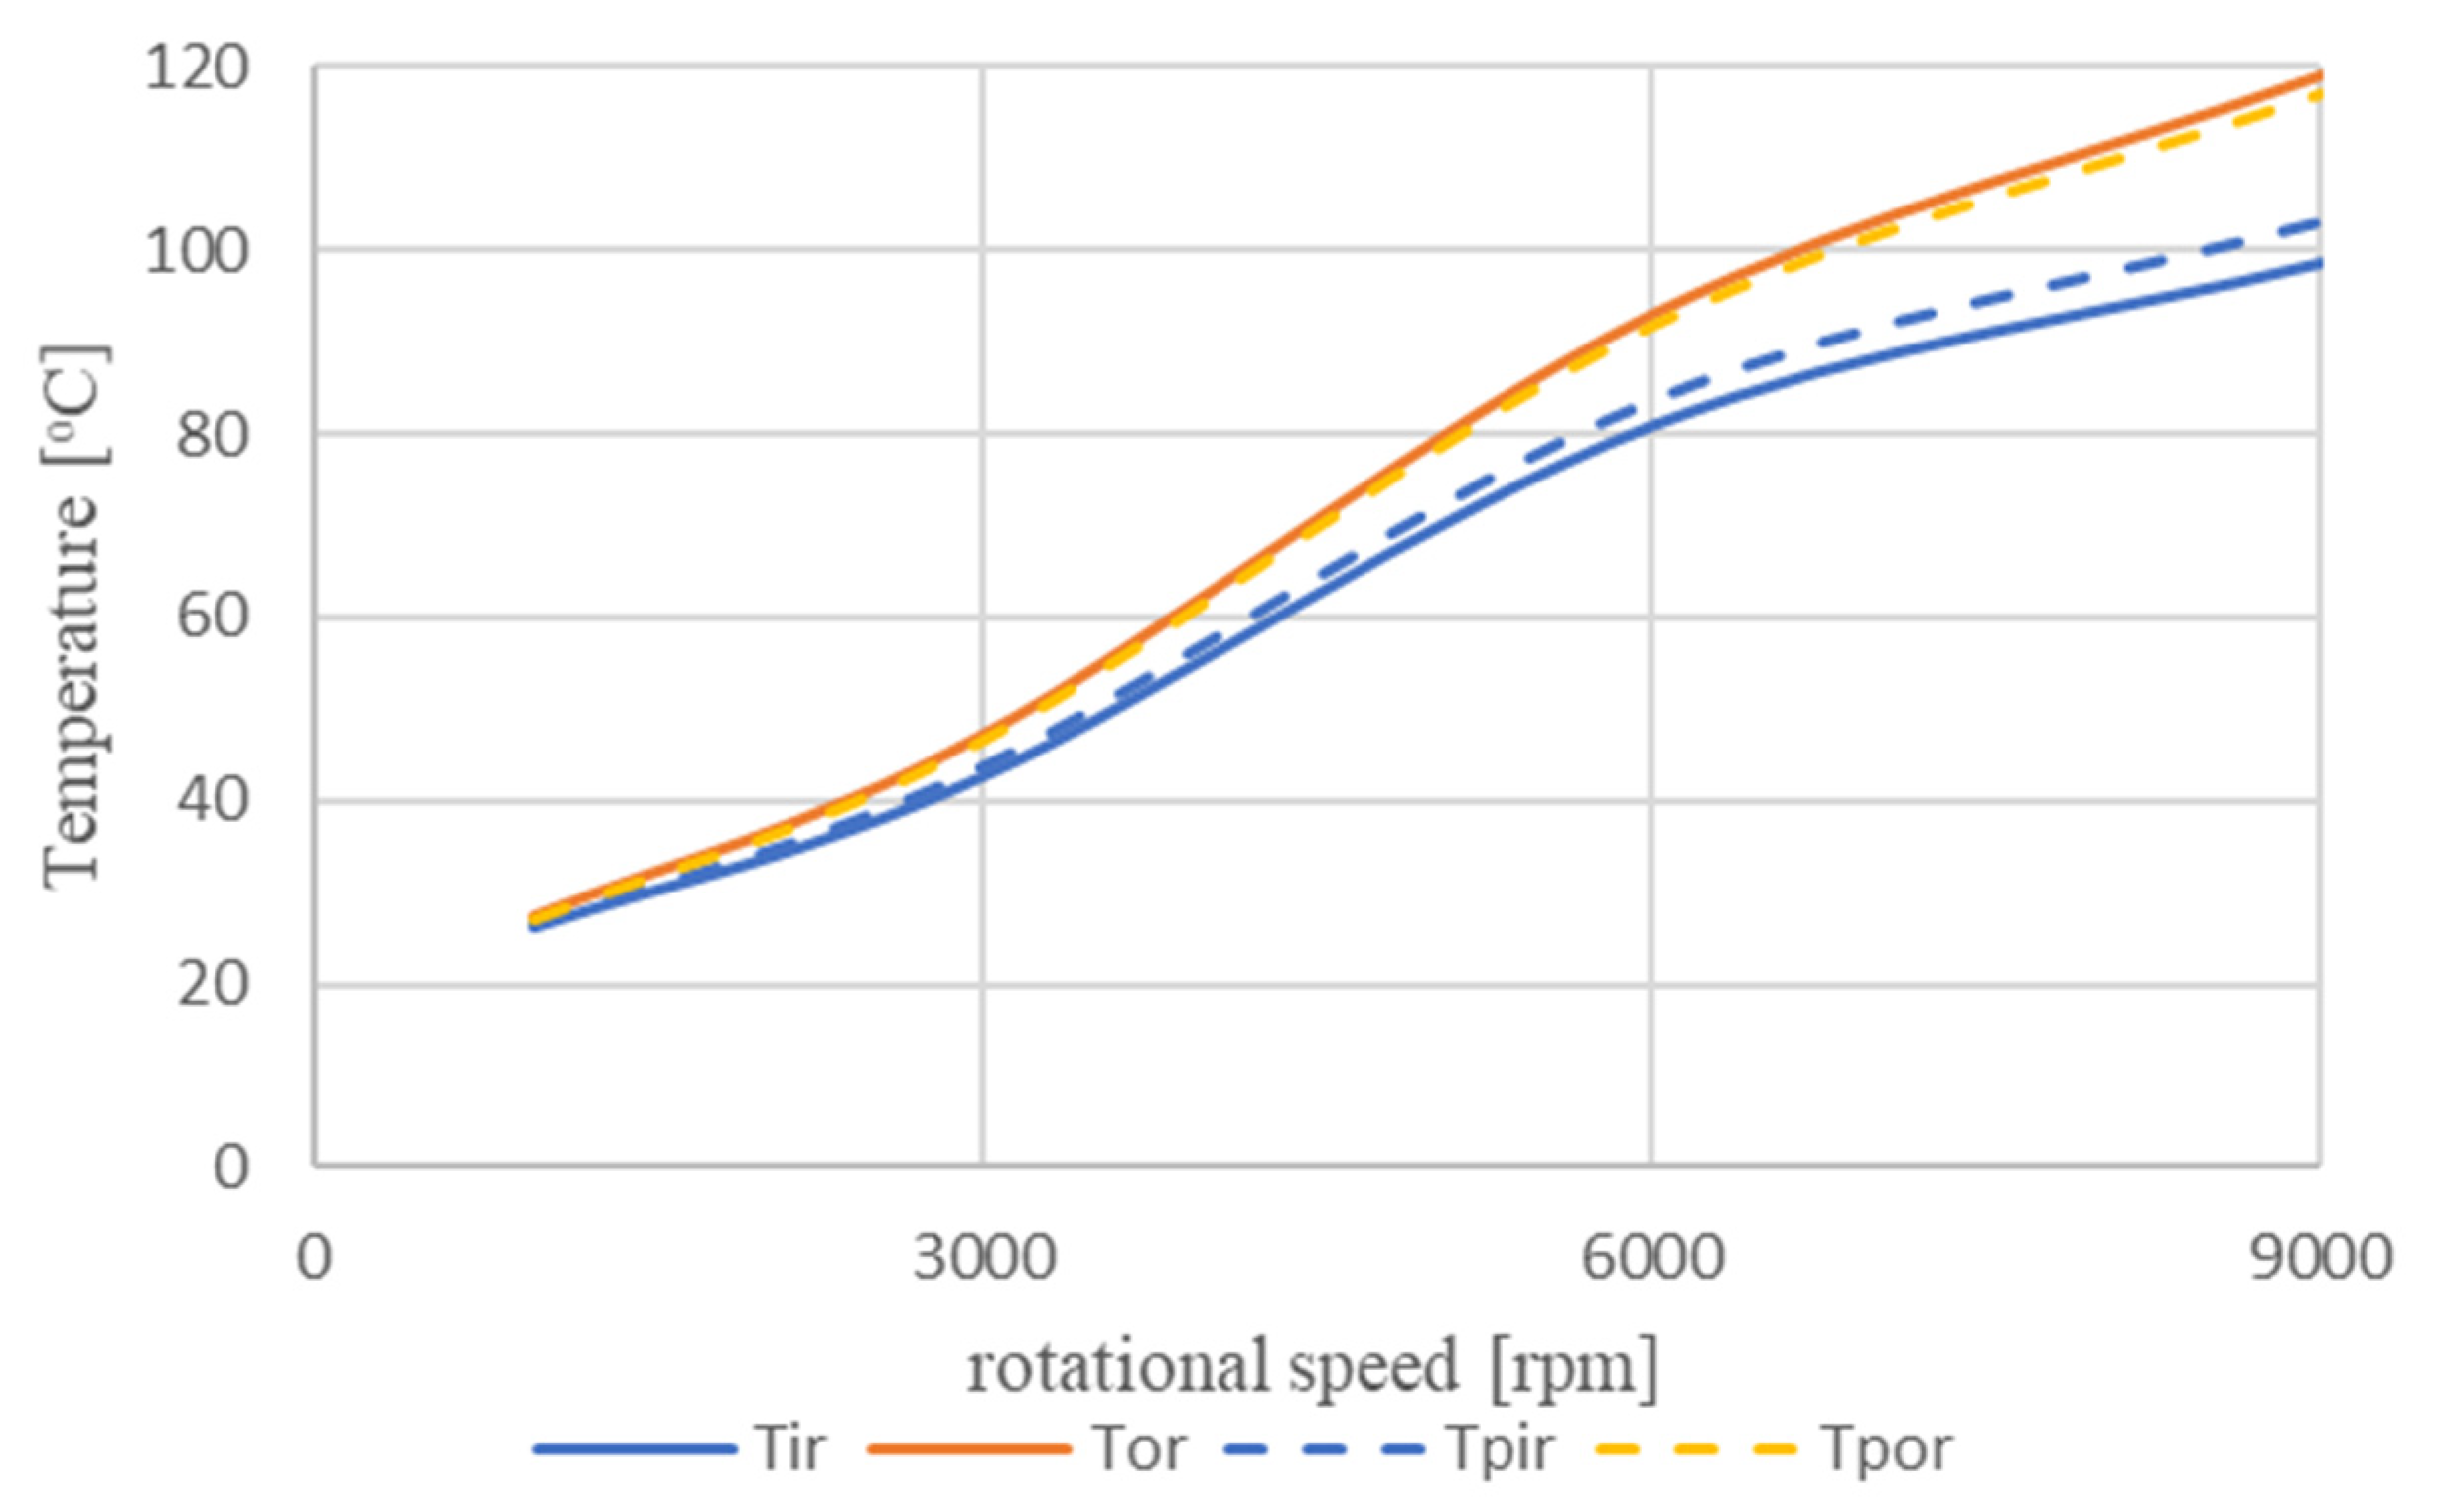
Figure 7 shows the test results in the form of the temperature dependence on raceways on the rotational speed of the bearing. The conclusions from the simulation tests carried out are quite obvious, the increase in speed significantly influences the temperature increase on both rings and at the points of contact of the ball with the raceways.
It is a non-linear relationship, and in the speed range of 1000–9000 rpm the temperatures increase from approx. 27 °C to approx. 120 °C. The temperature difference between the outer and inner rings for 9000 rpm reaches over 20 °C.
These results also explain why in the experimental tests (p. 11) the scope of the tests was limited to 6000 rpm. Temperature rise at higher speeds threatened to seize the bearing.
7.2. The Impact of the Ball-Raceway Contact Model
Commercial FEM systems, such as ANSYS, for example, by default have the so-called default contact models. For example, for the contact of a ball with a concave surface (outer race) or a convex surface (inner race) for bearings with higher accuracy class P5 and P6, these are Bonded class models for which the contact area is determined by the distance between two bodies (Tolerance value of contact). There are also other contact models available, such as: Rough, Frictional, No Separation and Frictionless. Considering that the TCC parameter is significantly dependent on the surface roughness, it may be appropriate to choose a model other than the default one.
The author’s own research [
17] shows that the contact areas resulting mainly from contact deformations of the ball and raceway may have different forms and dimensions (
Figure 2b,c) than the default one (
Figure 2a). This situation may alter the conditions of heat conduction between the balls and raceways. Therefore, the author conducted simulation studies of heat distribution in the bearing for several forms of the contact areas of the ball with raceways. These characters are the same as the areas coded with symbols V1–V6.
All simulation tests were carried out, assuming:
bearing power losses correspond to a bearing speed of 6000 rpm and are only assigned to the areas of the inner and outer raceways (variant V1)
in the geometric model of the bearing, the contact areas of the ball with the raceways were defined in the same way as the areas to which heat sources were assigned (areas V1–V6)
the remaining conditions of the simulation tests were the same as in the presented tests (p. 5)
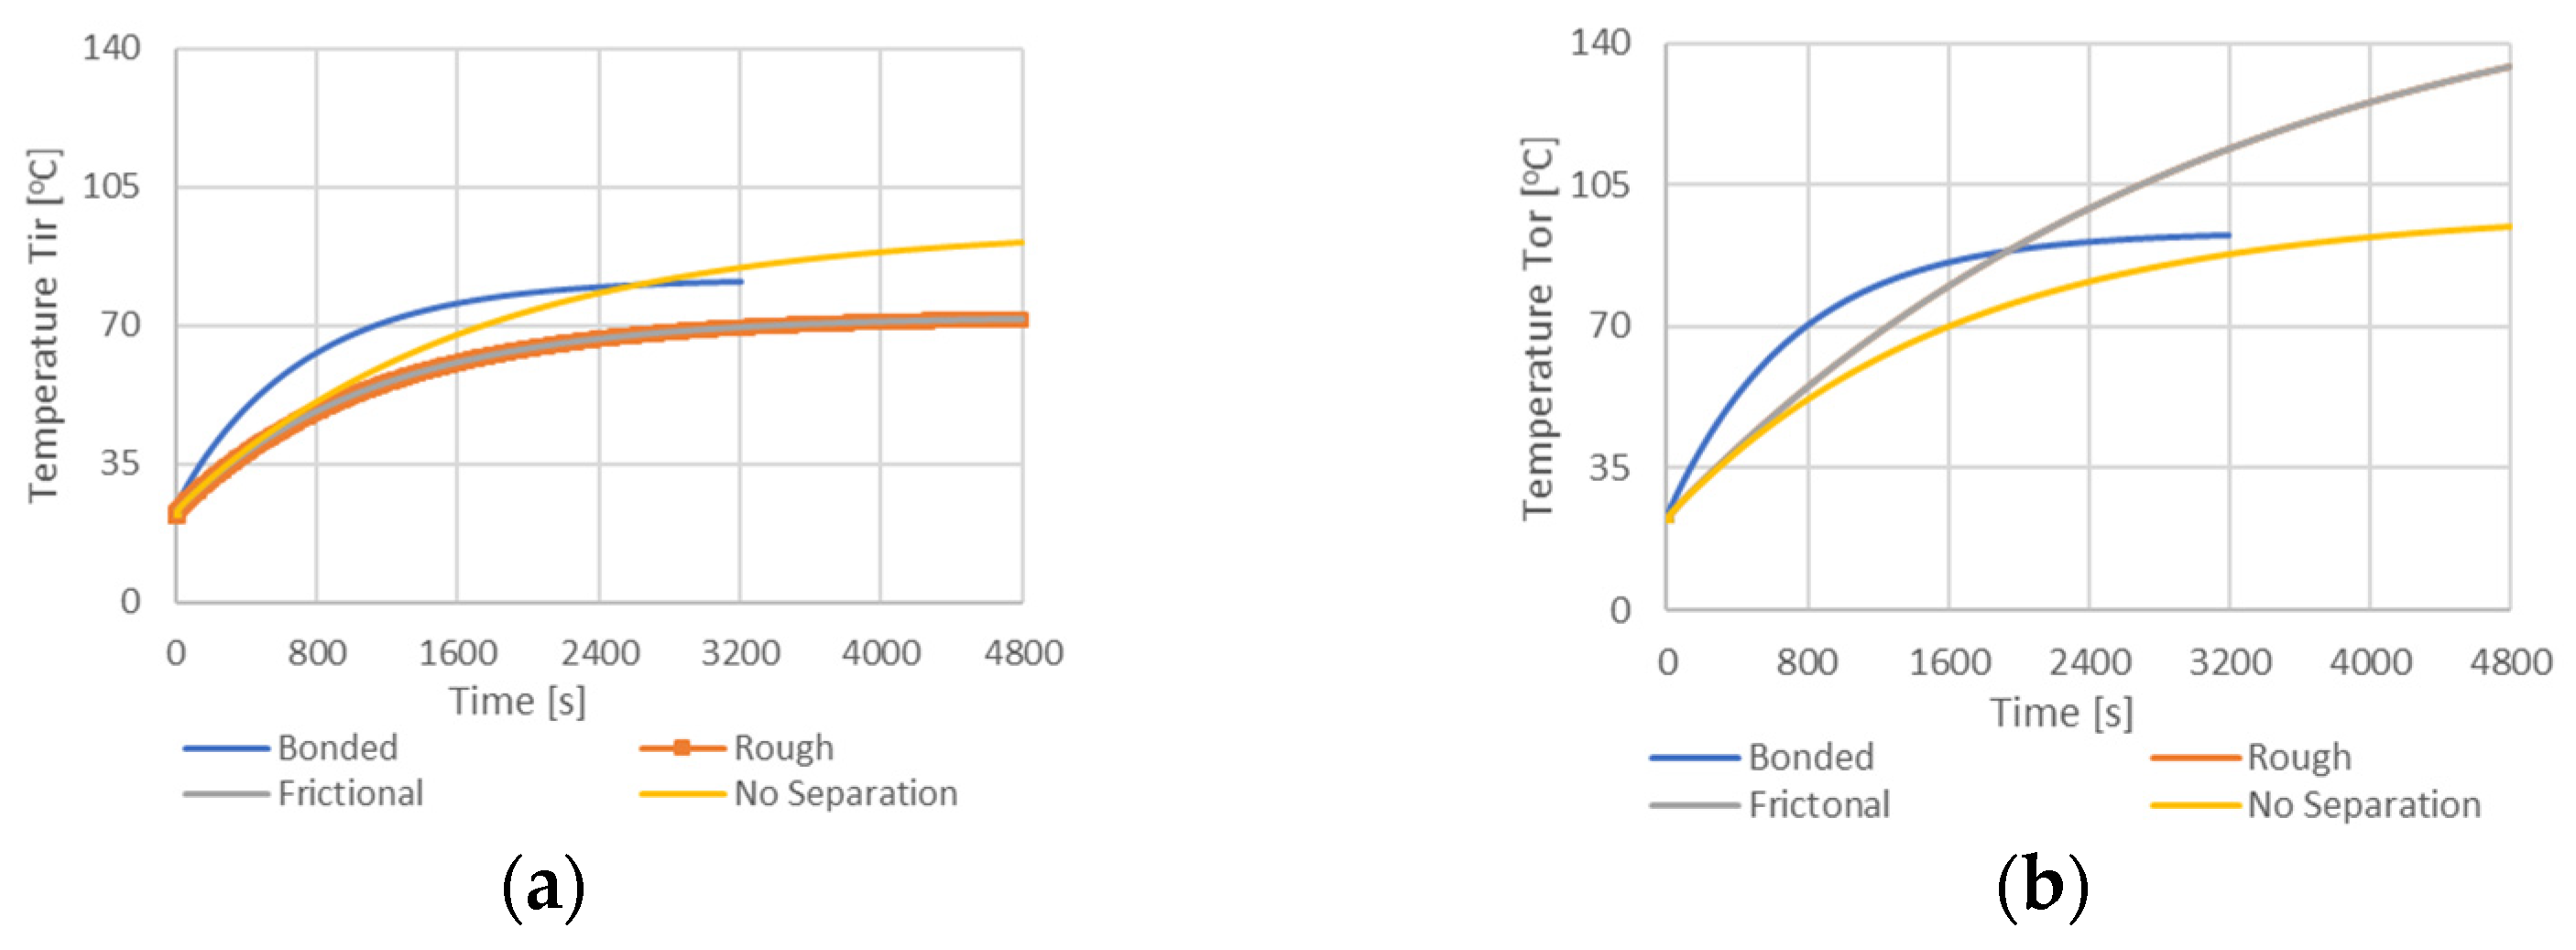
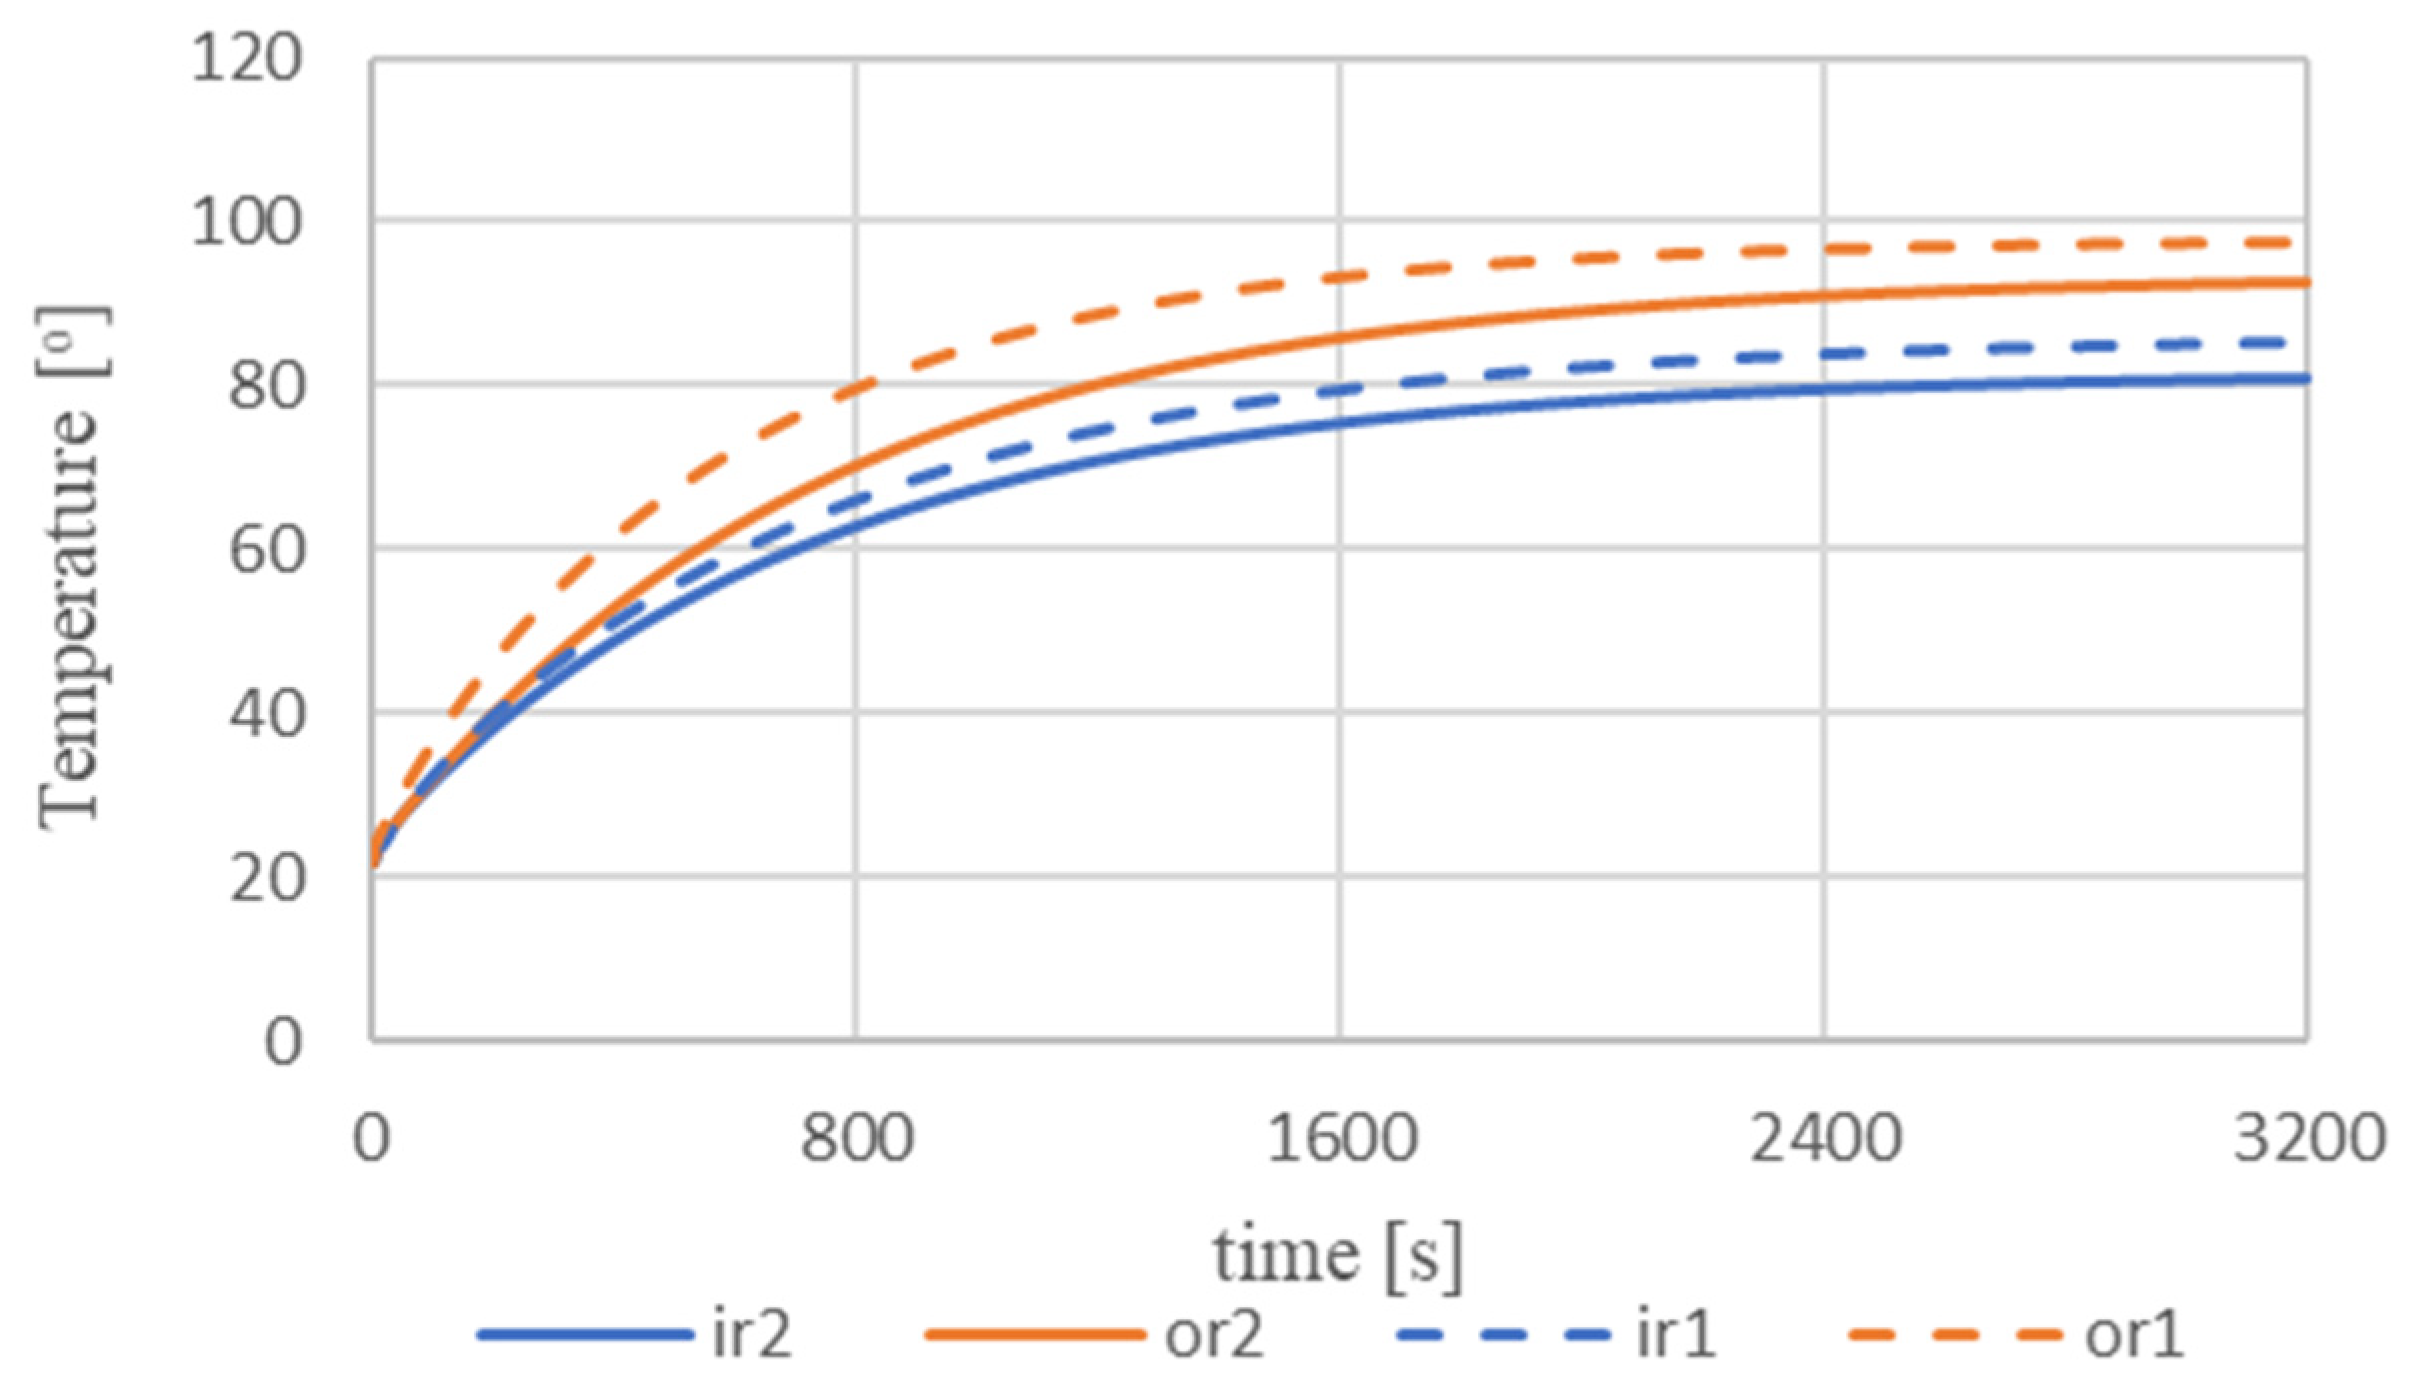
Figure 8 shows an example of the temperature curves of the inner and outer rings for several contact models.
Based on the results of the research presented in
Figure 8, it can be concluded that:
bearing ring temperatures, both in steady state and in transient states, differ significantly depending on the adopted contact model
the time of reaching a steady state in the temperature courses significantly depends on the contact model
On the other hand,
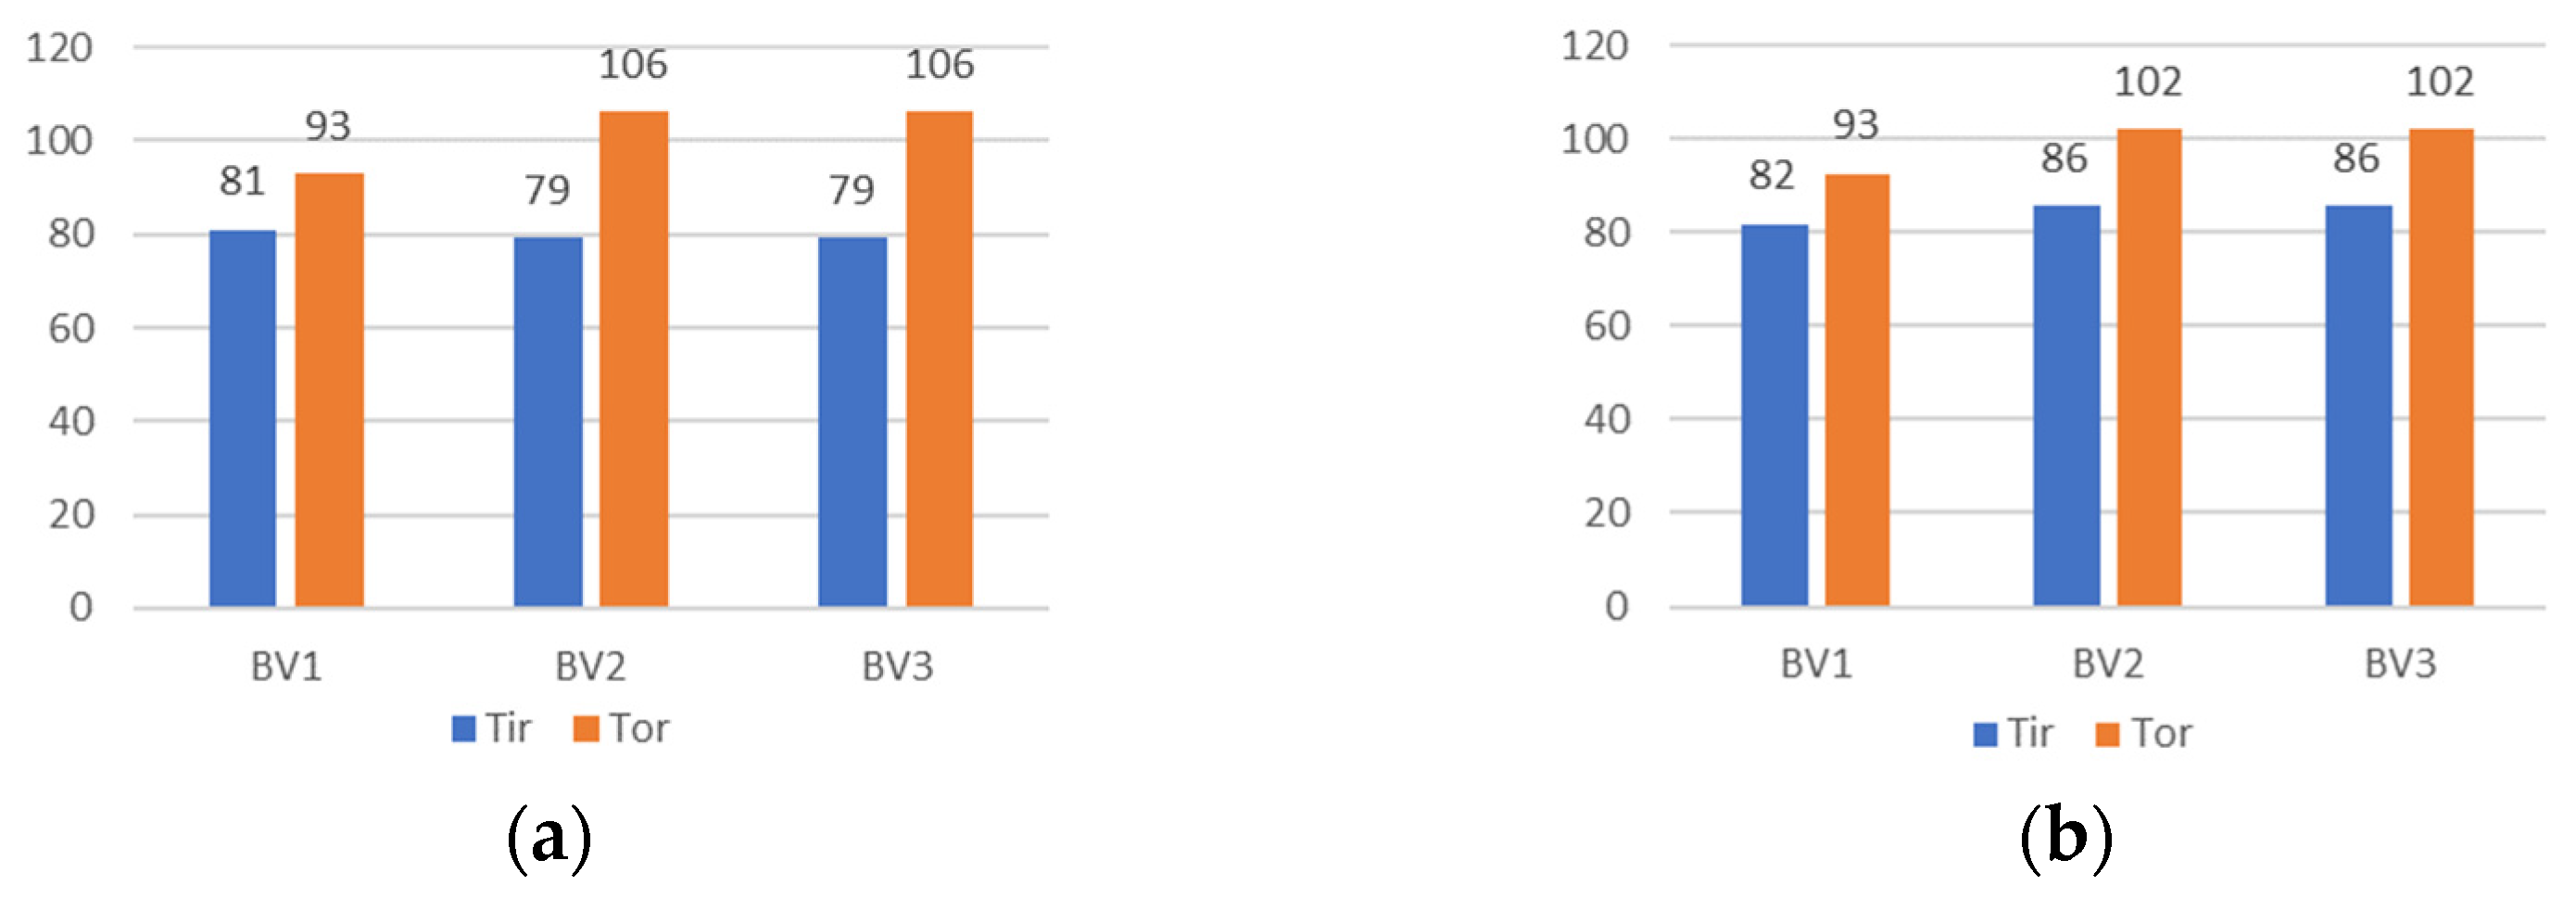
Figure 9 presents a collective comparison of the results of simulation studies of the influence of the contact model on temperatures.
The method of modeling contact areas results in the following consequences:
Contact areas have a significant influence, in particular on the steady-state temperatures of the outer ring. Depending on the contact area (BV1, BV2 or BV3), the Tor temperatures vary by up to 13 °C, with the lowest for the BV1 area which is the largest area. Such large differences are not observed for the inner ring. This means that the heat flow through areas with a smaller surface area is less intense.
Contact areas significantly influence the temperature differences Tir and Tor. They range from 11 °C for the BV1 variant to 27 °C for the BV2 and BV3 variants, with the lowest difference being in the area with the largest BV1 area.
For the outer ring, for models of contact areas with areas smaller (BV2 and BV3) than the default model (BV1), the temperature is higher than the temperature for the default model (BV1), even by a few degrees.
This means that the choice of the contact area model will have a significant impact on the temperature distribution in the bearing.
It should be noted that all tests were performed for the default TCC variant, i.e., for the Program Controlled.
Which of the models of contact areas is closer to reality will be determined by the experimental verification.
7.3. The Impact of Heat Convection
As already mentioned, convection is the primary heat transfer mechanism between a bearing and its surroundings. Moreover, free convection, mainly on the elements of the bearing seat, significantly depends on the temperature of the elements of the seat and the outer ring. On the other hand, forced convection, occurring mainly on the shaft and the inner ring, is constant for a given rotational speed of the bearing.
Through convection, the designer of the bearing seat has the ability to influence the thermal state, as the amount of heat that flows to the environment is proportional to the surface of the elements from which the heat flows. By selecting the size of all surfaces, it can achieve the desired thermal state.
All the tests described in items 6 were carried out for a virtual bearing seat in which the ratio of the surface with free convection to the surface with forced convection was 2. This was due to the construction of the body of the bearing seat and the shaft (
Figure 3b).
To assess the effect of convection on temperatures in the bearing, simulation tests were also carried out for the variant of heat sources V1, but for a different surface ratio, equal to 1 (due to structural changes to the seat body).
Figure 10 shows the temperature courses on the inner and outer rings for both variants of convection, i.e., for the quotient of 2 and 1.
The conclusion from these studies is quite obvious: due to the fact that the free convection coefficient is lower than the forced convection coefficient, the change in the pro-portion of heat emitting surfaces to the environment affects the temperature distribution. In the example in
Figure 10, the temperature in the steady state changed by approx. 5 °C.
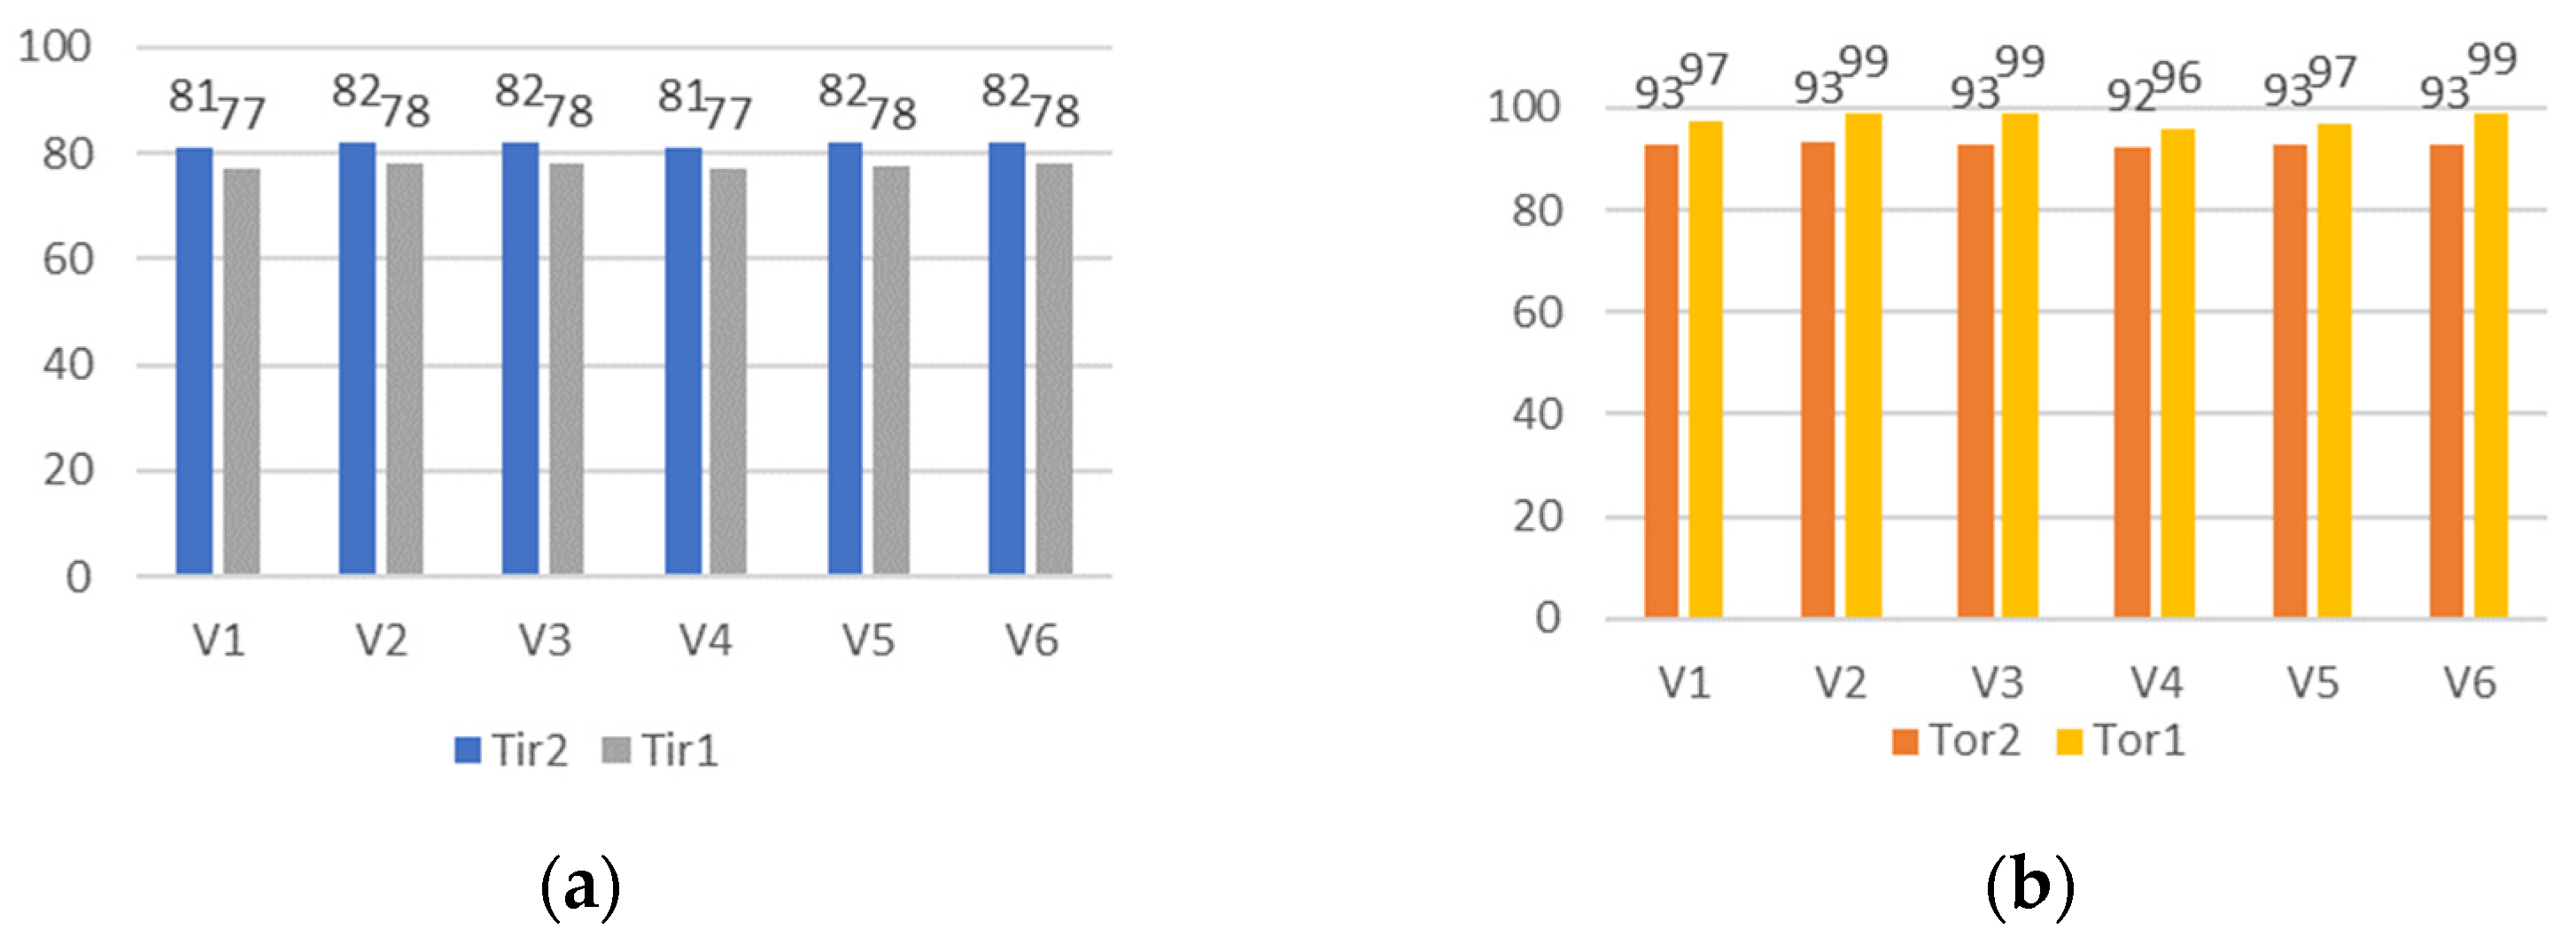
Figure 11 presents a summary of temperatures for two values of the area quotients, 2 and 1, for all variants of heat sources V1–V6. For these variants of heat sources there is a similar temperature difference of 4 °C for the inner ring and 4–6 °C for the outer ring, except that for the inner ring there is Tir2 > Tir1, and for the outer ring Tor2 < Tor1.
8. Influence of Temperature on Thermal Deformation of Bearing
As already mentioned, the aim of the research is to verify the sparse literature reports on the influence of the temperature in the bearing on its resistance to motion. The thesis about the change in resistance to motion due to temperature change results from the fact that thermal deformation of the bearing elements can cause a change in the clearance between the balls and raceways. If such a clearance is reduced, the consequence will be an increase in the resistance, while if it is increased, the resistance will decrease, and in an extreme case, skidding of the balls may occur.
The simulation tests were reduced to the estimation of thermal deformations
δ(i)T and
δ(o)T at the points of contact of the ball with the raceways.
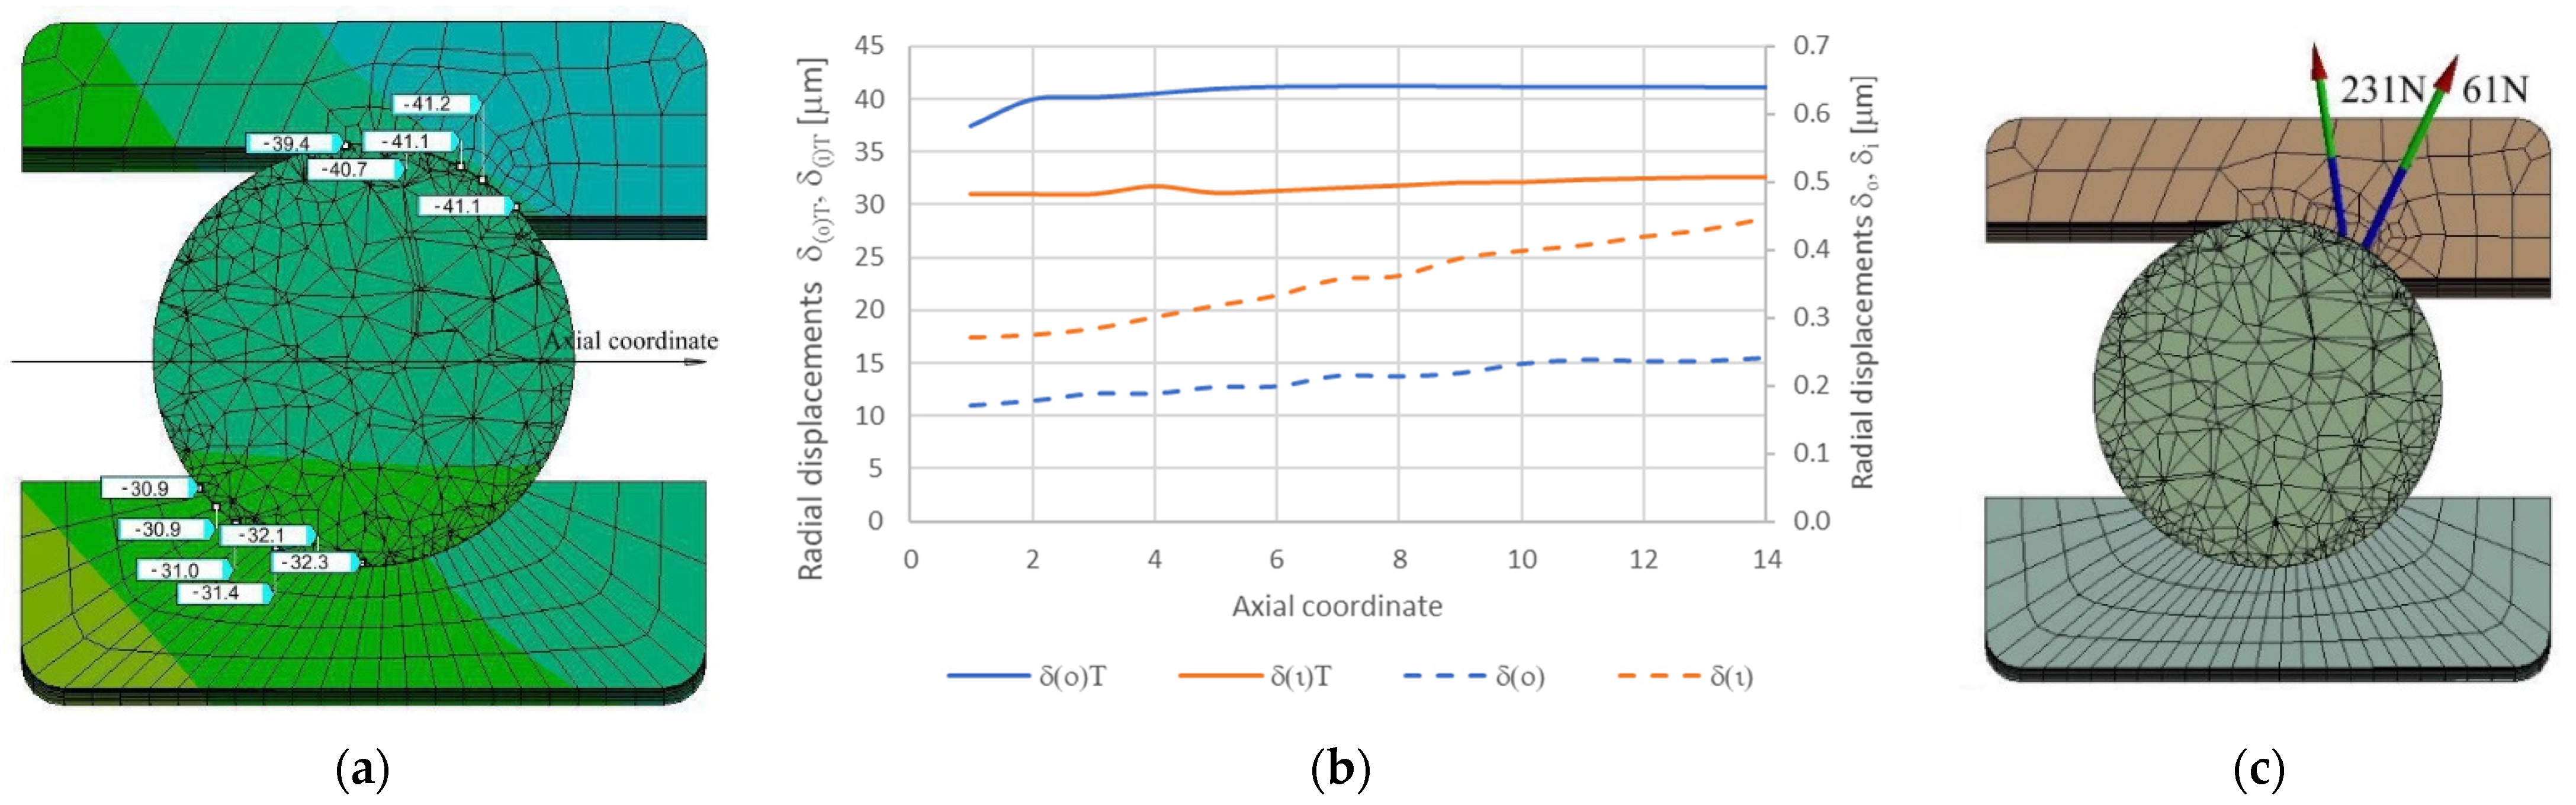
Figure 12a shows an example of obtained results.
Figure 12a shows the effect in the form of thermal deformations in the radial direction of the outer ring. Based on the simulation results as shown in
Figure 12a, a graph of such deformations as a function of the axial coordinate was developed (
Figure 12b). This diagram shows both thermal and mechanical deformations (caused by preload and centrifugal force).
Figure 12c shows the contact loads between the ball and the outer raceway corresponding to thermal and mechanical deformations.
If, in the unloaded state and with the bearing stationary, the distance between the contact points of the ball and the raceways was equal to the ball diameter, then in the example case as in
Figure 12b, this distance changed up to 10 μm for thermal deformations and 0.25 μm for mechanical deformations (caused by preload and centrifugal forces). These deformations are the source of contact forces, which for thermal effects amounted to approx. 231N (
Figure 12c) and for mechanical effects to approx. 61N. These forces will be a source of resistance to movement in the bearing.
Also note the substantially different positioning of the contact force vector for thermal and mechanical effects. The values and directions of action of these contact loads vary significantly.
The examples in
Figure 12 show how important it is to design the bearing arrangement due to heat convection to the environment. The constructor of the bearing arrangement has tools for shaping the heat flows by selecting the surface of the bearing seat and shaft, but must have knowledge about the thermal state.
9. Experimental Verification Tests of Bearing Temperatures
As already mentioned, experimental verification of temperatures is necessary, as the results of simulation tests differed, among others, in for modeling contact areas and distribution of heat sources. Experimental research should allow for the identification of the best, i.e., the closest to reality, method of FEM simulation modeling.
In the Department of Mechanical Engineering of the SUT there is a research stand for testing resistance to motion and temperatures in bearings [
17].
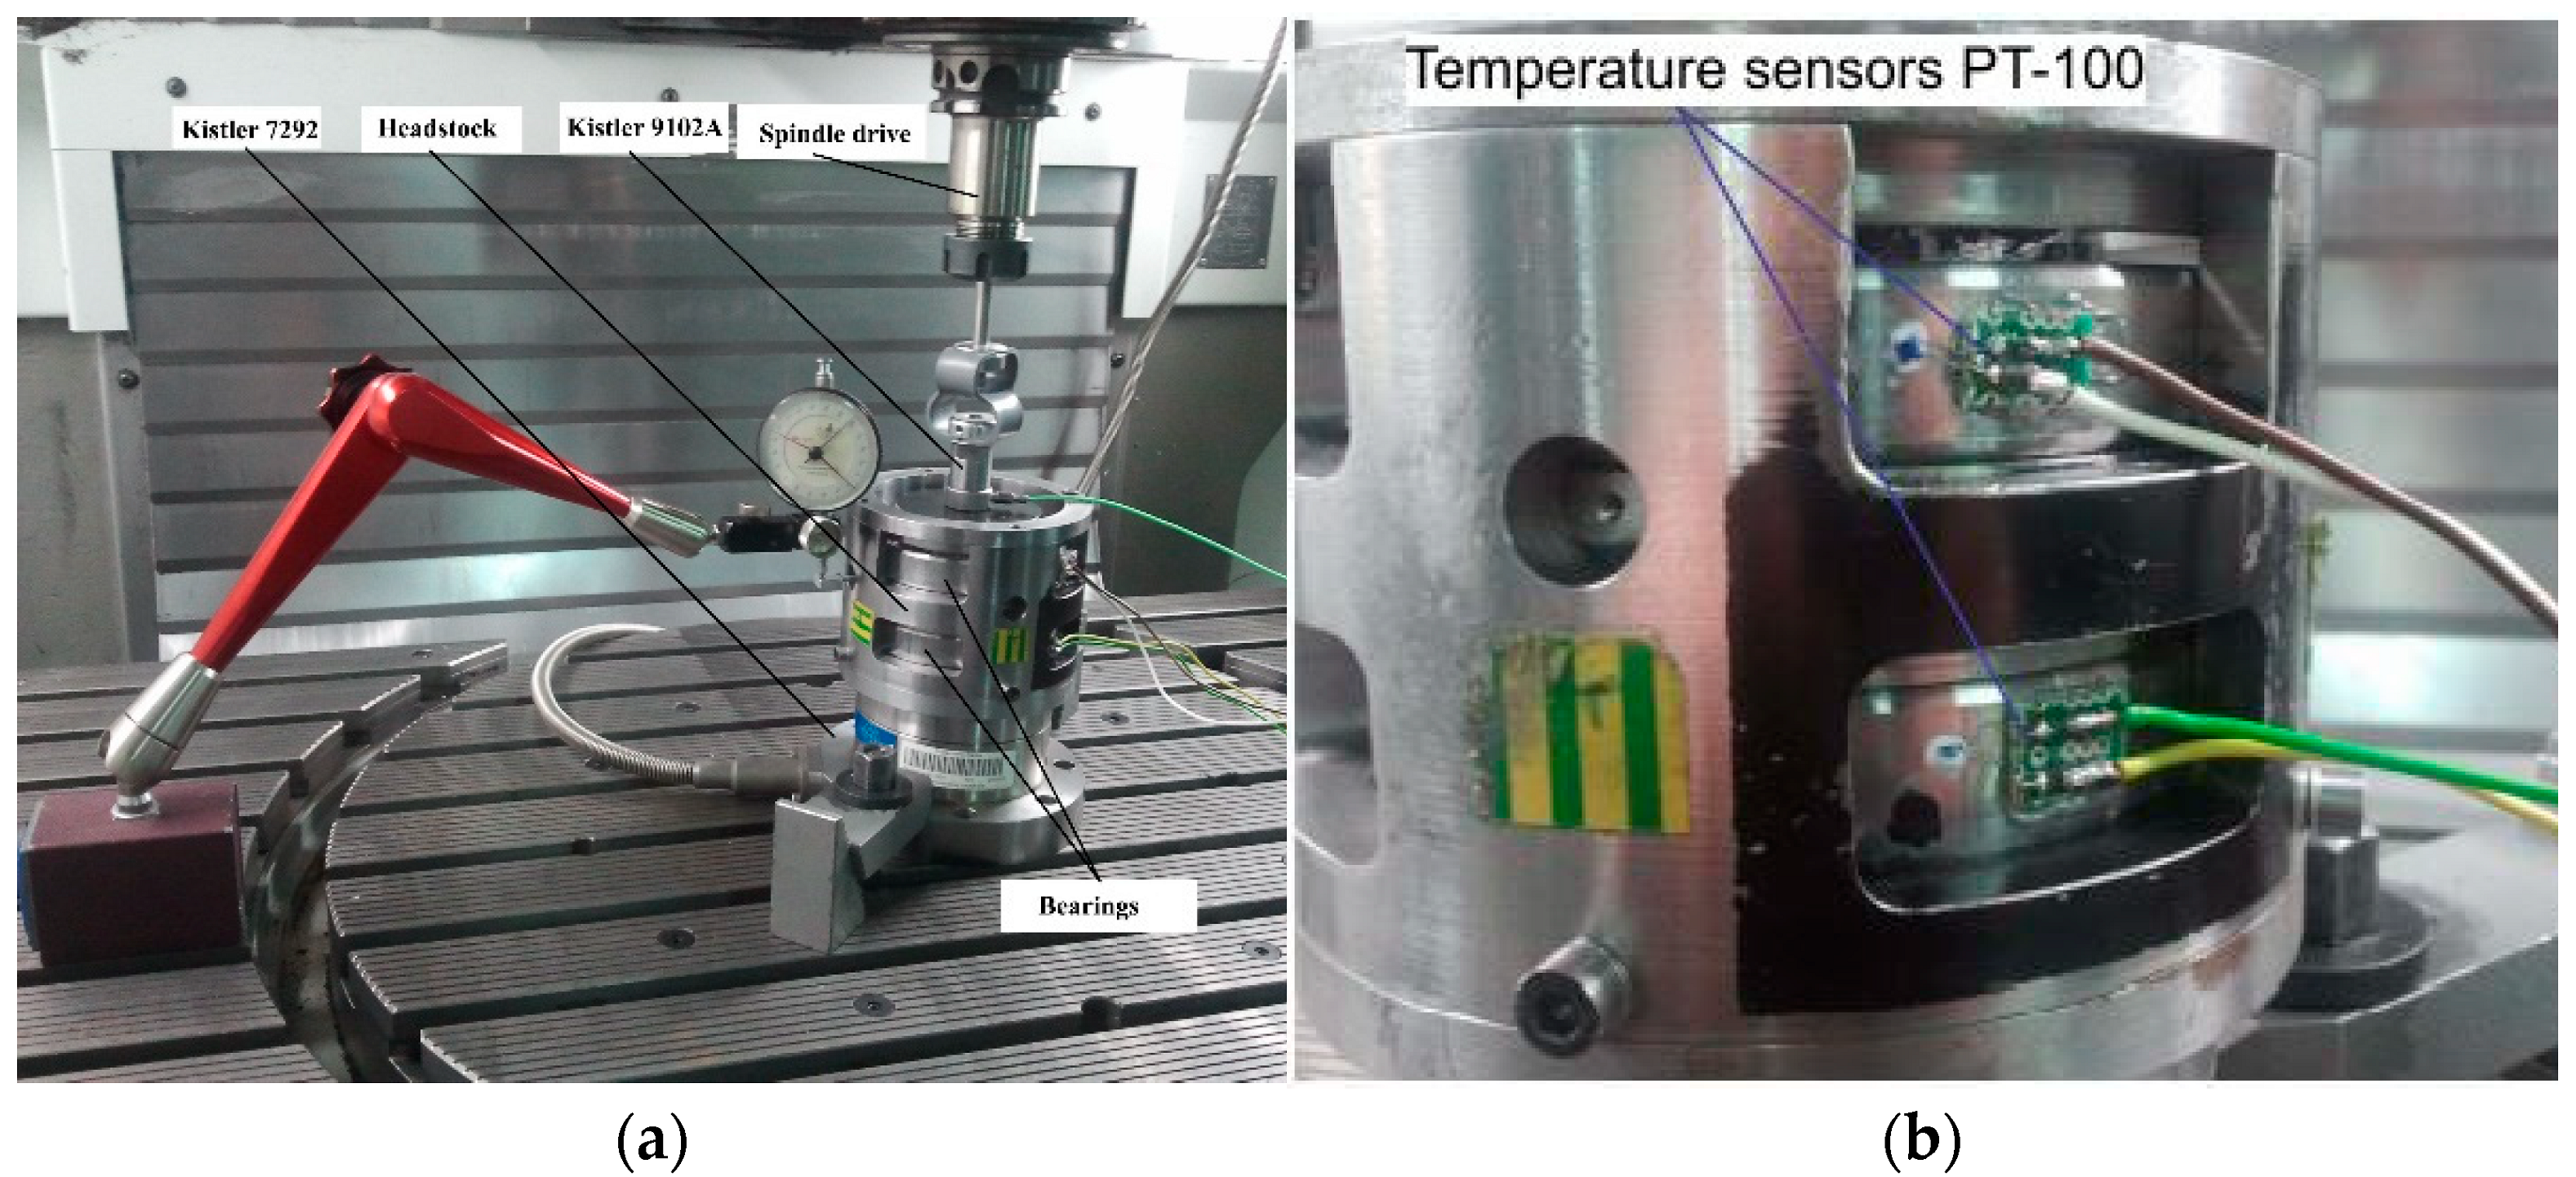
Figure 13 shows the view of this station. The stand is in the form of a headstock in which the spindle is mounted on two angular contact ball bearings. The headstock rests on the Kistler 7292 torque sensor, which measures the resistance to motion. The preloading of the bearings is performed by the nut and the Kistler 9102A axial force sensor, while the spindle rotation is performed by the milling spindle on the table where the entire station rests.
The temperature measurement was carried out with the use of Pt-100 contact sensors, glued on the outer rings of the bearings (
Figure 13b), with the OptisCtLaser pyrometer (temperature measurement on the inner ring) not shown in
Figure 13b and with the VigoCam V50 thermal imaging camera, not shown in
Figure 13b.
The tests consisted in recording the temperatures on the outer and inner ring and the entire headstock (using a camera) until a steady state was reached.
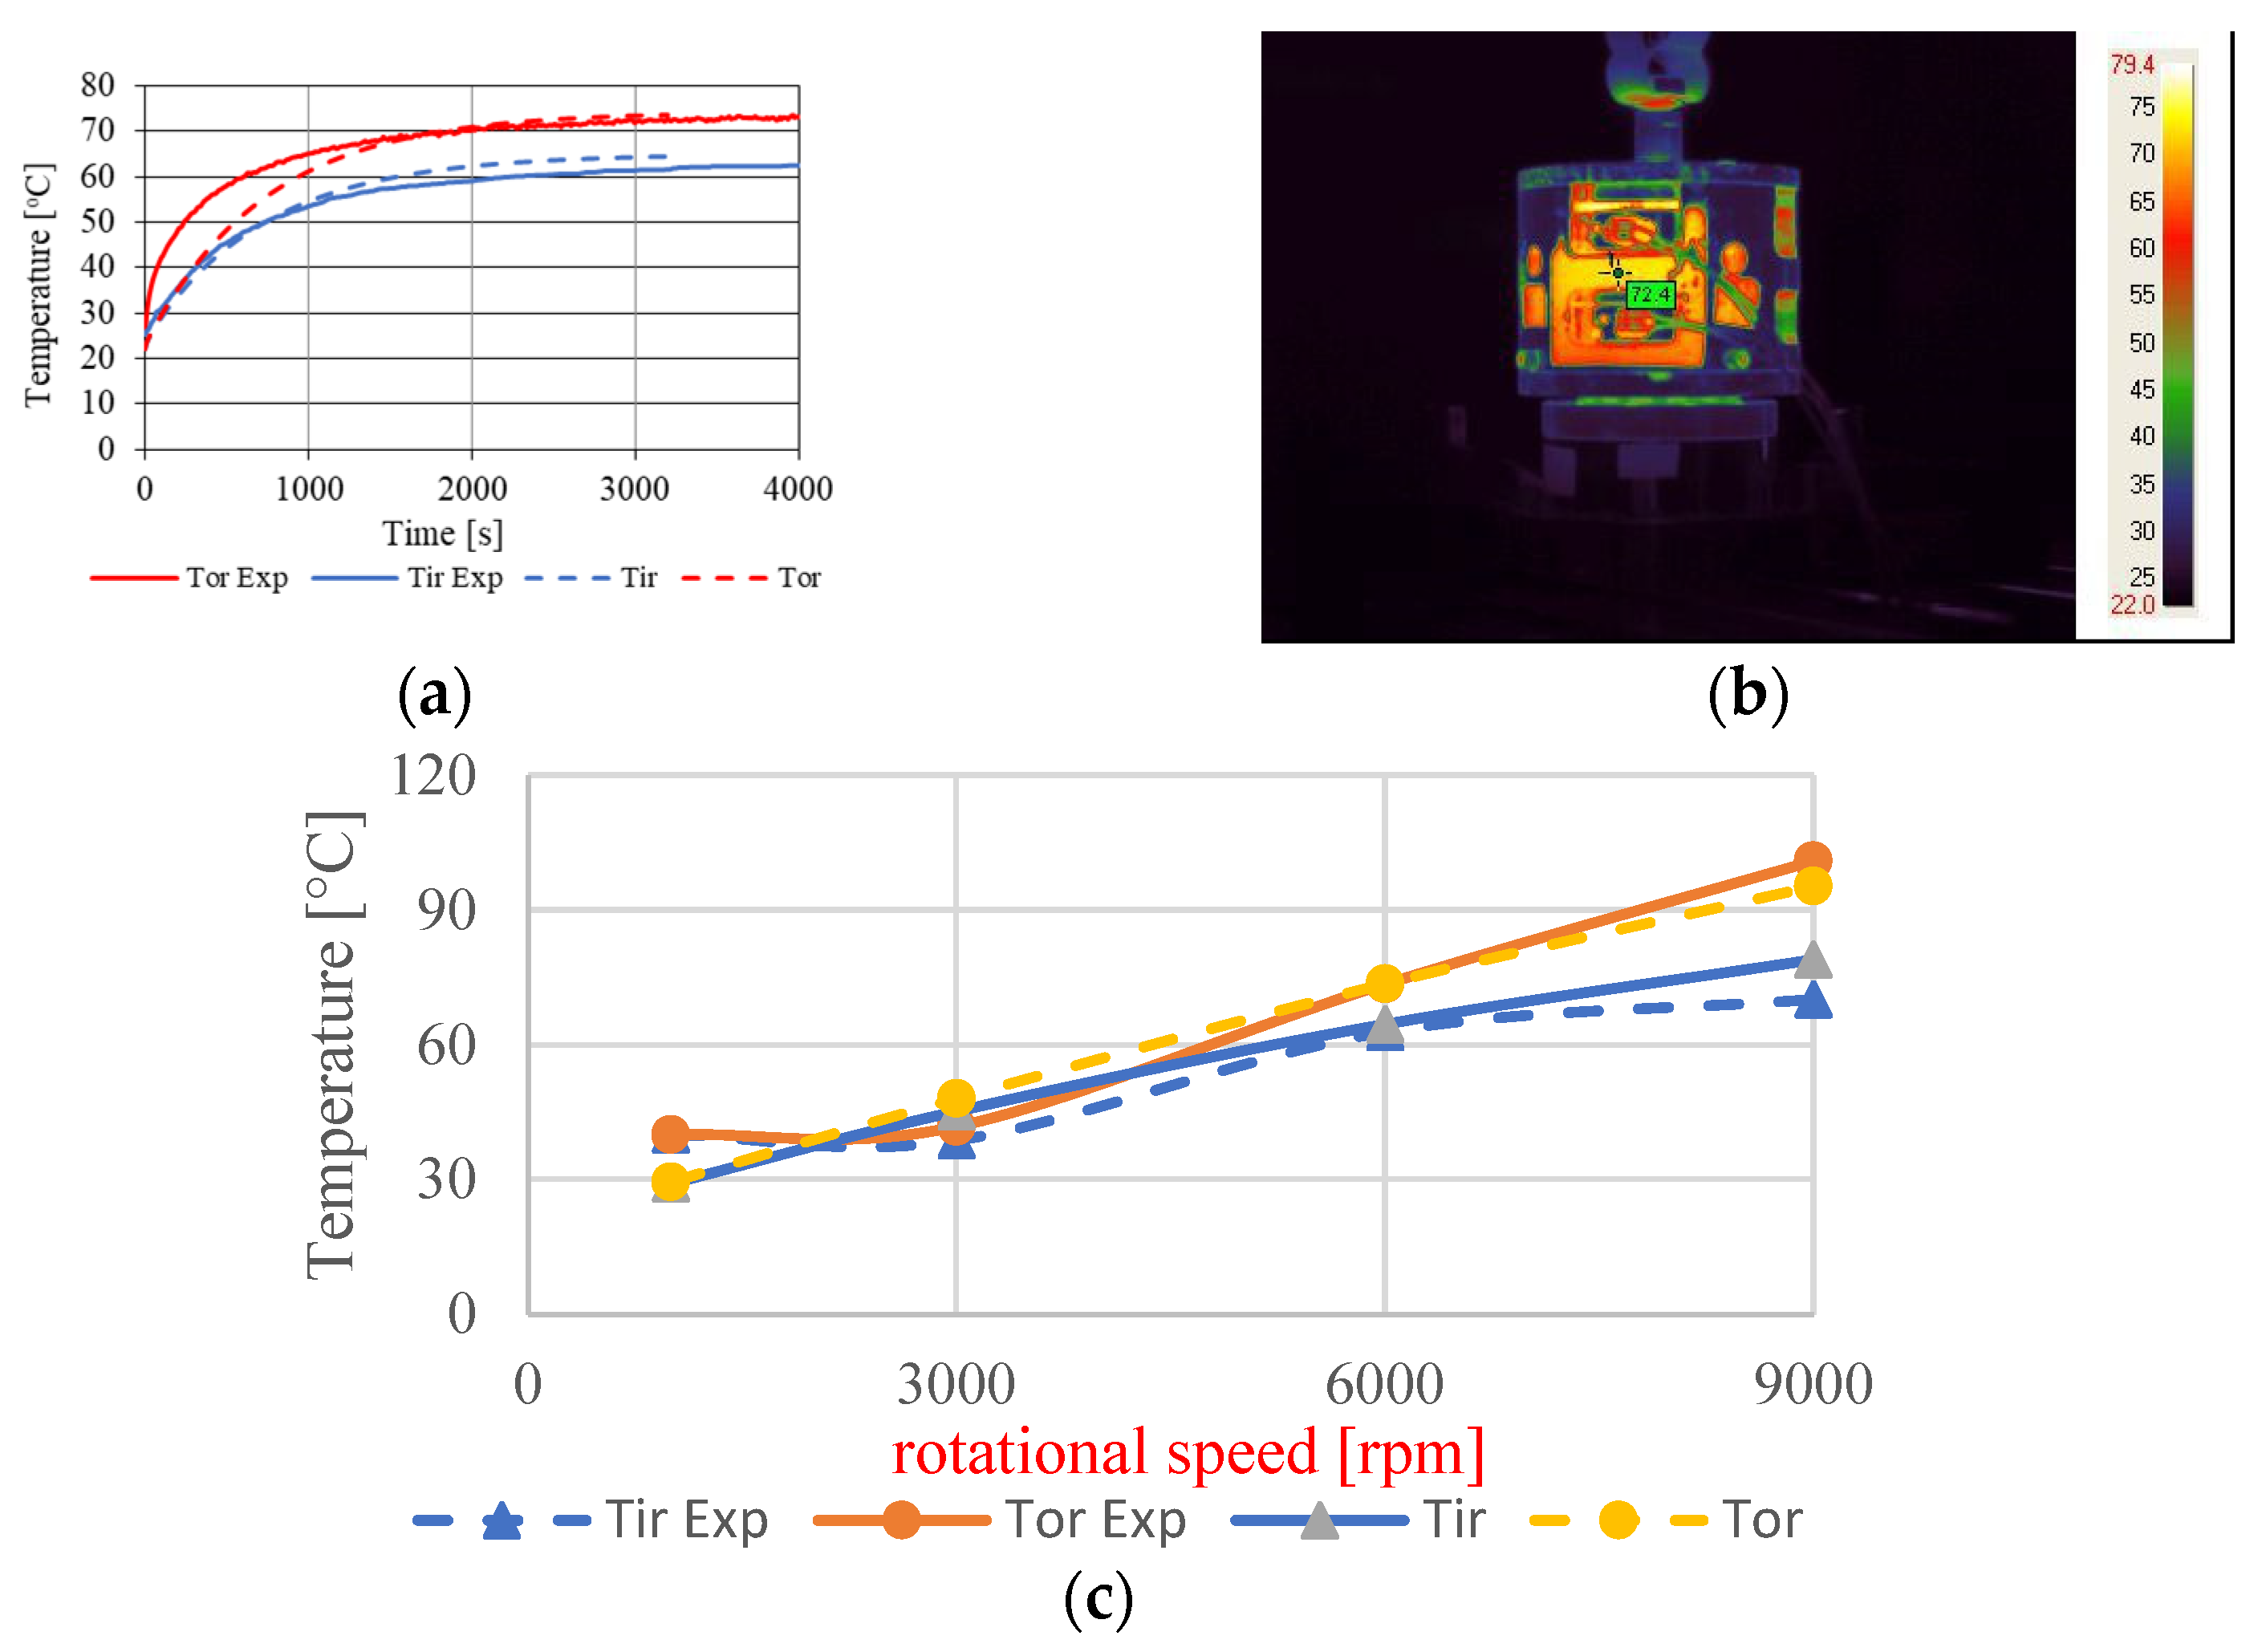
Figure 14a shows an example of the temperature course on the outer and inner rings, and
Figure 14b shows an example of a thermal image from a thermal imaging camera for similar conditions in which the simulation tests were carried out [
17].
Comparing the temperature courses from the simulation tests with the course from the experimental tests in
Figure 14a, one can formulate an opinion about their compliance, first of all qualitative. The temperatures on the outer and inner rings differ in the steady state by approx. 10 °C, and the time to reach the steady state is approx. 1 h. On the other hand, quantitative differences are noticeable, i.e., the temperatures from the experimental tests in the steady state are slightly lower than those from the simulation tests. In contrast, in the transition state for the outer ring, it is significantly different in the first 1000 s.
Figure 14c also shows the simulation and experimental test results in the form of the influence of the bearing rotational speed on the temperatures of the inner and outer rings. Comparing these test results, in this case we can also speak of a qualitative agreement, i.e., the increase in speed is accompanied by an increase in temperatures and the temperature of the outer ring is higher than the inner ring. The quantitative comparison of these results indicates larger differences (TirExp), up to 10 °C. This is mainly due to technical problems in measuring the temperature of the inner ring, which was difficult to access, and due to calibrating the pyrometer, i.e., choosing the correct emissivity factor.
10. Conclusions
In rolling element bearings, especially high-speed bearings, higher temperatures can be expected than in the case of lower rotational speeds. This is often the case in the spindles of HSC machines. High temperatures affect not only the thermal deformation of the spindle, but also the resistance to movement in the bearing. The latter issue is not included in the available literature. Therefore, the article presents the results of simulation tests of temperatures and the resulting thermal deformations of bearing elements. They allow for the following final conclusions:
The method of modeling heat sources in a bearing has no significant effect on the temperature distribution. Therefore, it is suggested to place heat sources only on the raceways of both rings, proportionally to the resistance to motion on these raceways. It is technically the simplest way of modeling heat sources, which does not introduce any significant error to the final results.
The contact model for balls and raceways has a significant influence on the temperature distribution in the bearing. By default, in FEM systems such as Ansys, the Bonded model dominates, and the default contact area includes raceway surfaces and ball surfaces. This method of modeling contacts gives the best compliance with the results of experimental research. Modeling the contact area, e.g., in the form of a contact ellipse, leads to high temperatures on the bearing elements.
Convection of heat to the environment has a significant influence on the temperature distribution in the bearing. The constructor can shape the surfaces of the bearing seat that emit heat to the environment to minimize temperature differences between the outer and inner rings. Then, smaller differences in thermal deformation between these elements can be expected, and consequently, smaller contact forces.
FEM simulation tests show that the influence of temperature on the contact loads of the bearing may be greater than the influence of mechanical loads, and because of this, the resistance to motion may be greater.
Research on the influence of the temperature on the thermal deformation of the bearing elements has to be continued, as the thermal deformations are much larger than the mechanical ones, and thus may have a greater impact on the resistance to motion of the bearing.


