Article

An In Vitro Study of Different Types of Greek Honey as Potential Natural Antimicrobials against Dental Caries and Other Oral Pathogenic Microorganisms. Case Study Simulation of Oral Cavity Conditions

by
Chrysoula (Chrysa) Voidarou
1,*,
Maria Antoniadou
2,
Georgios Rozos
1,
Athanasios Alexopoulos
3,
Elpida Giorgi
4,
Athina Tzora
1,
Ioannis Skoufos
1,
Theodoros Varzakas
5 and
Eugenia Bezirtzoglou
4
1
Laboratory of Animal Health, Food Hygiene and Quality, Department of Agriculture, University of Ioannina, 47100 Arta, Greece
2
School of Dentistry, National and Kapodistrian University of Athens, Goudi, 11527 Athens, Greece
3
Laboratory of Microbiology, Biotechnology & Hygiene, Department of Agricultural Development, Democritus University of Thrace, 68200 Orestiada, Greece
4
Laboratory of Hygiene and Environmental Protection, Medical School, Democritus University of Thrace, 67100 Alexandroupolis, Greece
5
Department of Food Science and Technology, University of the Peloponnese, Antikalamos, 24100 Kalamata, Greece
*
Author to whom correspondence should be addressed.
Appl. Sci. 2021, 11(14), 6318; https://doi.org/10.3390/app11146318
Submission received: 28 May 2021 / Revised: 5 July 2021 / Accepted: 6 July 2021 / Published: 8 July 2021
(This article belongs to the Special Issue New Insights in Oral Health and Diets)

Abstract

:
To study the antibacterial effect of different Greek honeys, samples of citrus honey, Saturja spp. Honey, and oregano and sage honey were collected directly from producers. Manuka honey and artificial honey were used as controls. The honeys were diluted in various concentrations to determine the minimum inhibitory concentration (MIC) and were also placed in agar wells to determine the inhibitory zones of growth. The bacteria tested were two reference strains and five pathogens isolated from patients with various dental ailments. A series of samples were diluted with artificial saliva instead of distilled water to simulate the conditions in the oral cavity. The results show that in most cases the Greek honeys, and particularly the citrus honey and the oregano and sage honey, outperformed the antibacterial activity of manuka honey against all tested bacteria. This performance was due to the hydrogen peroxide as well as to other components of the honeys, that is, peptides and other substances such as phenolic compounds and flavonoids. Artificial saliva enhanced the antibacterial effect of the honeys in comparison to distilled water.

1. Introduction

The oral cavity and its tissues form a complicated structure which consists of various anatomical elements of different fine structure and physiology. The main function of the oral cavity—apart from speech—is mastication of the food. It is the entrance of the digestive tract and the interaction of its anatomical elements with food may cause imbalance to the populations of 500 to 700 species of microorganisms which are estimated to inhabit the ecosystem of the oral cavity [1,2,3]. The ultimate result of this imbalance is the development of various lesions to the mucosal surfaces or to the teeth. Furthermore, at least 100 systemic diseases may induce lesions in the oral cavity, more than 500 medicines have oral manifestations, while 145 commonly prescribed drugs cause dry mouth [4,5,6]. Various pathogens, such as Streptococcus mutans exhibit their action causing serious health and oral health problems such as dental caries, while Staphylococcus aureus is found in periodontal pockets and other inflammations of the oral mucosa finally resulting in loss of teeth [7,8]. In addition, it has been clinically demonstrated that bacteria from oral cavity are transported to other locations in the body causing infections such as inflammatory bowel disease (IBS) or participating in the pathogenesis of diseases such as the cirrhotic liver or Alzheimer’s disease, diabetes melitus, adverse pregnancy outcomes, obesity, and polycystic ovary syndrome [1]. For all these reasons, the oral microbiome is of tremendous importance not only to oral health but also to the health of the whole organism. Antibiotics were and still are in the frontline of defense against infections, but their major disadvantage is that more and more resistant bacteria emerge. This resistance is not limited to commonly prescribed antibiotics but concerns even the so-called last resort antibiotics [9,10]. It is obvious that a new alternative strategy is needed and for that reason many researchers have focused their efforts on natural products of the pre-antibiotic era, to discover their salient or hidden antibiotic properties [11].
Honey is such a product with a very long history in human medicine. Since the dawn of humanity, honey has been used for its wound healing properties [12]. The fathers of medicine in classical antiquity mention honey as an excellent medicine for burns and trauma management [13,14]. Being a popular therapeutic in many cultures, honey is considered ideal for gastric and other ailments [15,16]. Chemically, honey is a supersaturated solution of carbohydrates (90–95% of its dry matter) containing no more than 20% of water (usually 17%) [17]. The remaining small portion consists of more than 180 other compounds which include proteins, vitamins, minerals, phenols, and flavonoids. Most researchers agree that the exact composition of the different types of honey depends on their botanical, seasonal, and geographical sources [7,18,19,20,21,22].
The aim of this study is to test the antibacterial activity of different types of honey (from different botanical sources but gathered at the same period and from the same area) against some pathogenic bacteria isolated from dental caries lesions. Furthermore, to determine their efficacy as well as their differences depending on their floral origins and hence stress their possible role for the prevention or the treatment of such lesions.

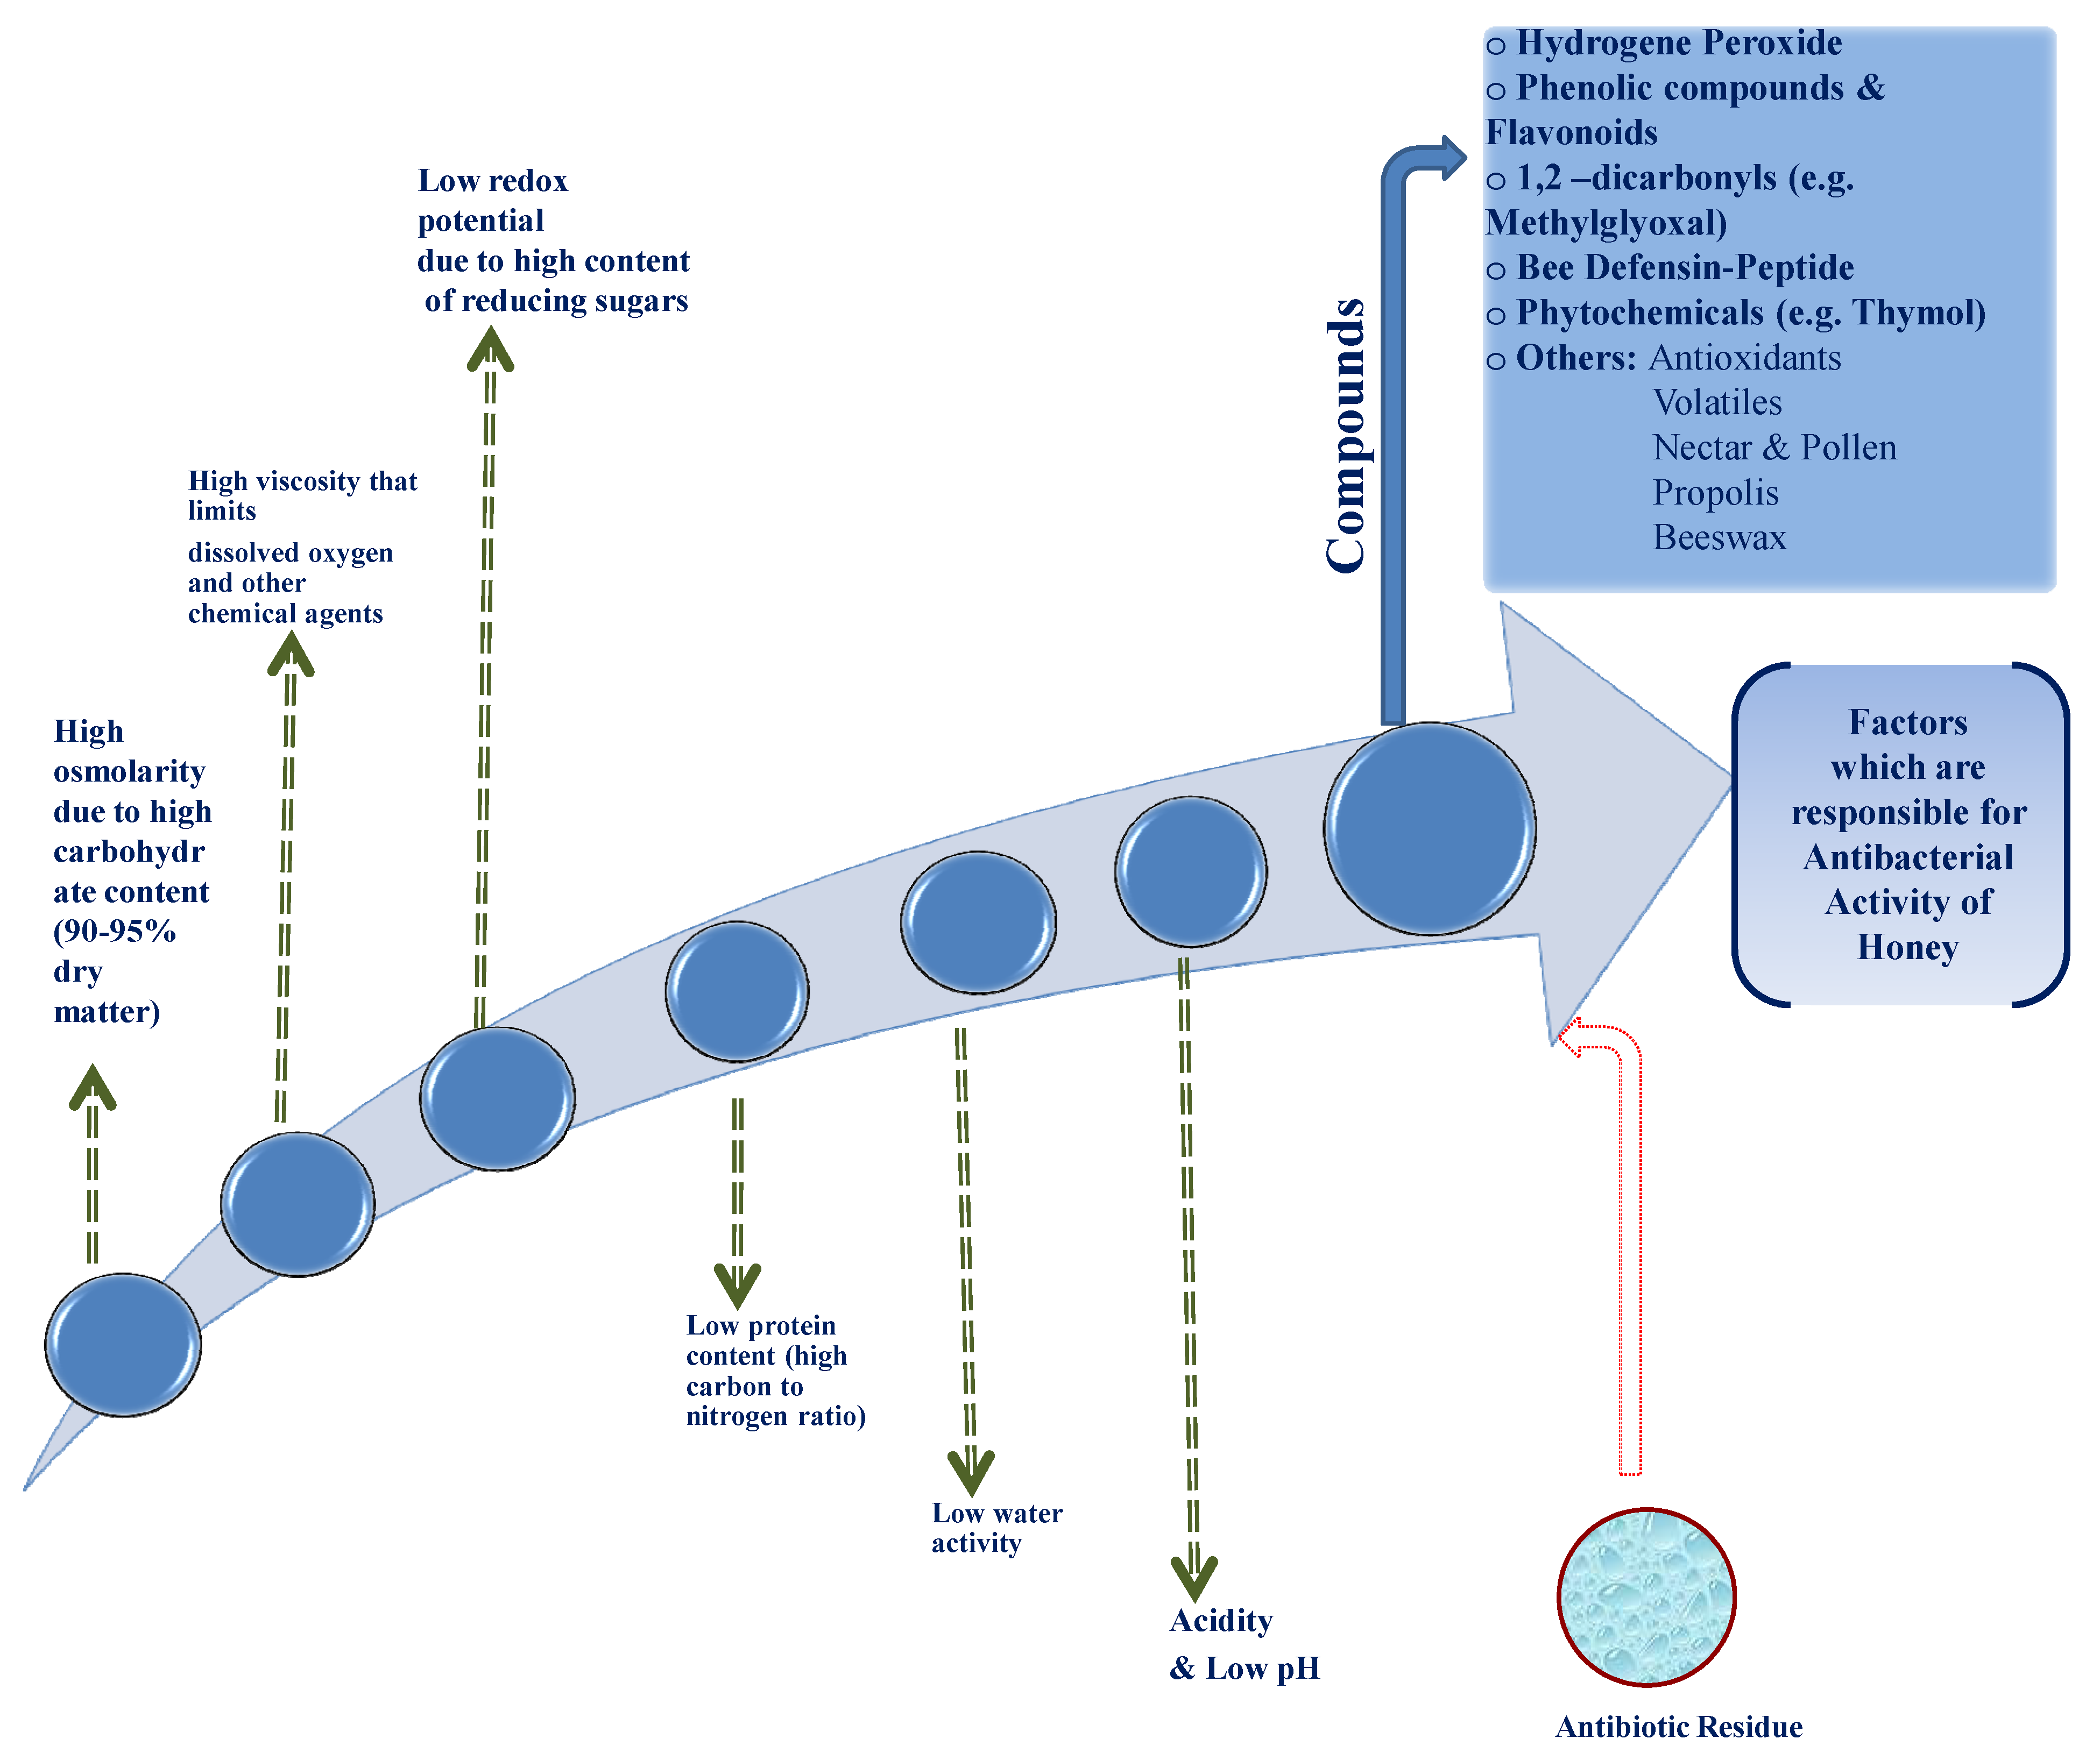
The Antibacterial Effectiveness of Honey

The antibacterial effectiveness of honey has been demonstrated in many studies [23,24,25,26,27]. The exact mechanism is not yet clear, although it is commonly attributed to (i) the high sugar content, which induces high osmolarity and inhibits bacterial growth, (ii) oxygen peroxide, which is produced by the activation of glucose oxidase and (iii) the low and acidic pH (usually 3.2–4.5) [6,7,22,26]. However, there is more to be said on the matter. Some studies have shown that «artificial» honey (a solution saturated in mono- and oligosaccharides) is not always able to inhibit bacterial growth effectively and that adding catalase does not remove all the antibacterial activity of honey [28,29]. These findings strongly suggest that there must be other factors which contribute to the total antibacterial effect of honey and that these factors act either separately or synergistically [26,27]. Such factors could be peptides such as defensin-1 or the phenolic compounds as well as the flavonoids, which are contained in honey (Scheme 1) [30,31].
Manuka honey is a well-studied product famous for its antibacterial properties and serves as a paradigm and a reference material for similar studies of other honeys. The high phenol content of manuka honey is impressive and accounts for a large part of its antibacterial activity. However, it is the methylglycoxal, a compound derived from dihydroacetone, that completes its antibacterial activity [32,33,34]. Another substance (its structure not yet identified by the researchers) described in manuka honey induces cytokine production by interaction with TLR4 on macrophages [35]. This study has demonstrated that the activity of cytic cells intimately involved in the repair of wounded tissue is modulated by honey. The mechanisms by which honey affects the release of anti-inflammatory agents and growth factors from monocytic cells are so far unclear, and this represents an area for further study, e.g., whether honey affects other cell types, particularly endothelial cells and fibroblasts. Finally, manuka honey affects the proteins forming the septal ring and thus affecting the cell division [36]. Such findings fuel the research of the antibacterial properties of different honeys as alternatives to standard antibiotics.

2. Materials and Methods

2.1. Honey Samples

A total of 60 raw, freshly harvested, untreated, and unpasteurized honey (bee Apismellifera) samples were received from local producers, in Epirus province in Greece. The samples were originated from different botanical sources, as following: 20 of citrus origin, 20 of Satureja spp. origin, and finally 20 of oregano and sage origin. Technically, since a botanical analysis of the pollen content has not been performed, all these samples should have been classified as multifloral honey. However, they were classified according to the dominant plant species in their geographical origin. Additionally, the given “botanical source” for every type of honey was identified by the beekeeper’s information based on the major species flowering at the harvest season at the period of honey collection. Honeys were collected from beekeepers who transfer their hives each year during the blossom period at the mountain fields where these plant species are dominant. This is a traditionally tested practice to produce honey with flavor of a particular type (coniferous, thyme, oregano, etc.). A portion of 1000 g (from each one local producer) of each sample was collected in a sterile universal container and kept at 2–8 °C in the dark, until tested. The sampling and labelling process were performed by different associates than the ones who performed the analyses, to maintain a blind character of the study. The samples did not contain any additives or diluents and had not been heated. They were evaluated for their microbiological quality by being dissolved in cation-adjusted Mueller Hinton broth (CAMHB; Oxoid, Ltd., Basingstoke, Hampshire, England) and subsequently inoculated into sheep blood agar (Columbia Agar base with 5% Sheep blood, Becton Dickinson) and incubated aerobically at 37 °C for 48 h. Samples showing growth of bacteria or growth of more than 4–5 colonies of yeasts were excluded from the study; only 2 samples were excluded and were substituted by others suitable for the purposes of the study, so that the total number of suitable samples was 20 for every botanical source (geographical origin/ dominant plant species).

2.1.1. Control Indexes of the Experimental Design

Artificial honey was prepared by dissolving 3 g sucrose, 15 g maltose, 81 g D-fructose, and 67 g D-glucose in 34 mL sterile water and stored in sterile bottles (all sugars were supplied by Sigma-Aldrich) [20,37]. This dilution of sugars represents the proportions of the four predominant sugars in natural honey samples [38]. AM HEALTH Manuka Health MGO™550+ (25+) (Lower Hutt, New Zealand) was used as a positive control.

2.1.2. Determination of Physicochemical Parameters (All the Analyses Were Done in Triplicate)

pH: 10 g of each honey sample were diluted in 75 mL in CO2 -free distilled water for measuring the pH value by the aid of a portable pH-meter (Sentron (1001) [39]. The pH-meter was calibrated by two standard recognition buffers before the analysis; pH 4 and pH 10 (as specified by the manufacturer) and each measurement was carried out in triplicate.
Determination of H2O2 content: H2O2 content in honey samples was determined by using the Megazyme GOX assay kit (Megazyme International Ireland Ltd., Bray, Co. Wicklow, Ireland), which is based on H2O2 release, after glucose oxidase catalysis of the oxidation of β-D-glucose to D-glucono-δ-lactone [40,41,42]. As a standard, H2O2 diluted to 9.8–312.5 µM was used. Other studies reported that the maximum levels of accumulated H2O2 that occurred in honey solutions were found in solutions diluted to concentrations between 30 and 50% [31], hence 40% (w/w) honey solutions in 0.1 M potassium phosphate buffer (pH 7.0) were prepared and immediately measured for their H2O2 content. Each honey sample as well as every H2O2 standard were tested in triplicate in a 96-well microplate. The absorbance of the reaction was then measured at 510 nm using a microplate reader [43].
Determination of free, lactonic, and total acidity: The free, lactonic, and total acidity were determined by equivalence point titration according to AOC, 1990 [44,45] and the results are expressed as meq/kg.
Determination of Total Phenolic Content (TPC): The TPC of the honey samples was measured in accordance with the Folin-Ciocalteu method, with a minor modification [20,46,47]. First, 20 µL volume of the sample was added to a tube containing 1 mL of ultrapure water. Subsequently, 100 µL of Folin-Ciocalteu reagent was added to the mixture, and the tube was stoppered and allowed to stand at room temperature for 3 min. Thereafter, 280 µL of 25% w/v sodium carbonate solution and 600 µL of ultrapure water were added to the mixture. Following 1 h of incubation at room temperature in the dark, the absorbance was measured at 765 nm versus a blank containing Folin-Ciocalteu reagent and ultrapure water and the measurement of absorbance was conducted. The optical density of the sample (20 µL) in 25% w/v solution of sodium carbonate (280 µL) and ultrapure water (1.7 mL) at 765 nm was also measured. The TPC was determined using a standard curve of absorbance values correlated with standard concentrations (50–1500 µg/mL) of gallic acid. The results are expressed as gallic acid equivalents (GAEs) using the standard curve (absorbance versus concentration) prepared from authentic gallic acid and the TPC was expressed in mg of gallic acid equivalents (mg GAE/100 g of honey).
Determination of Flavonoids: The total flavonoid content (TFC) of honey samples was determined by the aluminum chloride method [48]. Subsequently, 1 mL of a honey solution (1 mg/mL) was mixed with 0.3 mL NaNO2 (5%). After 5 min a solution of 0.3 mL AlCl3 (10%) was added and six minutes later the tested honey samples were neutralized with a 2 mL of NaOH solution (1 M). The mixture was shaken, and the absorbance was measured for all samples at 510 nm using a spectrophotometer. Quercetin (Sigma–Aldrich, St. Louis, MO, USA), which is having a moderate absorbance, was used as the standard and a calibration curve was made using a standard solution of quercetin 20–100 mg/L. The results were expressed in mg for Quercetin Equivalents (CE)/100 g of honey, as the average of triplicate measurements [49].

2.2. Determination of the Antibacterial Activity

2.2.1. Tested Microbial Strains

The strains of the pathogenic bacteria that were tested as cell- targets to assess the antibacterial activity of honey were the following:
  • Staphylococcusaureus subsp. aureus, methicillin, and vancomycin resistant (source: dental septicaemia)
  • Staphylococcus aureus subsp. aureus, methicillin, and vancomycin resistant (source: tooth abscess)
  • Staphylococcus aureus subsp. anaerobius (source: septicaemic gingivitis)
  • Streptococcus mutans (source: oral cavity)
  • Fusobacterium nucleatum (source: oral cavity)
  • Staphylococcus aureus subsp. aureus, reference strain ATCC 12600
  • Staphylococcus aureus subsp. αnaerobius, reference strain ATCC 35844
All the above strains were identified and classified by standard laboratory procedures, which are followed by the National and Kapodistrian University of Athens, School of Dentistry.

Antibiotic Susceptibility Assay

Antibiotic susceptibility for the used bacterial strains and the reference strains was detected using the disc diffusion method, according to the standards set by The National Committee for Clinical Laboratory Standards (later renamed The Clinical Laboratory Standard Institute-CLSI) [50,51]. An aliquot of 100 μL of an overnight culture was diluted in saline solution to about 1.5 × 10⁸ CFU/mL (0.5 McFarland turbidity standard). Mueller–Hinton agar (Oxoid Ltd., Basingstoke, UK) plates were flooded with this suspension in order confluent colonies given. The inoculated plates could stand at room temperature for 15 min prior to dispensing the paper discs and were then placed at 37 °C for 24 h. The diameters of the clear zones around each disc were measured after incubation.
In the present study, 9 antibiotic discs were used to determine the antibiotic resistance of the wild pathogenic Staphylococcus tested strains: Vancomycin (VA, 30 μg, Oxoid Ltd., Basingstoke, Hampshire, UK), Erythromycin (E, 15 μg, Oxoid Ltd., Basingstoke, Hampshire, UK), Ampicillin (AMP, 10 μg, Oxoid Ltd., Basingstoke, Hampshire, UK), Oxacillin (OX, 1 µg, Oxoid Ltd., Basingstoke, Hampshire, UK), Ciprofloxacin (CIP, 5 μg, Oxoid Ltd., Basingstoke, Hampshire, UK), Sulfamethoxazole with trimethoprim (SLT, 25 μg, Oxoid Ltd., Basingstoke, Hampshire, UK), Oxytetracycline (OXY, 30 μg, Oxoid Ltd., Basingstoke, Hampshire, UK), Ceftriofur (CFT, 30 μg, Oxoid Ltd., Basingstoke, Hampshire, UK), and Amoxicillin with Clavulanic acid (AMC, 30 μg, Oxoid Ltd., Basingstoke, Hampshire, UK).
For the S. mutans strain, the antibiotics employed in this study were: Ampicillin (AMP, 10μg, Oxoid Ltd., Basingstoke, Hampshire, UK), Cefotaxime (CTX, 30 μg, HiMedia Labs, Einhausen, Germany), Erythromycin (E, 15 μg, Oxoid Ltd., Basingstoke, Hampshire, UK), Cephazolin (kZ, 30 μg, Oxoid Ltd., Basingstoke, Hampshire, UK), Methicillin (ME, 5 μg Oxoid Ltd., Basingstoke, Hampshire, UK), Lincomycin (L, 2 μg, Oxoid Ltd., Basingstoke, Hampshire, UK), Clindamycin (CC, 2 μg, Abtek Biologicals Ltd-UK, Liverpool, UK), Vancomycin (VA, 30 μg, Oxoid Ltd., Basingstoke, Hampshire, UK) Metronidazole (MTZ, 5 µg, Abtek Biologicals Ltd-UK, Liverpool, UK), Rifampicin (RIF, 5 µg, HiMedia Labs, Einhausen, Germany), Ciprofloxacin (CIP, 5 μg, Oxoid Ltd., Basingstoke, Hampshire, UK), Ofloxacin (OF, 5 µg, Oxoid Ltd., Basingstoke, Hampshire, UK), Gentamycin (GEN, 10 µg, Oxoid Ltd., Basingstoke, Hampshire, UK), Penicillin G (P10, 10 µg, Oxoid Ltd., Basingstoke, Hampshire, UK), Chlortetracycline (CTE, 30 µg, Oxoid Ltd.), Doxycycline (DO, 30 µg, Oxoid Ltd., Basingstoke, Hampshire, UK), Chloramphenicol (CHL, 30 µg, Oxoid Ltd., Basingstoke, Hampshire, UK), Tetracycline (TE, 30 µg, Oxoid Ltd., Basingstoke, Hampshire, UK) and Amoxicillin (AMO, 30 µg, NEOSENSITABS™-Rosco Diagnostica, Taastrup, Denmark). Finally for the F. nucleatum strain the tested antibiotic discs were: Ampicillin (AMP, 10 μg, Oxoid Ltd., Basingstoke, Hampshire, UK), Clindamycin (CC, 2 μg, Abtek Biologicals Ltd-UK, Liverpool, UK), Erythromycin (E, 15 μg, Oxoid Ltd., Basingstoke, Hampshire, UK), Metronidazole (MTZ, 5 µg, Abtek Biologicals Ltd-UK, Liverpool, UK), Amoxicillin-clavulanic acid (AM, 30 μg, Oxoid Ltd., Basingstoke, Hampshire, UK), Tetracycline (TE, 30 µg, Oxoid Ltd., Basingstoke, Hampshire, UK), Trovafloxacin (TROVAN, 30 µg, Pfizer Pharmaceuticals, Berlin, Germany) and Azithromycin (AZM, 15 μg, Oxoid Ltd., Basingstoke, Hampshire, UK).
The inhibition zone was measured after 24 h of aerobic and anaerobic incubation at 37 °C. The experiments of each antibiotic were performed in triplicate. The results were interpreted according to Clinical and Laboratory Standards Institute (CLSI) methodology.

2.2.2. Study Design

Used Solvents

In the present study, as a solvent to prepare various solutions and concentrations of honey, phosphate-buffered saline (PBS) was used. A simulation of in vivo (oral cavity) testing was attempted and all the tests for the determination of the minimum inhibitory concentration (MIC), with the difference that artificial saliva also was used as solvent of the honey samples.
The artificial saliva was prepared according to the composition used in dental studies, as shown in Table 1 [52,53]. The mucin used in this study was porcine gastric mucin, which comprises of both human mucins type MUC5AC and type MUC6 [54] and is said to simulate human saliva rymucins (mucin type MUC5B) [55].

Introduction on the Methods of Assessment of Antimicrobial Potency of the Different Honey Types

For the assessment of the antibacterial potency of the different types of honey, two different in vitro methods were used: (i) Agar wells diffusion method, and (ii) determination of the minimum inhibitory concentration by microtiter plates. The first method is based on the inhibition of bacterial growth in a circular zone around the well. The second method is based on the inhibition of bacterial growth in different dilutions of honey. In order to investigate the possible modes of antibacterial action involved, four different techniques of MIC determination by microtiter plates were used: (a1) addition of catalase, with PBS as solvent (a2) addition of catalase, with artificial saliva as solvent, (b1) addition of proteinase K, with PBS as solvent and (b2) addition of proteinase K, with artificial saliva as solvent.

Agar Well Diffusion Assay

It should be noted that the agar well diffusion assay was performed only for the 50% dilution of honey to simulate the dilution of honey in the oral cavity. It is estimated that a spoon of honey was screened for its antibacterial activity, according to the agar well diffusion method proposed by the Clinical and Laboratory Standards Institute (CLSI, former NCCLS) guidelines [20]. Briefly, overnight bacterial cultures grown in Mueller-Hinton broth were adjusted to 0.5 McFarland turbidity standard (~1.5 × 10⁸ CFU/mL). Mueller-Hinton agar plates were inoculated with roughly 106 CFUs over the entire surface of the plate. Wells of 8 mm in diameter were cut into the surface of the agar using a sterile cork borer. Subsequently, 100 µL (50% w/v in phosphate-buffered saline (PBS)) of the tested honey types, manuka honey, and artificial honey were added separately to each well. The plates were incubated aerobically and anaerobically at 37 °C for 16–18 h. Antibacterial activity was assessed by measuring (with a calliper) the diameter of the inhibition zones surrounding the wells, including the diameter of the well. The diameter of the inhibition zone, if present in the negative control, was recorded and subtracted from the inhibition zones of the tested honey, as well as of manuka honey. The experiment was repeated three times.

Determination of Minimum Inhibitory Concentration (MIC)

The minimum inhibitory concentration (MIC) of the honey types was determined in sterile 96-well polystyrene microtiter plates (Kisker Biotech GmbH and Co. KG, Steinfurt, Germany) by using a spectrophotometric bioassay, as previously described [20,57]. Briefly, overnight bacterial cultures grown in Mueller-Hinton broth were adjusted to a 0.5 McFarland turbidity standard (~1.5 × 10⁸ CFU/mL). Approximately 5 × 10⁴ CFUs in 10 µL Mueller-Hinton broth were added to 190 µL of 2-fold diluted test honey (honey concentration ranged from 75 to 0.58% w/v) in Mueller-Hinton broth. Two-fold serial dilutions of the same range of manuka honey and artificial honey were included for comparison. The control wells contained only Mueller-Hinton broth-inoculated with bacteria. The optical density (OD) was determined at 630 nm using a microplate reader (Multi-detection reader, BioTek®), just prior to incubation (t = 0) and after 24 h of incubation (t = 24) at 37 °C. MIC was determined as the lowest honey concentration that results in 100% growth inhibition.

Determination of Minimum Inhibitory Concentration (MIC) Performed After Enzymatic Treatment of Honey Samples with Catalase and Proteinase K

This determination was done following two options:
(a)
by using catalase, which degrades hydrogen peroxide, allowing evaluation of the contribution of hydrogen peroxide production to antibacterial activity [58].
(b)
by adding proteinase K, with which the part of antibacterial activity that is due to proteins and peptides in honey can be assessed [59].
Catalase stock solution was prepared by dilution of 30 mg powder of catalase originating from bovine liver (SERNA, Heidelberg, Germany) to 10 mL phosphate buffer (pH 7.4. In 1.5 mL honey 50% v/v (750 μL honey and 750 μL Muller Hinton Broth), 28 μL of the stock solution were added so that the final concentration of catalase was 600 U/mL. The dilution of honey was put in the incubator shaker for 16 h at 37 °C in 210 rounds. Subsequently, all the different honey solutions were prepared to determine the MIC. For the proteinase K stock solution of 10 mg/mL concentration, 10 mg of proteinase powder (Ambion®, Inc., Huntingdon, Cambridgeshire, UK) were diluted in 1 mL distilled water. The same procedure was followed as described for catalase to obtain the different dilutions, so that the final concentration of proteinase Kwas 100 μg/mL. Catalase- and proteinase K-treated honey samples were then used in the antibacterial assay to determine the MIC values, as described in paragraph “Determination of Minimum Inhibitory Concentration (MIC)”.
Controls containing no honey (positive growth control), and no honey with catalase or proteinase K (catalase only control/ proteinase K only control) were included to evaluate the effect of catalase/proteinase K alone on bacterial growth.
The elevated MIC values of the treated honey compared to the untreated honey revealed the presence of hydrogen peroxide and/or proteinaceous compounds, which contributed to the antibacterial activity of the tested honey types.
Three-fold samples for every honey and for every concentration were examined.

Statistical Analysis

The physicochemical characteristics of honeys were expressed as means (±SD) of triplicate analyses. Results from the well diffusion assays and minimum inhibitory concentration are also presented as means (±SD) of mm or honey concentration (%). Analysis of variance with Tukey’s post-hoc comparison was used to compare either the physicochemical characteristics of the samples or the antibacterial effects. Spearman’s rho correlation coefficient was used to indicate any correlation between the physicochemical characteristics and cluster analysis to distinguish groups of observations with similar characteristics. All statistical analyses were performed with SPSS v. 21 statistical package (IBM Corp. Armonk, NY) with a significance level at p < 0.05.

3. Results

In citrus honey samples (n = 20), pH values ranged from 3.5 to 4.5 with a mean value of 3.8 ± 0.3, hydrogen peroxide from 10.4 to 61.0 μg/g (mean 32.2 ± 15.1 μg/g), free acidity from 10.6 to 27.4 (15.6 ± 4.4), lactonic acidity from 3.1 to 10.3 (6.2 ± 2.3), TPC from 22.4 to 75.6 (41.4 ± 11.9 mg GAE/100 g), and TFC from 0 to 2.5 (1.1 ± 0.5 CE/100 g).
The average values of all variables varied considerably among the samples studied as indicated by the ANOVA procedure (Table 2). Cluster analysis (nearest neighbor method, squared Euclidean) revealed that one major group of observations contained 19 samples and another group consisting of the 3 observations of sample Νο.4 was distinguished by the increased value of free acidity and TPC, as indicated in Table 3. Correlation analysis revealed only one strong positive correlation between TPC and free acidity (Spearman rho = 0.73, p < 0.05).
In Satureja spp. honey samples (n = 20), pH values ranged from 3.0 to 4.1 with a mean value of 3.4 ± 0.3, hydrogen peroxide from 2.5 to 15.5 μg/g (mean 6.9 ± 3.9 μg/g), free acidity from 16.2 to 79.9 (33.8 ± 17.5), lactonic acidity from 0.3 to 33.3 (11.8 ± 6.2), TPC from 24.2 to 149.6 (73.4 ± 32.7 mg GAE/100 g), and TFC from 0.6 to 5.3 (2.5 ± 1.2 CE/100 g). The average values of all variables varied considerably among the samples studied as indicated by the ANOVA procedure (Table 4). Cluster analysis (nearest neighbor method, squared Euclidean) revealed that one major group of observations contained 19 samples and another group consisting of the 3 observations of sample 3 were distinguished by the increased value of TPC and the lower value of hydrogen peroxide as indicated in Table 5. There were no strong (Spearman rho > 0.70) and statistically significant (p < 0.05) correlations between the various physicochemical characteristics in those honey samples.
In oregano and sage honey samples (n = 20), the pH ranged from 3.0 to 4.2 with a mean value of 3.4 ± 0.3, hydrogen peroxide from 4.6 to 17.3 μg/g (mean 9.6 ± 3.4 μg/g), free acidity from 27.4 to 99.3 (49.1 ± 20.8), lactonic acidity from 3.6 to 22.3 (11.2 ± 4.4), TPC from 22.6 to 89.1 (47.6 ± 17.4), and TFC from 0.6 to 7.0 (3.5 ± 1.3).
The average values of all variables varied considerably among the samples studied as indicated by the ANOVA procedure (Table 6). However, cluster analysis (nearest neighbor method, squared Euclidean) revealed some similarities among the samples based on the results of the physicochemical examination. As indicated in Table 7, all samples had similar physicochemical characteristics, except for sample 14, which had almost twice the concentration of hydrogen peroxide and TPCm but approximately half the concentration of free acidity and TPC. No strong correlations (Spearman rho > 0.7, p < 0.05) were observed between the various physicochemical parameters of oregano and sage honey samples.
In Table 8, the mean (±standard deviation) of physicochemical characteristics of the three types of honey included in the study, i.e., citrus honey, honey from Satureja spp. and oregano and sage honey are presented.
Among the statistically significant differences observed between the characteristics of the various honey types, the most profound were the differences in free acidity and hydrogen peroxide concentration (Table 8). Honey samples produced from hives foraging citrus varieties of plants exhibit approximate half of the acidity of honeys produced from Satureja spp. and almost one third of the ones produced from oregano and sage plant species. However, as shown in Table 8, citrus honeys contained three to five times more the concentration of hydrogen peroxide compared to the other two types.

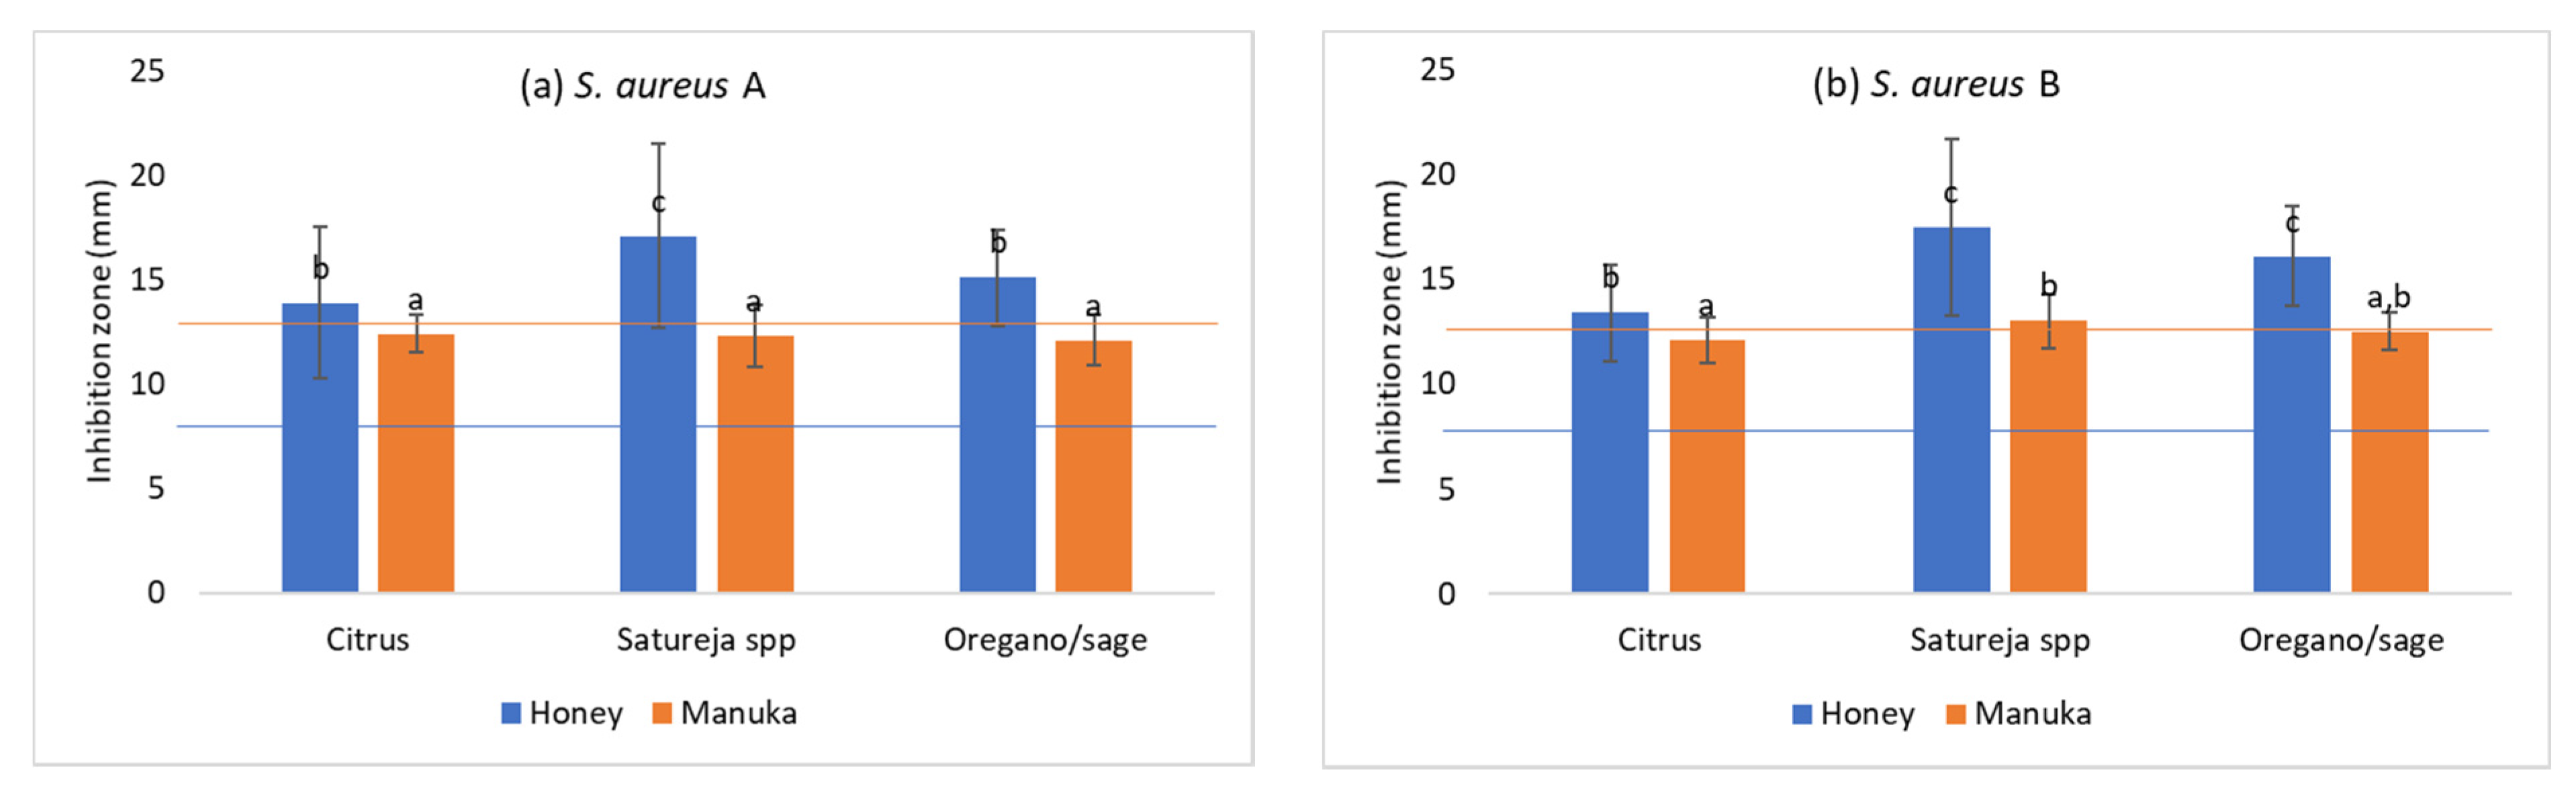
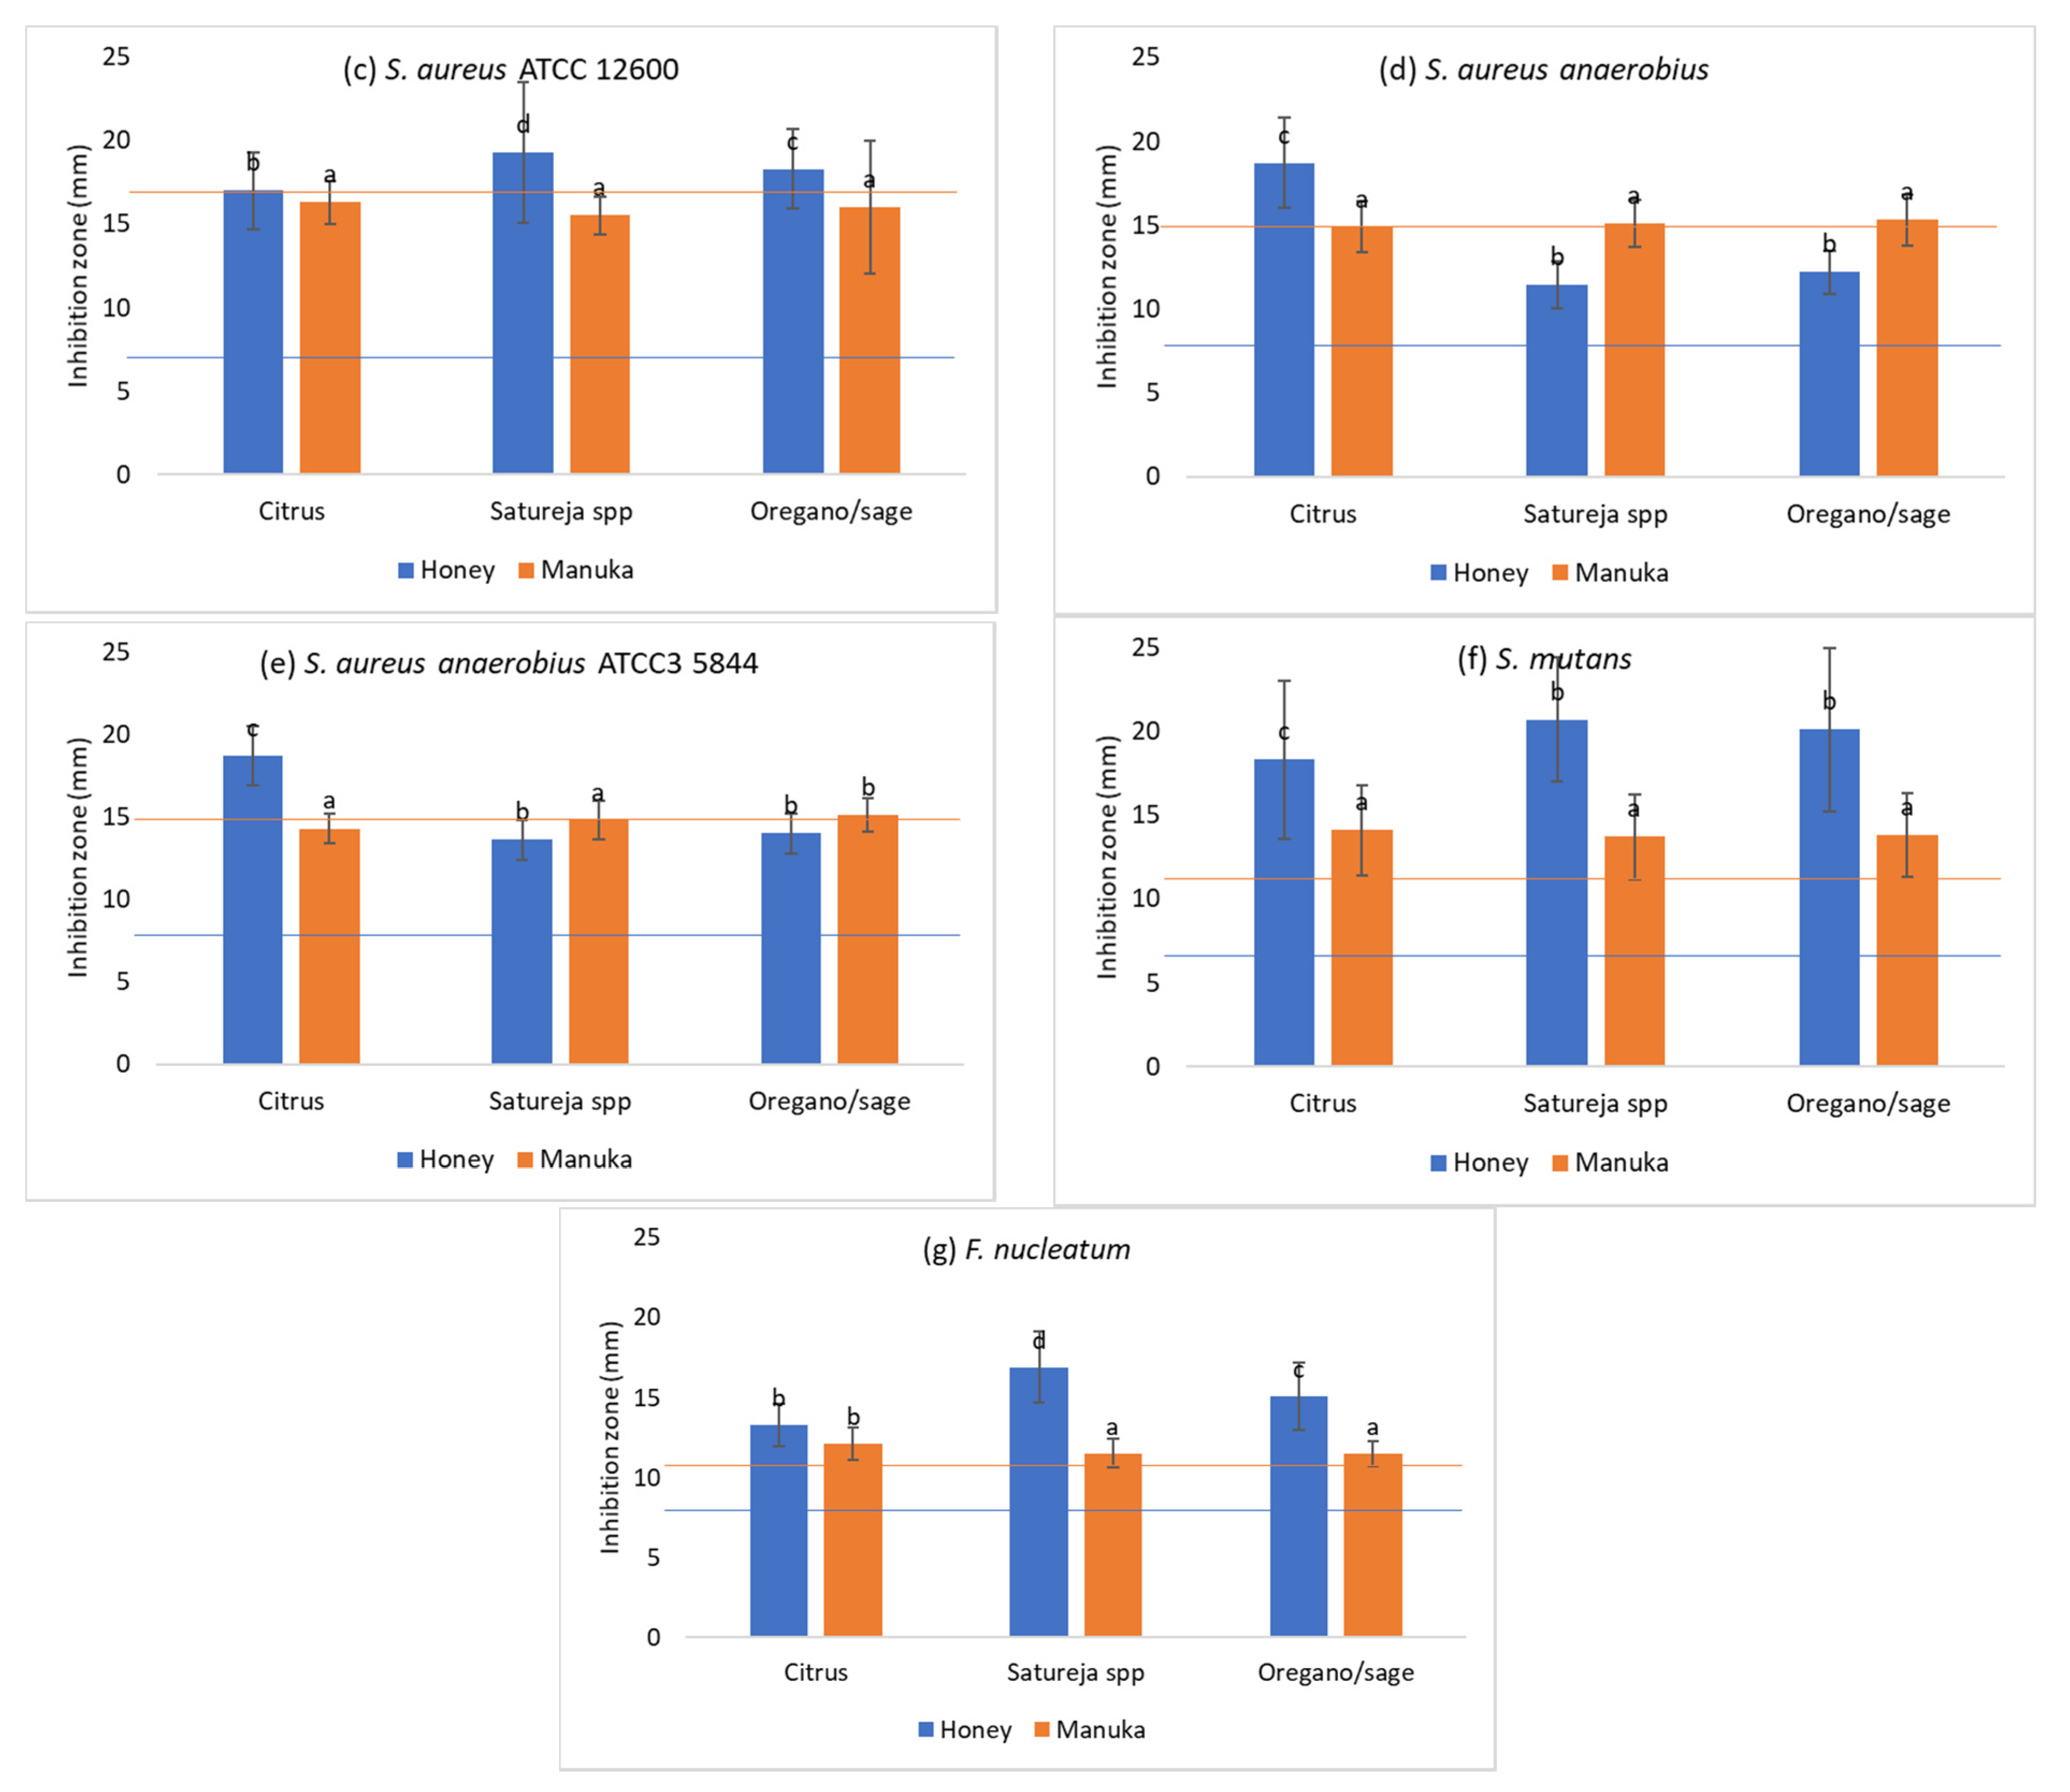
3.1. Antimicrobial Activity

In well diffusion assays, all honey samples had an antibacterial effect against pathogens (and reference strains) when compared with artificial honey, where only the osmotic effect is considered (Table 9, Figure 1a–g). The average of inhibition zones from honeys of Satureja spp. were 16.7 ± 4.1 mm, oregano and sage 15.9 ± 3.5 mm, and of citrus 15.9 ± 3.9 mm indicating that samples of Satureja spp. were among the most effective, particularly against S. aureus A, S. aureus B, S. aureus ATCC 12600, S. mutans, and F. nucleatum. The most sensitive strain was proven to be S. mutans, with an average inhibition zone of 19.5 ± 4.7 mm and the least sensitive being S. anaerobius and F. nucleatum, with average inhibition zones of 14.0 ± 3.8 mm and 14.3 ± 3.1 mm, respectively, which indicates differences among the susceptibility of the strains (ANOVA F = 25.64, p < 0.05). Almost all honey samples were more effective against pathogens than the manuka honey. Overall, the manuka honey gave an average inhibition zone of 13.7 ± 2.2 mm in comparison to 16.0 ± 4.0 mm of the local samples. In these experiments, F. nucleatum was the least sensitive to manuka (mean zone 11.7 ± 0.9 mm) and S. aureus ATCC 12600 the most sensitive (mean zone 15.9 ± 2.5 mm).
The results from MIC experiments showed that local honey samples were effective enough against the seven bacteria tested alone or after treatment with proteinase K, catalase, or by using artificial saliva as diluent. A sample of commercially available manuka honey, equally diluted, was included in the study for comparison (Figure 2a–g and Figure 3a–g). On average 9.3 ± 7.6% (w/v) of honey inhibited the growth of our pathogens. Again, samples from Satureja spp. floral source were the most effective (mean MIC 8.2 ± 6.2%) followed by citrus honey (mean MIC 9.6 ± 6.9%) and oregano and sage (mean MIC 10.2 ± 9.2%). In those experiments, S. aureus A was the most sensitive strain (mean MIC 8.1 ± 3.6%) and S. aureus spp. anaerobius the least sensitive (mean MIC 17.0 ± 13.0) with the rest of the pathogens being among the above. When the above experiments were repeated with manuka honey, an increase to the MIC (or a decrease in effectiveness) was observed from 9.3 ± 7.6 to 10.7 ± 6.4 for all strains and honey samples (ANOVA F = 20.9, p < 0.05). S. mutans (MIC 6.2 ± 0.0), S. aureus ATCC 12600 (MIC 6.2 ± 0.4), S. anaerobius (MIC 6.4 ± 1.1), and S. anaerobius ATCC 35844 (MIC 6.25 ± 0) were the most sensitive to manuka honey and F. nucleatum the least, with a mean MIC of 25.0 ± 0.
As already mentioned, the estimation of the minimum inhibitory concentration was accomplished first by using multiple dilutions of honey in deionized water and again with artificial saliva as dilutant. In those later experiments there was a decrease in MIC values below the values presented in MIC experiments with ordinary dilutions, or in other words, an increase in effectiveness of the local honeys. The reduction in MIC values was statistically significant (ANOVA F = 11.6, p < 0.05) from an average of 9.3 ± 7.6 to 8.3 ± 7.6, which is proof of the active involvement of (artificial) saliva in the antimicrobial action of honey. However, the use of artificial saliva with manuka honey did not result in a similar increase of effectiveness but on the contrary, there was an average increase in MIC by 1.5% from 10.6 ± 6.4 to 12.1 ± 5.9%.
Finally, as expected the results from the well diffusion estimations were negatively correlated with those of the MIC (Spearman Rho = −0.65, p < 0.05), indicating an overall consistency of our data.

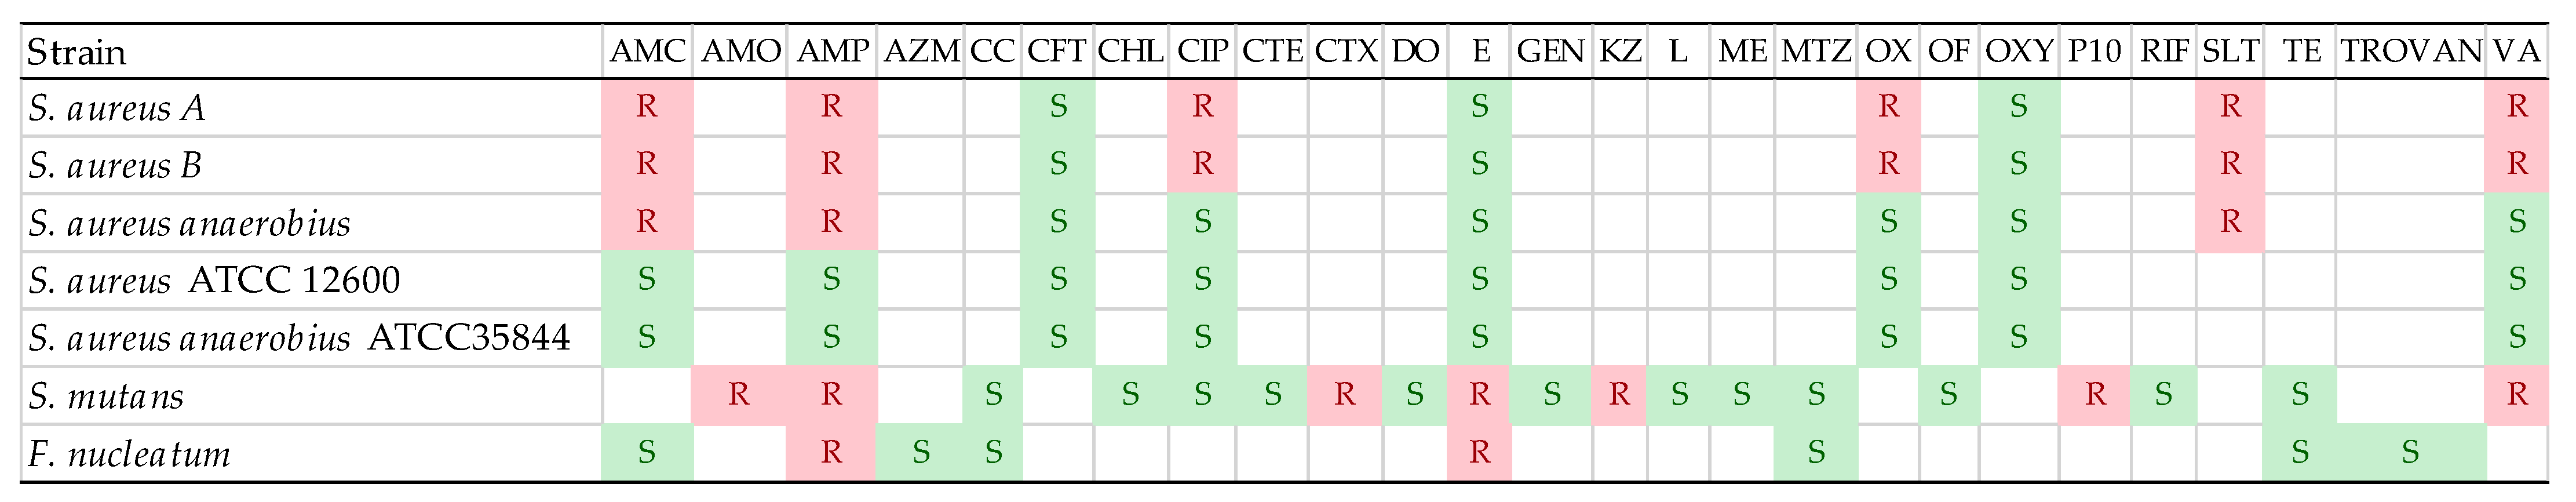
3.2. Antibiotic Susceptibility of Used Strains

All strains were tested for their susceptibility in common antibiotics. S. aureus (A) and (B) (both methicillin and vancomycin resistant) were proven to be multi-resistant in 66.7% of the drugs (Figure 4). S. mutans. was also multi-resistant in 7 out of 19 antibiotics. The two S. aureus reference strains were sensitive in all tested antibiotics, while F. nucleatum was resistant only in ampicillin (10 μg) and erythromycin (15 μg).

3.3. Effect of Physicochemical Characteristics in Antimicrobial Action

Multiple regression analysis with the results of well diffusion assays or MICs (with and without artificial saliva) as the dependent variable and the physicochemical characteristics of the honey samples as independent variables, showed that (a) no significant contribution of these characteristics was observed in well diffusion assays for the three types of honey studied (ANOVA F = 2.06, p > 0.05); (b) similarly, no critical factors were identified in the manuka well diffusion experiments (ANOVA F = 0.06, p > 0.05), (c) only TPC was a critical factor (ANOVA F = 10.6, p < 0.05) for MIC with no artificial saliva results, (c) all physicochemical characteristics (except pH) were contributing factors in the results of MIC experiments with the addition of catalase (ANOVA F = 63.7, p < 0.05) and all factors (except pH and TPC) contributed in MIC values in experiments with the addition of proteinase (ANOVA |F = 5.44, p < 0.05). When artificial saliva was used as a diluent in MIC experiments, multiple regression analysis revealed that the contributing factors were free acidity and TPC (ANOVA F = 8.19, p < 0.05) when the three types of honey were tested. In MIC experiments with artificial saliva and catalase addition, the concentration of hydrogen peroxide, lactone acidity and TPC were indicated as contributors (ANOVA F = 20.17, p < 0.05). When proteinase was added, then all physicochemical characteristics (except pH and TFC) were identified as critical factors (ANOVA F13.26, p < 0.05) while no characteristics appeared to contribute in manuka MIC experiments (ANOVA F = 1.07, p > 0.05).

3.4. Effect of Honey pH in Antimicrobial Action

The pH of the various honey samples ranged from 3.0 to 4.5 with a mean of 3.55 ± 0.36. Although there were statistically significant differences among the pH values from different floral sources (citrus, Satureja spp., oregano and sage) as shown in Table 9, it was not statistically possible to correlate (positively or negatively) these values to the antimicrobial action observed both in well diffusion experiments and in MIC estimations.

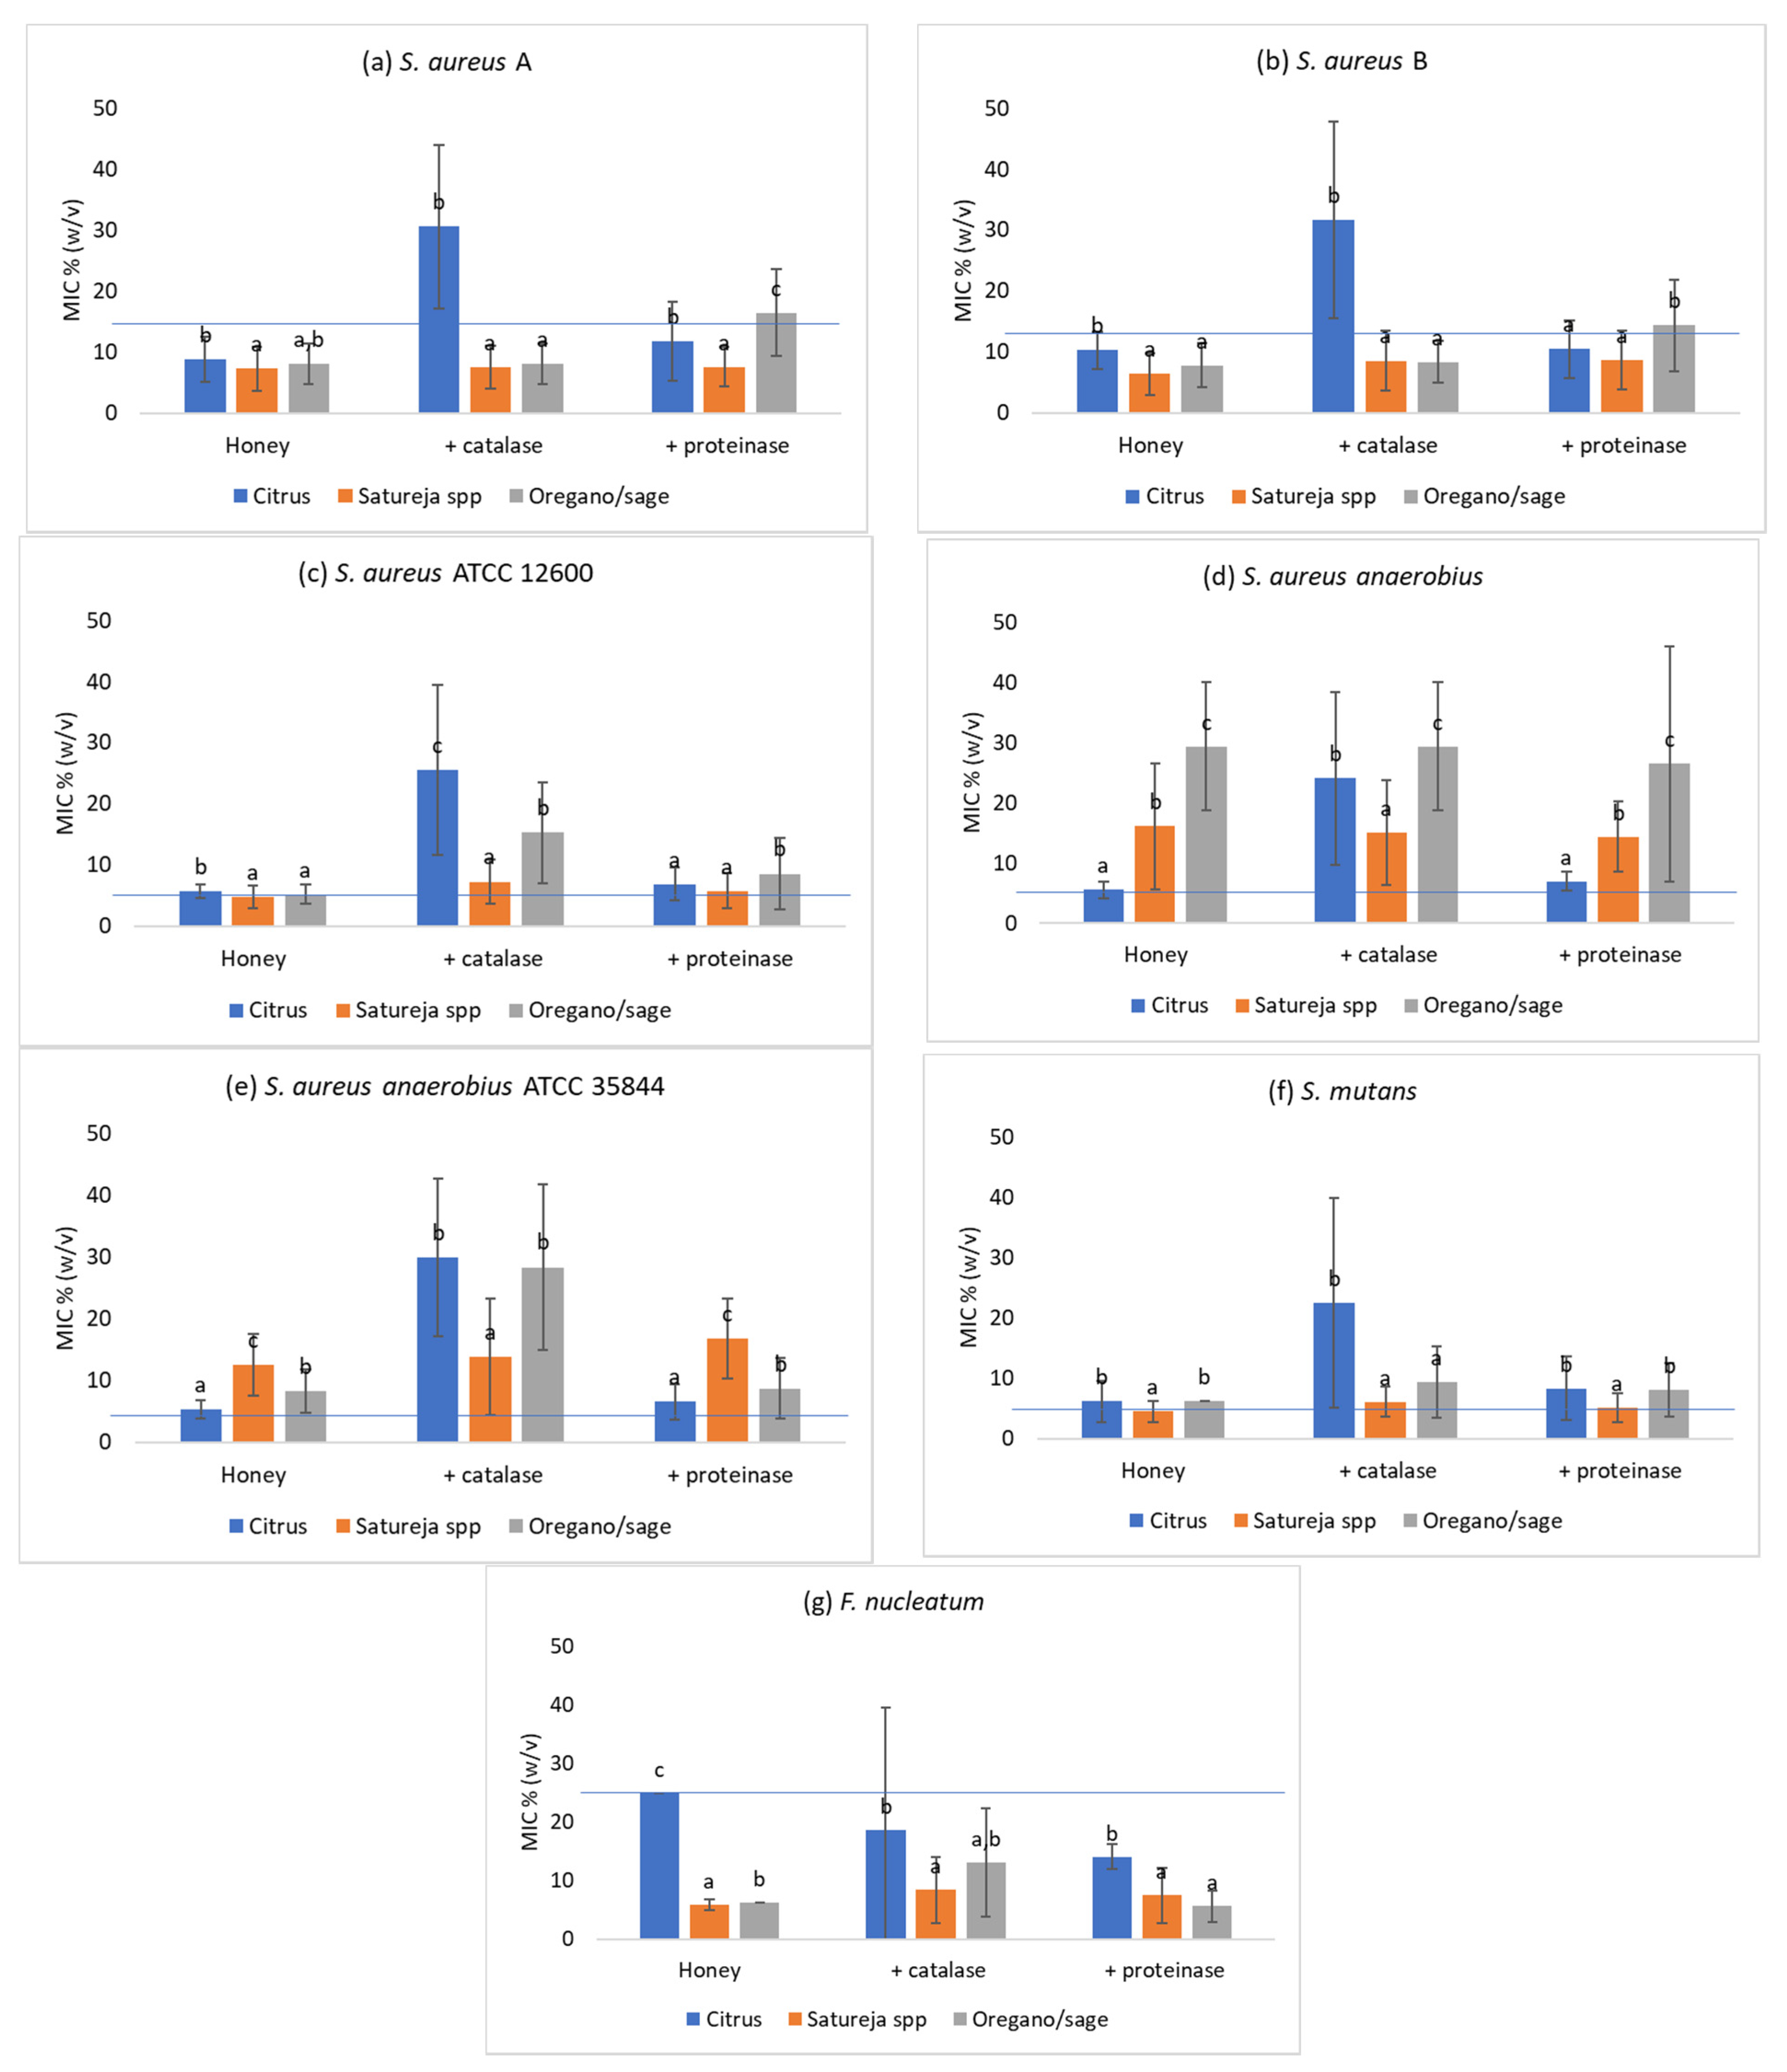
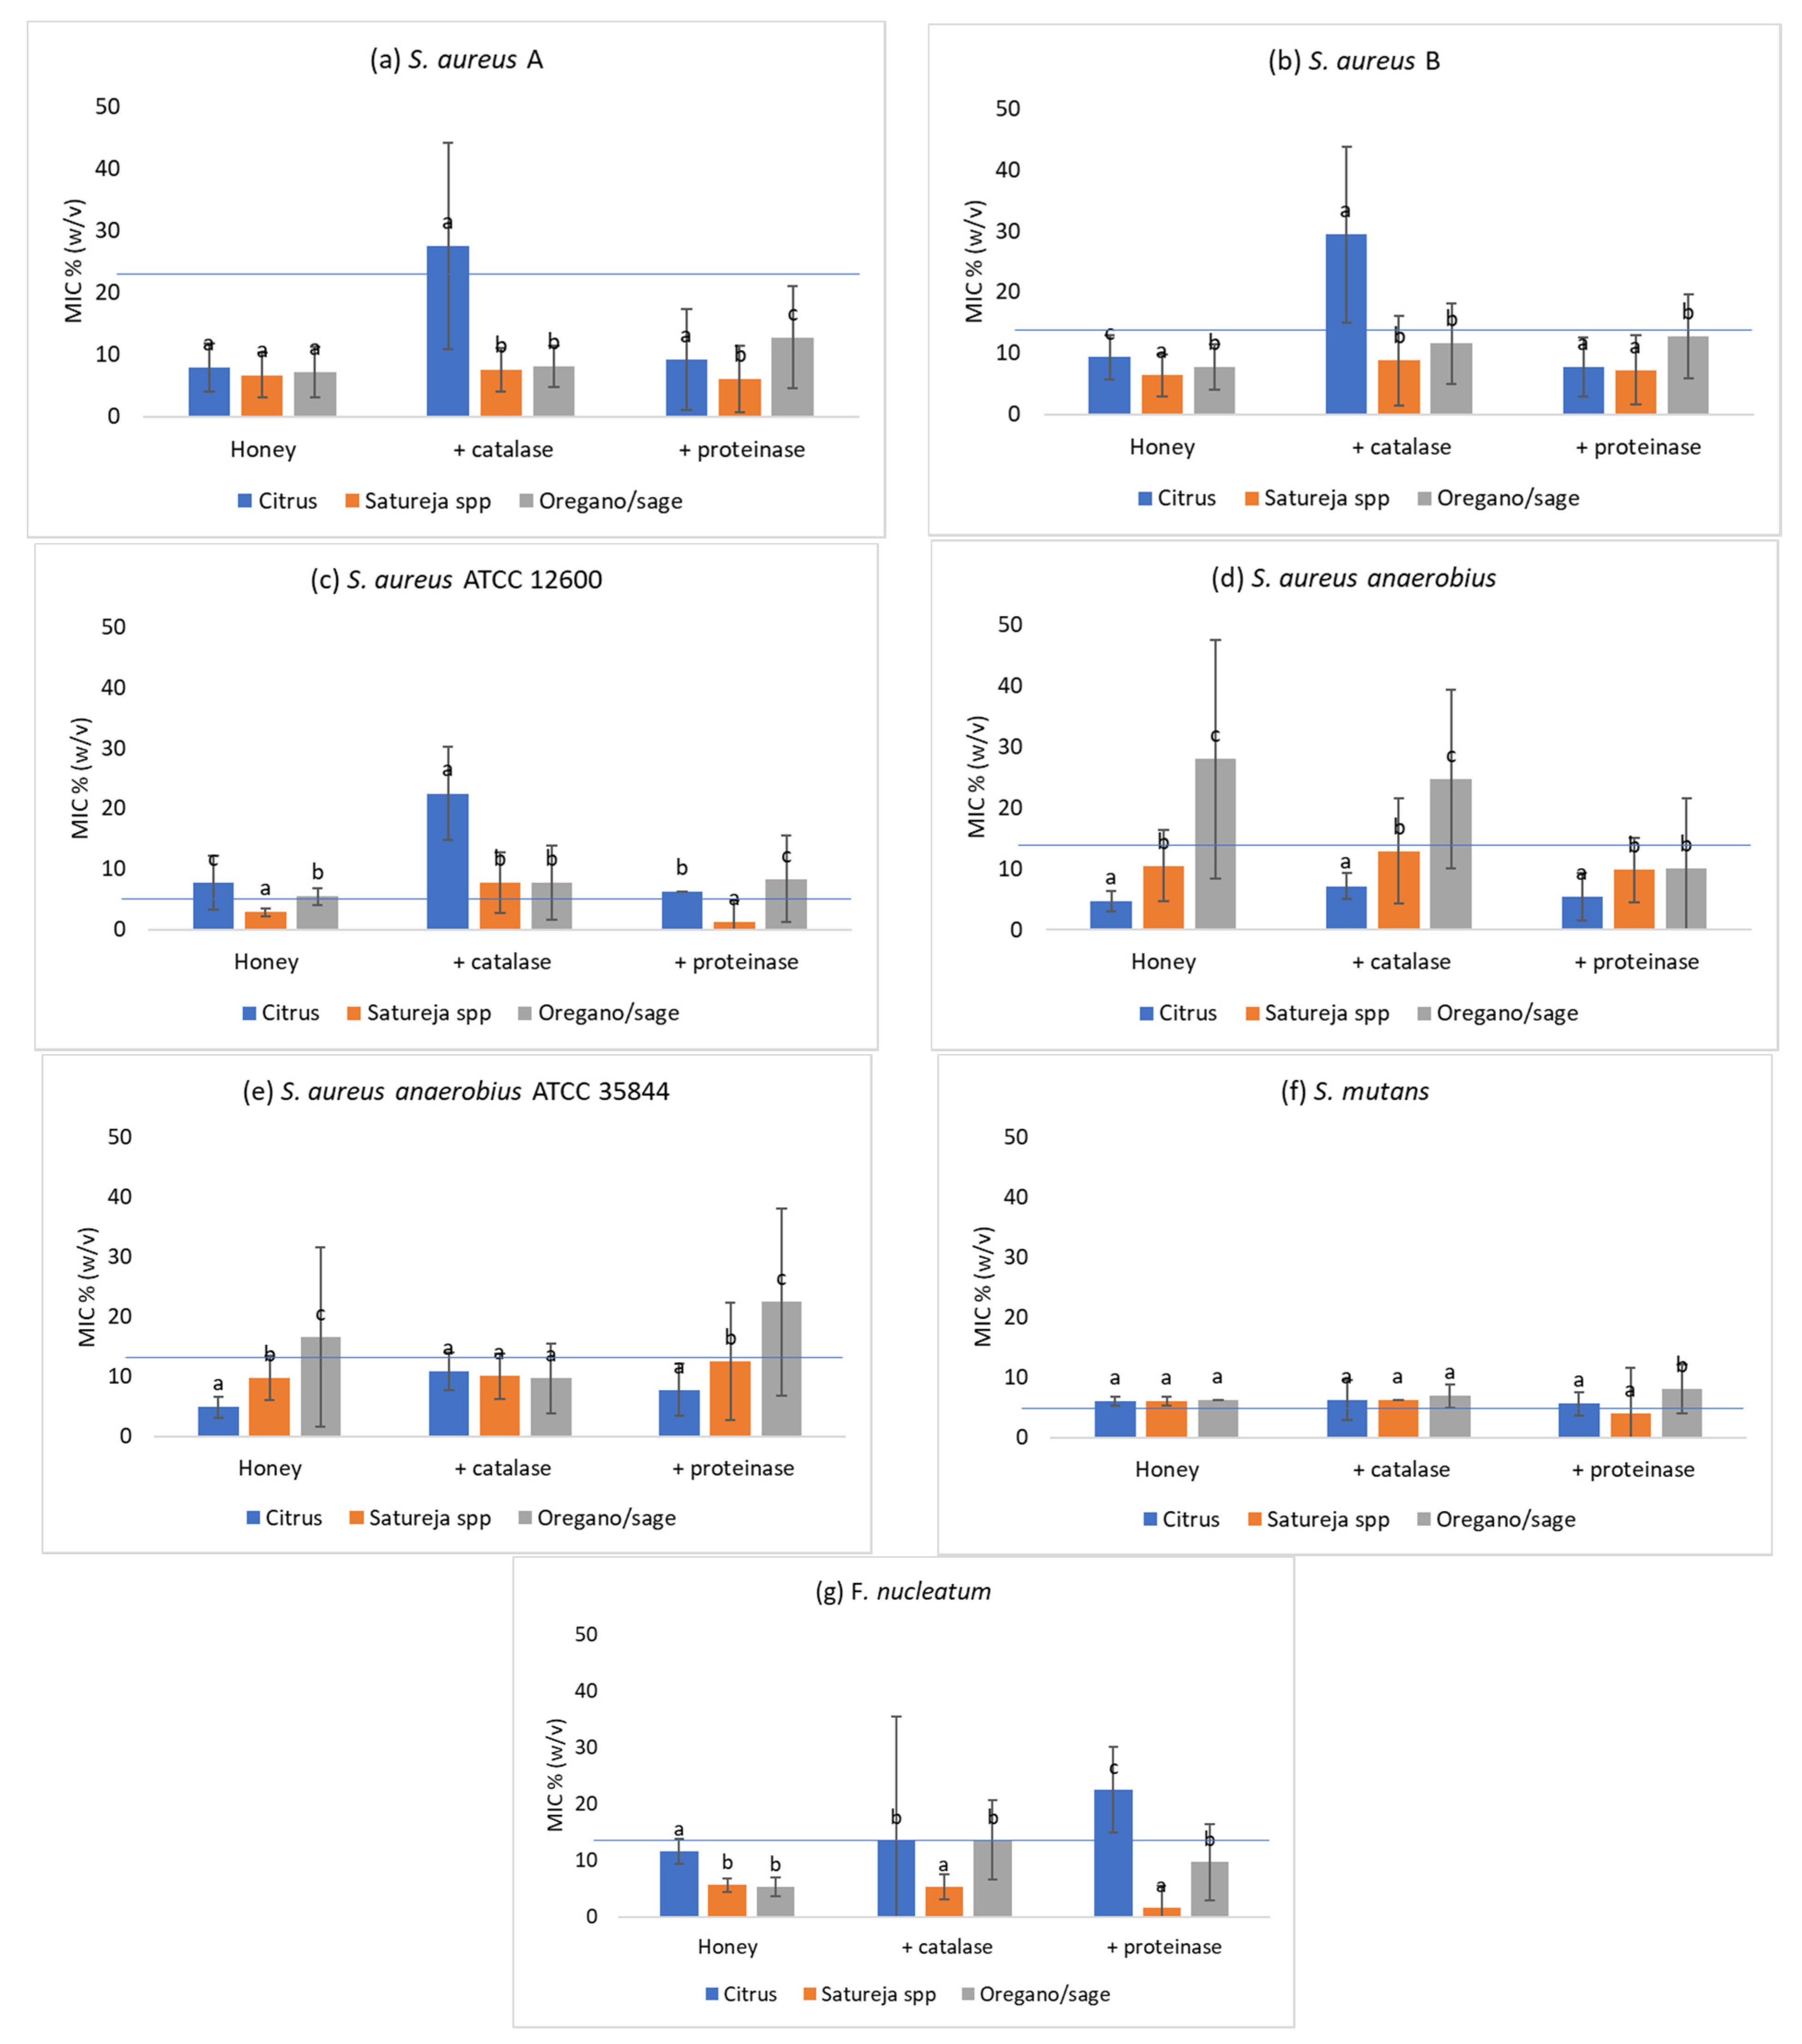
3.5. Effect of the Addition of Catalase

Except for F. nucleatum, all other pathogens including the reference ones exhibited a significant increase in MIC (Table 9) after the treatment with catalase. This is an indication of decrease in the antimicrobial action of the honey samples and particularly in those of citrus origin. A profound decrease of antimicrobial action was the most noticeable among the reference strains, with the new MIC values being 4 to 6 times higher than those without catalase treatment. As already stated, F. nucleatum was the only strain in which the addition of catalase increases the susceptibility.
In most of the MIC experiments with artificial saliva as diluent, no statistically significant differences were observed. A significant increase of MIC was observed in citrus and oregano and sage honeys against F. nucleatum and in all honeys against S. aureus A, S. aureus B, and S. aureus ATCC 12600.

3.6. Effect of Proteinase K

In general, and regardless of the pathogen or the floral source, almost all honey samples showed a reduced activity after the proteinase K treatment from a total MIC average of 9.3 ± 7.6 (% w/v) to 10.4 ± 8.1 (% w/v). In one third of the experiments, those differences were statistically significant, as indicated in Table 9, while the rest showed no differences. Increased antimicrobial activity after proteinase K treatment was noted from citrus samples against F. nucleatum. Similar results were also obtained in MIC experiments where artificial saliva was used as diluent.

4. Discussion

Dental decay has been known since recorded history, but was not an important health problem until sucrose became a major component of the human diet. When sucrose is consumed frequently, an organism known as S.mutans emerges as the predominant organism, and it is this organism that has been uniquely associated with dental decay [60]. The tooth surface initially represents a carrier state relative to harboring this primary cariogen in the dental plaque on a smooth surface. The proportion of the cariogen in the flora is similar in both cases, but the location of S. mutans differs within the plaques. In the tooth destined to develop decay, S. mutans is located on the enamel surface, whereas in the tooth destined to remain caries free, S. mutans is confined to the saliva-plaque interface [61]. Debriding procedures, such as toothbrushing and flossing, might remove most plaque organisms except of S.mutans, including S. aureus and F. nucleatum, tested in this study, but could leave untouched those bacteria either firmly attached to the enamel surface or sequestered in defects and cavities in the enamel or dentin surface [60,62,63]. In such cases, alternative natural diet sources such as honey tested here could inhibit the proliferation of the previous mentioned pathogen’s population, resulting in controlling or even better, preventing dental caries. Other pathogens can also proliferate in the oral cavity inducing periodontitis and other soft tissue diseases resulting in the loss of teeth and low quality of life [60,62,63]. Within the limitations of this in vitro study, different honey samples, originating from the region of Epirus in Greece, were found to be effective against dental pathogens when treated in artificial saliva means. Artificial saliva has rheological, lubrication, and antibacterial properties similar to the ones of natural saliva and is used with good clinical results in patients suffering from xerostomia after radiation and other similar ailments, which reduces the production of natural saliva [64].
In our study, despite the strain and botanical dependent variation of our results, the majority of our samples performed better than manuka honey. This is an important finding, because manuka honey is considered by most researchers as the “front-runner of honeys for non peroxide antimicrobial activity” [65]. Hydrogen peroxide is not accumulated in manuka honey due to the destruction of glucose oxidase by methylglycoxal [66] and this is perhaps one reason for the outperformance of antibacterial activity of the Greek honeys. These honeys can act as both bacteriostatic and bactericidal depending on the concentration used. Pasture honey (4–8%) and 5–11% manuka honey were found to be bacteriostatic, whereas bactericidal activity was achieved at 5–10% and 8–15% concentrations, respectively [15,27,67]. In contrast, artificial honey (sugar solution which mimics the composition of honey) showed only bacteriostatic activity (at 20–30% v/v) and not bactericidal in the study of Bansal et al. (2005) [68]. In the present study, the bacteriostatic result was not differentiated from the bactericidal effect, mostly because (a) the aim of the study was to assess the total antibacterial activity and (b)—to a lesser degree—from a therapeutic point of view it is the inhibition of bacterial growth that matters most.
Mechanisms of antimicrobial activity of honey are different from antibiotics, which destroy the bacteria’s cell wall or inhibit intracellular metabolic pathways. The antibacterial activity is related to four properties of honey [11,17,22,26,33,69]. First, honey draws moisture out of the environment and thus dehydrates bacteria. The sugar content of honey is also high enough to hinder the growth of microbes, but the sugar content alone is not the sole reason for honey’s antibacterial properties [68]. The second antimicrobial reason of honey is the pH values. Τhe pH of honey is between 3.2 and 4.5 [26,27,38,70]. This acidity is low enough to inhibit the growth of most microorganisms of the ones tested here [26,27,38,70,71,72]. Although statistically significant differences were observed among the pH values off the different honey types, it was not possible to conclude any positive (or negative) statistically significant effect of these differences on the antimicrobial action either in well diffusion experiments or in MIC estimates. Furthermore, hydrogen peroxide produced by the glucose oxidase is one of the most important antibacterial components of honey, although some authors believe the non-peroxide activity is equally or even more important. Glucose oxidase is incorporated into honey during the foraging of the bees and oxidizes glucose to glucolactone [40,41]. This oxidation results in the production of gluconic acid and in the reduction of molecular oxygen to hydrogen peroxide [73]. The latter substance however can also be produced by polyphenol autoxidation [74]. In the present study, the hydrogen peroxide’s antibacterial activity was assessed by the addition of catalase (Figure 2 and Figure 3). Catalase can be found naturally in honey and is of pollen origin [75]. The results show (Figure 2 and Figure 3) that for all types of honey and for all pathogens, MIC increases after the addition of catalase. This increase in MIC implies an increased susceptibility of the dental pathogens due to the hydrogen peroxide content of honey. However, hydrogen peroxide, although a significant bactericidal ingredient, is not the sole or the most potent cause of the antibacterial activity of unprocessed honey. In our study, citrus honey contains 3.35 and 4.67 more hydrogen peroxide than oregano honey and Satureja spp. honey, respectively (Table 8), yet 5 out of 7 pathogens and reference strains showed a smaller inhibition zone in comparison to the other honeys (Table 9). On the other hand, the bacterial susceptibility can perhaps be attributed to the strain or even species-specific factors. Furthermore, several phytochemical factors with antibacterial activity have been identified in honey [76,77]. All these substances have been described as non-peroxide antibacterial factors [78].
In most of the MIC experiments with artificial saliva as the diluent, no statistically significant differences were observed. A significant increase of MIC was observed in citrus and oregano and sage honeys against F. nucleatum and in all honeys against S. aureus A, S. aureus B, and S. aureus ATCC 12600. Artificial saliva alters the viscosity of honey as well as its colloid structure. These physicochemical changes reduce the susceptibility of certain bacteria and thus the increase in MIC values in our study. However, this effect must have a species-specific element since only the S. aureus strains were found most susceptible to all honeys. In addition to the previous information, volatiles, organic acids, lysozyme, beeswax, nectar, pollen and propolis are important chemical factors that provide antibacterial properties to honey [78,79,80]. Propolis, a natural resinous mixture produced by honeybees, which exhibits anti-microbial, anti-inflammatory, cytostatic, and cariostatic properties. has been used already for cosmetic crèmes for the skin and oral hygiene sources such as dentifrices. Propolis, as it is known, influences the cytoplasmic membrane and has an inhibitory effect on the bacterial motility and enzymatic activity. It has bacteriostatic activity at low concentrations and can be bactericidal at high concentrations [81]. It breaks down bacterial cell wall, cytoplasm and prevents bacterial cell division. There are reports on the effectiveness of propolis-containing dentifrices for the control of caries in young adults [82]. In addition, in the study of Ophori et al. (2010) [83], it was also established that propolis and especially the ethanol extract of propolis (EEP) exerted bacteriostatic and bactericidal effects against S. mutans, respectively, at concentrations of 1.875 and 3.75 µg/mL or more. It was stated that organisms were the most susceptible to EEP at acidic pH followed by neutral and alkaline pH [84]. In another study, propolis mouth rinse was found to have an effective antimicrobial action against S. mutans [84]. In this sense, Greek honeys, which are already more effective than the manuka control source, as tested in this study, are estimated to better fulfill the pathogens inhibition status if specific extracted derivatives were also used in oral hygiene sources such as gels, mouth rinses, or dentifrices. Honey also contains oligosaccharides in large quantities. The sugar composition of honey from different floral sources was related to the growth inhibition of various intestinal bacteria [85]. Sugars do not possess antibacterial properties per se, but their concentration regulates the osmolarity and the osmolality of honey [86,87]. From the findings of our study, it is not clear however, if these differences can significantly affect the colloidal and rheological properties of different honeys and thus alter their antibacterial effect.
Despite their antibacterial effect, honey’s carbohydrates could be a factor of cariogenesis in high-risk dental patients [62,63]. Of course, in this risk category, patient’s use of honey is better than the sugar itself [62]. As shown in the study of Sela et al. (1998) [88], the initial microhardness of the surface of the enamel decreased significantly after consumption of a teaspoonful of honey in the subjects with a regular saliva flow, whereas in the irradiated dry-mouth patients, no enamel microhardness decrease occurred. The supposed solubility-reducing factor present in honey, which remains active in the absence of saliva but is inactivated by salivary enzymes, gives some support to the hypothesis that honey is less cariogenic or erosive in dry-mouth subjects [63,89]. These findings could most likely suggest that honey as a natural diet source could work better as an anticariogenic, anti-erosive, or wound healing factor in patients with hyposalivation [89,90,91]. However, diagnosed hyposalivation often comprises a sequela of severe systemic diseases, such as Sjögren’s syndrome [91,92], diabetes mellitus [93], or cancer during the phase of chemotherapy and radiotherapy [94,95]. It can also be derived by age or certain drugs (i.e., intake of angiotensin-converting enzyme inhibitors, anorexiants, anticholinergic/antispasmodic agents, sedatives, anti-parkinsonism agents, antipsychotics, etc.) [96,97]. Possibly, in these patients, honey should be used through natural sources while propolis should be used in younger and healthy patients as extracts in oral hygiene products.
Moreover, it is reported that a part of the antibacterial activity might be attributed to the components of plant origin [97,98]. In our study, honeys of different plant origins were used, and the results show differences in the diameter of the inhibition zones as well as in MIC according to the plant origin. After the addition of catalase, which eliminates the activity of hydrogen peroxide, the still existing antibacterial activity of honey is entirely due to various phytochemicals. A portion of these substances is of protein or peptide origin, as the addition of proteinase K suggests, and the rest are phenolic, flavonoid, and other compounds with antibacterial activity, all of them derived from the plants that bees forage. Honey contains proteins and peptides with antibacterial activity. Brudzynski and Sjaard (2015) [99] identified fragments of glycoproteins, which exerted non-specific membrane permeabilization of the bacterial cells, resulting in a strong inhibition of growth. The same researchers (2014) [100] argued that compounds in Canadian honey act against bacterial cells in a mode similar to β-lactams. Four families of antibacterial peptides and proteins have been identified so far, in bees: apideacins, abaecins, hymenoptaecin, and defensin. These compounds represent the humoral defense of bees against pathogens and some of them, such as defensin 1, are incorporated into honey [100,101].
An interesting find is that in the case of citrus honey, most of the tested pathogens showed decreased susceptibility after the addition of protease K (Figure 3). The remaining antibacterial activity is due to phenolic and other non-protein compounds, and since the susceptibility of the pathogens was reduced, it follows that possibly the action of some of these compounds must have been inhibited by some peptides. Combarros-Fuertes et al. (2019) [102] demonstrated that the antibacterial activity of the phenolic and flavonoid compounds of honey in MIC range from 0.05 g/mL to 0,40 g/mL. The use of artificial saliva in the present study served the purpose of simulating the conditions in the oral cavity. The results show that the antibacterial effect was enhanced in most cases. To our knowledge, this is the first study researching the effect of artificial saliva as a solvent to the antibacterial effect of honey. Having a greater viscosity than distilled water (the usual solvent), artificial saliva reduces to a lesser extent the viscosity and the colloidal structure of honey, which retains due to these properties more of its initial antibacterial activity.
A limitation of the present study is the lack of pollen analysis of the different types of honey. This analysis would verify the botanical source of each sample. We relied on the information about the geographical origin of the samples, which included the dominant plant species.
Finally, as a probable limitation in this study, we could point the use of a post-hoc multiple comparison methodology but without a Bonferroni reduction, since it works by reducing the p-values, making it possible to reject the valid conclusions (Type II error). We chose to follow the classical approach (without Bonferroni reduction) which, despite its flaws, remains a standard and convenient approach.

5. Conclusions

  • The Greek honeys and particularly the citrus and the oregano and sage honey, showed an impressive antibacterial activity against all oral pathogens tested in this study as well as the reference strains.
  • This antibacterial activity outperformed in most cases the one of manuka honey, which was used as control due to its well-studied and fully documented antibacterial activity.
  • A significant part of the antibacterial activity was due to hydrogen peroxide. Further studies are needed for evaluating the effect of other compounds such as peptides and non-peptides (phenolic compounds, flavonoids, and others) in the antibacterial action.
  • In in-vitro conditions, the antibacterial activity of honey is found to be enhanced in most cases when artificial saliva is used for its dilution.
  • There is an indication that in a clinical environment, Greek honeys can be used as anti-cariogenic, anti-erosive and/or oral wound healing factor in patients with hyposalivation.
  • Although further clinical research is needed, there is a strong indication that honey should be used in elderly patients through natural sources while propolis or other honey derivatives should be used in younger and healthy patients as extracts in oral hygiene products.
  • Our results are promising, and a future project must include not «artificial saliva» but saliva from volunteers, and perhaps not only healthy volunteers but also volunteers with specific dental lesions. In this case, the interaction between the natural microflora of the oral cavity and the pathogenic bacteria in the presence of various types of honey should also be studied.
  • The exact botanological profile of the various types of honeys should be investigated in order to classify them accurately and derive more specific clinical suggestions.

Author Contributions

C.V., G.R., A.T., M.A. and E.B.; methodology, G.R. and A.A.; software, C.V., M.A., I.S., A.T. and E.B.; validation, A.A., M.A., G.R., E.G. and T.V.; formal analysis, C.V. and A.A.; investigation, C.V., E.G., A.T., I.S. and E.B.; resources, C.V., A.A., G.R. and T.V.; data curation, C.V. and G.R.; writing—original draft preparation, C.V., M.A., A.T., T.V. and E.B.; writing—review and editing, C.V., T.V. and E.B.; visualization, C.V., A.T. and E.B.; supervision, C.V., A.T. and E.B.; project administration. All authors have read and agreed to the published version of the manuscript.

Funding

This research received no external funding.

Conflicts of Interest

The authors declare no conflict of interest.

References

  1. Gao, L.; Xu, T.; Huang, G.; Jiang, S.; Gu, Y.; Chen, F. Oral microbiomes: More and more importance in oral cavity and whole body. Protein Cell 2018, 9, 488–500. [Google Scholar] [CrossRef] [PubMed] [Green Version]
  2. Yadav, N.; Garla, B.; Reddy, V.; Tandon, S.; Prasad, S. Antimicrobial Effect of Honey on Streptococcus Mutans of Dental Plaque. J. Oral Health Community Dent. 2014, 8, 72–75. [Google Scholar] [CrossRef]
  3. Mark Welch, J.L.; Dewhirst, F.E.; Borisy, G.G. Biogeography of the Oral Microbiome: The Site-Specialist Hypothesis. Annu. Rev. Microbiol. 2019, 73, 335–358. [Google Scholar] [CrossRef]
  4. Yeoh, S.C.; Hua, H.; Yepes, J.F.; Peterson, D.E. Oral Manifestations of Systemic Diseases and their Treatments. In Contemporary Oral Medicin; Farah, C., Balasubramaniam, R., McCullough, M., Eds.; Springer: Cham, Switzerland, 2018. [Google Scholar] [CrossRef]
  5. Bakhtiari, S.; Sehatpour, M.; Mortazavi, H.; Bakhshi, M. Orofacial Manifestation of Adverse Drug Reactions: A Review Study. Med. Pharm. Rep. 2018, 91, 27–36. [Google Scholar] [CrossRef] [Green Version]
  6. Ramsay, E.I.; Rao, S.; Madathil, L.; Hegde, S.K.; Baliga-Rao, M.P.; George, T.; Baliga, M.S. Honey in oral health and care: A mini review. J. Oral Biosci. 2019, 61, 32–36. [Google Scholar] [CrossRef]
  7. Stašková, A.; Nemcová, R.; Lauko, S.; Jenča, A. Oral Microbiota from the Stomatology Perspective. Bact. Biofilms 2020. [Google Scholar] [CrossRef] [Green Version]
  8. Shay, K. Infectious Complications of Dental and Periodontal Diseases in the Elderly Population. Clin. Infect. Dis. 2002, 34, 1215–1223. [Google Scholar] [CrossRef] [PubMed]
  9. Iwu, C.D.; Korsten, L.; Okoh, A.I. The incidence of antibiotic resistance within and beyond the agricultural ecosystem: A concern for public health. Microbiol. Open 2020, 9, e1035. [Google Scholar] [CrossRef]
  10. Fair, R.J.; Tor, Y. Antibiotics and Bacterial Resistance in the 21st Century. Perspect. Med. Chem. 2014, 6. [Google Scholar] [CrossRef] [PubMed] [Green Version]
  11. Nolan, V.C.; Harrison, J.; Cox, J.A.G. Dissecting the Antimicrobial Composition of Honey. Antibiotics 2019, 8, 251. [Google Scholar] [CrossRef] [Green Version]
  12. Mushtaq, S.; Imtiyaz, Z.; Wali, A.F.; Khan, A.; Rashid, S.M.; Amin, I.; Ali, A.; Rehman, M.U.; Arafah, A. Honey: A Powerful Natural Antioxidant and Its Possible Mechanism of Action. In Therapeutic Applications of Honey and Its Phytochemicals; Rehman, M.U., Majid, S., Eds.; Springer: Singapore, 2020. [Google Scholar] [CrossRef]
  13. Zbuchea, A. Up-to-date use of honey for burns treatment. Ann. Burn. Fire Disasters 2014, 27, 22–30. [Google Scholar]
  14. Schencke, C.; Vasconcellos, A.; Sandoval, C.; Torres, P.; Acevedo, F.; Del Sol, M. Morphometric evaluation of wound healing in burns treated with Ulmo (Eucryphia cordifolia) honey alone and supplemented with ascorbic acid in guinea pig (Cavia porcellus). Burn. Trauma 2016, 4, 1–9. [Google Scholar] [CrossRef] [PubMed] [Green Version]
  15. Ranneh, Y.; Akim, A.M.; Hamid, H.A.; Khazaai, H.; Fadel, A.; Zakaria, Z.A.; Albujja, M.; Bakar, M.F.A. Honey and its nutritional and anti-inflammatory value. BMC Complement. Med. Ther. 2021, 21. [Google Scholar] [CrossRef] [PubMed]
  16. Samarghandian, S.; Farkhondeh, T.; Samini, F. Honey and Health: A Review of Recent Clinical Research. Pharmacogn. Res. 2017, 9, 121–127. [Google Scholar] [CrossRef]
  17. Ahmad, R.S.; Hussain, M.B.; Saeed, F.; Waheed, M.; Tufail, T. Phytochemistry, metabolism, and ethnomedical scenario of honey: A oncurrent review. Int. J. Food Prop. 2017, 20, S254–S269. [Google Scholar] [CrossRef] [Green Version]
  18. Ahmed, S.; Sulaiman, S.A.; Baig, A.A.; Ibrahim, M.; Liaqat, S.; Fatima, S.; Jabeen, S.; Shamim, N.; Othman, N.H. Honey as a Potential Natural Antioxidant Medicine: An Insight into Its Molecular Mechanisms of Action. Oxidative Med. Cell. Longev. 2018, 1–19. [Google Scholar] [CrossRef] [PubMed] [Green Version]
  19. Ahmadi-Motamayel, F.; Hendi, S.S.; Alikhani, M.Y.; Khamverdi, Z. Antibacterial activity of honey on cariogenic bacteria. J. Dent. (Tehran) 2013, 10, 10–15. [Google Scholar] [PubMed]
  20. Stagos, D.; Soulitsiotis, N.; Tsadila, C.; Papaeconomou, S.; Arvanitis, C.; Ntontos, A.; Karkanta, F.; Adamou-Androulaki, S.; Petrotos, K.; Spandidos, D.; et al. Antibacterial and antioxidant activity of different types of honey derived from Mount Olympus in Greece. Int. J. Mol. Med. 2018, 42, 726–734. [Google Scholar] [CrossRef] [PubMed] [Green Version]
  21. Machado, A.M.; Miguel, M.G.; Vilas-Boas, M.; Figueiredo, A.C. Honey Volatiles as a Fingerprint for Botanical Origin—A Review on their Occurrence on Monofloral Honeys. Molecules 2020, 25, 374. [Google Scholar] [CrossRef] [PubMed] [Green Version]
  22. Israili, Z.H. Antimicrobial properties of honey. Am J Ther. 2014, 21, 304–323. [Google Scholar] [CrossRef] [PubMed]
  23. Almasaudi, S. The antibacterial activities of honey. Saudi J. Biol. Sci. 2021, 28, 2188–2196. [Google Scholar] [CrossRef]
  24. Voidarou, C.; Alexopoulos, A.; Tsinas, A.; Rozos, G.; Tzora, A.; Skoufos, I.; Varzakas, T.; Bezirtzoglou, E. Effectiveness of Bacteriocin-Producing Lactic Acid Bacteria and Bifidobacterium Isolated from Honeycombs against Spoilage Microorganisms and Pathogens Isolated from Fruits and Vegetables. Appl. Sci. 2020, 10, 7309. [Google Scholar] [CrossRef]
  25. Voidarou, C.; Alexopoulos, A.; Plessas, S.; Karapanou, A.; Mantzourani, I.; Stavropoulou, E.; Fotou, K.; Tzora, A.; Skoufos, I.; Bezirtzoglou, E. Antibacterial activity of different honeys against pathogenic bacteria. Anaerobe 2011, 17, 375–379. [Google Scholar] [CrossRef] [PubMed]
  26. Albaridi, N.A. Antibacterial Potency of Honey. Int. J. Microbiol. 2019, 2019, 2464507. [Google Scholar] [CrossRef]
  27. Mandal, M.D.; Mandal, S. Honey: Its medicinal property and antibacterial activity. Asian Pac. J. Trop. Biomed. 2011, 1, 154–160. [Google Scholar] [CrossRef] [Green Version]
  28. Kwakman, P.H.S.; Zaat, S.A.J. Antibacterial components of honey. IUBMB Life 2012, 64, 48–55. [Google Scholar] [CrossRef]
  29. Cooper, R.A.; Molan, P.C.; Harding, K.G. Antibacterial Activity of Honey against Strains of Staphylococcus aureus from Infected Wounds. J. R. Soc. Med. 1999, 92, 283–285. [Google Scholar] [CrossRef] [Green Version]
  30. Viuda-Martos, M.; Ruiz-Navajas, Y.; Fernández-López, J.; Pérez-Álvarez, J.A. Functional Properties of Honey, Propolis, and Royal Jelly. J. Food Sci. 2008, 73, R117–R124. [Google Scholar] [CrossRef] [PubMed]
  31. Pasupuleti, V.R.; Sammugam, L.; Ramesh, N.; Gan, S.H. Honey, Propolis, and Royal Jelly: A Comprehensive Review of Their Biological Actions and Health Benefits. Oxid. Med. Cell Longev. 2017, 1259510. [Google Scholar] [CrossRef] [PubMed]
  32. Mavric, E.; Wittmann, S.; Barth, G.; Henle, T. Identification and quantification of methylglyoxal as the dominant antibacterial constituent of Manuka (Leptospermum scoparium) honeys from New Zealand. Mol. Nutr. Food Res. 2008, 52, 483–489. [Google Scholar] [CrossRef] [PubMed]
  33. Molan, P. An explanation of why the MGO level in manuka honey does not show the antibacterial activity. N. Z. BeeKeeper 2008, 16, 11–13. [Google Scholar]
  34. Atrott, J.; Henle, T. Methylglyoxal in Manuka Honey—Correlation with Antibacterial Properties. Czech J. Food Sci. 2009, 27, S163–S165. [Google Scholar] [CrossRef] [Green Version]
  35. Tonks, A.J.; Cooper, R.A.; Jones, K.P.; Blair, S.; Parton, J.; Tonks, A. Honey stimulates inflammatory cytokine production from monocytes. Cytokine 2003, 21, 242–247. [Google Scholar] [CrossRef]
  36. Lu, J.; Carter, D.A.; Turnbull, L.; Rosendale, D.; Hedderley, D.; Stephens, J.; Gannabathula, S.; Steinhorn, G.; Schlothauer, R.C.; Whitchurch, C.B.; et al. The Effect of New Zealand Kanuka, Manuka and Clover Honeys on Bacterial Growth Dynamics and Cellular Morphology Varies According to the Species. PLoS ONE 2013, 8, e55898. [Google Scholar] [CrossRef] [Green Version]
  37. Cooper, R.A.; Molan, P.C.; Harding, K.G. The sensitivity to honey of Gram-positive cocci of clinical significance isolated from wounds. J. Appl. Microbiol. 2002, 93, 857–863. [Google Scholar] [CrossRef]
  38. Gkoutzouvelidou, M.; Panos, G.; Xanthou, M.N.; Papachristoforou, A.; Giaouris, E. Comparing the Antimicrobial Actions of Greek Honeys from the Island of Lemnos and Manuka Honey from New Zealand against Clinically Important Bacteria. Proceedings 2021, 70, 8. [Google Scholar] [CrossRef]
  39. Cunnif, P. Official Methods of Analysis of AOAC International, 16th ed.; 5th Revision, Volume II, Chapter 44, Subchapter 4; AOAC International: Gaithersburg, MD, USA, 1999. [Google Scholar]
  40. Bucekova, M.; Jardekova, L.; Juricova, V.; Bugarova, V.; Di Marco, G.; Gismondi, A.; Leonardi, D.; Farkasovska, J.; Godocikova, J.; Laho, M.; et al. Antibacterial Activity of Different Blossom Honeys: New Findings. Molecules 2019, 24, 1573. [Google Scholar] [CrossRef] [PubMed] [Green Version]
  41. Bucekova, M.; Bugarova, V.; Godocikova, J.; Majtan, J. Demanding New Honey Qualitative Standard Based on Antibacterial Activity. Foods 2020, 9, 1263. [Google Scholar] [CrossRef] [PubMed]
  42. Godocikova, J.; Bugarova, V.; Kast, C.; Majtan, V.; Majtan, J. Antibacterial potential of Swiss honeys and characterisation of their bee-derived bioactive compounds. J. Sci. Food Agric. 2020, 100, 335–342. [Google Scholar] [CrossRef] [PubMed]
  43. Bang, L.M.; Buntting, C.; Molan, P. The Effect of Dilution on the Rate of Hydrogen Peroxide Production in Honey and Its Implications for Wound Healing. J. Altern. Complement. Med. 2003, 9, 267–273. [Google Scholar] [CrossRef] [Green Version]
  44. Association of Official Analytical Chemists (AOAC). Official Methods of Analysis, 15th ed.; Helrich, K., Ed.; Methods 954.11–979.21 and 977.20; Association of Official Analytical Chemists, Inc.: Arlington, VA, USA, 1990; pp. 1028–1030. [Google Scholar]
  45. Terrab, A.; Recamales, A.F.; Hernanz, D.; Heredia, F.J. Characterisation of Spanish thyme honeys by their physicochemical characteristics and mineral contents. Food Chem. 2004, 88, 537–542. [Google Scholar] [CrossRef]
  46. Singleton, V.L.; Orthofer, R.; Lamuela-Raventos, R.M. Analysis of total phenols and other oxidation substrates and antioxidants by means of Folin-Ciocalteu reagent. Methods Enzym. 1999, 299, 152–178. [Google Scholar] [CrossRef]
  47. Al-Farsi, M.; Al-Amri, A.; Al-Hadhrami, A.; Al-Belushi, S. Color, flavonoids, phenolics and antioxidants of Omani honey. Heliyon 2018, 4, e00874. [Google Scholar] [CrossRef] [Green Version]
  48. Blasa, M.; Candiracci, M.; Accorsi, A.; Piacentini, M.; Piatti, E. Honey flavonoids as protection agents against oxidative damage to human red blood cells. Food Chem. 2017, 104, 1635–1640. [Google Scholar] [CrossRef]
  49. Boussaid, A.; Chouaibi, M.; Rezig, L.; Hellal, R.; Donsì, F.; Ferrari, G.; Hamdi, S. Physicochemical and bioactive properties of six honey samples from various floral origins from Tunisia. Arab. J. Chem. 2018, 11, 265–274. [Google Scholar] [CrossRef] [Green Version]
  50. Clinical and Laboratory Standards Institute. Available online: https://clsi.org/about/clsis-history/ (accessed on 12 January 2021).
  51. National Committee For Clinical Laboratory Standards. Performance Standards for Antimicrobial Disk and Dilution Susceptibility Tests for Bacteria Isolated from Animals: Approved Standards; Document M31-A, 19; NCCLS: Wayne, PA, USA, 1999; pp. 9–10. [Google Scholar]
  52. Gal, J. About a synthetic saliva for in vitro studies. Talanta 2001, 53, 1103–1115. [Google Scholar] [CrossRef]
  53. Leung, V.W.; Darvell, B.W. Artificial salivas for in vitro studies of dental materials. J. Dent. 1997, 25, 475–484. [Google Scholar] [CrossRef] [PubMed]
  54. Nordman, H.; Davies, J.R.; Lindell, G.; De Bolós, C.; Real, F.; Carlstedt, I. Gastric MUC5AC and MUC6 are large oligomeric mucins that differ in size, glycosylation and tissue distribution. Biochem. J. 2002, 364, 191–200. [Google Scholar] [CrossRef]
  55. Sarkar, A.; Goh, K.K.T.; Singh, H. Colloidal stability and interactions of milk-protein-stabilized emulsions in an artificial saliva. Food Hydrocoll. 2009, 23, 1270–1278. [Google Scholar] [CrossRef]
  56. Malpass, G.E.; Arimilli, S.; Prasad, G.L.; Howlett, A.C. Complete artificial saliva alters expression of proinflammatory cytokines in human dermal fibroblasts. Toxicol. Sci. Off. J. Soc. Toxicol. 2013, 134, 18–25. [Google Scholar] [CrossRef] [Green Version]
  57. Patton, T.; Barrett, J.; Brennan, J.; Moran, N. Use of a spectrophotometric bioassay for determination of microbial sensitivity to manuka honey. J. Microbiol. Methods 2006, 64, 84–95. [Google Scholar] [CrossRef]
  58. Sindi, A.; Chawn, M.V.B.; Hernandez, M.E.; Green, K.; Islam, M.K.; Locher, C.; Hammer, K. Anti-biofilm effects and characterisation of the hydrogen peroxide activity of a range of Western Australian honeys compared to Manuka and multifloral honeys. Sci. Rep. 2019, 9. [Google Scholar] [CrossRef]
  59. Mundo, M.A.; Padilla-Zakour, O.I.; Worobo, R.W. Growth inhibition of foodborne pathogens and food spoilage organisms by select raw honeys. Int. J. Food Microbiol. 2004, 97, 1–8. [Google Scholar] [CrossRef] [PubMed]
  60. Walter, J. Loesche. In Microbiology of Dental Decay and Periodontal Disease. Medical Microbiolog, 4th ed.; The University of Texas Medical Branch at Galveston: Galveston, TX, USA, 1996; Chapter 99. [Google Scholar]
  61. Amargianitakis, M.; Antoniadou, M.; Rahiotis, C.; Varzakas, T. Probiotics, Prebiotics, Synbiotics and Dental Caries. New Perspectives, Suggestions, and Patient Coaching Approach for a Cavity-Free Mouth. Appl. Sci. 2021, 11, 5472. [Google Scholar] [CrossRef]
  62. Antoniadou, M.; Varzakas, T. Diet and Oral Health Coaching Methods and Models for the Independent Elderly. Appl. Sci. 2020, 10, 4021. [Google Scholar] [CrossRef]
  63. Antoniadou, M.; Varzakas, T. Breaking the vicious circle of diet, malnutrition and oral health for the independent elderly. Crit. Rev. Food Sci. Nutr. 2020. [Google Scholar] [CrossRef]
  64. Łysik, D.; Niemirowicz-Laskowska, K.; Bucki, R.; Tokajuk, G.; Mystkowska, J. Artificial Saliva: Challenges and Future Perspectives for the Treatment of Xerostomia. Int. J. Mol. Sci. 2019, 20, 3199. [Google Scholar] [CrossRef] [PubMed] [Green Version]
  65. Johnston, M.; McBride, M.; Dahiya, D.; Owusu-Apenten, R.; Nigam, P.S. Antibacterial activity of Manuka honey and its components: An overview. AIMS Microbiol. 2018, 4, 655–664. [Google Scholar] [CrossRef] [PubMed]
  66. Majtan, J.; Bohova, J.; Prochazka, E.; Klaudiny, J. Methylglyoxal may affect hydrogen peroxide accumulation in manuka honey through the inhibition of glucose oxidase. J. Med. Food. 2014, 17, 290–293. [Google Scholar] [CrossRef] [PubMed]
  67. Eteraf-Oskouei, T.; Najafi, M. Traditional and modern uses of natural honey in human diseases: A review. Iran. J. Basic Med Sci. 2013, 16, 731–742. [Google Scholar]
  68. Bansal, V.; Medhi, B.; Pandhi, P. Honey -A remedy rediscovered and its therapeutic utility. Kathmandu Univ. Med. J. 2005, 3, 305–309. [Google Scholar]
  69. Molan, P.C. The Antibacterial Activity of Honey. Bee World 1992, 73, 5–28. [Google Scholar] [CrossRef]
  70. Kinoo, M.S.; Mahomoodally, M.F.; Puchooa, D. Anti-Microbial and Physico-Chemical Properties of Processed and Raw Honeys of Mauritius. Adv. Infect. Dis. 2012, 2, 25–36. [Google Scholar] [CrossRef]
  71. Brown, E.; O’Brien, M.; Georges, K.; Suepaul, S. Physical characteristics and antimicrobial properties of Apis mellifera, Frieseomelitta nigra and Melipona favosa bee honeys from apiaries in Trinidad and Tobago. BMC Complement. Med. Ther. 2020, 20, 85. [Google Scholar] [CrossRef] [PubMed] [Green Version]
  72. Simon, A.; Traynor, K.; Santos, K.; Blaser, G.; Bode, U.; Molan, P. Medical honey for wound care—still the ‘latest resort’? Evid. Based Complement. Alternat. Med. 2009, 6, 165–173. [Google Scholar] [CrossRef]
  73. da Silva, P.M.; Gauche, C.; Gonzaga, L.V.; Costa, A.C.; Fett, R. Honey: Chemical composition, stability and authenticity. Food Chem. 2016, 196, 309–323. [Google Scholar] [CrossRef]
  74. Brudzynski, K. A current perspective on hydrogen peroxide production in honey. A review. Food Chem. 2020, 332, 127229. [Google Scholar] [CrossRef]
  75. Brudzynski, K.; Abubaker, K.; St-Martin, L.; Castle, A. Re-examining the role of hydrogen peroxide in bacteriostatic and bactericidal activities of honey. Front. Microbiol. 2011, 2, 213. [Google Scholar] [CrossRef] [Green Version]
  76. Al-Waili, N.S.; Haq, A. Effect of honey on antibody production against thymus-dependent and thymus-independent antigens in primary and secondary immune responses. J. Med. Food 2004, 7, 491–494. [Google Scholar] [CrossRef]
  77. Emsen, I.M. A different and safe method of split thickness skin graft fixation: Medical honey application. Burns 2007, 33, 782–787. [Google Scholar] [CrossRef]
  78. Olaitan, P.B.; Adeleke, O.E.; Ola, I.O. Honey: A reservoir for microorganisms and an inhibitory agent for microbes. Afr. Health Sci. 2007, 7, 159–165. [Google Scholar] [CrossRef] [PubMed]
  79. Szweda, P. Antimicrobial Activity of Honey. In Honey Analysis; de Alencar Arnaut de Toledo, V., Ed.; IntechOpen: London, UK, 2017; pp. 215–232. [Google Scholar] [CrossRef] [Green Version]
  80. Estevinho, L.; Pereira, A.P.; Moreira, L.; Dias, L.G.; Pereira, E. Antioxidant and antimicrobial effects of phenolic compounds extracts of Northeast Portugal honey. Food Chem Toxicol. 2008, 46, 3774–3779. [Google Scholar] [CrossRef] [PubMed]
  81. Fokt, H.; Pereira, A.; Ferreira, A.M.; Cunha, A.; Aguiar, C. How do bees prevent hive infections? The antimicrobial properties of Propolis. Curr. Res. Technol. Educ. Top. Appl. Microbiol. Microb. Biotechnol. 2010, 1, 481–493. [Google Scholar]
  82. Mohsin, S.; Manohar, B.; Rajesh, S.; Asif, Y. The effects of a dentifrice containing propolis on Mutans Streptococci: A clinico-microbiological study. Ethiop. J. Health Sci. 2015, 25, 9–16. [Google Scholar] [CrossRef] [PubMed] [Green Version]
  83. Ophori, E.A.; Eriagbonye, B.N.; Ugbodaga, P. Antimicrobial activity of Propolis against Streptococcus Mutans. Afr. J. Biotechnol. 2010, 9, 4966–4969. [Google Scholar] [CrossRef]
  84. Yang, H.-Y.; Ho, W.-L.; Chang, C.-M.; Chou, C.-C. Antibacterial activity of propolis ethanol extract against streptococcus mutans as influenced by concentration, temperature, pH and cell age. J. Food Drug Anal. 2007, 15. [Google Scholar] [CrossRef]
  85. Malhotra, N.; Rao, S.P.; Acharya, S.; Vasudev, B. Comparative in vitro evaluation of efficacy of mouthrinses against Streptococcus mutans, Lactobacilli and Candida albicans. Oral Health Prev. Dent. 2011, 9, 261–268. [Google Scholar] [CrossRef]
  86. Shin, H.; Ustunol, Z. Carbohydrate composition of honey from different floral sources and their influence on growth of selected intestinal bacteria. Food Res. Int. 2005, 38, 721–728. [Google Scholar] [CrossRef]
  87. Basualdo, C.; Sgroy, V.; Finola, M.S.; Marioli, J.M. Comparison of the antibacterial activity of honey from different provenance against bacteria usually isolated from skin wounds. Vet. Microbiol. 2007, 124, 375–381. [Google Scholar] [CrossRef]
  88. Sela, M.; Shapira, L.; Grizim, I.; Lewinstein, I.; Steinberg, D.; Gedalia, I.; Grobler, S.R. Effects of honey consumption on enamel microhardness in normal versus xerostomic patients. J. Oral Rehabil. 1998, 25, 630–634. [Google Scholar] [CrossRef]
  89. Habluetzel, A.; Schmid, C.; Carvalho, T.S.; Lussi, A.; Eick, S. Impact of honey on dental erosion and adhesion of early bacterial colonizers. Sci Rep. 2018, 8, 10936. [Google Scholar] [CrossRef] [PubMed]
  90. Molan, P.C. Not all honeys are the same for wound healing. Eur. Tissue Repair. Soc. Bull. 2002, 9, 5–6. [Google Scholar]
  91. Schubert, M.M.; Izutsu, K.T. Iatrogenic Causes of Salivary Gland Dysfunction. J. Dent. Res. 1987, 66, 680–688. [Google Scholar] [CrossRef] [PubMed]
  92. Saleh, J.; ZancanaroFigueiredo, M.A.; Cherubini, K.; Salum, F.G. Salivary hypofunction: An update on aetiology, diagnosis and therapeutics. Arch. Oral Biol. 2015, 60, 242–255. [Google Scholar] [CrossRef]
  93. Kudiyirickal, M.G.; Pappachan, J.M. Diabetes mellitus and oral health. Endocrine 2015, 49, 27–34. [Google Scholar] [CrossRef]
  94. Poulopoulos, A.; Papadopoulos, P.; Andreadis, D. Chemotherapy: Oral side effects and dental interventions. A review of the literature. Stomatol. Dis. Sci. 2017, 1, 35–49. [Google Scholar] [CrossRef]
  95. Arrifin, A.; Heidari, E.; Burke, M.; Fenlon, M.R.; Banerjee, A. The Effect of Radiotherapy for Treatment of Head and Neck Cancer on Oral Flora and Saliva. Oral Health Prev. Dent. 2018, 16, 425–429. [Google Scholar] [CrossRef]
  96. Scully, C. Drug effects on salivary glands: Dry mouth. Oral Dis. 2003, 9, 165–176. [Google Scholar] [CrossRef] [PubMed]
  97. Ohara, Y.; Hirano, H.; Yoshida, H.; Obuchi, S.; Ihara, K.; Fujiwara, Y.; Mataki, S. Prevalence and factors associated with xerostomia and hyposalivation among community-dwelling older people in Japan. Gerodontology 2013, 33, 20–27. [Google Scholar] [CrossRef] [PubMed]
  98. Küçük, M.; Kolaylı, S.; Karaoğlu, S.; Ulusoy, E.; Baltacı, C.; Candan, F. Biological activities and chemical composition of three honeys of different types from Anatolia. Food Chem. 2007, 100, 526–534. [Google Scholar] [CrossRef]
  99. Brudzynski, K.; Sjaarda, C. Honey glycoproteins containing antimicrobial peptides, Jelleins of the Major Royal Jelly Protein 1, are responsible for the cell wall lytic and bactericidal activities of honey. PLoS ONE 2015, 10, e0120238. [Google Scholar] [CrossRef] [PubMed] [Green Version]
  100. Brudzynski, K.; Sjaarda, C. Antibacterial compounds of Canadian honeys target bacterial cell wall inducing phenotype changes, growth inhibition and cell lysis that resemble action of β-lactam antibiotics. PLoS ONE 2014, 9, e106967. [Google Scholar] [CrossRef] [PubMed] [Green Version]
  101. Xu, P.; Shi, M.; Chen, X.X. Antimicrobial peptide evolution in the Asiatic honey bee Apiscerana. PLoS ONE 2009, 4, e4239. [Google Scholar] [CrossRef] [Green Version]
  102. Combarros-Fuertes, P.; Estevinho, L.M.; Dias, L.G.; Castro, J.M.; Tomás-Barberán, F.A.; Tornadijo, M.E.; Fresno-Baro, J.M. Bioactive Components and Antioxidant and Antibacterial Activities of Different Varieties of Honey: A Screening Prior to Clinical Application. J. Agric. Food Chem. 2019, 67, 688–698. [Google Scholar] [CrossRef] [PubMed] [Green Version]
Scheme 1. Schematic representation of the main factors involved in antibacterial activity of honey.
Applsci 11 06318 sch001
Figure 1. (ag): Antimicrobial effect of local and manuka honey samples estimated by the well diffusion assay against seven pathogens. Lines indicate the inhibition zone of artificial honey in local honey experiments (blue) and with manuka (yellow).
Applsci 11 06318 g001aApplsci 11 06318 g001b
Figure 2. (ag): Minimum inhibitory concentration of local (n = 60) honey samples treated with and without catalase or proteinase, as well as manuka honey (n = 1) against seven oral pathogens. Different letters indicate differences among the types of honey within each treatment. Line (blue) indicates the MIC value of manuka.
Applsci 11 06318 g002
Figure 3. (ag): Minimum inhibitory concentration of local (n = 60) honey samples treated with and without catalase or proteinase as well as manuka honey (n = 1) against seven oral pathogens with artificial saliva as diluent. Different letters indicate differences among the types of honey within each treatment. Line (blue) indicates the MIC value of manuka.
Applsci 11 06318 g003
Figure 4. Antibiotic susceptibility profile of the strains used in the study (see in the text for antibiotic abbreviations).
Applsci 11 06318 g004
Table 1. Chemical composition of artificial saliva. Reprinted with permission from Refs. [55,56] 2009 Elsevier.
Components in Artficial SalivaConcetration (g/L)
Sodium chlorideNaCl1.594
Ammonium nitrateNH4NO30.328
Potassium phosphateKH2PO40.636
Potassium chlorideKCl0.202
Potassium citrateK3C6H5O7·H2O0.308
Uric acid sodium saltC5H3N4O3Na0.021
UreaH2NCONH20.198
Lactic acid sodium saltC3H5O3Na0.146
Porcine gastric Mucin Type II 1.35
D- (+) glucose 0.1
α-amylase 100,000 U
Lysozyme 750 U
WaterFour times distilled H2O and 0.1 M NaOH used to achieve pH 6.8
Table 2. Physicochemical characteristics of the 20 citrus honey samples.
HoneypHH2O2 (μg/g Unprocessed Honey)Free AcidityLactonic AcidityTPC (mg GAE/100 g of Honey)TFCmg Quercetin Equivalents (CE)/100 g of Honey
13.911 ± 0.4 a13.6 ± 0.2 de9.1 ± 0.2 f35.1 ± 0.4 d0.65 ± 0.2 ab
23.537 ± 0.9 e12.1 ± 0.4 bc5.3 ± 0.4 d29.5 ± 0.2 b1.2 ± 0.2 abc
33.711 ± 0.56 a22.1 ± 0.1 gh7.8 ± 0.2 e52.1 ± 0.7 h0.8 ± 0.7 a
43.517 ± 0.8 b27 ± 0.6 i3.2 ± 0.2 a75.1 ± 0.8 j2.2 ± 0.3 d
53.547 ± 2.54 g11.7 ± 0.1 abc4.5 ± 0.2 cd45.3 ± 0.7 f1.9 ± 0.4 cd
63.632 ± 1.51 d12.8 ± 0.3 cd4.5 ± 0.4 cd29.2 ± 0.7 b0.55 ± 0.3 a
73.852 ± 2.74 h15.2 ± 0.2 e7.1 ± 0.2 ce33.4 ± 0.2 c0.7 ± 0.2 ab
83.941 ± 1.98 ef22.2 ± 0.3 h4.8 ± 0.1 d45.3 ± 0.5 f1.1 ± 0.3 abc
93.839 ± 1.09 e17 ± 0.2 f4.1 ± 0.5 abc32.4 ± 0.7 c0.8 ± 0.2 ab
103.940 ± 1.1 ef18.1 ± 0.3 f7.1 ± 0.3 e45.2 ± 0.3 f1.2 ± 0.2 ac
113.539 ± 0.4 e11.2 ± 0.7 ab9.4 ± 0.3 fg33.7 ± 0.5 cdf0.7 ± 0.2 ab
123.622 ± 1.04 c10.8 ± 0.2 a9.2 ± 0.1 f44.7 ± 0.2 f0.7 ± 0.3 ab
133.959 ± 1.77 i14.2 ± 0.2 e4.2 ± 0.4 bc53.1 ± 0.7 h0.9 ± 0.1 ab
144.155 ± 1.74 hi11.8 ± 0.3 abc3.5 ± 0.1 ab22.7 ± 0.4 a1.6 ± 0.2 cd
154.224 ± 0.8 c14.2 ± 0.7 e3.7 ± 0.1 abc39.1 ± 0.1 e1.5 ± 0.7 abcd
163.717 ± 0.8 b14.1 ± 0.5 e3.3 ± 0.2 a44.2 ± 0.2 f0.8 ± 0.2 ab
173.614 ± 0.8 ab17.1 ± 0.4 f7.1 ± 0.6 be50.2 ± 0.4 g0.9 ± 0.1 ab
184.129 ± 0.7 d21 ± 0.1 g8.9 ± 0.1 f55.1 ± 0.1 i1.2 ± 0.2 bc
194.514 ± 2.1 ab14.3 ± 0.4 e10.2 ± 0.1 g29.7 ± 0.2 b1.5 ± 0.2 acd
203.944 ± 1.11 fg11.7 ± 0.2 abc7.1 ± 0.7 e33.4 ± 0.7 c0.7 ± 0.2 ab
F = 349.7, p < 0.01F = 443.5, p < 0.01F = 163.9, p < 0.01F = 1800, p < 0.01F = 6.53, p < 0.01
Different superscript letters in a column indicate statistically significant differences (ANOVA, Tukey’s HSD post-hoc comparison with a 95% confidence level).
Table 3. Centroids of the 2 clusters formed by the physicochemical analysis of the 20 citrus honey samples.
ClusterpHH2O2 (μg/g Unprocessed Honey)Free AcidityLactonic AcidityTPC (mg GAE/100 g of Honey)TFCmg Quercetin Equivalents (CE)/100 g of Honey
13.833.015.06.3639.651.0
23.517.026.963.275.12.2
Table 4. Physicochemical characteristics of the 20 honey Satureja spp. samples.
HoneypHH2O2 (μg/g Unprocessed Honey)Free AcidityLactonic AcidityTPC (mg GAE/100 g of Honey)TFC mg Quercetin Equivalents (CE)/100 g of Honey
13.26 ± 0.7 cd22 ± 0.5 c16.8 ± 0.2 cde78.5 ± 0.1 g2.5 ± 0.4 bcde
23.414 ± 0.4 g17.9 ± 0.2 a7.1 ± 0.3 abcd99.3 ± 2.1 h3.2 ± 0.3 e
33.63 ± 0.6 a28 ± 0.3 d16.5 bcde117.1 ± 1.4 j1.7 ± 0.5 abcd
44.13 ± 0.2 a17 ± 0.8 a1.7 ± 0.2 a65.2 ± 0.7 e2.9 ± 0.2 bcde
53.95 ± 0.1 bc17.8 ± 0.9 a18.2 ± 0.3 de55.7 ± 0.3 d5.2 ± 0.1 f
63.67 ± 0.4 de28 ± 0.4 d6.8 ± 0.1 abcd147.8 ± 1.7 l3.4 ± 0.4 de
73.211 ± 0.3 f28 ± 0.1 d6.5 ± 0.3 abc130.1 ± 2.1 k1.4 ± 0.4 ab
83.58 ± 0.4 e45.2 ± 0.4 f17.1 ± 0.2 cde47.8 ± 0.7 c0.9 ± 0.2 a
93.18 ± 0.7 e55 ± 0.2 h8.5 ± 0.3 abcd55.2 ± 0.7 d3.6 ± 0.4 e
103.010 ± 0.4 f28 ± 0.1 d7.8 ± 0.1 abcd65.7 ± 0.9 e1.7 ± 0.4 abc
113.68 ± 0.1 e17 ± 0.3 a11.2 ± 0.3 abcd40.3 ± 0.5 b2.2 ± 0.4 bcd
123.76 ± 0.1 cd72 ± 0.1 i5.3 ± 0.6 ab65.1 ± 0.8 e2.3 ± 0.1 bcd
134.03 ± 0.4 a32.2 ± 0.4 e11.5 ± 0.3 abcde110.1 ± 3.2 i3.1 ± 0.4 de
143.13 ± 0.3 a79.7 ± 0.2 j10.9 ± 0.1 abcd72.3 ± 1.1 f1.4 ± 0.4 ab
153.315 ± 0.7 g32 ± 0.2 e16.2 ± 0.7 bcde58.1 ± 2.3 d5.2 ± 0.2 f
163.05 ± 0.5 bc27.3 ± 0.1 d16.8 ± 0.7 bcde40.1 ± 3.1 b0.9 ± 0.2 a
173.64 ± 0.1 b31 ± 0.2 e10.8 ± 0.4 abcd24.8 ± 0.9 a3.5 ± 0.9 de
183.13 ± 0.4 a19.3 ± 0.4 b22.7 ± 0.2 e98.2 ± 3.1 h1.7 ± 0.2 abc
193.214 ± 0.2 g32 ± 0.2 e17.5 ± 0.3 cde59.5 ± 0.4 d2.2 ± 0.4 bcd
203.13 ± 0.1 a48.4 ± 0.3 g6.9 ± 0.2 abcd37.8 ± 2.1 b1.7 ± 0.7 abc
F = 286.6, p < 0.01F = 6444, p < 0.01F = 6.72, p < 0.01F = 1149, p < 0.01F = 28.23, p < 0.01
Different superscript letters in a column indicate statistically significant differences (ANOVA, Tukey’s HSD post-hoc comparison with a 95% confidence level).
Table 5. Centroids of the 2 clusters formed by the physicochemical analysis of the 20 Satureja spp. honey samples.
ClusterpHH2O2 (μg/g Unprocessed Honey)Free AcidityLactonic AcidityTPC (mg GAE/100 g of Honey)TFC mg Quercetin Equivalents (CE)/100 g of Honey
13.46.933.911.472.662.5
23.63.628.333.3115.91.5
Table 6. Physicochemical characteristics of the 20 oregano and sage honey samples.
HoneypHH2O2 (μg/g Unprocessed Honey)Free AcidityLactonic AcidityTPC (mg GAE/100 g of Honey)TFC mg Quercetin Equivalents (CE)/100 g of Honey
13.111 ± 0.2 de52 ± 0.3 i11.5 ± 0.1 d38.2 ± 0.7 d5.1 ± 0.7 fgh
23.69 ± 0.3 c38.2 ± 0.7 e15.2 ± 0.7 ef44.2 ± 0.2 e3.7 ± 0.5 cdef
33.56 ± 0.7 ab99.1 ± 0.2 o9.1 ± 0.2 bc86.1 ± 3.1 k4.4 ± 0.6 defg
43.25 ± 0.2 a87 ± 0.2 n4.5 ± 0.7 a45.3 ± 1.3 e4.1 ± 0.2 def
53.55 ± 0.3 a65.1 ± 0.7 k11.2 ± 0.7 d55.7 ± 0.9 g2.8 ± 0.4 bcd
64.111 ± 0.7 de55 ± 0.1 j14.2 ± 0.7 e62.7 ± 2.1 h2.9 ± 0.6 bcd
73.613 ± 0.3 f47.8 ± 0.3 h5.6 ± 0.2 a33.9 ± 0.7 c3.3 ± 0.4 cd
83.010 ± 0.4 cd38.2 ± 0.9 e7.8 ± 0.2 b61.4 ± 0.4 h4.7 ± 0.4 defg
93.112 ± 0.1 ef71 ± 0.1 l11.3 ± 0.5 bd50.7 ± 2.7 f3.7 ± 0.2 cef
103.25 ± 0.4 a41.2 ± 0.2 g11.1 ± 0.7 d42.7 ± 0.2 de3.1 ± 0.4 bcde
113.513 ± 0.2 f32.7 ± 0.3 bc22.3 ± 01 h32.9 ± 3.5 bc2.3 ± 0.2 abc
123.611 ± 0.2 de27.9 ± 0.7 a17.2 ± 0.7 g40.8 ± 0.8 de1.8 ± 0.3 ab
133.07 ± 0.2 b32.1 ± 0.7 b10.3 ± 0.1 cd22.8 ± 0.2 a6.2 ± 0.8 h
143.517 ± 0.4 h29.2 ± 0.7 a16.3 ± 0.4 fg85.3 ± 0.2 k3.1 ± 0.3 bcde
154.211 ± 0.2 de33.2 ± 0.4 bc10.2 ± 0.7 cd37.8 ± 0.81.1 ± 0.5 a
163.915 ± 0.3 g35.7 ± 0.2 d4.2 ± 0.4 a29.1 ± 0.7 b2.4 ± 0.3 abc
173.17 ± 0.2 b40.2 ± 0.4 fg14.2 ± 0.1 e33.8 ± 0.7 c4.1 ± 0.8 def
183.26 ± 0.1 ab33.7 ± 0.2 c7.8 ± 0.2 b41.5 ± 0.8 de3.3 ± 0.4 cd
193.07 ± 0.3 b85.1 ± 0.6 m9.1 ± 0.7 c71.2 ± 1.7 j3.6 ± 0.2 bcd
203.612 ± 0.2 ef39.7 ± 0.2 f11.7 ± 0.1 d37.5 ± 0.7 i5.8 ± 0.6 egh
F = 315.03, p < 0.01F = 6047, p < 0.01F = 243.8, p < 0.01F = 428.6, p < 0.01F = 21.4, p < 0.01
Different superscript letters in a column indicate statistically significant differences (ANOVA, Tukey’s HSD post-hoc comparison with a 95% confidence level).
Table 7. Centroids of the 2 clusters formed by the physicochemical analysis of the 20 oregano and sage honey samples.
ClusterpHH2O2 (μg/g Unprocessed Honey)Free AcidityLactonic AcidityTPC (mg GAE/100 g of Honey)TFC mg Quercetin Equivalents (CE)/100 g of Honey
13.29.2150.2110.9245.653.55
23.516.929.1316.2385.233.03
Table 8. Physicochemical characteristics of the honey types used in the study.
Honey samples (n)pHH2O2 (μg/g Unprocessed Honey)Free AcidityLactonic AcidityTPC (mg GAE/100 g of Honey)TFC mg Quercetin Equivalents (CE)/100 g of Honey
Citrus (20)3.81 ± 0.3 a32.19 ± 15.0 a15.6 ± 4.3 a6.2 ± 2.3 a41.6 ± 11.9 a1.07 ± 0.5 a
Satureja spp. (20)3.41 ± 0.3 b6.89 ± 3.9 b33.8 ± 17.4 b11.8 ± 6.2 b73.4 ± 44.6 b2.48 ± 1.2 b
Oregano and sage3.42 ± 0.3 b9.59 ± 3.5 b49.1 ± 20.8 c11.2 ± 4.4 b47.6 ± 17.4 a3.52 ± 1.5 c
F = 30.02, p < 0.05F = 136.1, p < 0.05F = 66.9, p < 0.05F = 26.5, p < 0.05F = 34.0, p < 0.05F = 76.9, p < 0.05
Different superscript letters in a column indicated statistically significant differences among the honey types for each characteristic (ANOVA, Tukey’s HSD post-hoc comparison).
Table 9. Antimicrobial activity of honeys: Minimum inhibitory concentration (MIC) expressed in % w/v by broth dilution and inhibition diameter (mm) including well (8.0 mm) of honeys at 75% by well diffusion assays (WDA) against various pathogens.
Bacterial SpeciesHoney Origin (N)Well Diffusion Assay (mm)MIC 75% (w/v) MIC % (w/v) Using Artificial Saliva
HoneyManukaHoneyManuka+ Catalase+ Proteinase KHoneyManuka+ Catalase+ Proteinase K
S. aureus ACitrus (20)13.9 ± 3.6 b112.4 ± 0.9 a28.9 ± 3.7 b112.5 ± 0 a230.6 ± 13.5 b311.8 ± 6.5 b27.9 ± 3.9 a121.9 ± 5.4 a227.5 ± 16.7 a39.2 ± 8.2 a1
Satureja spp. (20)17.1 ± 4.4 c112.3 ± 1.5 a27.3 ± 3.6 a112.5 ± 0 a27.5 ± 3.5 a17.6 ± 3.3 a16.7 ± 3.6 a123.1 ± 4.5 a27.5 ± 3.5 b16.1 ± 5.4 b1
Oregano and sage (20)15.1 ± 2.3 b112.1 ± 1.2 a28.1 ± 3.4 ab112.5 ± 0 a28.1 ± 3.3 a116.5 ± 7.2 c27.2 ± 4.1 a125.0 ± 0 b38.1 ± 3.4 b112.8 ± 8.3 c2
Artificial honey8.0 ± 0 a113.0 ± 20 a2
S. aureus BCitrus (20)13.4 ± 2.3 b112.1 ± 1.1 a210.3 ± 3.0 b112.2 ± 1.4 b131.6 ± 16.1 b210.5 ± 4.7 a19.4 ± 3.6 c114.1 ± 4.8 b229.4 ± 16.4 a37.8 ± 4.8 a1
Satureja spp. (20)17.5 ± 4.2 c113.0 ± 1.3 b26.4 ± 3.4 a111.8 ± 1.9 b38.6 ± 5.0 a28.7 ± 4.9 a26.4 ± 3.4 a111.9 ± 1.9 a38.8 ± 7.3 b27.3 ± 5.6 a12
Oregano and sage (20)16.1 ± 2.4 c112.5 ± 0.9 ab27.8 ± 3.6 a110.9 ± 2.7 a28.4 ± 3.4 a114.4 ± 7.5 b37.8 ± 3.7 b110.9 ± 2.7 a211.6 ± 6.6 b212.8 ± 6.9 b2
Artificial honey8.0 ± 0 a113.0 ± 1.2 ab2
S. aureus ATCC 12600Citrus (20)17.0 ± 1.2 b116.3 ± 1.3 a15.8 ± 1.1 b16.25 ± 0 a125.6 ± 13.9 c26.9 ± 2.7 a17.8 ± 4.4 c16.25 ± 0 122.5 ± 7.6 a26.25 ± 0 b1
Satureja spp. (20)19.3 ± 1.8 d115.5 ± 1.1 a24.8 ± 1.9 a16.1 ± 0.7 a27.3 ± 3.6 a35.8 ± 2.9 a122.9 ± 0.6 a16.25 ± 0 27.8 ± 5 b31.2 ± 3.7 a4
Oregano and sage (20)18.3 ± 1.6 c116.0 ± 4.0 a25.2 ± 1.6 ab16.25 ± 0 a215.3 ± 8.3 b48.6 ± 5.8 b35.5 ± 1.4 b16.25 ± 0 127.8 ± 6.1 b28.4 ± 7.2 c2
Artificial honey8.0 ± 0 a116.0 ± 2.0 a2
S. aureus anaerobiusCitrus (20)18.7 ± 2.7 c114.9 ± 1.5 a25.54 ± 1.4 a16.6 ± 1.4 a124.1 ± 14.4 b27.0 ± 2.4 a14.7 ± 1.6 a112.5 ± 0 a27.2 ± 2.2 a35.5 ± 3.9 a1
Satureja spp. (20)11.4 ± 1.4 b115.1 ± 1.4 a216.1 ± 10.4 b26.25 ± 0 a115.1 ± 8.7 a214.4 ± 10.3 b210.5 ± 5.8 b1211.9 ± 2.7 a1212.9 ± 8.6 b29.8 ± 5.2 b1
Oregano and sage (20)12.2 ± 1.3 b115.3 ± 1.5 a229.4 ± 10.7 c26.6 ± 1.4 a129.4 ± 10.7 c226.5 ± 14.1 c225.0 ± 19.5 c211.9 ± 4.8 a124.7 ± 14.6 c210.0 ± 11.6 b1
Artificial honey8.0 ± 0 a115.0 ± 1.4 a2
S. aureus anaerobius ATCC 35844Citrus (20)18.7 ± 1.8 c114.3 ± 0.9 a25.4 ± 1.5 a16.25 ± 0 a130.0 ± 12.8 b26.6 ± 2.9 a14.9 ± 1.8 a112.5 ± 0 b210.9 ± 3.2 a37.8 ± 4.4 a4
Satureja spp. (20)13.6 ± 1.2 b114.8 ± 1.2 ab12.2 ± 5.0 c26.25 ± 0 a113.9 ± 9.5 a2316.8 ± 6.5 c39.8 ± 3.7 b111.25 ± 3.8 a110.1 ± 3.8 a112.5 ± 9.8 b1
Oregano and sage (20)14.0 ± 1.2 b115.1 ± 1.0 b28.3 ± 3.6 b16.25 ± 0 a128.4 ± 13.5 b28.7 ± 4.9 b116.6 ± 15 c211.9 ± 2.7 ab129.7 ± 5.8 a122.5 ± 15.7 c3
Artificial honey8.0 ± 0 a115.0 ± 2.0 ab1
Streptococcus mutansCitrus (20)18.3 ± 4.7 b114.1 ± 2.7 a26.2 ± 3.4 b16.25 ± 0 a122.5 ± 17.4 b28.3 ± 5.3 b16.1 ± 0.7 a16.25 ± 0 a16.25 ± 3.4 a15.6 ± 1.9 a1
Satureja spp. (20)20.7 ± 3.7 c113.7 ± 2.5 a24.5 ± 1.8 a16.25 ± 0 a26.1 ± 2.5 a25.1 ± 2.4 a16.1 ± 0.7 a16.25 ± 0 a16.25 ± 0 a14.0 ± 7.7 a2
Oregano and sage (20)20.1 ± 4.9 bc113.8 ± 2.5 a26.25 ± 0 b16.25 ± 0 a19.4 ± 6.0 a28.1 ± 4.5 b26.25 ± 0 a16.25 ± 0 a16.9 ± 1.9 a18.1 ± 4.0 b2
Artificial honey8.0 ± 0 a114.0 ± 2.0 a2
FusobacteriumnucleatumCitrus (20)11.3 ± 1.3 b112.1 ± 1.0 b225.0 ± 0 c125.0 ± 0 a118.7 ± 20.9 b214.1 ± 12.2 b211.6 ± 2.2 a112.5 ± 0 a113.7 ± 21.8 b122.5 ± 7.6 c2
Satureja spp. (20)16.9 ± 2.2 d111.5 ± 0.9 a25.9 ± 0.9 a125.0 ± 0 a38.4 ± 5.7 a27.5 ± 4.7 a125.6 ± 1.2 b112.5 ± 0 a25.3 ± 2.2 a11.6 ± 3.9 a3
Oregano and sage (20)15.1 ± 2.1 c111.5 ± 0.8 a26.25 ± 0 b125.0 ± 0 a313.1 ± 9.3 ab25.6 ± 2.7 a15.3 ± 1.7 b112.5 ± 0 a313.7 ± 7 b39.7 ± 6.7 b2
Artificial honey8.0 ± 0 a110.9 ± 1.0 ab2
Different superscript lower letters in columns indicate statistically significant differences (ANOVA with Tukey’s HSD post-hoc comparison) between the honey types of each experiment and for each strain. Different superscript numbers in rows indicate statistically significant differences (ANOVA with Tukey’s HSD post-hoc comparison) for each honey within the various experiments (well diffusion assay, MIC with diluted honey, MIC with artificial saliva).
Publisher’s Note: MDPI stays neutral with regard to jurisdictional claims in published maps and institutional affiliations.

