Article

Analysis of the Learning Process through Eye Tracking Technology and Feature Selection Techniques

1
Departamento de Ciencias de la Salud, Facultad de Ciencias de la Salud, Universidad de Burgos, Research Group DATAHES, Pº Comendadores s/n, 09001 Burgos, Spain
2
Departamento de Ingeniería Informática, Escuela Politécnica Superior, Universidad de Burgos, Research Group ADMIRABLE, Escuela Politécnica Superior, Avda. de Cantabria s/n, 09006 Burgos, Spain
3
Departamento de Ingeniería Informática, Escuela Politécnica Superior, Universidad de Burgos, Research Group DATAHES, Escuela Politécnica Superior, Avda. de Cantabria s/n, 09006 Burgos, Spain
4
Instituto de Educação, Universidade do Minho, Research Group CIEd, Campus de Gualtar, 4710-057 Braga, Portugal
5
Departamento de Filología Inglesa, Universidad de Burgos, Pº Comendadores s/n, 09001 Burgos, Spain
*
Author to whom correspondence should be addressed.
Appl. Sci. 2021, 11(13), 6157; https://doi.org/10.3390/app11136157
Submission received: 25 May 2021 / Revised: 26 June 2021 / Accepted: 26 June 2021 / Published: 2 July 2021
(This article belongs to the Special Issue Applied Cognitive Sciences)

Abstract

:
In recent decades, the use of technological resources such as the eye tracking methodology is providing cognitive researchers with important tools to better understand the learning process. However, the interpretation of the metrics requires the use of supervised and unsupervised learning techniques. The main goal of this study was to analyse the results obtained with the eye tracking methodology by applying statistical tests and supervised and unsupervised machine learning techniques, and to contrast the effectiveness of each one. The parameters of fixations, saccades, blinks and scan path, and the results in a puzzle task were found. The statistical study concluded that no significant differences were found between participants in solving the crossword puzzle task; significant differences were only detected in the parameters saccade amplitude minimum and saccade velocity minimum. On the other hand, this study, with supervised machine learning techniques, provided possible features for analysis, some of them different from those used in the statistical study. Regarding the clustering techniques, a good fit was found between the algorithms used (k-means ++, fuzzy k-means and DBSCAN). These algorithms provided the learning profile of the participants in three types (students over 50 years old; and students and teachers under 50 years of age). Therefore, the use of both types of data analysis is considered complementary.

1. Introduction

The eye tracking technique has represented an important advance in research in different fields, for example, cognitive psychology, as it records evidence on the cognitive processes related to attention during the resolution of different types of tasks. In particular, this technology provides the researcher with knowledge of the eye movements that the learner performs to solve different tasks [1]. This implies an important advance in the study of information processing, as this technique will allow us to obtain empirical indicators in different metrics, all of which offers a guarantee of precision to the psychology professional for the interpretation of each user’s information processing. However, the measurements are complex and, above all, lengthy in time, which often means that the ratios of participants are not very large. In summary, technological advances are improving the study of information processing in different learning tasks. The use of these resources is an opportunity for cognitive and instructional psychology to delve into the analysis of the variables that facilitate deep learning in different tasks. In addition, these tools allow the visualisation of the learning patterns of apprentices during the resolution of different activities. Initial research in this field [2] indicated that readers with prior knowledge showed little interest in the images embedded in the learning material. Furthermore, recent research [3] has found significant differences in eye tracking behaviour between experts vs. novices. It seems that experts allocate their attention more efficiently and learn more easily if automated monitoring processes are applied in learning proposals. Similarly, other studies [2] have indicated that the use of multimedia resources that incorporate zoom effects makes it easier for information to remain longer in short-term memory (STM). Likewise, if this information is accompanied by a narrating voice, attention levels and semantic comprehension increase [4,5]. A number of methods are used to analyse the effectiveness of the learning process including eye tracking-based methods. This technique offers an evaluation of eye movement in different metrics [1,2,3,4,5]. The eye tracking technique can use different algorithms [6,7,8,9]. They can be used to extract different metrics (more detailed explanations are given below). Specifically, eye tracking technology allows the analysis of the relationship between the level of visual attention and the eye–hand coordination processes during the resolution of different tasks within the executive attention processes [7,8]. Clearly, rapid eye movement has also been associated with the learner’s fixation on the most relevant elements of the material being learned [2].
In this context, attention is considered to be the beginning of information processing and the starting point for the use of higher-order executive functions. In the same way, observational skills relate to eye tracking, which is directly related to the level of arousal and the transmission of information first to the STM and then its processing in working memory [6]. This development is influenced by learner-specific variables such as age, level of prior knowledge, cognitive ability and learning style [7]. However, some studies show that prior knowledge can compensate for the effects of age [8]. On the other hand, eye tracking technology is one of the resources that is supporting this new way of analysing the learning process. This technology is centred on evidence-based software engineering (EBSE) [9]. This technological resource makes it possible to study attentional levels and relate them to the cognitive processes that the learner uses in the course of solving a task [10,11]. Thus, eye tracking technology provides different metrics based on the recording of the frequency of gaze on certain parts of a stimulus. These metrics can be previously defined by the researcher and are called areas of interest (AOI), which can be relevant or irrelevant. This information will allow the practitioner to determine which learners are field-dependent or field-independent, based on their access to irrelevant vs. relevant information [12]. Likewise, the use of multimedia resources, such as videos, which include Self-Regulation Learning (SRL) aids through the teacher’s voiceover or the figure of an avatar seems to be an effective resource for maintaining attention and comprehension of the task and even compensating for the lack of prior knowledge of the learners. One possible explanation is that they enhance self-regulation in the learning process [13,14,15]. However, the design of learning materials seems to be a key factor in maintaining attention during task performance. Therefore, it is necessary to know which elements are relevant vs. irrelevant, not only for the teacher but also for the learners’ perception [16]. This is why the knowledge of measurement metrics in eye tracking technology, together with their interpretation, is a relevant component for the design of learning activities for different types of users.

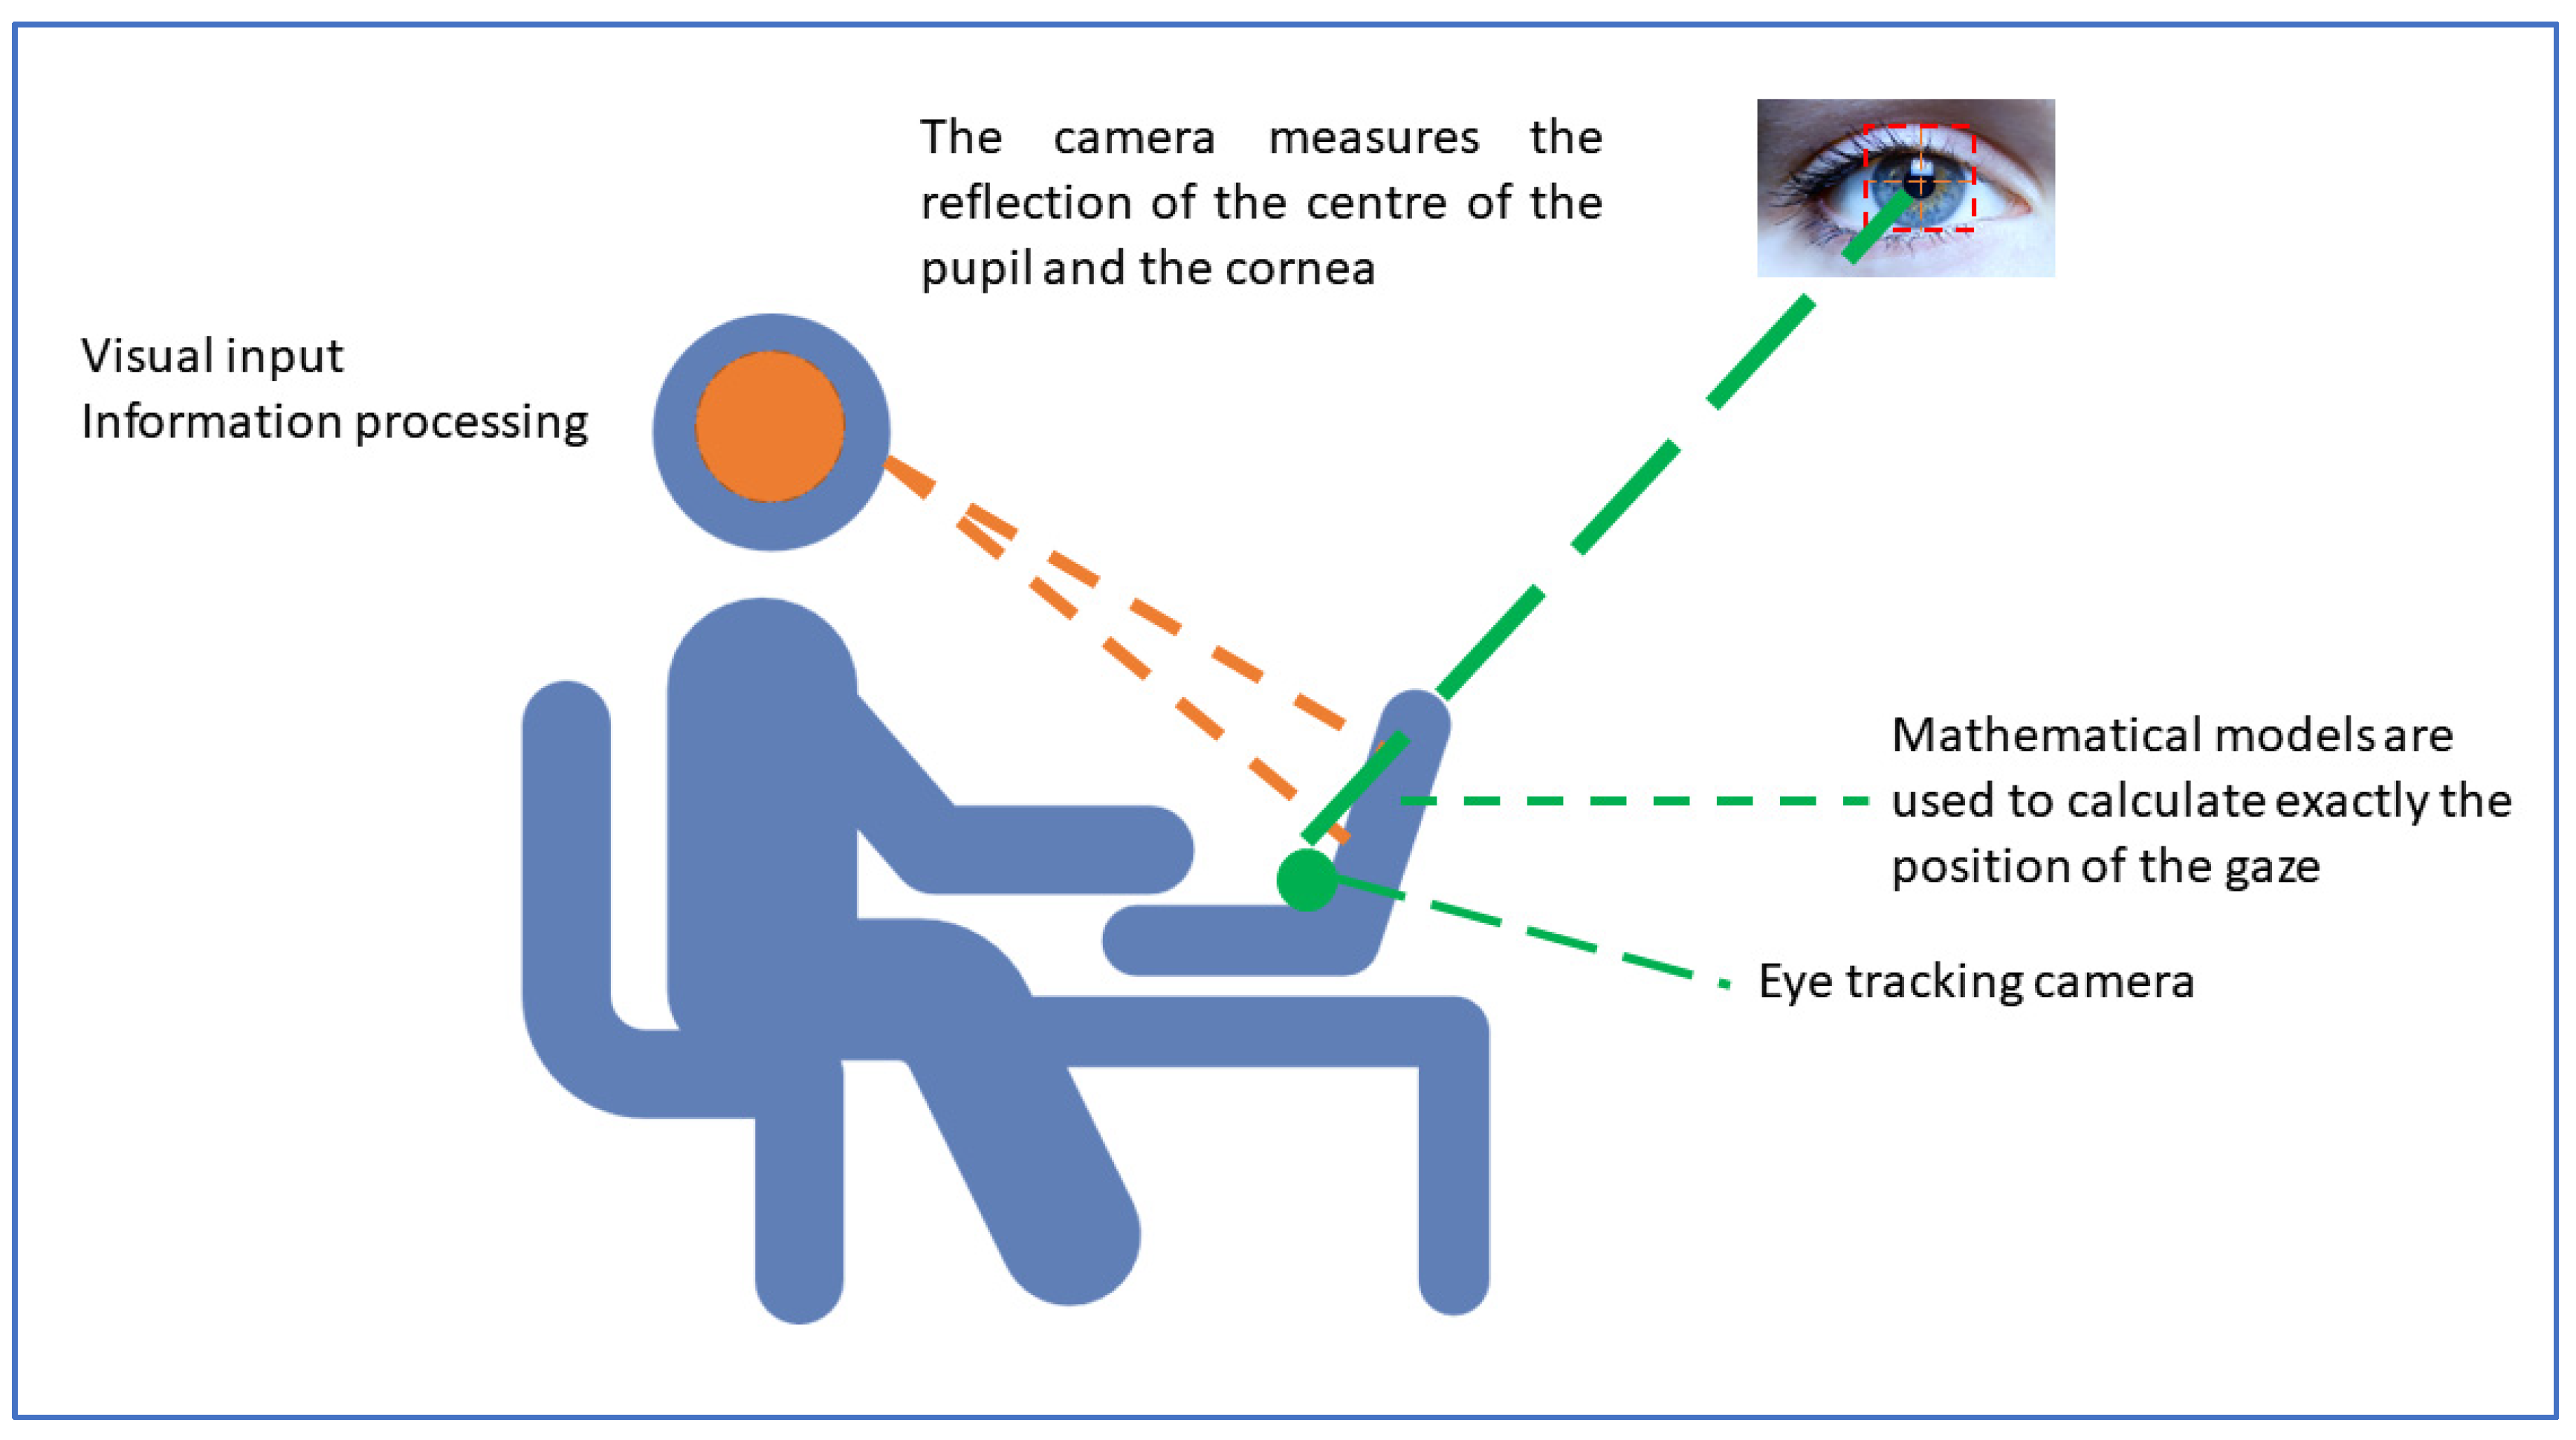
1.1. Measurement Parameters in Eye Tracking Technology

As mentioned above, eye tracking technology facilitates the collection of different metrics. First, it enables the recording of the learner’s eye movement or eye tracker while performing an activity. In addition, the use of eye tracking technology allows the definition of relevant vs. non-relevant areas (AOI) in the information being learned [17]. Within these metrics, different parameters can be studied, such as the fixation time of the eye on the part of the stimulus (interval between 200 and 300 ms). In this line, recent studies [18] indicate that the acquisition of information is related to the number of eye fixations of the learner. Similarly, another important metric is the saccade, which is defined as the sudden and rapid movement of a fixation (the interval is 40–50 ms). Sharafi et al. [18,19] found differences in the type of saccade depending on the phase of information encoding the learner was at. Another relevant parameter is the scan path or tracking path. This metric collects, in chronological order, the steps that the learner performs in the resolution of the learning task within the AOI marked by the teacher [18,19]. Likewise, eye tracking technology allows the use of supervised machine learning techniques to predict the level of learners’ understanding, as this seems to be related to the number of fixations [20]. Recent studies indicate that variability in gaze behaviour is determined by image properties (position, intensity, colour and orientation), task instructions, semantic information and the type of information processing of the learner. These differences are detected using AOIs that are set by the experimenter [21].
In summary, eye tracking technology records diverse types of parameters that provide different interpretations of the underlying cognitive processes during the execution of a task. These parameters fall into three categories: fixations, saccades and scan path. The first one, fixations, refers to the stabilisation of the eye on a part of the stimulus during a time interval between 200 and 300 ms. In addition, eye tracking technology provides information about the start and the end time in x and y coordinates. The meaning of the cognitive interpretation is related to the perception, encoding and processing of the stimulus. The second ones, saccades, refers to the movement from one fixation to another, which is very fast and in the range of 40–50 ms. The third ones, scan path, refers to a series of fixations in the AOIs in chronological order of execution. This cognitive metric is useful for understanding the behavioural patterns of different participants in the same activity. Furthermore, each of these metrics has its own measurement specifications. Table 1 below shows the most significant ones and, where appropriate, their relationship with information processing.
In summary, the use of eye tracking technology for the analysis of information processing during the resolution of tasks in virtual learning environments has been shown to be a very effective tool for understanding how each student learns [23]. Moreover, recent studies conclude the need to integrate this technology in the usual learning spaces such as classrooms, although its use is still conditioned to important technical and interpretation knowledge on the part of the teacher [24]. Therefore, more research studies are needed to find out which of the presentation conditions of a learning task are more or less effective in learning depending on the characteristics of each learner (age, previous knowledge, learning style, etc.) [25].

1.2. Use of Data Mining and Pattern Mining Techniques in the Interpretation of the Results Obtained with the Eye Tracking Methodology

There are many studies on the application of eye tracking technology that address the model of understanding the results obtained in the different metrics. To do so, they analyse the differences in results between experts vs. novices. Experts use additional information and solve a task faster and in less time. These studies also analyse behavioural patterns by comparing the type of participant, the type of pattern and the efficiency in solving the task. Cluster analysis metrics on frequency, time and effort are used to perform these analyses. Experts vs. novices use the additional information, e.g., colour and layout, in order to use the most efficient way of navigating the platform [11]. Additionally, experts seem to be faster, meaning they will solve tasks faster and more accurately. However, novice students seem to have a greater ability to understand the tasks [13]. Nevertheless, a comparative analysis of the performance of either the same learner in their learning process or between different types of learners (e.g., novices vs. experts) [26,27] requires the use of different data mining techniques [21,28]. These can be supervised learning (related to prediction or classification) [21] or unsupervised learning (related to the use of clustering techniques) [29]. Such techniques applied to the analysis of user learning have been called educational data mining (EDM) techniques [30]. Likewise, especially in the field of analysing student behaviour during task solving, the importance of using pattern analysis techniques within what has been called educational process mining (EPM) [31] stands out. EPM is a process that focuses on detecting among the possible variables of a study those that have a greater predictive capacity. These variables may be unknown or partially known. In short, EPM thus focuses on assuming a different type of data called events. Each event belongs to a single instance of the process, and these events are related to the activities. EPM is interested in end-to-end processes and not in local patterns [31]. The general objective of instance selection techniques (e.g., prototype selection) is to “try to eliminate from the training set those instances that are misclassified and, at the same time, to reduce possible overlaps between regions of different classes, i.e., their main goal is to achieve compact and homogeneous groupings” [32] (p. 2). These analyses would belong to the supervised machine learning techniques of classification and also to the statistical techniques related to knowing which possible independent variable or variables are the ones that have a significant weight on the dependent variable or variables. The common aim of these techniques would be the elimination of noise [33], which in experimental psychology would be related to the development of pre-experimental descriptive studies [34].
In summary, feature selection techniques are a very important part of machine learning and very useful in the field of education, as they will make it possible to eliminate those attributes that contribute little or nothing to the understanding of the results in an educational learning process. Knowledge of these aspects will be essential for the proposal of new research and in the design of educational programmes [8,35]. In brief, the use of sequence mining techniques [36] and the selection of instances used in studies on the analysis of the metacognitive strategies used during task resolution processes will be very useful for the development of personalised educational intervention proposals.

1.3. Application of the Use of Eye Tracking Technology

The cognitive procedure in the process of visual tracking of images, texts or situations in natural contexts is based on the stimulus–processing–response structure. Information enters via the visual pathway (retina-fovea) and is processed at the level of the subcortical and cortical regions within the central nervous system. This processing results in a sensory stimulation response. Specifically, saccades are a form of sensory-to-motor transformation from a stimulus that has been found to be significant. Saccadic eye movements are used to redirect the fovea from one point of interest to another. Fixation is also used to keep the fovea aligned on the target during subsequent analysis of the stimulus. This alternative saccade–fixation behaviour is repeated several hundred thousand times a day and is essential in complex behaviours such as reading and driving. Saccades can be triggered by the appearance of a visual stimulus that is motivating to the subject or initiated voluntarily by the person’s interest in an object. Saccades can be suppressed during periods of visual fixation. In these situations, the brain must inhibit the automatic saccade response [37]. Eye tracking technology collects, among others, metrics related to fixations, saccades and blinks. This technology is also used in studies on information processing in certain learning processes (reading, driving machines or vehicles, marketing, etc.) in people without impairments [38,39,40,41,42,43,44,45] or in groups with different impairments such as attention deficit hyperactivity disorder or autism spectrum disorder [45]. In these cases, the objective is to analyse the users’ difficulties in order to make proposals for therapeutic intervention. This technology is also being used as an accident avoidance strategy [43]. Similarly, this technology can be used to study the behavioural patterns of subjects and to analyse the differences or similarities between different groups [44,45,46]. Eye tracking is also currently being used to test the human–machine interface based on monitoring the control of smart homes through the Internet of Things [47]. In addition, this technology is being incorporated into mobile devices. This will soon facilitate its use by users in natural contexts [48]. Similarly, eye tracking technology is being incorporated into virtual and augmented reality scenarios as the software for registration is included within the glasses [49,50,51]. Similarly, eye tracking technology is being incorporated into the control of industrial robots [52,53]. Finally, systems are being implemented to improve the calibration and tracking of gaze tracking for users who were previously unable to use it, due to various neurological conditions (stroke paralysis or amputations, spinal cord injuries, Parkinson’s disease, multiple sclerosis, muscular dystrophy, etc.) [53]. However, these applications are still very novel and require very specific knowledge of application, and processing and interpretation of the metrics. However, progress is being made in this aspect with the implementation of interpretation algorithms in software, such as machine learning techniques for supervised learning of classification, including algorithms such as k-nn and random forests [54].
Based on the above theoretical foundation, a study was carried out on the analysis of the behaviour of novice vs. expert learners during the performance of a self-regulated learning task. This task was carried out in a virtual environment with multimedia resources (self-regulated video) and was monitored using eye tracking technology.
In this study, two types of analysis were used. On the one hand, statistical techniques based on analysis of covariance (ANCOVA) were used on two fixed effects factors which have been shown to be relevant in the research literature, the type of participant (novice vs. expert) and age (in this study, over 50 years old vs. under 50 years old). In addition, whether the participant is a student vs. a teacher was considered as a covariate on the dependent variables learning outcomes in solving a crossword puzzle task and eye tracking metrics (fixations, saccades, blinks and scan path length).
The hypotheses were as follows:
RQ1. Will there be significant differences in the results of solving a crossword puzzle depending on whether the participants are novices vs. experts, taking into account the covariate student vs. teacher?
RQ2. Will there be significant differences in fixations, saccades, blinks and scan path length metrics depending on the age of the participant (over 50 vs. under 50), taking into account the covariate student vs. teacher?
RQ3. Will there be significant differences in the metrics of fixations, saccades, blinks and scan path length depending on whether the participants are novices vs. experts, taking into account the covariate student vs. teacher?
On the other hand, this study applied a data analysis procedure using different supervised learning algorithms for feature selection. The objective was to find out the most significant attributes with respect to all the variables (characteristics of the participants and metrics obtained with eye tracking technology).

2. Materials and Methods

2.1. Participants

A disaggregated description of the sample with respect to the variables age, gender and type of participant (prior knowledge vs. no prior knowledge; teacher vs. student) can be found in Table 2.

2.2. Instruments

The following resources were used:
1. Eye tracking equipment iView XTM, SMI Experimenter Center 3.0 and SMI BeGazeTM. These tools record eye movements, their coordinates and the pupillary diameters of each eye. In this study, 60 Hz, static scan path metrics (fixations, saccades, blinks and scan path) were used. In addition, participants viewed the performance of the learning task on a monitor with a resolution of 1680 × 1050.
2. Ad hoc questionnaire on the characteristics of each participant (age, gender, level of studies, branch of knowledge, current employment situation and level of previous knowledge).
The questions were related to the following:
(a)
Age;
(b)
Gender;
(c)
Level of education;
(d)
Field of knowledge;
(e)
Employment status (active, retired, student);
(f)
Knowledge about the origin of monasteries in Europe.
3. Ad hoc crossword puzzle on the knowledge of the information in 5 questions related to the content of the video seen and referring to the origin of monasteries in Europe.
4. Learning task that consisted of a self-regulated video through the figure and voice of an avatar that narrated the task about the origins of monasteries in Europe. The duration of the activity was 120 s.
The questions were related to the following:
(a)
Monks belonging to the order of St. Benedict;
(b)
Powerful Benedictine monastic centre founded in the 10th century, whose influence spread throughout Europe;
(c)
Space around which the organisation of the monastery revolves;
(d)
Set of rules that govern monastic life;
(e)
Each of the bays or sides of a cloister.
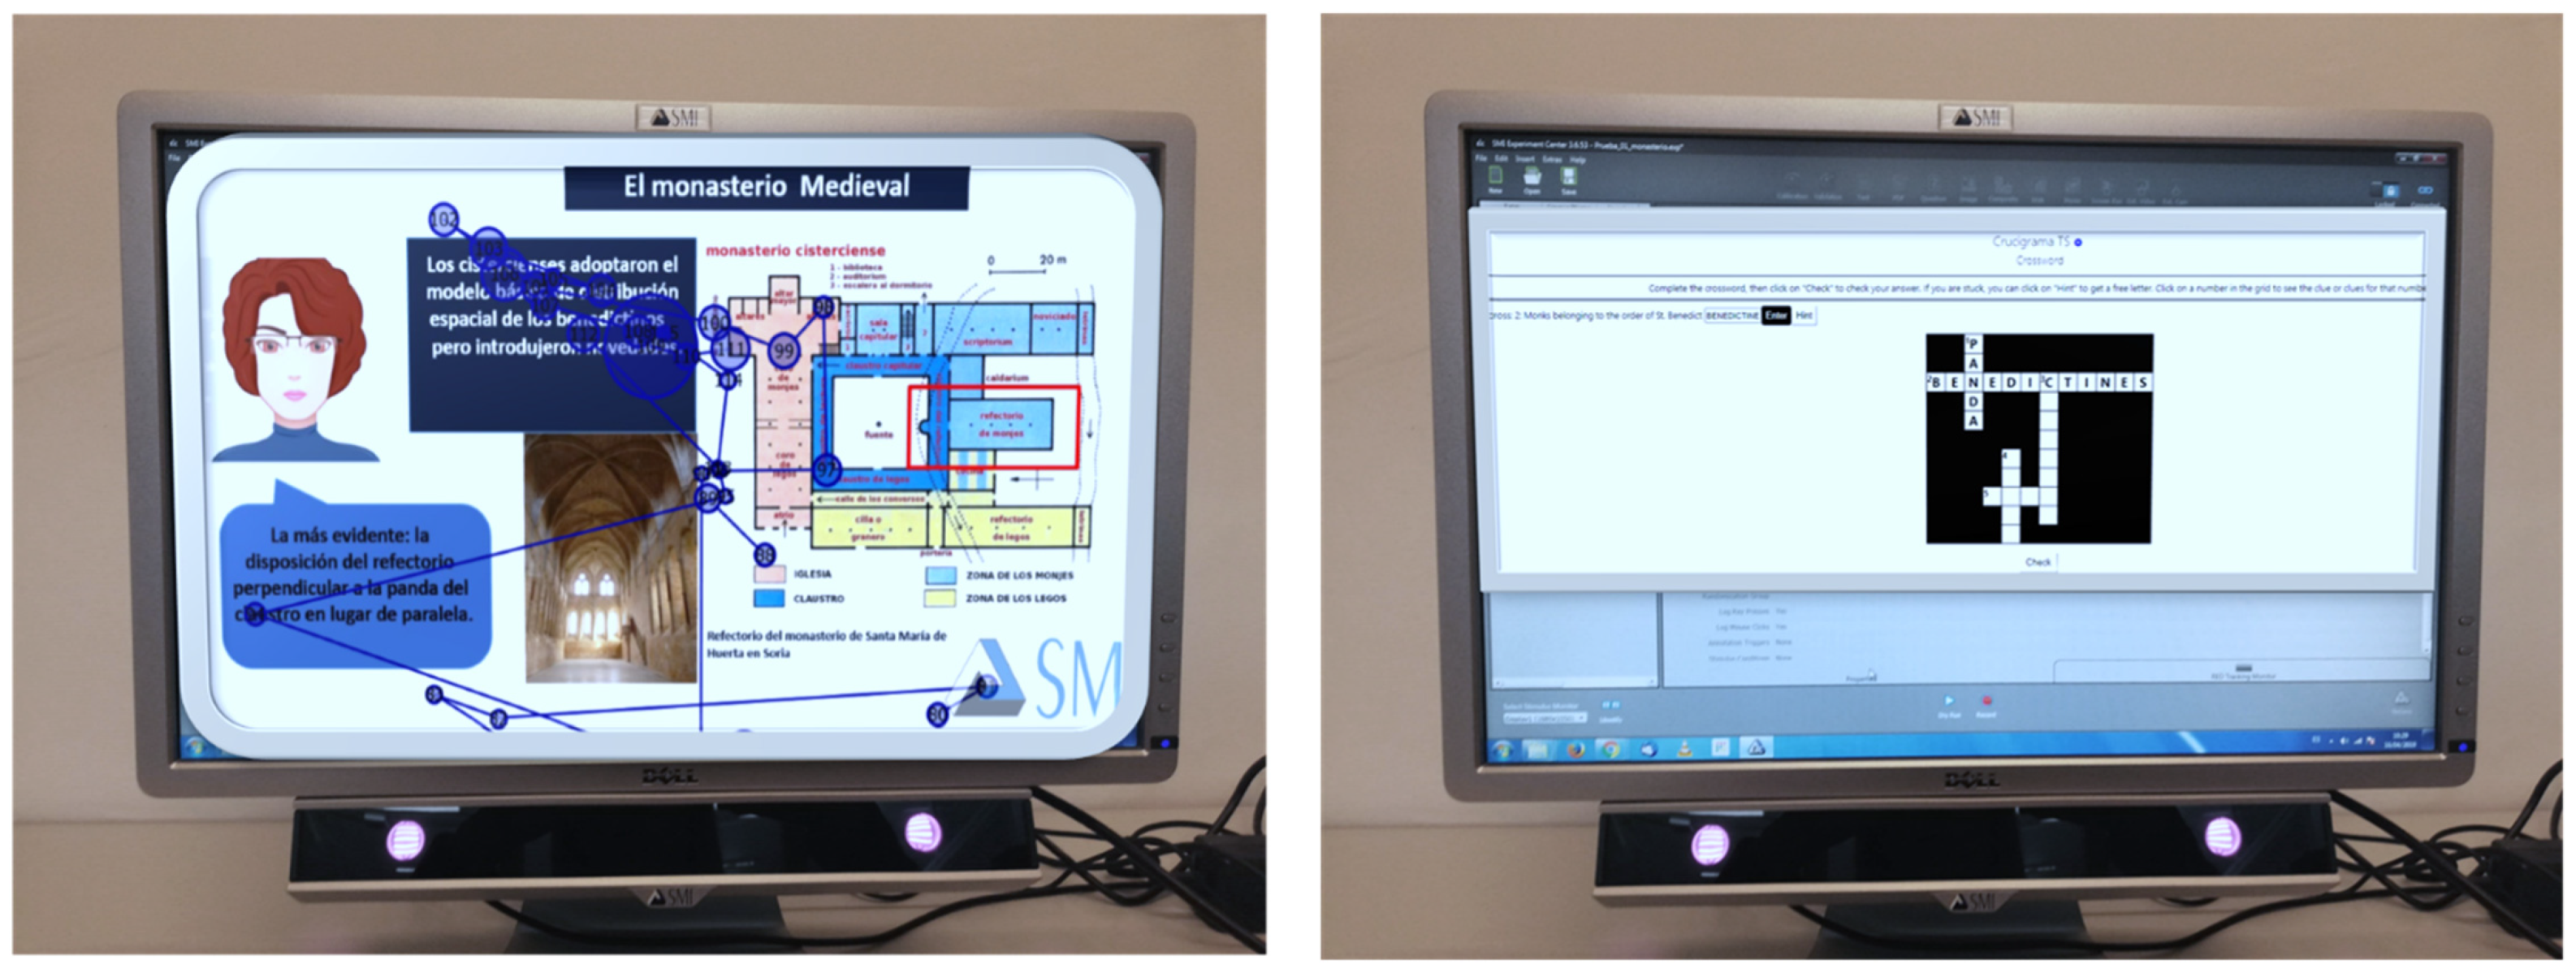
2.3. Procedure

An authorisation was obtained from the Bioethics Committee of the University of Burgos before starting the research. In addition, convenience sampling was used to select the sample. The participants did not receive any financial compensation. They were previously informed of the objectives of the research, and a written informed consent was obtained from all of them. The first phase of the study consisted of collecting personal data and testing the level of prior knowledge. Subsequently, the calibration test was prepared for each participant, using the standard deviation of 0.1–0.9, for both eyes, with a percentage adjustment of between 86.5% and 100%. Subsequently, a test was applied, which consisted of watching a 120-s video about the characteristics of a medieval monastery. The video was designed by a specialist teacher in art history, and the voiceover was provided by a specialist in SRL. After watching the video, each participant completed a crossword puzzle with five questions about the concepts explained in the video. The evaluation sessions were always conducted by the same people: a psychologist with expertise in SRL and a computer engineer, both with experience in the operation of eye tracking technology. Figure 1 shows an image of the calibration procedure and Figure 2 shows the viewing of the video and the completion of the crossword puzzle.

2.4. Data Analysis

2.4.1. Statistical Study

A study was conducted using three-factor fixed effects analysis of variance (ANOVA) statistical techniques (type of participant, i.e., student vs. teacher, age (over 50 years old vs. under 50 years old) and knowledge (expert vs. novices)) and eta squared effect value analysis (η2). Analyses were performed with the SPSS v.24 statistical package [55].
A 2 × 2 × 2 factorial design (experts vs. non-experts, students vs. teachers, age (over 50 years old vs. under 50 years old)) was used [34]. The independent variables were type of participant (experts vs. novice), age (over 50 years old vs. under 50 years old) and participant type (students vs. teachers). The dependent variables were as follows:
  • Solving crossword puzzle results;
  • Fixations (fixation count, fixation frequency count, fixation duration total, fixation duration average, fixation duration maximum, fixation duration minimum, fixation dispersion total, fixation dispersion average, fixation dispersion maximum, fixation dispersion minimum);
  • Saccades (saccade count, saccade frequency count, saccade duration total, saccade duration average, saccade duration maximum, saccade duration minimum, saccade amplitude total, saccade amplitude average, saccade amplitude maximum, saccade amplitude minimum, saccade velocity total, saccade velocity average, saccade velocity maximum, saccade velocity minimum, saccade latency average);
  • Blinks (blink count, blink frequency count, blink duration total, blink duration average, blink duration maximum, blink duration minimum) and scan path length.
These metrics are related to the analysis of the cognitive procedure during visual tracking. This procedure is based on the stimulus–processing–response structure. Information enters via the visual pathway (retina-fovea) and is processed at the level of subcortical and cortical regions within the central nervous system. This processing results in a sensory stimulation response. Specifically, saccades constitute a form of sensory-to-motor transformation in response to a stimulus that has been found to be significant and a sensorimotor control of the processing. Saccadic eye movements are used to redirect the fovea from one point of interest to another. Likewise, fixation is used to keep the fovea aligned on the target during subsequent image analysis. This alternating saccade–fixation behaviour is repeated several hundred thousand times a day in humans and is central to complex behaviours such as reading. Saccades can be triggered by the appearance of a visual stimulus that is motivating to the subject or initiated voluntarily by the person’s interest in a particular object. Saccades can be suppressed during periods of visual fixation, in which case the brain must inhibit the automatic saccade response [37]. The whole process is summarised in Figure 3. In addition, a video (https://youtu.be/DlRK21afGgo access on 28 June 2021) on the process of performing the task applied in this study can be consulted. In this video, the fixation and saccade points can be seen.

2.4.2. Study Using Machine Learning Techniques

As stated in the introduction, machine learning techniques can be divided into supervised learning techniques, which in turn can be subdivided into classification and prediction techniques [21], and unsupervised learning, which refers to the use of clustering techniques [29]. Specifically, supervised learning techniques of pattern analysis are used for human behavioural analysis. These would fall within the supervised learning techniques of clustering [31,32,36]. Concretely, in this study, we used supervised automatic learning techniques for classification (the gain ratio, symmetrical uncertainty and chi-square algorithms were applied) and unsupervised clustering (the k-means ++, fuzzy k-means and DBSCAN algorithms were applied). The analyses were performed with the R programming language [56].
In the study with machine learning techniques, a descriptive correlational design was applied [34]. A supervised learning analysis of classification and non-supervised clustering was applied on all features.

3. Results

3.1. Statistical Study

3.1.1. Previous Analyses

Before starting the testing of the hypotheses, it was checked whether the sample followed a normal distribution, for which a study was conducted on the values of skewness (values below |2.00| are considered accepted values, and a value of skewness = −0.22 was found) and kurtosis (values below |8.00| are considered accepted values, and a value of kurtosis = −2.06 was found). Therefore, the results indicate that the distribution follows the assumptions of normality, which is why parametric statistics were used to test the hypotheses.

3.1.2. Hypothesis Testing Analysis

To test RQ1, a one-factor fixed effects ANCOVA was applied for the participant type “expert vs. novice” considering the covariate (participant type “student vs. teacher”) with respect to the dependent variable crossword result. No significant differences were found, but a mean effect value was found (F = 1.91, p = 0.40, η2 = 0.66). Additionally, no effect of the covariate was found (F = 0.03, p = 0.90, η2 = 0.03), and in this case, the effect value was low.
To test RQ2, a one-factor fixed effects ANCOVA (participant type “over 50 vs. under 50”) was applied considering the covariate (participant type “student vs. teacher”). No significant differences were found in the metrics of fixations, saccades, blinks and scan path length. A covariate effect was only found in the metrics of saccade amplitude minimum (F = 5.19, p = 0.03, η2 = 0.13) and saccade velocity minimum (F = 5.18, p = 0.03, η2 = 0.13), in both cases with a low effect value. All results can be found in Table A1 in Appendix A.
Regarding test RQ3, a one-factor fixed effects ANCOVA (participant type “novice vs. expert”) was applied considering the covariate (participant type “student vs. teacher”). No significant differences were found in the metrics of fixations, saccades, blinks and scan path length. The effect of the covariate was only found in the metrics of saccade amplitude minimum (F = 6.90, p = 0.01, η2 = 0.16) and saccade velocity minimum (F = 7.67, p = 0.01, η2 = 0.18), and in both cases, the effect value was medium. All results can be found in Table A2 in Appendix A.

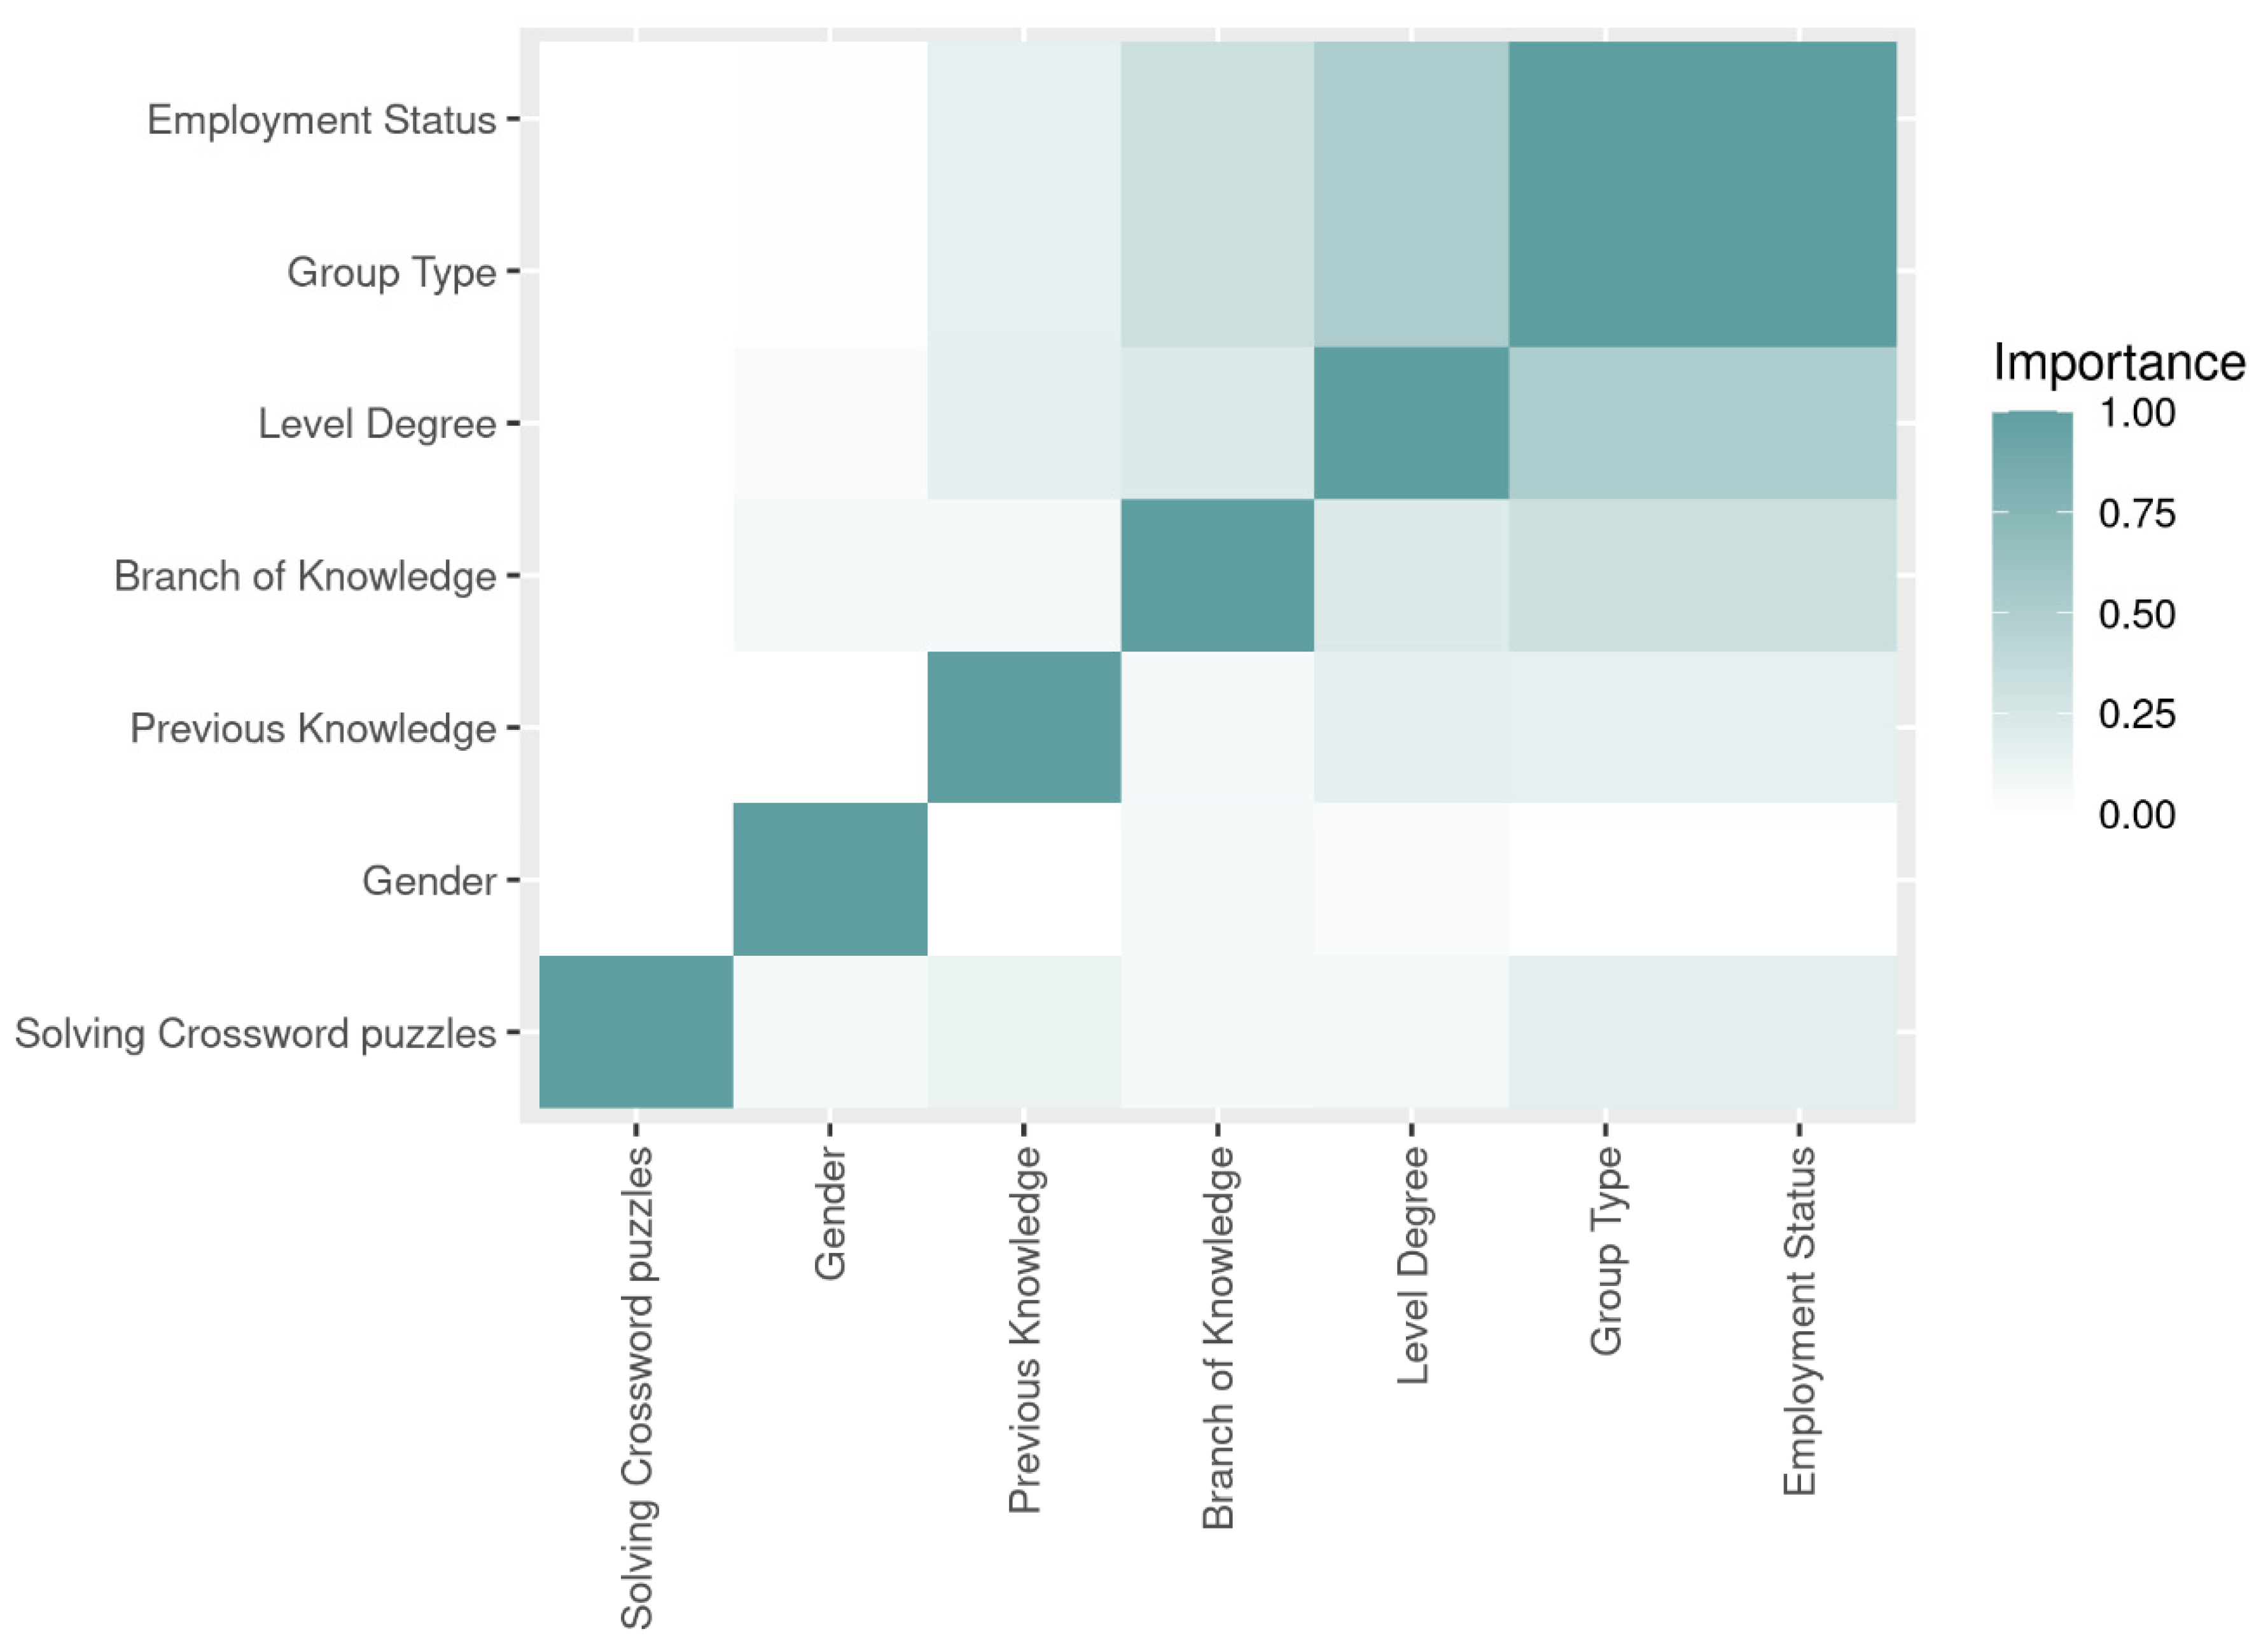
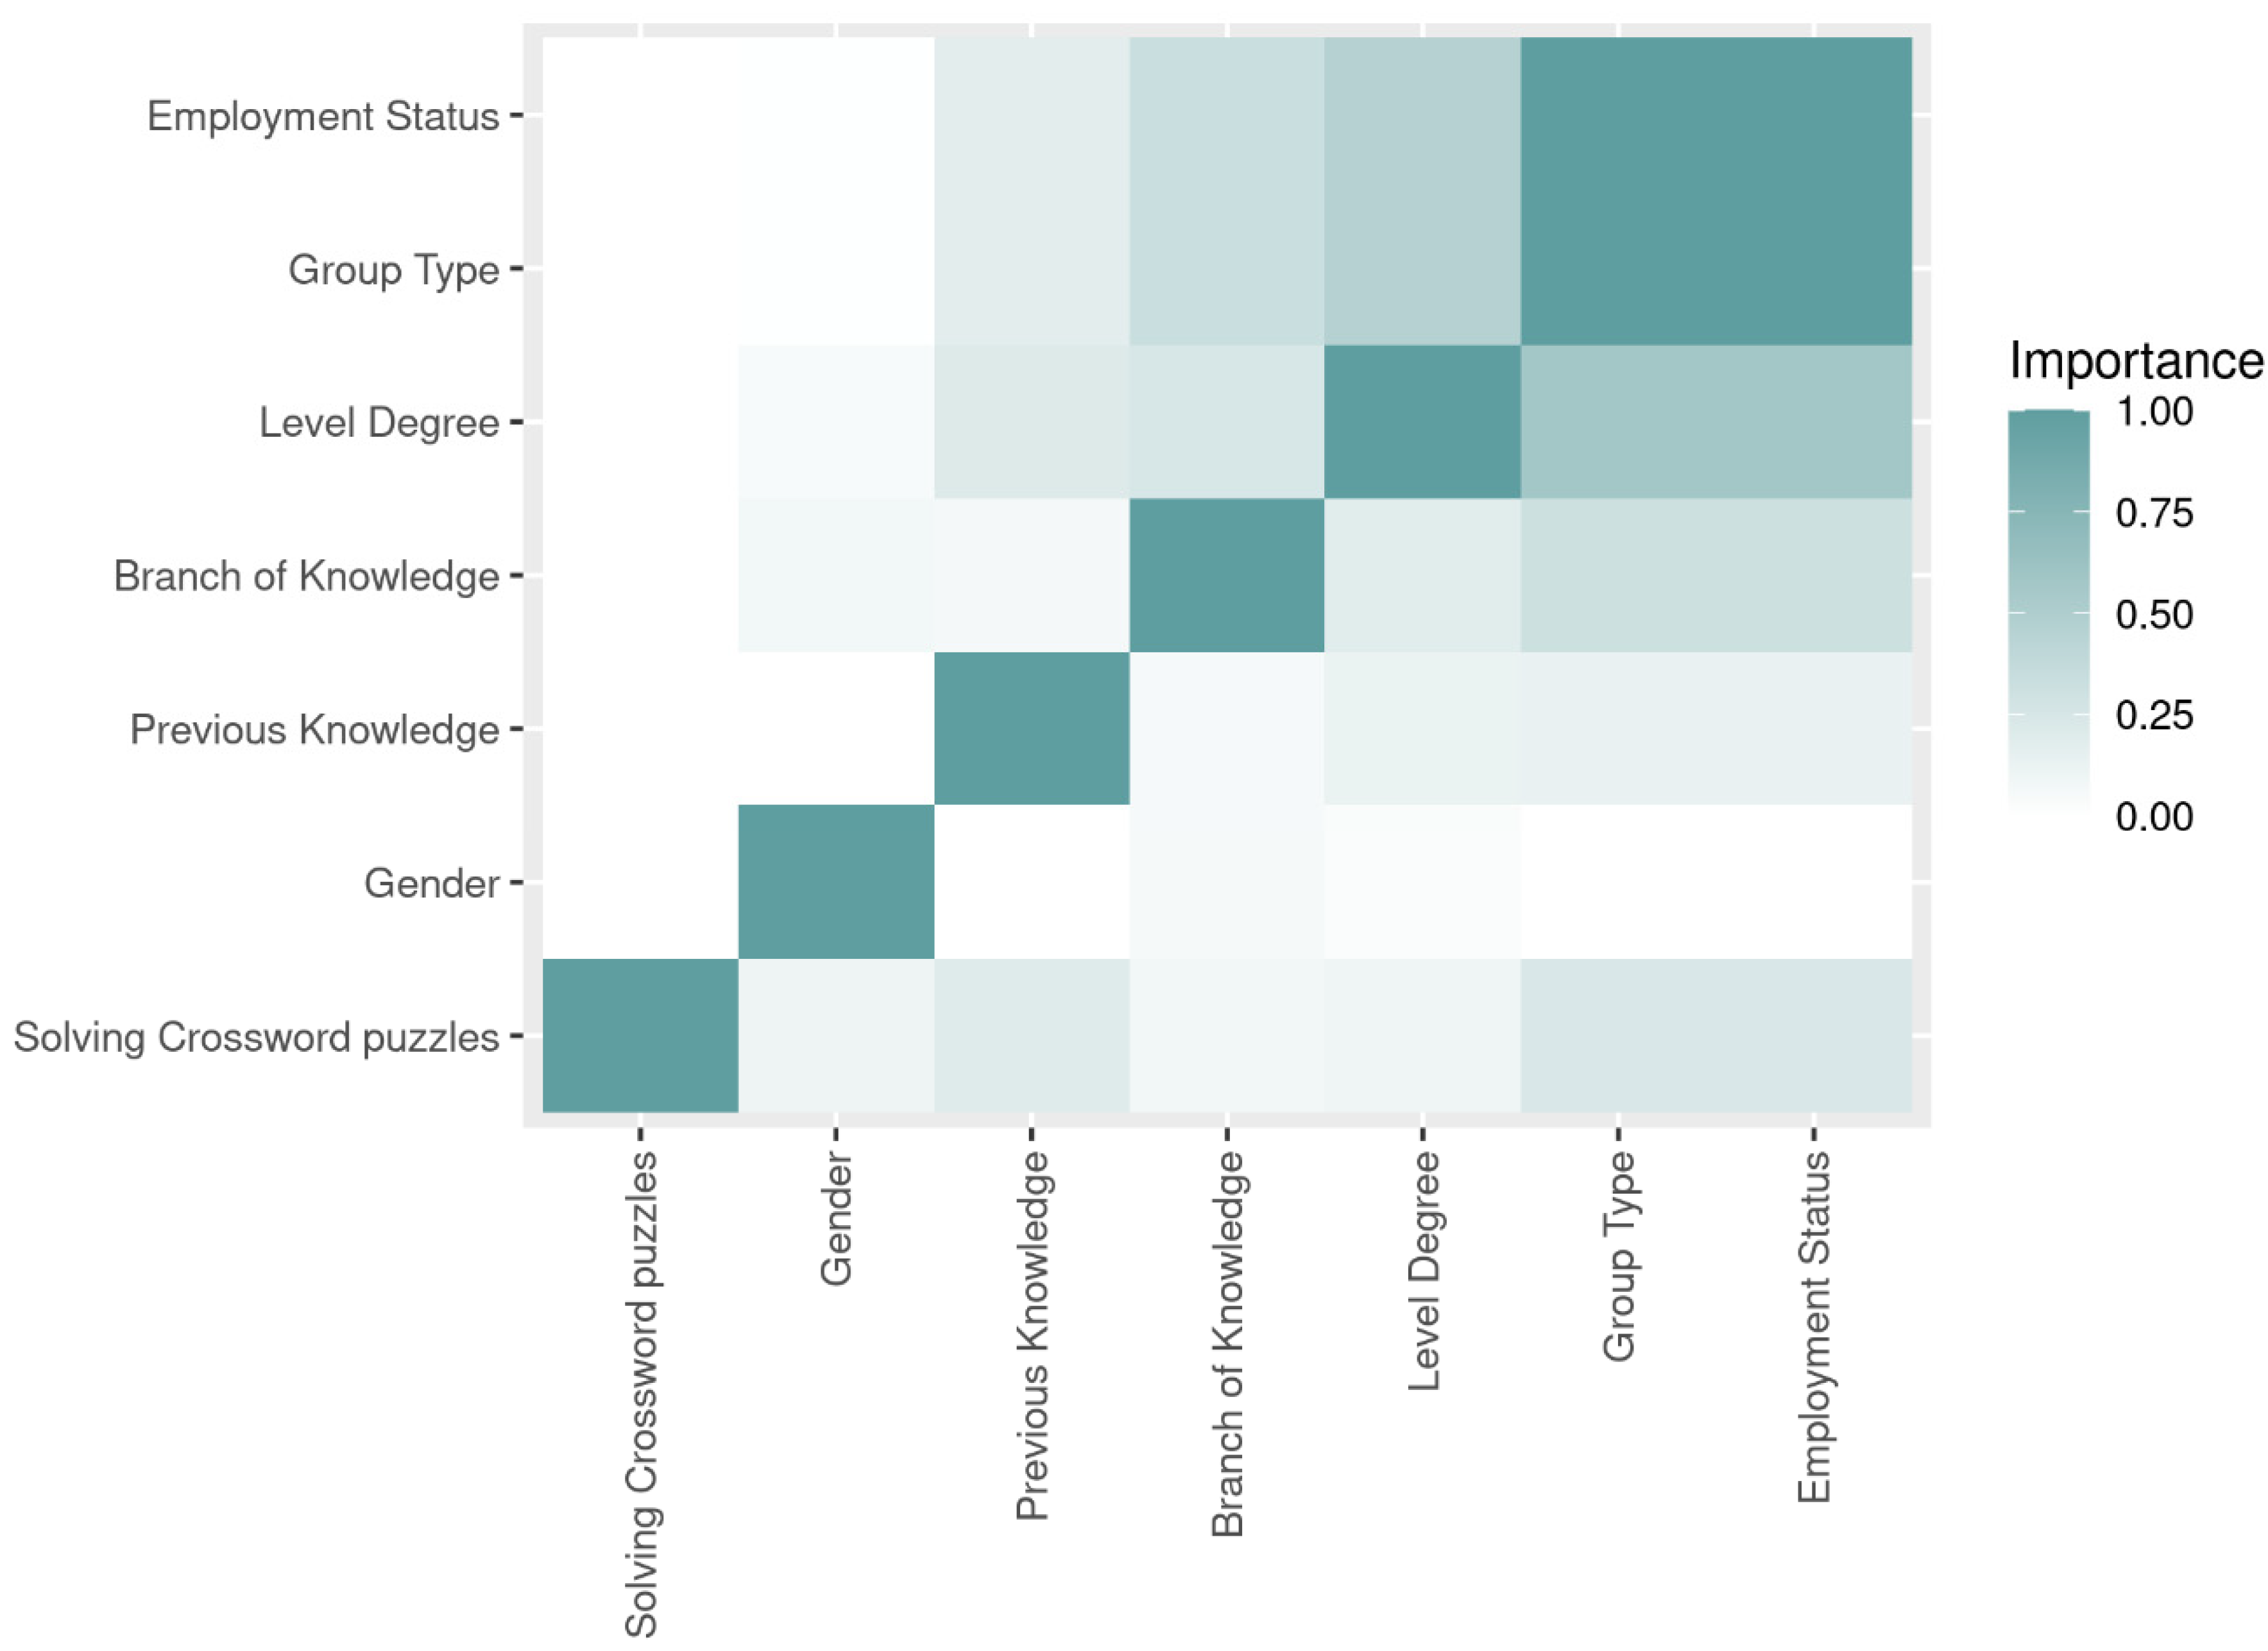
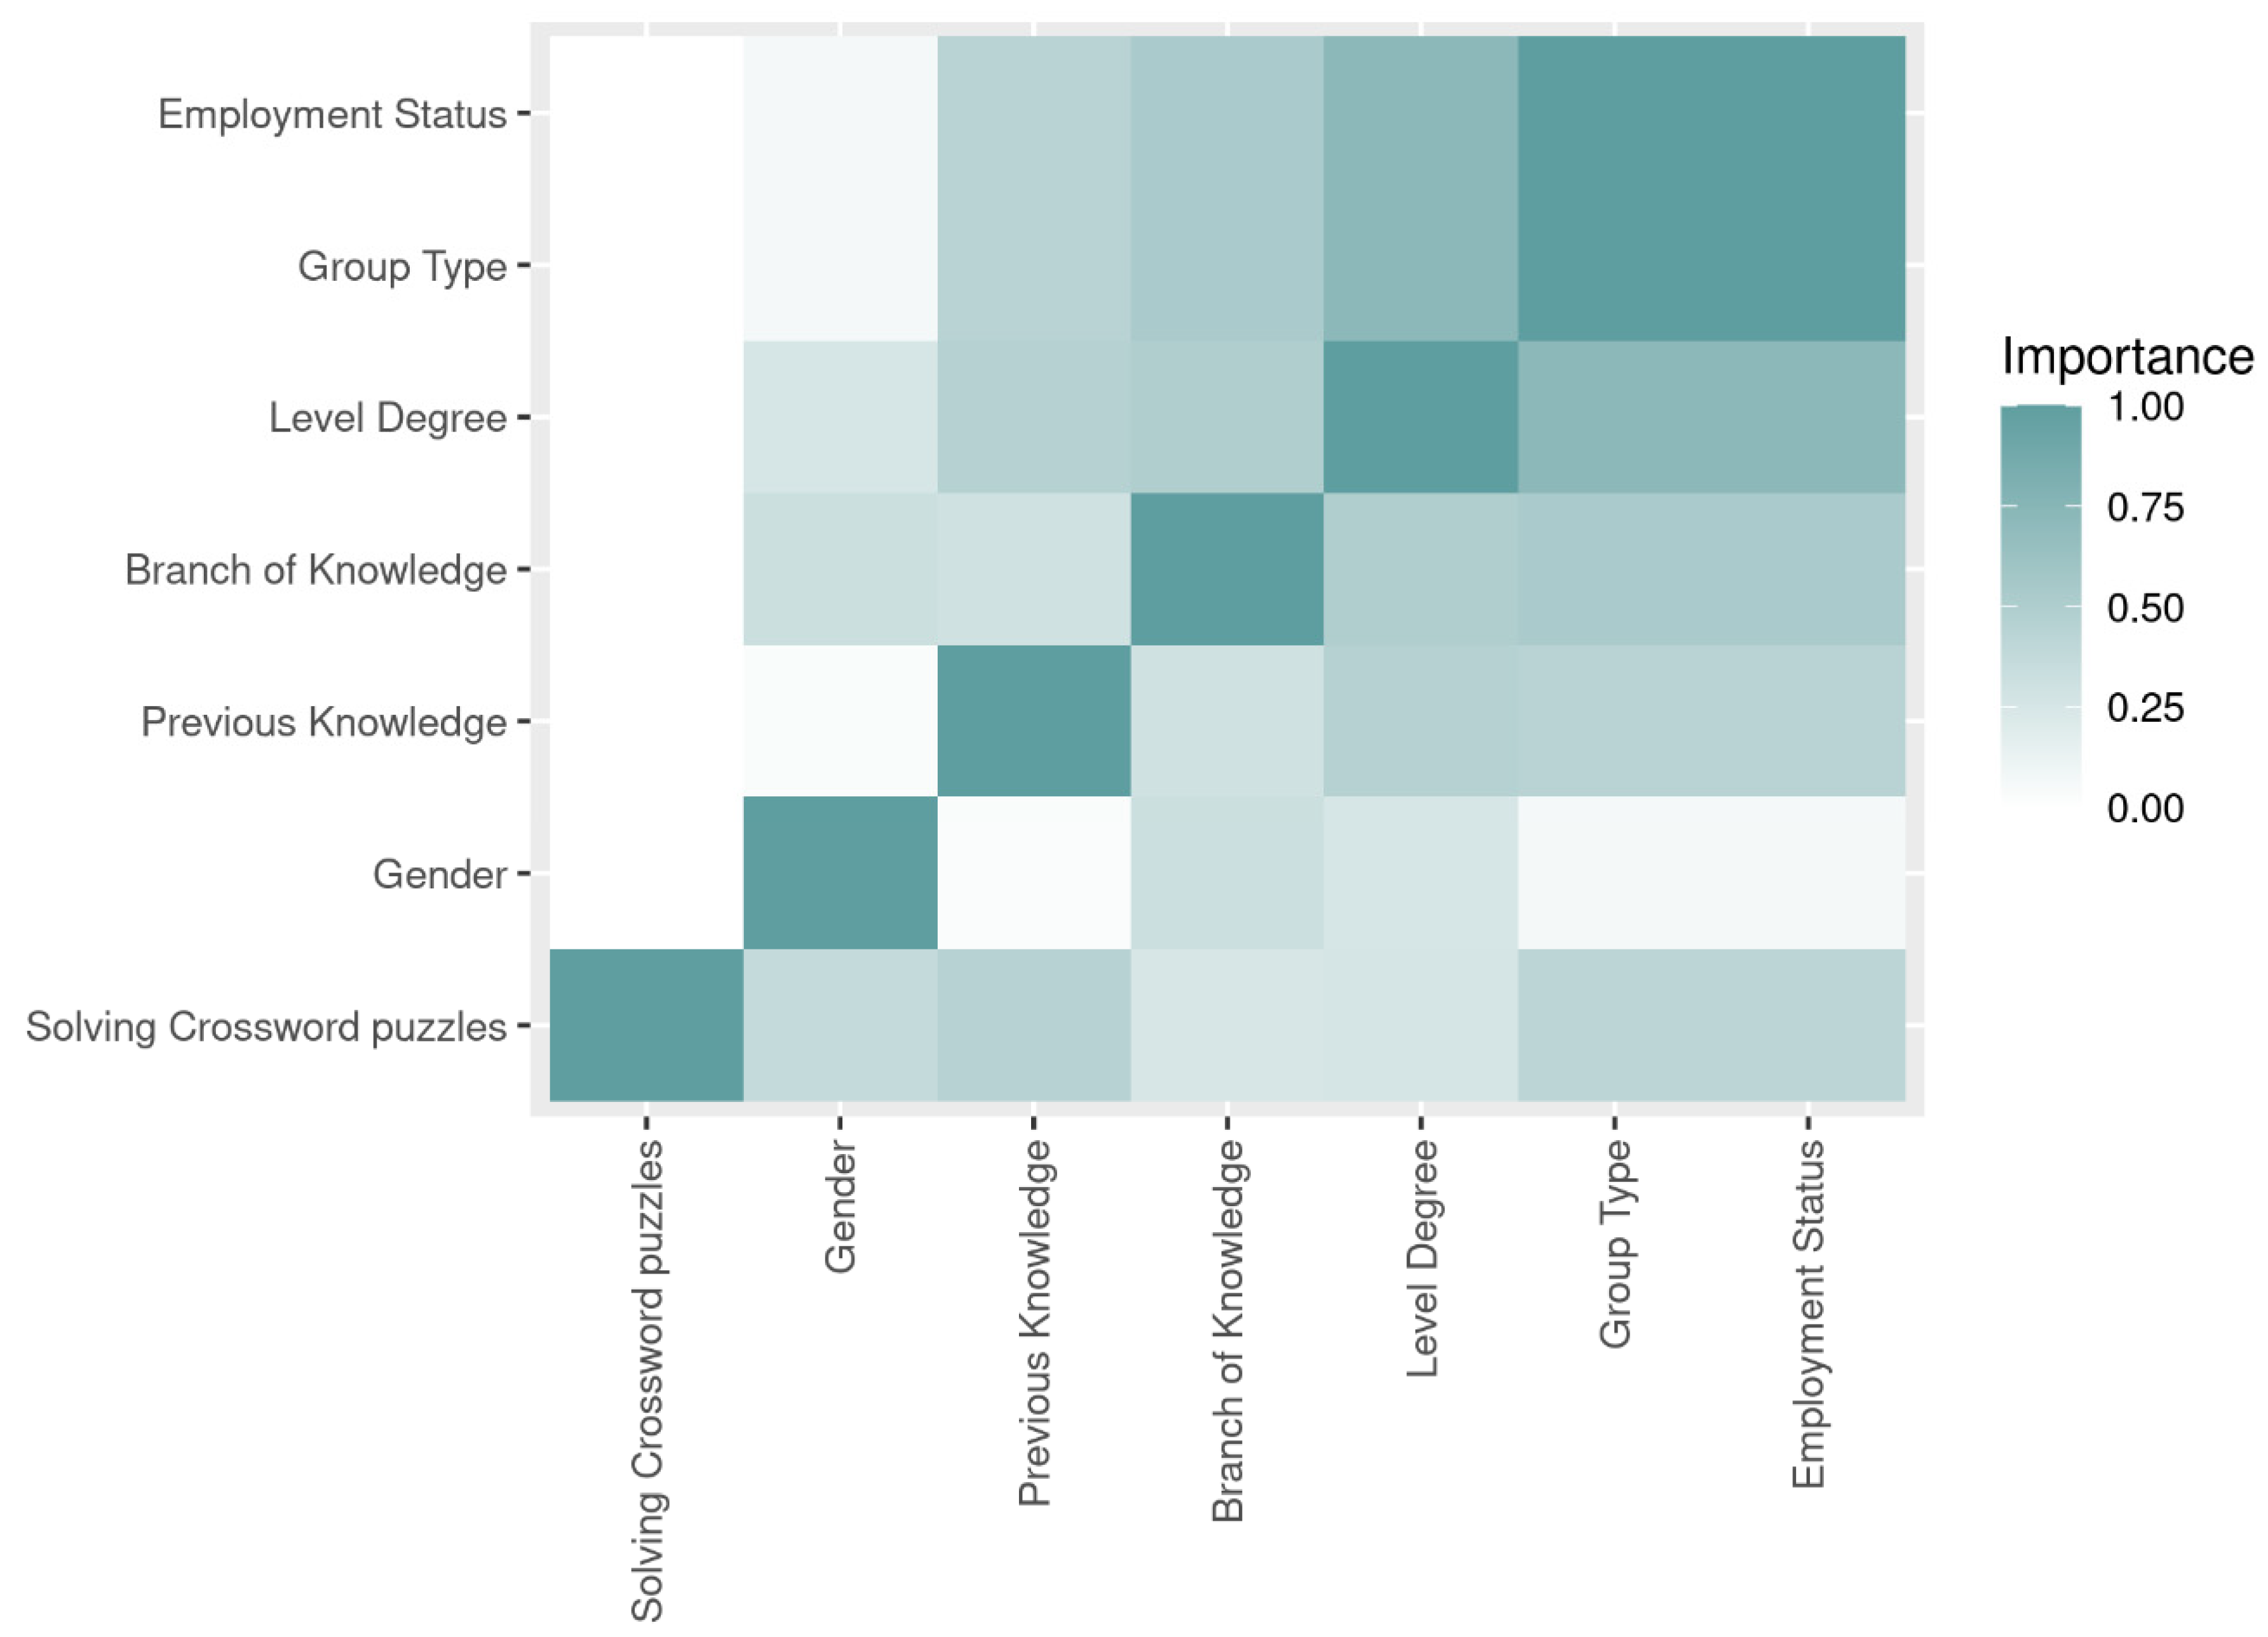
3.2. Study with Supervised Learning Machine Learning Techniques: Feature Selection

A feature selection analysis was performed with the R programming package mclust, selecting from all possible variables those that received a positive ranking. The gain ratio, symmetrical uncertainty and chi-square algorithms were used for feature selection. Table 3 shows the best values found with each of them for feature selection.
(a) The gain ratio is a feature selection method that belongs to the filtering methods. It relies on entropy to assign weights to discrete attributes based on their correlation between the attribute and a target variable (in this study, the results in solving the crossword puzzle). The gain ratio focuses on the information gain metric [57], traditionally used to choose the attribute at a node of a decision tree with the ID3 method. This is the one that generates a partition in which the examples are distributed less randomly among the classes. This method was improved by Quinlan in 1993 [58], as he detected that the information gain was calculated with an unfair favouritism towards attributes with many results. To correct this, he added a value correction based on standardisation by the entropy of that attribute. If Y is the variable to be predicted, then the gain ratio standardises the gain by dividing by the entropy of X. Thus, the C4.5 decision tree construction method uses this measure. From a data mining point of view, this attribute selection could be understood as the selection of attributes as best candidates for the root of a decision tree, which in this study will predict the solving crossword puzzle variable. With H being the entropy, the gain ratio equation is as follows:
g a i n   r a t i o = H ( C l a s s ) + H ( A t t r i b u t e ) H ( C l a s s , A t t r i b u t e ) H ( A t t r i b u t e )
Figure 4 shows the correlation matrix found with the gain ratio algorithm in the selection of best features.
(b) Symmetrical uncertainty is a feature selection method which, as with the gain ratio, belongs to the filter methods and is also based on entropy. Symmetrical uncertainty normalises the values in the range [0, 1]. It also normalises the gain by dividing by the sum of the attribute and class entropies, where H is the entropy.
s y m m e t r i c a l   u n c e r t a i n t y = 2 × H ( C l a s s ) + H ( A t t r i b u t e ) H ( C l a s s ,   A t t r i b u t e ) H ( A t t r i b u t e ) + H ( C l a s s )
Figure 5 shows the correlation matrix found with the symmetrical uncertainty algorithm on the best features.
(c) Chi-square is a feature selection algorithm that belongs to the filter type and tries to obtain the weights of each feature by using the chi-square test (in case the features are not nominal, it discretises them). The selection result is the same as Cramer’s V coefficient. The chi-square equation is as follows:
χ 2 = i = 1 k ( O i + E i ) 2 E i
where Oi is the observed or empirical absolute frequency and Ei is the expected frequency.
Figure 6 shows the correlation matrix found with chi-square (χ2) [59].

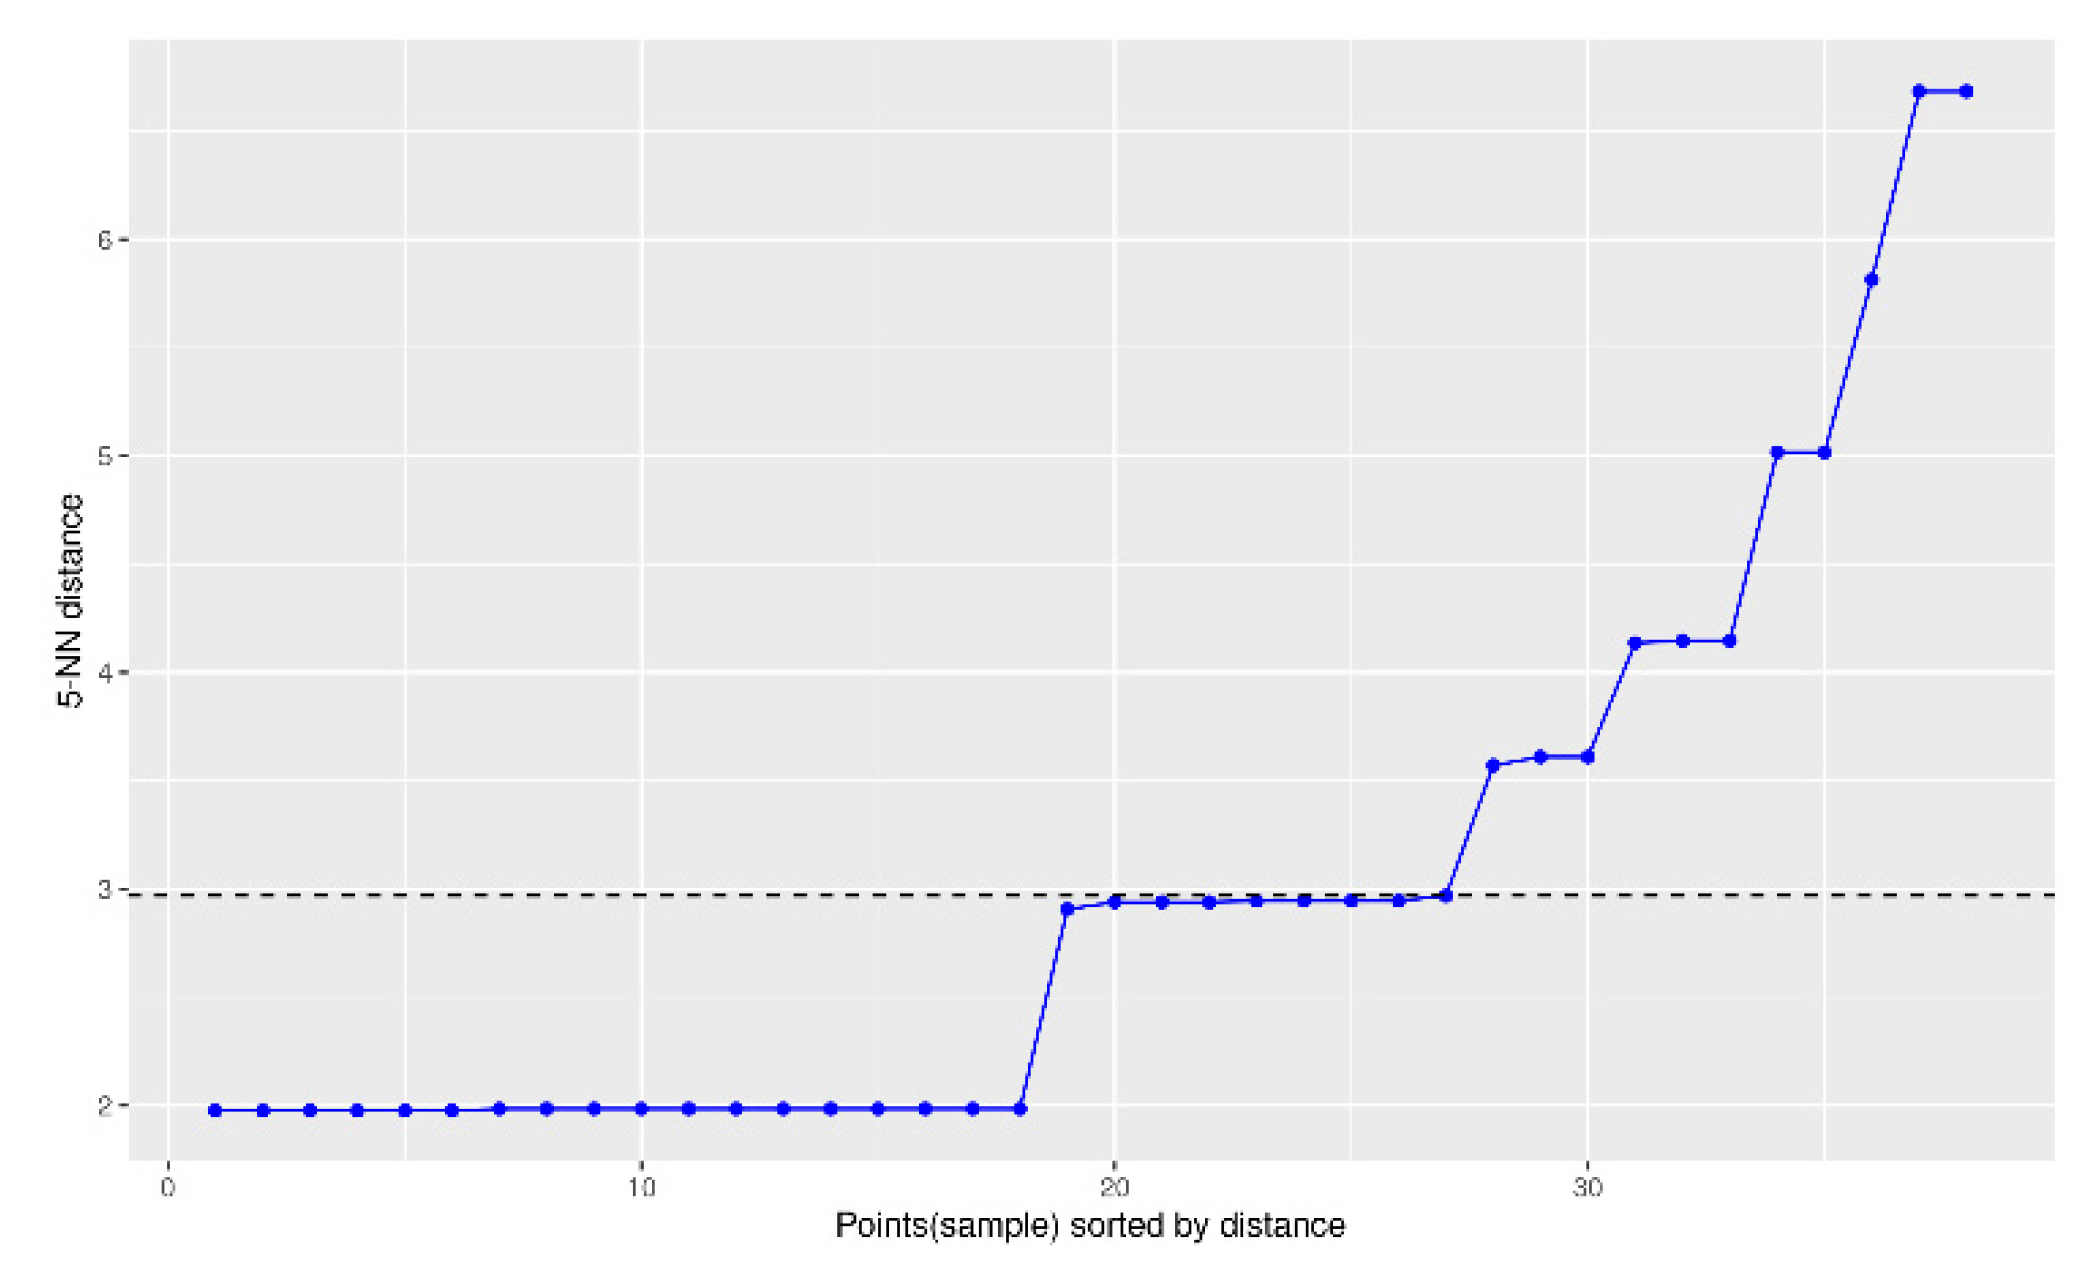
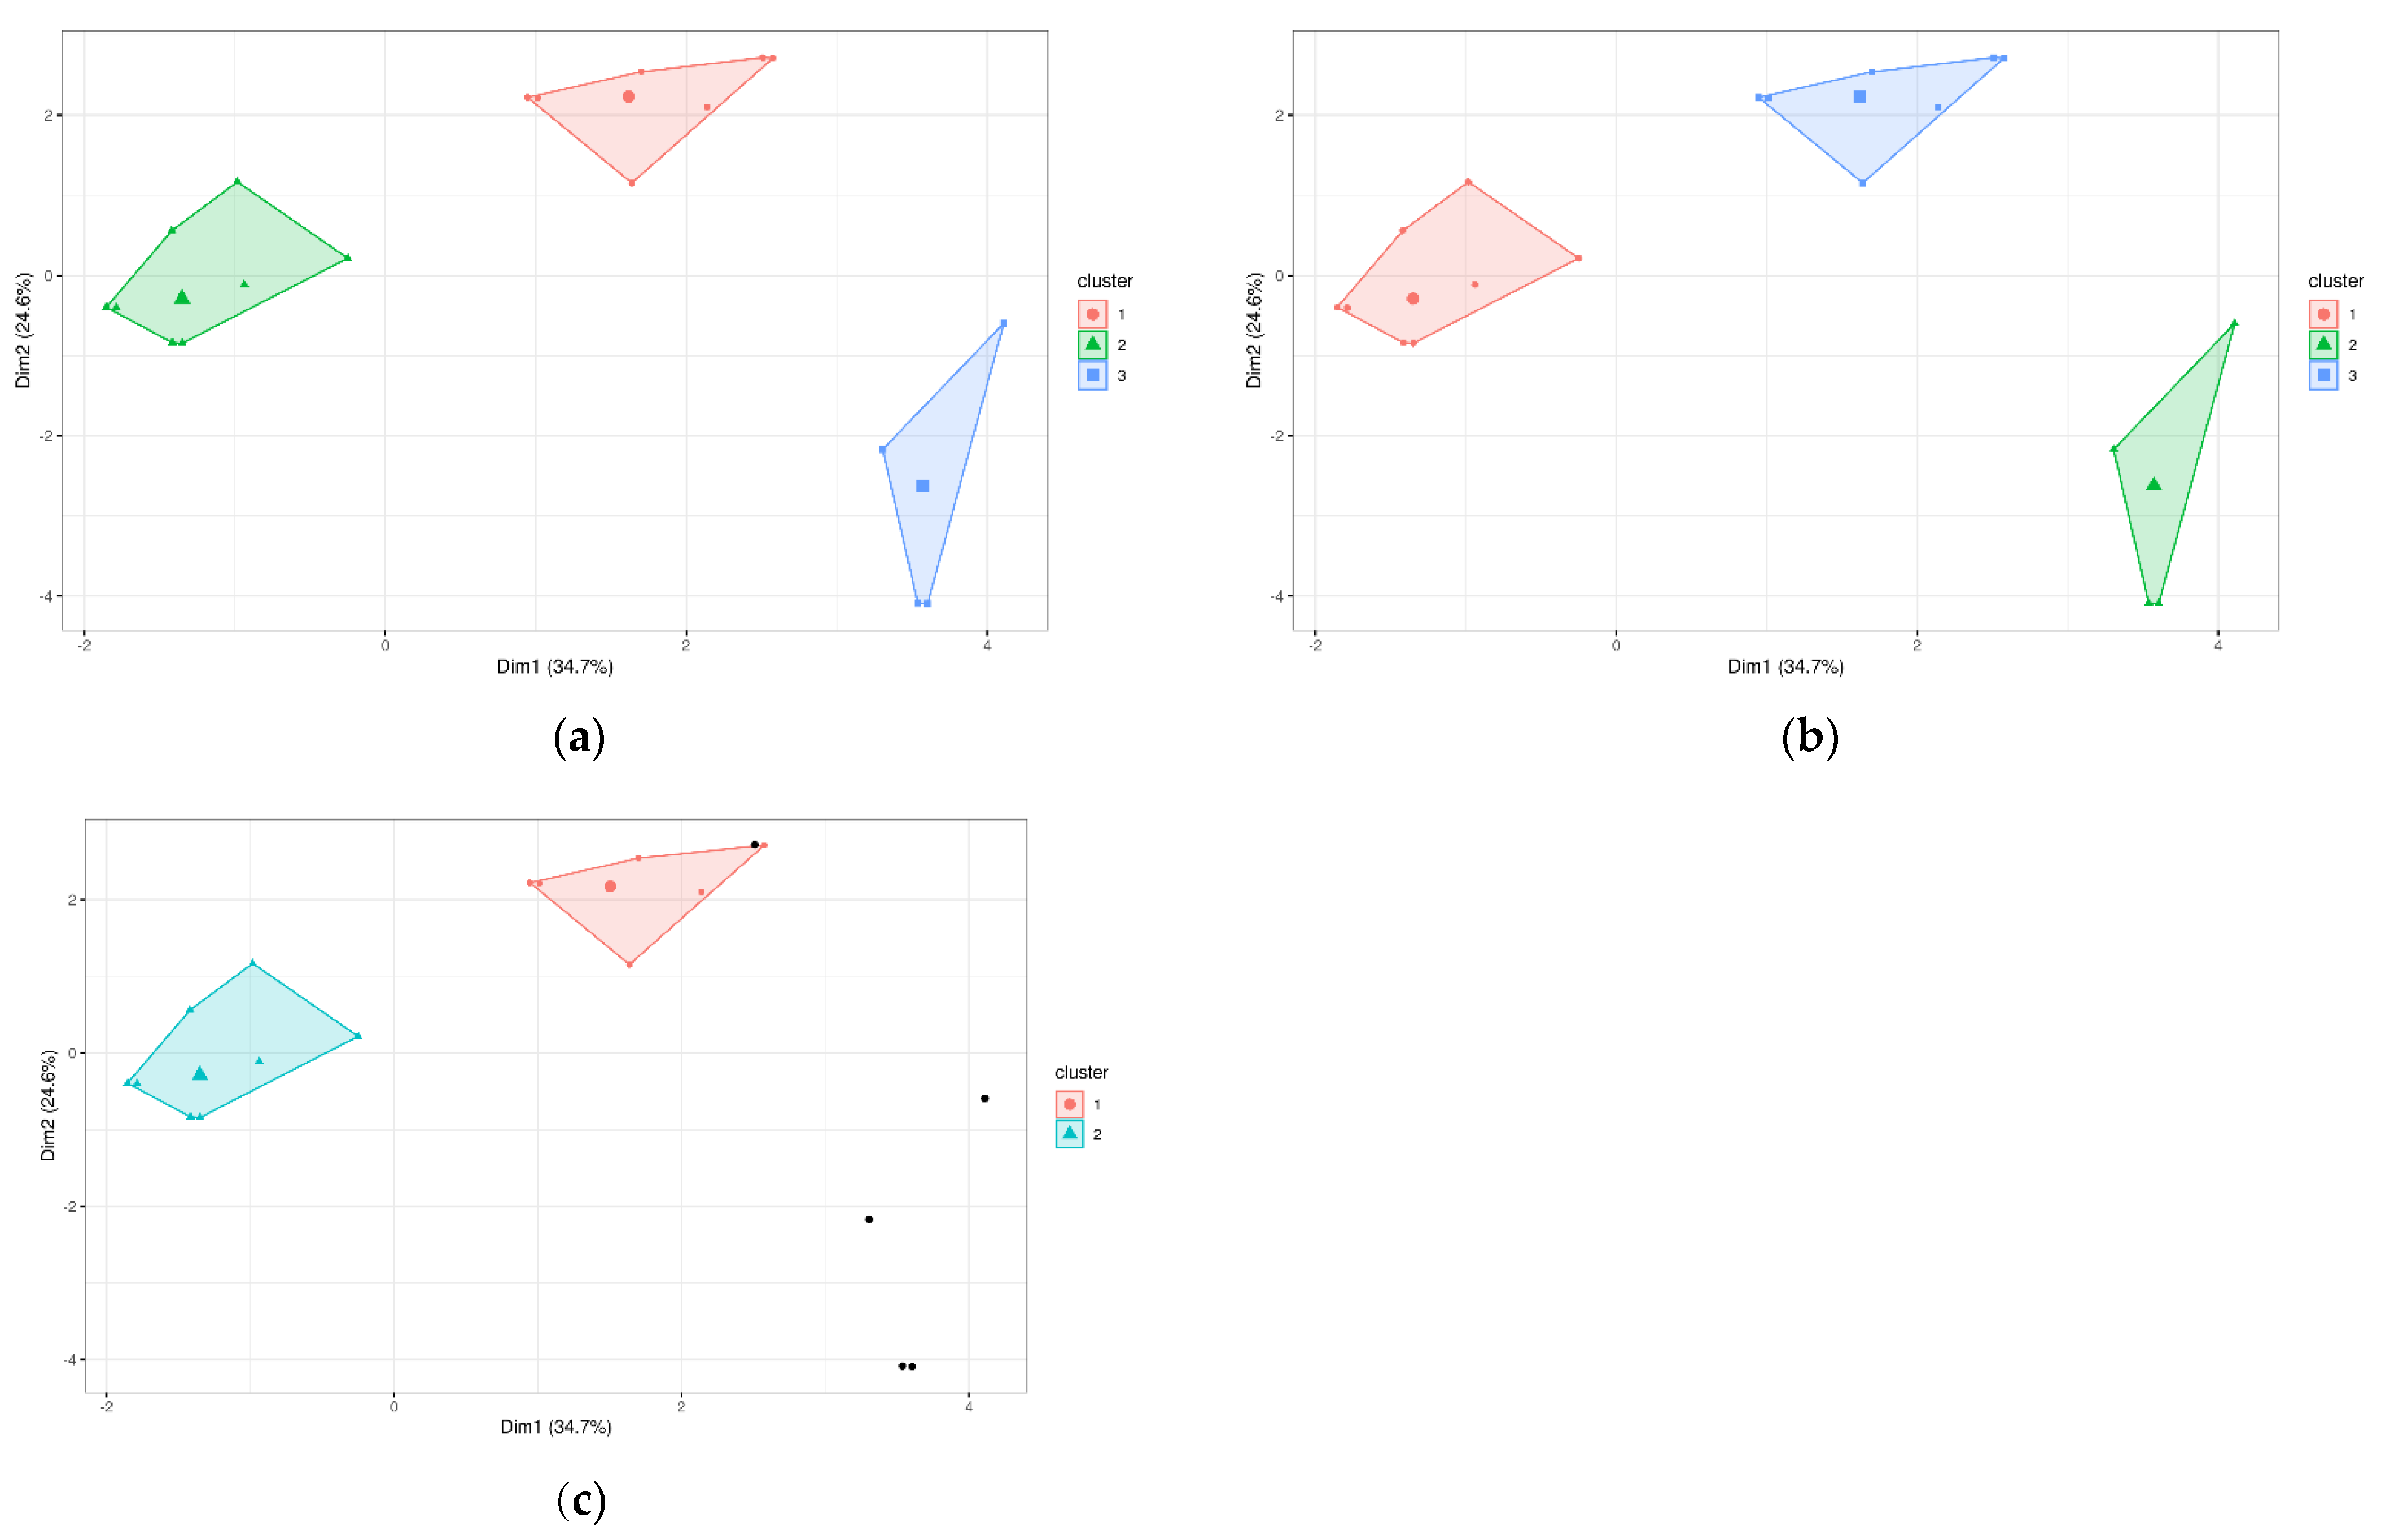
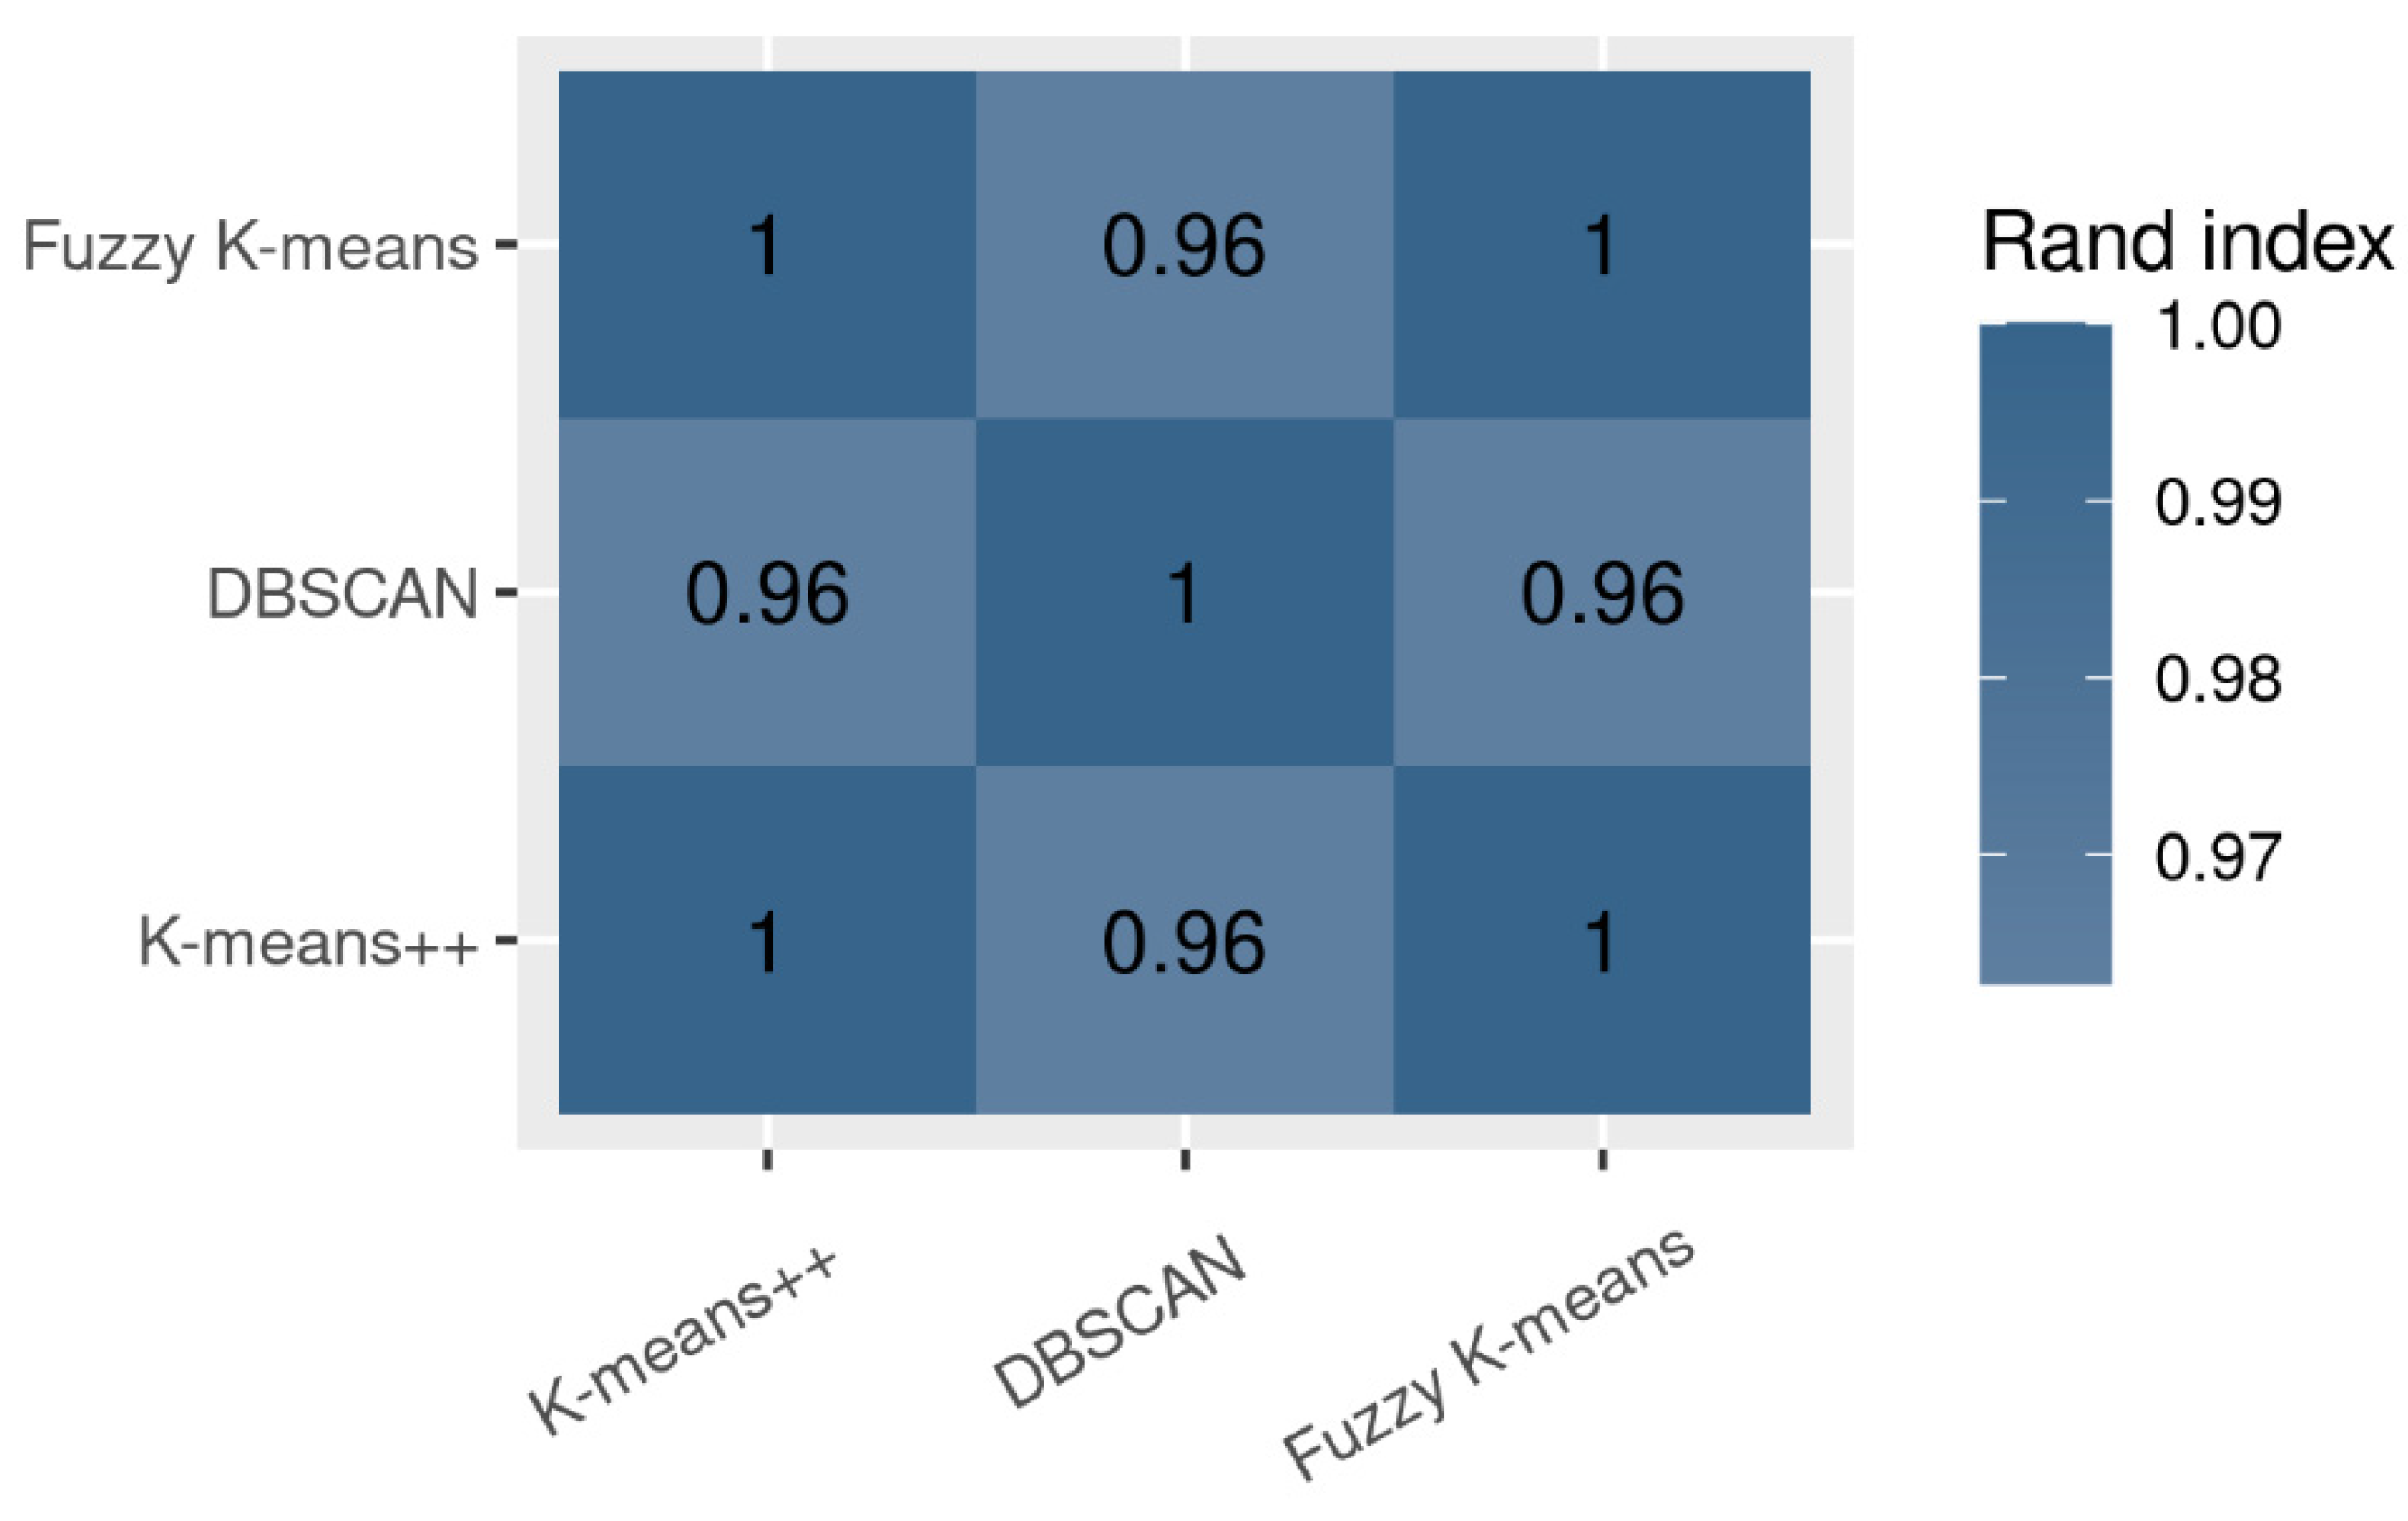
3.3. Study with Unsupervised Learning Machine Learning Techniques: Clustering

Finally, cluster detection was performed on the data with unsupervised learning techniques, ignoring the solving crossword puzzles parameter in order to detect patterns in the instances. Nominal variables were transformed into dummy variables in such a way that a variable with n possible different values was divided into n-1 new binary variables, meaning that each of them indicated belonging to one of the previous values. The data were normalised by normalising the mean of the attributes to 0 and the standard deviation to 1. The following clustering algorithms were used:
(a) k-means++ is an algorithm for choosing the initial values of the centroids for the k-means clustering algorithm. It was proposed in 2007 by Arthur and Vassilvitskii [60] as an approximation algorithm for solving the NP-hard k-means problem. That is, a way to avoid the sometimes poor clustering encountered by the standard k-means clustering algorithm.
D 2 ( µ 0 ) 2 D 2 ( µ i ) + 2 | | µ i µ 0 | | 2
where µ 0 is the initial point selected and D is the distance between point µ i and the nearest centre of the cluster. Once the centroids are chosen, the process is like the classical k-means.
(b) The fuzzy k-means algorithm combines the methods based on the optimisation of the objective function with those of fuzzy logic [61,62]. This algorithm performs cluster formation through a soft partitioning of the data. That is, a piece of data would not belong exclusively to a single group but could have different degrees of belonging to several groups. This procedure calculates initial means (m1, m2, ..., mk) to find the degree of membership of data in a cluster. As long as there are no changes in these means, the degree of membership of each data item xj in cluster i is calculated.
u ( j ,   i ) = e ( | | x j m i | | 2 ) j e ( | | x j m i | | 2 )
where mi is the fuzzy mean of all the examples in cluster i.
m i = j i u ( j , i ) 2 x j j u ( j , i ) 2
(c) DBSCAN (density-based spatial clustering of applications with noise) [63] is understood as an algorithm that identifies clusters describing regions with a high density of observations and regions of low density. DBSCAN avoids the problem that other clustering algorithms have by following the idea that, for an observation to be part of a cluster, there must be a minimum number of neighbouring observations (minPts) within a proximity radius (epsilon) and that clusters are separated by empty regions or regions with few observations.
As all remaining variables were nominal after feature selection, after pre-processing the data, only clustering with binary variables was used, which complicated the processing of the k-means++ algorithm by placing the centroids at different locations in the space when the number of centroids was bigger than three. For this reason, the parameter value k in the k-means++ and fuzzy k-means algorithms was equal to 3.
The value of the DBSCAN algorithm parameters was 5 for the minPts variable as it is the default value in the library [64]. To choose the epsilon value, the elbow method was applied. Figure 7 shows the average distance of each point to its nearest neighbouring minPts, and the value 2.97 was chosen for this parameter.
The visualisation of the clustering results can be seen in Figure 8, which shows the data after applying dimensionality reduction with the principal component analysis (PCA) method. The clusters selected by the k-means++ and fuzzy k-means algorithms are identical, while DBSCAN only found two clusters, leaving instances out of them. These instances labelled as noise in this study are assigned to an additional cluster.
Finally, it has to be considered that when applying an unsupervised learning method, such as clustering, there is no objective variable to evaluate the goodness of the distribution of instances in clusters. However, the goodness of clustering can be tested using the adjusted Rand index (ARI), in order to compare how similar the clustering algorithms are to each other. Thus, if many algorithms perform similar partitions, the conclusion will be consistent [65]. That is, if a pair of instances is in the same cluster in both partitions, this fact will represent similarity between these partitions. In the opposite case, where a pair of instances is in the same cluster in one partition and in different clusters in the other category, it will represent a difference. With n being the number of instances, a being the number of pairs of instances grouped in the same cluster in both partitions and b being the number of pairs of instances grouped in different clusters in different partitions, the Rand index (without adjustment and correction) would be as follows:
a = | S e q | ,   w h e r e   S e q = { ( o i ,   o j ) | o i ,   o j X k ,   o i ,   o j Y l ,   } b = | S e q | ,   w h e r e   S e q = { ( o i ,   o j ) | o i X k 1 ,   o j X k 2 ,   o i X l 1 ,   o j Y l 2 ,   } R a n d   i n d e x = a + b ( n 2 )
A correction is made to the original intuition of the Rand index, since the expected similarity between two partitions established with random models can have pairs of instances that coincide, and this fact would cause the Rand index to never be 0. To make the correction, the adjusted Rand index algorithm, ARI, was applied, in which negative values can be found if the similarity is less than expected, being equal to
A d j u s t e d   r a n d   i n d e x = I n d e x E x p e c t e d   I n d e x M a x i m u n   I n d e x E x p e c t e d   I n d e x
The applied ARI formula is therefore
A R I = i j ( n i j   2 ) [ i ( a i 2 )   j ( b j 2 ) ] / ( n 2 ) 1 2 [ i ( a i 2 )   j ( b j 2 ) ] / ( n 2 )
where if X = {X1,X2, ..., Xr} and Y = {Y1,Y2, ..., Ys}, then nij = XiYj, ai = ∑jnij and bi = ∑inij.
Thus, the ARI can have a value between −1 and 1, where 1 indicates that the two data clusters match exactly in every pair of points, 0 is the expected value for randomly created clusters and −1 is the worst fit. The results indicate that the algorithms that provide the best fit are k-means ++ and fuzzy k-means (ARI = 1), k-means ++ and DBSCAN (ARI = 0.96) and fuzzy k-means and DBSCAN (ARI = 0.9), where the higher the intensity, the higher the relationship. It can therefore be concluded that the degree of fit between the algorithms applied in this study is good for all possible associations (show Figure 9).

4. Discussion

Regarding the results found in the RQ1 check, it was not confirmed that participants with prior knowledge performed better on the crossword puzzle solving test than non-experts. In line with studies by Eberhard et al. [2], Takacs and Bus [4] and Verhallen and Bus [5], this may be explained by the fact that the task was presented in a video that included self-regulated speech. This technique has been shown to be very effective in mitigating the differences between novice vs. experienced learners [12,13,14]. However, although no significant differences were found with respect to the independent variable, a mean effect value was found. This suggests that the participant type variable “novice vs. expert” is an important variable in task resolution processes. However, in this study, this effect may have been mitigated by the way the task was presented (self-regulated procedure). This result coincides with the findings of studies that conclude that the lack of prior knowledge in novice learners can be compensated by the proposal of self-regulated multi-measure tasks [12,13,14,15,35,36]. The explanation is that self-regulated video may facilitate homogeneity in the encoding of information, attention to relevant vs. non-relevant information and in the route taken in the scan path [18,19].
Regarding RQ2, no effect of age was found on the metrics of fixations, saccades, blinks and scan path length. This may be explained by the way the task was presented (self-regulated video), or by the participants’ prior knowledge. In this line, research [8] supports that prior knowledge compensates for the effects of age on cognitive functioning, for example, on long-term memory processes or reaction times. In addition, it has been found that the covariate participant type “student vs. teacher” does weigh on task performance. Specifically, differences were found in the saccade amplitude minimum and saccade velocity minimum parameters. These data can be related to the findings of studies indicating that age effects can be mitigated by learners’ prior knowledge of the task [8] and also by self-regulated presentation of the task [18,19]. In fact, the significant differences found in the covariate focused on saccade amplitude and minimum saccade velocity, which is consistent with studies that found differences in saccade type depending on the phase of information encoding the learner was at [18,19]. This result is important for future research proposals. The reason is that the way students vs. teachers process information might be influencing the way they learn. For example, teachers might develop more systematic processing that would compensate for their lack of knowledge in a task. Alternatively, younger students might implement more effective learning, and thus processing, strategies even though they are novices [13]. These hypotheses will be explored in future studies.
Regarding RQ3, no significant differences were found in the metrics of fixations, saccades, blinks, and scan path length depending on whether the participant was a novice or an expert. This may be explained by the way the task was presented (a self-regulated video with a set time duration). However, future studies could test the results on videos that did not include self-regulation and/or that could be viewed more than once. We also found that there is an effect of the covariate participant type “student vs. teacher” on the saccade amplitude minimum and saccade velocity minimum parameters. As indicated in RQ2, this is an important fact to consider in future research, as the way students vs. teachers process information could be influencing the type of information processing. Similarly, future studies could test whether the form of task presentation (self-regulated vs. non-self-regulated; timed vs. untimed, etc.) could be influencing the form of processing (fixations, saccades, blinks, scan path length). Similarly, processing patterns could be found for different participant types (novice vs. expert, with different age intervals, etc.), and the types of patrons could be tested according to the type of participant.
According to the analysis performed with supervised learning methods of feature selection, it was found that the different algorithms applied (gain ratio, symmetrical uncertainty, chi-square) provided valuable information regarding the most significant attributes in the study. In this case, the following attributes were considered as important: previous knowledge, group type, employment status, gender, level degree and knowledge branch. This result is very interesting for future research, as it provides information on the possible effects of characteristics that were not considered as independent variables in the statistical study (employment status, gender, level degree and knowledge branch).
Regarding the study with unsupervised learning techniques (clustering), it allowed us to know the grouping, i.e., the similar interaction patterns of the participants in the selected characteristics. The three algorithms applied had a good ARI. This result is important for future studies, as a learning style profile can be extracted for each group and its relationship with the outcome of the learning tasks and with the reaction times for the execution of the tasks can be checked.

5. Conclusions

The use of the eye tracking technique provides evidence on the processing of information in different types of participants during the resolution of different tasks [9,10,11]. This fact facilitates research in behavioural sciences [37]. Working with this technology opens up many fields of research applied to numerous environments (learning to read and write, logical-mathematical reasoning, physics, driving vehicles, driving dangerous machines, marketing, etc.) [38,39,40,41,42]. It can also be used to find out how people with different learning disabilities [45] (ADHD, ASD, etc.) learn. Therefore, it could improve their learning style and make proposals for personalised intervention according to the needs observed in each of them. In addition, this technology can be used to improve driving practices and accident prevention with regard to the handling of dangerous machinery. This training is being carried out in virtual and/or augmented reality scenarios [49,50,51] that apply eye tracking technology. All these possibilities open an important field to be addressed in future research.
Another relevant aspect to take into account is the way tasks are presented. This study has shown that the use of self-regulated tasks facilitates the processing of information and homogenises learning responses between novice and expert learners [12,13,14,15,35,36]. Therefore, in future studies, we will study participants’ processing in different types of tasks (self-regulated designs with avatars, zooming in on the most relevant information, etc.). Likewise, the results will be tested in different educational stages (early childhood education, primary education, secondary education, university education and non-formal education) and in different subjects (experimental vs. non-experimental).
Subsequently, this study has shown that the use of different automatic learning techniques such as feature selection facilitates the knowledge of attributes that may be more significant for the research. This functionality is very useful in research that works with a large volume of features or instances. Moreover, if this technique is combined with the use of machine learning techniques and traditional statistics, the results can provide more information, especially related to future lines of research. In fact, in this study, it has been found that some of the variables considered as independent in the statistical study were also selected as relevant features in the study that applied supervised learning techniques of instance selection (e.g., prior knowledge, type of participant (student vs. teacher)). However, the feature selection techniques have also provided clues to be taken into account in future studies on the influence of other variables (e.g., gender, employment status, level of education and field of knowledge). In this line, the use of different algorithms to test both feature selection and clustering in unsupervised learning provides the researcher with a repertoire of results whose fit can be contrasted with the ARI. This will make it possible to know the groupings among the learners and to isolate the patterns of the types of learners in order to be able to offer educational responses based on personalised learning. On the other hand, the use of statistical analysis methods makes it possible to ascertain whether the variables indicated as independent have an effect on the dependent variables. In summary, perhaps the most useful procedure is, first, to apply the techniques of supervised learning of characteristics and then, depending on the variables detected, to pose the research questions and apply the relevant statistical analyses to test them.
Finally, the results of this study must be taken with caution, as this study has a series of limitations. These are mainly related to the size of the sample, which is small, and the selection of the sample, which was conducted convenience sampling. However, it must be considered that the use of the eye tracking methodology requires a very exhaustive control of the development of tasks in laboratory spaces, an aspect that makes it difficult for the samples to be large and randomised. Another of the limiting elements of this work is that a very specific task (acquisition of the concepts of the origins of monasteries in Europe and verification of this acquisition through the resolution of a crossword puzzle) was used in a specific learning environment (history of art). For this reason, possible future studies have been indicated in the Discussion and Conclusions sections.

Author Contributions

Conceptualisation, M.C.S.-M., I.R.P., L.A. and A.A.R.; methodology, M.C.S.-M., I.R.P. and A.A.R.; software, I.R.P.; validation, M.C.S.-M., I.R.P. and A.A.R.; formal analysis, M.C.S.-M., I.R.P. and A.A.R.; investigation, M.C.S.-M.; resources, M.C.S.-M.; data curation, M.C.S.-M.; writing—original draft preparation, M.C.S.-M.; writing—review and editing, M.C.S.-M.; I.R.P., C.F.M., A.A.R., L.A. and S.R.A.; visualisation, M.C.S.-M., I.R.P. and A.A.R.; supervision, M.C.S.-M.; project administration, M.C.S.-M.; funding acquisition, M.C.S.-M., L.A. and S.R.A. All authors have read and agreed to the published version of the manuscript.

Funding

This work was funded through the European Project “Self-Regulated Learning in SmartArt” 2019-1-ES01-KA204-065615.

Institutional Review Board Statement

The Ethics Committee of the University of Burgos approved this study No. IR27/2019.

Informed Consent Statement

Written informed consent was obtained from all participants in this study in accordance with the Declaration of Helsinki guidelines.

Data Availability Statement

The datasets generated for this study are available on request to the corresponding author.

Acknowledgments

The authors would like to thank all the people and entities that have collaborated in this study, especially the research group ADIR of Universidad de Oviedo for loaning the eye tracking equipment iView XTM, SMI Experimenter Center 3.0 and SMI BeGazeTM, and the Director of the Experience University of the University of Burgos.

Conflicts of Interest

The authors declare no conflict of interest.

Appendix A

Table A1. One-factor ANCOVA with fixed effects (age over 50 vs. under 50) and covariate (student vs. teacher).
Type of AccessNnG1nG2dfFpη2
M (SD)M (SD)
Independent Variable (novel vs. expert)
Fixation Count3817654.18 (138.56)21625.19 (189.87)1,350.090.760.003
Fixation Frequency Count38173.01 (0.67)212.96 (0.91)1,350.090.760.003
Fixation Duration Total3817166,132.18
(44,244.00)
21152,531.78
(48,472.19)
1,350.490.490.01
Fixation Duration Average3817255.93 (72.55)21254.36 (88.36)1,350.0040.950.000
Fixation Duration Maximum38171189.10
(484.92)
211286.40
(623.33)
1,350.420.520.01
Fixation Duration Minimum381783.21 (0.05)2183.21 (0.04)1,350.030.860.001
Fixation Dispersion Total381747,498.23
(11,528.53)
2146,202.81
(15,068.91)
1,350.010.930.000
Fixation Dispersion Average381772.50 (5.00)2173.58 (5.00)1,350.420.520.01
Fixation Dispersion Maximum381799.98 (0.04)2198.89 (0.39)1,350.790.380.02
Fixation Dispersion Minimum381711.54 (4.65)219.94 (5.01)1,350.850.360.02
Saccade Count3817664.29 (136.78)21632.24 (195.64)1,350.120.730.003
Saccade Frequency Count38173.15 (0.65)213.00 (0.93)1,350.120.730.003
Saccade Duration Total381732,282.09
(27,891.81)
2131,241.80 (21,906.09)1,350.030.860.001
Saccade Duration Average381759.47 (89.43)2152.58 (44.21)1,350.230.630.02
Saccade Duration Maximum3817629.38 (1332.76)21467.00 (414.22)1,350.490.490.01
Saccade Duration Minimum381716.57 (0.05)2116.49 (0.30)1,352.000.170.05
Saccade Amplitude Total38174825.23 (6815.38)214740.95 (4780.52)1,350.020.880.001
Saccade Amplitude Average381710.74 (25.55)218.69 (10.82)1,350.260.610.02
Saccade Amplitude Maximum3817156.15 (300.65)21119.67 (96.25)1,350.470.500.013
Saccade Amplitude Minimum38170.03 (0.05)210.05 (0.07)1,350.350.560.010
Saccade Velocity Total381761,828.35 (17,396.33)2166,554.31 (26,550.69)1,350.500.490.014
Saccade Velocity Average381796.85 (36.43)21113.01 (45.91)1,350.950.340.03
Saccade Velocity Maximum3817878.00 (190.65)21844.58 (173.95)1,350.250.620.01
Saccade Velocity Minimum38172.81 (1.43)213.62 (2.47)1,350.750.390.02
Saccade Latency Average3817279.93 (64.36)21295.73 (106.93)1,350.120.730.003
Blink Count381733.12 (25.59)2145.00 (37.00)1,351.140.290.03
Blink Frequency Count38170.15 (0.12)210.21 (0.18)1,351.140.290.03
Blink Duration Total38176777.12 (9174.98)2120,619.05 (41,403.88)1,351.360.250.04
Blink Duration Average3817202.48 (244.52)21545.61 (1352.20)1,350.770.390.02
Blink Duration Maximum3817898.75 (2087.86)215951.36 (19,080.82)1,350.880.360.02
Blink Duration Minimum381785.19 (5.57)2184.80 (5.05)1,350.070.790.002
Scan Path Length3817122,506.94 (21157.24)21117,620.71 (36,042.24)1,350.160.690.01
Covariable (type of participant student vs. professor)
Fixation Count3817 21 1,351.610.210.04
Fixation Frequency Count3817 21 1,351.530.230.04
Fixation Duration Total3817 21 1,351.120.300.03
Fixation Duration Average3817 21 1,350.0010.980.000
Fixation Duration Maximum3817 21 1,350.600.440.02
Fixation Duration Minimum3817 21 1,350.040.840.001
Fixation Dispersion Total3817 21 1,351.360.250.04
Fixation Dispersion Average3817 21 1,350.0020.970.000
Fixation Dispersion Maximum3817 21 1,350.080.780.002
Fixation Dispersion Minimum3817 21 1,350.120.730.004
Saccade Count3817 21 1,351.730.200.047
Saccade Frequency Count3817 21 1,351.650.210.045
Saccade Duration Total3817 21 1,350.110.740.003
Saccade Duration Average3817 21 1,351.050.310.03
Saccade Duration Maximum3817 21 1,351.090.300.03
Saccade Duration Minimum3817 21 1,352.410.130.06
Saccade Amplitude Total3817 21 1,350.440.510.01
Saccade Amplitude Average3817 21 1,351.180.280.03
Saccade Amplitude Maximum3817 21 1,351.010.320.03
Saccade Amplitude Minimum3817 21 1,355.190.03 *0.13
Saccade Velocity Total3817 21 1,350.280.600.01
Saccade Velocity Average3817 21 1,351.270.270.04
Saccade Velocity Maximum3817 21 1,350.080.770.002
Saccade Velocity Minimum3817 21 1,355.180.03 *0.13
Saccade Latency Average3817 21 1,351.190.280.03
Blink Count3817 21 1,350.020.810.001
Blink Frequency Count3817 21 1,350.0000.980.000
Blink Duration Total3817 21 1,350.930.340.03
Blink Duration Average3817 21 1,350.580.450.02
Blink Duration Maximum3817 21 1,350.530.470.02
Blink Duration Minimum3817 21 1,350.090.770.003
Scan Path Length3817 21 1,350.210.650.01
Note. G1 = participants younger than 50 years; G2 = participants older than 50 years; M = mean; SD = standard deviation; df = degrees of freedom; η2 = eta squared effect value; * p < 0.05.
Table A2. One-factor ANCOVA with fixed effects (age over 50 vs. under 50) and covariate (student vs. teacher).
Type of AccessNnG1nG2dfFpη2
M (SD)M (SD)
Independent Variable (novel vs. expert)
Fixation Count3825628.92 (183.40)13655.92 (136.21)1,350.550.460.02
Fixation Frequency Count38252.98 (0.88)133.10 (0.65)1,350.510.480.01
Fixation Duration Total3825152,469.04
(54,256.14)
13170,437.56
(23,520.29)
1,351.980.170.05
Fixation Duration Average3825243.64 (69.26)13277.03 (98.19)1,351.490.230.04
Fixation Duration Maximum38251184.55 (512.27)131355.00 (650.35)1,351.060.310.03
Fixation Duration Minimum382583.22 (0.06)1383.20 (0.00)1,351.160.290.03
Fixation Dispersion Total382546,170.27
(14,279.23)
1347,959.40
(12,120.32)
1,350.390.540.01
Fixation Dispersion Average382573.19 (4.65)1372.89 (5.72)1,350.040.840.001
Fixation Dispersion Maximum382599.90 (0.36)1399.99 (0.03)1,351.030.320.03
Fixation Dispersion Minimum382511.02 (4.59)139.95 (5.44)1,350.300.590.01
Saccade Count3825638.44 (186.76)13662.23 (139.21)1,350.470.500.01
Saccade Frequency Count38253.03 (0.89)133.12 (0.67)1,350.360.550.01
Saccade Duration Total382535,070.90 (28,103.57)1325,238.52 (13,761.84)1,351.570.220.04
Saccade Duration Average382565.17 (81.24)1337.38 (14.49)1,352.060.160.06
Saccade Duration Maximum3825633.59 (1130.76)13358.96 (252.82)1,351.120.300.03
Saccade Duration Minimum382516.52 (0.26)1316.52 (0.16)1,350.070.800.002
Saccade Amplitude Total38255679.51 (6777.34)133046.24 (1794.51)1,352.310.140.06
Saccade Amplitude Average382512.20 (22.60)134.62 (2.49)1,352.050.160.06
Saccade Amplitude Maximum3825161.21 (254.94)1387.50 (56.00)1,351.490.230.04
Saccade Amplitude Minimum38250.04 (0.07)130.03 (0.05)1,351.390.250.04
Saccade Velocity Total382566,146.90 (24,164.73)1361,157.70 (20,255.49)1,350.310.580.01
Saccade Velocity Average3825112.39 (47.64)1393.07 (26.12)1,352.780.100.074
Saccade Velocity Maximum3825882.20 (193.02)13815.95 (148.76)1,351.020.320.03
Saccade Velocity Minimum38253.50 (2.41)132.79 (1.20)1,352.490.120.07
Saccade Latency Average3825282.75 (76.56)13300.02 (113.31)1,350.120.730.003
Blink Count382539.24 (29.03)1340.54 (39.73)1,350.0030.960.000
Blink Frequency Count38250.18 (0.14)130.18 (0.20)1,350.0000.980.000
Blink Duration Total382515,683.28 (38,413.22)1312,009.94 (12,594.05)1,350.320.580.01
Blink Duration Average3825418.80 (1251.58)13340.78 (286.44)1,350.160.690.01
Blink Duration Maximum38254263.06 (17603.20)132590.82 (3294.93)1,350.270.610.01
Blink Duration Minimum382585.22 (5.57)1384.51 (4.66)1,350.200.660.01
Scan Path Length3825122,693.40 (31,212.68)13114,255.23 (27,953.39)1,350.520.480.02
Covariable (type of participant student vs. professor)
Fixation Count3825 13 1,352.140.150.06
Fixation Frequency Count3825 13 1,352.030.160.06
Fixation Duration Total3825 13 1,352.130.150.06
Fixation Duration Average3825 13 1,350.040.840.001
Fixation Duration Maximum3825 13 1,350.740.400.02
Fixation Duration Minimum3825 13 1,350.140.710.004
Fixation Dispersion Total3825 13 1,351.690.200.05
Fixation Dispersion Average3825 13 1,350.040.850.001
Fixation Dispersion Maximum3825 13 1,350.390.540.01
Fixation Dispersion Minimum3825 13 1,350.160.690.01
Saccade Count3825 13 1,352.270.140.06
Saccade Frequency Count3825 13 1,352.120.150.06
Saccade Duration Total3825 13 1,350.290.590.01
Saccade Duration Average3825 13 1,351.530.230.04
Saccade Duration Maximum3825 13 1,351.280.270.04
Saccade Duration Minimum3825 13 1,351.750.200.05
Saccade Amplitude Total3825 13 1,350.890.350.03
Saccade Amplitude Average3825 13 1,351.670.210.05
Saccade Amplitude Maximum3825 13 1,351.270.270.04
Saccade Amplitude Minimum3825 13 1,356.900.01 *0.16
Saccade Velocity Total3825 13 1,350.090.770.003
Saccade Velocity Average3825 13 1,352.670.110.07
Saccade Velocity Maximum3825 13 1,350.040.850.001
Saccade Velocity Minimum3825 13 1,357.670.01 *0.18
Saccade Latency Average3825 13 1,351.170.290.032
Blink Count3825 13 1,350.100.750.003
Blink Frequency Count3825 13 1,350.030.870.001
Blink Duration Total3825 13 1,351.550.220.04
Blink Duration Average3825 13 1,350.950.340.03
Blink Duration Maximum3825 13 1,350.950.340.03
Blink Duration Minimum3825 13 1,350.120.740.003
Scan Path Length3825 13 1,350.150.700.004
Note. G1 = novice participants; G2 = expert participants; M = mean; SD = standard deviation; df = degrees of freedom; η2 = eta squared effect value; * p < 0.05.

References

  1. van Marlen, T.; van Wermeskerken, M.; Jarodzka, H.; van Gog, T. Effectiveness of eye movement modeling examples in problem solving: The role of verbal ambiguity and prior knowledge. Learn. Instr. 2018, 58, 274–283. [Google Scholar] [CrossRef]
  2. Eberhard, K.M.; Tanenhaus, M.K.; Sciences, C.; Sedivy, J.C.; Sciences, C.; Hall, M. Eye movements as a window into real-time spoken language comprehension in natural contexts. J. Psycholinguist. Res. 1995, 24, 409–436. [Google Scholar] [CrossRef]
  3. Bruder, C.; Hasse, C. Differences between experts and novices in the monitoring of automated systems. Int. J. Ind. Ergon. 2019, 72, 1–11. [Google Scholar] [CrossRef]
  4. Takacs, Z.K.; Bus, A.G. How pictures in picture storybooks support young children’s story comprehension: An eye-tracking experiment. J. Exp. Child. Psychol. 2018, 174, 1–12. [Google Scholar] [CrossRef]
  5. Verhallen, M.J.A.J.; Bus, A.G. Young second language learners’ visual attention to illustrations in storybooks. J. Early Child. Lit. 2011, 11, 480–500. [Google Scholar] [CrossRef]
  6. Ooms, K.; de Maeyer, P.; Fack, V.; van Assche, E.; Witlox, F. Interpreting maps through the eyes of expert and novice users. Int. J. Geogr. Inf. Sci. 2012, 26, 1773–1788. [Google Scholar] [CrossRef]
  7. Hilton, C.; Miellet, S.; Slattery, T.J.; Wiener, J. Are age-related deficits in route learning related to control of visual attention? Psychol. Res. 2020, 84, 1473–1484. [Google Scholar] [CrossRef] [Green Version]
  8. Sáiz Manzanares, M.C.; Rodríguez-Díez, J.J.; Marticorena-Sánchez, R.; Zaparaín-Yáñez, M.J.; Cerezo-Menéndez, R. Lifelong learning from sustainable education: An analysis with eye tracking and data mining techniques. Sustainability 2020, 12, 1970. [Google Scholar] [CrossRef] [Green Version]
  9. Kitchenham, B.A.; Dybå, T.; Jørgensen, M. Evidence-based software engineering. In Proceedings of the 26th International Conference on Software Engineering, Edinburgh, UK, 28 May 2004; pp. 273–281. [Google Scholar] [CrossRef]
  10. Joe, L.P.I.; Sasirekha, S.; Uma Maheswari, S.; Ajith, K.A.M.; Arjun, S.M.; Athesh, K.S. Eye Gaze Tracking-Based Adaptive E-learning for Enhancing Teaching and Learning in Virtual Classrooms. In Information and Communication Technology for Competitive Strategies; Fong, S., Akashe, S., Mahalle, P.N., Eds.; Springer: Singapore, 2019; pp. 165–176. [Google Scholar] [CrossRef]
  11. Rayner, K. Eye Movements in Reading and Information Processing: 20 Years of Research. Psychol. Bull. 1998, 124, 372–422. [Google Scholar] [CrossRef]
  12. Taub, M.; Azevedo, R.; Bradbury, A.E.; Millar, G.C.; Lester, J. Using sequence mining to reveal the efficiency in scientific reasoning during STEM learning with a game-based learning environment. Learn. Instr. 2018, 54, 93–103. [Google Scholar] [CrossRef]
  13. Taub, M.; Azevedo, R. Using Sequence Mining to Analyze Metacognitive Monitoring and Scientific Inquiry Based on Levels of Efficiency and Emotions during Game-Based Learning. JEDM 2018, 10, 1–26. [Google Scholar] [CrossRef]
  14. Cloude, E.B.; Taub, M.; Lester, J.; Azevedo, R. The Role of Achievement Goal Orientation on Metacognitive Process Use in Game-Based Learning. In Artificial Intelligence in Education; Isotani, S., Millán, E., Ogan, A., Hastings, P., McLaren, B., Luckin, R., Eds.; Springer International Publishing: Cham, Switzerland, 2019; pp. 36–40. [Google Scholar] [CrossRef]
  15. Azevedo, R.; Gašević, D. Analyzing Multimodal Multichannel Data about Self-Regulated Learning with Advanced Learning Technologies: Issues and Challenges. Comput. Hum. Behav. 2019, 96, 207–210. [Google Scholar] [CrossRef]
  16. Liu, H.-C.; Chuang, H.-H. An examination of cognitive processing of multimedia information based on viewers’ eye movements. Interact. Learn. Environ. 2011, 19, 503–517. [Google Scholar] [CrossRef]
  17. Privitera, C.M.; Stark, L.W. Algorithms for defining visual regions-of-lnterest: Comparison with eye fixations. IEEE Trans. Pattern Anal. Mach. Intell. 2000, 22, 970–982. [Google Scholar] [CrossRef] [Green Version]
  18. Sharafi, Z.; Soh, Z.; Guéhéneuc, Y.G. A systematic literature review on the usage of eye-tracking in software engineering. Inf. Softw. Technol. 2015, 67, 79–107. [Google Scholar] [CrossRef]
  19. Sharafi, Z.; Shaffer, T.; Sharif, B.; Guéhéneuc, Y.G. Eye-tracking metrics in software engineering. In Proceedings of the 015 Asia-Pacific Software Engineering Conference (APSEC), New Delhi, India, 1–4 December 2015; pp. 96–103. [Google Scholar] [CrossRef]
  20. Maltz, M.; Shina, D. Eye movements of younger and older drivers. Hum. Factors 1999, 41, 15–25. [Google Scholar] [CrossRef] [Green Version]
  21. Dalrymple, K.A.; Jiang, M.; Zhao, Q.; Elison, J.T. Machine learning accurately classifies age of toddlers based on eye tracking. Sci. Rep. 2019, 9, 6255. [Google Scholar] [CrossRef]
  22. Shen, J.; Elahipanah, A.; Reingold, E.M. Effects of context and instruction on the guidance of eye movements during a conjunctive visual search task. Eye Mov. 2007, 597–615. [Google Scholar] [CrossRef]
  23. Alemdag, E.; Cagiltay, K. A systematic review of eye tracking research on multimedia learning. Comput. Educ. 2018, 125, 413–428. [Google Scholar] [CrossRef]
  24. Scherer, R.; Siddiq, F.; Tondeur, J. The technology acceptance model (TAM): A meta-analytic structural equation modeling approach to explaining teachers’ adoption of digital technology in education. Comput. Educ. 2019, 128, 13–35. [Google Scholar] [CrossRef]
  25. Stull, A.T.; Fiorella, L.; Mayer, R.E. An eye-tracking analysis of instructor presence in video lectures. Comput. Hum. Behav. 2018, 88, 263–272. [Google Scholar] [CrossRef]
  26. Burch, M.; Kull, A.; Weiskopf, D. AOI rivers for visualizing dynamic eye gaze frequencies. Comput. Graph. Forum 2013, 32, 281–290. [Google Scholar] [CrossRef]
  27. Dzeng, R.-J.; Lin, C.-T.; Fang, Y.-C. Using eye-tracker to compare search patterns between experienced and novice workers for site hazard identification. Saf. Sci. 2016, 82, 56–67. [Google Scholar] [CrossRef]
  28. Klaib, A.F.; Alsrehin, N.O.; Melhem, W.Y.; Bashtawi, H.O.; Magableh, A.A. Eye tracking algorithms, techniques, tools, and applications with an emphasis on machine learning and Internet of Things technologies. Expert Syst. Appl. 2021, 166, 114037. [Google Scholar] [CrossRef]
  29. König, S.D.; Buffalo, E.A. A nonparametric method for detecting fixations and saccades using cluster analysis: Removing the need for arbitrary thresholds. J. Neurosci. Methods 2014, 227, 121–131. [Google Scholar] [CrossRef] [Green Version]
  30. Romero, C.; Ventura, S. Educational data mining: A survey from 1995 to 2005. Expert Syst. Appl. 2007, 33, 135–146. [Google Scholar] [CrossRef]
  31. Bogarín, A.; Cerezo, R.; Romero, C. A survey on educational process mining. WIREs Data Min. Knowl. Discov. 2018, 8, e1230. [Google Scholar] [CrossRef] [Green Version]
  32. González, Á.; Díez-Pastor, J.F.; García-Osorio, C.I.; Rodríguez-Díez, J.J. Herramienta de apoyo a la docencia de algoritmos de selección de instancias. In Proceedings of the Jornadas Enseñanza la Informática, Ciudad Real, Spain, 10–13 July 2012; pp. 33–40. [Google Scholar]
  33. Arnaiz-González, Á.; Díez-Pastor, J.F.; Rodríguez, J.J.; García-Osorio, C.I. Instance selection for regression by discretization. Expert Syst. Appl. 2016, 54, 340–350. [Google Scholar] [CrossRef]
  34. Campbell, D.F. Diseños Experimentales y Cuasiexperimentales en la Investigación Social [Experimental and Qusai-Experimental Designs for Research], 9th ed.; Amorrortu: Buenos Aires, Argentina, 2005. [Google Scholar]
  35. Cerezo, R.; Fernández, E.; Gómez, C.; Sánchez-Santillán, M.; Taub, M.; Azevedo, R. Multimodal Protocol for Assessing Metacognition and Self-Regulation in Adults with Learning Difficulties. JoVE 2020, 163, e60331. [Google Scholar] [CrossRef]
  36. Mudrick, N.V.; Azevedo, R.; Taub, M. Integrating metacognitive judgments and eye movements using sequential pattern mining to understand processes underlying multimedia learning. Comput. Hum. Behav. 2019, 96, 223–234. [Google Scholar] [CrossRef]
  37. Munoz, D.P.; Armstrong, I.; Coe, B. Using eye movements to probe development and dysfunction. In Eye Movements: A Window on Mind and Brain; van Gompel, R.P.G., Fischer, M.H., Murray, W.S., Hill, R.L., Eds.; Elsevier: Amsterdam, The Netherlands, 2007; pp. 99–124. [Google Scholar] [CrossRef]
  38. Sulikowski, P.; Zdziebko, T. Deep Learning-Enhanced Framework for Performance Evaluation of a Recommending Interface with Varied Recommendation Position and Intensity Based on Eye-Tracking Equipment Data Processing. Electronics 2020, 9, 266. [Google Scholar] [CrossRef] [Green Version]
  39. Moghaddasi, M.; Marín-Morales, J.; Khatri, J.; Guixeres, J.; Chicchi, G.I.A.; Alcañiz, M. Recognition of Customers’ Impulsivity from Behavioral Patterns in Virtual Reality. Appl. Sci. 2021, 11, 4399. [Google Scholar] [CrossRef]
  40. Qin, L.; Cao, Q.-L.; Leon, A.S.; Weng, Y.-N.; Shi, X.-H. Use of Pupil Area and Fixation Maps to Evaluate Visual Behavior of Drivers inside Tunnels at Different Luminance Levels—A Pilot Study. Appl. Sci. 2021, 11, 5014. [Google Scholar] [CrossRef]
  41. Giraldo-Romero, Y.-I.; Pérez-de-los-Cobos-Agüero, C.; Muñoz-Leiva, F.; Higueras-Castillo, E.; Liébana-Cabanillas, F. Influence of Regulatory Fit Theory on Persuasion from Google Ads: An Eye Tracking Study. J. Theor. Appl. Electron. Commer. Res. 2021, 16, 1165–1185. [Google Scholar] [CrossRef]
  42. Sulikowski, P. Evaluation of Varying Visual Intensity and Position of a Recommendation in a Recommending Interface Towards Reducing Habituation and Improving Sales. In Advances in E-Business Engineering for Ubiquitous Computing, ICEBE 2019, Proceedings of the International Conference on e-Business Engineering Advances in E-Business Engineering for Ubiquitous Computing, Shanghai, China, 12–13 October 2019; Chao, K.M., Jiang, L., Hussain, O., Ma, S.P., Fei, X., Eds.; Springer: Cham, Switzerland, 2019; pp. 208–218. [Google Scholar] [CrossRef]
  43. Sulikowski, P.; Zdziebko, T.; Coussement, K.; Dyczkowski, K.; Kluza, K.; Sachpazidu-Wójcicka, K. Gaze and Event Tracking for Evaluation of Recommendation-Driven Purchase. Sensors 2021, 21, 1381. [Google Scholar] [CrossRef]
  44. Bortko, K.; Piotr, B.; Jarosław, J.; Damian, K.; Piotr, S. Multi-Criteria Evaluation of Recommending Interfaces towards Habituation Reduction and Limited Negative Impact on User Experience. Procedia Comput. Sci. 2019, 159, 2240–2248. [Google Scholar] [CrossRef]
  45. Lee, T.L.; Yeung, M.K. Computerized Eye-Tracking Training Improves the Saccadic Eye Movements of Children with Attention-Deficit/Hyperactivity Disorder. Brain Sci. 2020, 10, 1016. [Google Scholar] [CrossRef]
  46. Peysakhovich, V.; Lefrançois, O.; Dehais, F.; Causse, M. The Neuroergonomics of Aircraft Cockpits: The Four Stages of Eye-Tracking Integration to Enhance Flight Safety. Safety 2018, 4, 8. [Google Scholar] [CrossRef] [Green Version]
  47. Bissoli, A.; Lavino-Junior, D.; Sime, M.; Encarnação, L.; Bastos-Filho, T. A Human–Machine Interface Based on Eye Tracking for Controlling and Monitoring a Smart Home Using the Internet of Things. Sensors 2019, 19, 859. [Google Scholar] [CrossRef] [Green Version]
  48. Brousseau, B.; Rose, J.; Eizenman, M. Hybrid Eye-Tracking on a Smartphone with CNN Feature Extraction and an Infrared 3D Model. Sensors 2020, 20, 543. [Google Scholar] [CrossRef] [Green Version]
  49. Vortman, L.; Schwenke, L.; Putze, F. Using Brain Activity Patterns to Differentiate Real and Virtual Attended Targets during Augmented Reality Scenarios. Information 2021, 12, 226. [Google Scholar] [CrossRef]
  50. Kapp, S.; Barz, M.; Mukhametov, S.; Sonntag, D.; Kuhn, J. ARETT: Augmented Reality Eye Tracking Toolkit for Head Mounted Displays. Sensors 2021, 21, 2234. [Google Scholar] [CrossRef]
  51. Wirth, M.; Kohl, S.; Gradl, S.; Farlock, R.; Roth, D.; Eskofier, B.M. Assessing Visual Exploratory Activity of Athletes in Virtual Reality Using Head Motion Characteristics. Sensors 2021, 21, 3728. [Google Scholar] [CrossRef] [PubMed]
  52. Scalera, L.; Seriani, S.; Gallina, P.; Lentini, M.; Gasparetto, A. Human–Robot Interaction through Eye Tracking for Artistic Drawing. Robotics 2021, 10, 54. [Google Scholar] [CrossRef]
  53. Maimon-Dror, R.O.; Fernandez-Quesada, J.; Zito, G.A.; Konnaris, C.; Dziemian, S.; Faisal, A.A. Towards free 3D end-point control for robotic-assisted human reaching using binocular eye tracking. In Proceedings of the IEEE International Conference on Rehabilitation Robotics, London, UK, 17–20 July 2017; pp. 1049–1054. [Google Scholar] [CrossRef]
  54. Antoniou, E.; Bozios, P.; Christou, V.; Tzimourta, K.D.; Kalafatakis, K.; Tsipouras, M.G.; Giannakeas, N.; Tzallas, A.T. EEG-Based Eye Movement Recognition Using Brain–Computer Interface and Random Forests. Sensors 2021, 21, 2339. [Google Scholar] [CrossRef] [PubMed]
  55. IBM Corp. SPSS Statistical Package for the Social Sciences (SPSS); Version 24; IBM: Madrid, Spain, 2016. [Google Scholar]
  56. R Core Team. R: A Language and Environment for Statistical; Version 4.1.0; R Foundation for Statistical Computing: Vienna, Austria, 2021; Available online: http://www.R-project.org/ (accessed on 6 June 2021).
  57. Hall, M.; Smith, L.A. Practical feature subset selection for machine learning. Comput. Sci. 1998, 98, 181–191. [Google Scholar]
  58. Harris, E. Information Gain versus Gain Ratio: A Study of Split Method Biases. 2001, pp. 1–20. Available online: https://www.mitre.org/sites/default/files/pdf/harris_biases.pdf (accessed on 15 May 2021).
  59. Cramér, H. Mathematical Methods of Statistics (PMS-9); Princeton University Press: Princeton, NJ, USA, 2016. [Google Scholar] [CrossRef]
  60. Arthur, D.; Vassilvitskii, S. K-means++: The advantages of careful seeding. In Proceedings of the SODA ‘07: Actas del Decimoctavo Simposio Anual ACM-SIAM Sobre Algoritmos Discretos, Philadelphia, PA, USA, 7–9 January 2007; pp. 1027–1035. [Google Scholar]
  61. Bezdek, J.C.; Dunn, J.C. Optimal Fuzzy Partitions: A Heuristic for Estimating the Parameters in a Mixture of Normal Distributions. IEEE Trans. Comput. 1975, 24, 835–838. [Google Scholar] [CrossRef]
  62. Zadeh, L.A. Fuzzy Sets and Information Granularity. Fuzzy Sets Fuzzy Logic. Fuzzy 1996, 433–448. [Google Scholar] [CrossRef] [Green Version]
  63. Daszykowski, M.; Walczak, B. Density-Based Clustering Methods. In Comprehensive Chemometrics, 2nd ed.; Brown, S., Tauler, R., Walczak, B., Eds.; Elsevier: Amsterdam, The Netherlands, 2020; Volume 2, pp. 635–654. [Google Scholar]
  64. Hahsler, M.; Piekenbrock, M.; Doran, D. dbscan: Fast Density-Based Clustering with R. J. Stat. Softw. 2019, 91, 1–30. [Google Scholar] [CrossRef] [Green Version]
  65. Hubert, L.; Arabie, P. Comparing partitions. J. Classif. 1985, 2, 193–218. [Google Scholar] [CrossRef]
Figure 1. Calibration with eye tracking.
Applsci 11 06157 g001
Figure 2. Watching the video and carrying out the crossword puzzle. Note. The circles on the image on the right indicate each point of fixation of the learner on each element in the visual tracking sequence of the image.
Applsci 11 06157 g002
Figure 3. Visual tracking process during the resolution of a task.
Applsci 11 06157 g003
Figure 4. Relationship matrix on the selected features performed with the gain ratio algorithm.
Applsci 11 06157 g004
Figure 5. Relationship matrix on the selected features performed with the symmetrical uncertainty algorithm.
Applsci 11 06157 g005
Figure 6. Relationship matrix on the selected characteristics performed with the chi-square algorithm.
Applsci 11 06157 g006
Figure 7. Elbow method in the DBSCAN algorithm.
Applsci 11 06157 g007
Figure 8. (a) Clustering with the k-means ++ algorithm; (b) clustering with the fuzzy means algorithm; (c) clustering with the DBSCAN algorithm.
Applsci 11 06157 g008
Figure 9. Adjusted Rand index (ARI).
Applsci 11 06157 g009
Table 1. Most representative parameters that can be obtained with the eye tracking technique and their significance in information processing.
MetricAcronymMetric MeaningLearning Implications
Fixation CountFCCounts the number of specific bindings on AOIs in all stimuliA greater number and frequency of fixations on a stimulus may indicate that the learner has less knowledge about the task or difficulty in discriminating relevant vs. non-relevant information. These are measures of global search performance [22].
Fixation Frequency CountFFC
Fixation DurationFDDuration of fixationIt gives an indication of the degree of interest and reaction times of the learner. Longer duration is usually associated with deeper cognitive processing and greater effort. For more complicated texts, the user has a longer average fixation duration. Fixation duration provides information about the search process [22].
Fixation Duration AverageAFDAverage duration of fixationLonger fixations refer to the learner spending more time analysing and interpreting the information content within the different areas of interest (AOIs). The average duration is considered to be between 200 and 260 ms.
Fixation Duration MaximumFDMaMaximum duration of fixationThey refer to reaction times.
Fixation Duration MinimumFDMiMinimum duration of fixation
Fixation Dispersion TotalFDTSum of all dispersions of fixations in X and YIt refers to the perception of information in different components of the task.
Fixation Dispersion AverageFDASum of all fixation dispersions in X and Y divided by the number of fixations in the testIt analyses the dispersions in each of the fixations in the different stimuli.
Saccades CountSCTotal number of saccades in each of the stimuliA greater number of saccades implies greater search strategies. The greater the breadth of the saccade, the lower the cognitive effort. It may also refer to problems in understanding information.
Saccade Frequency CountSFCSum of all saccadesThey refer to the frequency of use of saccades that are related to search strategies.
Saccade Duration TotalSDTSum of the duration of all saccades
Saccades Duration AverageSDAAverage duration of saccades in each of the AOIsIt allows discriminating field-dependent vs. non-dependent trainees.
Saccade Duration MaximumSDMaMaximum saccade duration.They refer to the perception of information in different components of the task.
Saccade Duration MinimumSDMiMinimum saccade duration.
Saccade Amplitude TotalSATSum of the amplitude of all saccadesNewcomers tend to have shorter saccades.
Saccade Amplitude MaximumSAMaMaximum of saccade amplitude
Saccade Amplitude MinimumSAMiMinimum of the saccade amplitude
Saccade Velocity TotalSVTSum of the velocity of all saccadesThey are directly related to the speed of information processing in moving from one element to another within a stimulus.
Saccade Velocity MaximumSVMaMaximum value of the saccade velocity
Saccade Velocity MinimumSVMiMinimum value of saccade speed
Saccade Latency AverageSLAIt is equal to the time between the end of one saccade and the start of the next saccadeIt is directly related to reaction times in information processing. The initial saccade latency provides detailed temporal information about the search process [22].
Blink CountBCNumber of flashes in the testIt is related to the speed of information processing. Novice learners report a higher frequency.
Blink Frequency CountBFCNumber of blinks of all selected trials per second divided by number of selected trialsBlinks are related to information processing during exposure to a stimulus to generate the next action. Learners with faster information processing may have shorter blinks of shorter duration. However, this action may also occur when attention deficit problems are present. These results will have to be compared with those obtained in the other metrics in order to adjust the explanation of these results within the analysis of a learning pattern.
Blink Duration TotalBDTSum of the duration of all blinks of the selected trials divided by the number of trials selected
Blink Duration AverageBDAThe sum of the duration of all blinks of all selected trials divided by the number of selected trials
Blink Duration MaximumBDMaLongest duration of recorded blinks
Blink Duration MinimumBDMiThe shortest duration of recorded blinks
Scan Path LengthSPLIt provides a pattern of learning behaviours for each userThe study of the behavioural patterns of learning will facilitate the teacher’s orientations in relation to the way of learning. The length of the scan path provides information about reaction times in tasks with no predetermined duration.
Table 2. Descriptive statistics of the sample.
Participant TypeNWith Prior Knowledge (n = 17)Without Prior Knowledge (n = 21)
NnMennWomanNnMennWoman
MageSDage MageSDageMageSDage MageSDage
Students149549.0023.40445.2523.475430.257.93122.00-
Teachers248547.408.62342.6711.8516943.0011.79752.294.79
Note. Mage = mean age; SDage = standard deviation age.
Table 3. Best performing features in the gain ratio, symmetrical uncertainty and chi-square feature selection algorithms.
FeaturesGain RatioSymmetrical UncertaintyChi-Square
Previous Knowledge0.1990.1990.453
Group Type0.2380.1710.421
Employment Status0.2380.1710.421
Gender0.1080.0670.372
Level Degree0.1000.0820.263
Knowledge Branch0.0840.0570.251
Publisher’s Note: MDPI stays neutral with regard to jurisdictional claims in published maps and institutional affiliations.

