
Seismic Vulnerability Assessment of Historical Masonry Buildings in Croatian Coastal Area


Abstract
:1. Introduction
2. Seismic Vulnerability Assessment of the Test Site
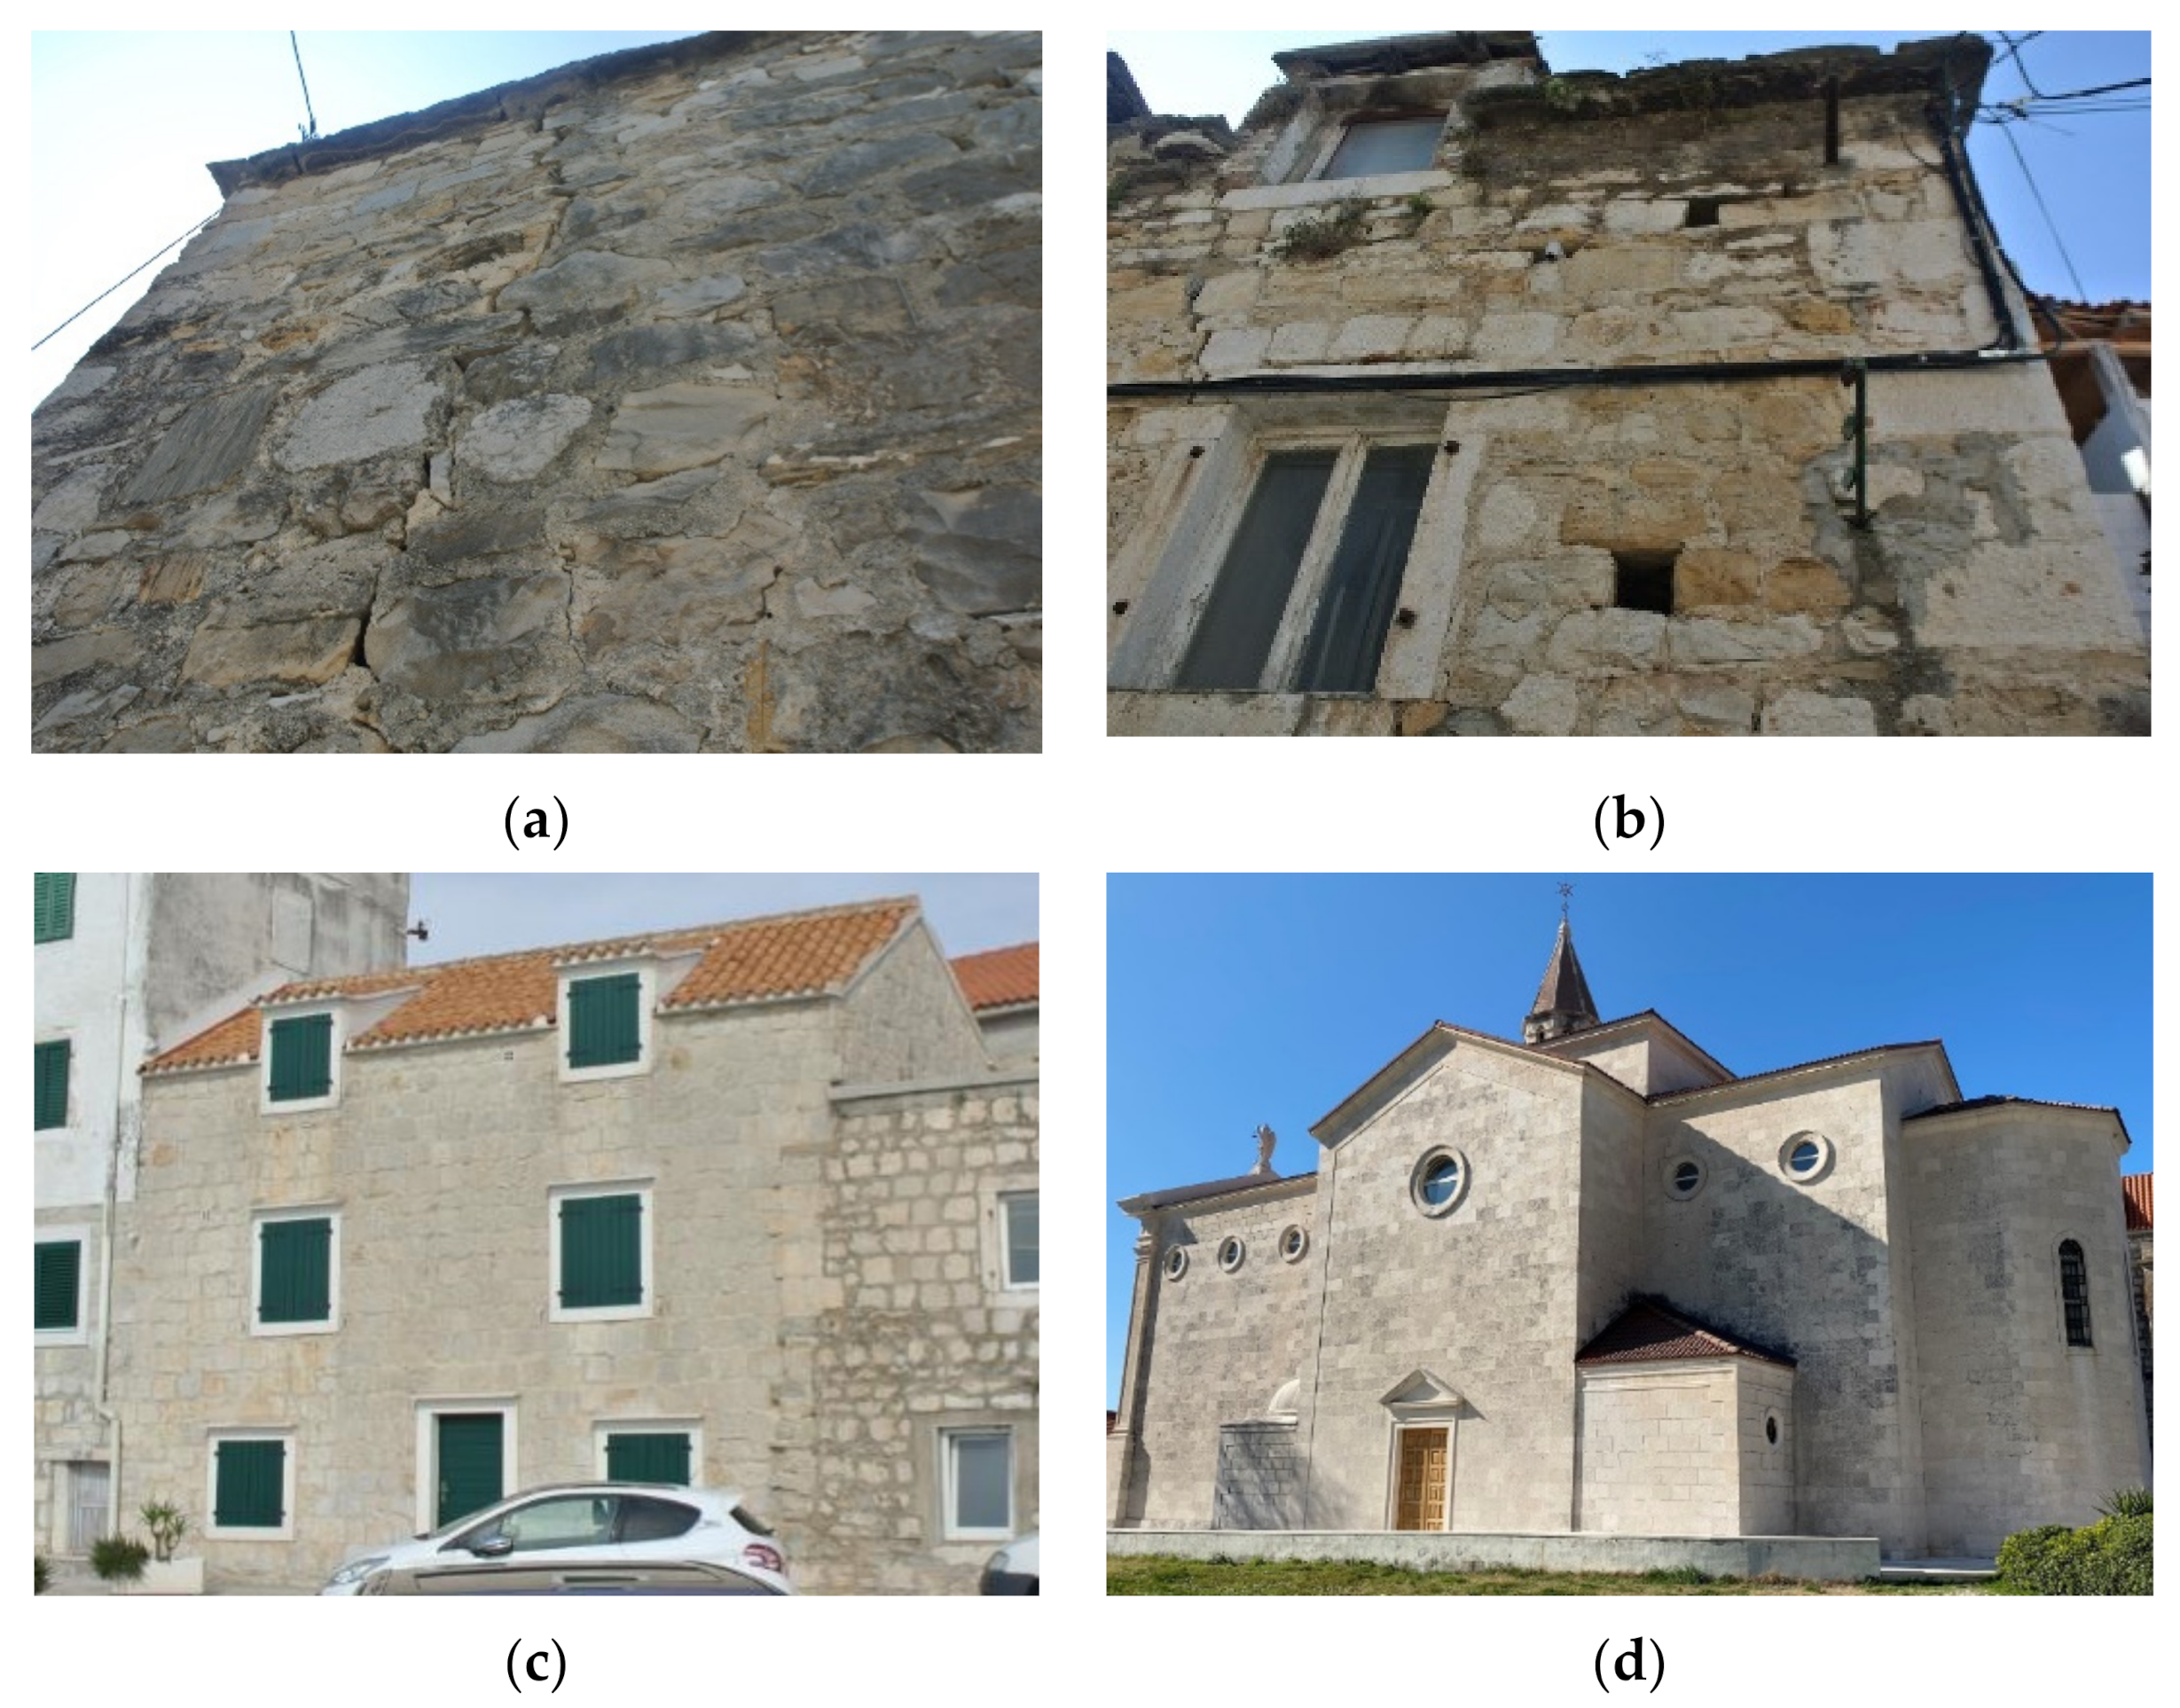
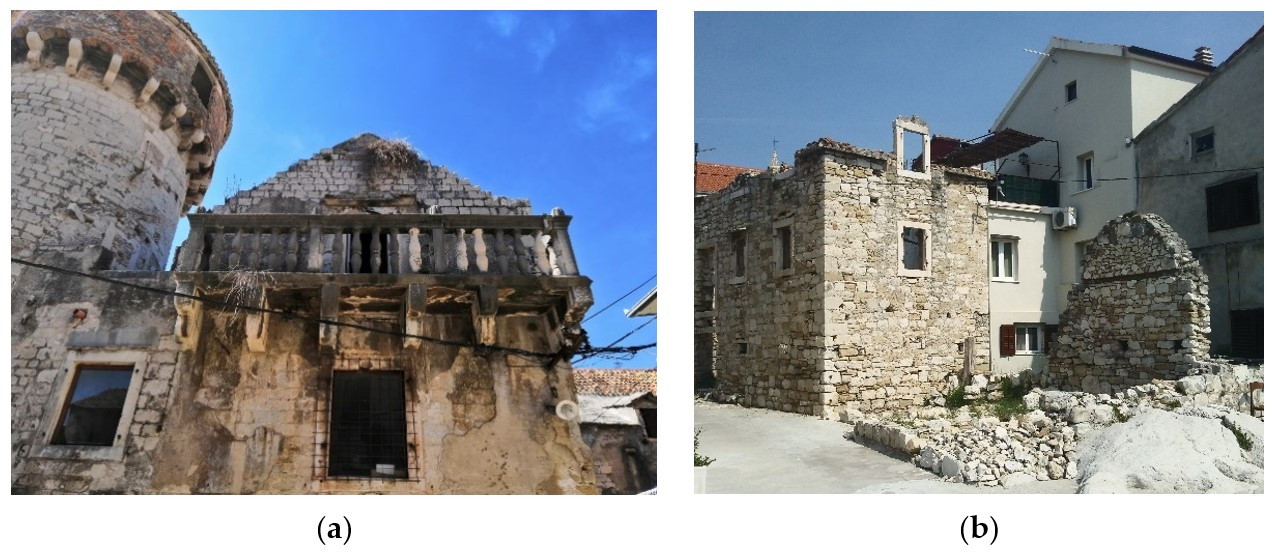
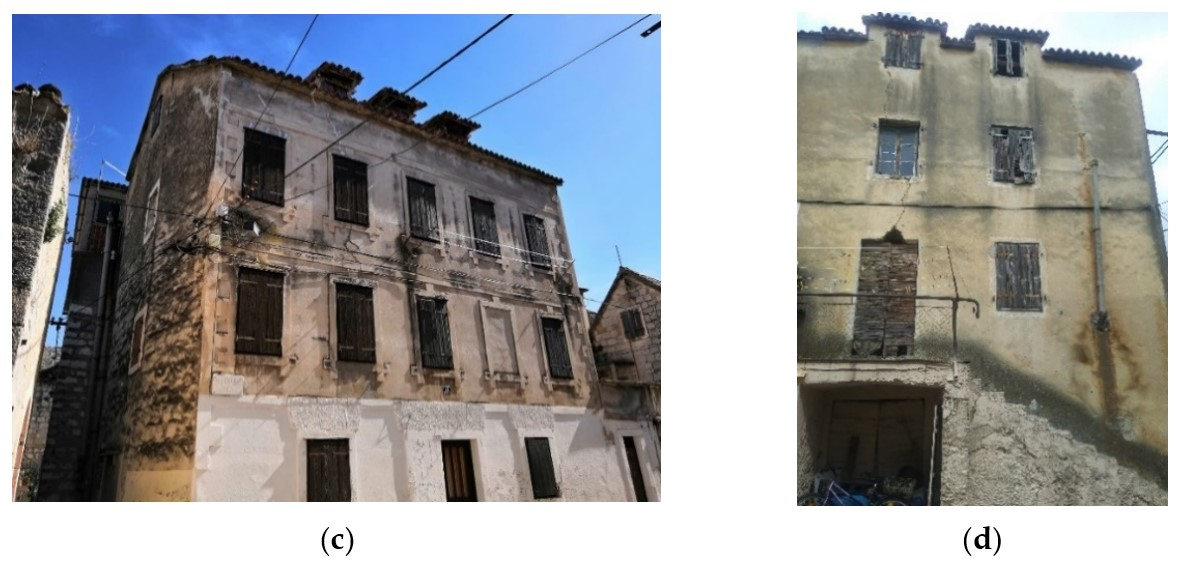
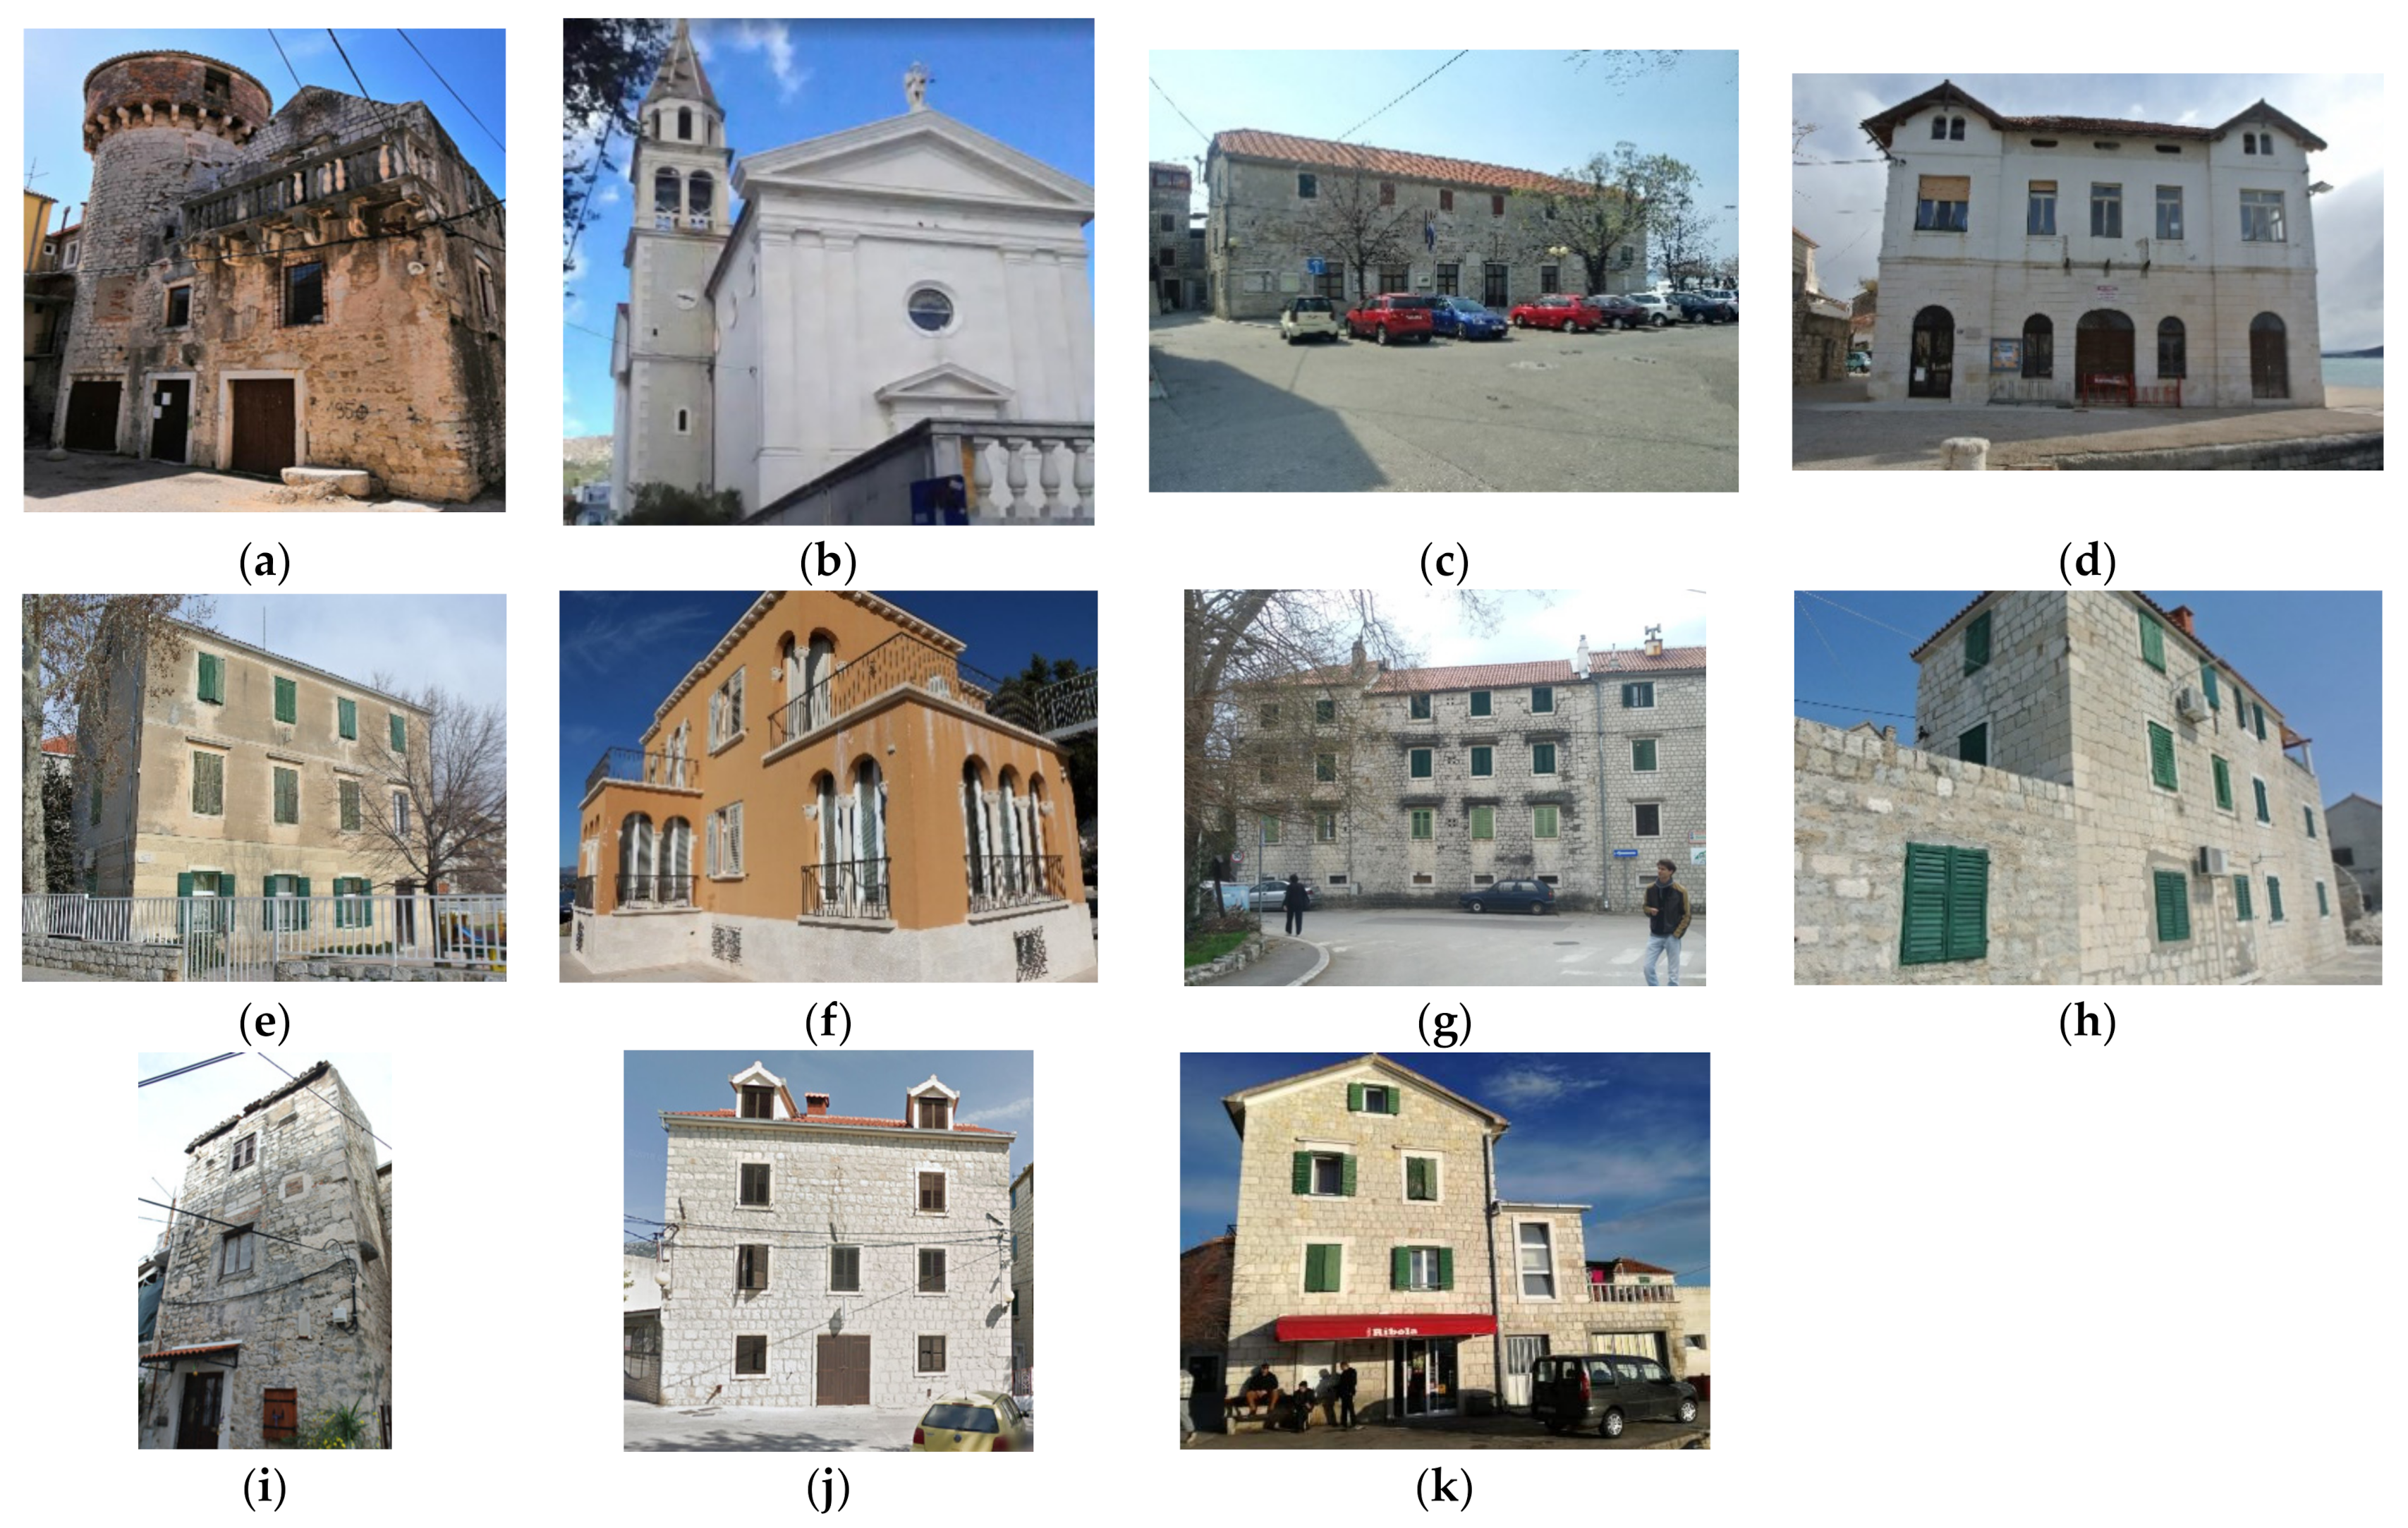
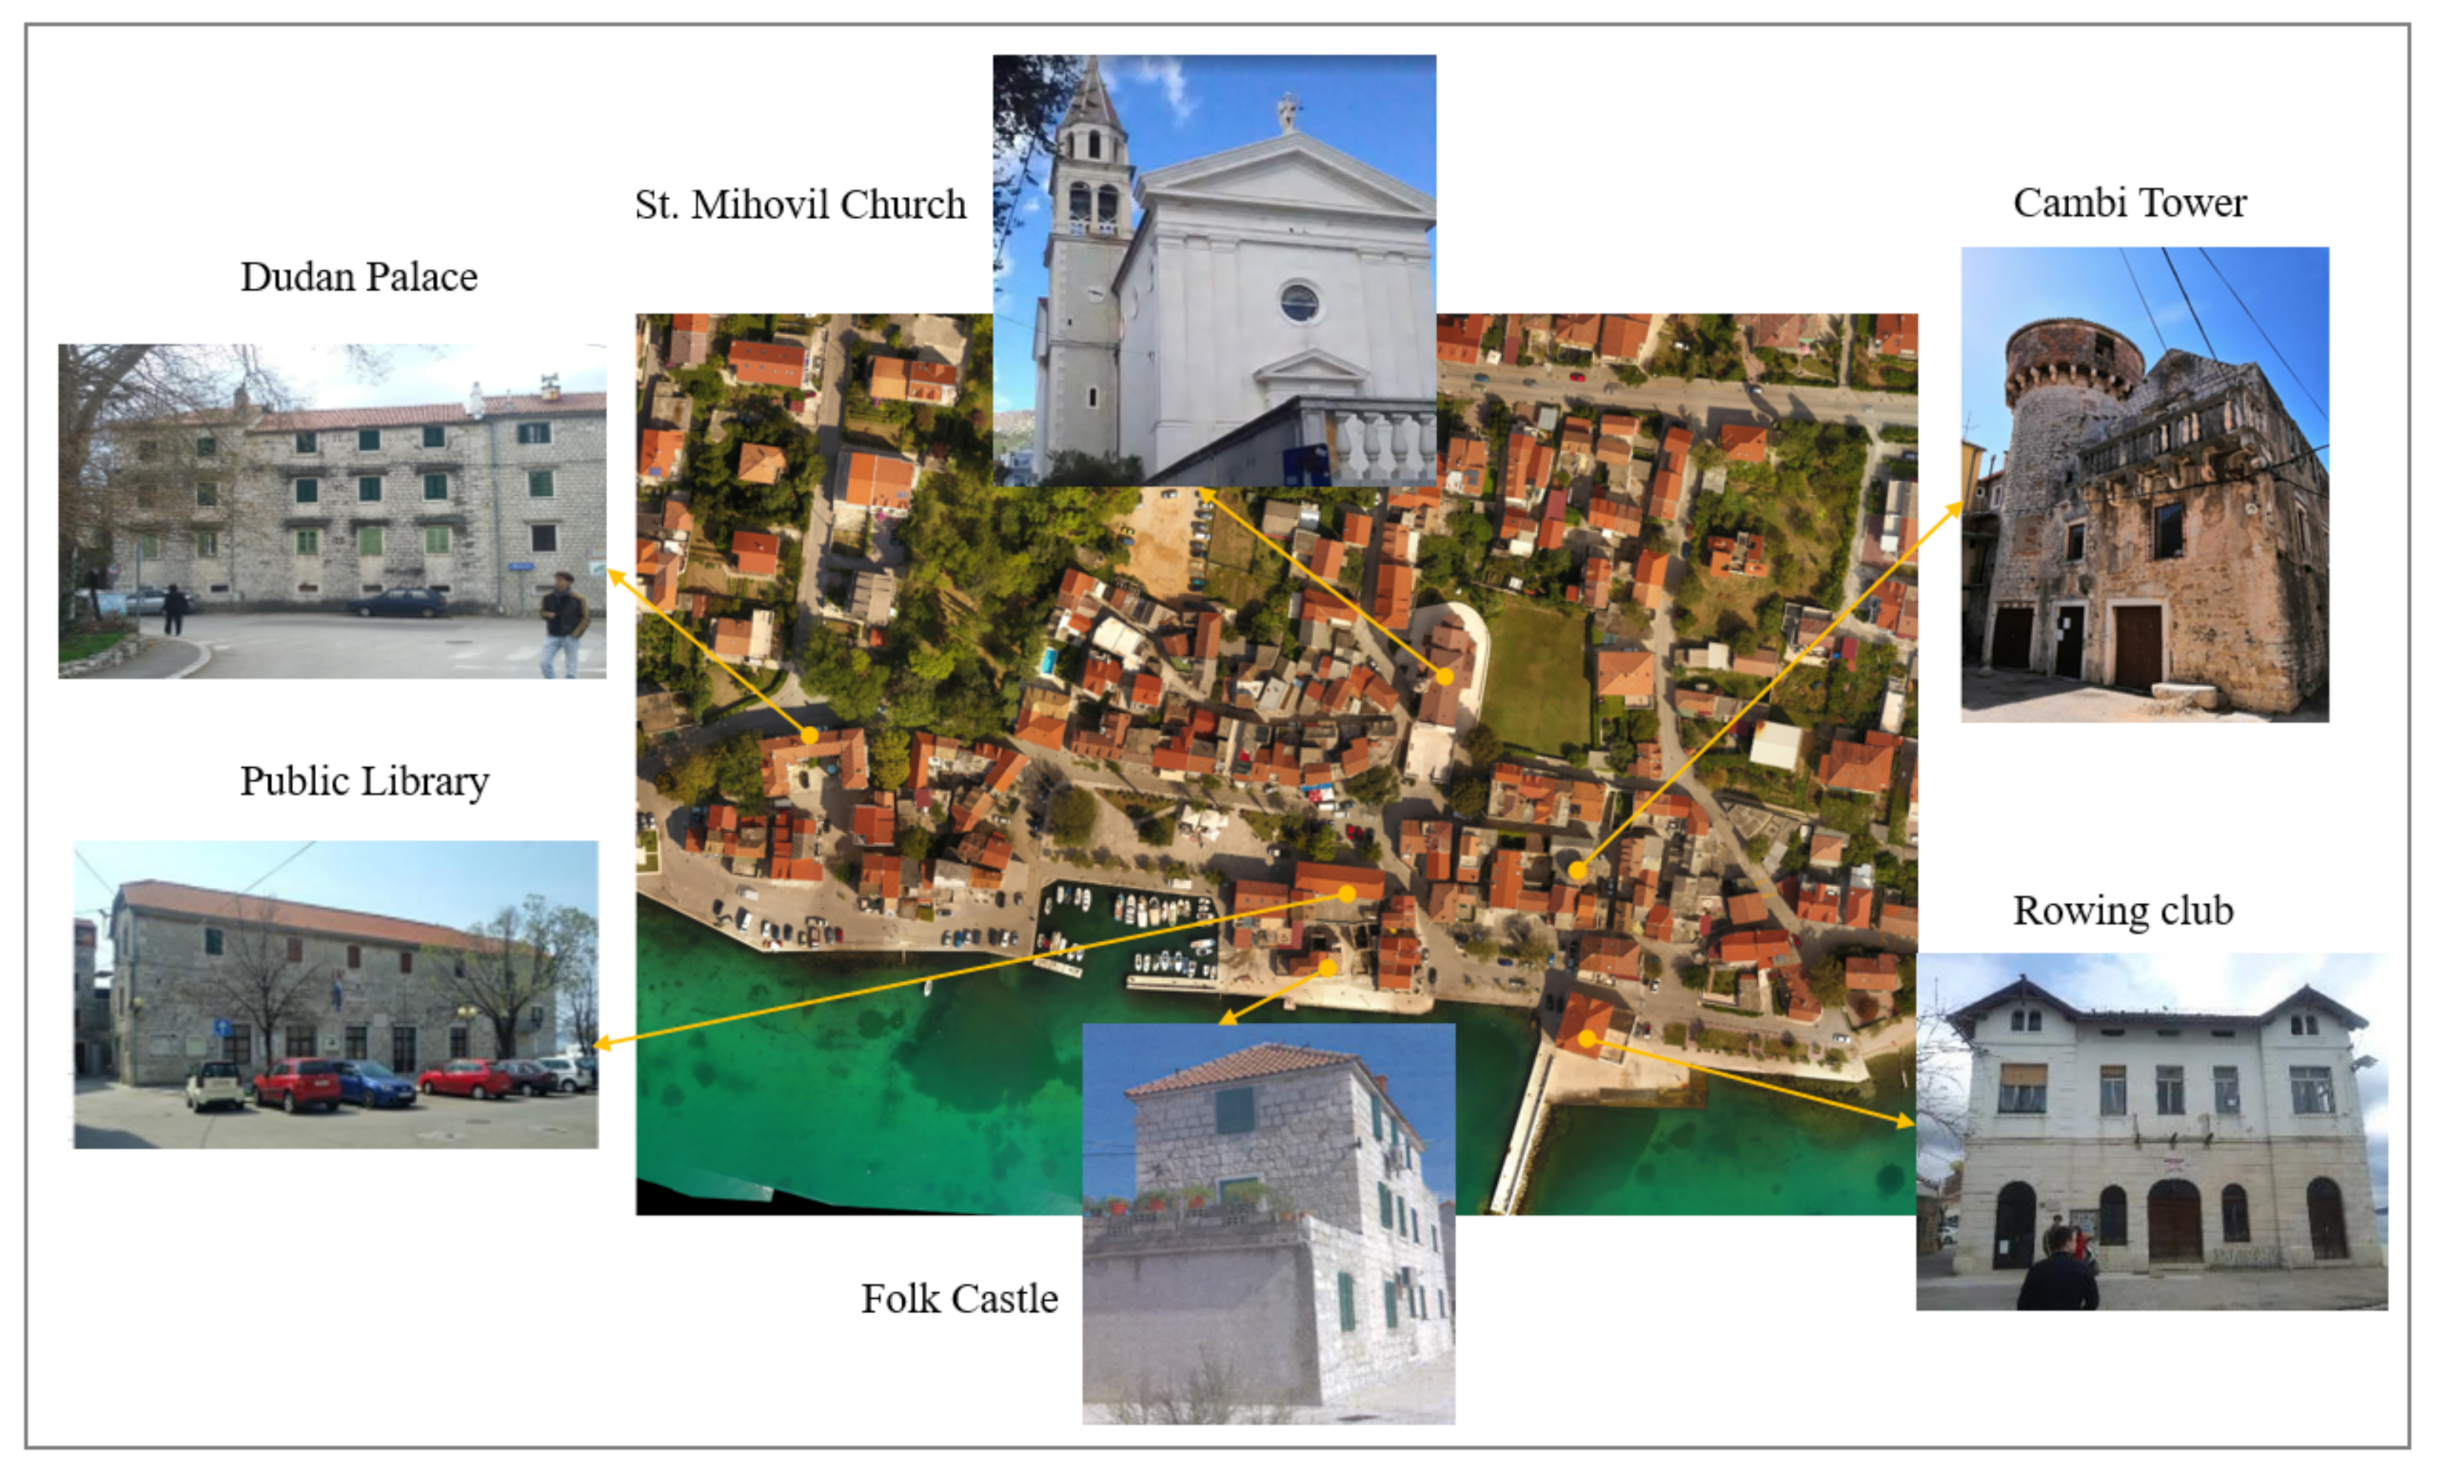
2.1. Description of the Test Site
2.2. Collection of the Geometrical, Material, and Structural Data
- Investigation of the buildings using historical documentation [40] and archival documentation of the town of Kaštela;
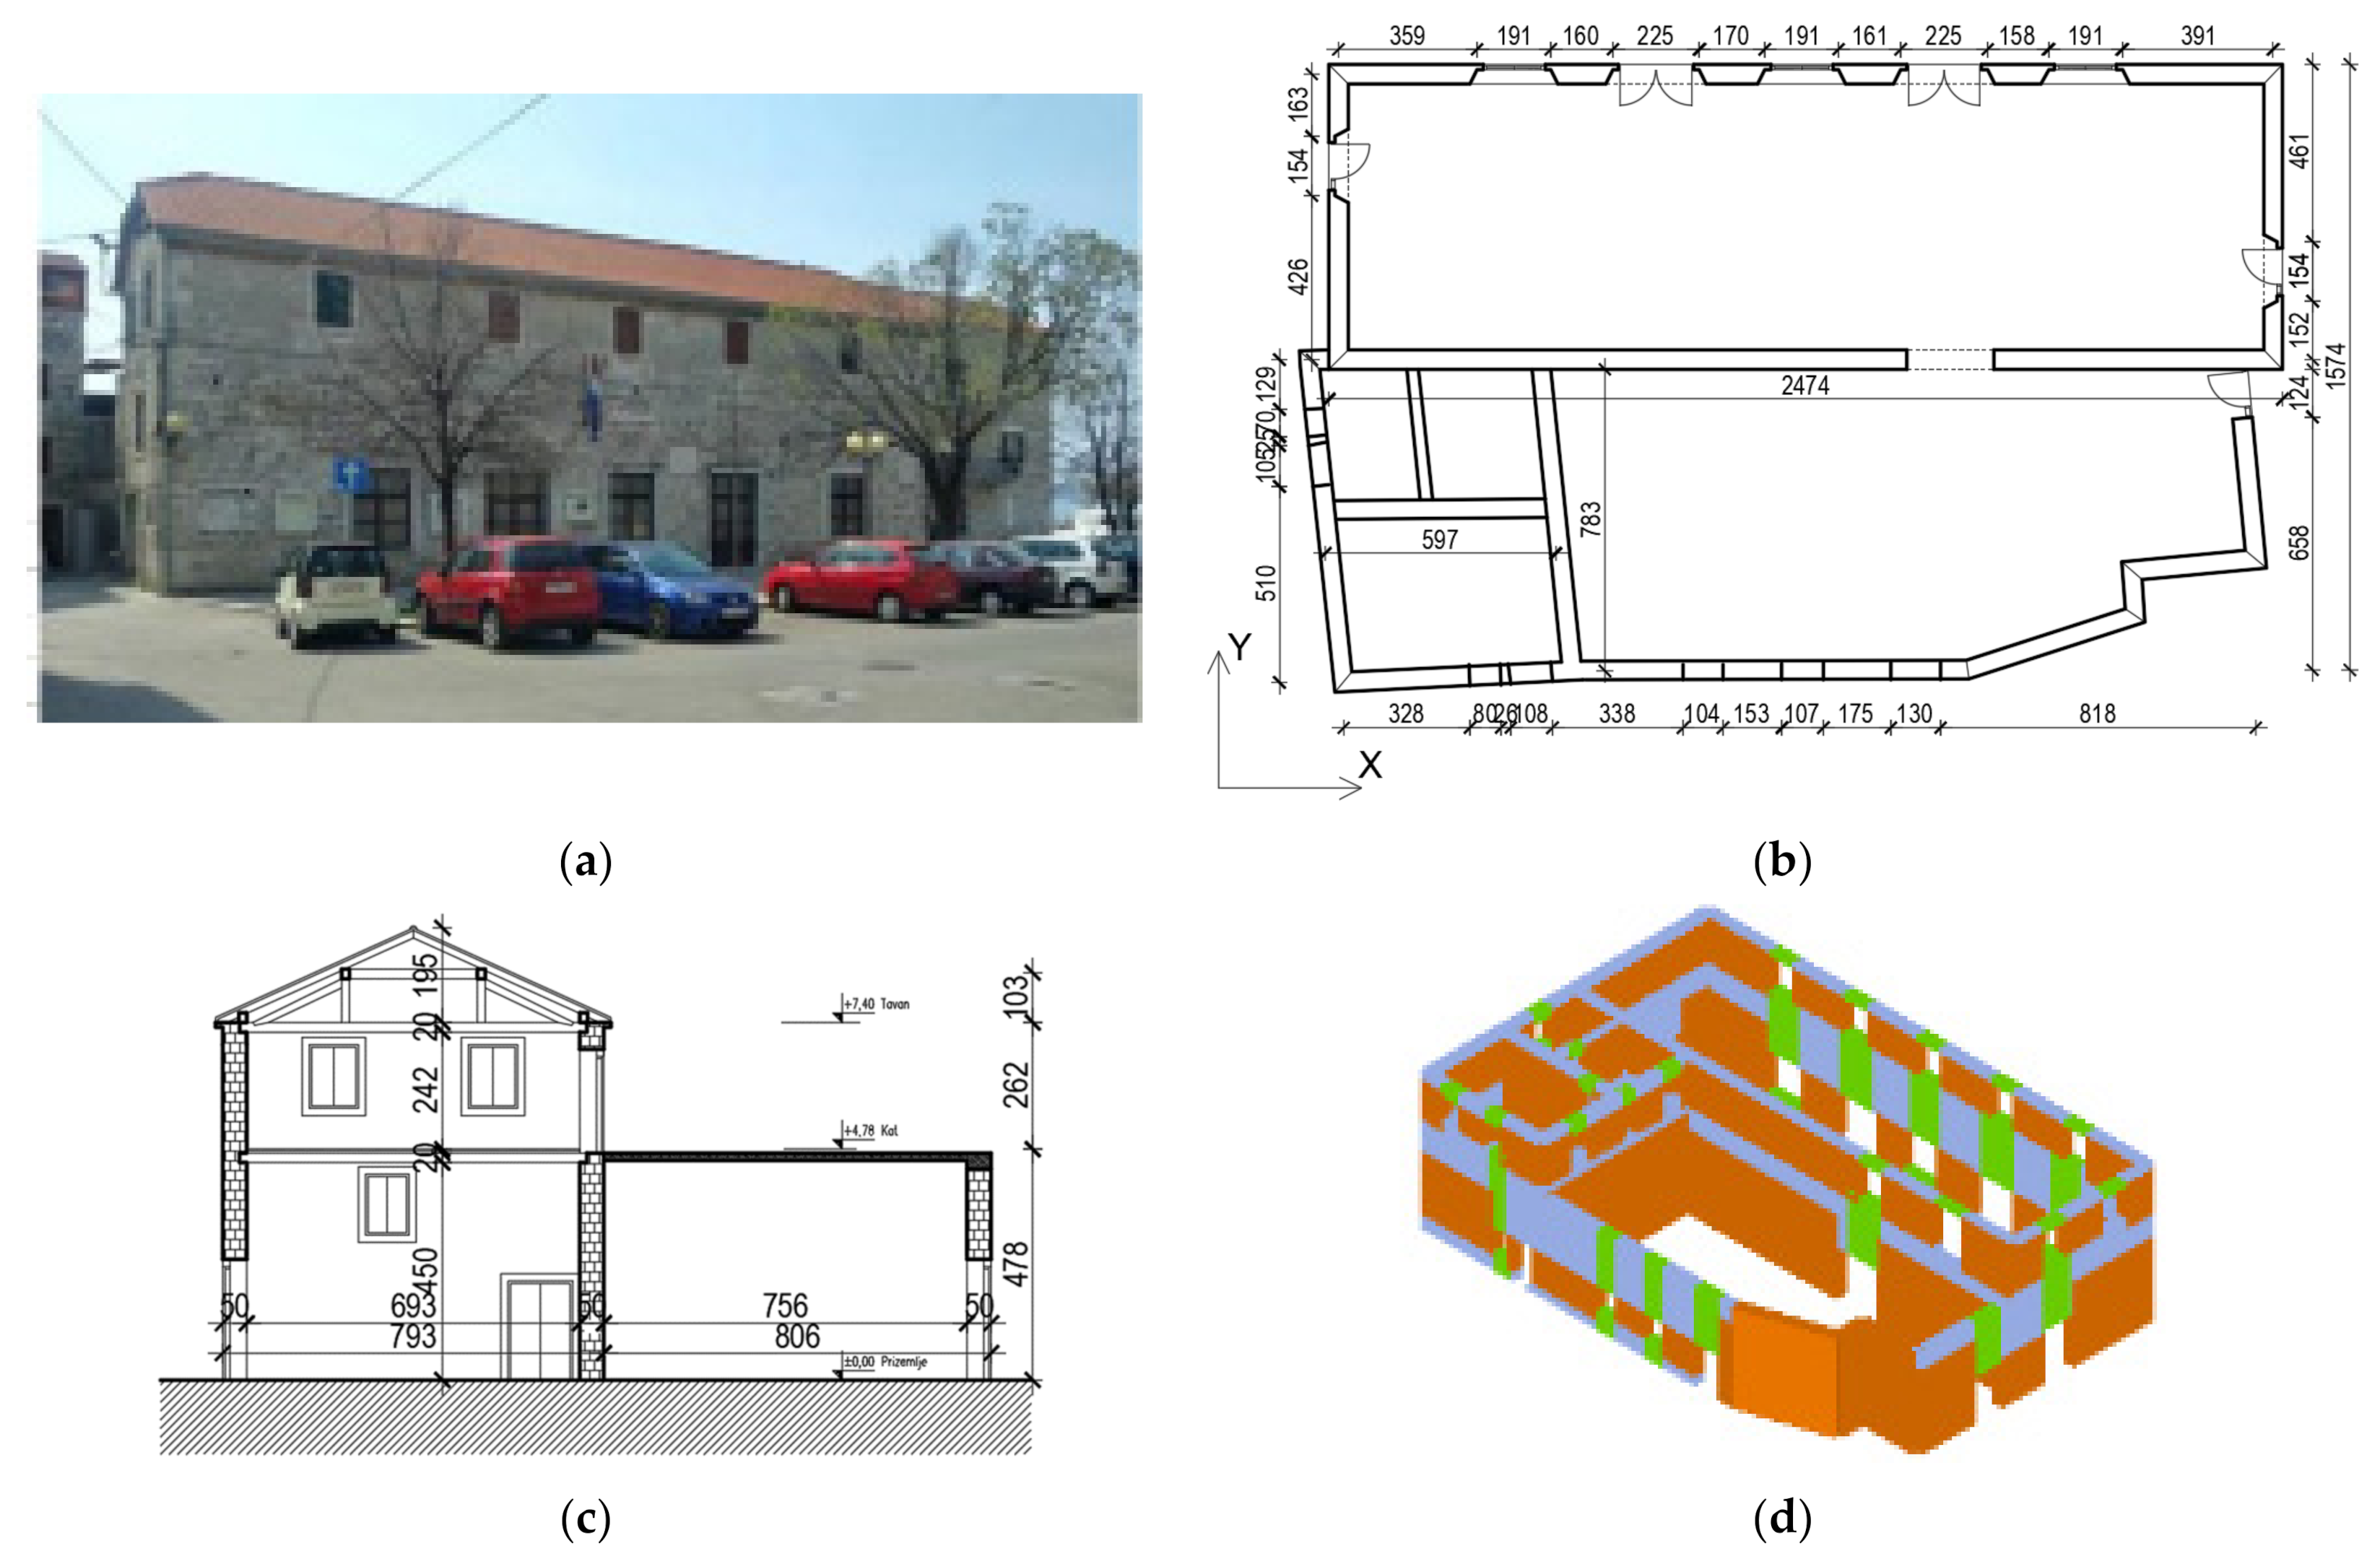
- Detailed survey of geometrical characteristics, architectural measurements, and creation of architectural drawings (floor plans and cross sections);
- Identification of structural systems and materials through visual inspection, using archive documentation, literature, and thermographic imaging in the several specific cases where, due to non-documented reconstructions, it was not possible to recognize the material and structural characteristics of the buildings;
- Characterization of the soil type by means of a geophysical survey.
2.3. Seismic Vulnerability Assessment Using the Vulnerability Index Method
2.4. Seismicity of the Area
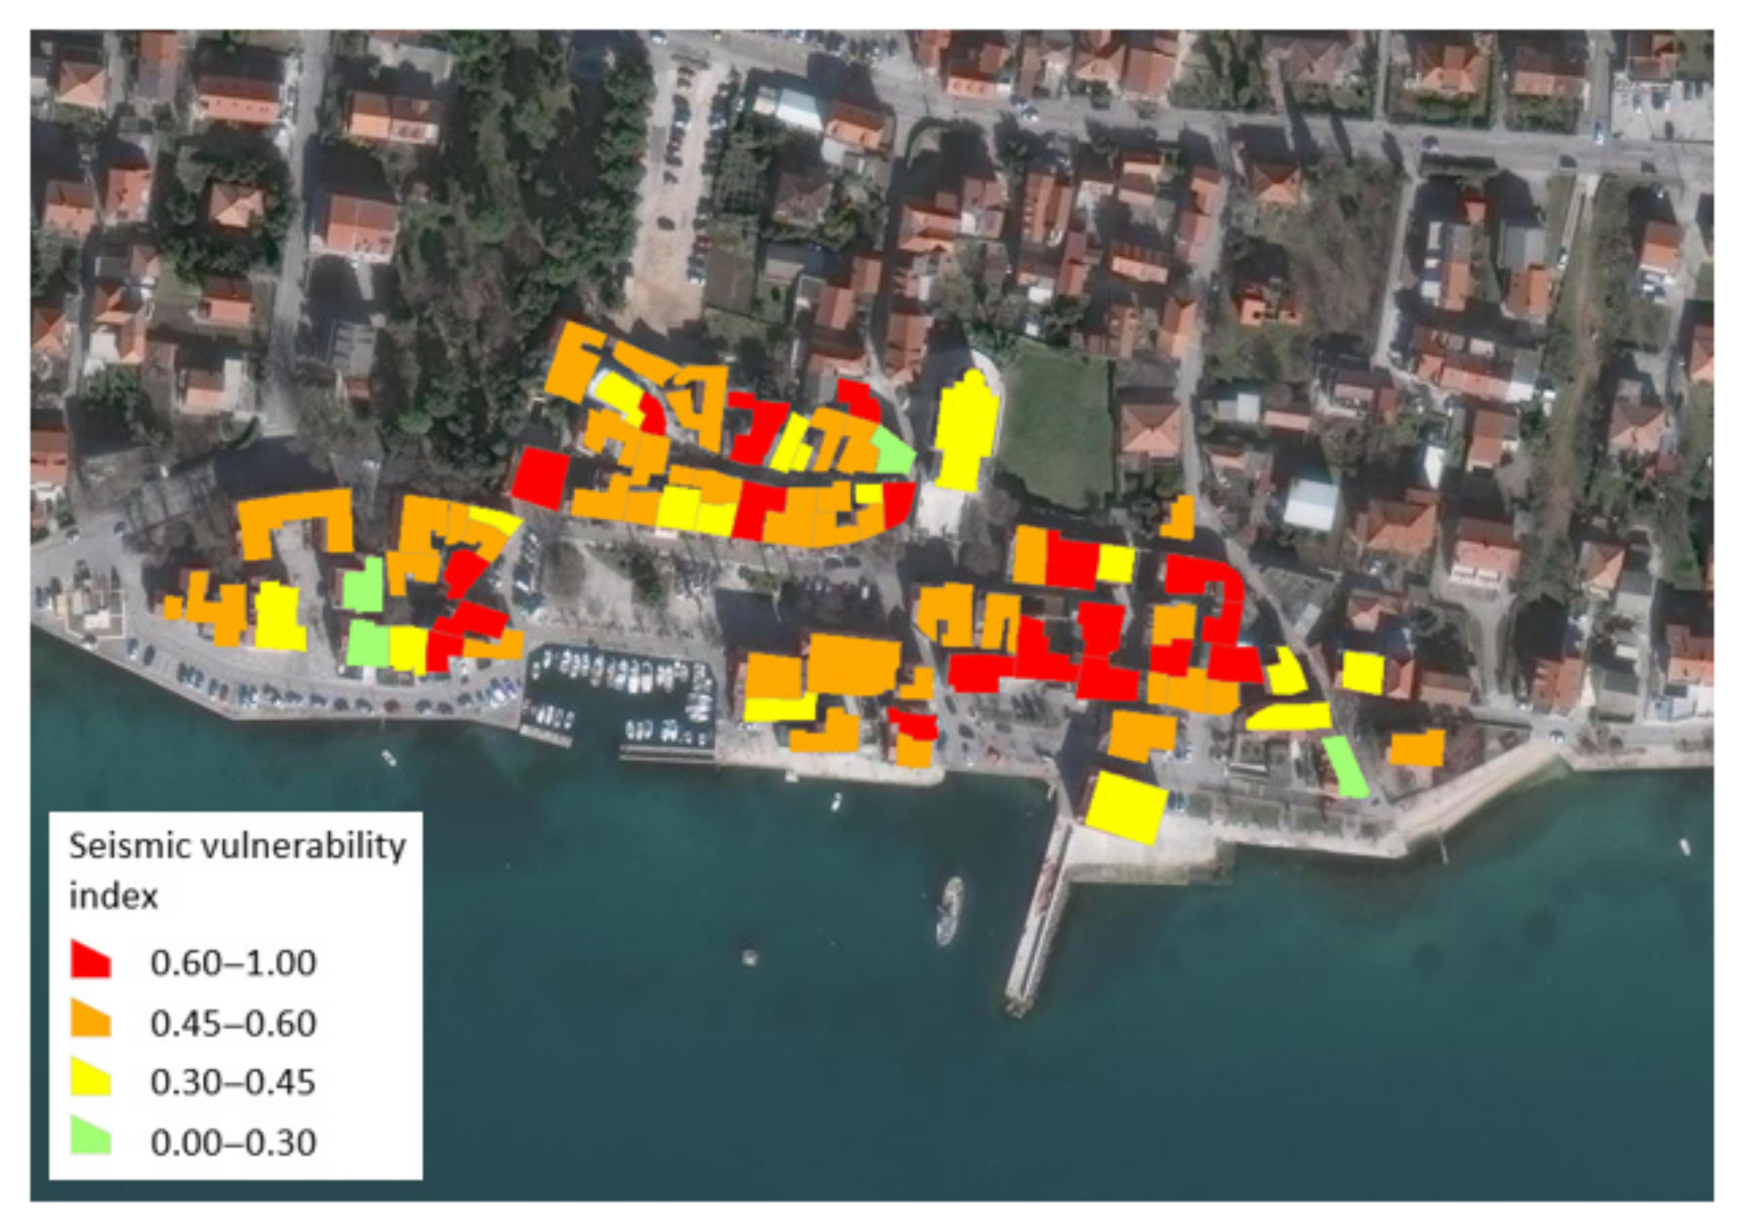
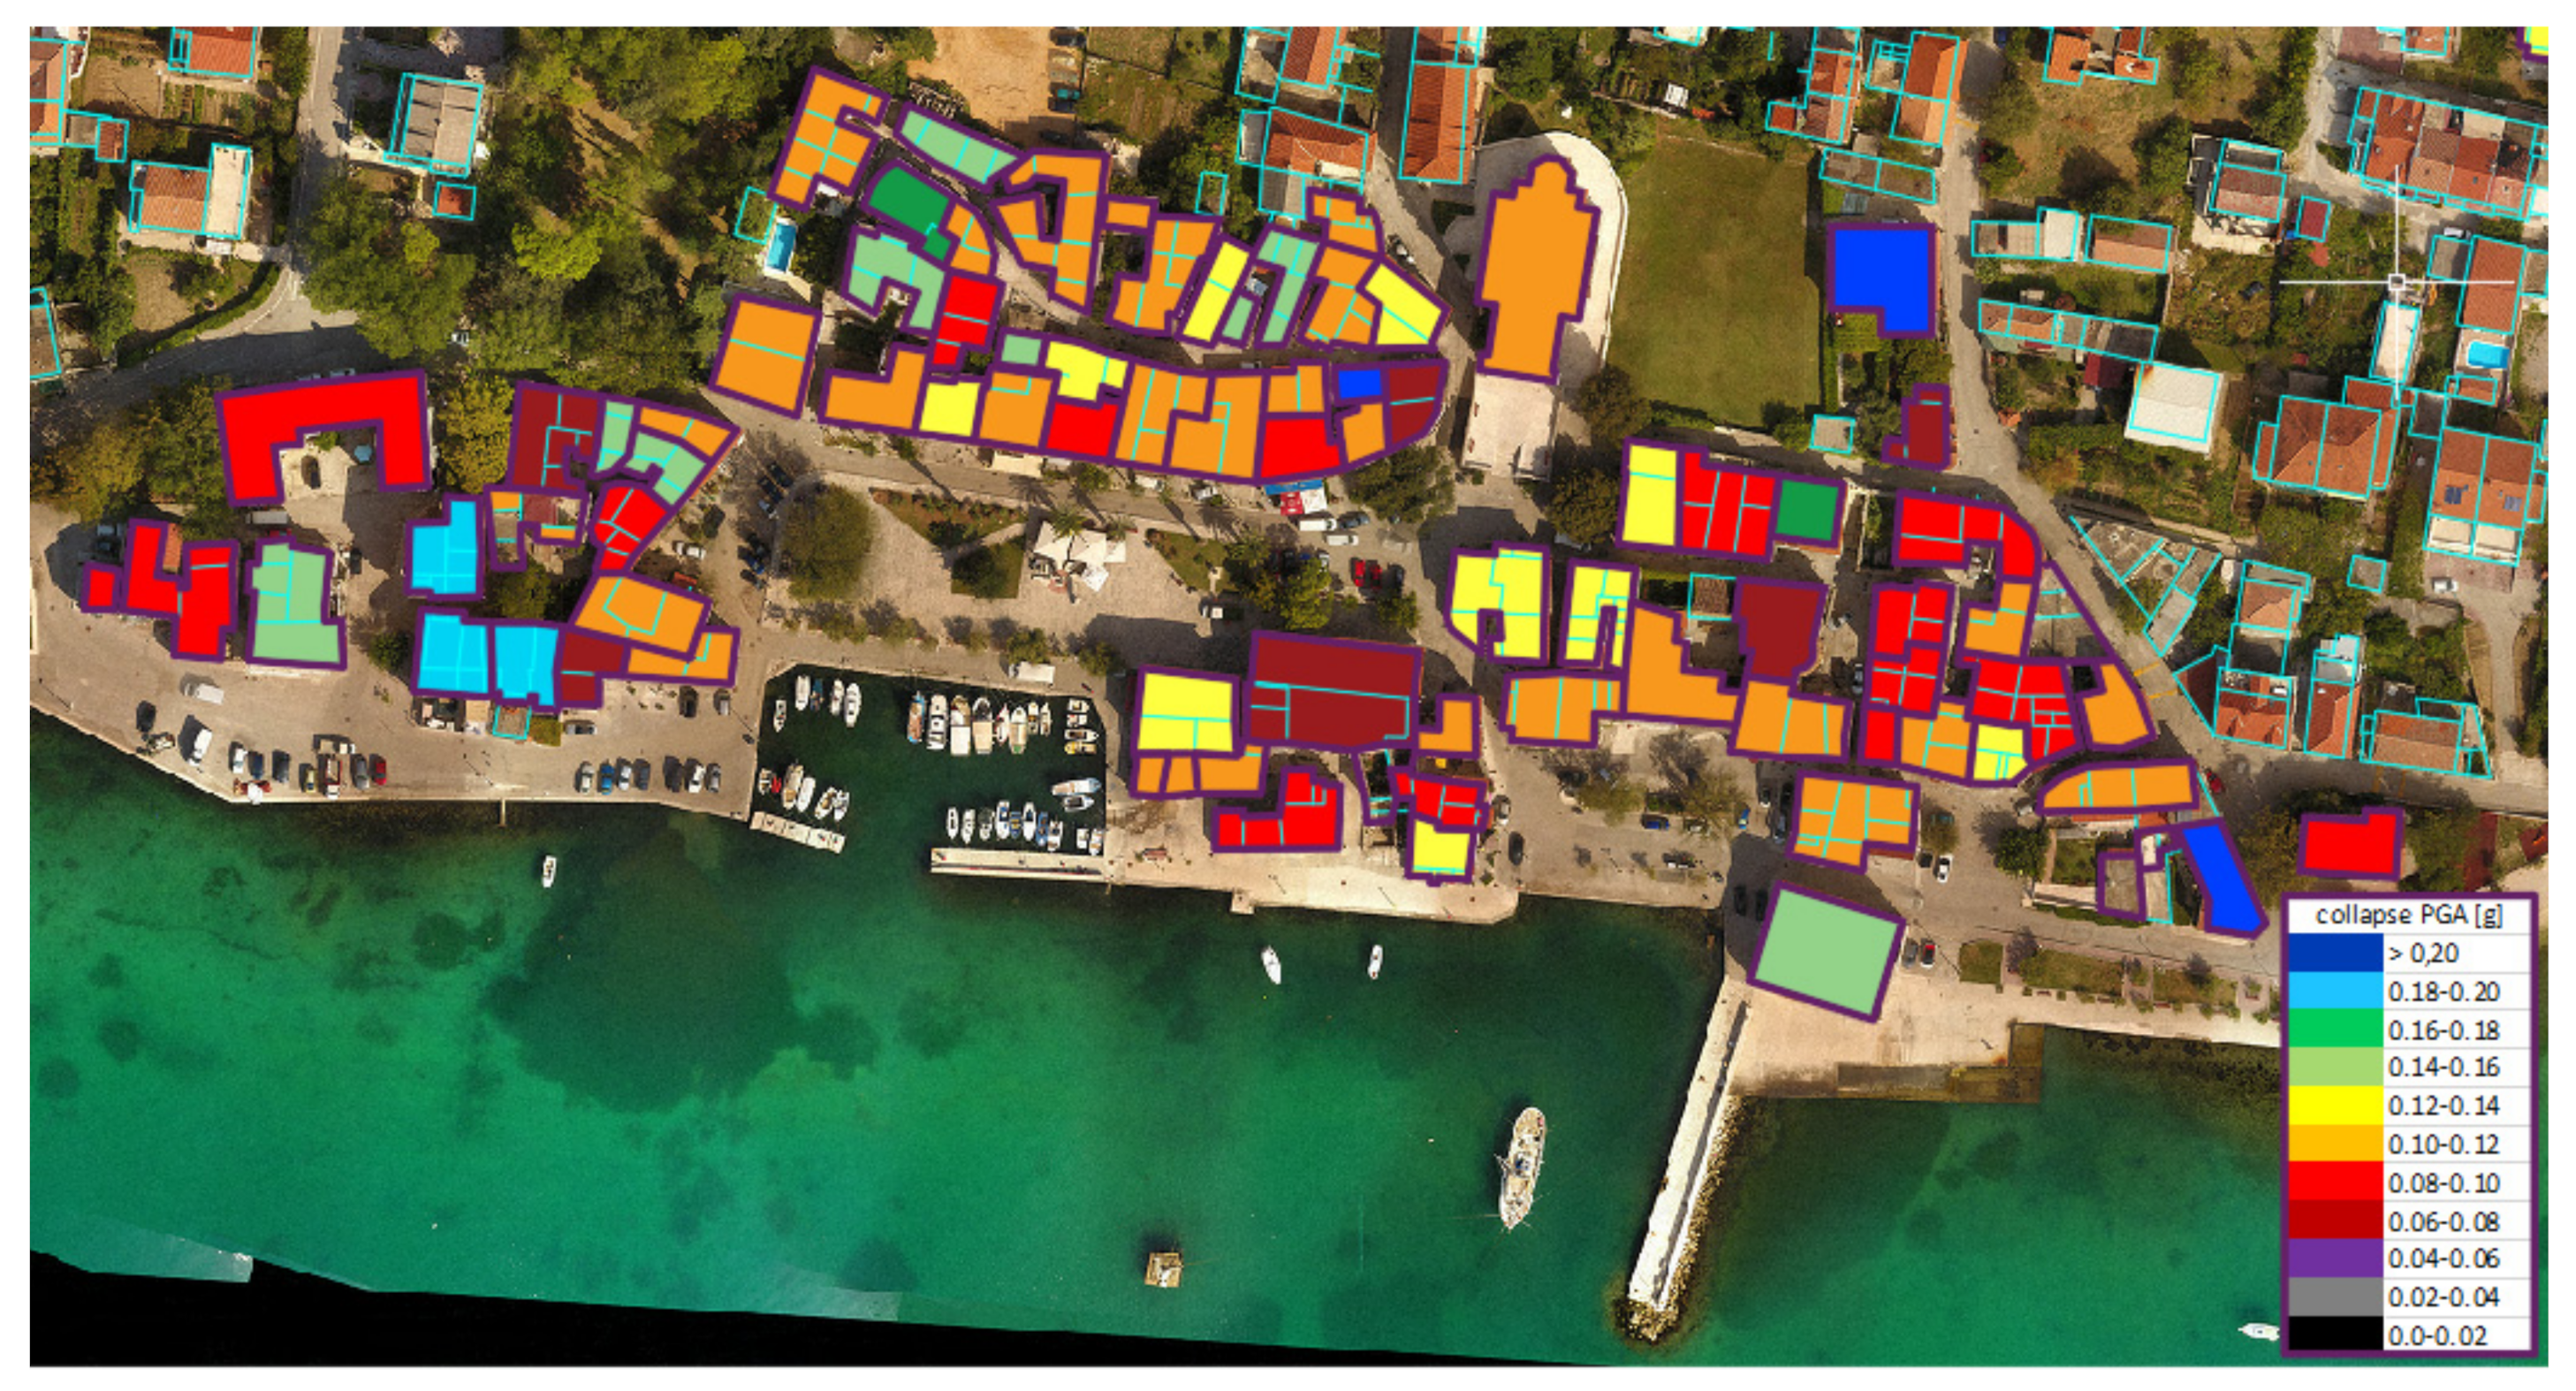
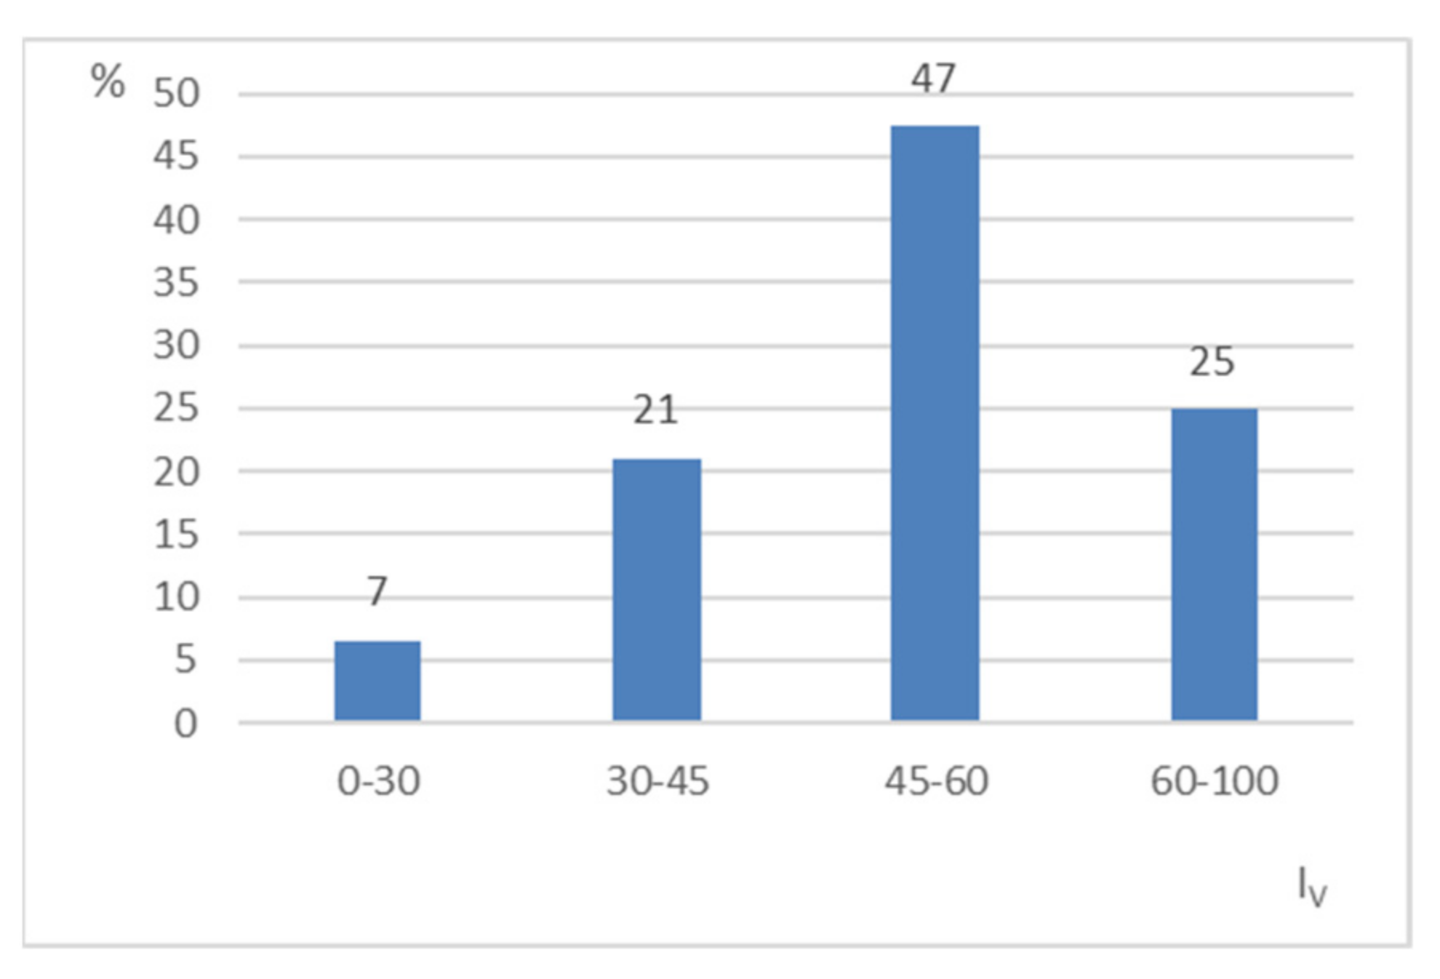
2.5. Vulnerability Index Results
Historical Core
3. Development and Calibration of Vulnerability Model
3.1. Vulnerability Model
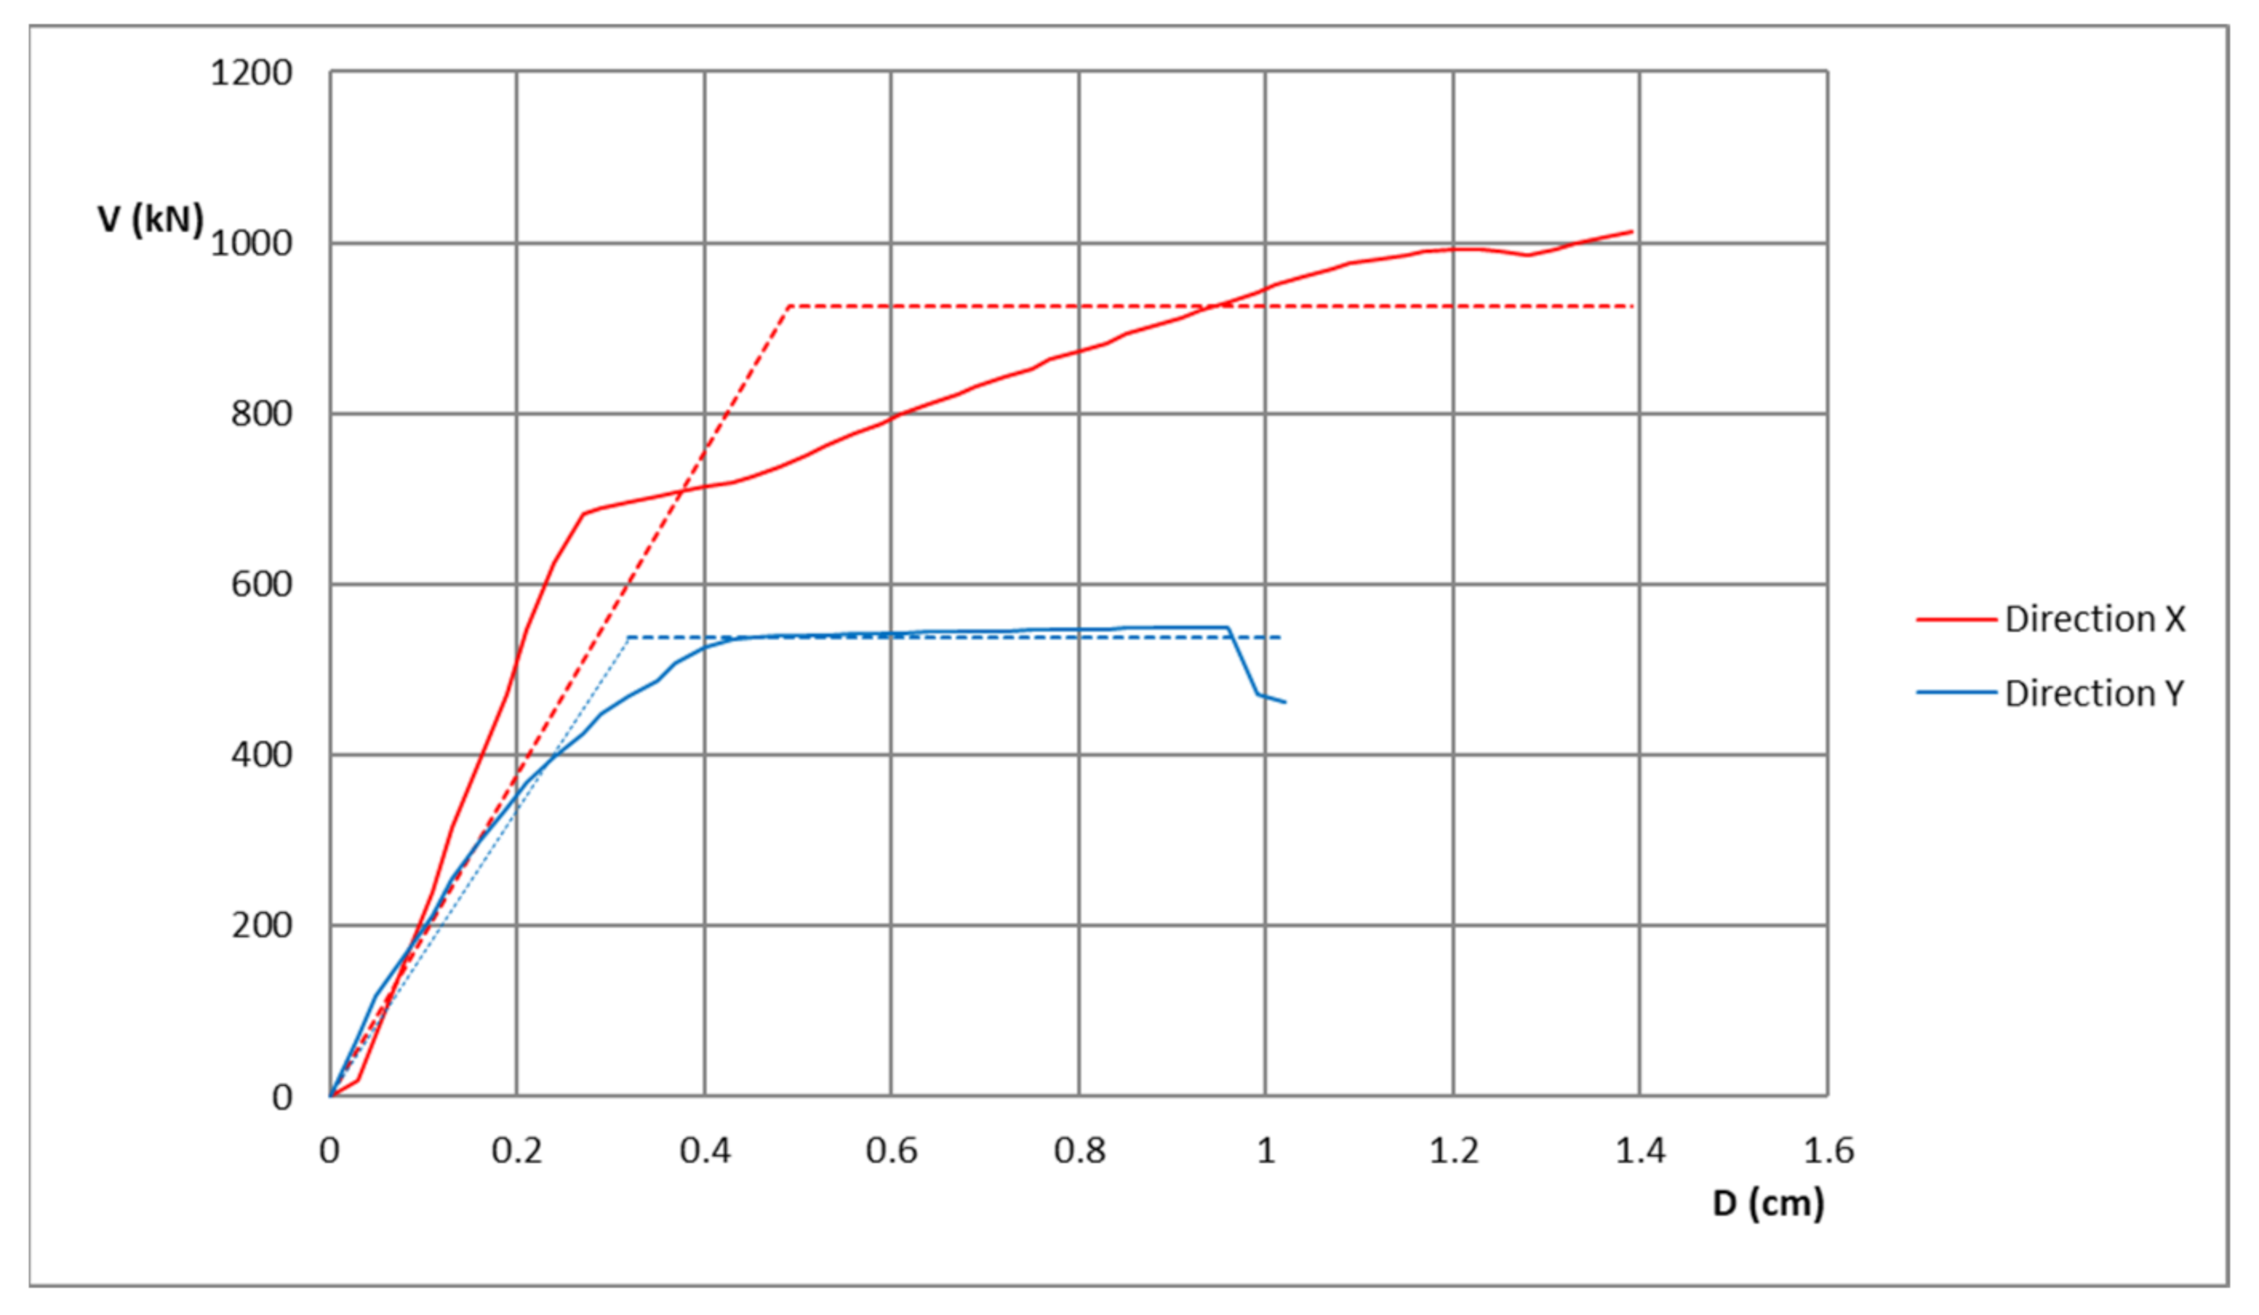
3.2. Static-Nonlinear Pushover Analysis of Representative Buildings
4. Discussion
- Identification of architectural, structural, and material characteristics of the buildings through the investigation of historical and archival documentation, literature, visual inspection, and thermographic imaging;
- Characterization of the soil type through a geophysical survey;
- Calculation of seismic vulnerability indexes for all buildings in the area;
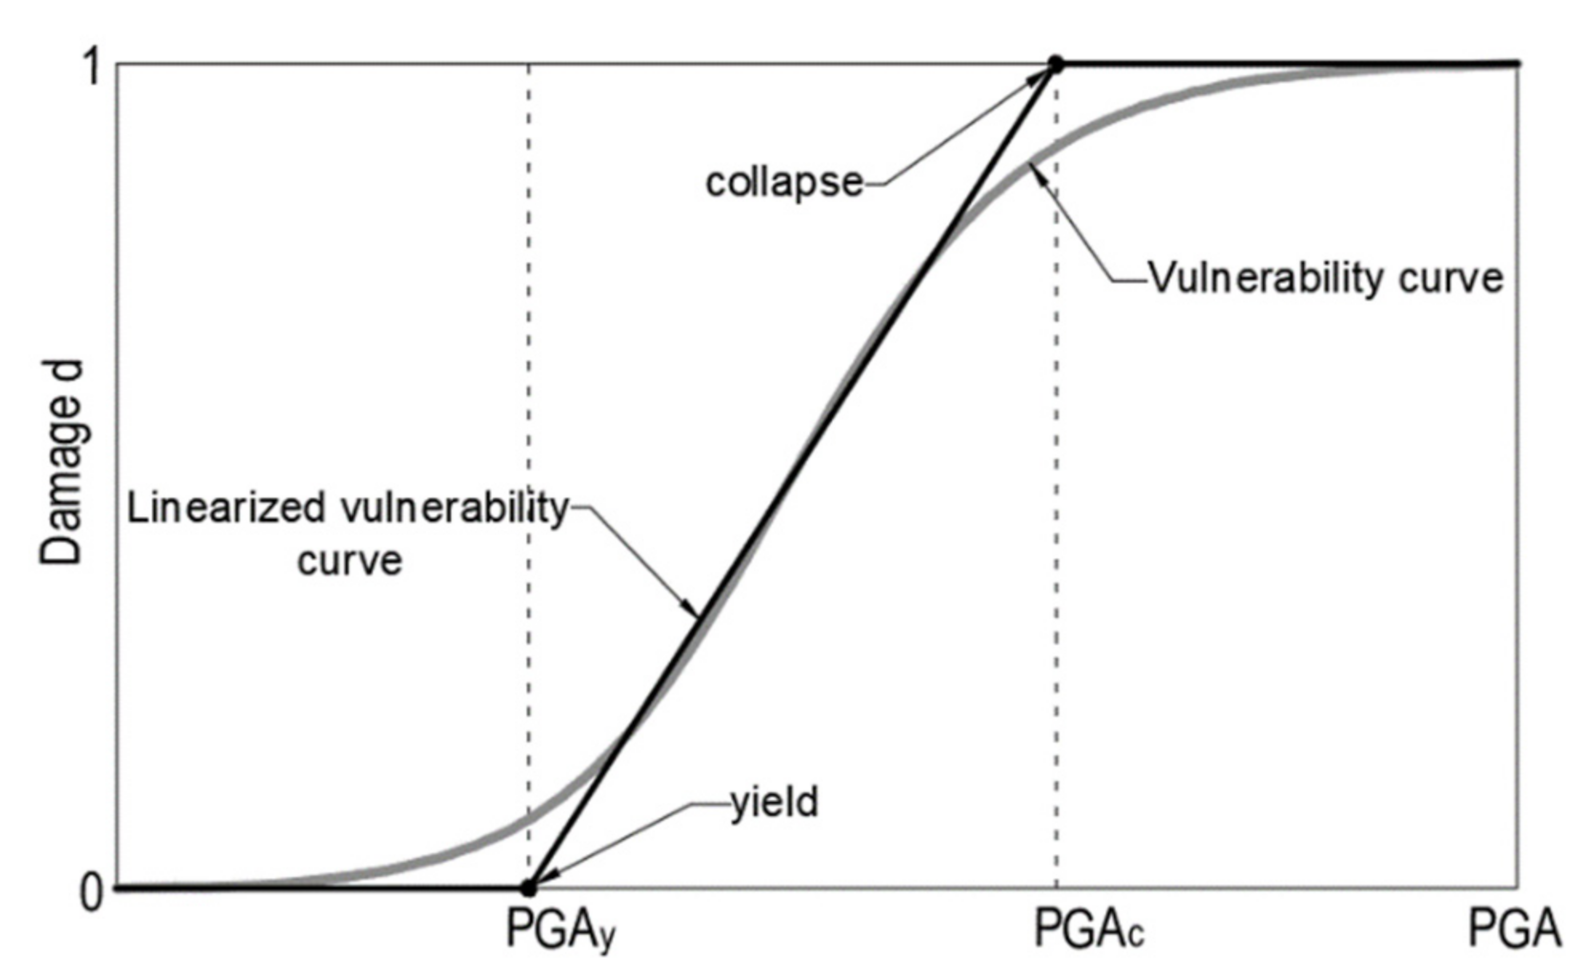
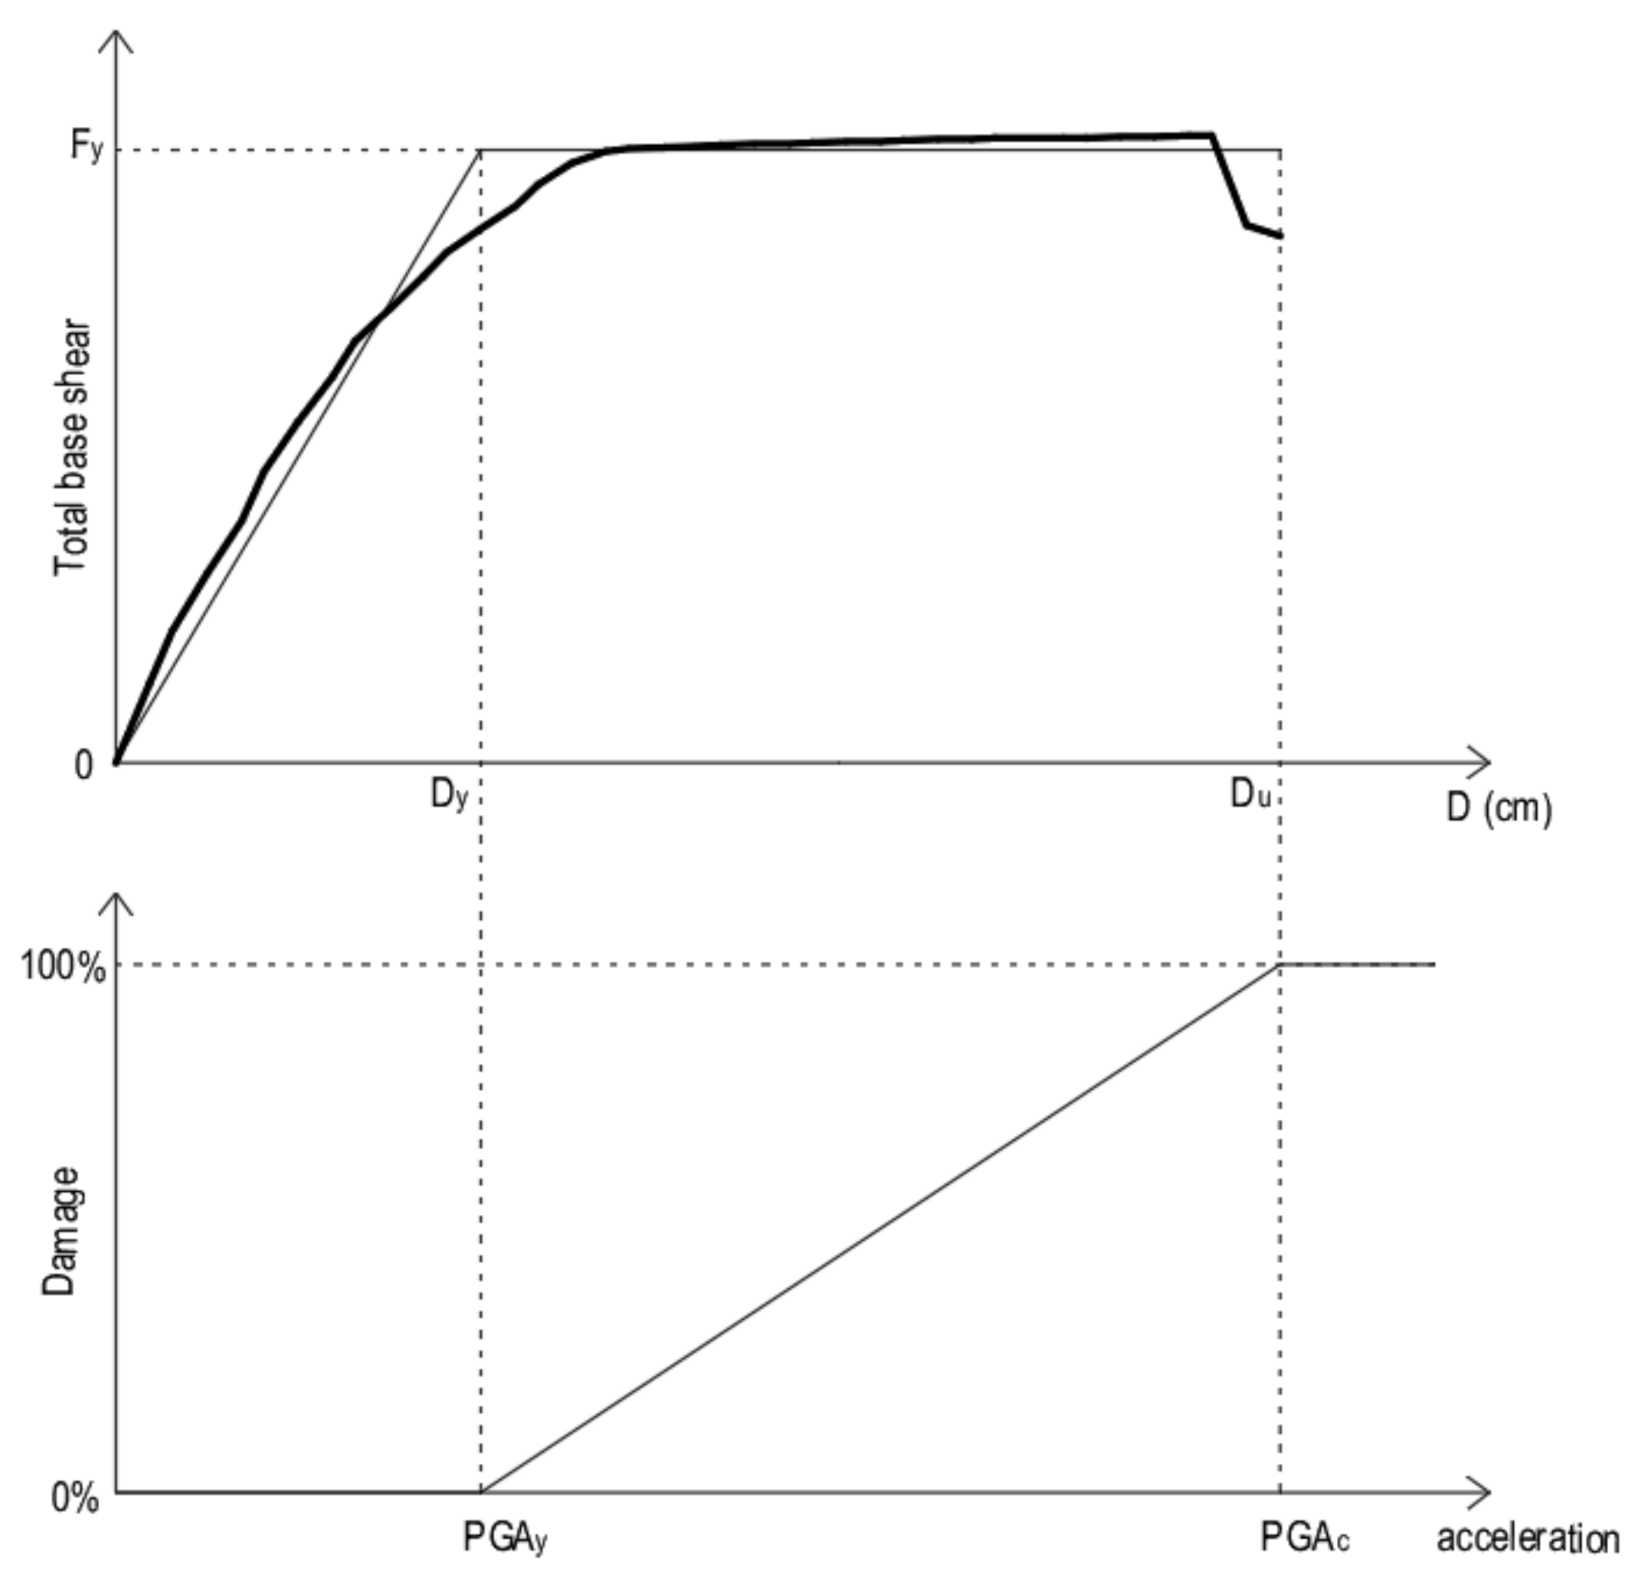
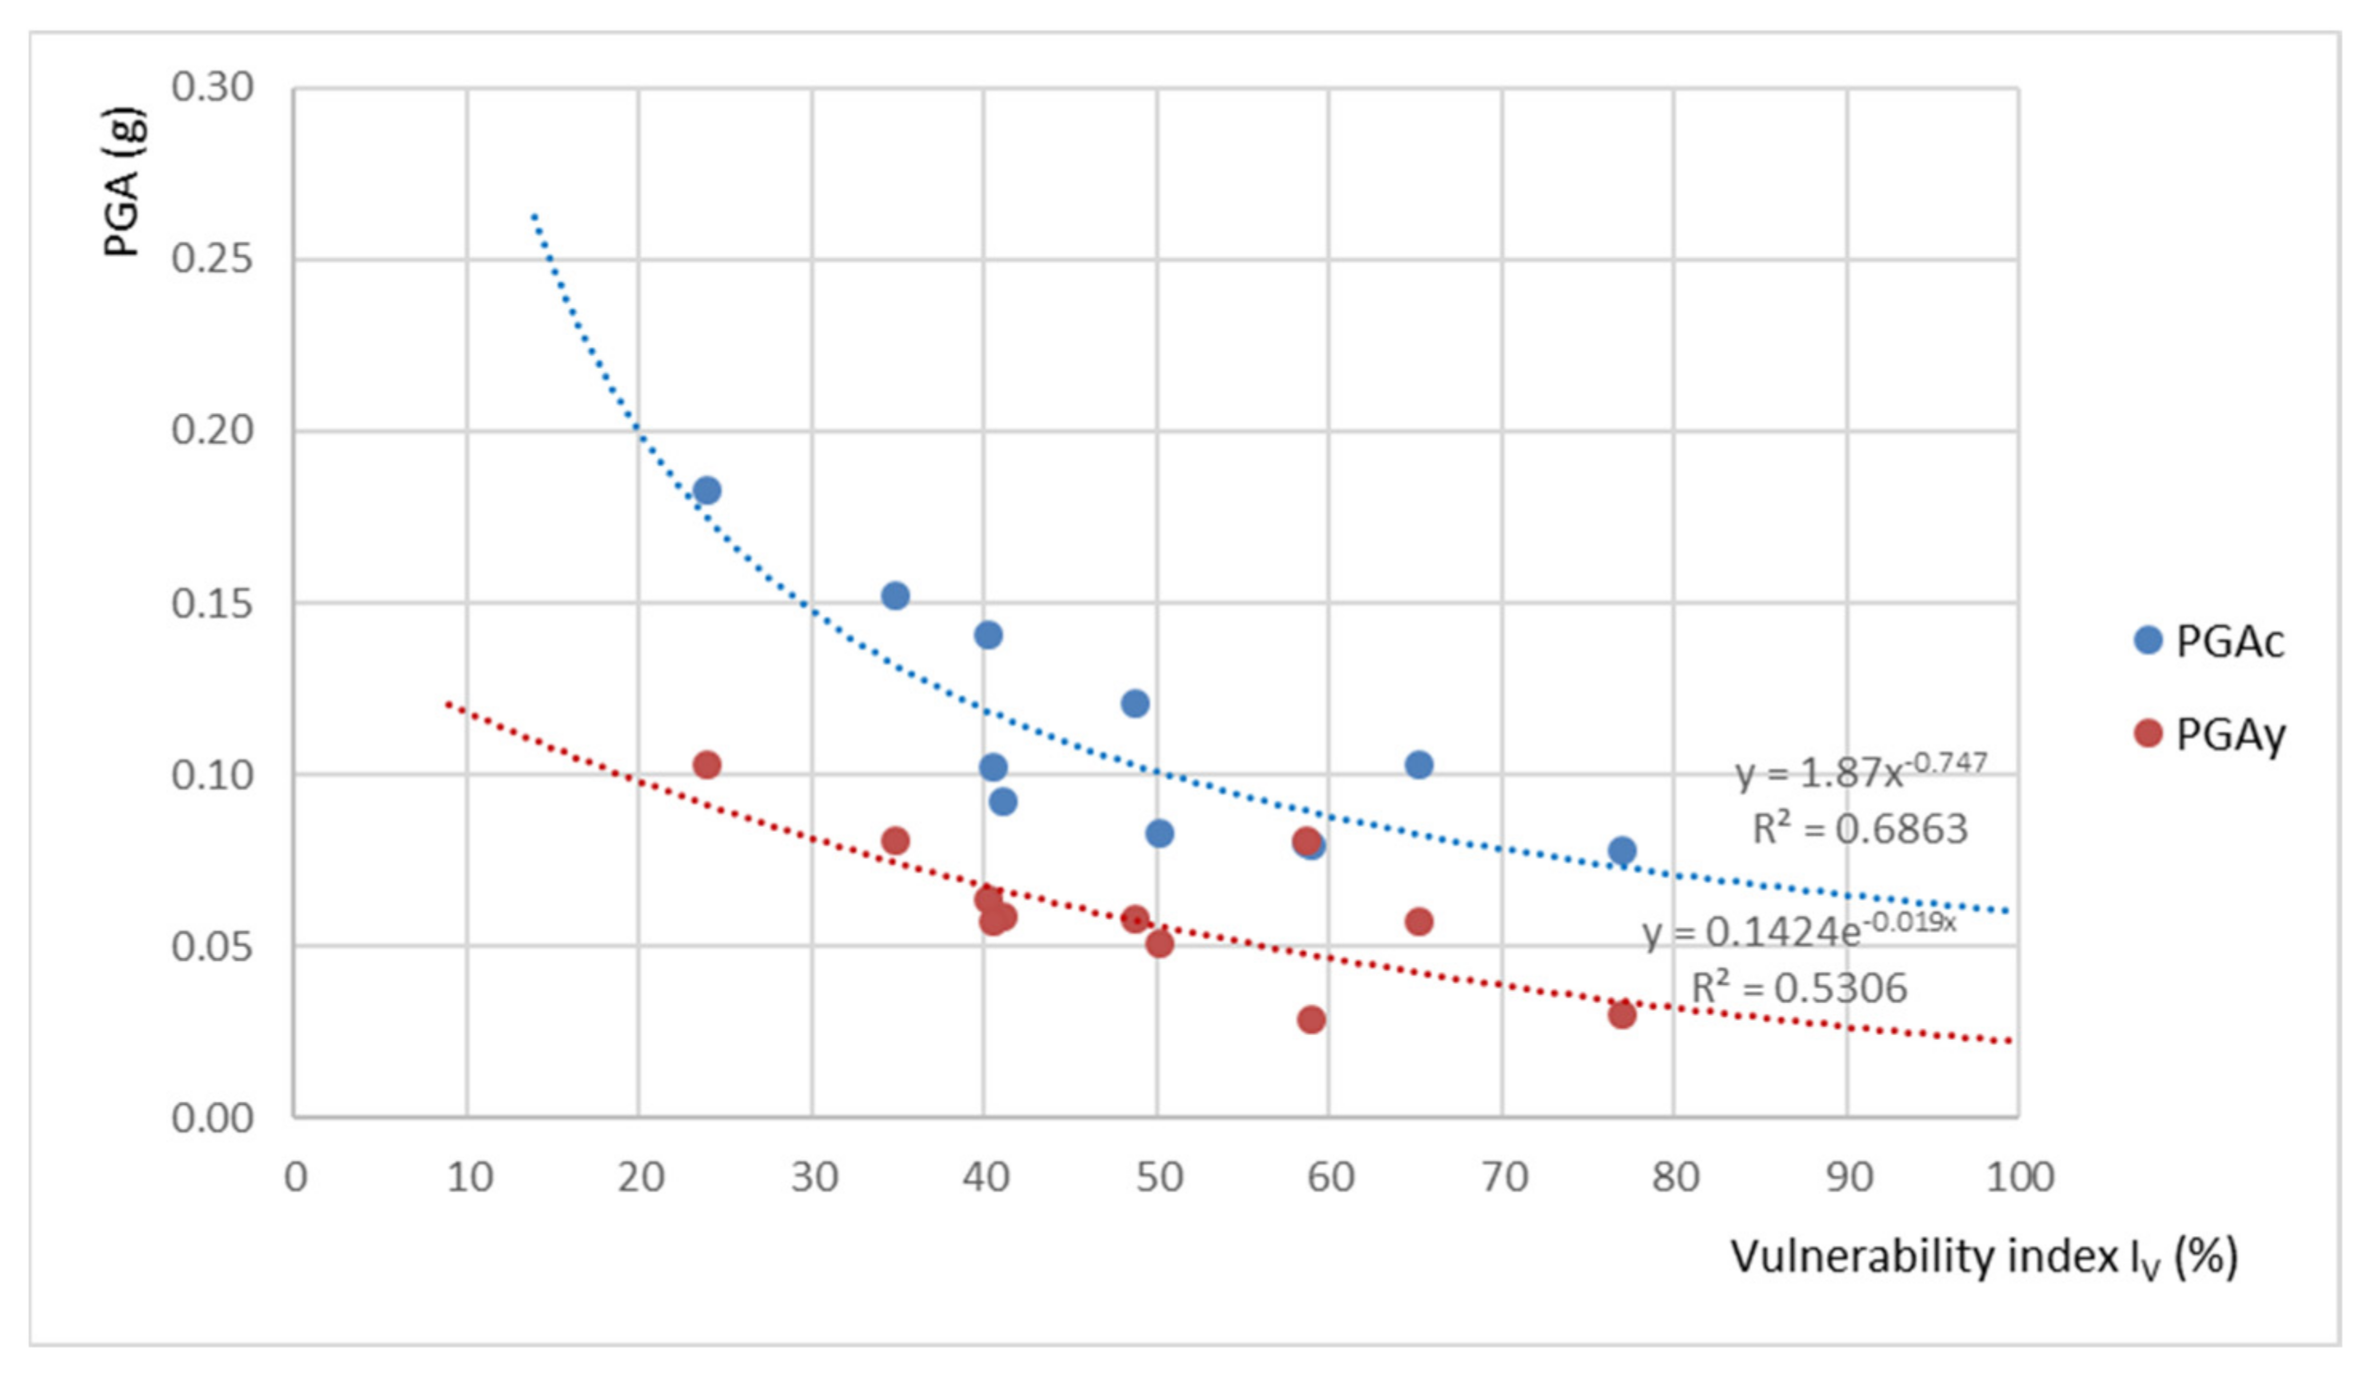
- Calculation of the peak ground accelerations for early damage and collapse states of the buildings through non-linear static (pushover) analysis of representative buildings;
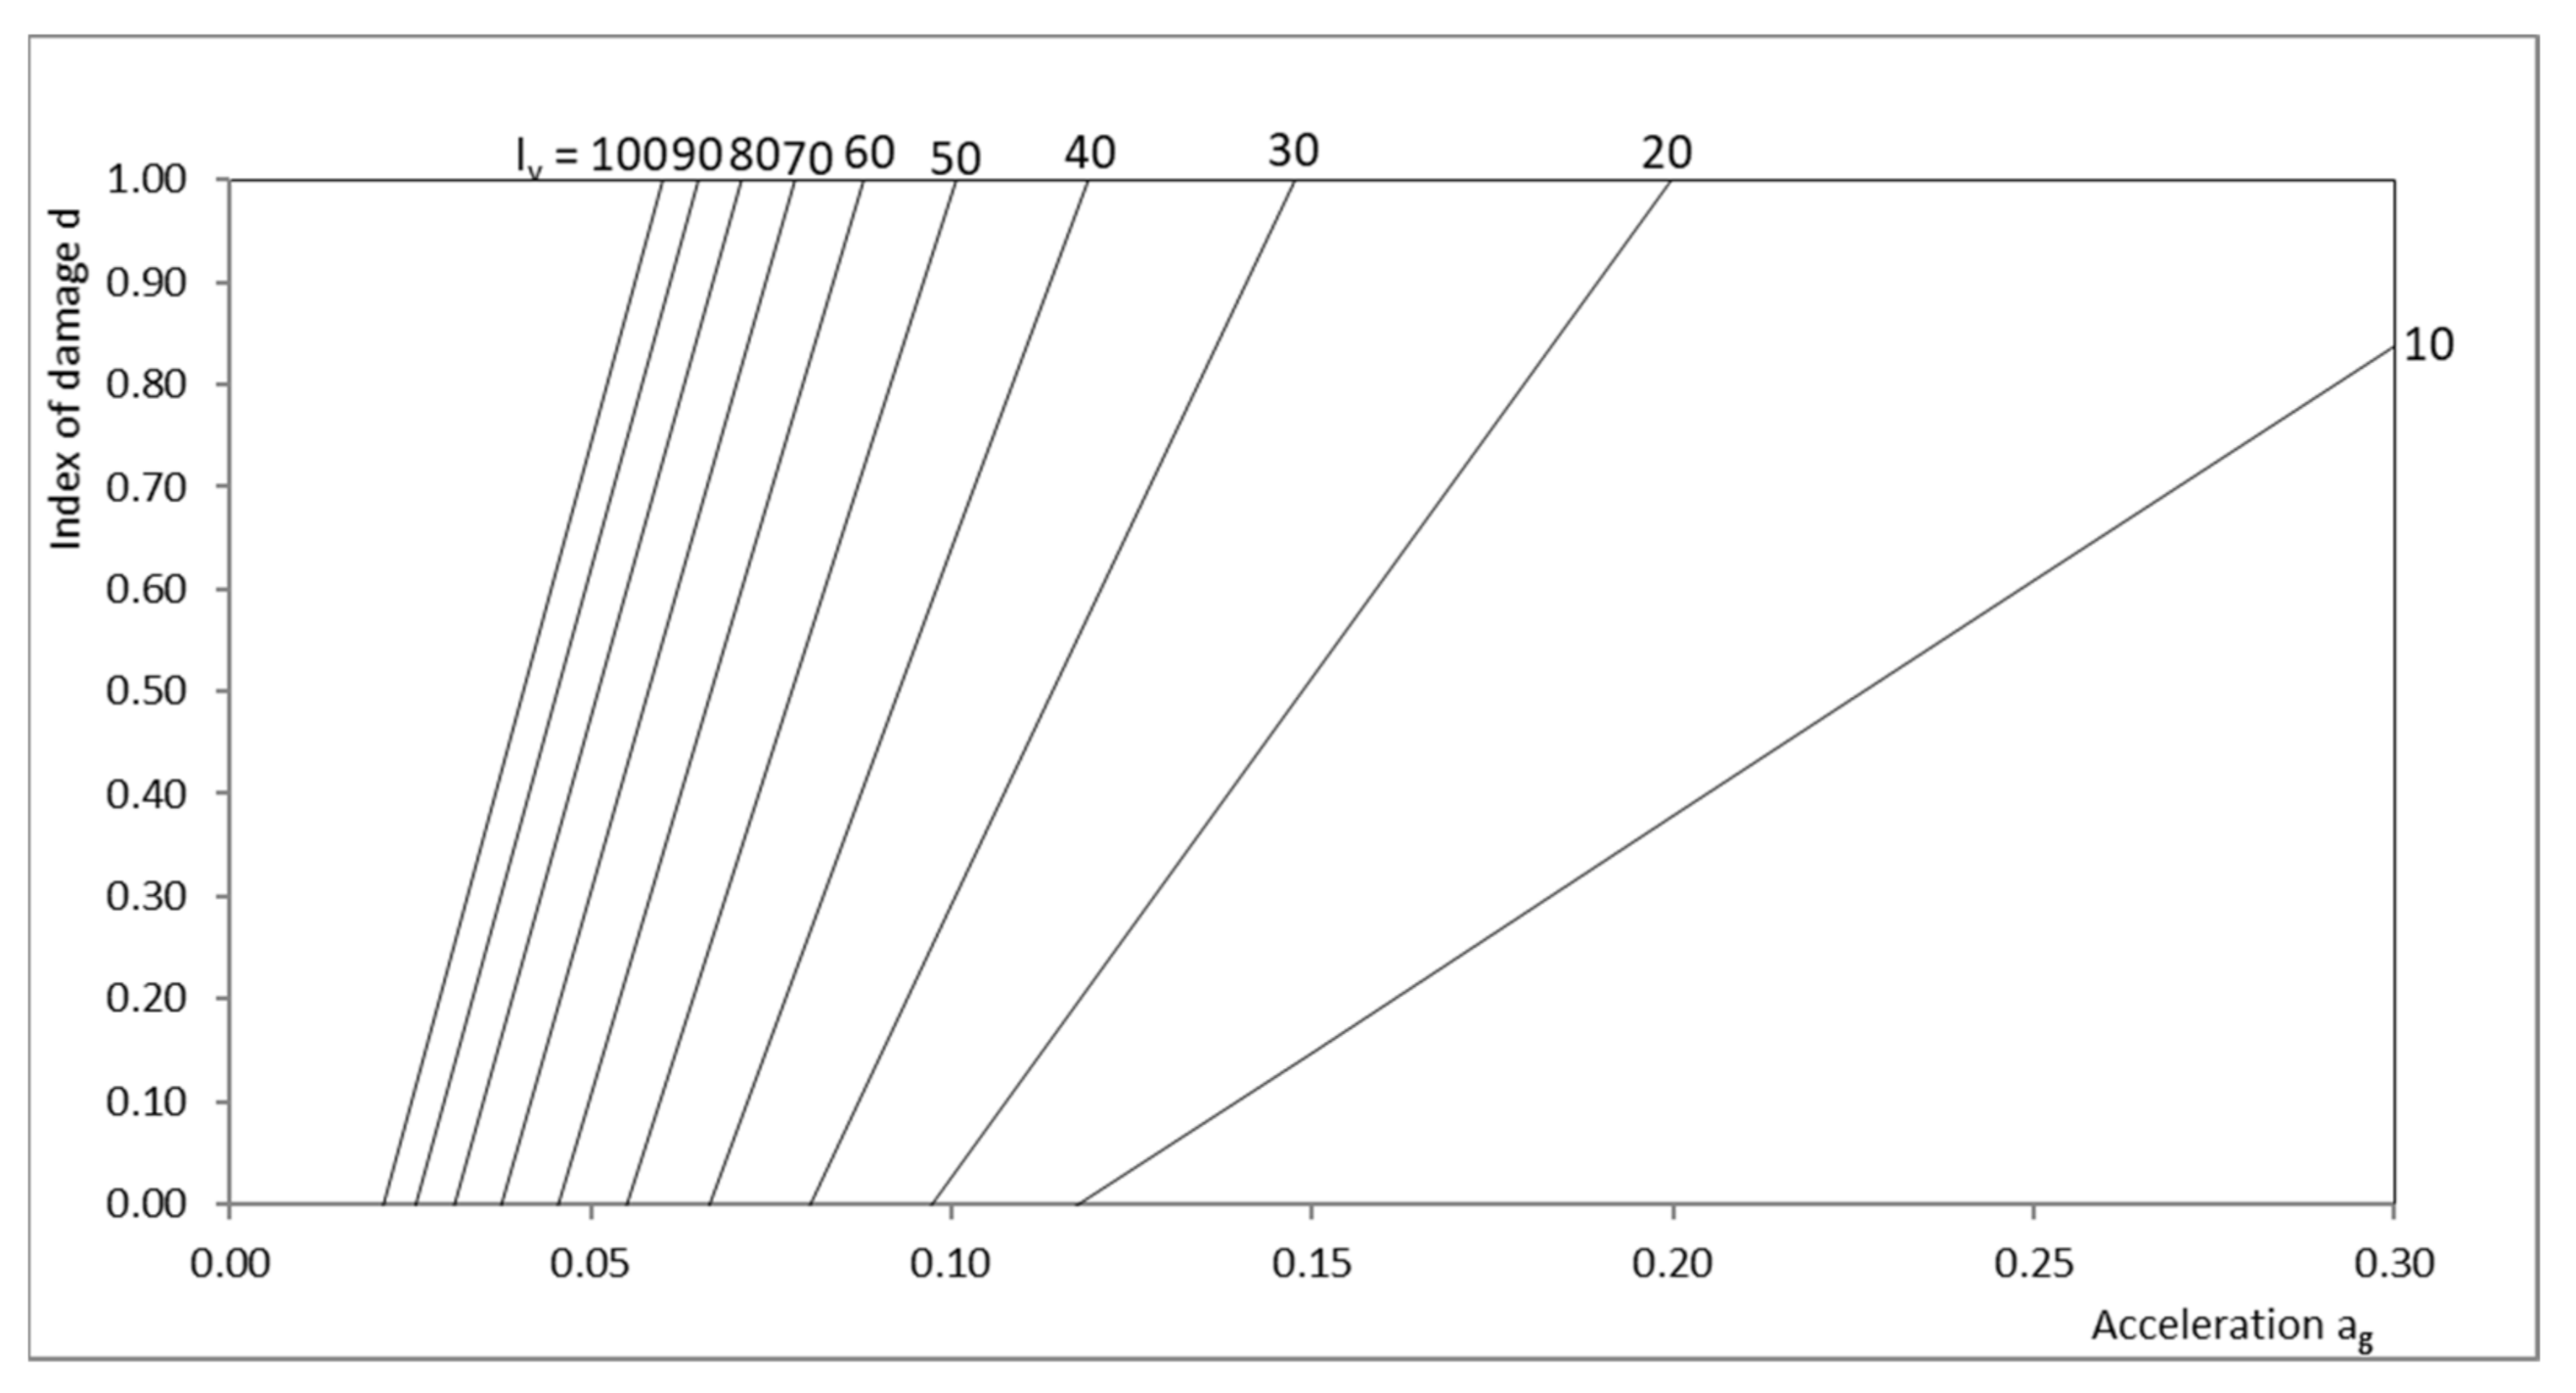
- Development of a new damage–vulnerability–peak ground acceleration relationship, which estimates the damage of the buildings under specific seismic action;
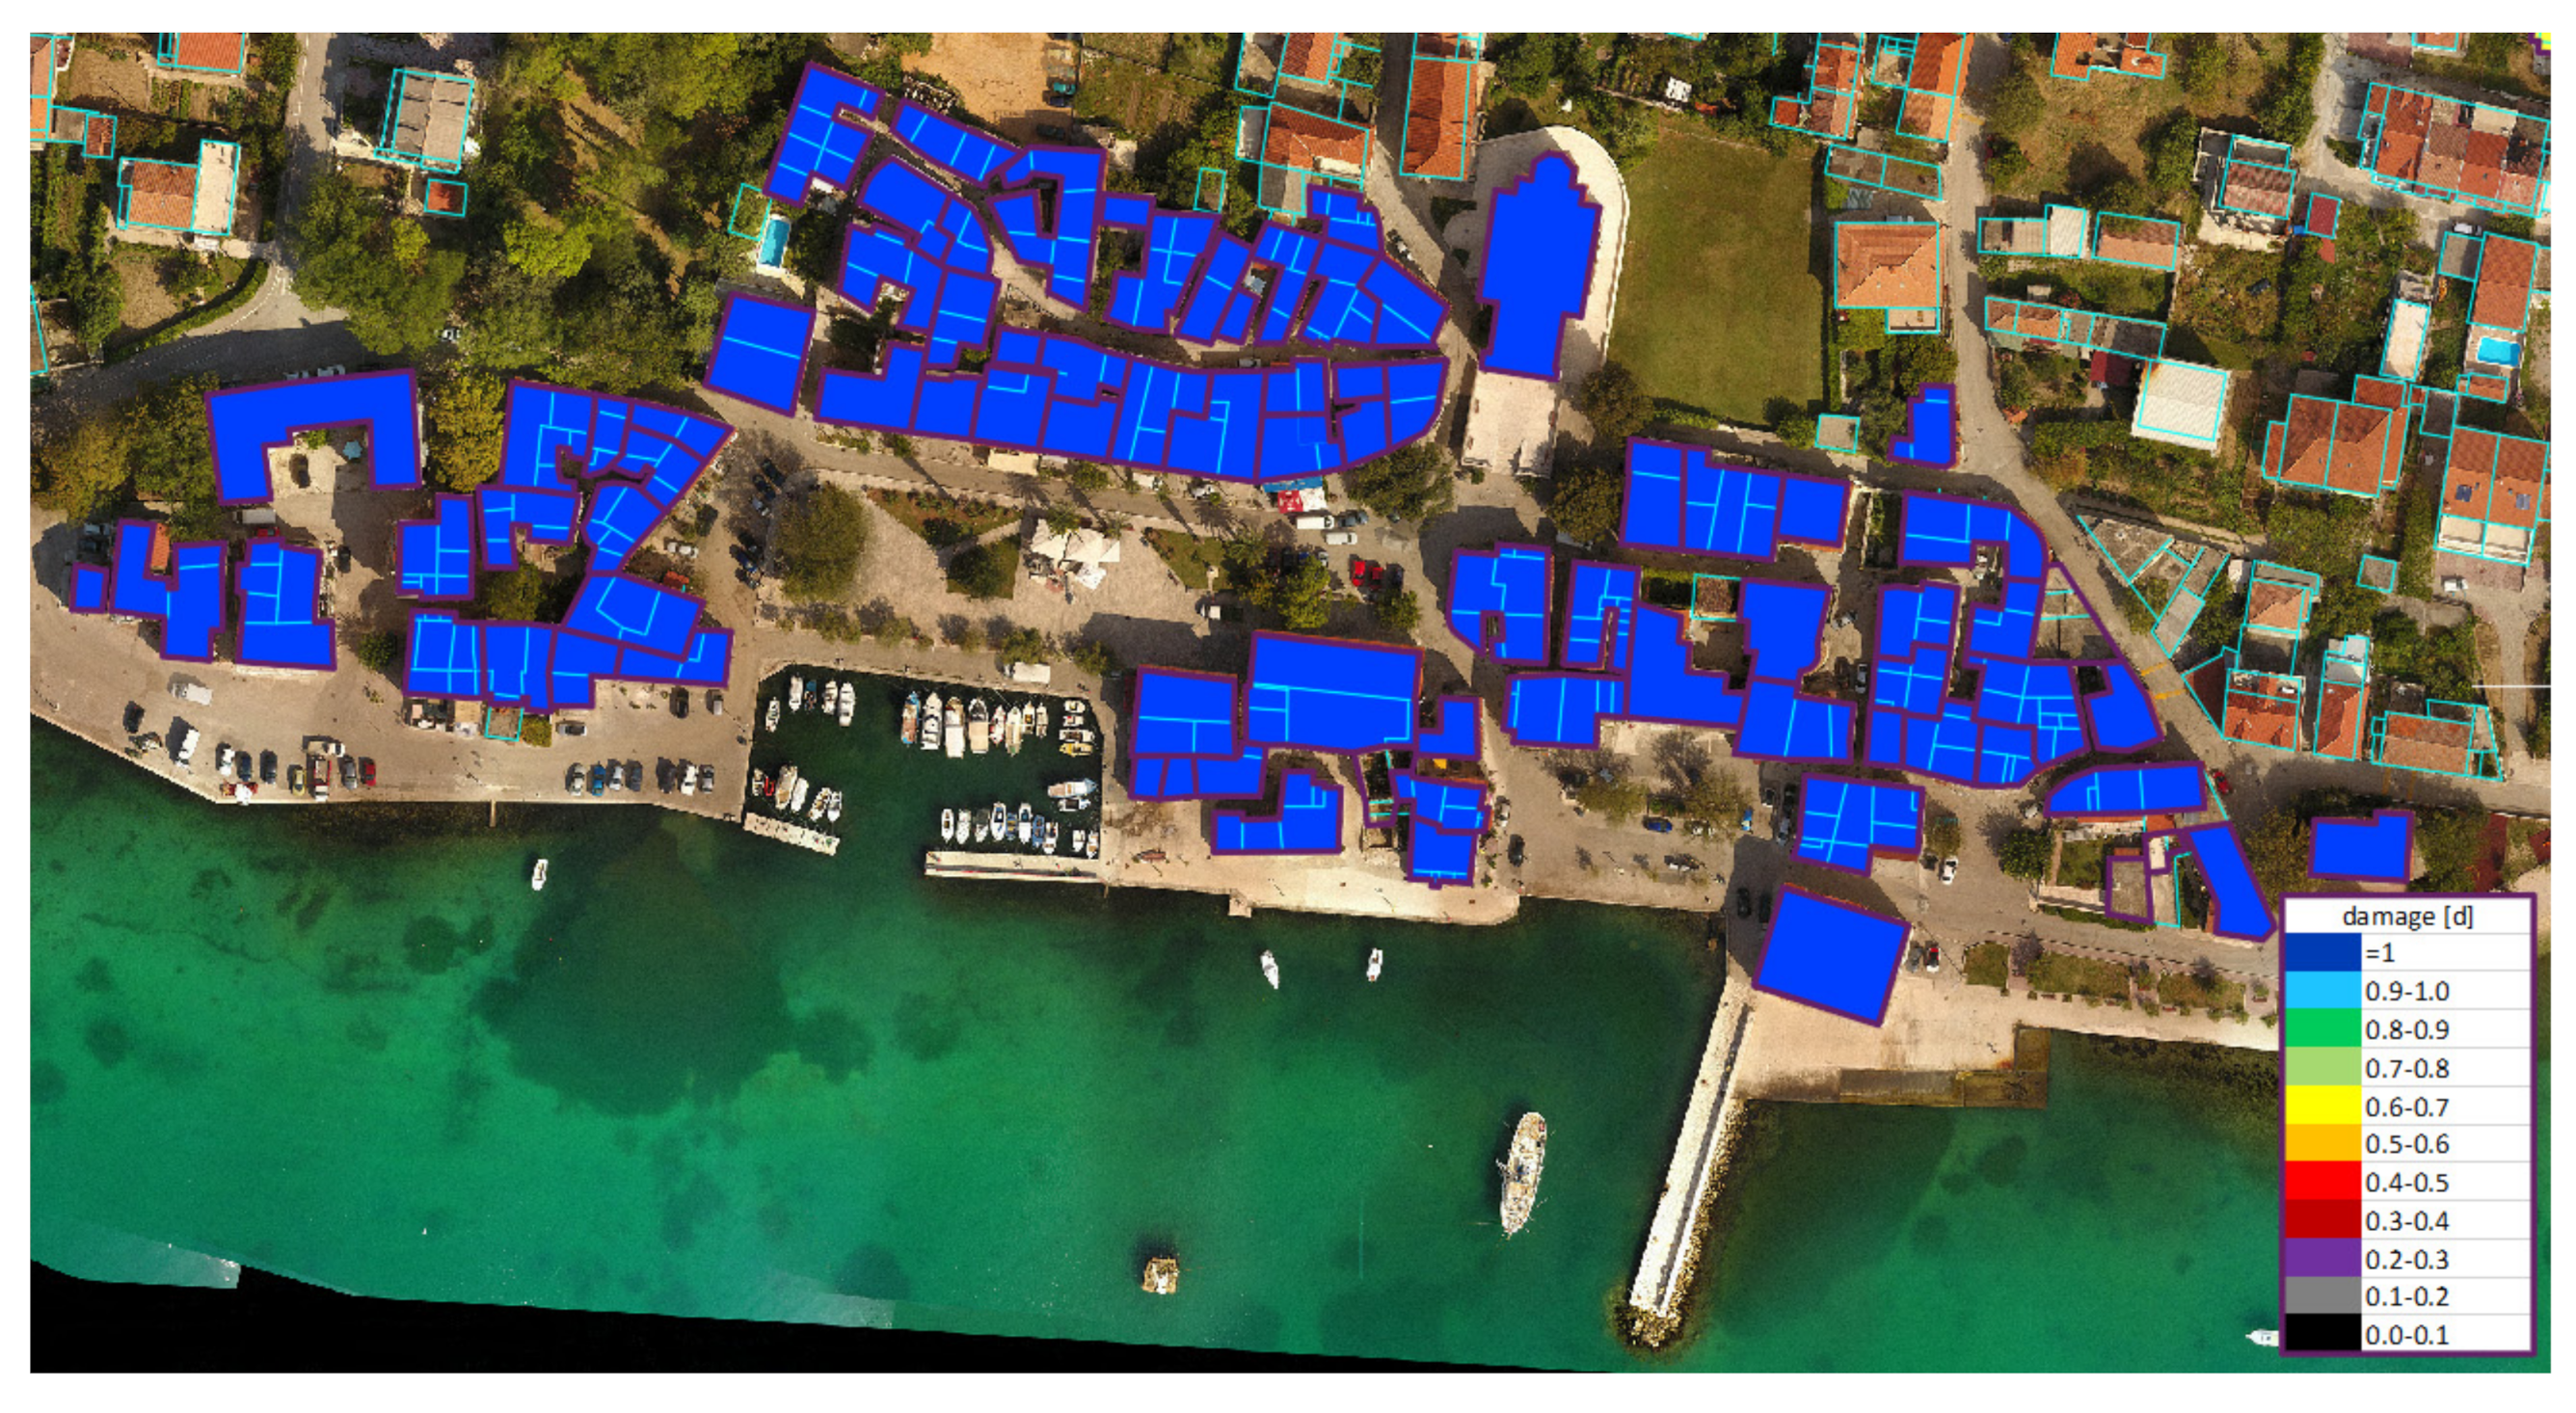
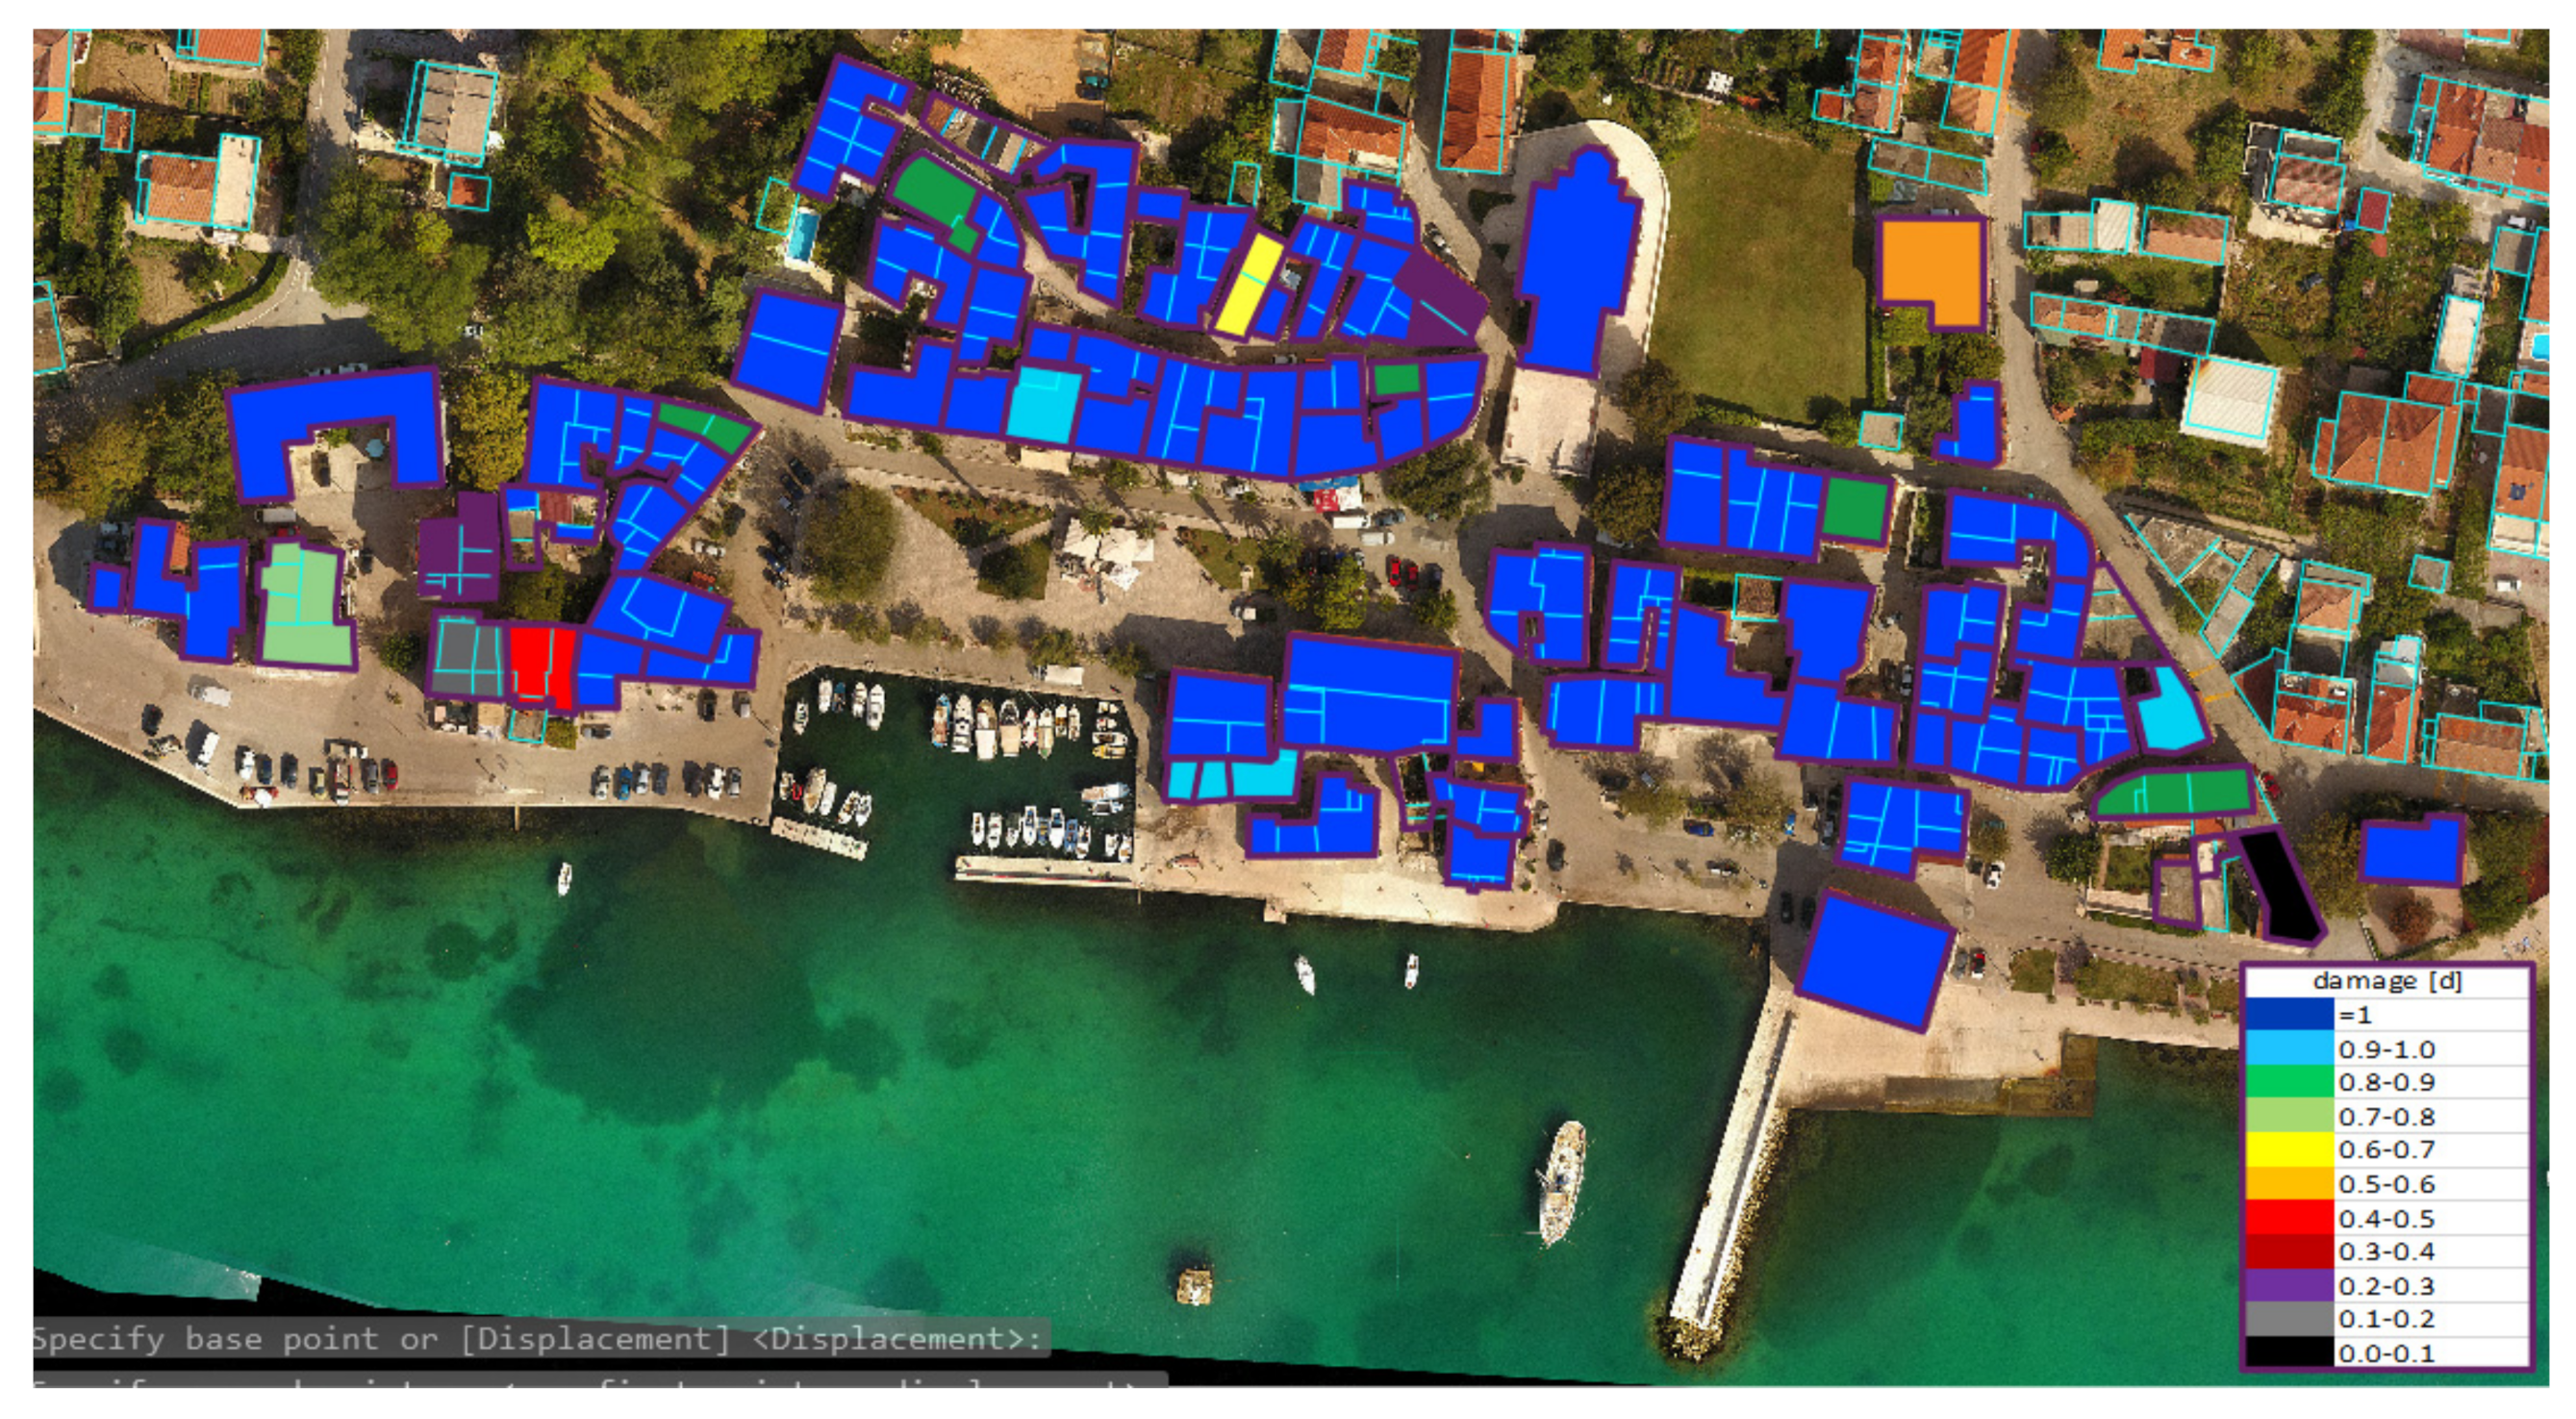
- Risk analysis in terms of seismic damage;
- Demonstration of seismic vulnerability and seismic risk using seismic vulnerability index maps and damage index maps.
5. Conclusions
Author Contributions
Funding
Institutional Review Board Statement
Informed Consent Statement
Data Availability Statement
Conflicts of Interest
References
- Fajfar, P.; Gašperšič, P. The N2 method for the seismic damage analysis of RC buildings. Earthq. Eng. Struct. Dyn. 1996, 25, 11–46. [Google Scholar] [CrossRef]
- Fajfar, P.; Eeri, M. A nonlinear analysis method for performance based seismic design. Earthq. Spectra 2000, 16, 573–592. [Google Scholar] [CrossRef]
- Vamvatsikos, D.; Cornell, C.A. Incremental Dynamic Analysis. Earthq. Eng. Struct. Dyn. 2002, 31, 491–514. [Google Scholar] [CrossRef]
- Kreslin, M.; Fajfar, P. The extended N2 method considering higher mode effects in both plan and elevation. Bull. Earthq. Eng. 2012, 10, 695–715. [Google Scholar] [CrossRef]
- Rossetto, T.; Elnashai, A. Derivation of vulnerability functions for European-type RC structures based on observational data. Eng. Struct. 2003, 25, 1241–1263. [Google Scholar] [CrossRef]
- Maniyar, M.M.; Khare, R.; Dhakal, R.P. Probabilistic seismic performance evaluation of non-seismic RC frame buildings. Struct. Eng. Mech. 2009, 33, 725–745. [Google Scholar] [CrossRef] [Green Version]
- Ioannou, I.; Douglas, J.; Rossetto, T. Assessing the impact of ground-motion variability and uncertainty on empirical fragility curves. Soil Dyn. Earthq. Eng. 2015, 69, 83–92. [Google Scholar] [CrossRef]
- Ripepe, M.; Lacanna, G.; Deguy, P.; De Stefano, M.; Mariani, V.; Tanganelli, M. Large-Scale Seismic Vulnerability Assessment Method for Urban Centres. An Application to the City of Florence. Key Eng. Mater. 2014, 628, 49–54. [Google Scholar] [CrossRef]
- Salgado-Galvez, M.A.; Zuloaga, R.D.; Velasquez, C.A.; Carreno, M.L.; Cardona, O.D.; Barbat, A.H. Urban seismic risk index for Medellın, Colombia, based on probabilistic loss and casualties estimations. Nat. Hazards 2016, 80, 1995–2021. [Google Scholar] [CrossRef] [Green Version]
- Aguado, J.L.P.; Ferreira, L.P.; Lourenco, P.B. The Use of a Large-Scale Seismic Vulnerability Assessment Approach for Masonry Façade Walls as an Effective Tool for Evaluating, Managing and Mitigating Seismic Risk in Historical Centres. Int. J. Archit. Herit. 2018, 12, 1259–1275. [Google Scholar] [CrossRef]
- Salazar, L.G.F.; Ferreira, T.M. Seismic Vulnerability Assessment of Historic Constructions in the Downtown of Mexico City. Sustainability 2020, 12, 1276. [Google Scholar] [CrossRef] [Green Version]
- Capanna, I.; Cirella, R.; Aloisio, A.; Alaggio, R.; Di Fabio, F.; Fragiacomo, M. Operational Modal Analysis, Model Update and Fragility Curves Estimation, through Truncated Incremental Dynamic Analysis, of a Masonry Belfry. Buildings 2021, 11, 120. [Google Scholar] [CrossRef]
- Battaglia, L.; Ferreira, T.M.; Lourenço, P.B. Seismic fragility assessment of masonry building aggregates: A case study in the old city Centre of Seixal, Portugal. Earthq. Eng. Struct. Dyn. 2021, 50, 1358–1377. [Google Scholar] [CrossRef]
- Lagomarsino, S.; Cattari, S.; Ottonelli, D. The heuristic vulnerability model: Fragility curves for masonry buildings. Bull. Earthq. Eng. 2021, 19, 3129–3163. [Google Scholar] [CrossRef]
- Giordano, N.; De Luca, F.; Sextos, A. Analytical fragility curves for masonry school building portfolios in Nepal. Bull. Earthq. Eng. 2021, 19, 1121–1150. [Google Scholar] [CrossRef]
- Capanna, I.; Aloisio, A.; Di Fabio, F.; Fragiacomo, M. Sensitivity Assessment of the Seismic Response of a Masonry Palace via Non-Linear Static Analysis: A Case Study in L’Aquila (Italy). Infrastructures 2021, 6, 8. [Google Scholar] [CrossRef]
- Whitman, R.V.; Reed, J.W.; Hong, S.T. Earthquake Damage Probability Matrices. In Proceedings of the 5th World Conference on Earthquake Engineering, Rome, Italy, 25–29 June 1973; Volume II, pp. 2531–2540. [Google Scholar]
- Benedetti, D.; Petrini, V. Vulnerability of masonry buildings: Proposal of a method of assessment. Industria Costr. 1984, 149, 66–74. (in Italian). [Google Scholar]
- GNDT-SSN. Scheda di Espozione e Vulnerabilita e di Rilevamento Danni di Primo e Secondo Livello (Murata e Cemento Armato); GNDT-SSN: Rome, Italy, 1994; Available online: https://protezionecivile.regione.abruzzo.it/files/rischio%20sismico/verificheSism/Manuale_e_scheda_GNDT_II_livello.pdf (accessed on 26 April 2021).
- Di Pascuale, G.; Orsini, G.; Romeo, R.W. New developments in seismic risk assessment in Italy. Bull. Earthq. Eng. 2005, 3, 101–128. [Google Scholar] [CrossRef]
- Lagomarsino, S.; Giovinazzi, S. Macroseismic and mechanical models for the vulnerability and damage assessment of current buildings. Bull. Earthq. Eng. 2006, 4, 415–443. [Google Scholar] [CrossRef]
- Grunthall, G. European Macroseismic Scale 1998 (EMS-98); Cahiers du Centre Européen de Géodynamique et Séismologie: Luxembourg, 1998; Volume 15. [Google Scholar]
- Guagenti, E.; Petrini, V. The case of old buildings: Towards a new law damage-intensity. In Proceedings of the IV ANIDIS Convention, Milan, Italy, 1989; Volume I, pp. 145–153. (in Italian). [Google Scholar]
- Bernardini, A. The Vulnerability of Buildings-Evaluation on the National Scale of the Seismic Vulnerability of Ordinary Buildings; CNR-GNDT: Rome, Italy, 2000. [Google Scholar]
- Giovinazzi, S. The Vulnerability Assessment and the Damage Scenario in Seismic Risk Analysis. Ph.D. Thesis, Department of Civil Engineering, Technical University Carolo-Wilhelmina, Braunschweig, Germany, Department of Civil Engineering, Faculty of Engineering, University of the Florence, Florence, Italy, 2005. [Google Scholar]
- FEMA. HAZUS Technical Manual; Federal Emergency Management Agency: Washington, DC, USA, 1999.
- Kircher, C.A.; Whitman, R.V.; Holmes, W.T. HAZUS earthquake loss estimation methods. Nat. Hazards 2006, 7, 45–59. [Google Scholar] [CrossRef]
- Moroux, P.; Bertrand, E.; Bour, M.; Le Brun, B.; Depinois, S.; Masure, P.; The RISK-UE Team. The European RISK-UE project: An advanced approach to earthquake risk scenarios. In Proceedings of the 13th World Conference on Earthquake Engineering, Vancouver, BC, Canada, 1–6 August 2004. [Google Scholar]
- Silva, V.; Crowley, H.; Varum, H.; Pinho, R.; Sousa, R. Evaluation of analytical methodologies used to derive vulnerability functions. Earthq. Eng. Struct. Dyn. 2014, 43, 181–204. [Google Scholar] [CrossRef] [Green Version]
- Angeletti, P.; Bellina, A.; Guagenti, E.; Moretti, A.; Petrini, V. Comparison between vulnerability assessment and damage index, some results. In Proceedings of the 9th World Conference on Earthquake Engineering, Tokyo, Japan, 2–9 August 1988. [Google Scholar]
- Vicente, R.; Parodi, S.; Lagomarsino, S.; Varum, H.; Da Silva, M. Seismic vulnerability and risk assessment: Case study of the historic city centre of Coimbra, Portugal. Bull. Earthq. Eng. 2011, 9, 1067–1096. [Google Scholar] [CrossRef]
- Achs, G.; Adam, C. Rapid seismic evaluation of historic brick-masonry buildings in Vienna (Austria) based on visual screening. Bull. Earthq. Eng. 2012, 10, 1833–1856. [Google Scholar] [CrossRef]
- Ferreira, T.M.; Mendes, N.; Silva, R. Multiscale Seismic Vulnerability Assessment and Retrofit of Existing Masonry Buildings. Buildings 2019, 9, 91. [Google Scholar] [CrossRef] [Green Version]
- Atalić, J.; Šavor Novak, M.; Uroš, M. Seismic risk for Croatia: Overview of research activities and present assessments with guidelines for the future. Građevinar 2019, 10, 923–947. [Google Scholar]
- Hadzima-Nyarko, M.; Pavić, G.; Lešić, M. Seismic vulnerability of old confined masonry buildings in Osijek, Croatia. Earthq. Struct. 2016, 11, 629–648. [Google Scholar] [CrossRef]
- Hadzima-Nyarko, M.; Mišetić, V.; Morić, D. Seismic vulnerability assessment of an old historical masonry building in Osijek, Croatia, using Damage Index. J. Cult. Herit. 2017, 28, 140–150. [Google Scholar] [CrossRef]
- Gordana Pavić, G.; Bulajić, B.; Hadzima-Nyarko, M. The Vulnerability of buildings from the Osijek database. Front. Built Environ. 2019, 5, 1–14. [Google Scholar]
- Cavaleri, L.; Di Trapani, F.; Ferroto, M.F. A new hybrid procedure for the definition of seismic vulnerability in Mediterranean cross-border urban areas. Nat. Hazards 2017, 86, 517–541. [Google Scholar] [CrossRef]
- Available online: https://marinas.com/view/marina/eyc39lv_Kastel_Kambelovac_Harbour_Kastel_Gomilica_Croatia (accessed on 21 November 2020).
- Marasović, K. Kaštel Kambelovac. Kaštela J. 2003, 7, 35–61. (In Croatian) [Google Scholar]
- Uranjek, M.; Žarnić, R.; Bokan-Bosiljkov, V.; Bosiljkov, V. Seismic resistance of stone masonry building and effect of grouting. Građevinar 2014, 66, 715–726. [Google Scholar]
- Bosiljkov, V.; Kržan, M. Results of Laboratory and In-Situ Tests on Masonry Properties and Tables with Mechanical Parameters to Be Adopted in Numerical Modelling, PERPETUATE (ECFP7 Project), Deliverable D15. 2012. Available online: www.perpetuate.eu (accessed on 26 April 2021).
- Ferrini, M.; Melozzi, A.; Pagliazzi, A.; Scarparolo, S. Rilevamento della Vulnerabilita Sismica degli Edifici in Muratura, Manuale per la Compilazione della Scheda GNDT/CNR di II Livello, Versione Modificata dalla Regione Toscana. S.l.; Direzione Generale delle Politiche Territoriale e Ambientali, Settore—Servizio Sismico Regionale: Regione Toscana, ltaly, 2003. [Google Scholar]
- Herak, M. Croatian map of seismic hazards. In Proceedings of the IVth Conference of Croatian Platform for Disaster Risk Reduction, Zagreb, Croatia, 13 December 2012; pp. 4–12. [Google Scholar]
- HRN EN 1998-1:2011. Design of Structures for Earthquake Resistance. Part 1: General Rules, Seismic Actions and Rules for Buildings; Croatian Standards Institute: Zagreb, Croatia, 2011. [Google Scholar]
- The European Union per Regulation. EN 1998-1 Eurocode 8: Design of Structures for Earthquake Resistance—Part 1: General Rules, Seismic Actions and Rules for Buildings; European Committee for Standardization CEN: Brussels, Belgium, 2004. [Google Scholar]
- Bohm, G.; Da Col, F.; Accaino, F.; Meneghini, F.; Schleifer, A.; Nikolić, Ž. Characterization of shallow sediments in an urban area (Kaštela, Croatia) by analysis of P, SV and Sh seismic velocities using a tomographic approach. In Proceedings of the Near Surface Geoscience Conference & Exhibition 2020, Belgrade, Serbia, 30 August–3 September 2020. [Google Scholar]
- Croatian Standards Institute. HRN EN 1998-3 Eurocode 8: Design of Structures for Earthquake Resistance—Part 3: Assessment and Retrofiting of Buildings; Croatian Standards Institute: Zagreb, Croatia, 2011. [Google Scholar]
- Lagomarsino, S.; Penna, A.; Galasco, A.; Cattari, S. TREMURI Program: An equivalent frame model for the nonlinear seismic analysis of masonry buildings. Eng. Struct. 2013, 56, 1787–1799. [Google Scholar] [CrossRef]
- TREMURI Software, Professional version; S.T.A. DATA: Turin, Italy, 2019.


| Parameter | Score (svi) | Weight (wi) | |||
|---|---|---|---|---|---|
| A | B | C | D | ||
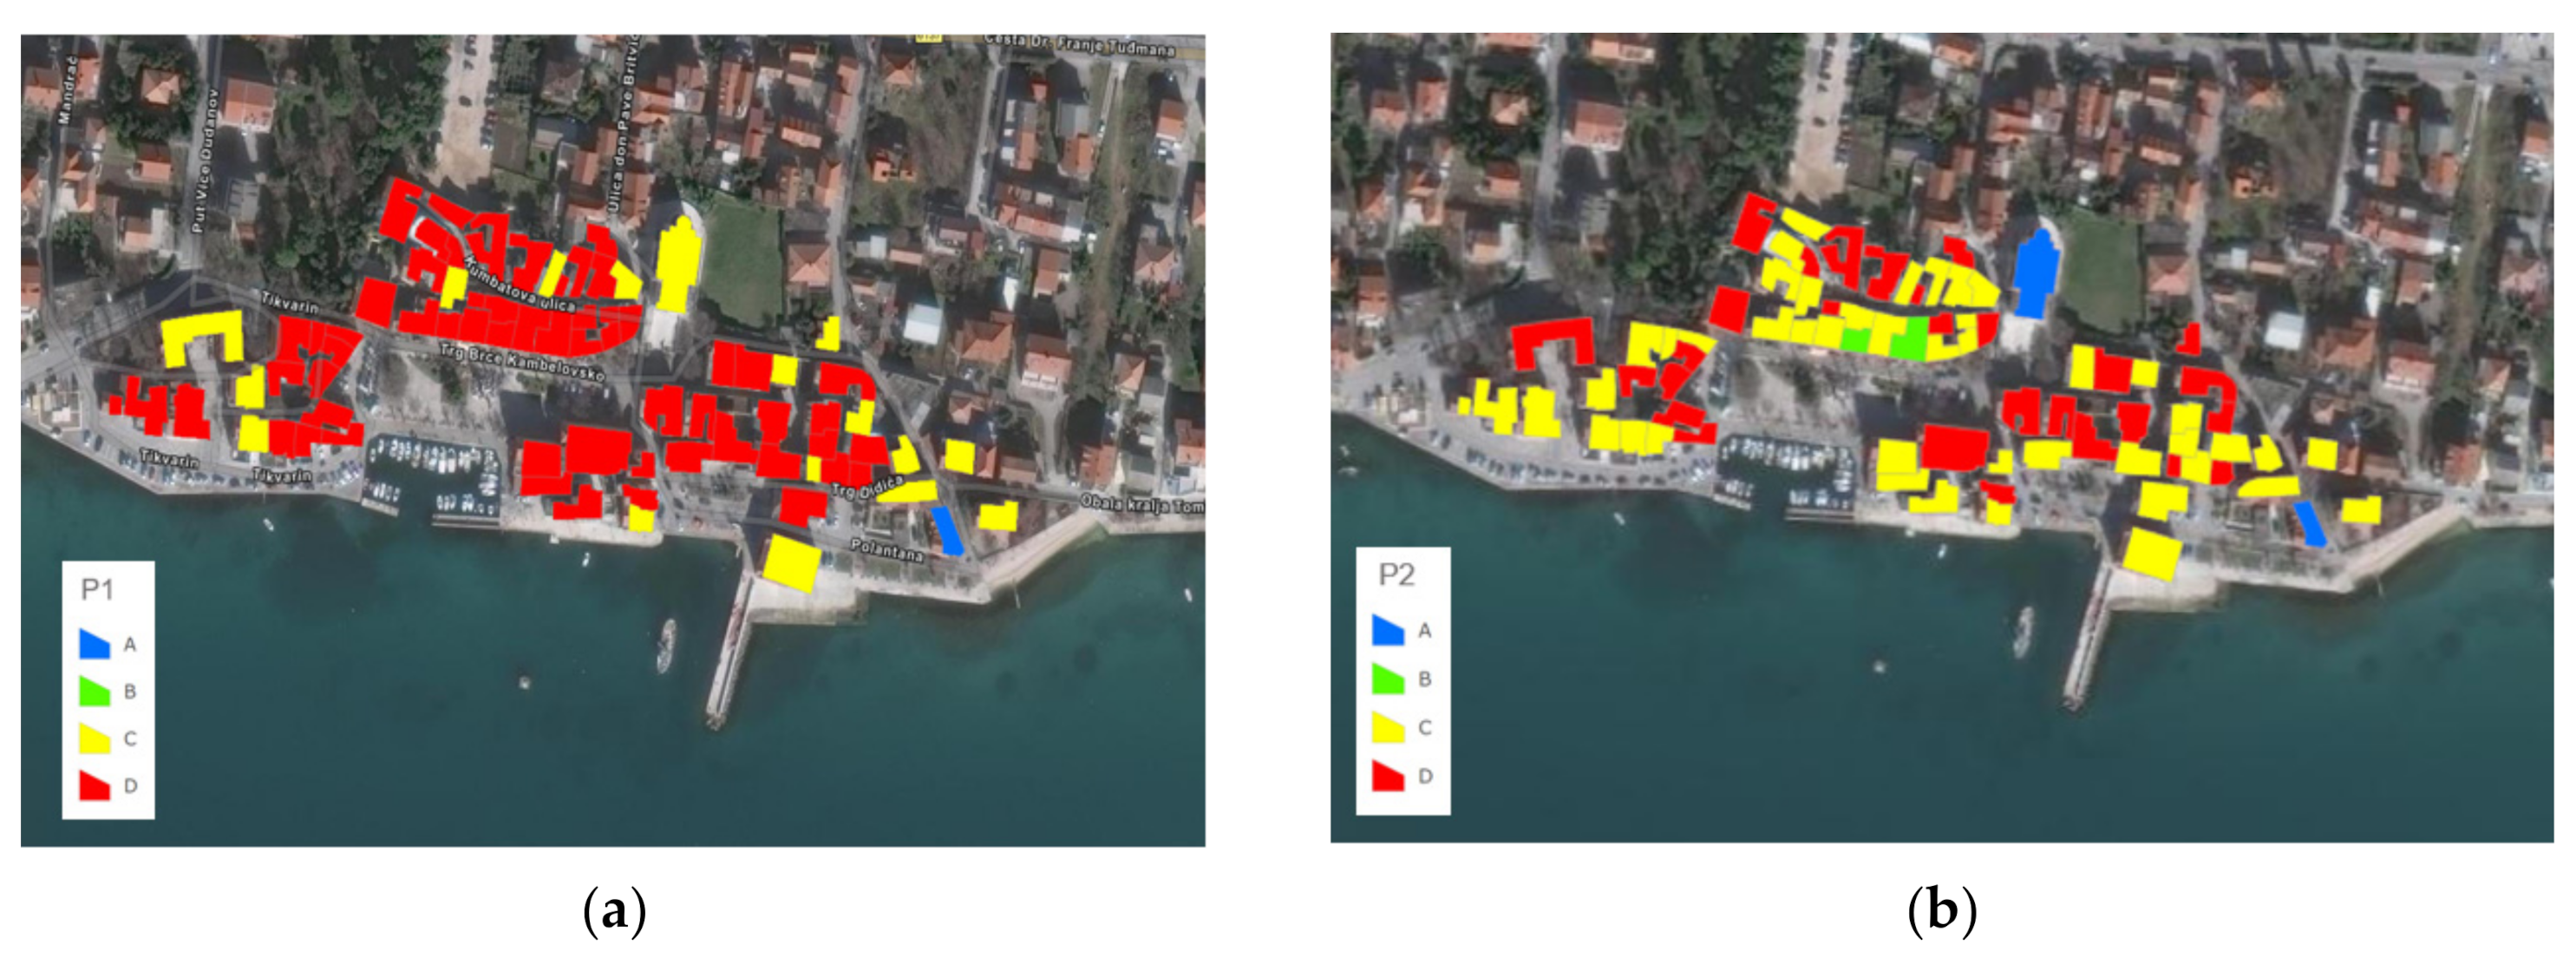
| Type and organization of the resistant system (P1) | 0 | 5 | 20 | 45 | 1.50 |
| Quality of the resistant system (P2) | 0 | 5 | 25 | 45 | 0.25 |
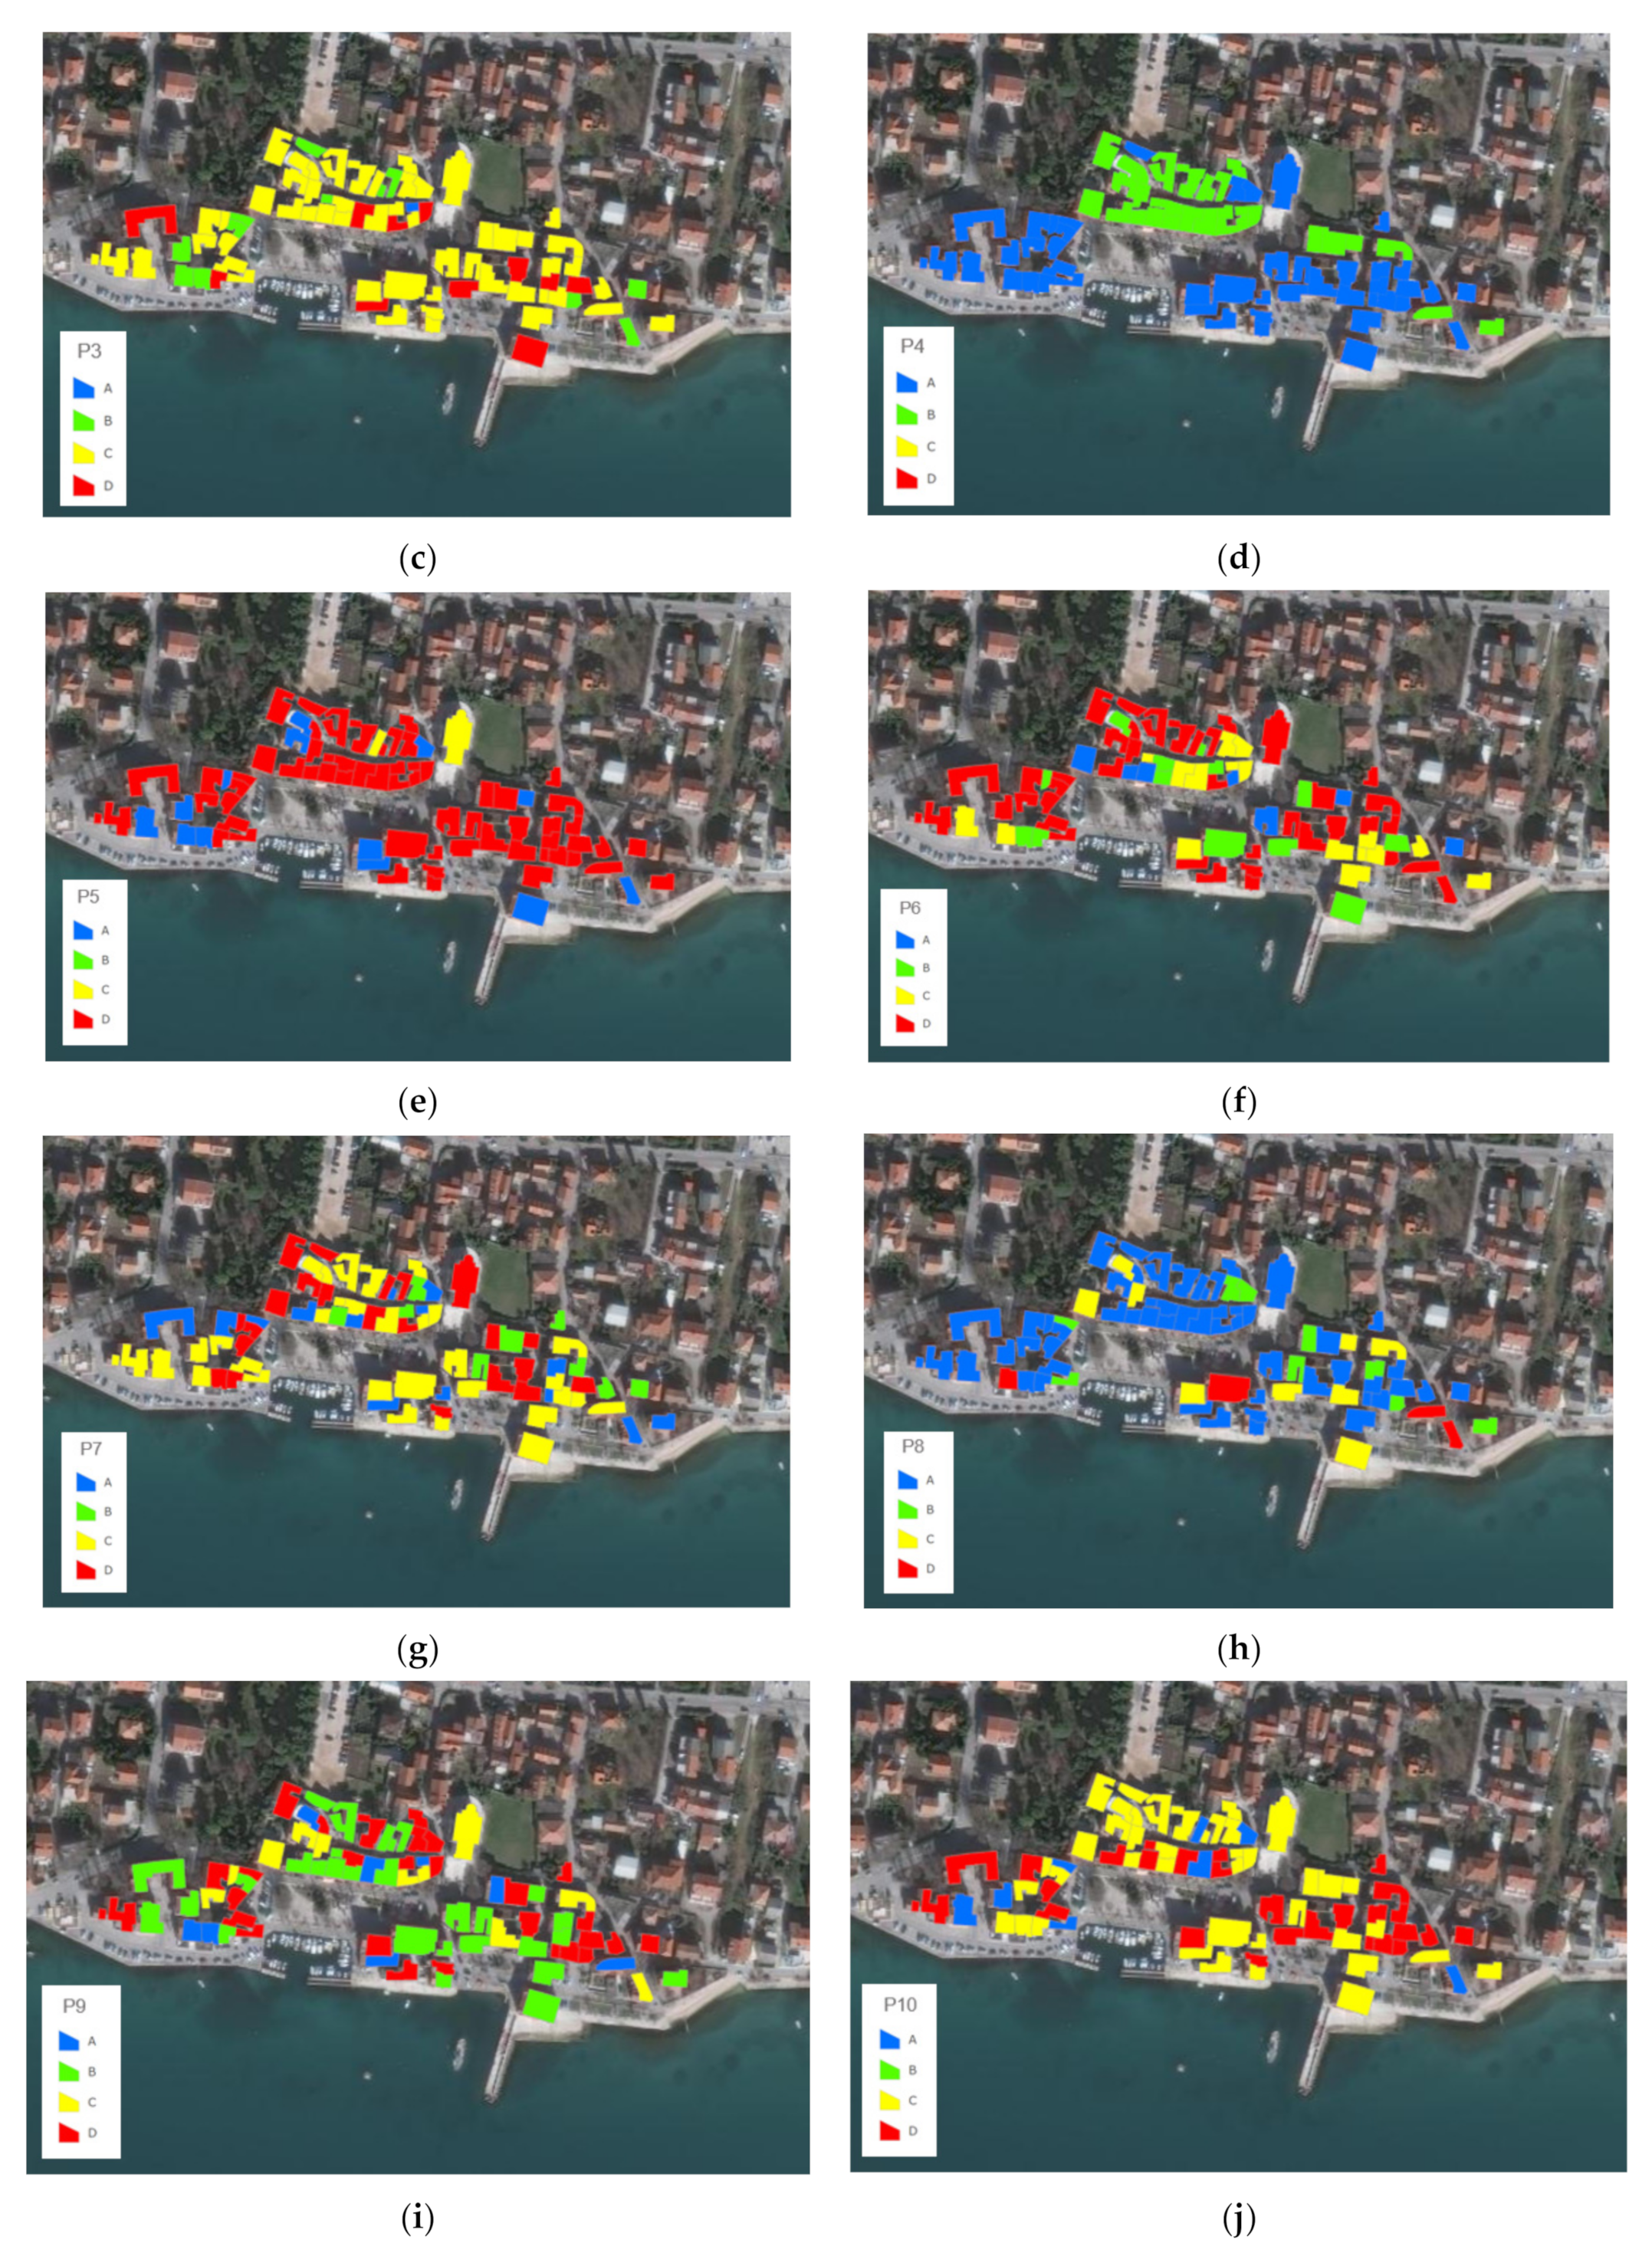
| Conventional resistance (P3) | 0 | 5 | 25 | 45 | 1.50 |
| Position of the building and foundation (P4) | 0 | 5 | 25 | 45 | 0.75 |
| Typology of floors (P5) | 0 | 5 | 15 | 45 | var. |
| Planimetric configuration (P6) | 0 | 5 | 25 | 45 | 0.50 |
| Elevation configuration (P7) | 0 | 5 | 25 | 45 | var. |
| Maximum distance among the walls (P8) | 0 | 5 | 25 | 45 | 0.25 |
| Roof (P9) | 0 | 15 | 25 | 45 | var. |
| Non-structural elements (P10) | 0 | 0 | 25 | 45 | 0.25 |
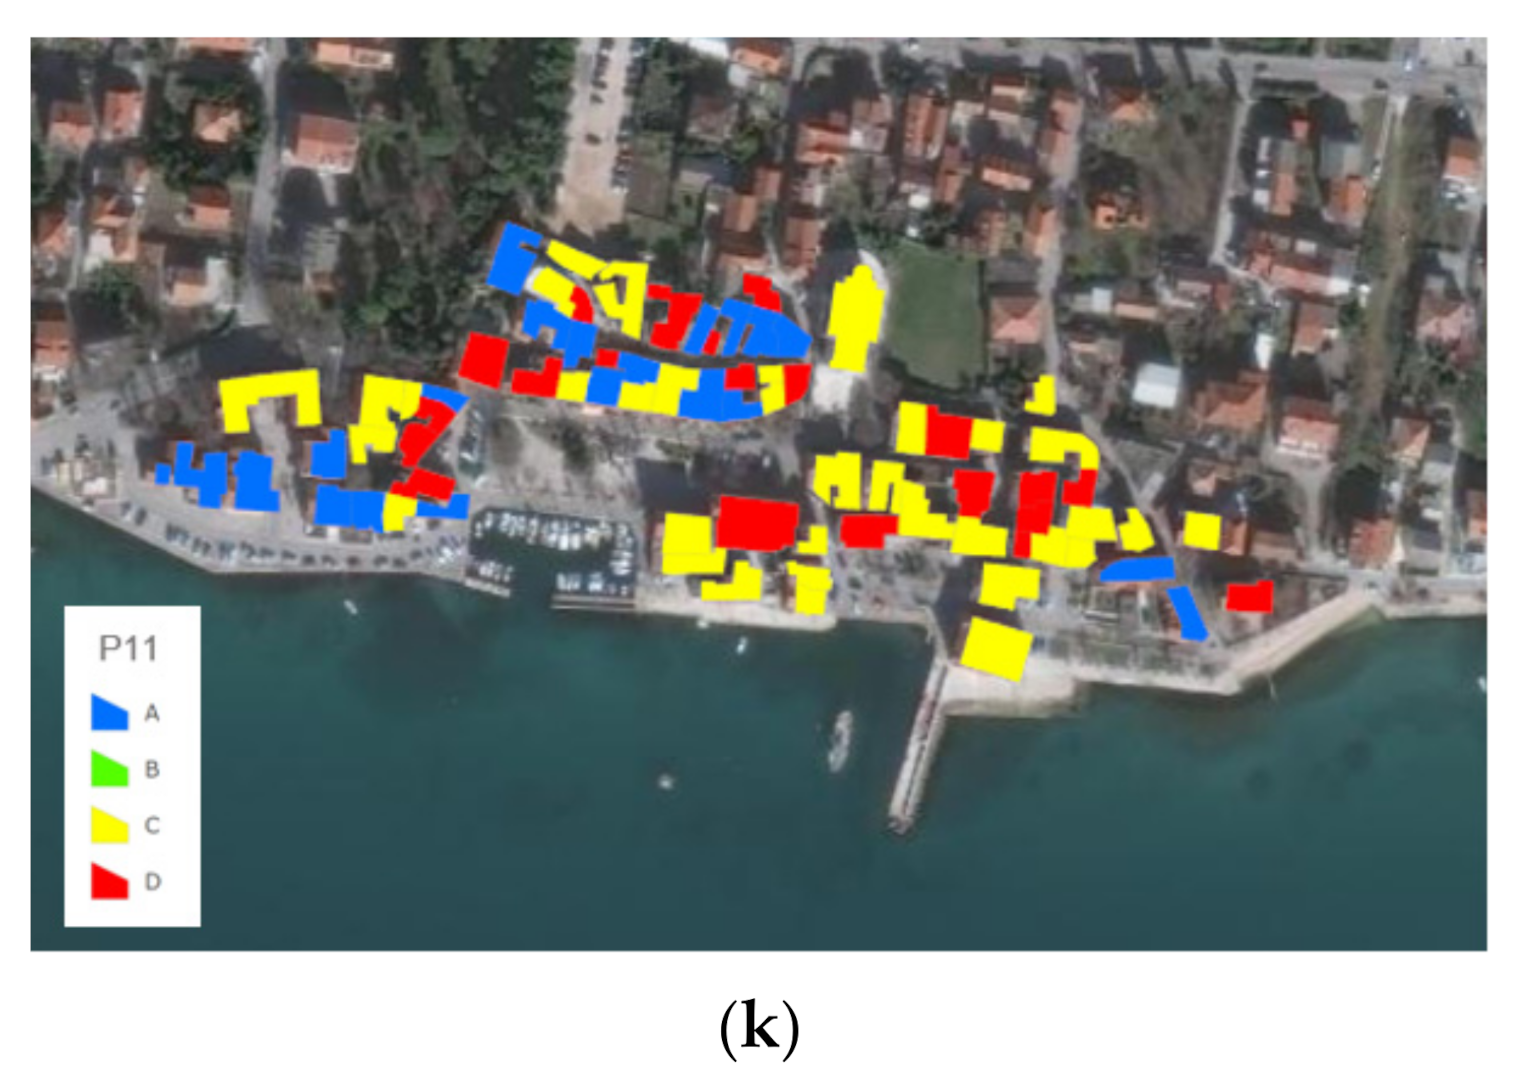
| State of conservation (P11) | 0 | 5 | 25 | 45 | 1.00 |
| Direction | Load | Eccentricity | PGAy/g | PGAc/g |
|---|---|---|---|---|
| +x | uniform | 0 | 0.063 | 0.148 |
| +x | linear | 0 | 0.057 | 0.144 |
| +x | modal | 0 | 0.257 | 0.264 |
| −x | uniform | 0 | 0.121 | 0.188 |
| −x | linear | 0 | 0.121 | 0.147 |
| −x | modal | 0 | 0.235 | 0.257 |
| +y | uniform | 0 | 0.046 | 0.095 |
| +y | linear | 0 | 0.033 | 0.088 |
| +y | modal | 0 | 0.051 | 0.168 |
| −y | uniform | 0 | 0.054 | 0.132 |
| −y | linear | 0 | 0.039 | 0.105 |
| −y | modal | 0 | 0.060 | 0.173 |
| +x | uniform | +5% | 0.052 | 0.130 |
| +x | uniform | −5% | 0.079 | 0.171 |
| +x | linear | +5% | 0.048 | 0.123 |
| +x | linear | −5% | 0.072 | 0.166 |
| +x | modal | +5% | 0.248 | 0.264 |
| +x | modal | −5% | 0.231 | 0.245 |
| −x | uniform | +5% | 0.109 | 0.151 |
| −x | uniform | −5% | 0.143 | 0.553 |
| −x | linear | +5% | 0.098 | 0.131 |
| −x | linear | −5% | 0.136 | 0.557 |
| −x | modal | +5% | 0.229 | 0.413 |
| −x | modal | −5% | 0.207 | 0.208 |
| +y | uniform | +5% | 0.040 | 0.089 |
| +y | uniform | −5% | 0.055 | 0.107 |
| +y | linear | +5% | 0.028 | 0.079 |
| +y | linear | −5% | 0.038 | 0.100 |
| +y | modal | +5% | 0.042 | 0.144 |
| +y | modal | −5% | 0.066 | 0.212 |
| −y | uniform | +5% | 0.048 | 0.118 |
| −y | uniform | −5% | 0.063 | 0.146 |
| −y | linear | +5% | 0.031 | 0.122 |
| −y | linear | −5% | 0.045 | 0.115 |
| −y | modal | +5% | 0.049 | 0.156 |
| −y | modal | −5% | 0.071 | 0.194 |
| Building | Vulnerability Index IV [%] | Yield Acceleration PGAy [g] | Collapse Acceleration PGAC [g] |
|---|---|---|---|
| Cambi Tower | 76.9 | 0.030 | 0.078 |
| St. Mihovil Church | 40.5 | 0.057 | 0.102 |
| Public Library | 59.0 | 0.028 | 0.079 |
| Rowing club | 40.2 | 0.064 | 0.141 |
| Kindergarten | 41.0 | 0.059 | 0.092 |
| Ballet School | 23.9 | 0.103 | 0.183 |
| Dudan Palace | 50.1 | 0.051 | 0.083 |
| Folk Castle | 58.7 | 0.081 | 0.080 |
| Kumbat Towers | 65.2 | 0.057 | 0.103 |
| Residential building | 34.8 | 0.081 | 0.152 |
| Perišin house | 48.7 | 0.058 | 0.121 |
Publisher’s Note: MDPI stays neutral with regard to jurisdictional claims in published maps and institutional affiliations. |
© 2021 by the authors. Licensee MDPI, Basel, Switzerland. This article is an open access article distributed under the terms and conditions of the Creative Commons Attribution (CC BY) license (https://creativecommons.org/licenses/by/4.0/).
Share and Cite
Nikolić, Ž.; Runjić, L.; Ostojić Škomrlj, N.; Benvenuti, E. Seismic Vulnerability Assessment of Historical Masonry Buildings in Croatian Coastal Area. Appl. Sci. 2021, 11, 5997. https://doi.org/10.3390/app11135997
Nikolić Ž, Runjić L, Ostojić Škomrlj N, Benvenuti E. Seismic Vulnerability Assessment of Historical Masonry Buildings in Croatian Coastal Area. Applied Sciences. 2021; 11(13):5997. https://doi.org/10.3390/app11135997
Chicago/Turabian StyleNikolić, Željana, Luka Runjić, Nives Ostojić Škomrlj, and Elena Benvenuti. 2021. "Seismic Vulnerability Assessment of Historical Masonry Buildings in Croatian Coastal Area" Applied Sciences 11, no. 13: 5997. https://doi.org/10.3390/app11135997
APA StyleNikolić, Ž., Runjić, L., Ostojić Škomrlj, N., & Benvenuti, E. (2021). Seismic Vulnerability Assessment of Historical Masonry Buildings in Croatian Coastal Area. Applied Sciences, 11(13), 5997. https://doi.org/10.3390/app11135997