Article

The Significance of Hydrophobicity for the Water Retention Properties of Sand and Coal

Priority Research Centre for Geotechnical Science and Engineering, University of Newcastle, Callaghan, NSW 2308, Australia
*
Author to whom correspondence should be addressed.
Appl. Sci. 2021, 11(13), 5966; https://doi.org/10.3390/app11135966
Submission received: 5 June 2021 / Revised: 22 June 2021 / Accepted: 23 June 2021 / Published: 26 June 2021
(This article belongs to the Special Issue Unsaturated Soils: Testing and Modelling)

Abstract

:
For mine wastes such as coal tailings, management of these materials requires complex geotechnical engineering that uses many soil properties, such as water retention. However, coal itself is chemically heterogeneous and often appears to be partially hydrophobic, which affects its water retention properties. This study aims to outline how hydrophobic soil particles and coal alter water retention curves compared to hydrophilic materials. The study involves four materials: sand, hydrophobized sand, crushed rock and crushed coal. Mixtures of sand with different proportions of hydrophobic particles had their water retention curves measured and compared, with the only variable being the particle surface characteristics. The rock and coal were separated into different particle size fractions and had their water retention curves measured and compared, with the only variable being particle hydrophobicity. A clear trend was observed for the sand mixtures: the degree of saturation at any suction was reduced when increasing the hydrophobicity of the material. This trend indicates the fundamental water retention behavior expected for soils more hydrophobic than is typical, which was not clearly demonstrated in previous studies. However, a similar trend was not seen when comparing the rock and otherwise identical hydrophobic coal samples, which actually appeared hydrophilic in terms of water retention. ESEM imaging shows a dual hydrophilic and hydrophobic behavior for coal which may explain the result. However, further research is required to understand the discrepancy, which appears to be caused by an unknown coal–water phenomena.

1. Introduction

The movement and retention of water in soils is fundamental to many important considerations, from ground stability to ecosystem sustainability. When mining for resources such as ore or coal, the extracted resources usually undergo a beneficiation process, which creates a fine-grained waste product of a high water content called tailings. Coal tailings are a form of artificial granular soil from coal mining that can have a coal content of 40% or higher [1,2], with the rest being mineral particles coming from the overburden and underlying layers of soils and rocks. As for all wastes, tailings must be responsibly managed in the environment, and an understanding of their water retention properties is an essential consideration.
Coal tailings are often disposed in dams, encapsulated in cells within waste rock dumps or mixed with coarse reject and co-disposed with waste rock in spoil piles. Tailings dams are usually capped to allow future usage of the land, and this capping is a non-trivial geotechnical operation requiring knowledge of the drying rate of the tailings which, in turn, requires an estimation of the water retention and permeability functions of the tailings. Previous research has shown that coal, and consequently tailings, are more hydrophobic than common soils [3,4,5,6,7], which can significantly alter their water retention properties and hydraulic behavior. However, most models for permeability functions and water retention curves (WRCs) developed in unsaturated soil mechanics pertain to hydrophilic soils. Thus, in the management of tailings, it is important to consider the significance of materials of higher hydrophobicity in the context of geotechnical and geoenvironmental engineering.
The hydrophobicity of coal arises from the presence of various organic components called macerals that are predominantly composed of large aromatic hydrocarbon molecules, usually 150–250 carbon atoms. There are a variety of maceral types, and each varies in its degree of hydrophobicity [8]. Unlike the rock-forming minerals, macerals are not stoichiometrically predictable, so even a particular maceral type may exhibit variability in its degree of hydrophobicity. Coal itself is heterogeneous in its chemical composition [9,10], and a single coal particle may contain many different macerals. The variability of maceral hydrophobicity causes local variation of hydrophobicity on individual coal particle surfaces [3]. Further complication arises when considering coal tailings, which contains heterogeneous coal particles as well as hydrophilic rock mineral particles.
Few papers in the literature have considered how the hydrophobicity of soil affects water retention. One study investigated how the wettability (i.e., a measure of hydrophobicity) affects soil water drying curves [11]. This was done by comparing drying curves between three hydrophilic soils (sand, loam and silt loam) and then for the same three soils treated to become hydrophobic. Most notably, air entry was observed to occur at lower suctions for the hydrophobic soils. However, the study presented drying path retention curves in terms of the gravimetric water content, which may lead to an incorrect indication of air entry due to soil shrinkage. Drying curves expressed volumetrically would show when air entry occurs without any doubts of its reliability. Another study focused on the effect of the water–surface contact angle on WRCs [12]. This was achieved by measuring the pore size distributions and contact angles of two soils and estimating the WRCs from the pore size distributions using a capillarity model. Two WRCs were shown for each soil: one using a contact angle of zero and the other using the measured angle for that soil. As expected, increasing the contact angle caused a reduction of the predicted suction at any water content. However, the authors did not actually measure the WRCs, and this lack of experimental determination means the conclusions of the study may not represent reality.
This study aims to highlight the effects of particle hydrophobicity on the water retention curves of different materials, including coal. This fundamental level research may allow for deeper understanding of the retention properties of coal and coal tailings, providing more information for their management. To clearly outline how hydrophobicity affects water retention, this study compares the measured WRCs of two soil materials with hydrophilic particles (silica sand and crushed rock) and two counterparts with hydrophobic particles (hydrophobized sand and crushed coal). The goal is to compare the WRCs of natural sand and hydrophobized sand (where the only difference is the degree of hydrophobicity) and compare the WRCs for the crushed materials (where the differences are the nature of the particles and the hydrophobicity). The WRCs of several sand mixtures with varying proportions of hydrophobized particles are also considered, allowing insight into how the proportion of hydrophobic particles in the soil affects the WRC. Furthermore, the crushed coal and rock materials were separated into different particle size fractions with the WRCs measured for each to observe how hydrophobicity affects the WRCs for different-sized particles. To ensure that any differences seen in the WRCs are due to hydrophobicity, comparisons are only made between materials that have a similar particle size distribution (PSD), particle shape and void ratio. A simple model to predict the WRC is applied to the sand mixtures with the objective of investigating how a WRC model may be modified to capture the WRC of hydrophobic materials. The wetting behavior of hydrophilic and hydrophobic materials was also observed qualitatively at a particle scale using an environmental scanning electron microscope, which allows the condensation of water droplets on particle surfaces to be observed.

2. Materials and Methods

2.1. Materials

The materials used in this study included washed Stockton beach sand [13], blocks of intact coal from a Permian black (bituminous) coal mine in New South Wales, Australia and fresh crushed aggregate from a dacite rock quarry. The sand was selected as a suitable basic granular material, for which the effects of a progressively increased proportion of hydrophobic particles could be studied. The crushed fresh dacite rock was selected to provide a source of clay-free soil with typical hydrophilic minerals that might be found in most soils and which could serve in a comparison with crushed coal, with its textural characteristics being otherwise equivalent.
The sand was used in its natural condition; that is, its particle size and shape were not modified in any way. The rock and coal were first crushed into pieces of less than 10 mm in size using a ceramic pestle and then ground into a powder with an agate mill (Retsch RM200). The crushed material was then sorted into four particle size ranges by wet sieving (with deionized water) through appropriate sieve stacks. The process was accelerated by using an ultrasonic probe to agitate the particles, increasing the drainage rate of the water and particles through each sieve. Coal is known to spontaneously oxidize upon exposure to air, which could potentially alter its hydrophobicity [14,15,16]. To avoid measuring data on coal with evolving properties, the coal was allowed to oxidize for 6 months before being used. It was assumed that after this period of time, further oxidation at the coal surface would be slow enough such that the hydrophobicity would be relatively consistent over the testing period. The particle size ranges and corresponding specific gravity (measured using a Micromeritics Accupyc II) for all of the materials are reported in Table 1.
From the observations of microscope images of each particle size fraction of coal and rock, the particles appeared to have a similar angular shape, as is evident from the microscope images of the crushed materials between 150 and 212 μm in Figure 1.
Similar shapes to those shown in Figure 1 were seen for all size fractions. The microscope images of the crushed materials were also used to construct an estimate of the PSD within each sieve size to verify that, within the size fraction, the materials had a similar PSD.
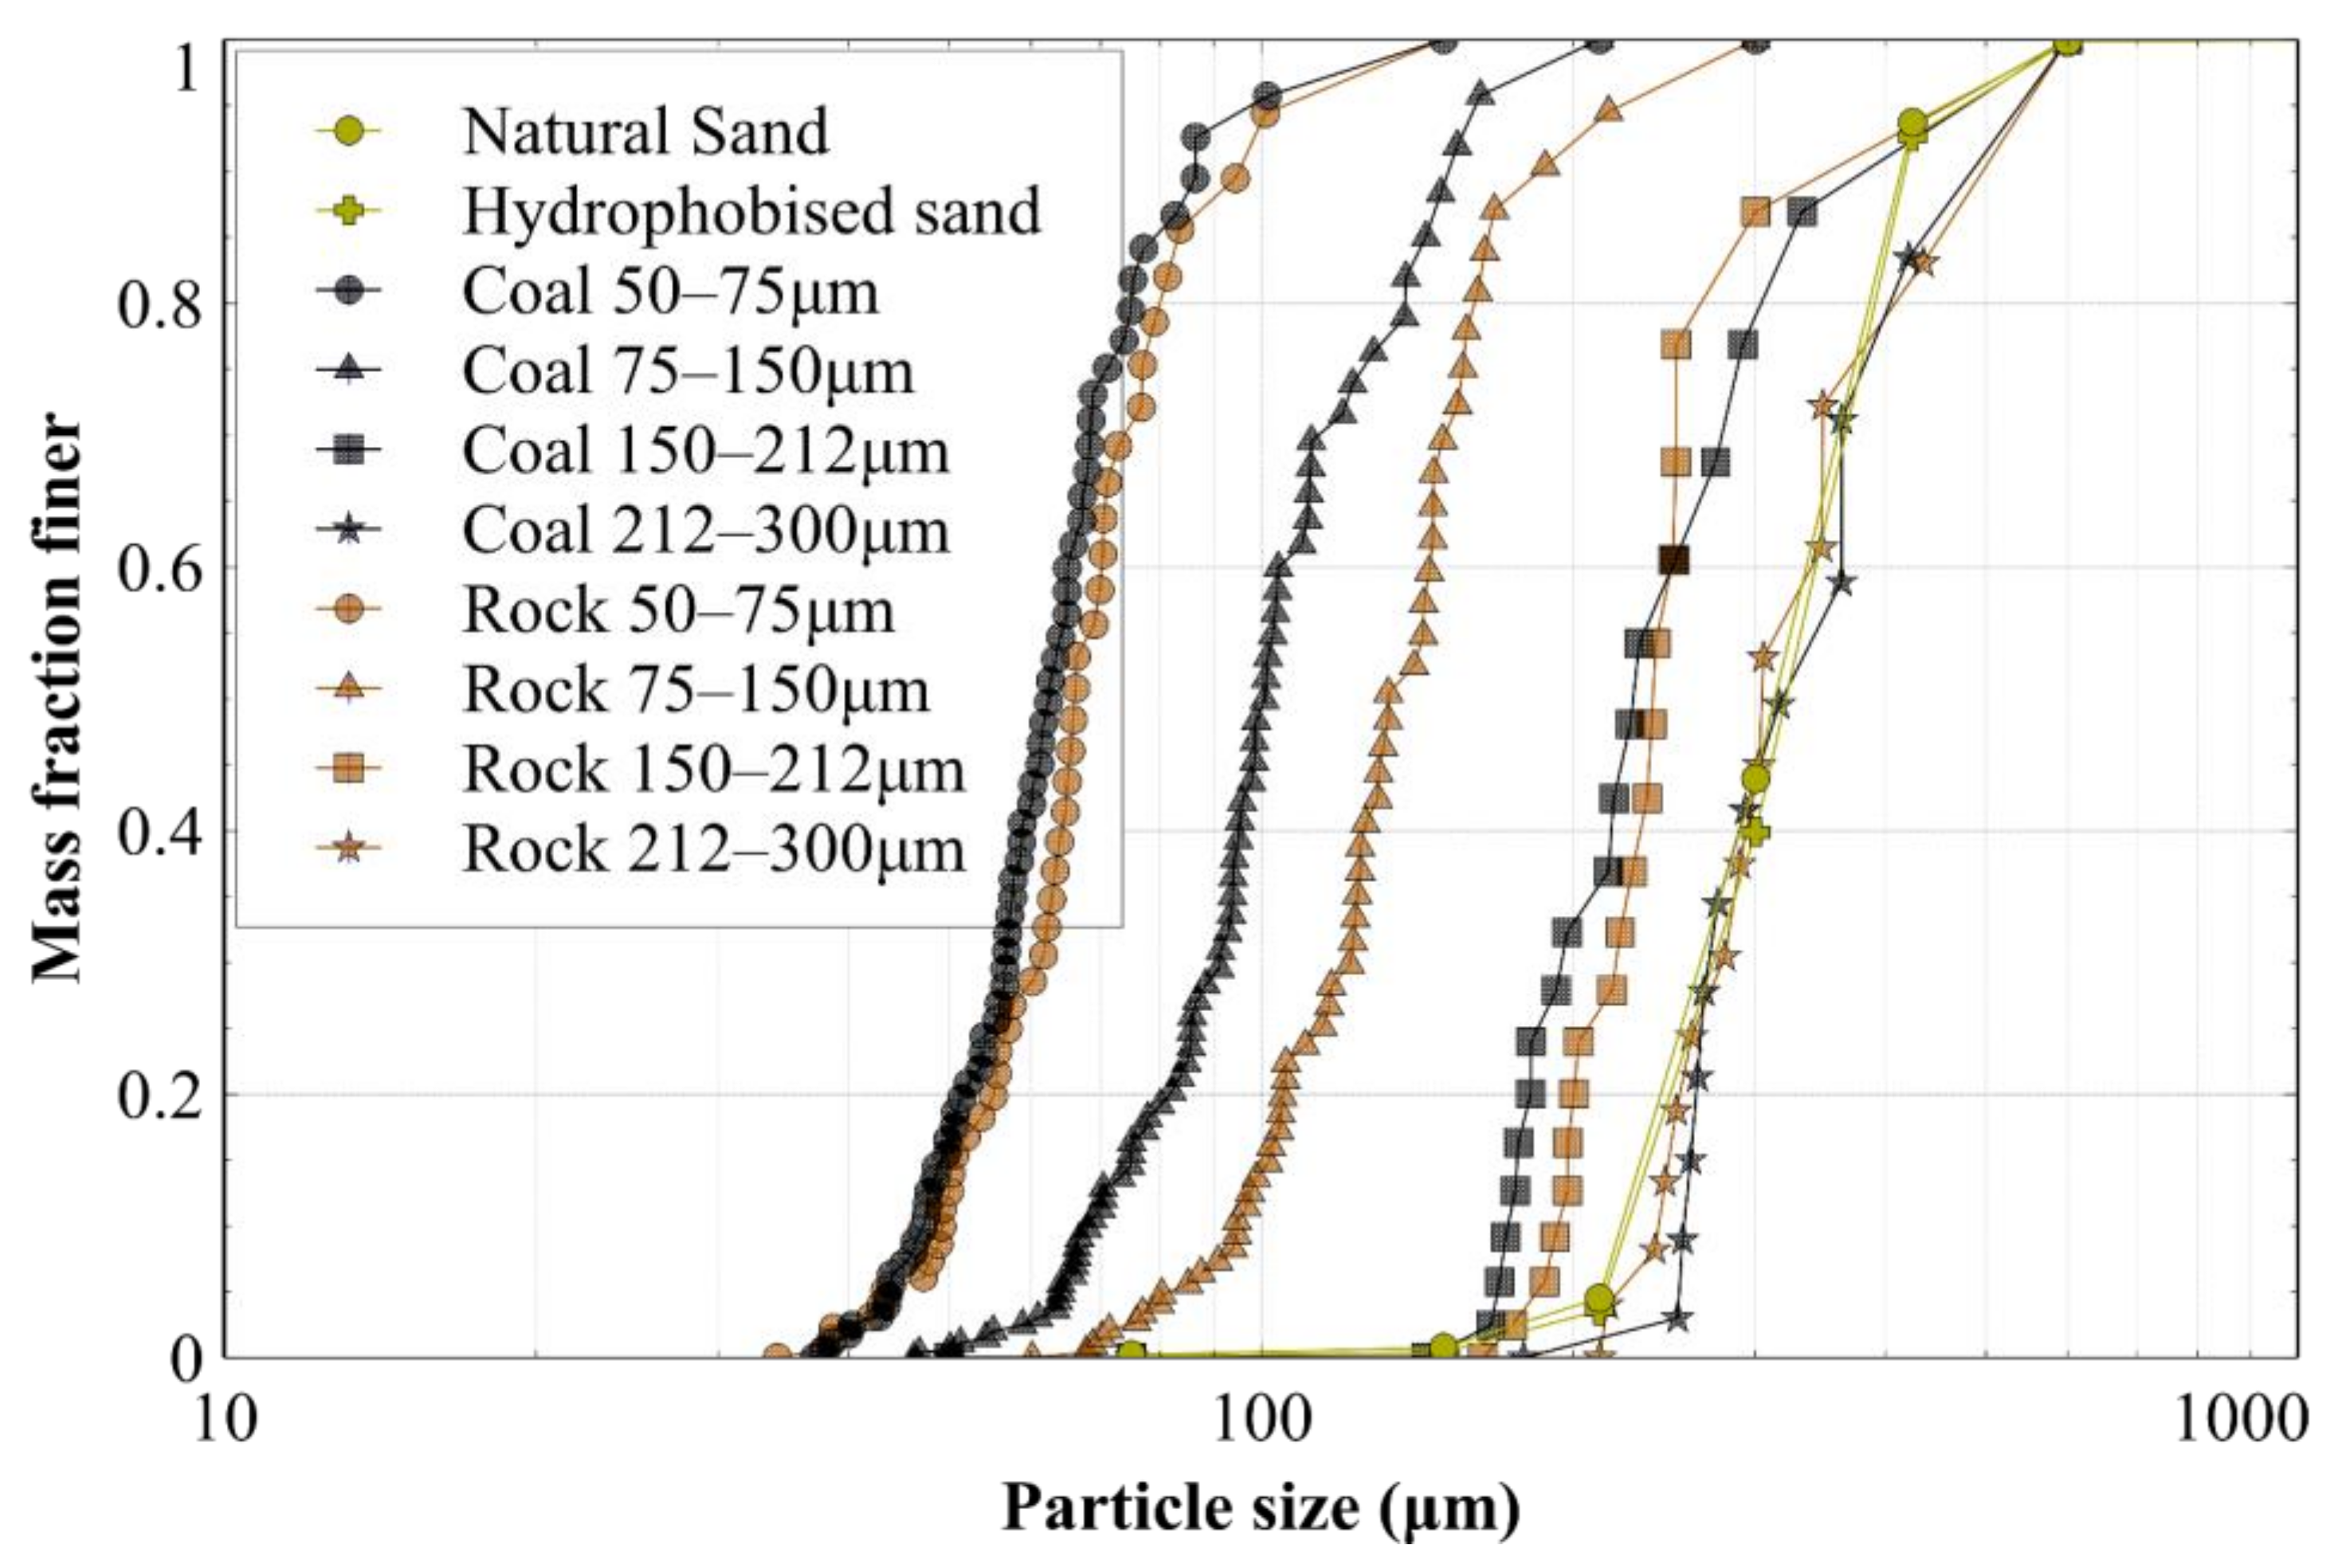
To construct the GSD for each material, the open-source image analysis software ImageJ was used, which provided the maximum and minimum Feret diameter of each particle in an image. Each particle was then simplified to a sphere, with the diameter equal to the average of the two Feret diameters. Note that the accuracy of the PSD constructed with this method was limited by a lack of information in the third dimension. Nevertheless, each particle in the microscope images had an associated volume and diameter, allowing the size distributions to be determined. The resulting PSDs are shown in Figure 2, which shows that the PSDs of the crushed rock and crushed coal were relatively consistent for all but one size fraction. Only the 75–150 μm fraction displayed a small difference between rock and coal, which was still deemed acceptable given the lack of control of particles between two consecutive sieves.
Stockton sand is a poorly graded sand composed of 98.8% quartz (silica) grains, with particle sizes ranging from 0.2 mm to 0.5 mm and a D50 of around 0.3 mm, as measured with dry sieving (see particle size distribution in Figure 2), and a measured specific gravity of 2.65. A hydrophobic coating was applied to the sand, using the procedure described in Section 2.2.1, and mixtures of 100:0, 75:25, 50:50, 25:75 and 0:100 of relative proportions of natural sand and hydrophobized sands were prepared and tested. The coating caused no considerable change in the particle size distribution, as can be seen in Figure 2.

2.2. Methods

2.2.1. Application of Hydrophobic Coating

A common practice for hydrophobizing soils (and other materials) is the use of Dichlorodimethylsilane (see the process described in [11]). However, due to the time and safety constraints associated with this chemical, spray-on shoe waterproofing (Spendless Shoes brand) was used as a simple, safe and inexpensive method to add a hydrophobic coating to the sand. Sand was placed into a container at a depth of around 1 cm and then sprayed numerous times while mixing occasionally. When the sand appeared to be saturated with the liquid coating, it was allowed to dry overnight. At this stage, much of the sand was lightly cemented together with the solidified coating, and it was broken apart through mixing and brushing against a sieve with a paintbrush. The hydrophobized sand was only used once to avoid the risk of the hydrophobic coating wearing or washing off or in some other way losing effectiveness.

2.2.2. Measurement of the Contact Angle

The advancing and receding contact angle (denoted CA) was determined for each material with a method based on a sessile drop technique [17]. This method, along with others, typically calls for samples to be a polished block of intact material [18,19]. However, in this study where the samples were granular, a material preparation process specific to soils had to be adopted [20]. A brief description of the adopted method is provided here, and the reader is directed to [17,20] for further details. The granular materials in this study were adhered with a consistent weight per unit area for 5 s to double-sided tape that was attached to a flat, rigid surface to create a bed of adhered grains. Excess material was removed by gently tapping near the grains, and the adhering process was repeated once to increase the number of grains adhered. The samples were tested within a laboratory where the air was continually conditioned to a relatively consistent temperature. Before undertaking any tests, the room temperature was required to be 22 °C ± 2 °C for consistency. Deionized water droplets around 5–7 mm or larger in base diameter were deposited on the surface of the grain bed with a syringe. The droplets used to measure the advancing angles required no special treatment. However, the droplets used to measure the receding angle required removing water from the droplet until its base diameter started reducing [17]. The images of the droplets were captured with a digital camera (Panasonic DMC-FZ20 with a standard lens) positioned at the level of the tape approximately 40 mm from the droplets. The image analysis software ImageJ was used to manually measure the angle between the grain bed surface and a tangent drawn to the droplet meniscus at its contact with the grain bed. Nine or more droplets were measured to observe the variance. The particle sizes adhered to the tape were kept between 20 and 50 μm for the crushed materials to avoid a possible effect of variable surface roughness on the CA. However, the sand was not crushed to 20–50 μm as it was unclear if the surface characteristics would remain representative of the uncrushed sand. Thus, the CAs of the crushed rock and coal materials were not strictly comparable with those of the sand, as the CA measured for the sand had an extra source of variability.

2.2.3. Measurement of the Drying Path of the Soil Water Retention Curves

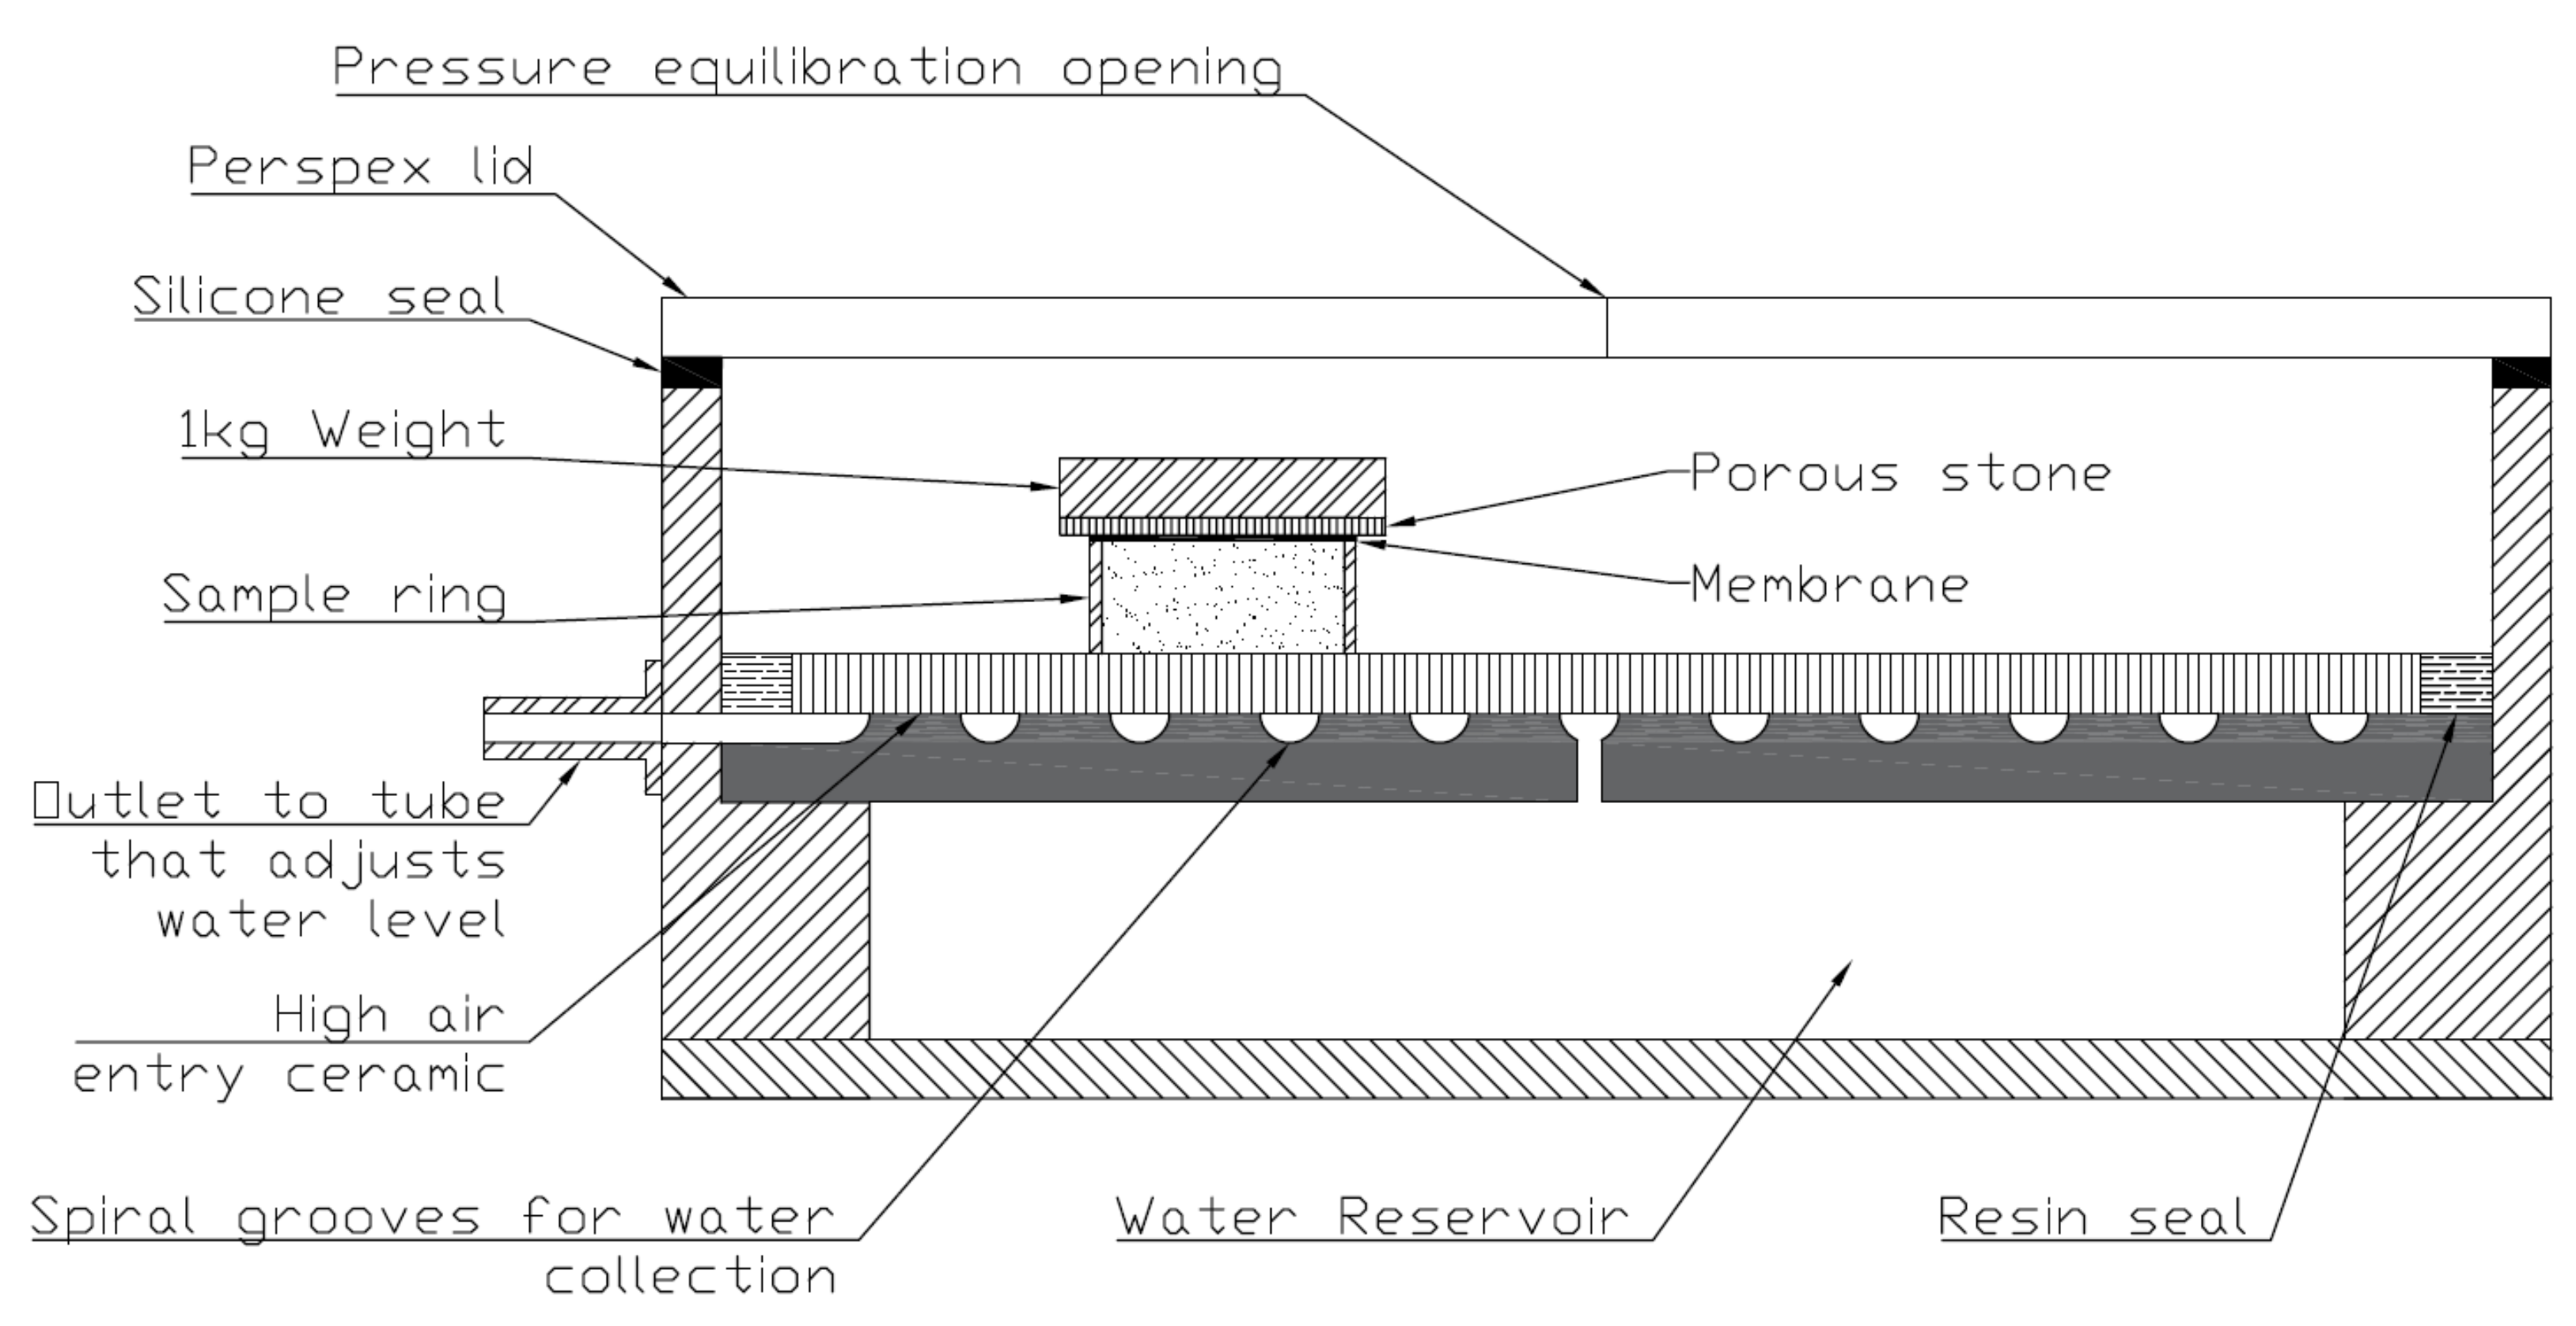
The drying path of the water retention curve was obtained from a hanging column (also called a negative water column) [21] which had a porous ceramic 30 cm in diameter with an air entry suction of 50 kPa. Pressure was induced in the water reservoir beneath the stone by adjusting the level of a clear, flexible tube (water column) attached to the reservoir at an outlet just below the plate. Suction was induced in the reservoir when the water level of the tube was below the porous ceramic, as this placed the water into tension. Figure 3 shows a diagram of the apparatus used.
The large diameter porous ceramic was used to allow several small samples to be placed on the column concurrently. To track the change in water content with imposed suction as the column was lowered in increments, each sample could be removed to measure its mass and infer its water content from the initial moisture content and progressive mass change. The material samples were contained in stainless steel rings (45 mm in diameter and 19 mm high) with filter paper and a supporting mesh glued to the bottom of the rings which prevented material loss when handling the samples. The sample volume was assumed to be the internal volume of the steel rings, which was measured with a standard error of 0.23%. Since WRCs are known to be sensitive to the arrangement of the granular fabric, each sand mixture specimen was compacted into the steel rings at a void ratio of approximately 0.68, while the crushed materials were compacted to a void ratio of approximately 0.8 for all size fractions. These values of void ratios were selected to minimize handling issues with the materials and ensure that similar fabrics could be maintained throughout the duration of the tests. As the results for the sand were not directly compared to the results for crushed rock and coal in this study, having two different void ratios was not problematic. Before inducing any suction, the samples were saturated by submersion in deionized water and de-airing with a vacuum. During the saturation process, the samples were clamped between two porous plates that allowed air to escape yet prevented material loss and deformation.
In the preliminary hanging column tests, some tendency for swelling of some samples was observed. For the tests reported here, this was restrained by placing a 1-kg weight on the sample that overlaid the filter paper, rubber membrane and a porous stone as illustrated in Figure 3. Thus, since no shrinkage was observed during testing, the samples maintained a constant volume, which allowed the volumetric water content and degree of saturation to be inferred from the gravimetric water content.

2.2.4. Microscopy Imaging

The typical particle shape seen in each particle size range was observed with an optical microscope (Zeiss Axio Imager A1). A small amount of material was placed onto a white plate. Images were taken in multiple locations on the plate for each material, using a focus that optimized the clarity of the particle edges (refer to Figure 1).
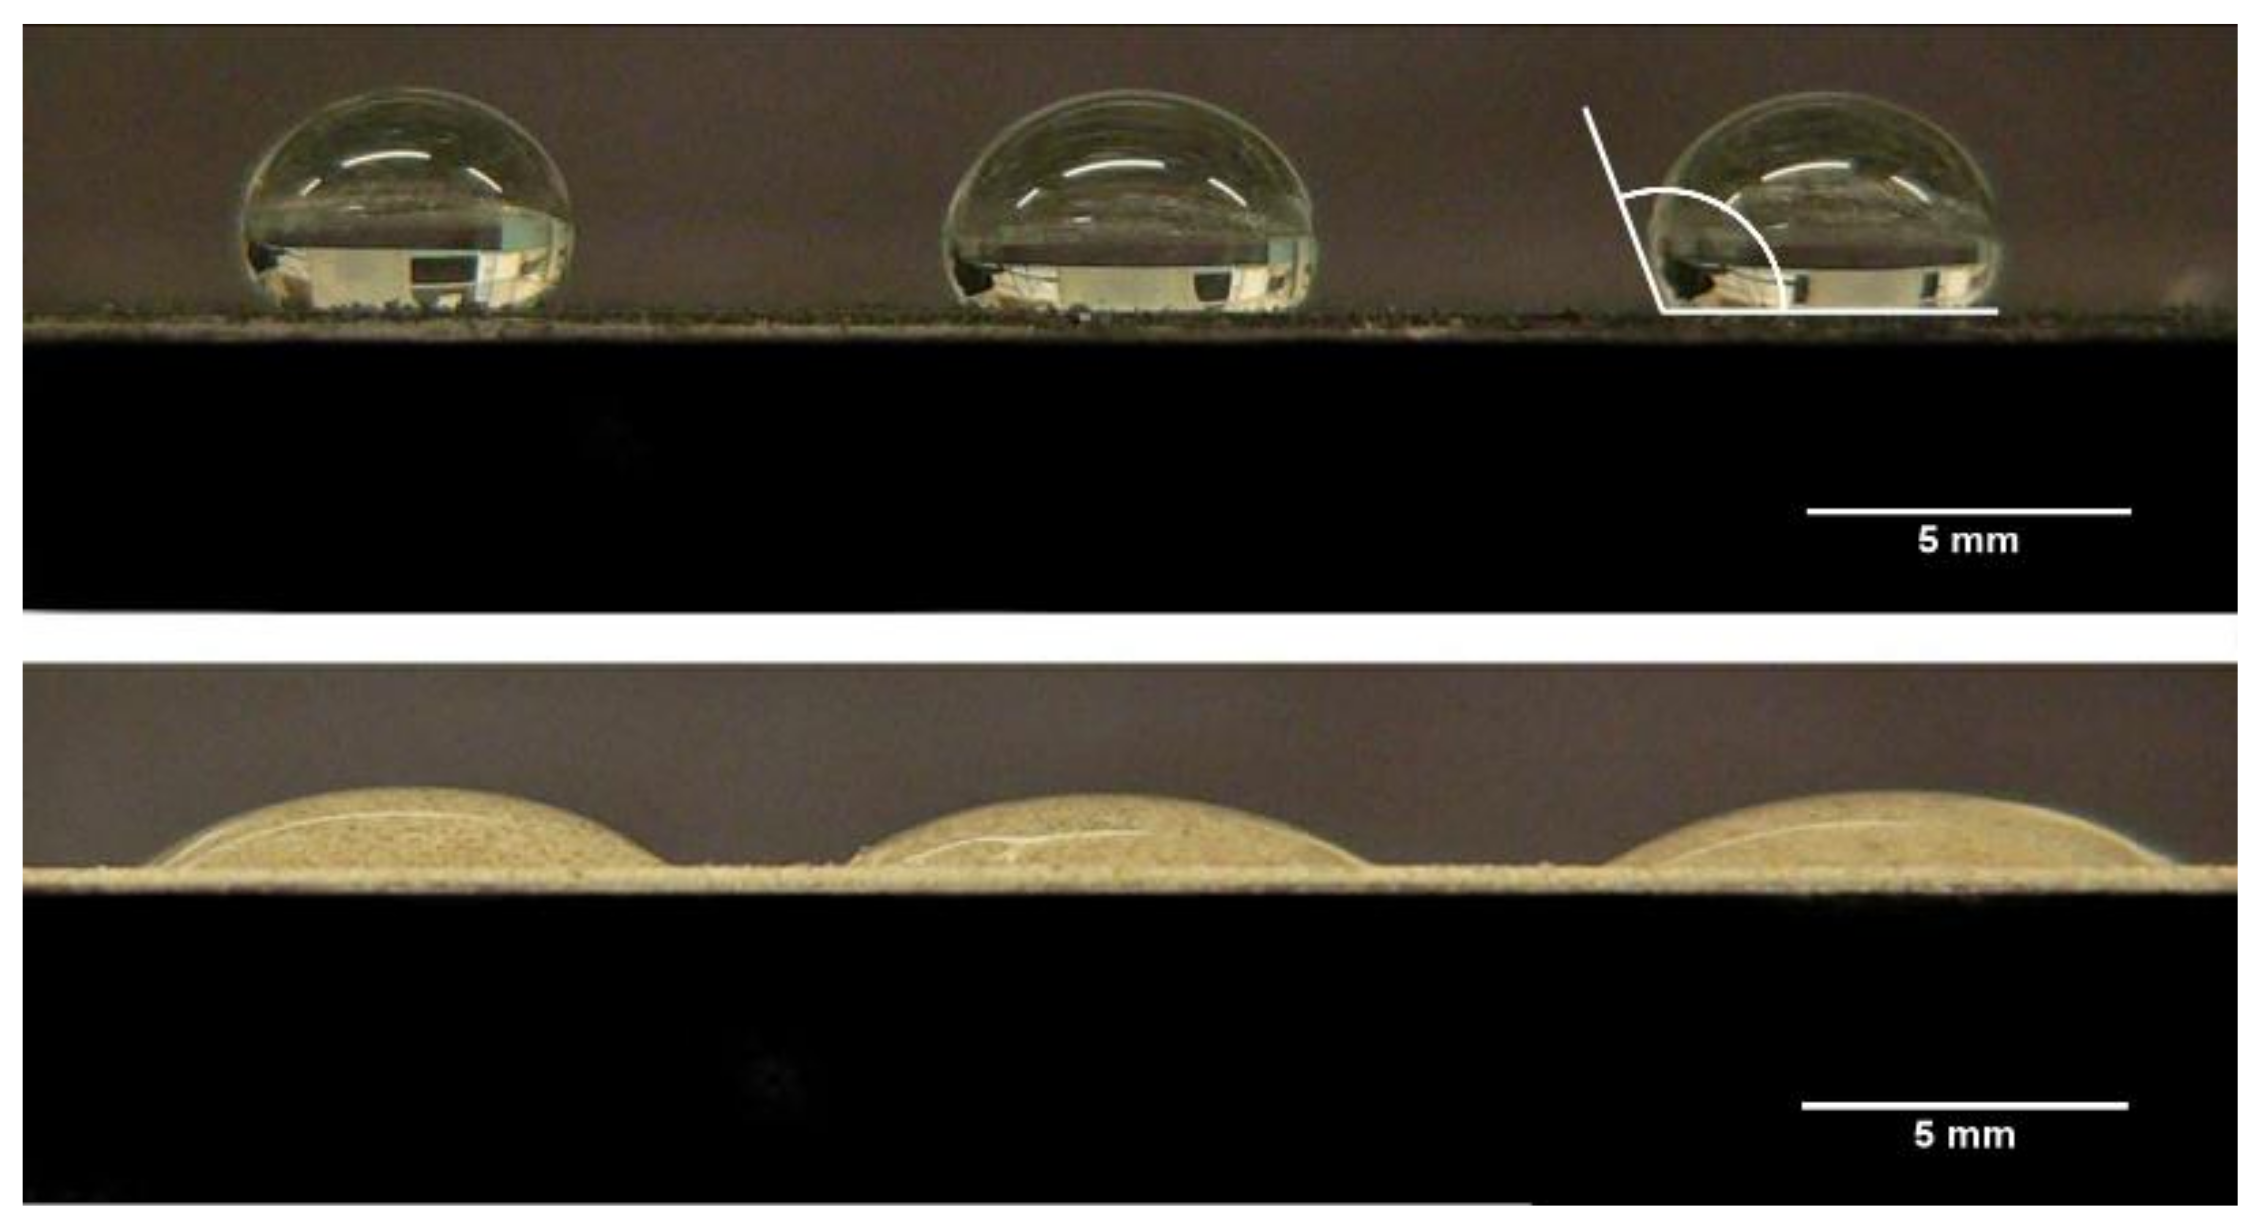
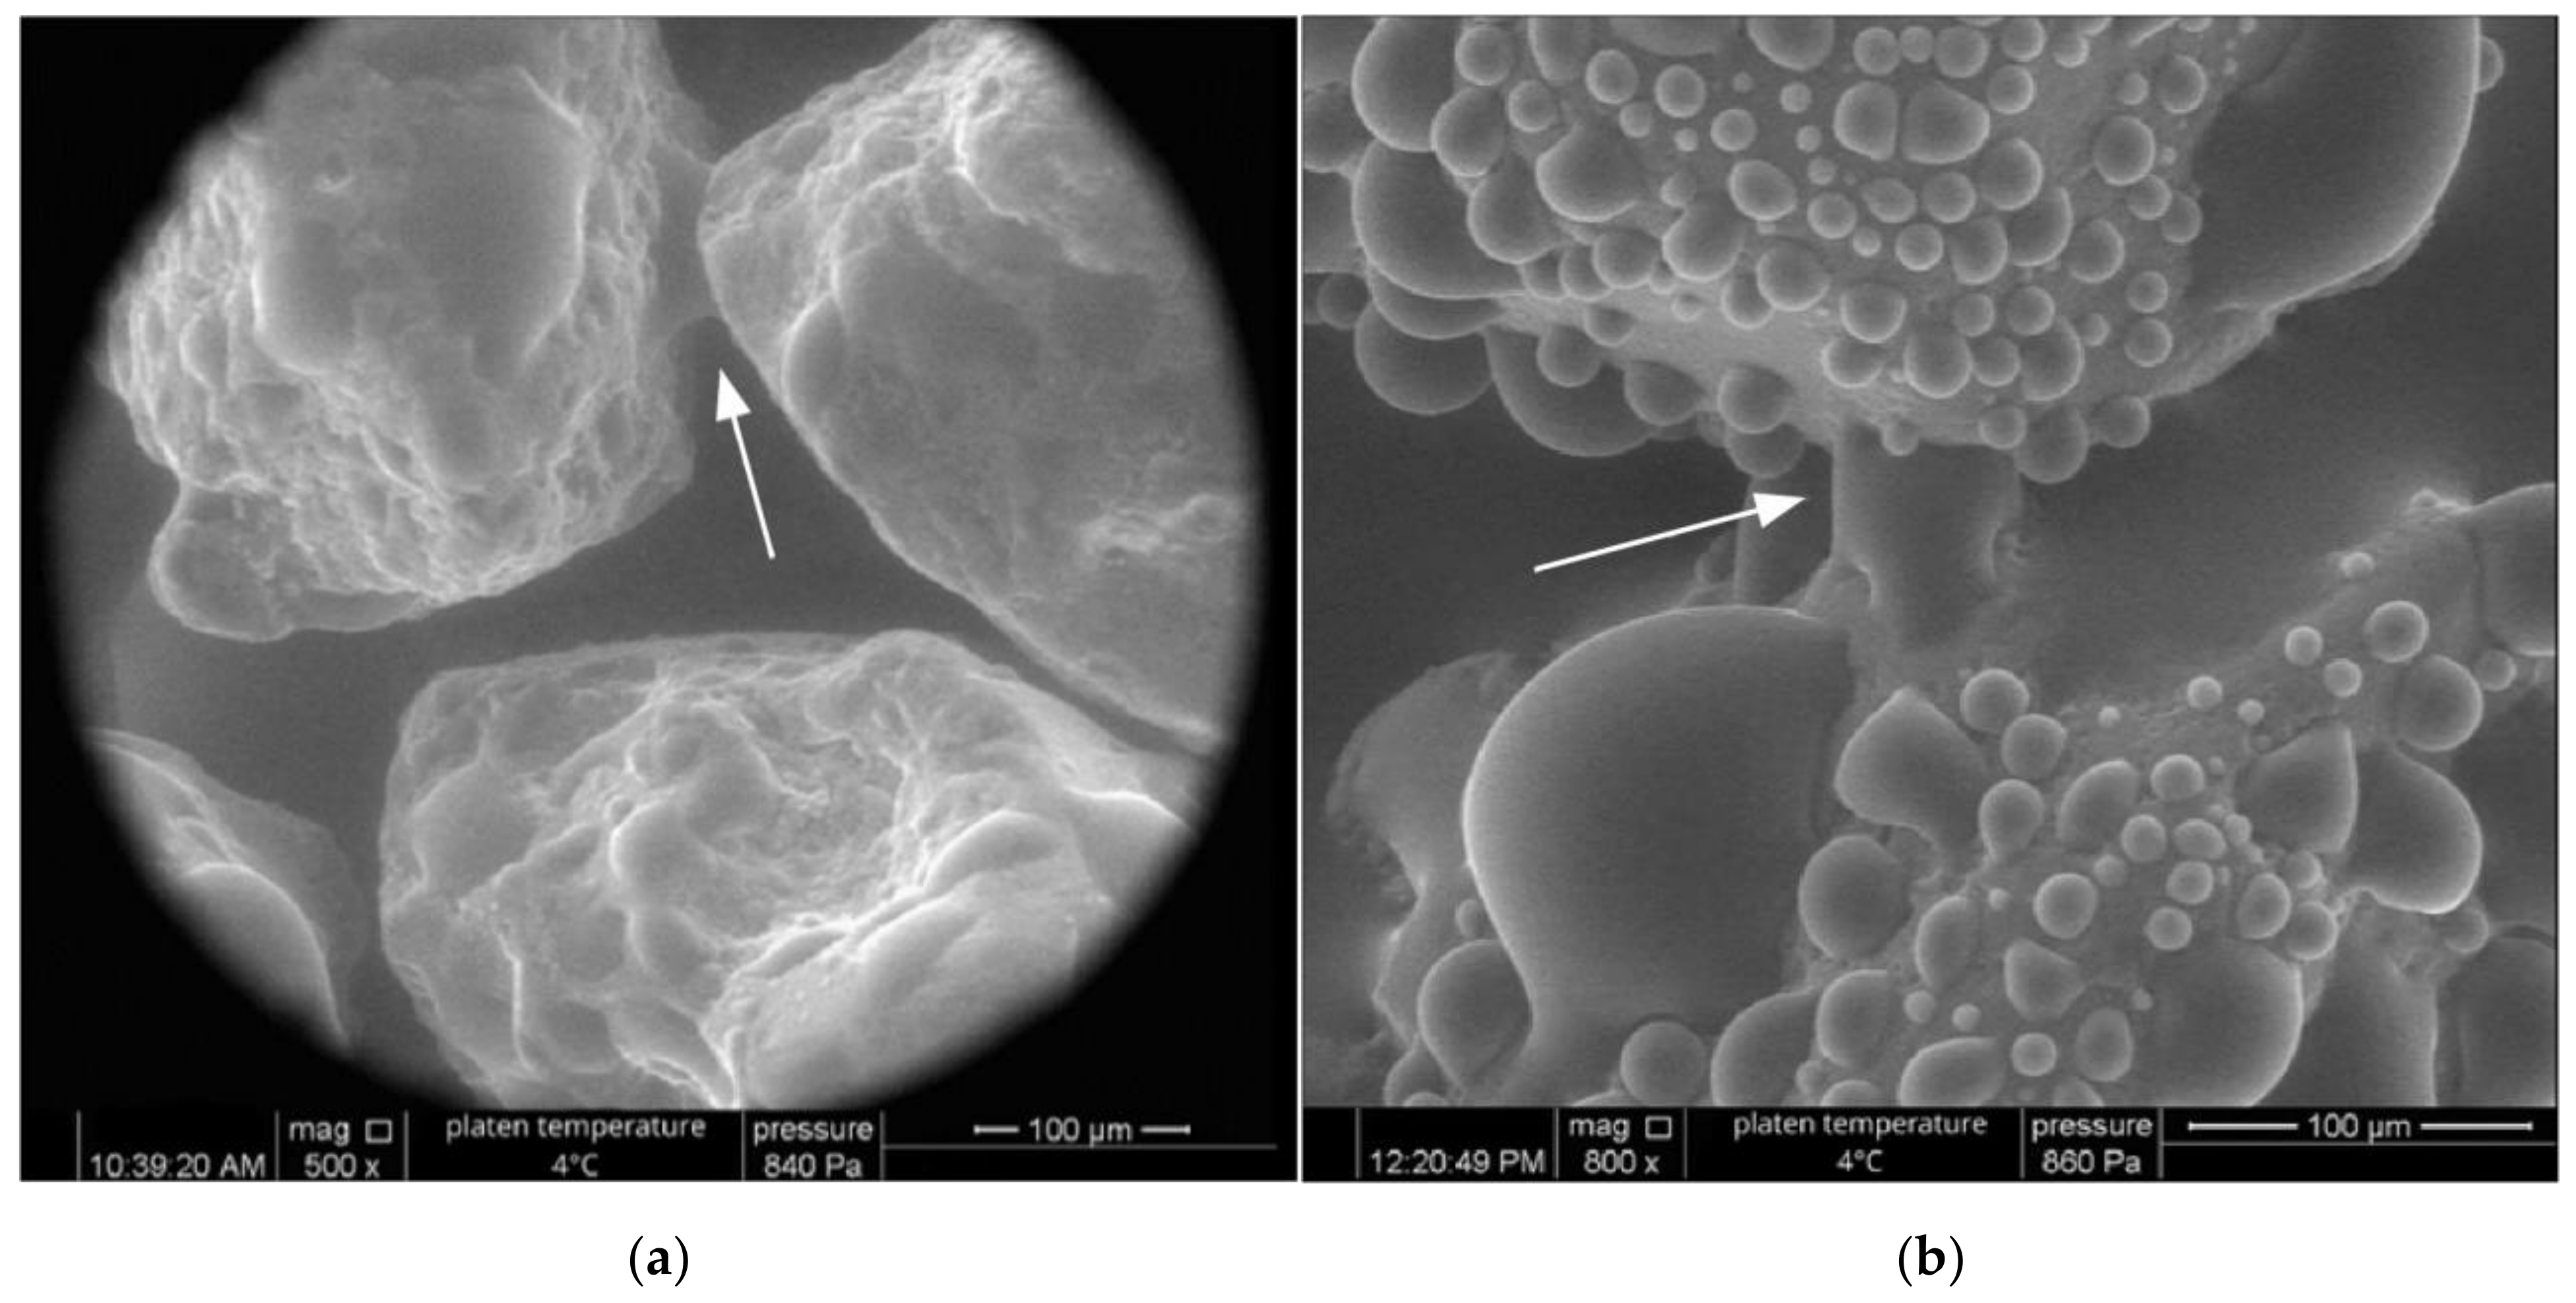
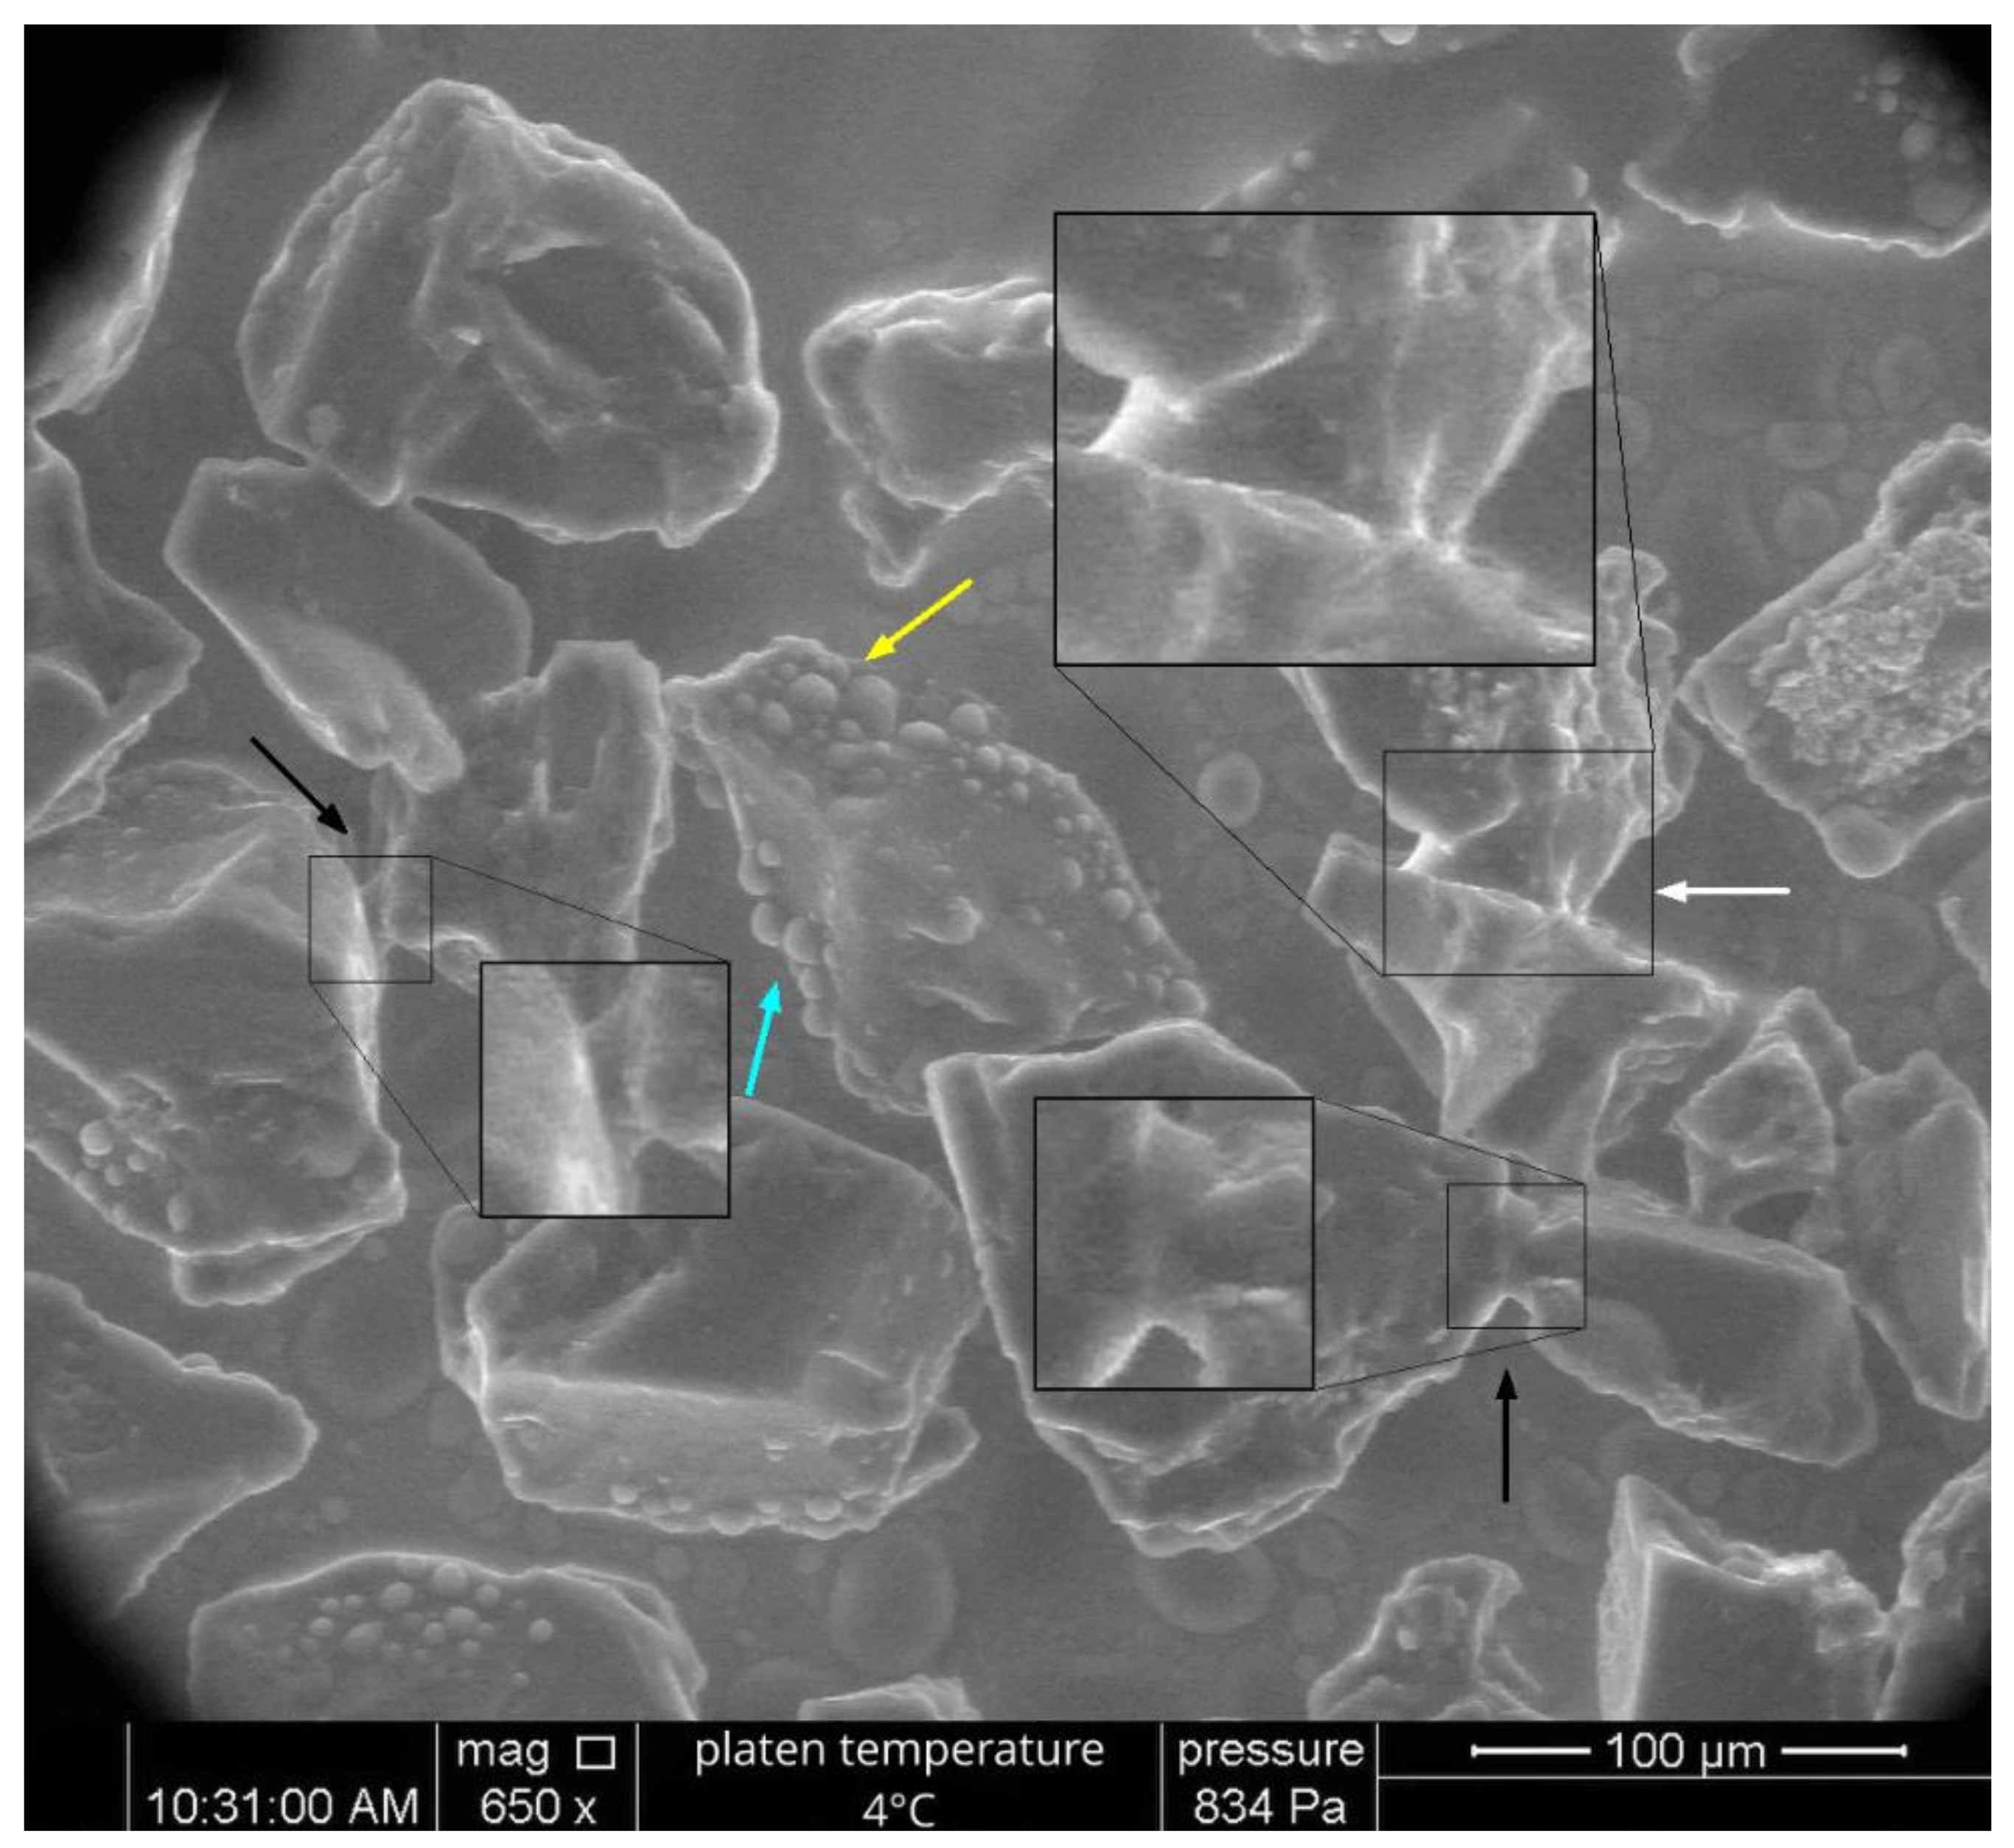
The wetting and drying of natural sand, hydrophobic sand and coal was studied within an environmental scanning electron microscope (ESEM). The ESEM allowed progressive condensation or evaporation of water on the particle surfaces by controlling the chamber air pressure (typically between 0.2 and 1.2 kPa) while maintaining the sample plate at a temperature of 4 °C. A conductive coating was not applied to any samples observed (as is required for some SEM analyses) because the surface characteristics would change significantly. The ESEM used in this study was a FEI Quanta 3D FEGSEM with an accelerating voltage of 20 kV operated by the Monash Centre for Electron Microscopy.

2.3. Experimental Program

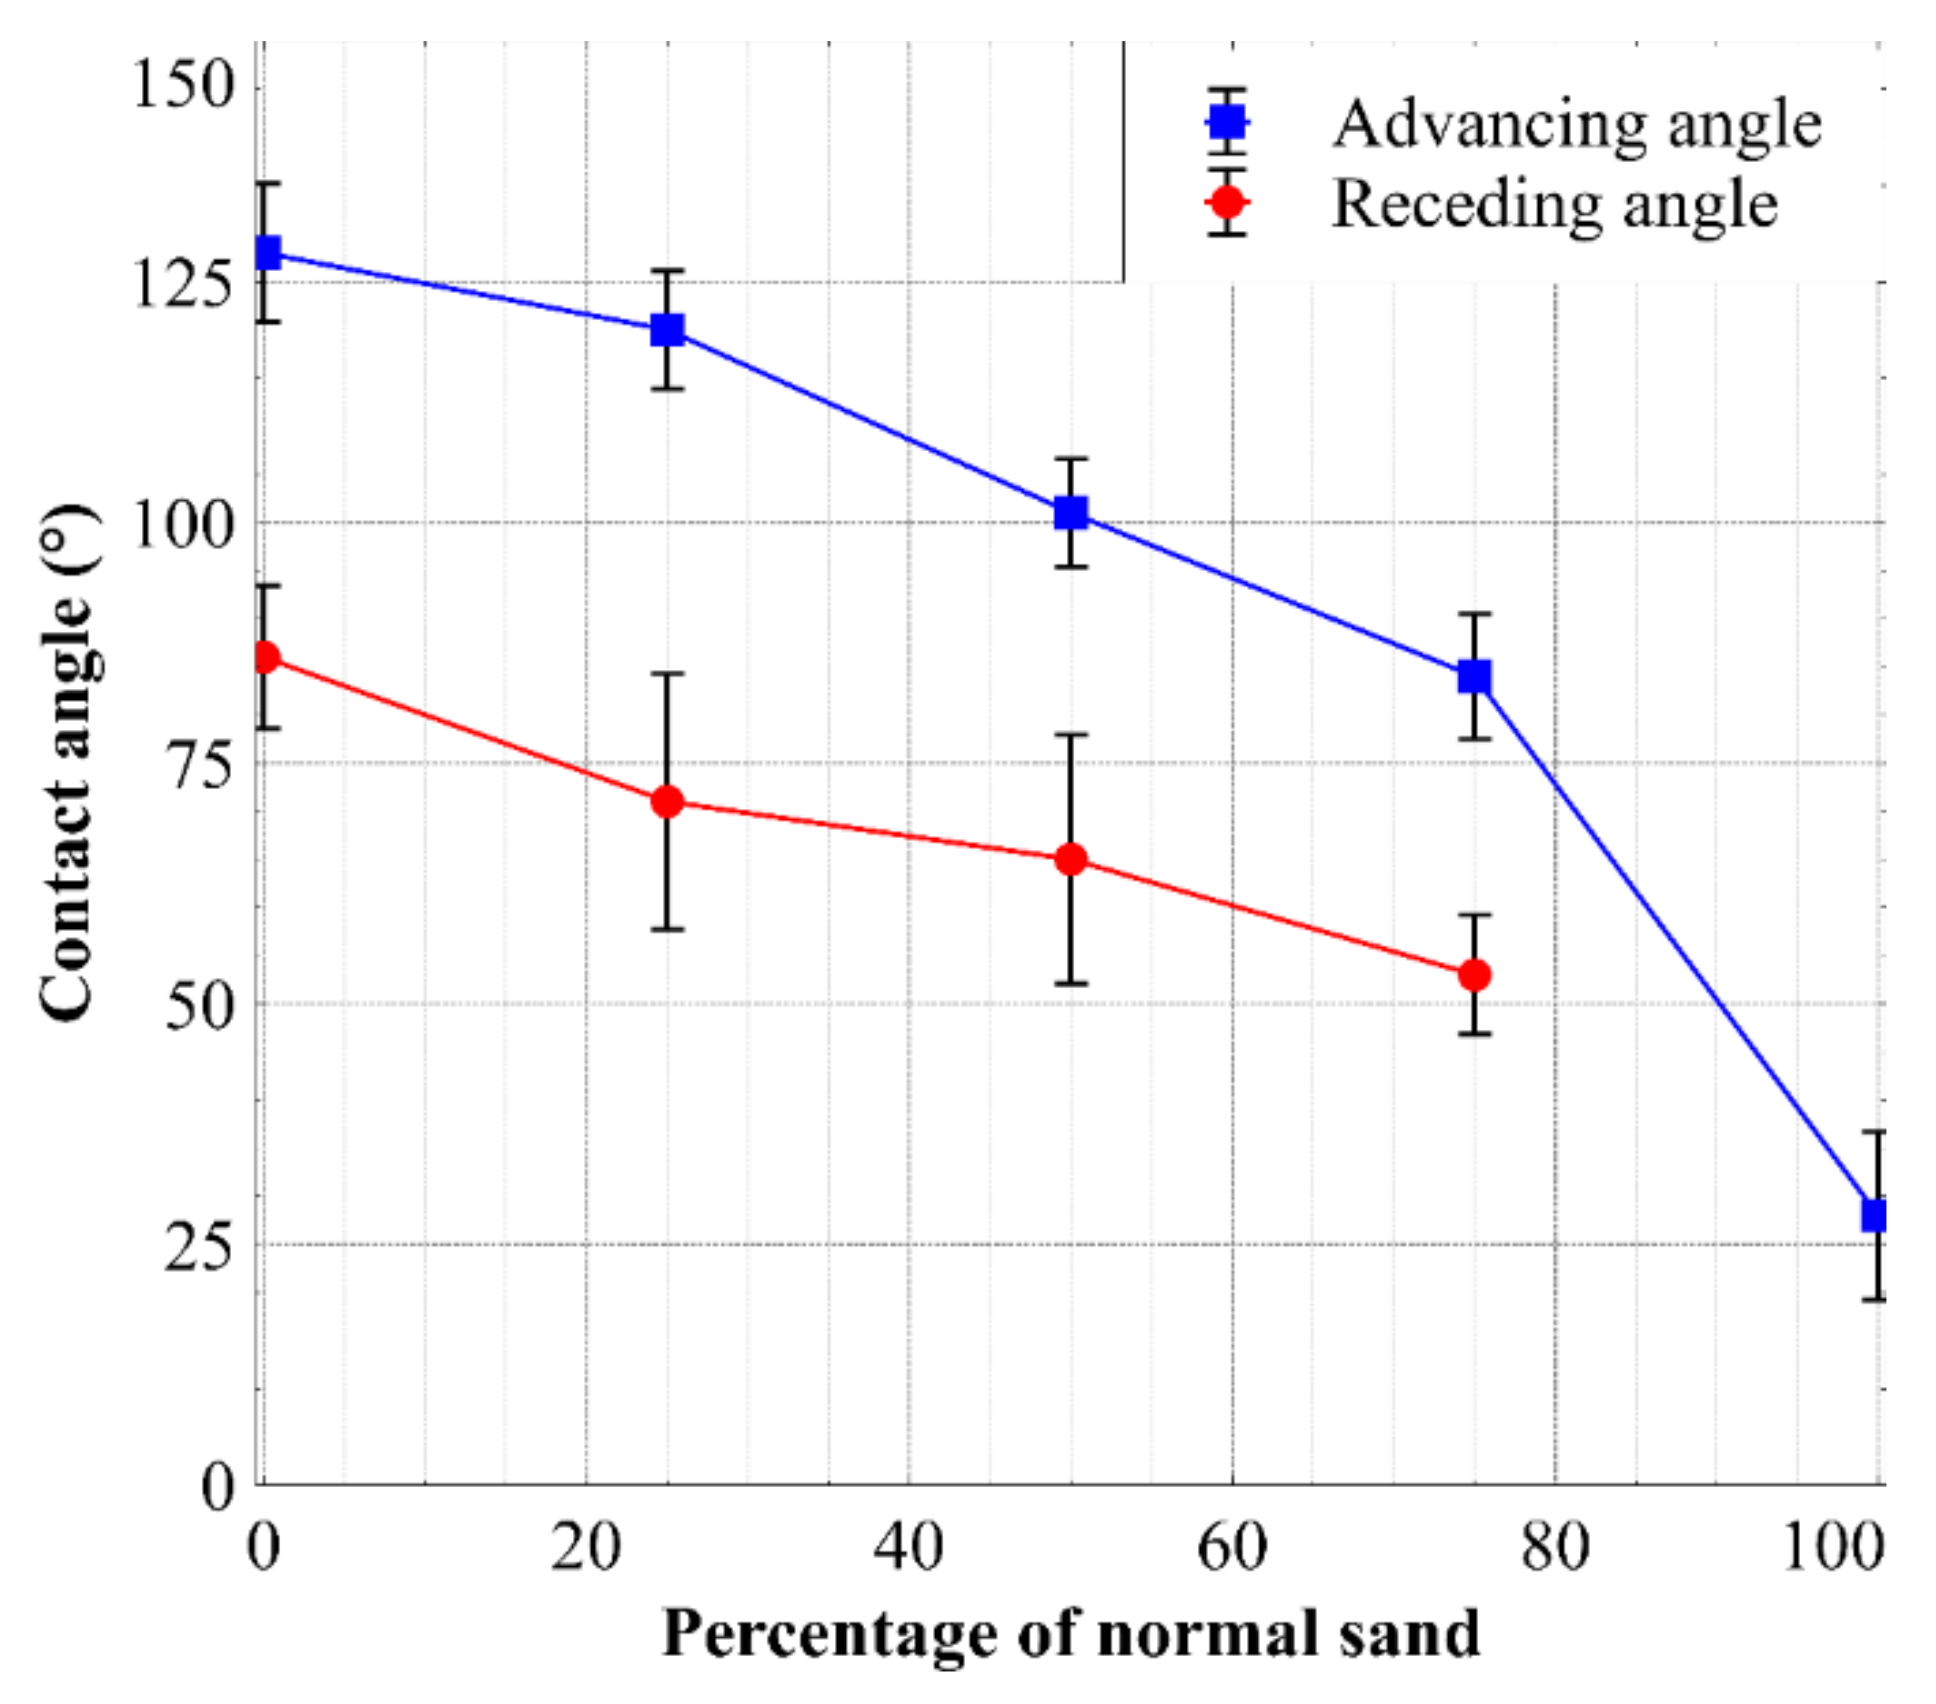
The first step of this research was to measure the advancing and receding CA of each basic material using the sessile drop approach and establishing their degree of hydrophobicity.
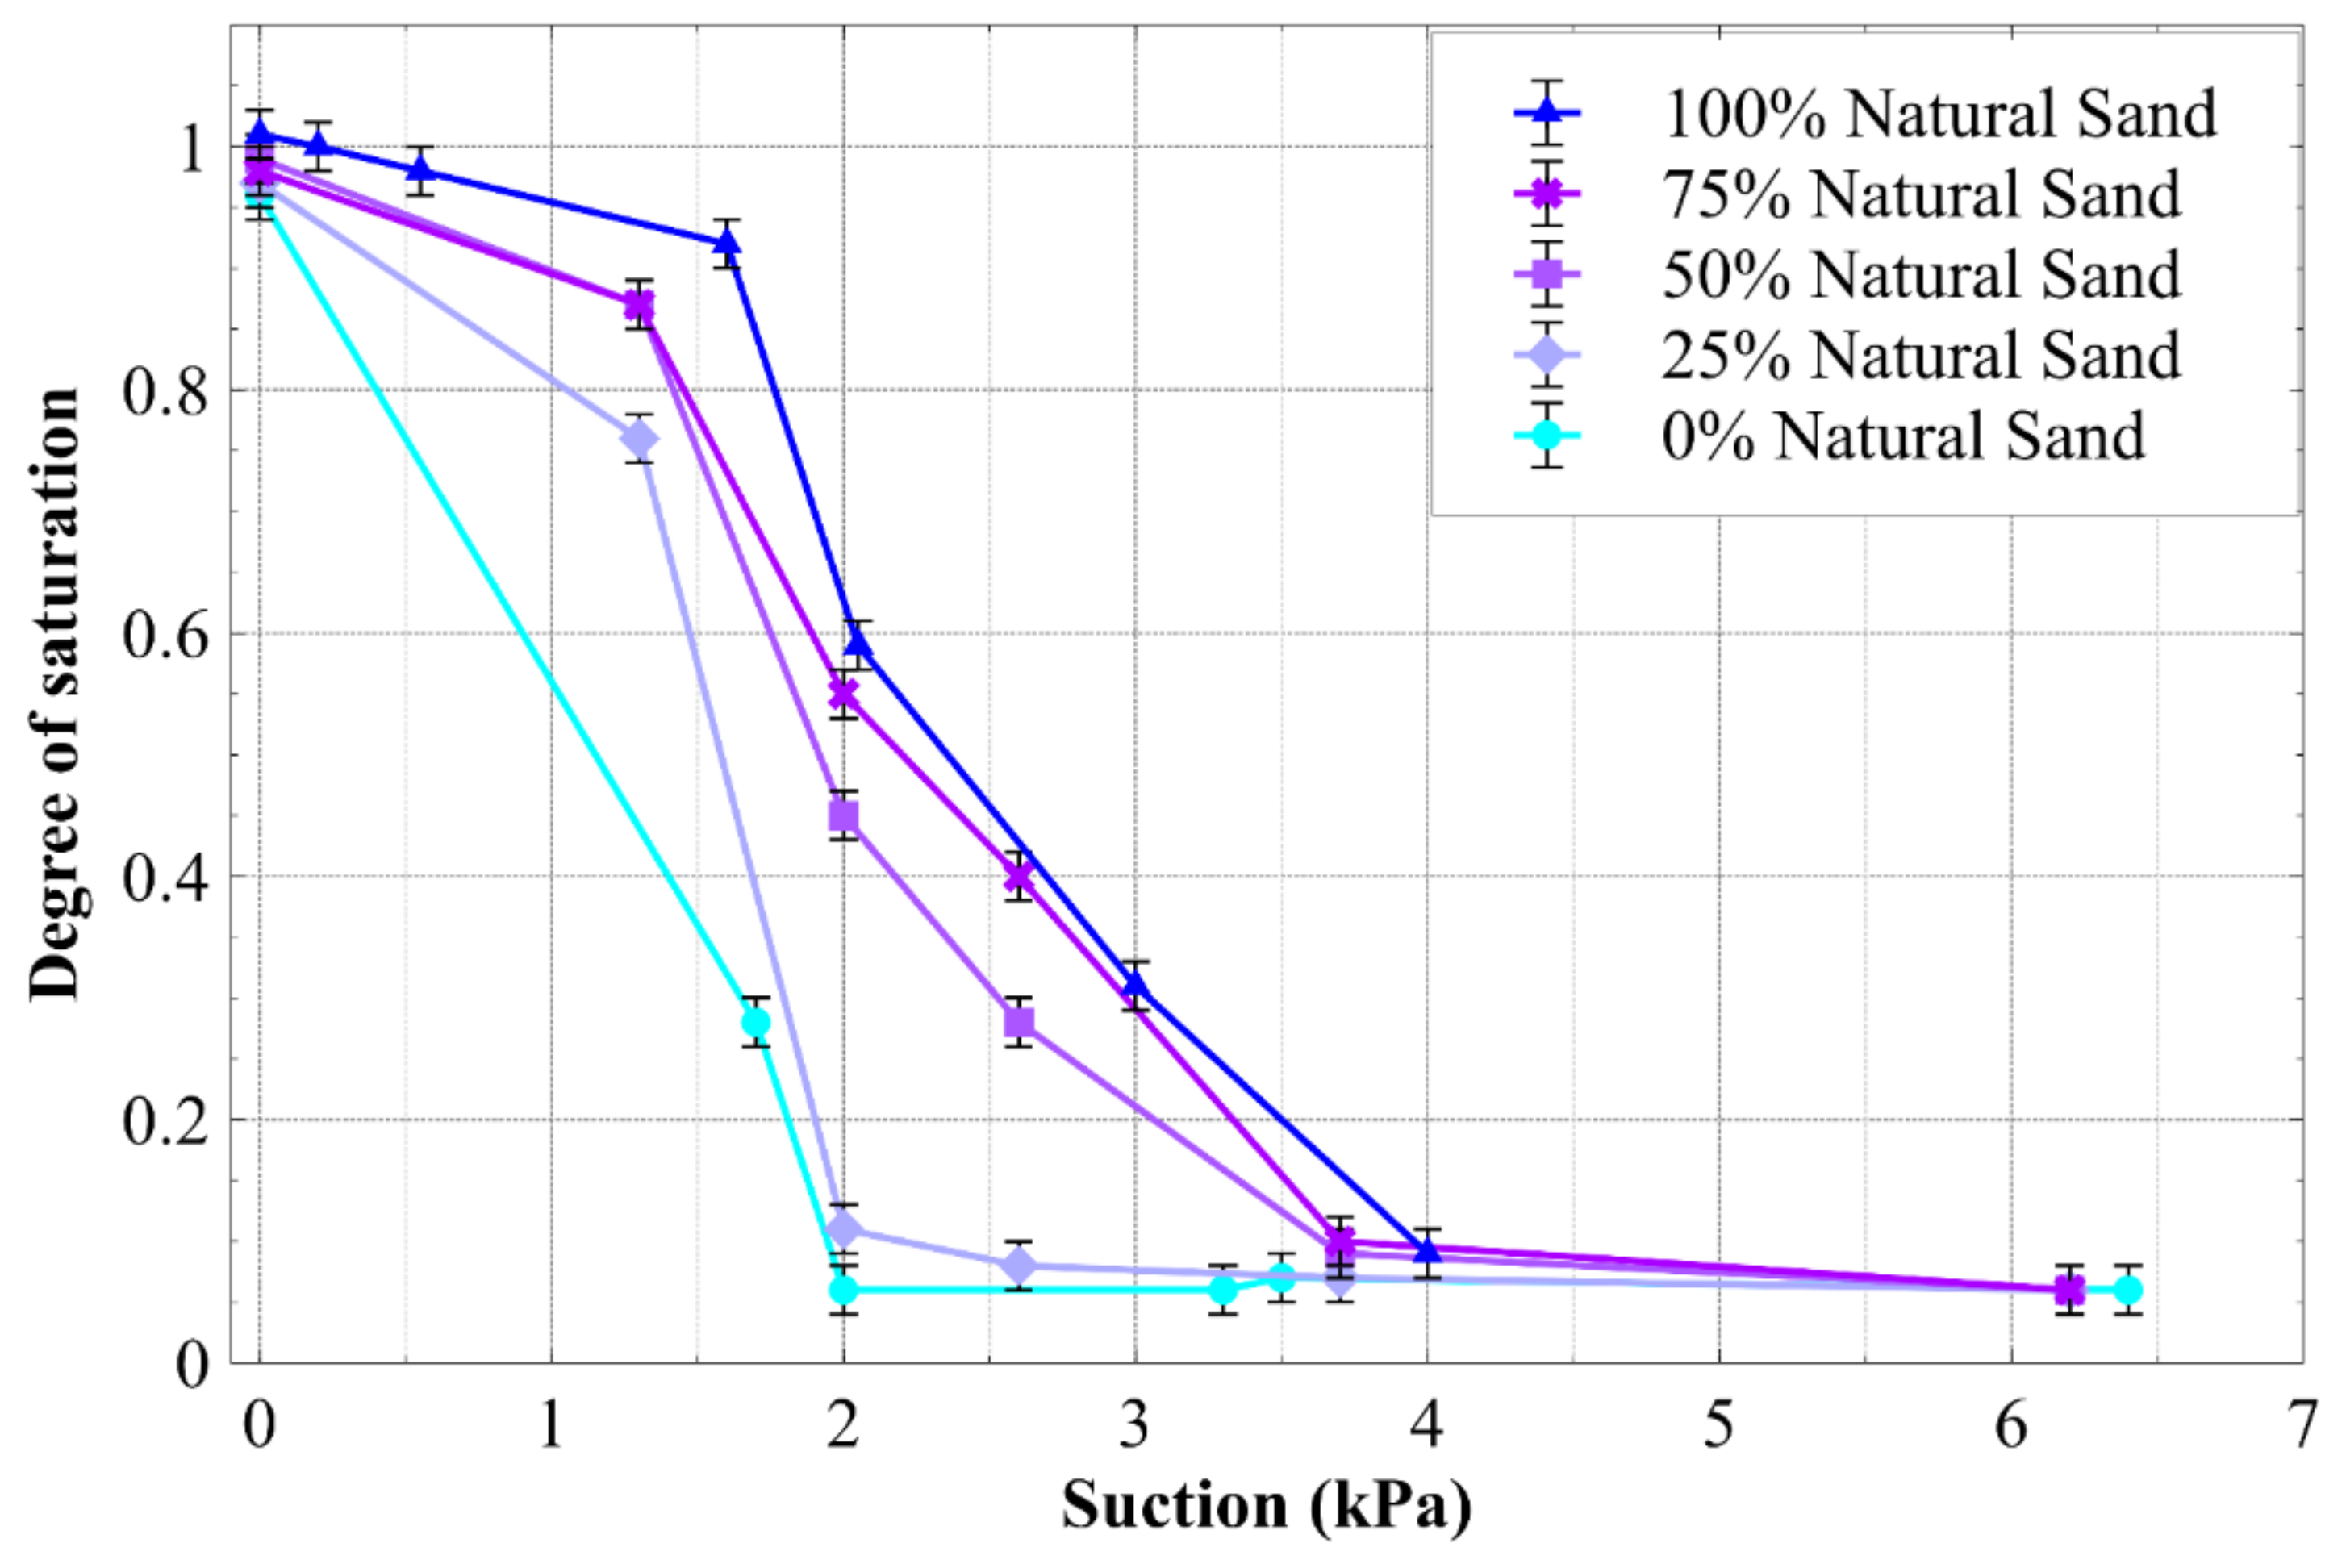
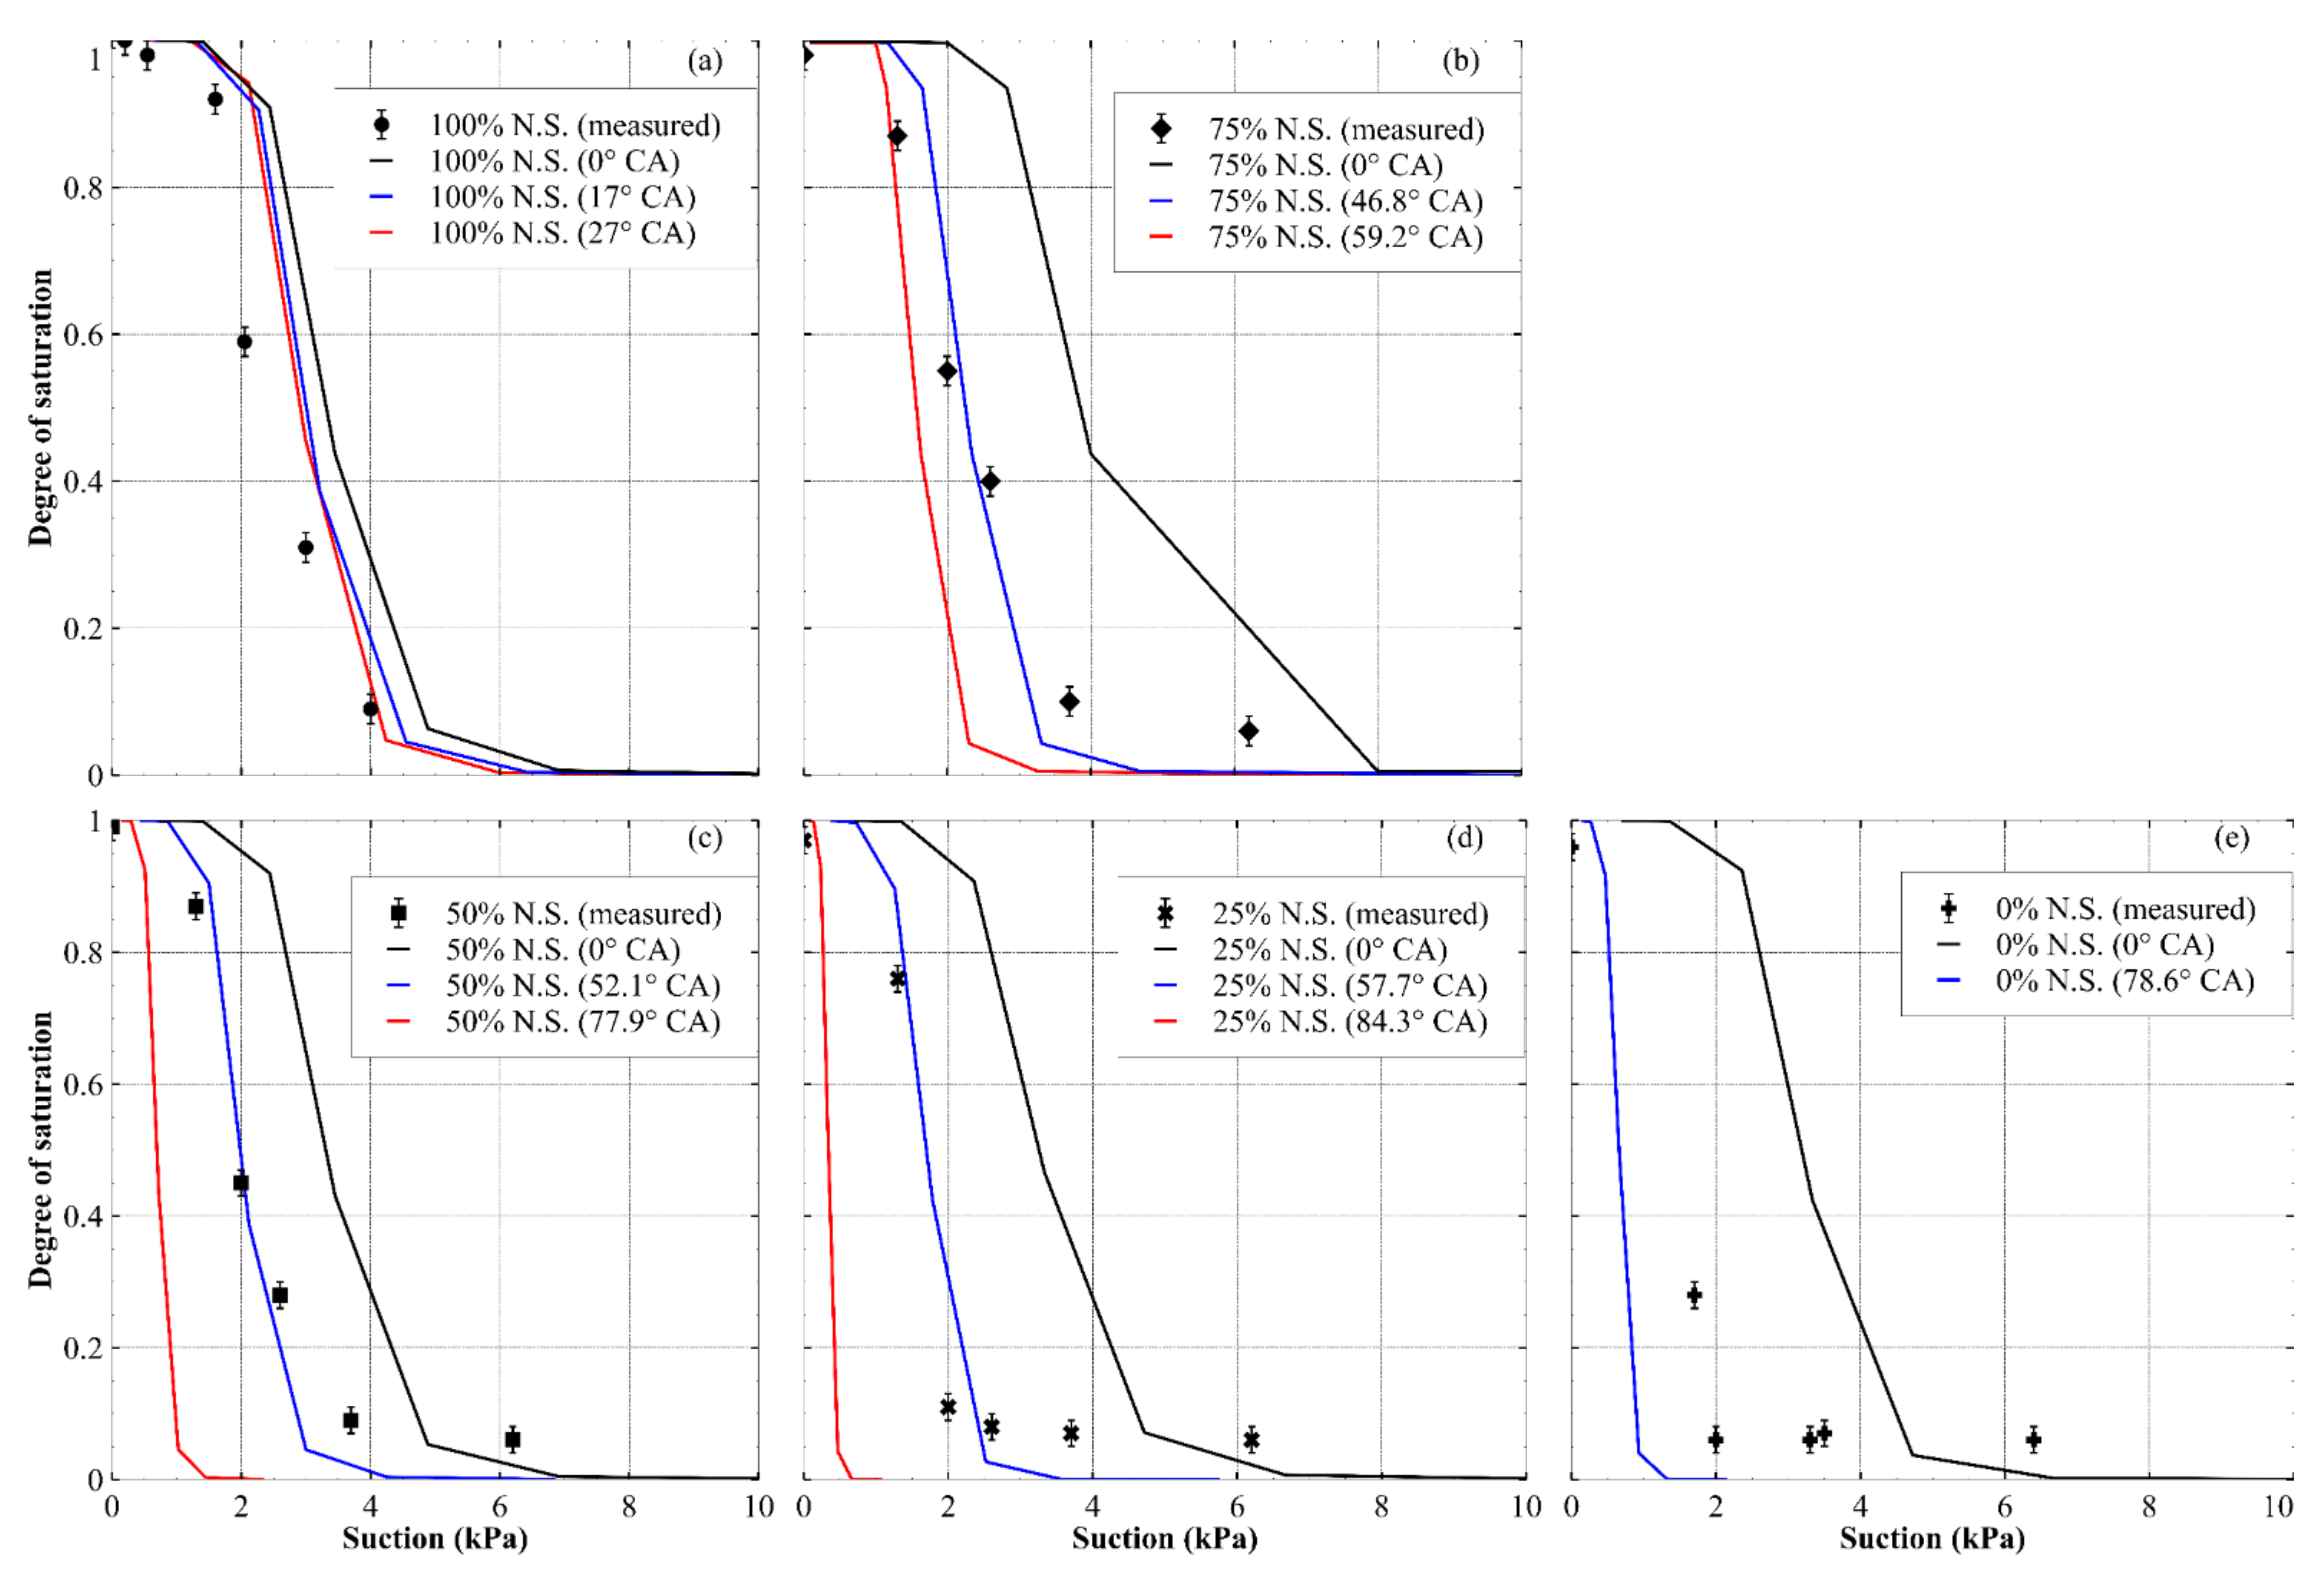
Then, the WRCs for the sand and sand mixtures (relative hydrophobic:hydrophilic proportions of 100:0, 75:25, 50:50, 25:75 and 0:100) were measured, with each mixture having similar particle size and shape characteristics yet varying degrees of hydrophobicity. The purpose of this data was to observe how the WRCs of coarse soil particle mixtures were affected by the proportion of hydrophobic particles in a material and how this related to the contact angle of the material.
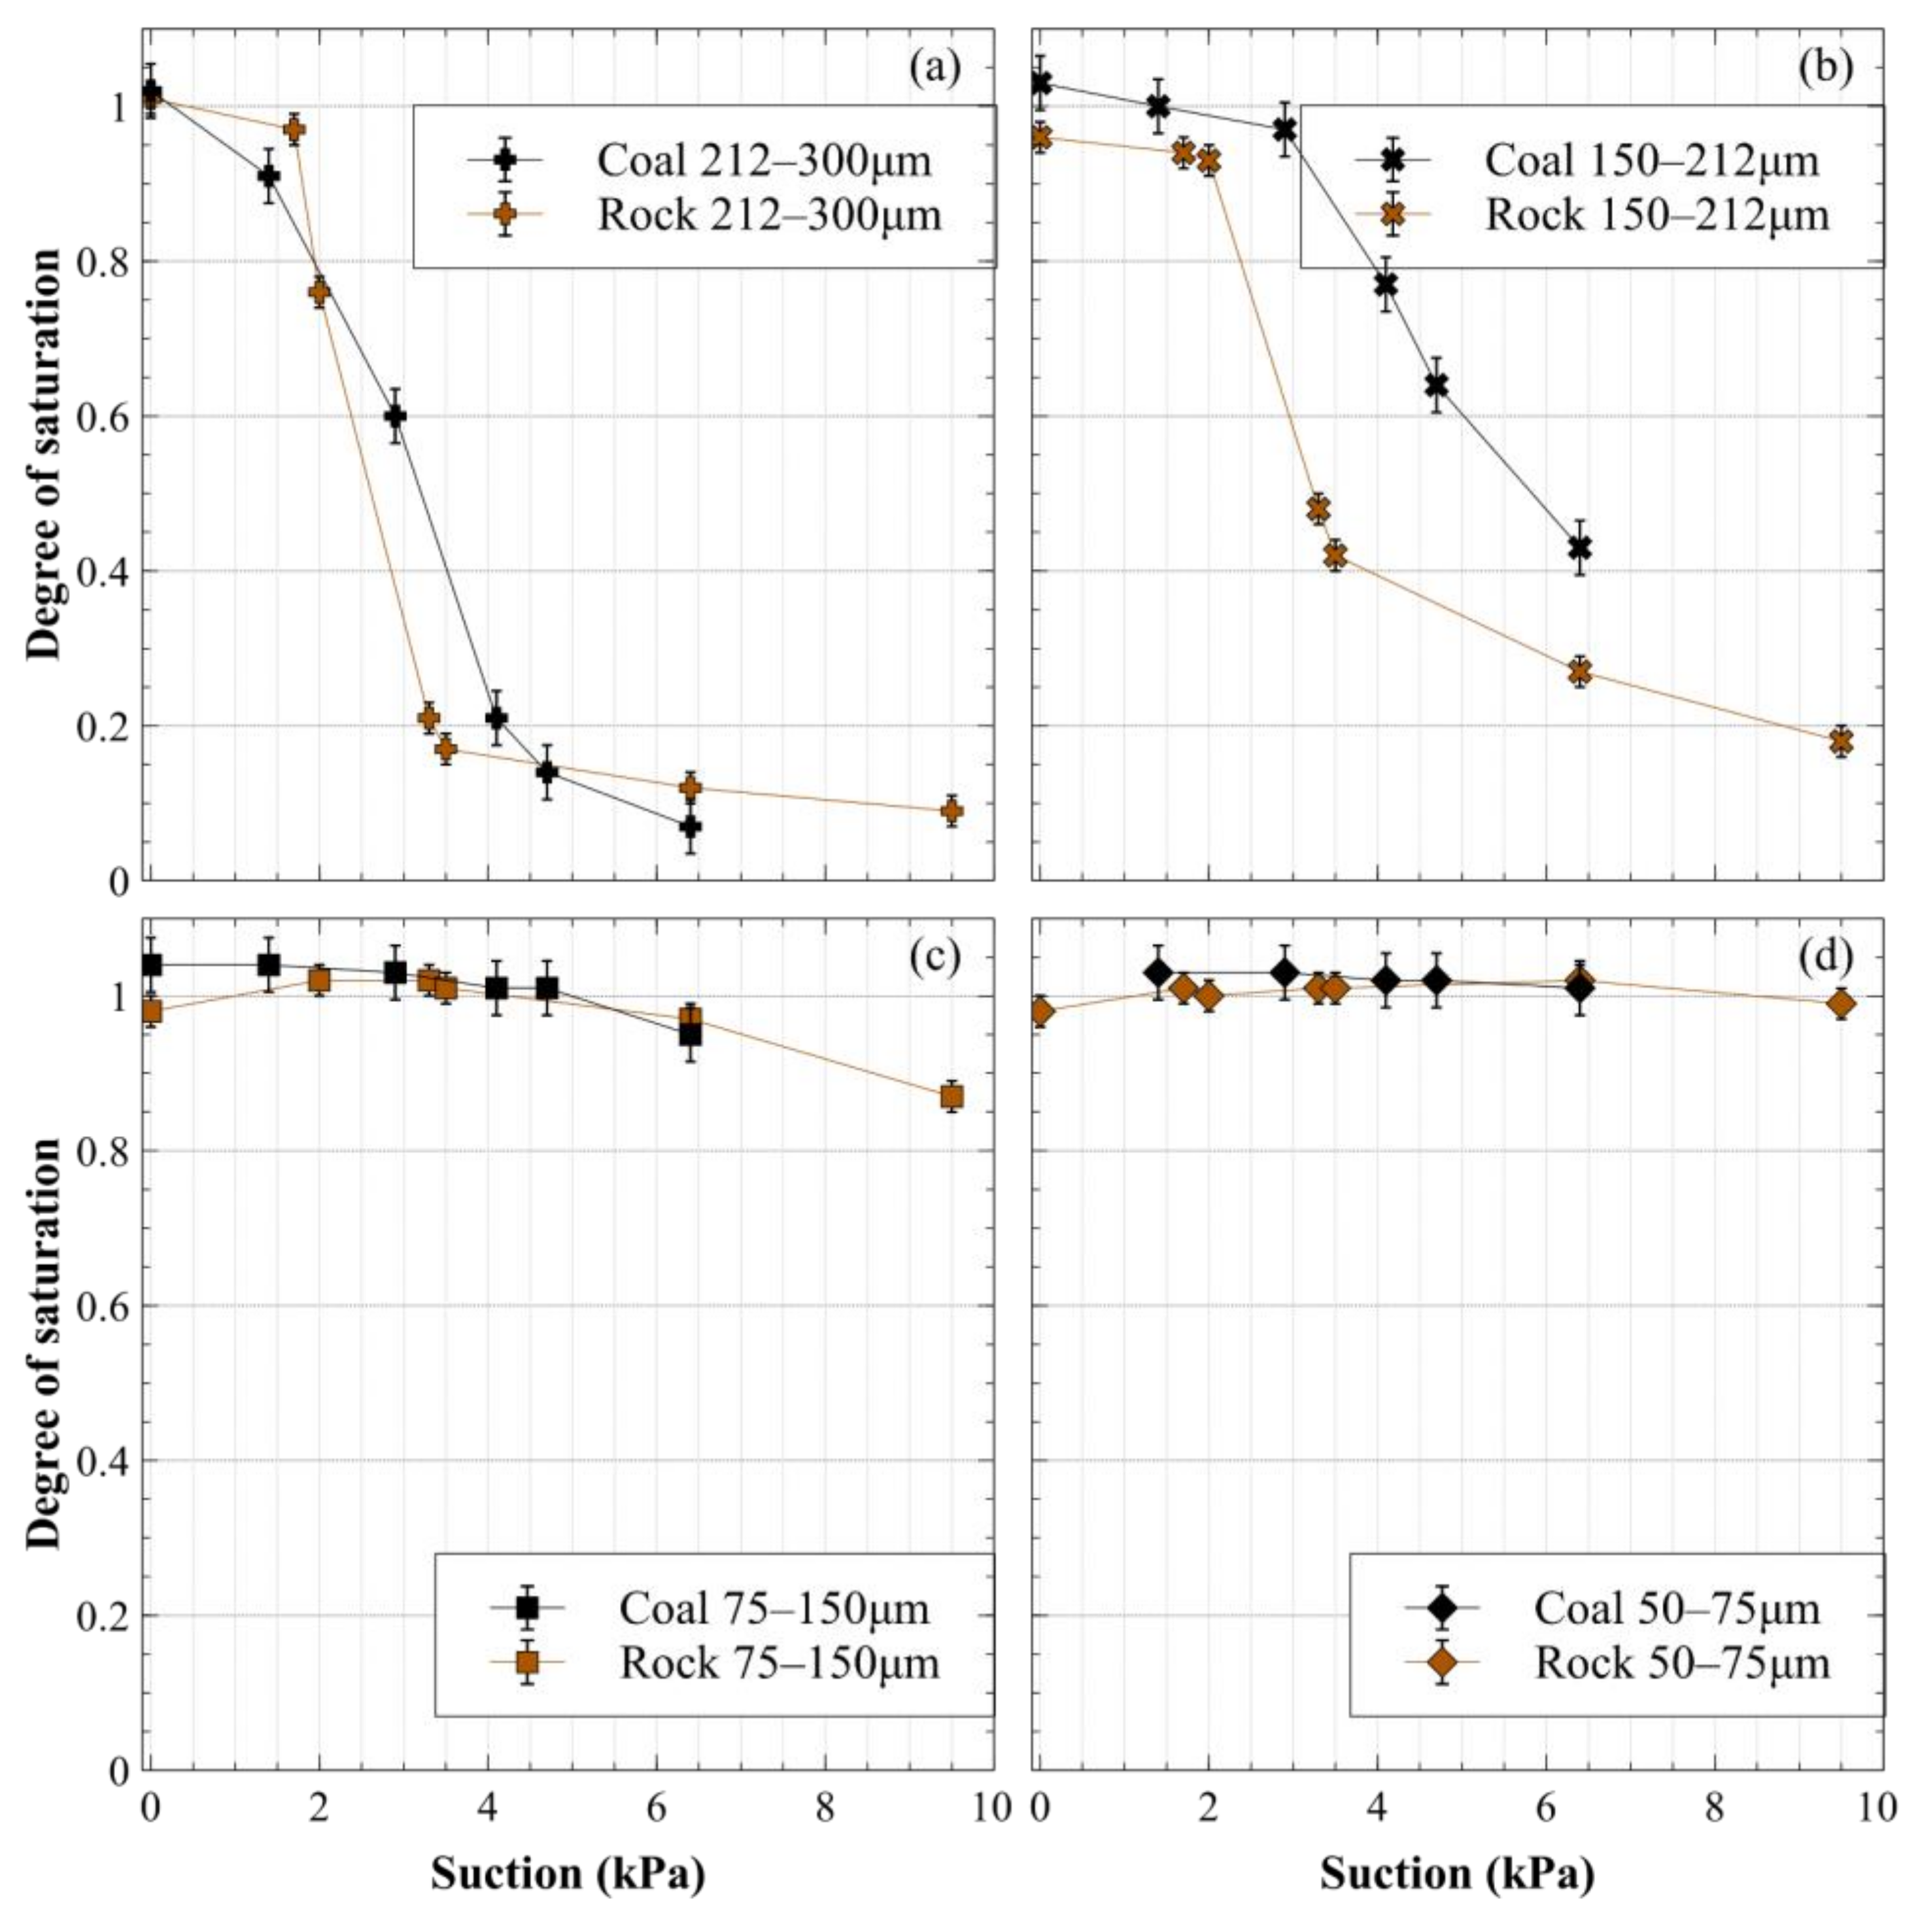
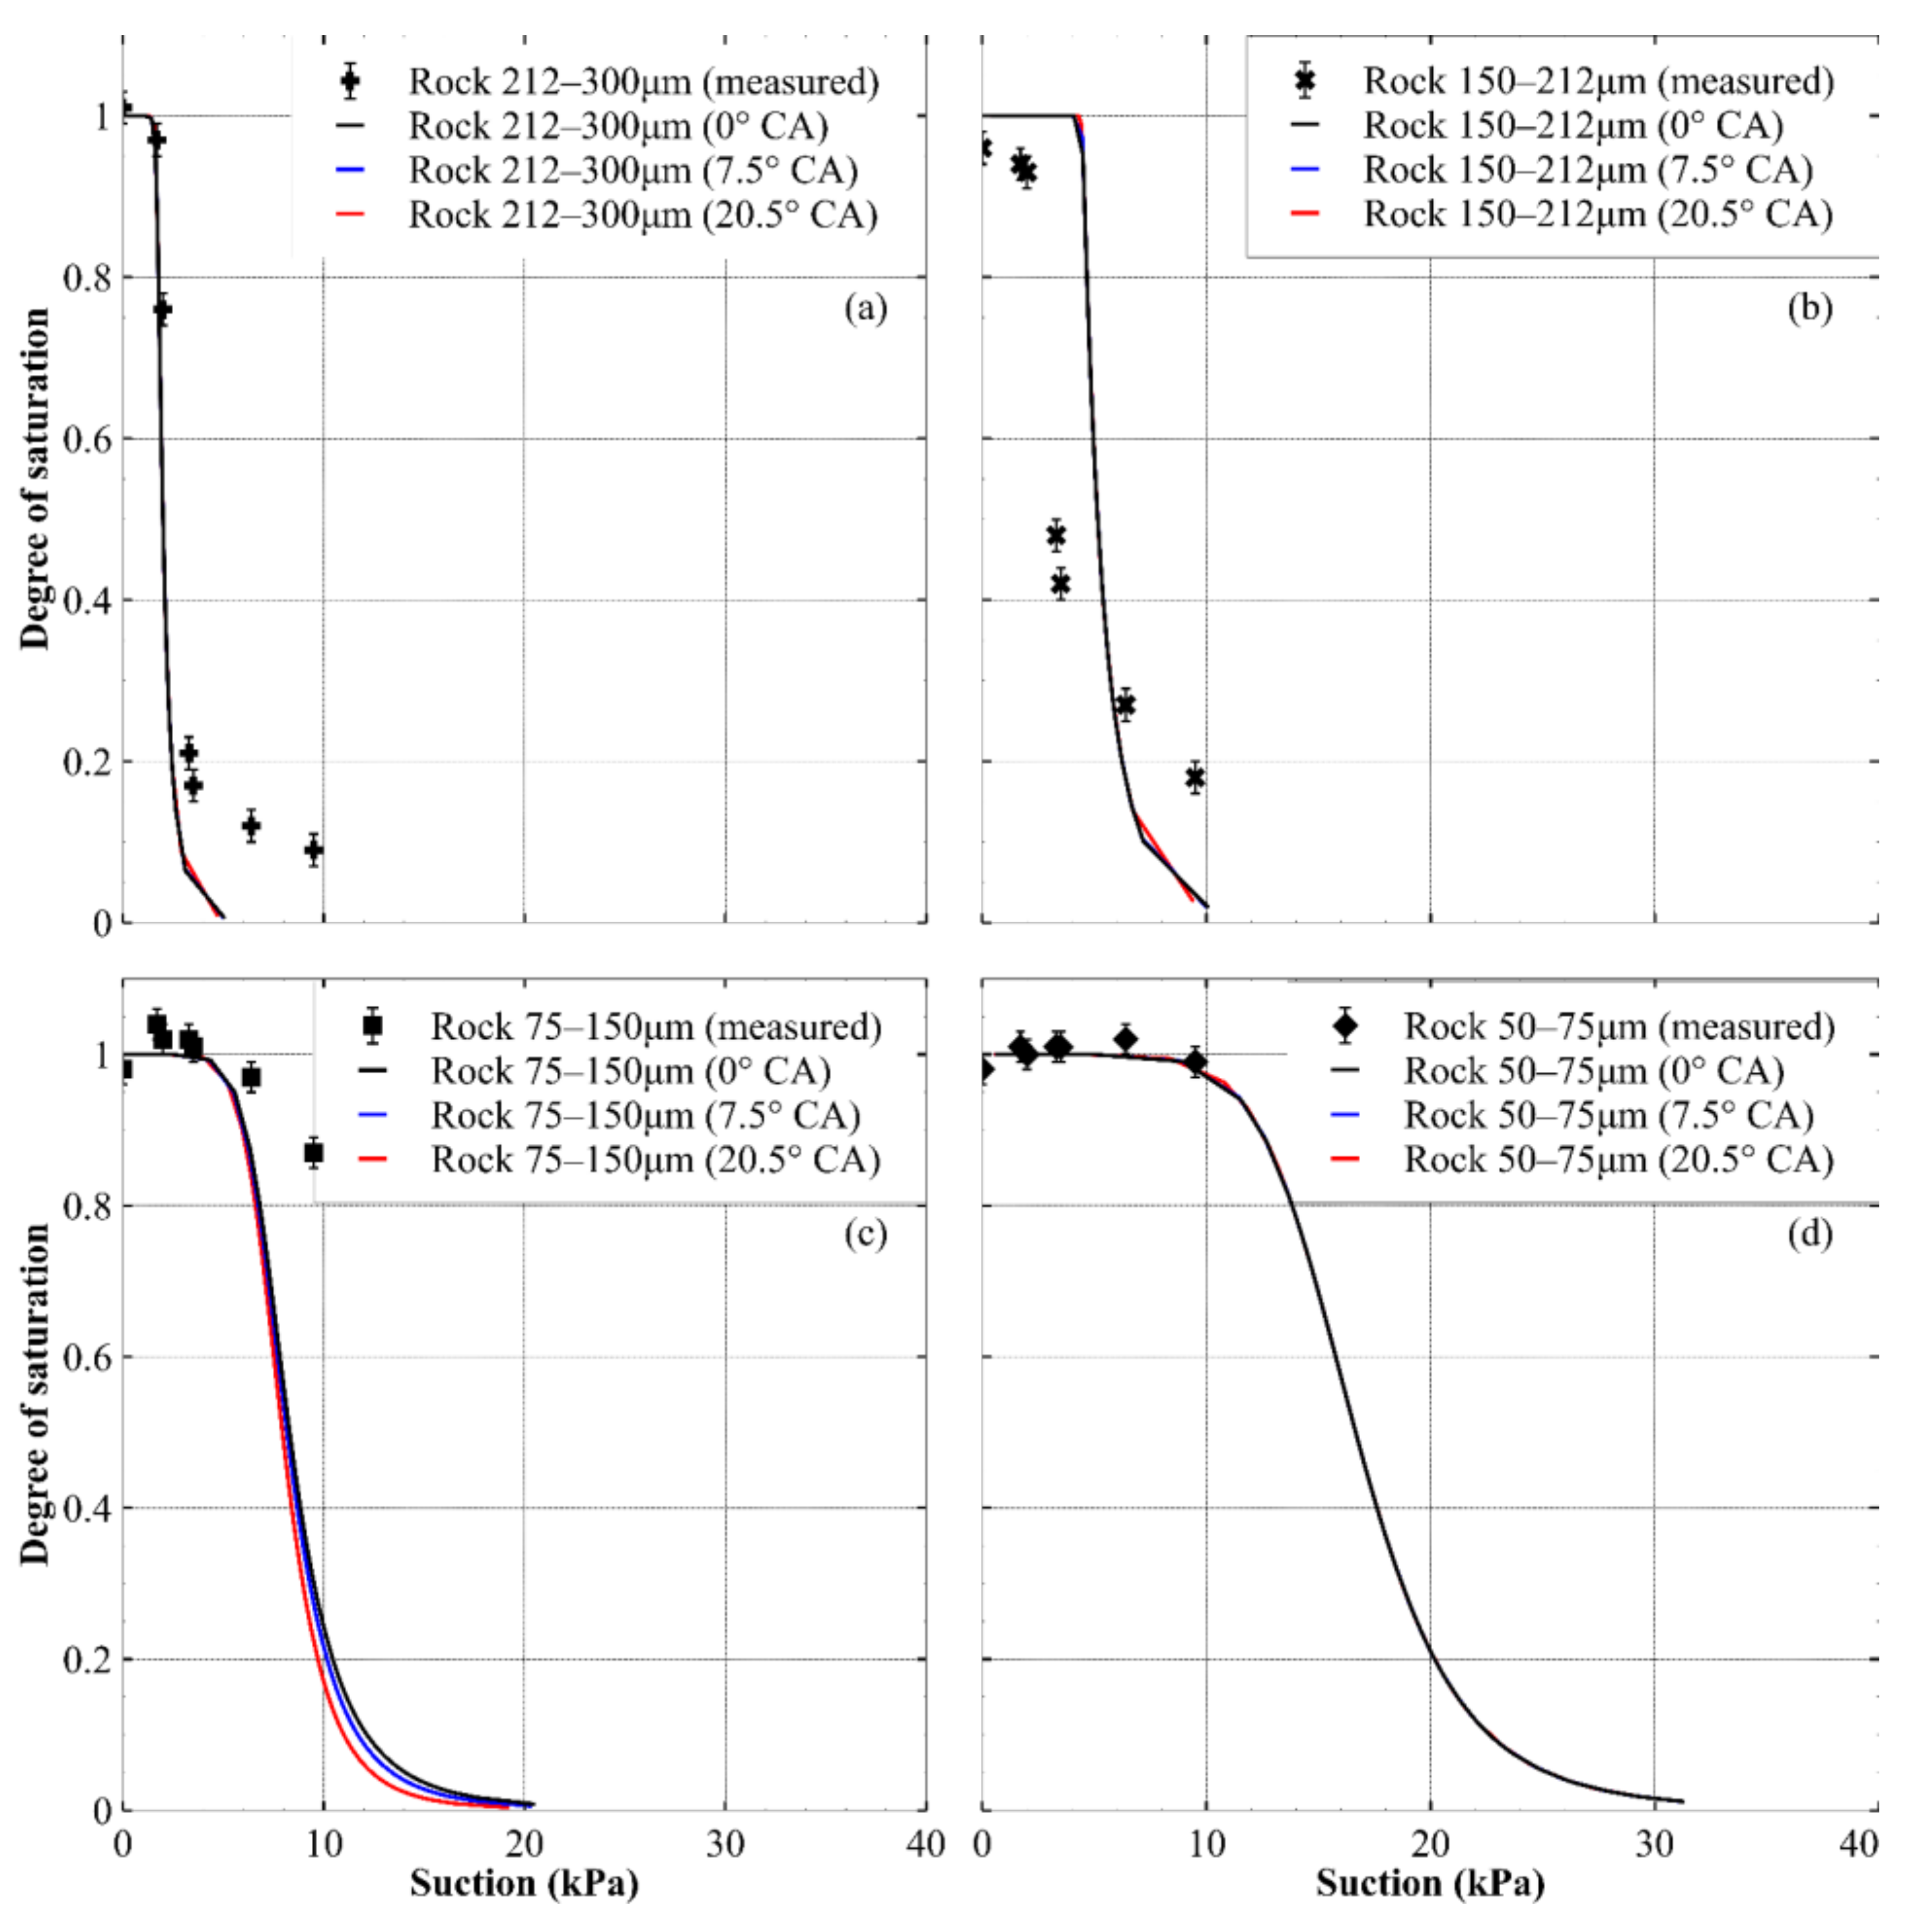
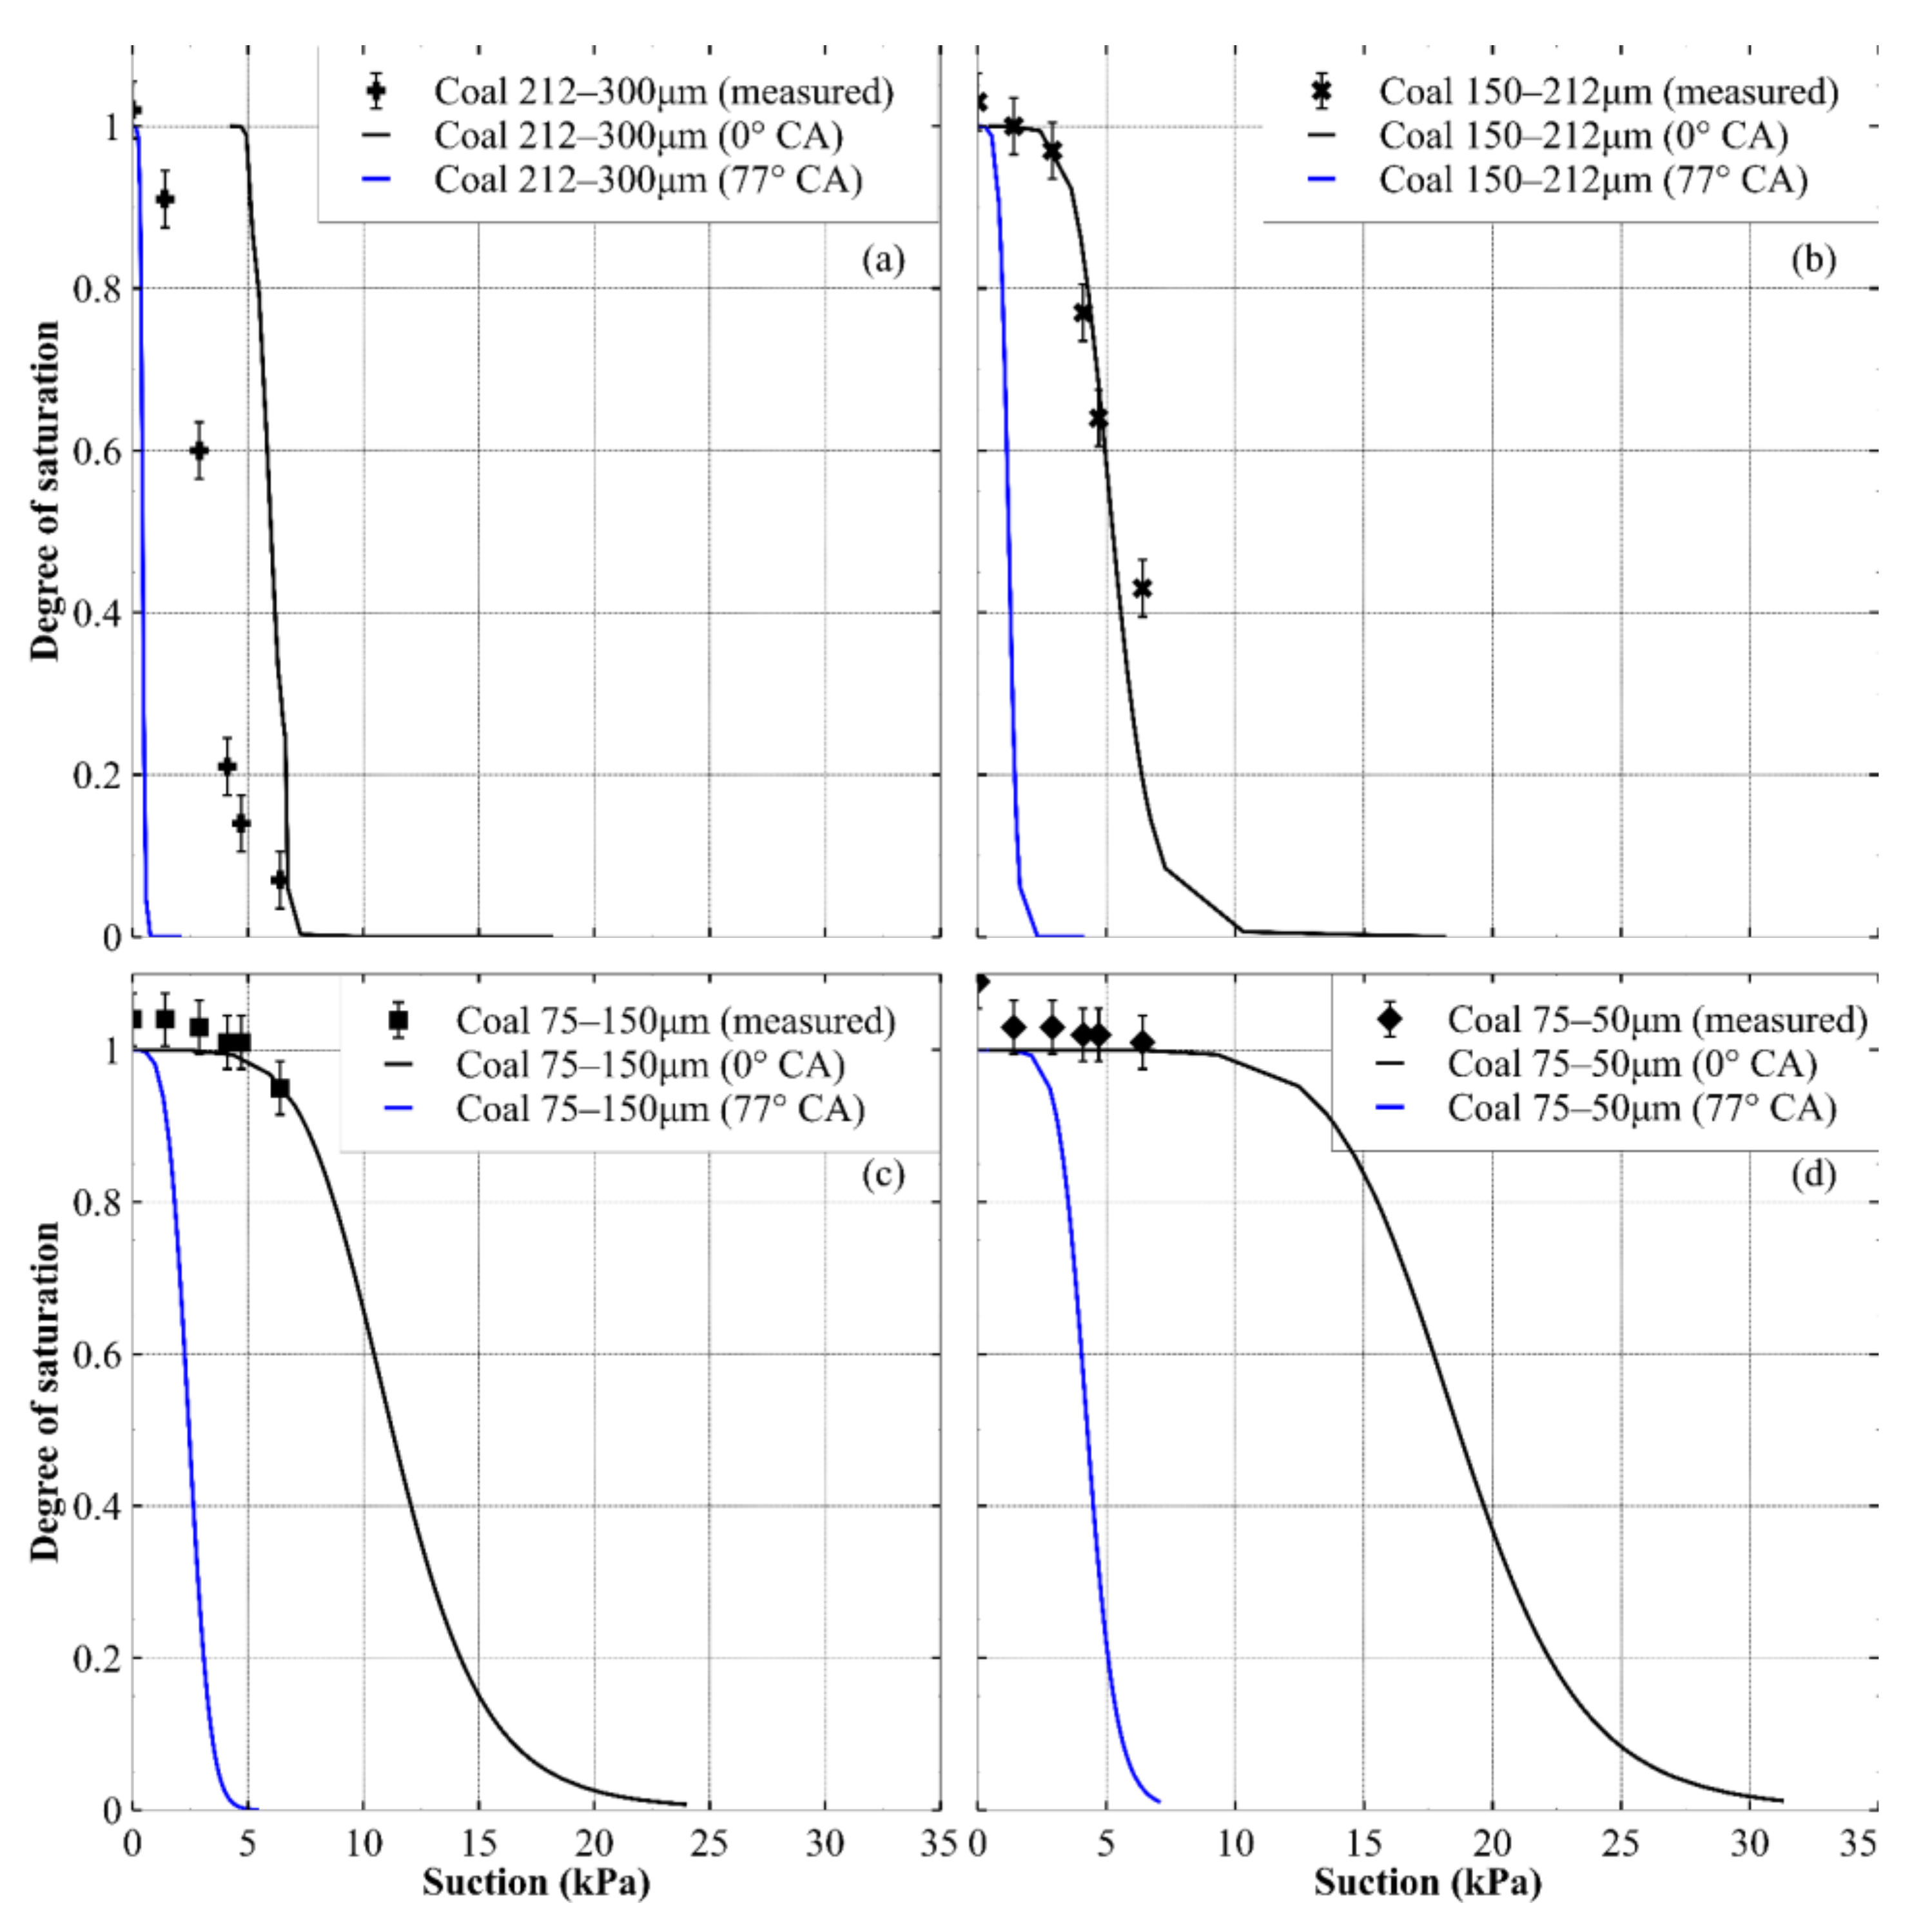
The WRCs of the crushed rock and crushed coal were then measured for each of the four size ranges. In each size range, both materials shared similar particle size and shape characteristics. The goal of this data was to observe how the WRCs of coal, presumably a hydrophobic material, compared to the WRCs of the hydrophilic rock, which potentially allowed insight into WRC characteristics at different sizes of hydrophobic particles.
The physical interaction of water with hydrophilic and hydrophobic particles was observed for natural sand, hydrophobic sand and crushed coal using ESEM imaging. The observation of water droplets and menisci forming on particle surfaces was useful to understand the water retention behavior and validate the observations and theories from the WRC and CA measurement tests carried out at other scales.

2.4. Model for the Water Retention Curves

The WRCs for the sand mixtures were predicted using a model adapted from the literature [22], with the prediction based upon the particle size distribution and void ratio of the material. The model equations utilized in this study are shown in Equations (1) and (2), and the reader is directed to [22] for the derivations and an explanation of their usage. Broadly speaking, however, the model estimates an associated pore size for each size fraction of a PSD. The draining suction and volumetric water content associated with each pore size is then determined. Thus, at any suction, the amount of undrained water in the assemblage of pores can be determined, which allows a WRC to be constructed.
Equation (1) is an expression for the suction head hi corresponding to the particle radius Ri of the ith particle’s size fraction in a soil with n fractions and a void ratio e:
h i = 0.543 × 10 4 R i × 1.9099 1 + e
Equation (2) is an expression that can determine the degree of saturation Si or the volumetric water content θi at the ith particle size fraction:
S i θ s =   θ i   = θ s 1 1 + α h i n m
where θs is the saturated volumetric water content of the material and α, n and m are the fitting parameters from an equation based on the van Genuchten equation [23] fitted to the particle size distribution of the materials. The fitting equation using α, n and m can be found in [22].
This model uses Jurin’s law to estimate the suction associated with a pore size, and the contact angle (CA) during derivation was assumed to be zero [22]. Jurin’s law, shown in Equation (3), describes the height h to which a liquid with a surface tension γ rises in a capillary tube of radius r:
h = 2 γ cos ( CA ) ρ g r
In Equation (3), CA is the contact angle of the liquid to the tube wall, ρ is the density of the liquid and g is the gravitational acceleration. Note that assuming a value of zero for CA in Equation (3) causes the cosine of CA to equal 1. Thus, to accommodate materials with different CAs, the equation to calculate the suction head (Equation (1)) was slightly modified to what is shown in Equation (4):
h i = 0.543 × 10 4 R i × 1.9099 1 + e × cos C A
Thus, the modified model (Equations (2) and (4)) can consider materials with a non-zero CA with the receding angle used in this study as it is representative of the WRCs that were measured along the drying path.

3. Results and Discussion

3.1. Measurement of Contact Angles

The CAs measured for all the materials used in this study are shown in Table 2, and example images of the water droplets used in creating Table 2 are presented in Figure 4.
From Table 2, it can be seen that the natural sand was relatively consistent with the other measured CAs of between 17° and 27° for quartz using droplets of a similar size [24,25]. In addition, the advancing CA of the crushed dacite rock was consistent with the literature, as the measured values were similar to the CAs for quartz [24,25] and sodium feldspar [26] at 17–27° and 34°, respectively. The hydrophobizing process of the sand was effective, as the observed advancing CA increased from 28° to 124°. The table also shows that as the proportion of hydrophobic sand particles increased, the average CA measured for a mixture increased in a non-linear way, as illustrated in Figure 5.

3.2. Water Retention Curves of Sand and Sand Mixtures

The WRCs of the natural sand and sand mixtures determined from inducing suction with a hanging column are presented in Figure 6, expressed in terms of the degree of saturation. The data in Figure 6 indicates that the natural sand and the sand mixtures all desaturated at low suctions (<1 kPa), and a reduction of the natural sand content (or an increase in the average CA) caused the degree of saturation at any suction to reduce. This observation is consistent with similar water retention curves for hydrophobic materials, which were expressed in terms of the gravimetric water content vs. suction [11].
An insight into the differences between the wetting of the natural and hydrophobic sand at a granular scale is given in Figure 7, which shows the ESEM images of condensing water droplets and the menisci between particles.
It can be seen that the contact angles of the water droplets in Figure 7 were somewhat similar to those observed and measured in the sessile drop tests for the natural and hydrophobic sand (28° and 128°, respectively). It is also interesting to note the difference in the number and size of the droplets between the hydrophilic surface (Figure 7a) and the hydrophobic one (Figure 7b). The menisci seen between particles in Figure 7 highlights the differing levels of hydrophobicity of the sands. Between the natural sand particles, a distinct curvature can be seen (arrow in Image a), whereas little curvature can be seen between the hydrophobic particles (arrow in Image b). Note that the droplets adjacent to the relatively straight meniscus appeared to have a contact angle of 90° or more (the upper particle in Figure 7b), reflecting strong local hydrophobicity. When considering the water held in the interparticle menisci or the funicular and pendular regime of the WRC [27], hydrophilic particles with curved menisci would contain more water than otherwise identical hydrophobic particles, which have relatively straight menisci. This is simply due to the curved geometry of the hydrophilic menisci requiring a greater volume than relatively straight menisci. This menisci phenomenon explains, to some degree, why more hydrophilic materials contain greater amounts of water at any suction in Figure 6.

3.3. Drying Path of the Water Retention Curves for Crushed Rock and Crushed Coal

The drying path of the WRCs for different size fractions of the crushed materials determined from the hanging column are presented in Figure 8 in terms of the degree of saturation.
Note that much of the data in Figure 8 that are close to full saturation have degree of saturation values slightly larger than one, which has no physical meaning. This reflects the sensitivity associated with trying to measure small changes in water content in small, moisture-sensitive materials. However, the error bars on most of these data extend below a degree of saturation of one, making it reasonable to presume that these values are indicative of fully saturated sample conditions.
The first observation to be made from Figure 8 is that, as expected, the finer the grain size for a given material, the higher the air entry value, and the higher the degree of saturation for a given suction was. This applied to both the crushed rock and the crushed coal.
Given the values of the contact angles reported in Table 2 and the results obtained for the various sand mixtures (Figure 6), it would reasonably be expected that the coal should hold less water than the crushed rock for a given size fraction and at a given suction. However, this is not what Figure 8 shows. The crushed coal appeared to have similar drying path WRCs to the crushed rock for the 75–150 μm and 50–75 μm fractions, while the coal in the 212–300 μm fraction, and particularly the 150–212 μm fraction, appeared to hold more water than the crushed rock.
Overall, the WRCs measured for the coal appeared to be similar to the WRCs measured for the hydrophilic materials of similar grain sizes. No reasonable hypothesis can be put forward to explain the unexpected water retention behavior of the crushed coal. It would appear that there were other unknown phenomena associated with the interaction of coal and water that were inconsistent with the expected effect of the CA on water retention.
An ESEM image of the crushed coal is shown in Figure 9 which, similar to Figure 7, shows numerous water droplets and menisci. Figure 9 suggests that the CA of water droplets can vary considerably over even a single coal particle, for example, from around 90°, as indicated by the cyan arrow, to angles consistent with hydrophilic material particles, as indicated by the yellow arrow. Some bridging menisci observed within the coal appear to show little to no curvature (white arrows), while others do show some concave curvature (black arrows). Thus, it appears that coal showed similarities to both hydrophobic and hydrophilic material behavior, likely due to the inherent chemical heterogeneity of coal. The localized hydrophilic behavior observed for the crushed coal could explain the coal WRCs if this tendency was somehow dominant over the localized hydrophobic behavior that was also evident.
It is important to note that interpretation of the geometry in these ESEM images (Figure 7 and Figure 9) is not strictly conclusive due to the image being a two-dimensional projection of a three-dimensional assemblage, and a projection at another angle may show different expressions of the behavior. However, when comparing the behavior presented in Figure 7 and Figure 9, it seems unlikely vastly different behavior would be observed at another angle.

3.4. Prediction of the Water Retention Curves

To assess the usefulness of the WRC models that can consider a hydrophobic material’s CA, a variety of WRC predictions will be presented for each material using the model introduced in Section 2.4. Early predictions showed that for some materials, changing the receding CA by the magnitude of the standard deviation (Table 2) could cause significant changes in the prediction. This sensitivity was amplified as the mean CA of the material approached 90°. Thus, rather than making a single model prediction based on the mean, a set of two predictions are shown which represent a reasonable prediction range. The left and right bounding curves of the prediction use different CAs as described in Equation (5):
CA = CAmean ± CASD,
where CAmean is the mean receding contact angle measured (from Table 2) and CASD is the standard deviation of the receding contact angle (from Table 2). The other required model parameters relate to the PSD and sample density of each material and are shown in Table 3. Readers are directed to Section 2.4 for a description of the model parameters. Multiple values of α, n and m are given for some materials as these parameters vary with the CA. In addition, as no receding CA was measured for the natural sand, the prediction range used values measured in the literature for quartz (17° and 27°) [24,25]. The model predictions for sand, rock and coal are shown in Section 3.4.1 Section 3.4.2 and Section 3.4.3, respectively.

3.4.1. Sand and Sand Mixtures

The predicted drying path of the WRCs of each sand or sand mixture are presented in Figure 10. Note that for the hydrophobized sand, the WRC prediction at CAmean + CASD was not shown, as the model is not valid for CAs above 90° (the cosine of CA becomes negative).
Figure 10 shows that the WRC predictions using a CA of zero degrees are not useful for any sand mixture except for the natural sand, where they provide a somewhat accurate and possibly useful approximation. However, a more accurate prediction was given when non-zero values of the CA were considered in the model, with the data appearing to fall near the right bound of the prediction range (for a contact angle of CAmean − CASD). However, for the hydrophobic sand, the measured WRC generally did not lie close to the right bound prediction; however, it was more accurate than assuming a CA of zero. Additionally, below a degree of saturation of around 0.1, the model consistently tended to underestimate the water volume in the material. This is a common problem when predicting WRCs and is likely due to imperfect estimation of the pore sizes in the materials and ignoring water adsorption [28]. Despite this, Figure 10 shows that considering a material’s receding CA in its WRC prediction improved the prediction accuracy. This highlights how a simple modification to allow consideration of non-zero CAs in WRC predictions may be useful for hydrophobic materials.

3.4.2. Crushed Rock

Similar to what was done for the sand mixtures in Figure 10, the predicted drying paths of the WRCs are shown for the rock in Figure 11. It can be seen that there was little difference between the WRCs predicted using the larger and smaller values of a receding CA and the WRC prediction at a CA of zero, which highlights how assuming a CA of zero may be reasonable for hydrophilic materials. The predicted WRCs for the 212–300 μm fraction of crushed rock were a good approximation to the measured data, with the accuracy reducing near the residual water content (near degree of saturation of 0.1). The predictions for the 150–212 μm fraction were also similar to the experimental data, though they were not as close as the 212–300 μm fraction. For the two smallest rock fractions, the accuracy of the predicted WRCs was uncertain due to a lack of data beyond 10 kPa of suction (because of cavitation of the hanging column at higher suctions).

3.4.3. Crushed Coal

The predicted drying paths of the WRCs of the crushed coal are presented in Figure 12, which shows that the predictions using the measured receding CA values were not useful for any size fraction. A reasonable prediction for the coarsest fraction may be possible with a contact angle somewhere between 0° and 77°, but this would be a trial-and-error fit with no obvious basis for selecting a particular value. The prediction using a CA of zero appeared to give a good approximation for the 150–212 μm fraction. Similar to the results for the crushed rock, the prediction accuracy of the zero CA prediction for the two smallest coal fractions was uncertain due to a lack of data beyond 10 kPa of suction; however, for the small range available, the fit was reasonable.

4. Conclusions

From the results of the sand and sand mixtures, a clear trend can be observed: increased hydrophobicity (or contact angle) from the presence of more hydrophobic soil particles caused a reduction in the saturation degree at every value of suction. Thus, increased hydrophobicity caused air entry at lower suctions and less water to be retained at any value of suction. These trends in the WRC could be inferred from the existing literature; however, this study allows the trends to be more confidently stated due to all other influencing parameters being kept similar between the hydrophobic and hydrophilic sand and the WRCs measured and expressed in volumetric terms.
The coal used in this study had its receding contact angle measured to be 90°, which indicated it was hydrophobic. However, when comparing the WRCs of coal to hydrophilic rock with a similar particle size, shape and distribution, no reduction in the saturation degree at every suction was observed. A reasonable explanation for this discrepancy cannot be provided, which indicates other unknown phenomena relating to the interaction of coal and water are affecting the measured WRCs, requiring further research to understand the discrepancy.
Using an existing model with the measured receding contact angles of the material to predict the drying paths of different WRCs showed its limitations when applied to crushed coal. Hence, more research is needed to properly predict the retention properties of crushed coal particles and tailings for engineering purposes.

Author Contributions

Conceptualization, A.V., O.B. and S.F.; methodology, A.V., O.B. and S.F.; validation, A.V., O.B. and S.F.; writing—original draft preparation, A.V.; writing—review and editing, A.V., O.B. and S.F.; supervision, O.B. and S.F. All authors have read and agreed to the published version of the manuscript.

Funding

This research received no external funding.

Institutional Review Board Statement

Not applicable.

Informed Consent Statement

Not applicable.

Data Availability Statement

Not applicable.

Acknowledgments

The authors acknowledge the use of the instruments and scientific and technical assistance of Yang Liu at the Monash Centre for Electron Microscopy, a node of Microscopy Australia. This research used equipment funded by Australian Research Council grant ARC Funding (LE0882821).

Conflicts of Interest

The authors declare no conflict of interest.

References

  1. Çiçek, T.; Cöcen, İ.; Engin, V.T.; Cengizler, H. An Efficient Process for Recovery of Fine Coal from Tailings of Coal Washing Plants. Energy Sources Part A Recover. Util. Environ. Eff. 2008, 30, 1716–1728. [Google Scholar] [CrossRef]
  2. Ryu, C.; Finney, K.; Sharifi, V.N.; Swithenbank, J. Pelletised fuel production from coal tailings and spent mushroom compost—Part I. Fuel Process. Technol. 2008, 89, 269–275. [Google Scholar] [CrossRef]
  3. Gutierrez-Rodriguez, J.A.; Purcell, R.J.; Aplan, F.F. Estimating the hydrophobicity of coal. Colloids Surf. 1984, 12, 1–25. [Google Scholar] [CrossRef]
  4. Kaji, R.; Muranaka, Y.; Miyadera, H.; Hishinuma, Y. Effect of electrolyte on the rheological properties of coal-water mixtures. AIChE J. 1987, 33, 11–18. [Google Scholar] [CrossRef]
  5. Wang, N.; Sasaki, M.; Yoshida, T.; Kotanigawa, T. Estimation of coal hydrophilicity by flow microcalorimetry. Colloids Surf. A Physicochem. Eng. Asp. 1998, 135, 11–18. [Google Scholar] [CrossRef]
  6. Arnold, B.; Aplan, F. The hydrophobicity of coal macerals. Fuel 1989, 68, 651–658. [Google Scholar] [CrossRef]
  7. Parekh, B.K.; Aplan, F.F. The critical surface tension of wetting of coal. In Recent Developments in Separation Science: Volume 4; CRC Press: West Palm Beach, FL, USA, 1978; pp. 107–113. [Google Scholar]
  8. Ofori, P.; Firth, B.; O’Brien, G.; McNally, C.; Nguyen, A.V. Assessing the Hydrophobicity of Petrographically Heterogeneous Coal Surfaces. Energy Fuels 2010, 24, 5965–5971. [Google Scholar] [CrossRef]
  9. Davidson, R.M. Molecular Structure of Coal. In Coal Science; Elsevier: Amsterdam, The Netherlands, 1982; pp. 83–160. [Google Scholar] [CrossRef]
  10. Grimes, W.R. The Physical Structure of Coal. In Coal Science; Elsevier: Amsterdam, The Netherlands, 1982; pp. 21–42. [Google Scholar] [CrossRef]
  11. Liu, H.; Ju, Z.; Bachmann, J.; Horton, R.; Ren, T. Moisture-Dependent Wettability of Artificial Hydrophobic Soils and Its Relevance for Soil Water Desorption Curves. Soil Sci. Soc. Am. J. 2012, 76, 342–349. [Google Scholar] [CrossRef]
  12. Liu, Z.; Yu, X.; Wan, L. Influence of Contact Angle on Soil–Water Characteristic Curve with Modified Capillary Rise Method. Transp. Res. Rec. J. Transp. Res. Board 2013, 2349, 32–40. [Google Scholar] [CrossRef]
  13. Ajalloeian, R.; Yu, H.S.; Allman, M.A. Physical and mechanical properties of Stockton Beach sand. In Proceedings of the 7th Australia New Zealand Conference on Geomechanics, Adelaide, SA, Australia, 1–5 July 1996; pp. 60–65. [Google Scholar]
  14. Gutierrez-Rodriguez, J.A. The effect of oxygen on the hydrophobicity and floatability of coal. Colloids Surf. 1984, 12, 27–51. [Google Scholar] [CrossRef]
  15. Cheng, F. Effect of Oxygen Functional Groups on the Surface Properties and Flotation Response of Fine Coal, Comparison of Rank with Oxidation. Int. J. Coal Prep. Util. 2018, 1–17. [Google Scholar] [CrossRef]
  16. Dey, S.; Paul, G.M.; Pani, S. Flotation behaviour of weathered coal in mechanical and column flotation cell. Powder Technol. 2013, 246, 689–694. [Google Scholar] [CrossRef]
  17. Drelich, J. Guidelines to measurements of reproducible contact angles using a sessile-drop technique. Surf. Innov. 2013, 1, 248–254. [Google Scholar] [CrossRef]
  18. Ibrahim, A.F.; Nasr-El-Din, H.A. Effects of water salinity, CO2 solubility, and gas composition on coal wettability. In Proceedings of the EUROPEC 2015, Madrid, Spain, 1 June 2015; pp. 271–292. [Google Scholar] [CrossRef]
  19. Ibrahim, A.F.; Nasr-El-Din, H.A. Effect of Water Salinity on Coal Wettability during CO2 Sequestration in Coal Seams. Energy Fuels 2016, 30, 7532–7542. [Google Scholar] [CrossRef]
  20. Bachmann, J.; Horton, R.; van der Ploeg, R.R.; Woche, S. Modified sessile drop method for assessing initial soil-water contact angle of sandy soil. Soil Sci. Soc. Am. J. 2000, 64, 564–567. [Google Scholar] [CrossRef]
  21. Vanapalli, S.K.; Nicotera, M.V.; Sharma, R.S. Axis translation and negative water column techniques for suction control. In Laboratory and Field Testing of Unsaturated Soils; Springer: Dordrecht, The Netherlands, 2009; pp. 33–48. [Google Scholar] [CrossRef]
  22. Mohammadi, M.H.; Meskini-Vishkaee, F. Predicting Soil Moisture Characteristic Curves from Continuous Particle-Size Distribution Data. Pedosphere 2013, 23, 70–80. [Google Scholar] [CrossRef]
  23. Van Genuchten, M. A Closed-form Equation for Predicting the Hydraulic Conductivity of Unsaturated Soils. Soil Sci. Soc. Am. J. 1980, 44, 892–898. [Google Scholar] [CrossRef] [Green Version]
  24. Mazurek, A.; Pogorzelski, S.J.; Boniewicz-Szmyt, K. Adsorption of natural surfactants present in sea waters at surfaces of minerals: Contact angle measurements. Oceanologia 2009, 51, 377–403. [Google Scholar] [CrossRef] [Green Version]
  25. Janczuk, B.; Zdziennicka, A. A study on the components of surface free energy of quartz from contact angle measurements. J. Mater. Sci. 1994, 29, 3559–3564. [Google Scholar] [CrossRef]
  26. Rao, S.; Deng, Y.; Cai, W.; Li, Z.; Ye, J.; Lu, H. Study of the contact angle of water droplet on the surface of natural K-feldspar with the combination of Ar+ polishing and atomic force microscopy scanning. Chem. Eng. Sci. 2021, 241, 116705. [Google Scholar] [CrossRef]
  27. Mitarai, N.; Nori, F. Wet granular materials. Adv. Phys. 2006, 55, 1–45. [Google Scholar] [CrossRef] [Green Version]
  28. Chang, C.; Cheng, D.; Qiao, X. Improving estimation of pore size distribution to predict the soil water retention curve from its particle size distribution. Geoderma 2019, 340, 206–212. [Google Scholar] [CrossRef]
Figure 1. Microscope images of crushed materials: (a) rock, showing crystal fragments of quartz (clear) and feldspar (translucent) and (b) coal.
Applsci 11 05966 g001
Figure 2. Particle size distribution of the materials used in this study.
Applsci 11 05966 g002
Figure 3. Diagram of the hanging column apparatus and test sample. All tests started with saturated specimens, and suction was incrementally increased, facilitating the determination of the drying path of the WRC. Note that the hanging water column, which attaches to the outlet, is not shown.
Applsci 11 05966 g003
Figure 4. Images of water droplets on a bed of crushed coal (top) and crushed rock (bottom). Both images show droplets used to measure the advancing contact angles, and the top right droplet indicates the angle measured.
Applsci 11 05966 g004
Figure 5. Advancing and receding angles measured for the sand and sand mixtures.
Applsci 11 05966 g005
Figure 6. Drying path of the water retention curves of different sand mixtures, expressed as the saturation degree vs. suction.
Applsci 11 05966 g006
Figure 7. ESEM images obtained during wetting of the natural sand (a) and hydrophobized sand (b). The arrows indicate the menisci bridging between particles.
Applsci 11 05966 g007
Figure 8. Drying path of the water retention curves of crushed coal and crushed rock expressed as the saturation degree vs. suction: (a) 212–300-μm size fraction; (b) 150–212-μm size fraction; (c) 75–150-μm size fraction and (d) 50–75-μm size fraction.
Applsci 11 05966 g008
Figure 9. ESEM image of coal obtained during a wetting phase. The squares show magnifications of zones containing menisci. The arrows indicate significant menisci or water droplets that are discussed in the analysis of this figure.
Applsci 11 05966 g009
Figure 10. Predicted drying path of WRCs for sand and sand mixtures at different contact angles, expressed in terms of the degree of saturation vs. suction for (a) natural sand, (b) 75% natural sand and 25% hydrophobized sand, (c) 50% natural sand and 50% hydrophobized sand, (d) 25% natural sand and 75% hydrophobized sand and (e) 0% natural sand and 100% hydrophobized sand. For each prediction, CA values of 0 (black lines), CAmean − CASD (blue lines) and CAmean + CASD (red lines) were used. N.S. denotes natural sand.
Applsci 11 05966 g010
Figure 11. Predicted drying paths of the WRCs for crushed rock at different contact angles: (a) 212–300 μm size fraction; (b) 150–212 μm size fraction; (c) 75–150 μm size fraction and (d) 50–75 μm size fraction. For each prediction, CA values of 0 (black lines), CAmean − CASD (blue lines) and CAmean + CASD (red lines) were used.
Applsci 11 05966 g011
Figure 12. Predicted drying paths of the WRCs for crushed coal at different contact angles: (a) 212–300 μm size fraction; (b) 150–212 μm size fraction; (c) 75–150 μm size fraction and (d) 50–75 μm size fraction. For each prediction, CA values of 0 (black lines) and CAmean − CASD (blue lines) were used.
Applsci 11 05966 g012
Table 1. Specific gravity (Gs) of the natural sand and the crushed rock and crushed coal at each size fraction.
Particle Size Range (μm)Gs of Crushed RockGs of Crushed CoalSand
212–3002.621.38-
150–2122.621.4-
75–1502.621.4-
50–752.621.39-
≈100–300--2.65
Table 2. Mean contact angles and standard deviation for each material (nine or more measurements performed).
MaterialMean Advancing
Contact Angle
(CAmean-ad) (°)
Advancing Angle
Standard Deviation
(CASD-ad) (°)
Mean Receding
Contact Angle
(CAmean) (°)
Receding Angle
Standard Deviation
(CASD) (°)
100% natural sand288.7Not observed 1.Not observed 1
75% natural sand846.5536.2
50% natural sand1015.66512.9
25% natural sand1206.17113.3
100% hydrophobic sand1287.2867.4
Crushed rock286.8146.5
Crushed coal1247.89013
1 The water was pulled into the pores between particles, and thus no contact angles could be observed.
Table 3. List of the model parameters used for each material, where values of α, n and m varied for each contact angle (CA). SD = standard deviation, and all CA values are from Table 2.
MaterialModel Parameters That Depended on CA
(Value at 0°, Value at Mean CA −1 SD, Value at Mean CA +1 SD)
Constant Model
Parameters
αnmeθr
Natural sand3.0, 3.2 1, 3.4 28.5, 8.7 1, 8.7 20.9 *0.6690
75% natural sand3.0, 4.0, 6.08.5, 7.0, 9.00.9, 1.3, 0.80.6840
50% natural sand3.0, 5.0, 14.08.5, 8, 80.9, 0.9, 1.00.6820
25% natural sand3.0, 5.0, 25.08.5, 6.0, 6.51.1, 2.0, 2.20.6840
Hydrophobic sand3.0, 13.0, −528.5, 6.5, 8.51.1, 2.0, 1.00.6810
Rock 212–3005.7 *23.1 *0.2 *0.8020
Rock 150–2122.2 *120 *0.04 *0.8020
Rock 75–1501.3 *8 *0.6, 0.65, 0.750.8040
Rock 50–750.6 *7.6 *0.9 *0.8020
Coal 212–3004.6, 19.4, −15.67.6, 7.2, 6.51.6, 2.2, 7.40.7970
Coal 150–2121.8, 5.66.6, 5.21.2, 5.20.7950
Coal 75–1500.8, 2, −2.25.2, 5.4, 3.91.4, 3.5, 7.40.8240
Coal 50–750.5, 2.1, 2.17.2, 6.7, 5.41.3, 1.6, 3.60.8090
1 Based on a receding angle of 17°, due to no receding angles being measured for natural sand. 2 Based on a receding angle of 27°, due to no receding angles being measured for natural sand. * Parameter used for every contact angle.
Publisher’s Note: MDPI stays neutral with regard to jurisdictional claims in published maps and institutional affiliations.

