Abstract
The Hunter valley region in NSW Australia is an area with a heavy coal mining presence. As some mines come to their end of life, options are being investigated to improve the topsoil on post mining land for greater plant growth, which may allow economically beneficial farmland to be created. This research is part of an investigation into mixing a mine waste material, coal tailings, with topsoil in order to produce an improved soil for plant growth. Implementing such a solution requires estimation of the drying path of the water retention curves for the tailings and topsoil used. Instead of a lengthy laboratory measurement, a prediction of the drying curve is convenient in this context. No existing prediction models were found that were suitable for these mine materials, hence this paper proposes a simple and efficient model that can more accurately predict drying curves for these mine materials. The drying curves of two topsoils and two tailings from Australian coal mines were measured and compared with predictions using the proposed model, which performs favorably compared to several existing models in the literature. Additionally, the proposed model is assessed using data from a variety of fine- and coarse-grained materials in the literature. It is shown that the proposed model is overall more accurate than every other model assessed, indicating the model may be useful for various materials other than those considered in this study.
1. Introduction
Resource mining is required to sustain the current demands of society. For example, coal mining is necessary to sustain steel and electricity production for much of the world. However, the transition from coal-fired power to renewable energy sources will likely cause a significant reduction in coal demand, which will inevitably lead to the closure of many coal mines. Mine closure leads to economic stresses for regions where a large coal mining industry is present; the Hunter Valley region in NSW, Australia, could be considered as one of these regions, where, as at the time of writing, around 40 coal mines operate. Various options to alleviate future economic stresses in this region are being proposed and investigated; one such option is to convert the vast areas occupied by coal mines to farmland, which could provide an economic benefit to the region.
Implementing this option will require significant topsoil improvement, due to generally poor quality topsoil for plant growth in the Hunter Valley [1,2], and the further degradation in topsoil quality that occurs when land is mined and then rehabilitated [3,4,5,6]. Soil improvement at the large scales of mine sites has a high cost, leading to some research on use of waste materials, such as municipal wastes (compost and sewerage wastes), as more cost-effective topsoil improvements [7]. This study investigates an alternative option to mix a locally-derived mine waste material, coal mine tailings, with the available site topsoil to achieve improved plant growth potential of the soil mixture compared to the unaltered topsoil. Coal tailings are produced during the beneficiation process of coal, which, importantly, do not typically contain chemical species that are toxic to plants. These tailings are a fine grained waste product of high initial water content comprising mineral soil particles and coal, with the coal content up to 40% or greater [8,9]. Indeed, the fine particle size and high initial water content of these tailings materials make them problematic for conventional disposal in tailings impoundments, making the soil improvement disposal option all the more advantageous.
The research presented herein is one component of broader research that focuses on improving a soil mixture’s water retention properties in the context of plant growth. Water retention properties of a soil are significant for plant growth as they govern the plant available water (PAW) [10], one of many important factors for plant growth. PAW can be estimated from the difference in volumetric water content between two critical soil water suction values: the field capacity (around 30 kPa) and the wilting point (around 1500 kPa) [10].
However, measuring a soil’s water retention curve (WRC) is a time-consuming laboratory process, especially when considering how many different materials must be managed in a coal mine; there may be several different topsoils across a mine site, and the nature of the coal tailings produced is continually changing, as the produced tailings properties vary depending on which coal seam is being mined and processed. The number of materials to evaluate is compounded when mixtures of materials need to be tested. Thus, it is more efficient to employ an accurate model in order to predict the resulting WRC of proposed soil-tailings mixtures. Further, for such a prediction model to be efficient, it should only use easily measurable soil properties and not rely on a calibration to the mixture’s WRC.
Two tailings and two topsoils from coal mines in Australia were gathered for the purpose of measuring their drying path WRCs and assessing the predictive ability of a range of existing models that are published in the literature. It was concluded none of the tested models were suitably accurate (as shown in Section 4), which prompted the development of a simple but more accurate model. The focus of the research herein is to propose the model developed during the broader research, which is a simple and efficient model to predict the soil water retention curve along a drying path based on simply-measured soil physical properties. The drying path of the WRC is predicted as that is the WRC path relevant to soil water absorbed by plant roots. In addition, validation of the model is presented for the local materials and a range of materials from the literature.
2. Key Phenomena for Water Retention Curve Models
There are numerous approaches in the literature to model soil water retention behavior. A common approach is the conversion of a grain size distribution (GSD) to a pore size distribution (PSD), with each pore in the PSD associated with a volume of water it contains and a suction at which it will drain [11,12,13,14,15,16,17]. This information allows a water retention curve to be built. The draining suction of a pore is determined from a capillarity law (e.g., Jurin’s equation), and adsorption mechanisms are generally ignored. In the context of PAW, ignoring adsorption is not detrimental as the wilting point is less than the suction at which adsorptive suction becomes significant (typically considered to be around 2 MPa) [18,19]. This type of modelling approach will be referred to here as the grain size distribution approach to water retention curve estimation (noted GSD-WRC). The GSD-WRC approach was adopted as the starting point in this study, as the primary input parameter of a GSD is relatively simple to measure, and the predictions can be accurate for the suction ranges required. However, the approach, as has been implemented in previous research, suffers from a number of limitations arising from complicated phenomena that need to be simplified, which affects the prediction accuracy. The following two subsections will highlight some of the limitations identified, which are pore filling and contact angle.
2.1. Pore Dimension and Pore Filling
The determination of the PSD from a GSD is arguably the most important aspect of the GSD-WRC approach, as it has the greatest impact on the prediction. Particle packing and determination of the resulting PSD is a complicated non-linear problem, thus it is common to simplify the particle packing for soils by assuming particles within a certain size range pack discretely and have pores of a similar size range [11,12,13,14,15,16,20,21], with a two-dimensional framework typically adopted. An example of this assumption in a two-dimensional basis is mathematically described in Equation (1):
where pi is the pore diameter associated with particle size fraction i of a soil, and di is the mean diameter of the particles in size fraction i. The rationale behind Equation (1) estimating the pore diameter being 30% of the particle diameter is based on research of pore sizes between sand sized spherical particles of a uniform or similar size. It was found that particles tended to pack most commonly as shown in Figure 1, surrounded by either four (left) or six (right) other particles [22].
pi = 0.3di,
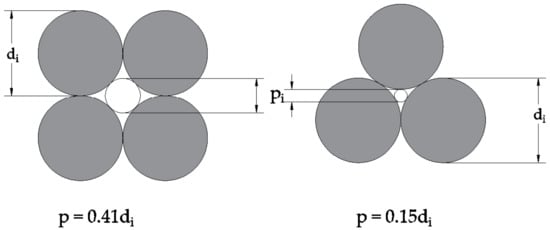
Figure 1.
Maximum pore diameter (p) created between particles for a mean diameter (di), adapted from [22].
The value of 0.3 in Equation (1) is close to the average of 0.41 and 0.15 from Figure 1, and was shown to be useful for estimating water retention behavior of relatively uniform sized sand and glass beads [23]. Thus, the simplified particle packing approach Equation (1) is suitable for some materials, however, it is not suitable for many soils that contain particles of varying sizes. This is primarily because Equation (1) ignores the possibility of larger pores being filled with particles smaller than 0.3di. Pore filling creates more, smaller pores and increases the suction at which the residual pores drain. Predicting grain packing and pore distribution requires much more soil data, such as stress history, placement conditions, and particularly information on each particle’s shape and size.
The dependence of pore filling on the GSD is highlighted in several studies investigating the packing density (or total volume fraction of solids) of binary mixtures of spherical particles (i.e., two different sized particles present) [24,25,26]. For these mixtures, much higher densities (or pore filling) are achieved as the coarse:fine particle size ratio of the particles increases, as shown in Figure 2.
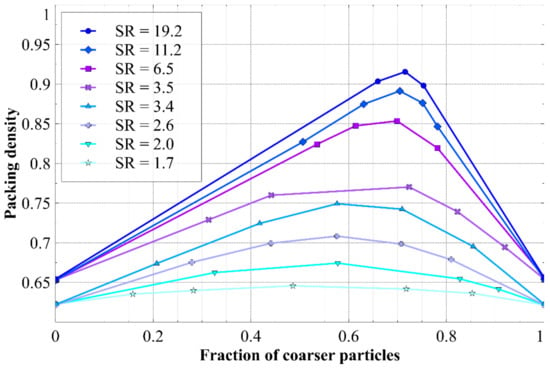
Figure 2.
Packing density measured for binary mixtures of spherical particles, showing the effect of size ratio (SR) and the fraction of coarser particles. Data adapted from [25].
In addition, Figure 2 shows that the ratio of coarse particle fraction to fine particle fraction also affects the packing density, with the highest density achieved at a coarse particle fraction of around 0.7 (for a size ratio around 19). This result suggests that a deficit of finer particles could result in the pores between coarse particles not being filled.
The binary mixture studies discussed [24,25,26] have only used sand sized particles, thus the behavior observed may change for silt and clay sized particles that are much smaller, and possibly more platy. This is confirmed by research showing a reduction in packing density achieved for mono-sized particles smaller than around 60 μm [27] (see Figure 3). The response between 3 and 60 μm is due to the greater significance of frictional and adhesional forces for smaller particles, when compared to the particles self-weight [27].
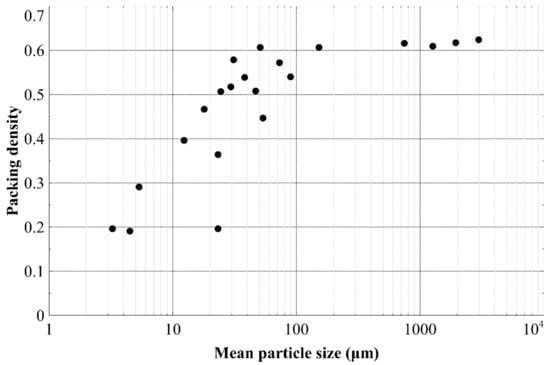
Figure 3.
Measured packing density of relatively uniformly sized particles of different mean diameters. Data adapted from [27].
The particle shape is also important for determining the packing density or pore filling of particle mixtures; research shows that many different packing density trends are possible as the aspect ratio and geometry of particles change [28,29,30]. For many soils the change in aspect ratio with particle size can be significant, as values range from 1.3 for sand sized particles [31,32] to several hundred for some clays [33].
To summarize the discussion of this subsection, when predicting pore filling, the literature indicates that the following particle parameters are important and should be considered: the size ratio between particles, the relative proportions of coarse and finer particles, the overall size of a particle, and the particle geometry [28,29,30]. However, no WRC models based on grain size distributions were found that take filling/packing into consideration in a meaningful way.
To implement pore filling in GSD-WRC models, techniques can be found in models that fit measured data from particle packing of spherical granular media. For example, a less common approach for predicting the particle packing of spherical grains was found, which uses a fractal approach called Apollonian packing, to place spheres into the pores between larger particles [34]. Apollonian packing may be useful for the GSD-WRC models discussed so far, as it can be applied on a two-dimensional basis using an Apollonian gasket, shown in Figure 4, to model the pore filling. Interestingly, the implementation of Apollonian packing in the context of WRC prediction was not found in the literature.
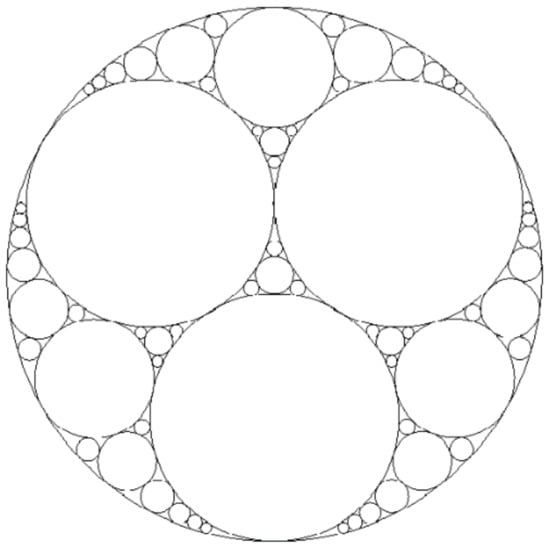
Figure 4.
A fractal shape called an Apollonian gasket, where the largest possible circle is progressively placed into each area that is not contained within a circle.
2.2. Contact Angle between Water and Soil Surface
The contact angle of a mineral soil grain is an important factor affecting the predicted suctions of GSD-WRC models, as it determines the drainage suction of a pore from the capillarity law. However, because most soil minerals are hydrophilic with relatively low contact angle values (for example, as low as 17° for quartz [35,36]), many GSD-WRC models assume a contact angle of zero and achieve good predictions for many soils [11,12,13,14,15,16,17]. In contrast, the materials of interest in this study include coal tailings that have significant coal content, and coal is known to be hydrophobic [37,38,39,40,41,42], which means that a contact angle of 0° cannot be used nor justified.
There are a variety of existing WRC models that do consider the contact angle of soils [43,44,45], typically for the purpose of fitting wetting and drying paths to WRC data (i.e., capturing hysteretic behavior) where the advancing contact angle and receding contact angle are relevant to the wetting and drying path WRCs, respectively. In addition, it has been shown that many of the WRC models that assume a contact angle of zero during the model development can be easily altered to consider the contact angle of a soil [37]. Thus, consideration of the contact angle of a material is relatively simple to implement, at least for materials that have the same contact angle for every particle. However, coal tailings contain a mixture of coal and mineral particles, and the coal particles can be more prevalent for particular size ranges, as indicated by the correlation between specific gravity (Gs) and particle size for one studied coal tailings [46]. No models have been found that can consider contact angle variations with particle size; however, for GSD-WRC models in particular, it would be simple to implement such the correction in [37], as a suction is associated with each particle size range.
3. Proposed Model
The GSD-WRC model proposed in this paper had to meet several criteria. It should:
- Achieve reasonably accurate predictions without requiring calibration to WRC data;
- Preferably use input parameters that are relatively easy to measure;
- Consider pore filling;
- Be capable of considering variation in contact angle with respect to particle size.
These criteria arose from the broader research goals and the limitations discussed in Section 2.1 and Section 2.2. Note that the model does not attempt to capture volume change as this would necessarily compromise its simplicity. Thus, when using this model, and many others, limitations due to the lack of volume change must be kept in mind.
To provide a high-level view of how the proposed model is implemented, a series of sequential steps are provided in the following list:
- The GSD of a material is used to calculate its clay, silt, and sand and larger fractions.
- The sizes in the GSD are then adjusted using an aspect ratio, such that smaller particles (e.g., clay or silt) are reduced in size to a greater extent than larger particles.
- A series of primary pore sizes are then created, by assuming the particles in each particle size bin of the adjusted GSD pack together to create a total volume of pores of a proportional size.
- The volume of primary pores associated with each pore size is estimated by assuming the pore volume fraction is proportional to the mass fraction of the associated particle size bin. That is, for a particle size bin accounting for 10% of a soil’s mass, the volume of pores associated with this bin account for 10% of its total pore volume, as determined from its adopted saturated volumetric water content.
- A set of criteria are applied to each primary pore size to determine what degree of pore filling should occur within each pore size. Any required pore filling is done so to achieve the packing densities at different levels of Apollonian packing.
- Whether pores are unfilled, partially filled, or filled is determined by considering whether there is a sufficient volume of smaller particle fractions that could fill each set of primary pores in a binary mixture to achieve the packing density corresponding to Apollonian packing.
- Having determined the degree of filling for each set of primary pores, they are then redistributed (as required) into a larger number of smaller pores, according to the appropriate Apollonian geometry, and combined to give a final pore size distribution.
- Each pore size in the final distribution is transformed to an equivalent area circular pore, with a drainage suction, creating the final pore size distribution.
- The predicted WRC is the theoretical WRC of the pore size distribution, which is estimated by assuming a number of arbitrary suctions, and calculating the volumetric water content of the water filled or undrained pores.
3.1. Inferring a Primary Pore Size Distribution from Grain Size Distribution (GSD)
The main input of the proposed model is the GSD of a soil, which is used to estimate a PSD, which in turn is converted into a WRC using Jurin’s law, for a given grain packing arrangement (porosity or void ratio).
The particles corresponding to measured sizes in a GSD are often assumed to be spherical; however, research has shown that small particles (e.g., clays or silts) are actually non-spherical and that an aspect ratio should be considered to better capture particle size and shape. The smaller particles in a soil are usually measured with methods other than sieving such as sedimentation or laser diffraction, which are more likely to detect the larger dimension of non-spherical particles. If the sizes reported in the GSD are assumed to represent diameters of spherical clay and silt sized particles, which are in fact platy, then the mean size of the particles will be overestimated, and this will affect the inferred packing of these smaller particles, resulting in an underestimation of the number of smaller pores. Hence, a more realistic grain packing will be achieved by reducing the sizes of small particles in the GSD to reflect their non-sphericity.
Figure 5 shows data derived from [31,47,48,49,50,51] which can be used as a basis to correlate AR to particle size. In the proposed model, the sizes of the particles in each size fraction of the GSD (di), smaller than sands (<60 μm), are adjusted by factoring them by an aspect ratio (ARi), determined by the function fitted to the data in Figure 5, according to Equation (2).
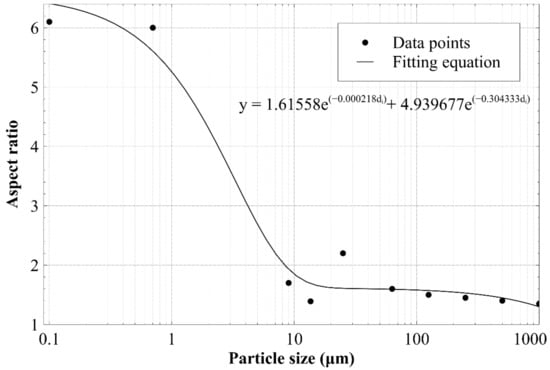
Figure 5.
Collated values of the average aspect ratio found for different particle sizes from the literature, measured using optical, electron, or atomic microscopy. A fitting equation and function (solid line) is shown, which describes the general trend in the aspect ratio values observed, as a function of particle size diameter di. Data adapted from [31,47,48,49,50,51].
In Equation (2), di,adjusted is the adjusted maximum particle size in the i-th bin of the GSD, di is the unaltered maximum particle size in the i-th bin of the GSD, and ARi is the aspect ratio determined from the fitting equation shown in Figure 5.
It should be noted that some clays are reported to have aspect ratios on the order of hundreds [33], however these extreme values were not considered in this model, which could result in limitations for some materials. Note, this large variability in aspect ratio between clay particles may be due to their mineralogy, which was ignored in this model for the purpose of using simple to measure soil properties.
For the first step in determining a primary packing, particles within each GSD size bin are assumed to pack together to create circular pores, according to one of the arrangements shown in Figure 1. Pores formed between three particles of diameter di,adjusted can accommodate smaller particles up to 0.15di,adjusted; pores formed between four particles of diameter di,adjusted can accommodate particles up to 0.41 di,adjusted. Assuming pores are similarly likely to form from three or four particle arrangements, the average pore diameter of the two arrangements in Figure 1 (taken as 0.3 di,adjusted) is used as the basis to relate particle size to pore size according to Equation (3), which is similar to Equation (1) that has been found to be accurate for sands [23].
pi = 0.3di,adjusted
In Equation (3) pi is the primary pore diameter associated with the i-th particle size bin, and di,adjusted is the particle size as determined from Equation (2).
After a series of primary pore sizes are obtained, the volume of primary pores with diameter pi is determined by assuming the total pore volume associated with particle size bin i is proportional to the mass fraction of size bin i. Thus, the saturated volumetric water content associated with only the i-th particle size bin θi, is given by Equation (4) as:
where xi is the mass fraction of particle size bin i, and θs is the saturated volumetric water content of the entire soil or material for the conditions under which the WRC is being determined. The value of θs is also equivalent to the total porosity of the soil or material under the same conditions.
3.2. Primary Pore Filling
The next step in determining the grain packing arrangement is to fill the primary pores pi with smaller particles, when appropriate. This filling is carried out according to the Apollonian gasket described in Section 2.1. An Apollonian gasket is a fractal pattern where each fractal step (denoted j herein) places a number of circular particles (denoted dij) neatly into the largest pores remaining after the previous step. As a fractal, it repeats infinitely, however this model arbitrarily uses a partial Apollonian gasket where a limited number of fractal steps are taken resulting in a maximum of six particles placed into pore pi, as shown in Figure 6. Figure 6a shows the packing outcome of the first fractal step (j = 1) which places particles di1, and Figure 6b shows the packing outcome of the second fractal step (j = 2) which places particles di2. The mathematics to determine the geometry of Figure 6, based on Descartes’ theorem, is well documented [52,53,54,55] and will not be repeated here for conciseness.
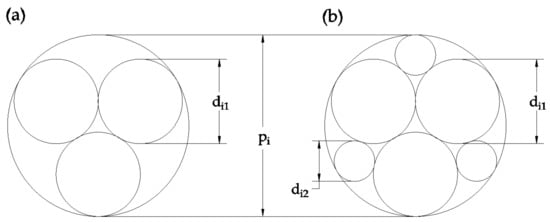
Figure 6.
Representation of a partial Apollonian gasket created by filling the primary pore pi with: (a) three particles named dij (j = 1), (b) six particles named dij (with j ranging from 1 to 2 to distinguish particle size). In this figure (a,b) show two different degrees of filling possible in the proposed model.
3.2.1. Smallest Particle Criterion
The first pore filling criterion pertains to the smallest particle in the material: if the diameter of the particle needed to create the Apollonian gasket (dij), is smaller than the minimum particle size (dmin) in the GSD, then particle dij is not placed within the pore pi as no sufficiently small particles are deemed to be available. This criterion could result in either no filling (di1 < dmin), partial filling (di1 > dmin > di1), or maximal filling (di2 > dmin). The value for dmin in this study was calculated as per Equation (5).
where d1%,adjusted is the smallest adjusted particle diameter (see Equation (2)) where there is at least 1% of the mass fraction finer. The adoption of 1% mass fraction finer is an arbitrary value chosen to prevent extremely small amounts of very fine particles in a soil, overly affecting the filling of pores in the remaining soil.
It should be noted here that satisfying the smallest particle criterion does not necessarily ensure that a pore will be filled in any particular way; it simply determines what degree of filling is possible. The criteria that follow determine if a primary pore is filled.
3.2.2. Filling of Pores Associated with Clay Sized Particles
For primary pores pi generated from clay particles (di,adjusted ≤ 2 μm), no filling is assumed to occur. This decision is based upon a large decrease in packing density (around 68%) observed for particles of 3 μm when compared to sand sized particles [27], as presented in Figure 3.
3.2.3. Filling of Pores Associated with Silt Sized Particles
For primary pores pi generated from silt sized particles (where di,adjusted is between 2 and 60 μm), filling is assumed to occur if there are deemed to be large enough fractions of suitably smaller particles, and these occur in suitable proportions. In this context, the amounts of particles are not considered on a rigorous, global mass or volume balance; rather they are determined separately for each set of primary pores by ensuring that there are smaller particles present in the GSD such that a binary mixture of smaller particles can exist to fill the primary pores to a packing density consistent with those corresponding to the partial or maximal filling shown Figure 7b,c.
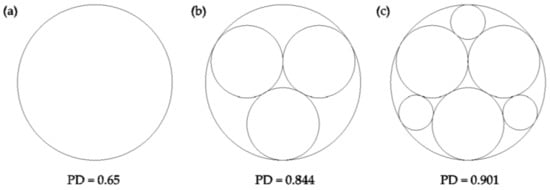
Figure 7.
Diagram showing the three possible states of a pore in the proposed model, along with the packing density (PD) associated with each state: (a) unfilled pores, where packing density is similar to random close packing density; (b) partial pore filling state where three particles fill the pore; (c) maximal pore filling state where six particles fill the pore.
Figure 7 provides values of packing densities for the Apollonian packing (0.844 for first level packing and 0.901 for second level packing) that can be adopted as values that would be achieved if different levels of primary pore filling were to occur. The obvious and direct criteria to consider would be whether there are enough particles di1 to fill the primary pores pi (refer to Figure 6), and enough di2 particles to fill the second level pores associated with di1. When this approach is implemented, the predicted WRCs are poor approximations to measured data, as the model fails to fill some pores that would improve the prediction accuracy.
Upon assessment of the results from this direct Apollonian filling process, it is considered likely that its poor performance arises because the Apollonian gasket pore filling shown in Figure 7 is strictly a 2D representation of a 3D phenomenon. So, rather than considering pore filling directly using the 2D geometry of Figure 7, the data for packing density as a function of the size ratio (denoted SR) and proportions of particles in a 3D binary mixture in Figure 2 (reproduced below as Figure 8) will be used.
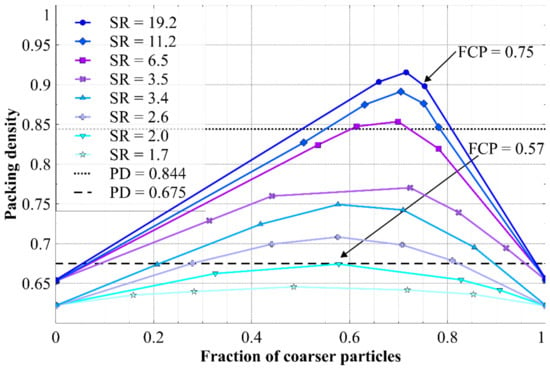
Figure 8.
Packing density measured for binary mixtures of spherical particles, showing the effect of size ratio (SR) and the fraction of coarser particles. The horizontal lines show the packing density (PD) of states (b) and (c) from Figure 7. The maximum FCP values that could accommodate these PD values are indicated. Data adapted from [25].
As an alternative approach, the pore filling criterion was modified to consider the size and proportion of mono-sized particles needed to fill the primary pores between particles di,adjusted, to achieve the same packing density as partial or maximal filling in Figure 7. This was done by combining the packing density determined from Figure 7 with the literature data from Figure 2, to create Figure 8. Figure 8 shows the packing density achieved in binary particle mixtures with different smaller:coarse particle size ratios and fractions of coarser particles in the binary mixture.
The unfilled pores condition in Figure 7 corresponds to an overall packing density that is a similar value to the random close packing density of spheres [56], which is consistent with the minimum void ratio of sands [57], aligns with the model’s use of Equation (3), and is similar to the value for single sized particle packing in Figure 8 (when the coarse fraction is 0 or 1). Figure 8 indicates that in a binary particle mixture, a minimum SR of 6.5 is needed to achieve a packing density of 0.844 (i.e., partial filling Figure 7b), and the fraction of coarser particles (denoted FCP) must not be greater than about 0.72 (or else there are not enough smaller particles to fill the pores between the coarser particles to achieve the assumed packing density). Thus, it is assumed partial pore filling in pore pi, requires particles at least 6.5 times smaller than di,adjusted, and the mass fraction for di,adjusted must not be greater than 72% of the “total” mass fraction; here, the “total” mass fraction is the sum of mass fractions from di,adjusted and all adjusted particle size bins at least 6.5 times smaller. Similarly for maximal filling, a SR of 19.2 is required to achieve a packing density of 0.901 (Figure 7c), and the FCP value must not be greater than 0.75. From this information, the minimum possible SR of filling particles was adopted as 6.5 and 19.2 to achieve partial and maximal pore filling respectively (Figure 7b,c). Additionally, it was assumed there are enough finer particles to achieve partial or maximal pore filling if the FCP is less than 0.72 or 0.75 respectively.
Hence, two decisions must be made to fill the primary pores in the silt fraction with mono-sized smaller particles:
- What is the size ratio that defines a suitably smaller particle, to form a binary mixture with a particular degree of filling (packing density)? That is, what size particles (dss,i) are small enough to effectively fill the pores between the larger particles di,adjusted?
- What is the maximum fraction xi of larger particles di,adjusted that still ensures that there are enough smaller particles (dss,i) to achieve the assumed packing density in the coarser particle fraction? That is, how to decide when there are too few smaller particles to effectively fill the pores between larger particles?
Partial or maximal pore filling is assumed to occur if the mass fraction of particles sufficiently smaller than di,adjusted, denoted here by xss,i, satisfies Equation (6):
where xi is the mass fraction of the i-th particle size bin, and FCPreq is 0.72 for partial pore filling or 0.75 for maximal pore filling. Equation (6) can also be re-expressed in terms of xss,i as shown in Equation (7).
In Equations (6) and (7) the sum of smaller particles, xss,i, can be determined by subtracting from unity the mass fraction of particles larger than dss,i, as shown in Equation (8):
where dm is the adjusted particle diameter associated with the mth particle size bin, xm is the mass fraction of the mth adjusted particle size bin, and dssi is the adjusted particle size considered small enough to fill the pores between di,adjusted and is determined using Equation (9):
where di,adjusted is the particle size as determined from Equation (2), and SR is the size ratio taken as 6.5 for partial or 19.2 for maximal pore filling.
Note, if Equation (6) or (7) is not true using the SR and FCP values from both partial or maximal pore filling, then no filling is assumed to occur (Figure 7a).
The pore filling conditions described so far for silt-sized particles are performed on a per bin basis; that is, each pore pi is has its degree of pore filling determined. However, a per bin determination of the degree of pore filling is not always conducted. Improved prediction results occur when the largest particle texture class is considered as a whole (not on a per bin basis), and the smaller texture classes are considered on a per bin basis. For example, if a soil contained only silt and clay, the largest texture class, silt, is considered as a whole with the use of Equation (10) instead of using Equation (6) or (7).
In Equation (10), FCPreq is 0.72 to check if partial pore filling occurs or 0.75 to check if maximal pore filling occurs, xsilt is the mass fraction of silt sized particles, and xclay is the mass fraction of clay sized particles. Equation (10) is used once with the flowchart shown in Figure 9, to decide what degree of pore filling occurs for every pore pi associated with a di,adjusted between 2 to 60 μm.
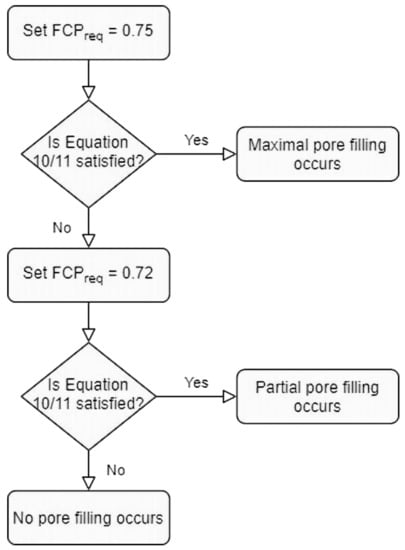
Figure 9.
Flowchart detailing how the pore filling state is decided with the use of either Equation (10) or (11).
3.2.4. Filling of Pores Associated with Sand and Larger Sized Particles
As discussed at the end of Section 3.2.3, improved prediction results occur when the largest particle texture class is considered as a whole, hence for simplicity any sand and larger sized particles (di,adjusted greater than 60 μm) are assumed to be the largest texture class and considered as a whole rather than on a per bin basis. The as a whole consideration is performed using Equation (11) to decide what degree of pore filling occurs for every pore pi associated with a di,adjusted greater 60 μm.
In Equation (11), FCPreq is 0.72 for state (b) or 0.75 for state (c) pore filling, xsand+ is the mass fraction of sand and larger sized particles, and xsilt is the mass fraction of silt sized particles. Equation (11) is used with the flowchart shown in Figure 9 to decide what degree of pore filling occurs in pores pi associated with a di,adjusted greater than 60 μm.
3.3. Pore Size Distribution to Water Retention Curve
Once each primary pore size pi is filled with particles when deemed appropriate (according to Section 3.2.1, Section 3.2.2, Section 3.2.3 and Section 3.2.4), each pore space associated with a particle size bin may be maximally filled and contain ten subpores as shown in Figure 10a, partially filled and contain four subpores (Figure 10b), or unfilled and only pore pi is relevant.
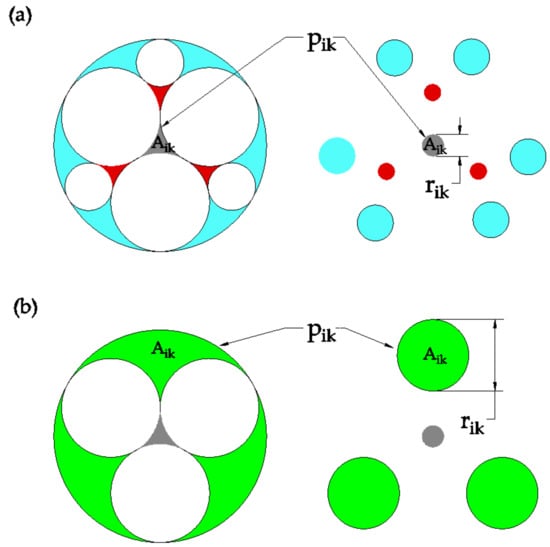
Figure 10.
Diagram showing: (a) the pore space associated with a maximally filled pore pi, with the area Aik of one subpore pik highlighted (with k ranging from 1 to 10); (b) the pore space associated with a partially filled pore with the area Aik of one subpore pik highlighted (k ranging from 1 to 4). In both (a,b) each subpore pik is transformed to a circular shape with an equivalent area, and subpores with the same color have identical areas.
Each subpore is transformed to an equivalent area circular pore as shown in Figure 10. The equations to determine the area of a subpore depend upon the degree of pore filling, and for simplicity are given as expressions of the primary pore diameter pi as shown in Equation (12); note a number of equations are shown, with the applicable subpore area being indicated by a pore color corresponding to what is shown in Figure 10.
In Equation (12), Aik is the area of the k-th subpore for the pore space of the i-th size bin, and pi is the primary pore diameter of the i-th particle size bin. Once the pores of area Aik have been converted to equivalent area circular pores, the capillary suction for each subpore (sik) is estimated using the Young-Laplace equation shown in Equation (13):
where γ is the surface tension of water, rik is the circular radius of the k-th subpore within the pore space of the i-th size fraction, and αi is the receding contact angle of the water solid interface for the particles associated with the i-th size fraction.
In the proposed model, the contact angle changes with particle size when the material tested is coal tailings, which are comprised of coal (maceral) and inorganic mineral particles. Indeed, coal macerals are known to be more hydrophobic than minerals [37,38,39,40,41,42] and the contact angle of a given fraction depends on the relative proportion of macerals and minerals. In addition, it was found that those proportions vary with particle size [46].
For those materials containing coal particles, it is proposed to estimate the value of αi as a weighted average of the contact angle of macerals and minerals, as given by Equation (14):
where αc is the contact angle measured for the coal particles, Vci is the volume fraction of coal particles for the i-th particle size bin, αm is the contact angle measured for the mineral particles, and Vmi is the volume fraction of mineral particles for the i-th particle size bin. For materials that do not contain coal particles, or if a simplified estimate of the contact angle is required, a constant contact angle should be used, as opposed to Equation (14).
Each subpore within a pore space is assigned a bulk soil volumetric water content when the subpore is filled with water (θik), such that the summation of every θik equals the soil’s porosity. This water content is based on the weighted average of the individual pore area (Aik) to total pore area (Ai) as shown in Equation (15), which can determine the volumetric water content θik of the k-th subpore within the i-th pore space.
where Aik is the area of the k-th subpore in the i-th particle size bin, and Ai is the total pore area for the pore space for the i-th size fraction, i.e., the sum of the k Aik values in the i-th particle size bin, θi is the volumetric water content associated with the i-th particle size bin given by Equation (4).
The volumetric water content at a particular suction θ(s) is determined by Equation (16), which sums all θik values that have a corresponding drainage suction sik greater than the suction s.
Equation (16) allows a WRC to be constructed by considering a number of suction values and determining their corresponding volumetric water contents.
3.4. Summary of Model Inputs and Outputs
The process of using the proposed model to generate a WRC prediction is summarized within this subsection. The material parameters required as inputs for the model are as follows:
- Sand fraction;
- Silt fraction;
- Clay fraction;
- Saturated volumetric water content;
- Receding contact angle;
- Particle size bins from the grain size distribution (GSD).
The first step is to create a primary pore size distribution (PSD) from the GSD using Equations (3) and (4). This PSD is modified by applying some degree of pore filling (Figure 7), depending upon the filling criteria presented in Section 3.2.1, Section 3.2.2, Section 3.2.3 and Section 3.2.4. After pore filling is complete the final PSD is generated, and each individual pore is assigned a draining suction (Equation (13)) and a partial volumetric water content (Equation (15)). The theoretical WRC of the PSD can then be determined by assuming a number of arbitrary suctions and using Equation (16) to determine the corresponding volumetric water content due to undrained pores. This theoretical WRC is adopted as the WRC prediction for the material.
4. Materials and Methods
4.1. Materials
The materials used in this study are tailings and topsoils collected from three coal mines in the Permian coalfields of eastern Australia and some materials from the literature [13,58,59,60,61,62,63]. The tailings initially had a high water content and required drying in an oven before use. The topsoils were cleared of particles larger than 2.36 mm and discrete organic matter (e.g., roots). For each tailings and topsoil, the Atterberg limits were measured (according to AS 1289.3.9.1 and AS 1289.3.2.1) and the specific gravity (Gs) was measured (using a Micromeritics Accupyc II).
Then, maceral particles (coal) and mineral particles for each tailings were separated on the basis of particle density, in order to measure the contact angle of maceral and mineral particles. Such measurement is necessary to assess the variability in contact angle with particle size (see discussion of Equation (14)). Density separation was achieved using a centrifuge and a “heavy liquid” (lithium heteropolytungstate solution) that can have its Gs adjusted to any value below 2.85. After centrifugation, the floating material and supernatant were carefully decanted from the settled material, and both parts of the material were then washed with deionized water and the floating and settled masses were measured. Two separation procedures were conducted, with heavy liquids with Gs of 1.4 and 2.2. The floating material collected from the heavy liquid with a Gs of 1.4 was considered representative of the coal particles in the tailings, as coal macerals usually have a Gs between 1.1–1.5 [64]. The settled material collected from the heavy liquid with a Gs of 2.2 was considered representative of the mineral particles in the tailings. Particles with intermediate Gs comprised mixed mineral and maceral grains.
The contact angle for each material was measured using an approach based upon a sessile drop technique [65] and a sample preparation procedure specific to soils [66]; the same approach was used in previous research and the reader is directed to [37] for a detailed description. Note, only the receding contact angle was necessary for this study, as this angle is relevant for the drying path of the WRC. The Gs, Atterberg limits, and receding contact angle measured for each material are shown in Table 1.

Table 1.
Specific gravity (Gs), Atterberg limits (AS 1289.3.9.1 and AS 1289.3.2.1), and receding contact angle [37] measured for tailings, topsoils, and coal and mineral particles separated from each coal tailings.
The GSD of each material listed in Table 1 was measured using laser diffraction and wet sieving. A standard sieve stack from 2360 μm to 75 μm was used to establish the GSD for particles larger than 75 μm. Material passing the 75 μm sieve was prepared to a loose dry powder and dispersed in deionized water with an ultrasonic probe, then analyzed using a Malvern Mastersizer 2000 (Malvern Panalytical, Malvern, UK). Several laser diffraction measurements were obtained to check variability, with no significant differences among different measurements observed. The GSD created for each material by combining the sieve and laser diffraction data is shown in Figure 11. Note that irregularities may be seen around 75 μm particle size indicating the transition between sizing methods.
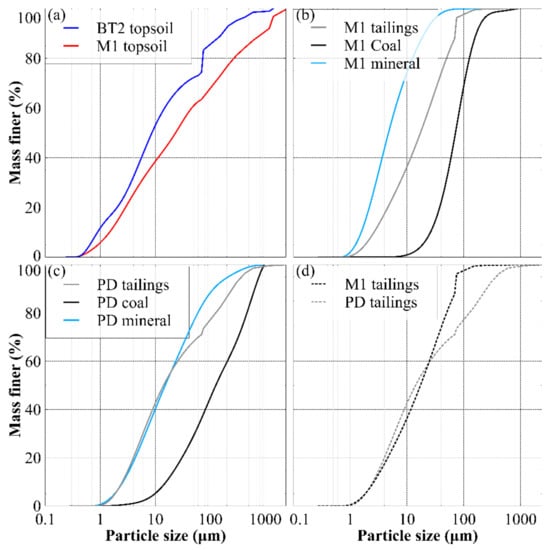
Figure 11.
Grain size distributions measured for the topsoils, tailings, and the representative coal and mineral particles separated from each tailings. Subfigure (a) shows the similarity between the two topsoils, (b,c) show how the representative coal and mineral fractions differ between the tailings, and (d) highlights the similarity of the tailings. Particle sizes below 75 μm were determined by laser diffraction, sizes above 75 μm was determined by wet sieving.
Figure 11a shows that the two topsoils are relatively similar in terms of GSD, with M1 only slightly coarser than BT2 (around 10% of particles are between 1 and 2 mm). The same can be seen for the two tailings (Figure 11d) where the PD tailings are only slightly coarser than the M1 tailings. However, Figure 11b,c highlight the large differences in particle size between the coal and mineral particles within both tailings used in this study. For example, most coal particles of M1 tailings are between 50 and 200 μm, whereas the associated mineral particles are mostly between 2 and 20 μm. This disparity between maceral and mineral sizes highlights that considering a contact angle for each particle size fraction may be useful, as hydrophobic coal particles are more prevalent in the larger sizes.
4.2. Methods
The laboratory methods used in this study all relate to the measurement of the drying path of the WRC for a material. The WRCs were measured for the purpose of model evaluation and validation using reconstituted samples; it is important to note these samples have a different soil structure to materials placed in-situ at mines, and evaluation of models for in-situ conditions was not performed herein. The WRCs were constructed in terms of volumetric water content vs. suction. Suction measurements were first performed on reconstituted samples undergoing drying to get the suction vs. gravimetric water content (wc) WRC. The relationship of the soil bulk volume with wc was determined and used to present the measured WRC in terms of volumetric water content. These two curves were then combined to get the evolution of volumetric water content with suction during drying.
Samples for suction measurement were first prepared by consolidation from a slurry within a stainless steel ring of 45 mm diameter, under a relatively low consolidation pressure of around 4 kPa. The reader is directed to [67] for further experimental details on consolidation. Every slurry was prepared at an initial wc of at least 150% of the liquid limit. The consolidation process created a saturated sample that a small circular plastic container was gently pushed into, filling the container with consolidated material, and a wire saw was used to cut the material flush with the rim of the container.
The initial wc of the sample was measured using some offcuts, which allowed the wc of the sample to be tracked during drying by measuring its mass change. Immediately after the wc was measured, suction was estimated using either a high capacity tensiometer [68] (up to ≈2 MPa) or a Decagon WP4C dewpoint potentiometer (greater than 2 MPa). To increase the suction within the sample, it was dried incrementally in a 60 °C oven, and an equilibration time of at least 2 days was given after a drying step before taking another suction measurement. To avoid drying during equilibration, the samples were double sealed in plastic zip lock bags and stored in a small airtight container. Note, most materials required several drying steps before a suction could be reliably measured, due to sensitivity limitations of the tensiometer used.
Samples for bulk volume measurement during shrinkage were first consolidated from a slurry in the same manner as samples used for suction measurements. A 1 cm3 sample was then cut from the consolidated material with a wire saw, though in some cases minor drying was required before cutting for handling reasons. The coated sample was progressively dried and its volume measured by immersion in silicon oil. The hand spray plaster method was used to ensure that the samples did not absorb silicon oil during immersion. A detailed description of the hand spray plaster procedure can be found in [69] and only a brief description is given in this paper. The hand spray plaster procedure involves coating the soil sample (of size ≈ 1 cm3) in a waterproof (hand spray plaster) material, which is permeable to water vapor (to allow incremental drying of the sample) but impervious to liquids. The volume of the sample is measured by submersion in silicon oil using Archimedes’ principle.
A series of consolidation processes were conducted to prepare samples of M1 tailings, PD tailings, BT2 topsoil and M1 topsoil for the measurement of their WRC and shrinkage upon drying.
4.3. Validation of the Proposed WRC Prediction Model
The prediction accuracy of the proposed model was assessed by comparing predicted WRCs against the WRCs measured as part of this study and WRCs from a number of materials in the literature [13,58,59,60,61,62,63]. The relevant properties and measured GSDs of each material from the literature are shown in Appendix A.
The accuracy of the proposed model was compared against several existing WRC models in the literature, to put its performance into context. The existing models used are the: Mohammadi-Vanclooster model (MV) [16], Arya-Paris model (AP) [11], Chang-Cheng-Qiao model (CCQ) [12], non-similar-media-concept model (NSMC) [20], modified Kovacs model (MK) [70], and intergranular mixing particle size distribution model (IMP) [71].
Each model from the literature is briefly characterized in Table 2, which details the model inputs, key equations to calculate volumetric water content or suction, and the model outputs. The reader is referred to Appendix B for a complete description of every input parameter used for each material, for the proposed model, and the WRC models from the literature.

Table 2.
Characterization of the proposed WRC model and models used from the literature, showing model inputs and outputs, equations related to estimating suction and volumetric water content, and the source of model. The equations shown are presented as seen from the source and the reader is directed to the relevant source for derivation and explanations of the equations shown. See footnote for definitions of input parameters.
Table 2 shows that most of the models presented require input parameters that are either assumed or adjusted such that the model performs adequately for some WRC data. In other words, most models require some form of calibration for optimum results. In this study, one requirement for the proposed model is that calibration to WRC data must be avoided. Thus, if any of the comparison WRC models were to be used in place of the proposed model, they must also satisfy the requirement to avoid calibration. Therefore, no input parameters for the comparison models were specifically adjusted to optimize fitting of the WRC data; instead, the recommend values for these parameters were adopted from the model’s source.
For the proposed model, and for each model used from the literature, it is assumed the soil or material maintains a constant volume (constant void ratio or porosity) despite changes in suction. This is important to consider, as many of the WRCs being predicted in this study are from soils which undergo volume change. Consequently, assuming a constant volume reduces the accuracy of the predicted WRCs. Nevertheless, models with this assumption are still used on real soils, simply due to the difficulty in predicting a WRC in a more scientifically rigorous manner incorporating volume change.
The basic material input properties adopted for each mine material were presented in Table 1, which includes: Gs, Atterberg limits, and receding contact angle. The initial density or porosity of a material in this study was adopted as the porosity corresponding to the first WRC data point of each material; the initial porosity along with other model specific parameters for each material are provided in Appendix B.
5. Results and Discussion
Retention Curves of the Mine Materials
The drying path WRCs measured for each material (as described in Section 4.2) are shown in Figure 12, expressed in terms of volumetric water content. Figure 12 shows that most of the measured WRCs are relatively similar, except for BT2 topsoil that retains more water than the other materials at particular values of suction in the range measured. These WRCS are consistent with the large proportion of fines in the materials (see Figure 11).
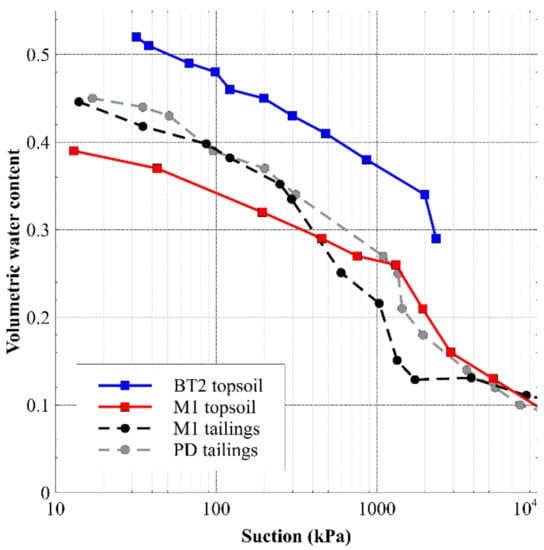
Figure 12.
Drying path of the water retention curves measured for each tailings and topsoil, expressed in volumetric water content vs. suction.
The predictions of the WRCs in Figure 12 are shown in Figure 13. The proposed model predictions, shown as black lines, agree very well for both mine tailings and reasonably well for both topsoils, although the model struggles to fit the WRC data at higher suctions. In contrast, the predictions obtained from all of the models found in the literature are relatively inaccurate, to greater and lesser degrees, for all of the studied mine materials. The inaccuracy of the proposed model generally becomes significant at suctions around 1–2 MPa or larger, which coincides with the range when adsorptive suction becomes dominant [18,19]. Thus, it is likely the inaccuracy of the proposed model at high suctions, for the mine materials, is due to water adsorption being ignored.
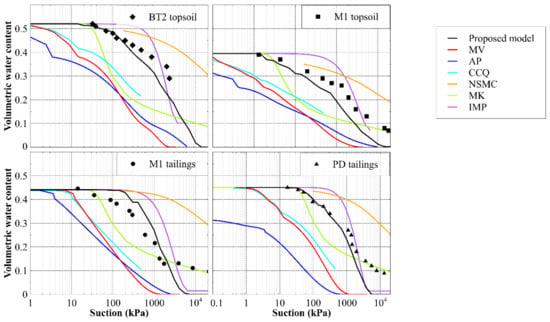
Figure 13.
Water retention curve predictions for the materials presented in Figure 12 from the proposed model and various models from the literature. Refer to Figure 11 for the GSD of each material, and Appendix B for the model parameters used.
The performance of the proposed model is further tested against existing models by comparing predictions of WRCs using published GSD and WRC data taken from a range of published studies. The comparisons for three fine grained soils (including a tailings), and for two sands and two loams, are shown in Figure 14 and Figure 15, respectively.
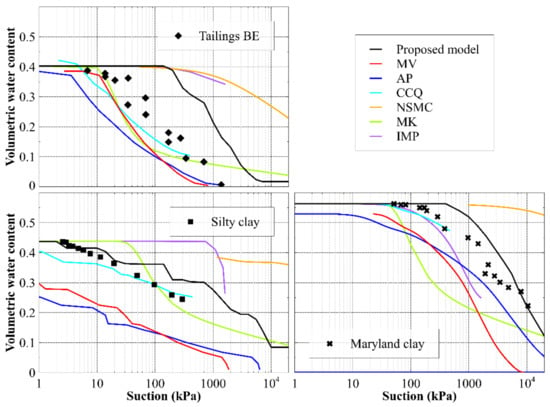
Figure 14.
Water retention curve predictions for clays and a tailings from the literature. Predictions from the proposed model and various models from the literature are shown, with water retention curves expressed in terms of volumetric water content vs. suction. Appendix A provides each material’s relevant properties and GSD, and Appendix B states the model parameters used.
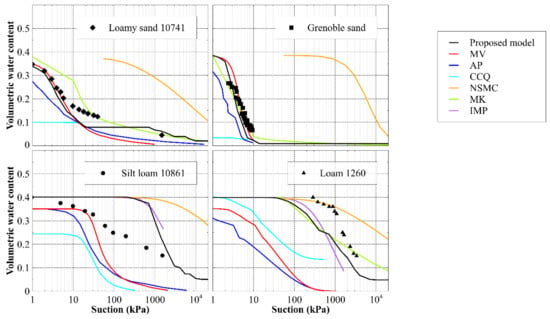
Figure 15.
Water retention curve predictions for sand and loam materials from the literature. Predictions from the proposed model and various models from the literature are shown, with water retention curves expressed in terms of volumetric water content vs. suction. Appendix A provides each material’s relevant properties and GSD, and Appendix B states the model parameters used.
Figure 14 and Figure 15 show that the proposed model can adequately capture the shape of many different WRCs, and that it performs relatively consistently for both coarse- and fine-grained soil materials. In some cases, it does not give the most accurate prediction of the WRC, however, it is more consistently accurate than the other models. This superior predictive ability is demonstrated quantitively by comparing the sum of the squared errors between the experimental value of volumetric water content at a given suction and its predicted counterpart for each model in Figure 16.
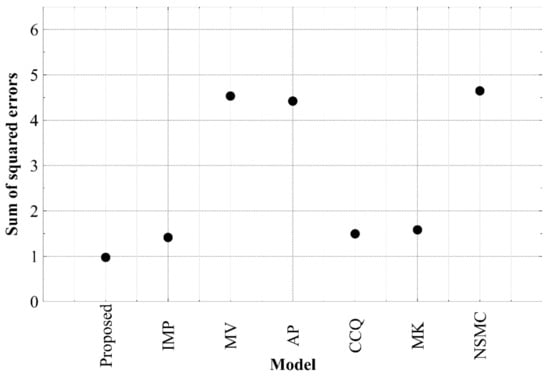
To assess the significance of the superior predictive ability of the proposed model compared to the other similarly performing models (IMP, CCQ, and MK from Figure 16), the sum of the squared errors was found for each model when predicting the plant available water, as seen in Figure 17. Note that plant available water was defined as the difference in volumetric water content between a suction of 30 kPa and 1500 kPa.
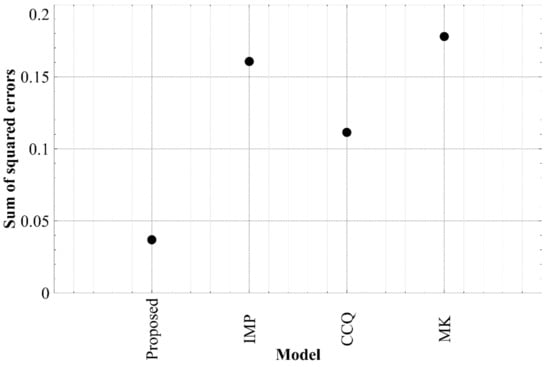
The proposed model has the lowest sum of squared errors for predicting both volumetric water content and PAW. It is important to keep in mind that the proposed model’s simplicity is somewhat reduced when a particle dependent contact angle is used (Equation (14)), as a separation operation, and two additional contact angle and particle sizing tests are required (for coal and mineral particles). The contact angle and particle sizing tests are relatively simple and are not particularly complex or time consuming, however this may not be true when conducting the separation process. This added complexity is unavoidable to estimate a particle dependent contact angle for coal tailings, however the proposed model does provide the ability to use a constant contact angle if it is required.
6. Conclusions
A scenario was introduced in this paper where topsoil improvement by coal tailings addition was suggested, with the focus on improving the plant-available water for the topsoil-tailings mixture. Determining the water retention properties of topsoil-tailings mixtures is required in order to identify the mixture proportions that result in a plant-available water range that is most favorable to plant growth. For this identification to be an efficient process, it is proposed to use a soil water retention curve prediction model instead of conducting extensive experimental testing. Many water retention models have been proposed in the literature, but it was found that these models could not adequately predict the retention properties of topsoils and tailings from Australian coal measures. Consequently, a new predictive water retention model was created and this model was proposed in the research herein. The proposed model uses the grain size distribution as the main input parameter and requires no laboratory calibration. Compared to similar models from the literature, the proposed model’s main improvement is achieved by filling the pores existing between particles with smaller particles according to an Apollonian gasket, but with the filling occurring only under certain criteria, which considers the size ratio and fraction of smaller particles.
The model validation against local materials and data from the literature showed a good predictive ability of the model against other existing models, in terms of volumetric water content and plant available water. This accuracy indicates the proposed model may be useful for predicting the water retention curve of a material, when calibration to existing data is not feasible. Additionally, the proposed model may enable efficient prediction of topsoil-tailings mixtures at mine sites, allowing identification of mixtures with improved plant available water and potentially improved plant growth. Thus, this model may allow easier implementation of topsoil-tailings mixtures in mine rehabilitation and the repurposing of post mining land.
In this study, the topsoil and tailings measured had little organic matter. However, if materials of higher organic matter contents are of interest, it is possible the accuracy of the proposed model may be improved by adding a regression parameter for organic matter content. Future research may involve further validation of the model for: other materials or mixtures, materials under different boundary and stress conditions, or materials with soil structures replicating in-situ states.
Author Contributions
Conceptualization, A.V., O.B. and S.F.; methodology, A.V., O.B. and S.F.; validation, A.V., O.B. and S.F.; writing—original draft preparation, A.V.; writing—review and editing, A.V., O.B. and S.F.; supervision, O.B. and S.F. All authors have read and agreed to the published version of the manuscript.
Funding
This research received no external funding.
Institutional Review Board Statement
Not applicable.
Informed Consent Statement
Not applicable.
Data Availability Statement
Not applicable.
Conflicts of Interest
The authors declare no conflict of interest.
Appendix A
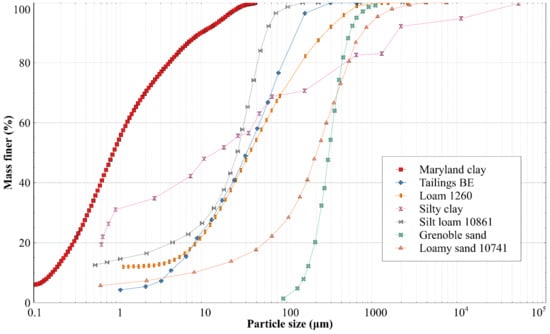
This appendix provides relevant properties and the grain size distributions (GSDs) of the various materials sourced from the literature. Soil properties are summarized in Table A1, which also provides the source of the material’s data. The GSD of each material is shown in Figure A1.

Table A1.
Specific gravity (Gs), Atterberg limits, receding contact angle (CA), and initial porosity of each soil being modelled. The source for each soil’s properties is provided.
Table A1.
Specific gravity (Gs), Atterberg limits, receding contact angle (CA), and initial porosity of each soil being modelled. The source for each soil’s properties is provided.
| Material | Gs | Liquid Limit | Plastic Limit | Receding CA (°) | Initial Porosity | Source |
|---|---|---|---|---|---|---|
| Tailings BE | 2.65 2 | 0.17 | - 1 | 0 2 | 0.403 | [58,59] |
| Silty clay | 2.65 2 | 0.404 | 0.248 | 0 2 | 0.438 | [60] |
| Silt Loam 10861 | 2.65 2 | - 1 | - 1 | 0 2 | 0.402 | [61] |
| Loam 1260 | 2.77 | - 1 | - 1 | 0 2 | 0.4 | UNSODA [62] |
| Maryland clay | 2.65 | 0.7 | 0.24 | 0 2 | 0.563 | [63] 3 |
| Loamy sand 10741 | 2.65 2 | N/A | N/A | 0 2 | 0.355 | [61] |
| Grenoble sand | 2.65 2 | N/A | N/A | 0 2 | 0.385 | [13] |
1: Data were not provided in source, 2: value was assumed as it was reasonable to do so and the models were not sensitive to this parameter, 3: GSD was measured by this paper’s authors.
Appendix B
This appendix provides all of the model parameters adopted for each material for the newly proposed and existing WRC models; the input parameters for the existing models were first introduced in Table 2. The parameters used for each material are separated by model into Table A2, Table A3, Table A4, Table A5, Table A6, Table A7 and Table A8. Note, for consistency, the first WRC data point of each material was used to determine the initial porosity, initial void ratio, or saturated volumetric water content values presented in Table A2, Table A3, Table A4, Table A5, Table A6, Table A7 and Table A8.

Table A2.
Parameters used in the proposed model for each material: sand, silt and clay fraction, receding contact angle (CA), and saturated volumetric water content (θs).
Table A2.
Parameters used in the proposed model for each material: sand, silt and clay fraction, receding contact angle (CA), and saturated volumetric water content (θs).
| Material | Sand Fraction | Silt Fraction | Clay Fraction | Receding CA (°) | Saturated Volumetric Water Content, θs |
|---|---|---|---|---|---|
| BT2 topsoil | 0.28 | 0.54 | 0.18 | 3 | 0.52 |
| M1 tailings | 0.12 | 0.82 | 0.06 | Varied 1 | 0.441 |
| M1 topsoil | 0.38 | 0.48 | 0.14 | 6 | 0.39 |
| PD tailings | 0.3 | 0.64 | 0.06 | Varied 1 | 0.45 |
| Tailings BE | 0.3 | 0.65 | 0.05 | 0 2 | 0.403 |
| Silty clay | 0.31 | 0.35 | 0.34 | 0 2 | 0.438 |
| Silt Loam 10861 | 0.06 | 0.78 | 0.16 | 0 2 | 0.402 |
| Loam 1260 | 0.36 | 0.52 | 0.12 | 0 2 | 0.4 |
| Maryland clay | 0 | 0.29 | 0.71 | 0 2 | 0.563 |
| Loamy sand 10741 | 0.78 | 0.15 | 0.7 | 0 2 | 0.355 |
| Grenoble sand | 1 | 0 | 0 | 0 2 | 0.385 |
1: Contact angle varied with particle size and the relationship is shown in Figure A2, 2: value was assumed as it was reasonable to do so and the models were not sensitive to this parameter.

Table A3.
Parameters used in the Mohammadi-Vanclooster model (MV) for each material: initial void ratio, saturated volumetric water content (θs), and receding contact angle (CA).
Table A3.
Parameters used in the Mohammadi-Vanclooster model (MV) for each material: initial void ratio, saturated volumetric water content (θs), and receding contact angle (CA).
| Material | Initial Void Ratio, e | Saturated Volumetric Water Content, θs | Receding CA (°) |
|---|---|---|---|
| BT2 topsoil | 1.083 | 0.52 | 3 |
| M1 tailings | 0.789 | 0.441 | Varied 1 |
| M1 topsoil | 0.652 | 0.39 | 6 |
| PD tailings | 0.82 | 0.45 | Varied 1 |
| Tailings BE | 0.674 | 0.403 | 0 2 |
| Silty clay | 0.78 | 0.438 | 0 2 |
| Silt Loam 10861 | 0.67 | 0.402 | 0 2 |
| Loam 1260 | 0.665 | 0.4 | 0 2 |
| Maryland clay | 1.29 | 0.563 | 0 2 |
| Loamy sand 10741 | 0.55 | 0.355 | 0 2 |
| Grenoble sand | 0.625 | 0.385 | 0 2 |
1: Contact angle varied with particle size and the relationship is shown in Figure A2, 2: value was assumed as it was reasonable to do so and the models were not sensitive to this parameter.

Table A4.
Parameters used in the Arya-Paris model (AP) for each material: initial void ratio, specific gravity, parameter α, and receding contact angle (CA).
Table A4.
Parameters used in the Arya-Paris model (AP) for each material: initial void ratio, specific gravity, parameter α, and receding contact angle (CA).
| Material | Initial Void Ratio, e | Specific Gravity, Gs | α | Receding CA (°) |
|---|---|---|---|---|
| BT2 topsoil | 1.083 | 2.63 | 1.35 | 3 |
| M1 tailings | 0.789 | 1.96 | 1.35 | Varied 1 |
| M1 topsoil | 0.652 | 2.66 | 1.35 | 6 |
| PD tailings | 0.82 | 2.22 | 1.35 | Varied 1 |
| Tailings BE | 0.674 | 2.65 2 | 1.35 | 0 2 |
| Silty clay | 0.78 | 2.65 2 | 1.35 | 0 2 |
| Silt Loam 10861 | 0.67 | 2.65 2 | 1.35 | 0 2 |
| Loam 1260 | 0.665 | 2.77 | 1.35 | 0 2 |
| Maryland clay | 1.29 | 2.65 | 1.35 | 0 2 |
| Loamy sand 10741 | 0.55 | 2.65 2 | 1.5 | 0 2 |
| Grenoble sand | 0.625 | 2.65 2 | 1.5 | 0 2 |
1: Contact angle varied with particle size and the relationship is shown in Figure A2, 2: value was assumed as it was reasonable to do so and the models were not sensitive to this parameter.

Table A5.
Parameters used in the Chang-Cheng-Qiao model (CCQ) for each material: clay fraction, parameter β, saturated volumetric water content (θs), and receding contact angle (CA).
Table A5.
Parameters used in the Chang-Cheng-Qiao model (CCQ) for each material: clay fraction, parameter β, saturated volumetric water content (θs), and receding contact angle (CA).
| Material | Clay Fraction | β | Saturated Volumetric Water Content, θs | Receding CA (°) |
|---|---|---|---|---|
| BT2 topsoil | 0.18 | 0.516 | 0.52 | 3 |
| M1 tailings | 0.06 | 0.516 | 0.441 | 0 1 |
| M1 topsoil | 0.14 | 0.516 | 0.39 | 6 |
| PD tailings | 0.06 | 0.516 | 0.45 | 0 1 |
| Tailings BE | 0.05 | 0.516 | 0.403 | 0 2 |
| Silty clay | 0.34 | 0.516 | 0.438 | 0 2 |
| Silt Loam 10861 | 0.16 | 0.516 | 0.402 | 0 2 |
| Loam 1260 | 0.12 | 0.516 | 0.4 | 0 2 |
| Maryland clay | 0.71 | 0.516 | 0.563 | 0 2 |
| Loamy sand 10741 | 0.7 | 0.516 | 0.355 | 0 2 |
| Grenoble sand | 0 | 0.516 | 0.385 | 0 2 |
1: Contact angle varied with particle size which could not be captured in this model, thus an angle of zero was used, 2: value was assumed as it was reasonable to do so and the models were not sensitive to this parameter.

Table A6.
Parameters used in the non-similar-media-concept model (NSMC) for each material: initial void ratio, specific gravity, saturated volumetric water content (θs), and receding contact angle (CA).
Table A6.
Parameters used in the non-similar-media-concept model (NSMC) for each material: initial void ratio, specific gravity, saturated volumetric water content (θs), and receding contact angle (CA).
| Material | Initial Void Ratio, e | Specific Gravity, Gs | Saturated Volumetric Water Content, θs | Receding CA (°) |
|---|---|---|---|---|
| BT2 topsoil | 1.083 | 2.63 | 0.52 | 3 |
| M1 tailings | 0.789 | 1.96 | 0.441 | Varied 1 |
| M1 topsoil | 0.652 | 2.66 | 0.39 | 6 |
| PD tailings | 0.82 | 2.22 | 0.45 | Varied 1 |
| Tailings BE | 0.674 | 2.65 2 | 0.403 | 0 2 |
| Silty clay | 0.78 | 2.65 2 | 0.438 | 0 2 |
| Silt Loam 10861 | 0.67 | 2.65 2 | 0.402 | 0 2 |
| Loam 1260 | 0.665 | 2.77 | 0.4 | 0 2 |
| Maryland clay | 1.29 | 2.65 | 0.563 | 0 2 |
| Loamy sand 10741 | 0.55 | 2.65 2 | 0.355 | 0 2 |
| Grenoble sand | 0.625 | 2.65 2 | 0.385 | 0 2 |
1: Contact angle varied with particle size and the relationship is shown in Figure A2, 2: value was assumed as it was reasonable to do so and the models were not sensitive to this parameter.

Table A7.
Parameters used in the modified Kovacs model (MK) for each material: 10% and 60% mass passing particle diameters (D10, D60), parameter ac, liquid limit, specific gravity, parameter m, initial void ratio, parameter λ, and receding contact angle (CA).
Table A7.
Parameters used in the modified Kovacs model (MK) for each material: 10% and 60% mass passing particle diameters (D10, D60), parameter ac, liquid limit, specific gravity, parameter m, initial void ratio, parameter λ, and receding contact angle (CA).
| Material | D10 (μm) | D60 (μm) | ac | Liquid Limit | Specific Gravity, Gs | m | Initial Void Ratio, e | λ (m2/kg) | Receding CA (°) |
|---|---|---|---|---|---|---|---|---|---|
| BT2 topsoil | N/A | N/A | 0.0007 | 0.462 | 2.63 | 0.00003 | 1.083 | 200 | 3 |
| M1 tailings | N/A | N/A | 0.0007 | 0.497 | 1.96 | 0.00003 | 0.789 | 200 | Varied 1 |
| M1 topsoil | N/A | N/A | 0.0007 | 0.274 | 2.66 | 0.00003 | 0.652 | 200 | 6 |
| PD tailings | N/A | N/A | 0.0007 | 0.482 | 2.22 | 0.00003 | 0.82 | 200 | Varied 1 |
| Tailings BE | N/A | N/A | 0.0007 | 0.17 | 2.652 | 0.00003 | 0.674 | 200 | 0 2 |
| Silty clay | N/A | N/A | 0.0007 | 0.404 | 2.652 | 0.00003 | 0.78 | 200 | 0 2 |
| Silt Loam 10861 | - 4 | - 4 | - 4 | - 3,4 | - 4 | - 4 | - 4 | - 4 | - 4 |
| Loam 1260 | 1 | 50 | 0.01 | N/A | 2.77 | N/A | 0.665 | 200 | 0 2 |
| Maryland clay | N/A | N/A | 0.0007 | 0.7 | 2.65 | 0.00003 | 1.29 | 200 | 0 2 |
| Loamy sand 10741 | 7.4 | 265 | 0.01 | N/A | 2.652 | N/A | 0.55 | 200 | 0 2 |
| Grenoble sand | 140 | 310 | 0.01 | N/A | 2.652 | N/A | 0.625 | 200 | 0 2 |
1: Contact angle varied with particle size and the relationship is shown in Figure A2, 2: value was assumed as it was reasonable to do so and the models were not sensitive to this parameter, 3: critical value missing from data source making model unusable, 4: model not used for this material due to missing data.

Table A8.
Parameters used in the intergranular mixing particle size distribution model (IMP) for each material: saturated volumetric water content (θs), parameter ξ1, parameter p, parameter β1, parameter β2, parameter ψmax, parameter θr_max, parameter α1, parameter α2, parmeter λ, and receding contact angle (CA).
| Material | Saturated Volumetric Water Content, θs | ξ1 | p | β1 | β2 | ψmax (kPa) | θr_max | α1 | α2 | λ | Receding CA (°) |
|---|---|---|---|---|---|---|---|---|---|---|---|
| BT2 topsoil | 0.52 | 11.07 | 2 | 0.09 | 0.95 | 1600 | 0.25 | 16.02 | 2.01 | 2 | 3 |
| M1 tailings | 0.441 | 11.07 | 2 | 0.09 | 0.95 | 1600 | 0.25 | 16.02 | 2.01 | 2 | Varied 1 |
| M1 topsoil | 0.39 | 11.07 | 2 | 0.09 | 0.95 | 1600 | 0.25 | 16.02 | 2.01 | 2 | 6 |
| PD tailings | 0.45 | 11.07 | 2 | 0.09 | 0.95 | 1600 | 0.25 | 16.02 | 2.01 | 2 | Varied 1 |
| Tailings BE | 0.403 | 11.07 | 2 | 0.09 | 0.95 | 1600 | 0.25 | 16.02 | 2.01 | 2 | 0 2 |
| Silty clay | 0.438 | 11.07 | 2 | 0.09 | 0.95 | 1600 | 0.25 | 16.02 | 2.01 | 2 | 0 2 |
| Silt Loam 10861 | 0.402 | 11.07 | 2 | 0.09 | 0.95 | 1600 | 0.25 | 16.02 | 2.01 | 2 | 0 2 |
| Loam 1260 | 0.4 | 11.07 | 2 | 0.09 | 0.95 | 1600 | 0.25 | 16.02 | 2.01 | 2 | 0 2 |
| Maryland clay | 0.563 | 11.07 | 2 | 0.09 | 0.95 | 1600 | 0.25 | 16.02 | 2.01 | 2 | 0 2 |
| Loamy sand 10741 | - 3 | - 3 | - 3 | - 3 | - 3 | - 3 | - 3 | - 3 | - 3 | - 3 | - 3 |
| Grenoble sand | - 3 | - 3 | - 3 | - 3 | - 3 | - 3 | - 3 | - 3 | - 3 | - 3 | - 3 |
1: Contact angle varied with particle size and the relationship is shown in Figure A2, 2: value was assumed as it was reasonable to do so and the models were not sensitive to this parameter, 3: model not used for this material as it is not suitable for coarse grained material.
In the relevant tables within this appendix, the contact angles used for M1 and PD tailings were stated to vary with particle size. These contact angles were determined with Equation (14), and the values are shown in Figure A2. Equation (14) required the GSD of representative coal and mineral particles from M1 and PD tailings; these GSDs were shown in Figure 11.
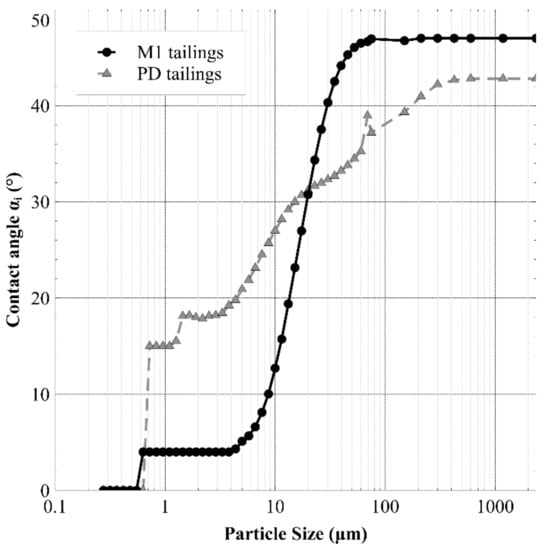
Figure A2.
Contact angles calculated for each particle size bin (αi) of M1 and PD tailings, as determined by Equation (14).
References
- Brown, G.M.C.; Grant, C.D. Nutrient status of pasture ecosystems established on rehabilitated overburden and topsoil sites in the Hunter Valley, New South Wales. Soil Res. 2000, 38, 479–492. [Google Scholar] [CrossRef]
- Dragovich, D.; Patterson, J. Condition of rehabilitated coal mines in the Hunter Valley, Australia. Land Degrad. Dev. 1995, 6, 29–39. [Google Scholar] [CrossRef]
- Kundu, N.; Ghose, M. Shelf life of stock-piled topsoil of an opencast coal mine. Environ. Conserv. 1997, 24, 24–30. [Google Scholar] [CrossRef]
- Ghose, M.K.; Kundu, N.K. Deterioration of soil quality due to stockpiling in coal mining areas. Int. J. Environ. Stud. 2004, 61, 327–335. [Google Scholar] [CrossRef]
- Sheoran, V.; Sheoran, A.; Poonia, P. Soil Reclamation of Abandoned Mine Land by Revegetation: A Review. Int. J. Soil Sediment Water 2010, 3, 13. [Google Scholar]
- Mushia, N.M.; Ramoelo, A.; Ayisi, K.K. The Impact of the Quality of Coal Mine Stockpile Soils on Sustainable Vegetation Growth and Productivity. Sustainability 2016, 8, 546. [Google Scholar] [CrossRef]
- Mercuri, A.; Duggin, J.; Grant, C. The use of saline mine water and municipal wastes to establish plantations on rehabilitated open-cut coal mines, Upper Hunter Valley NSW, Australia. For. Ecol. Manag. 2005, 204, 195–207. [Google Scholar] [CrossRef]
- Çiçek, T.; Cöcen, İ.; Engin, V.T.; Cengizler, H. An Efficient Process for Recovery of Fine Coal from Tailings of Coal Washing Plants. Energy Sources Part A Recover. Util. Environ. Eff. 2008, 30, 1716–1728. [Google Scholar] [CrossRef]
- Ryu, C.; Finney, K.; Sharifi, V.N.; Swithenbank, J. Pelletised fuel production from coal tailings and spent mushroom compost—Part I: Identification of pelletisation parameters. Fuel Process. Technol. 2008, 89, 269–275. [Google Scholar] [CrossRef]
- Kirkham, M. Field Capacity, Wilting Point, Available Water, and the Nonlimiting Water Range. In Principles of Soil and Plant Water Relations; Elsevier: Amsterdam, The Netherlands, 2014; pp. 153–170. [Google Scholar]
- Arya, L.M.; Paris, J.F. A Physicoempirical Model to Predict the Soil Moisture Characteristic from Particle-Size Distribution and Bulk Density Data. Soil Sci. Soc. Am. J. 1981, 45, 1023–1030. [Google Scholar] [CrossRef]
- Chang, C.-C.; Cheng, D.-H.; Qiao, X.-Y. Improving estimation of pore size distribution to predict the soil water retention curve from its particle size distribution. Geoderma 2019, 340, 206–212. [Google Scholar] [CrossRef]
- Haverkamp, R.; Parlange, J.-Y. Predicting the water-retention curve from particle-size distribution. Soil Sci. 1986, 142, 325–339. [Google Scholar] [CrossRef]
- Meskini-Vishkaee, F.; Mohammadi, M.H.; Vanclooster, M. Predicting the soil moisture retention curve, from soil particle size distribution and bulk density data using a packing density scaling factor. Hydrol. Earth Syst. Sci. 2014, 18, 4053–4063. [Google Scholar] [CrossRef][Green Version]
- Mohammadi, M.; Meskini-Vishkaee, F. Predicting Soil Moisture Characteristic Curves from Continuous Particle-Size Distribution Data. Pedosphere 2013, 23, 70–80. [Google Scholar] [CrossRef]
- Mohammadi, M.H.; Vanclooster, M. Predicting the Soil Moisture Characteristic Curve from Particle Size Distribution with a Simple Conceptual Model. Vadose Zone J. 2011, 10, 594–602. [Google Scholar] [CrossRef]
- Chang, C.-C.; Cheng, D.-H. Predicting the soil water retention curve from the particle size distribution based on a pore space geometry containing slit-shaped spaces. Hydrol. Earth Syst. Sci. 2018, 22, 4621–4632. [Google Scholar] [CrossRef]
- Romero, E.; Della Vecchia, G.; Jommi, C. An insight into the water retention properties of compacted clayey soils. Géotechnique 2011, 61, 313–328. [Google Scholar] [CrossRef]
- Romero, E.; Simms, P.H. Microstructure Investigation in Unsaturated Soils: A Review with Special Attention to Contribution of Mercury Intrusion Porosimetry and Environmental Scanning Electron Microscopy. Geotech. Geol. Eng. 2008, 26, 705–727. [Google Scholar] [CrossRef]
- Zhuang, J.; Jin, Y.; Miyazaki, T. Estimating water retention characteristic from soil particle-size distribution using a non-similar media concept. Soil Sci. 2001, 166, 308–321. [Google Scholar] [CrossRef]
- Fredlund, M.; Wilson, G.W.; Fredlund, D.G. Use of the grain-size distribution for estimation of the soil-water characteristic curve. Can. Geotech. J. 2002, 39, 1103–1117. [Google Scholar] [CrossRef]
- Hamamoto, S.; Moldrup, P.; Kawamoto, K.; De Jonge, L.W.; Schjønning, P.; Komatsu, T. Two-Region Extended Archie’s Law Model for Soil Air Permeability and Gas Diffusivity. Soil Sci. Soc. Am. J. 2011, 75, 795–806. [Google Scholar] [CrossRef]
- Sakaki, T.; Komatsu, M.; Takahashi, M. Rules-of-Thumb for Predicting Air-Entry Value of Disturbed Sands from Particle Size. Soil Sci. Soc. Am. J. 2014, 78, 454–464. [Google Scholar] [CrossRef]
- Dinger, D.R.; Funk, J.E. Particle-Packing Phenomena and Their Application in Materials Processing. MRS Bull. 1997, 22, 19–23. [Google Scholar] [CrossRef]
- Yu, A.; Standish, N. An analytical—Parametric theory of the random packing of particles. Powder Technol. 1988, 55, 171–186. [Google Scholar] [CrossRef]
- Liu, Z.-R.; Ye, W.-M.; Zhang, Z.; Wang, Q.; Chen, Y.-G.; Cui, Y.-J. A nonlinear particle packing model for multi-sized granular soils. Constr. Build. Mater. 2019, 221, 274–282. [Google Scholar] [CrossRef]
- Schmidt, J.; Parteli, E.J.; Uhlmann, N.; Wörlein, N.; Wirth, K.-E.; Pöschel, T.; Peukert, W. Packings of micron-sized spherical particles—Insights from bulk density determination, X-ray microtomography and discrete element simulations. Adv. Powder Technol. 2020, 31, 2293–2304. [Google Scholar] [CrossRef]
- Prior, J.M.; Almeida, I.; Loureiro, J.M. Prediction of the packing porosity of mixtures of spherical and non-spherical particles with a geometric model. Powder Technol. 2013, 249, 482–496. [Google Scholar] [CrossRef]
- Li, G.-Y.; Zhan, L.-T.; Hu, Z.; Chen, Y.-M. Effects of particle gradation and geometry on the pore characteristics and water retention curves of granular soils: A combined DEM and PNM investigation. Granul. Matter 2021, 23, 1–16. [Google Scholar] [CrossRef]
- Zhou, Z.-Y.; Zou, R.-P.; Pinson, D.; Yu, A.-B. Dynamic Simulation of the Packing of Ellipsoidal Particles. Ind. Eng. Chem. Res. 2011, 50, 9787–9798. [Google Scholar] [CrossRef]
- Rodriguez, J.M. Importance of the Particle Shape on Mechanical Properties of Soil Materials; Luleå University of Technology: Luleå, Sweden, 2013. [Google Scholar]
- Dodds, J. Particle Shape and Stiffness—Effects on Soil Behavior; Georgia Institute of Technology: Atlanta, GA, USA, 2003; Available online: https://smartech.gatech.edu/bitstream/handle/1853/8063/Dodds_Jake_S_200405.pdf (accessed on 6 July 2021).
- Veghte, D.P.; Freedman, M.A. Facile Method for Determining the Aspect Ratios of Mineral Dust Aerosol by Electron Microscopy. Aerosol Sci. Technol. 2014, 48, 715–724. [Google Scholar] [CrossRef]
- Anishchik, S.; Medvedev, N.N. Three-Dimensional Apollonian Packing as a Model for Dense Granular Systems. Phys. Rev. Lett. 1995, 75, 4314–4317. [Google Scholar] [CrossRef]
- Jańczuk, B.; Zdziennicka, A. A study on the components of surface free energy of quartz from contact angle measurements. J. Mater. Sci. 1994, 29, 3559–3564. [Google Scholar] [CrossRef]
- Mazurek, A.K.; Pogorzelski, S.J.; Boniewicz-Szmyt, K. Adsorption of natural surfactants present in sea waters at surfaces of minerals: Contact angle measurements. Oceanologia 2009, 51, 377–403. [Google Scholar] [CrossRef]
- Vidler, A.; Buzzi, O.; Fityus, S. The Significance of Hydrophobicity for the Water Retention Properties of Sand and Coal. Appl. Sci. 2021, 11, 5966. [Google Scholar] [CrossRef]
- Gutierrez-Rodriguez, J.; Purcell, R.; Aplan, F. Estimating the hydrophobicity of coal. Colloids Surf. 1984, 12, 1–25. [Google Scholar] [CrossRef]
- Kaji, R.; Muranaka, Y.; Miyadera, H.; Hishinuma, Y. Effect of electrolyte on the rheological properties of coal-water mixtures. AIChE J. 1987, 33, 11–18. [Google Scholar] [CrossRef]
- Wang, N.; Sasaki, M.; Yoshida, T.; Kotanigawa, T. Estimation of coal hydrophilicity by flow microcalorimetry. Colloids Surf. A Physicochem. Eng. Asp. 1998, 135, 11–18. [Google Scholar] [CrossRef]
- Arnold, B.; Aplan, F. The hydrophobicity of coal macerals. Fuel 1989, 68, 651–658. [Google Scholar] [CrossRef]
- Parekh, B.K.; Aplan, F.F. The critical surface tension of wetting of coal. In Recent Developments in Separation Science: Volume 4; CRC Press: West Palm Beach, FL, USA, 1978; pp. 107–113. [Google Scholar]
- Zhou, A.-N. A contact angle-dependent hysteresis model for soil–water retention behaviour. Comput. Geotech. 2013, 49, 36–42. [Google Scholar] [CrossRef]
- Rafraf, S.; Guellouz, L.; Guiras, H.; Bouhlila, R. A New Model Using Dynamic Contact Angle to Predict Hysteretic Soil Water Retention Curve. Soil Sci. Soc. Am. J. 2016, 80, 1433–1442. [Google Scholar] [CrossRef]
- Azizi, A.; Jommi, C.; Musso, G. A water retention model accounting for the hysteresis induced by hydraulic and mechanical wetting-drying cycles. Comput. Geotech. 2017, 87, 86–98. [Google Scholar] [CrossRef]
- Vidler, A.; Buzzi, O.; Fityus, S. Effect of coal on mine tailings’ water permeability and water retention. E3S Web Conf. 2020, 195, 03004. [Google Scholar] [CrossRef]
- Zbik, M. Nanomorphology of Kaolinites: Comparative SEM and AFM Studies. Clays Clay Miner. 1998, 46, 153–160. [Google Scholar] [CrossRef]
- Nadeau, P.H. Relationships between the mean area, volume and thickness for dispersed particles of kaolinites and micaceous clays and their application to surface area and ion exchange properties. Clay Miner. 1987, 22, 351–356. [Google Scholar] [CrossRef]
- Negri, S.; Raimondo, E.; D’Amico, M.E.; Stanchi, S.; Basile, A.; Bonifacio, E. Loess-derived polygenetic soils of North-Western Italy: A deep characterization of particle size, shape and color to draw insights about the past. Catena 2021, 196, 104892. [Google Scholar] [CrossRef]
- Wei, T.; Fan, W.; Yu, N.; Wei, Y.-N. Three-dimensional microstructure characterization of loess based on a serial sectioning technique. Eng. Geol. 2019, 261, 105265. [Google Scholar] [CrossRef]
- Liu, Z.; Liu, F.; Ma, F.; Wang, M.; Bai, X.; Zheng, Y.; Yin, H.; Zhang, G. Collapsibility, composition, and microstructure of loess in China. Can. Geotech. J. 2016, 53, 673–686. [Google Scholar] [CrossRef]
- Lagarias, J.C.; Mallows, C.L.; Wilks, A.R. Beyond the Descartes Circle Theorem. Am. Math. Mon. 2002, 109, 338–361. [Google Scholar] [CrossRef][Green Version]
- Kasner, E.; Supnick, F. The Apollonian Packing of Circles. Proc. Natl. Acad. Sci. USA 1943, 29, 378–384. [Google Scholar] [CrossRef]
- Graham, R.L.; Lagarias, J.C.; Mallows, C.L.; Wilks, A.R.; Yan, C.H. Apollonian Circle Packings: Geometry and Group Theory I. The Apollonian Group. Discret. Comput. Geom. 2005, 34, 547–585. [Google Scholar] [CrossRef]
- Bourke, P. An introduction to the Apollonian fractal. Comput. Graph. 2006, 30, 134–136. [Google Scholar] [CrossRef]
- Scott, G.D.; Kilgour, D.M. The density of random close packing of spheres. J. Phys. D Appl. Phys. 1969, 2, 863–866. [Google Scholar] [CrossRef]
- Shen, C.; Liu, S.; Xu, S.; Wang, L. Rapid estimation of maximum and minimum void ratios of granular soils. Acta Geotech. 2019, 14, 991–1001. [Google Scholar] [CrossRef]
- Aubertin, M.; Ricard, J.-F.; Chapuis, R.P. A predictive model for the water retention curve: Application to tailings from hard-rock mines. Can. Geotech. J. 1998, 35, 55–69. [Google Scholar] [CrossRef]
- Aubertin, M. Évaluation en Laboratoire de Barrières Sèches Construites à Partir de Résidus Miniers; MEND: Ottawa, ON, Canada, 1995. [Google Scholar]
- Li, J.; Lu, Z.; Guo, L.; Zhang, L. Experimental study on soil-water characteristic curve for silty clay with desiccation cracks. Eng. Geol. 2017, 218, 70–76. [Google Scholar] [CrossRef]
- Fredlund, M.D.; Fredlund, D.; Wilson, G. Prediction of the Soil-Water Characteristic Curve from Grain-Size Distribution and Volume-Mass Properties. In Proceedings of the 3rd Brazilian Symposium on Unsaturated Soils, Rio de Janeiro, Brazil, 22–25 April 1997. [Google Scholar]
- Nemes, A.; Schaap, M.; Leij, F.; Wösten, J. Description of the unsaturated soil hydraulic database UNSODA version 2.0. J. Hydrol. 2001, 251, 151–162. [Google Scholar] [CrossRef]
- Liu, X.; Buzzi, O.; Yuan, S.; Mendes, J.; Fityus, S. Multi-scale characterization of retention and shrinkage behaviour of four Australian clayey soils. Can. Geotech. J. 2016, 53, 854–870. [Google Scholar] [CrossRef]
- Karas, J.; Pugmire, R.J.; Woolfenden, W.R.; Grant, D.M.; Blair, S. Comparison of physical and chemical properties of maceral groups separated by density dradient centrifugation. Int. J. Coal Geol. 1985, 5, 315–338. [Google Scholar] [CrossRef]
- Drelich, J. Guidelines to measurements of reproducible contact angles using a sessile-drop technique. Surf. Innov. 2013, 1, 248–254. [Google Scholar] [CrossRef]
- Bachmann, J.; Horton, R.; van der Ploeg, R.R.; Woche, S. Modified sessile drop method for assessing initial soil-water contact angle of sandy soil. Soil Sci. Soc. Am. J. 2000, 64, 564–567. [Google Scholar] [CrossRef]
- Das, B.M. 8.5 Standard one-dimensional consolidation test and interpretation. In Advanced Soil Mechanics, 4th ed.; CRC Press: Boca Raton, FL, USA, 2013; pp. 338–346. [Google Scholar]
- Mendes, J.; Buzzi, O. Performance of the University of Newcastle high capacity tensiometers. In Proceedings of the 6th International Conference on Unsaturated Soils, Sydney, Australia, 2–5 July 2014; Volume 2, pp. 1611–1616. [Google Scholar]
- Liu, X.; Buzzi, O. Use of Hand-Spray Plaster as a Coating for Soil Bulk Volume Measurement. Geotech. Test. J. 2014, 37. [Google Scholar] [CrossRef]
- Aubertin, M.; Mbonimpa, M.; Bussière, B.; Chapuis, R.P. A model to predict the water retention curve from basic geotechnical properties. Can. Geotech. J. 2003, 40, 1104–1122. [Google Scholar] [CrossRef]
- Pollacco, J.; Fernández-Gálvez, J.; Carrick, S. Improved prediction of water retention curves for fine texture soils using an intergranular mixing particle size distribution model. J. Hydrol. 2020, 584, 124597. [Google Scholar] [CrossRef]
Publisher’s Note: MDPI stays neutral with regard to jurisdictional claims in published maps and institutional affiliations. |
© 2021 by the authors. Licensee MDPI, Basel, Switzerland. This article is an open access article distributed under the terms and conditions of the Creative Commons Attribution (CC BY) license (https://creativecommons.org/licenses/by/4.0/).
