Article

The Influence of Floor Layering on Airborne Sound Insulation and Impact Noise Reduction: A Study on Cross Laminated Timber (CLT) Structures

by
Federica Bettarello
1,
Andrea Gasparella
2 and
Marco Caniato
2,*
1
Department of Engineering and Architecture, University of Trieste, 34127 Trieste, Italy
2
Faculty of Science and Technology, Free University of Bozen, 39100 Bolzano, Italy
*
Author to whom correspondence should be addressed.
Appl. Sci. 2021, 11(13), 5938; https://doi.org/10.3390/app11135938
Submission received: 7 June 2021 / Revised: 23 June 2021 / Accepted: 23 June 2021 / Published: 25 June 2021
(This article belongs to the Special Issue Acoustic Properties of Absorbing Materials)

Abstract

:
The use of timber constructions recently increased. In particular, Cross Laminated Timber floors are often used in multi-story buildings. The development of standardization processes, product testing, design of details and joints, the speed of construction, and the advantages of eco-sustainability are the main reasons why these structures play a paramount role on the international building scene. However, for further developments, it is essential to investigate sound insulation properties, in order to meet the requirements of indoor comfort and comply with current building regulations. This work presents the results obtained by in field measurements developed using different sound sources (tapping machine, impact rubber ball, and airborne dodecahedral speaker) on Cross Laminated Timber floors, changing different sound insulation layering (suspended ceiling and floating floors). Results clearly show that the influence on noise reduction caused by different layering stimulated by diverse noise source is not constant and furthermore that no available analytical model is able to correctly predict Cross Laminated Timber floors acoustic performances.

1. Introduction

At present, the need of sustainable buildings is rising all over Europe and thus their construction is growing quickly [1]. Therefore, high-rise wooden edifices are more and more requested in the market [2,3,4]. These edifices are composed using different elements. Often, timber frame is used for the construction of walls [5,6] and Cross Laminated Timber (CLT) for floors [7,8]. In this light, CLT horizontal partitions have to fulfil many requisites like structural integrity etc., but recently sound insulation and impact noise reduction as well as indoor acoustic comfort are becoming important issues to manage. Anyway, bare horizontal partitions do not easily fulfill acoustic law requirements [9] and thus many other layers have to be added.
In order to solve these problems, many works were developed in years to study the acoustic behavior of this type of timber element. In a recent review, Di Bella and Mitrovic [10] focused on bare structures elucidating their properties and construction phases.
Such structures have several advantages:
(1) eco-sustainability;
(2) anti-seismicity;
(3) thermally insulating;
(4) possibility of dry construction;
(5) possibility of raising existing structures thanks to the reduced weight.
When focusing on layered CLT elements, Pérez and Fuente [11] presented a dedicated study using laboratory and field measurements of sound insulation and impact noise reduction of some CLT components. Anyway, no parametric study related to the influence of the single layer is included. The same consideration could be applied to many other works [12,13,14,15].
Due to the reduced weight of CLT elements, their poor acoustic performances could lead to problems in the lower frequency range when in presence of impact noises such as children or adults walking or running. In order to reduce impact noise or to increase sound insulation, some other technologies have to be coupled to the bare timber floor. Two of the most used are (i) floating floor and (ii) suspended ceiling.
Kim et al. [16] found that a floating floor addition using resilient materials ensures good performance against lightweight impact noise, but has rather negative effects due to the resonance on the heavy weight impact noise caused by the falling of heavy objects or children walking/running.
It is thus evident how there is a lack of parametric studies, discussing the influence of single noise reduction action on CLT floors and, in addition, their overall contribution when laid together on the same horizontal partition. Furthermore, there is a lack of studies comprising different acoustic excitation techniques on such floors [17], providing single configuration influence on final sound reduction.
Timber constructions are relatively new in the European market. People usually live in traditional heavyweight ones made of masonry and/or concrete. When moving on new sustainable edifices, people feel new indoor environment and new noises, which were not present in traditional houses. Thus, subjective evaluations are now part of the research order to understand if timber buildings could provide a suitable environment from the point of view of acoustic comfort [18]. In this view, the rubber impact ball was demonstrated to be the noise source most associated with subjective reactions [19,20]. However, to the authors’ knowledge, no parametric research comparing the influence of noise reduction technologies on CLT floors is available in literature, using such a source.
For these reasons, this research presents the results of acoustic measurements using rubber ball and tapping machine for impact noise and dodecahedral source for airborne noise. Tests were carried out in situ in a timber building featuring CLT floors. The measurements were made step-by-step during the construction phase, firstly considering the bare CLT floor and after all the various layers. The aim of this research is to parametrically determine the influence of different layers on impact and airborne noise reduction as well as to understand if available analytical models could predict the measured values.

2. Materials and Methods

The test-building where the in situ measurements (airborne and impact noise tests) were performed consists of five CLT floors (Figure 1), featuring timber frame walls, as depicted in Figure 2.
In these conditions, thanks to (i) the rock wool included within the timber studs of the vertical partitions, (ii) the coupling of massive (CLT) and lightweight (timber frame) partitions and (iii) the point connections, flanking transmissions are very limited (up to 1 dB overall) [21,22,23,24].

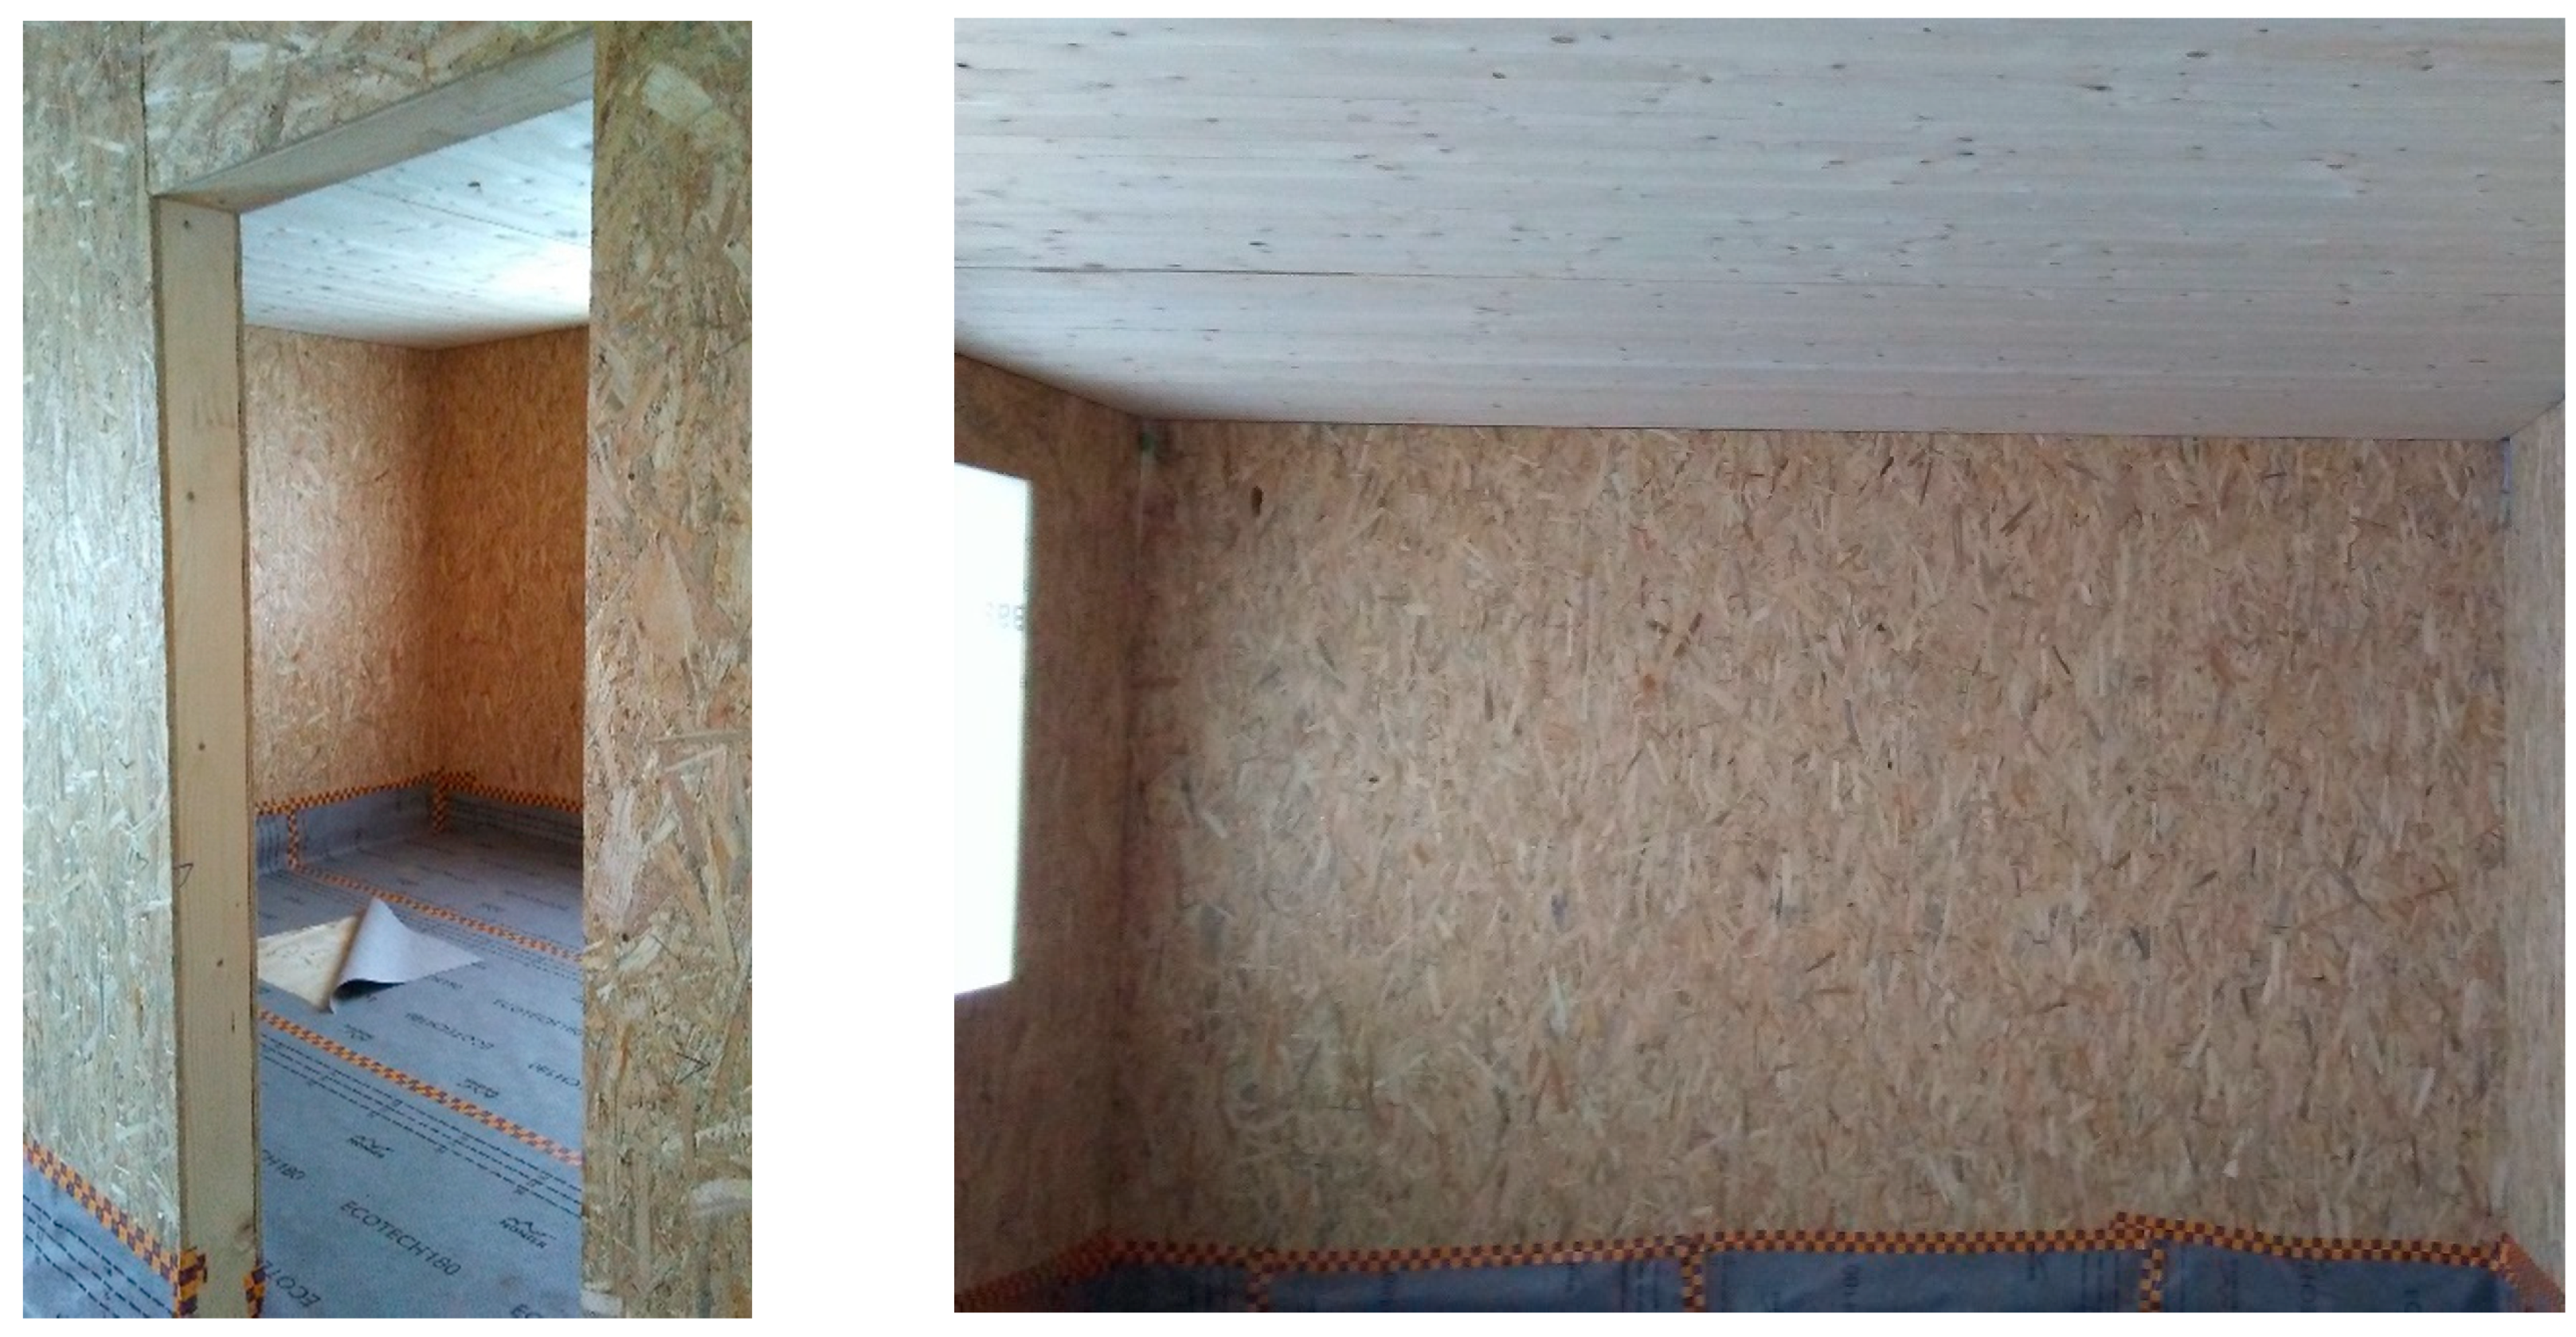
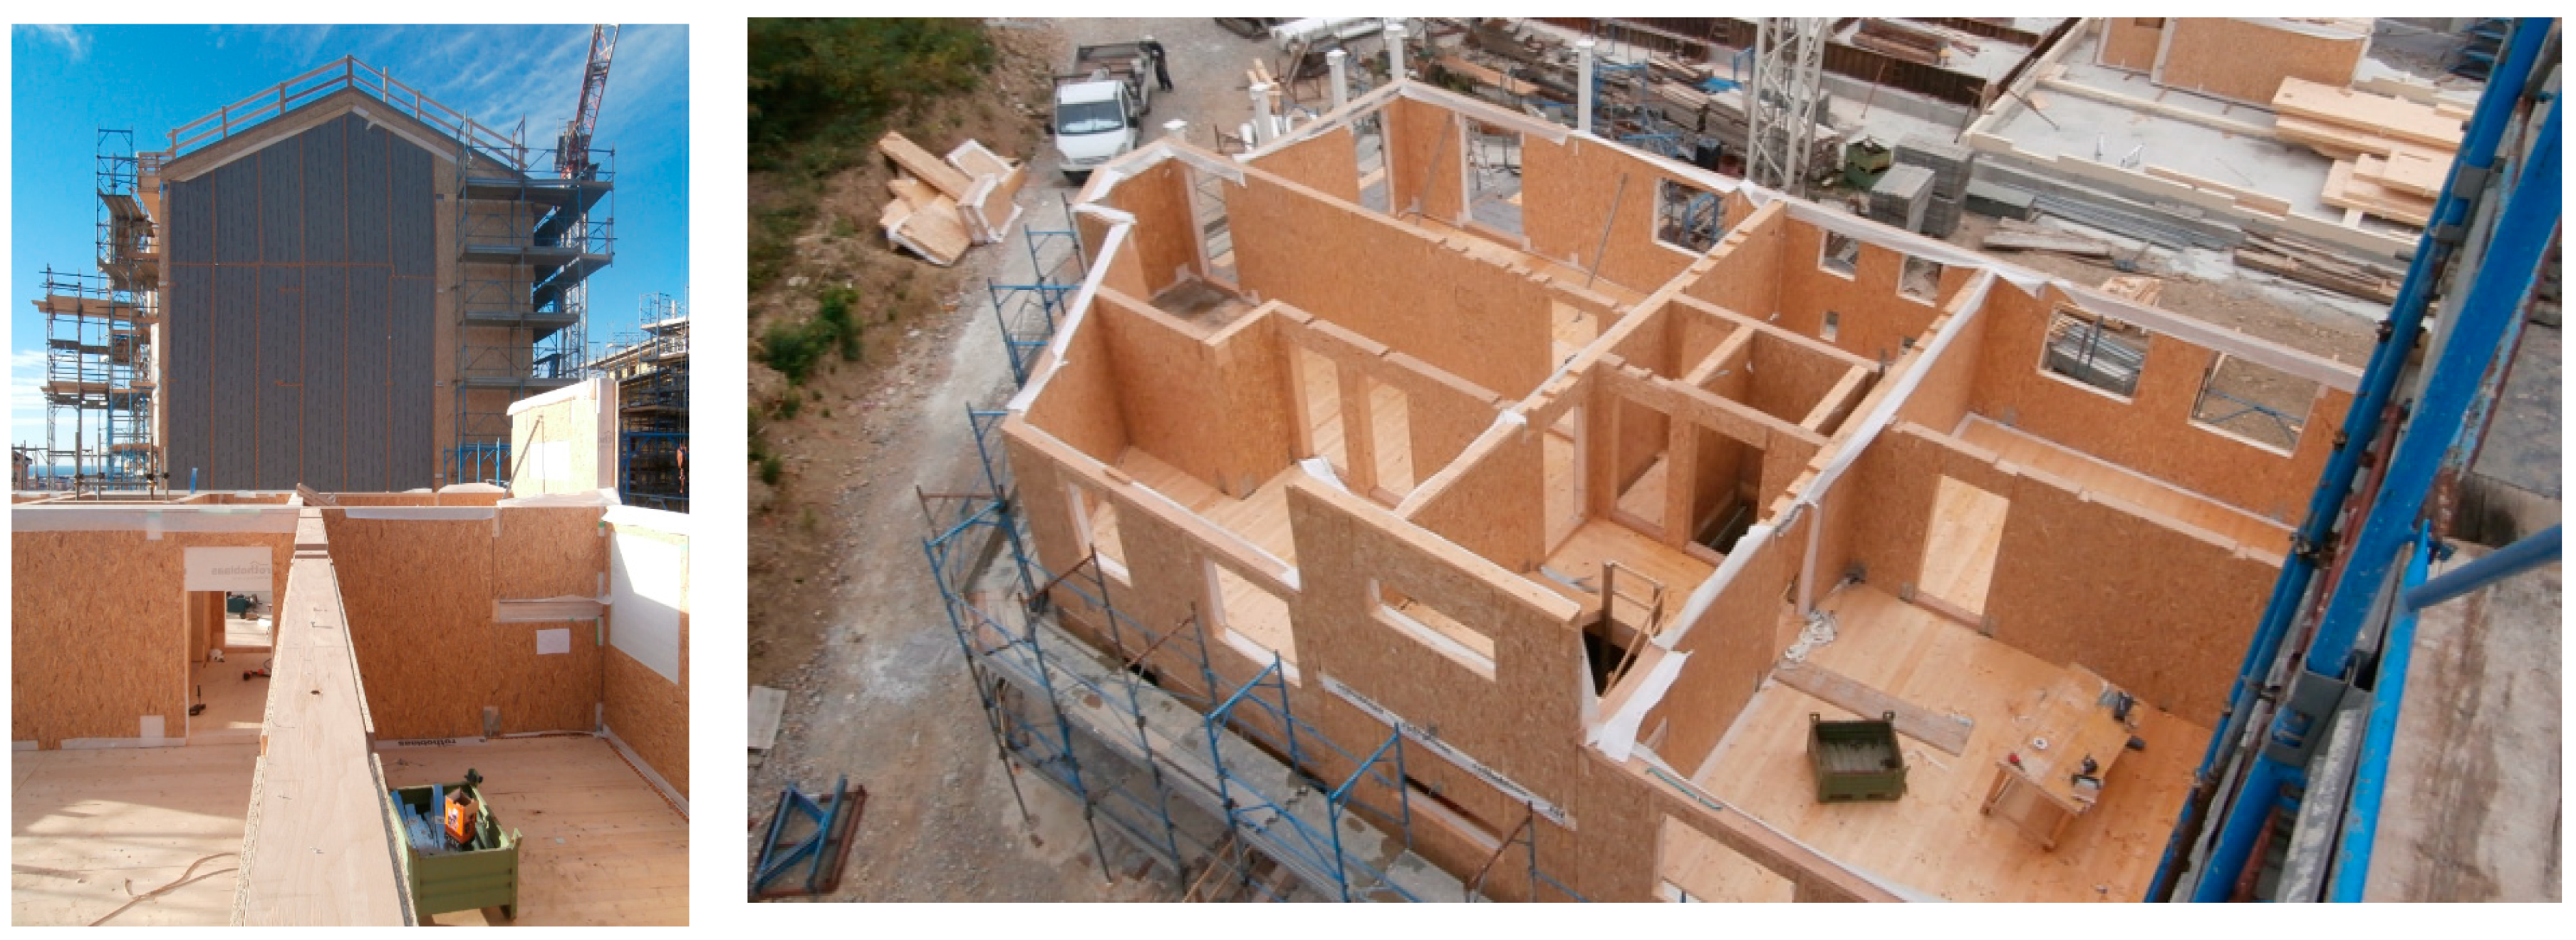
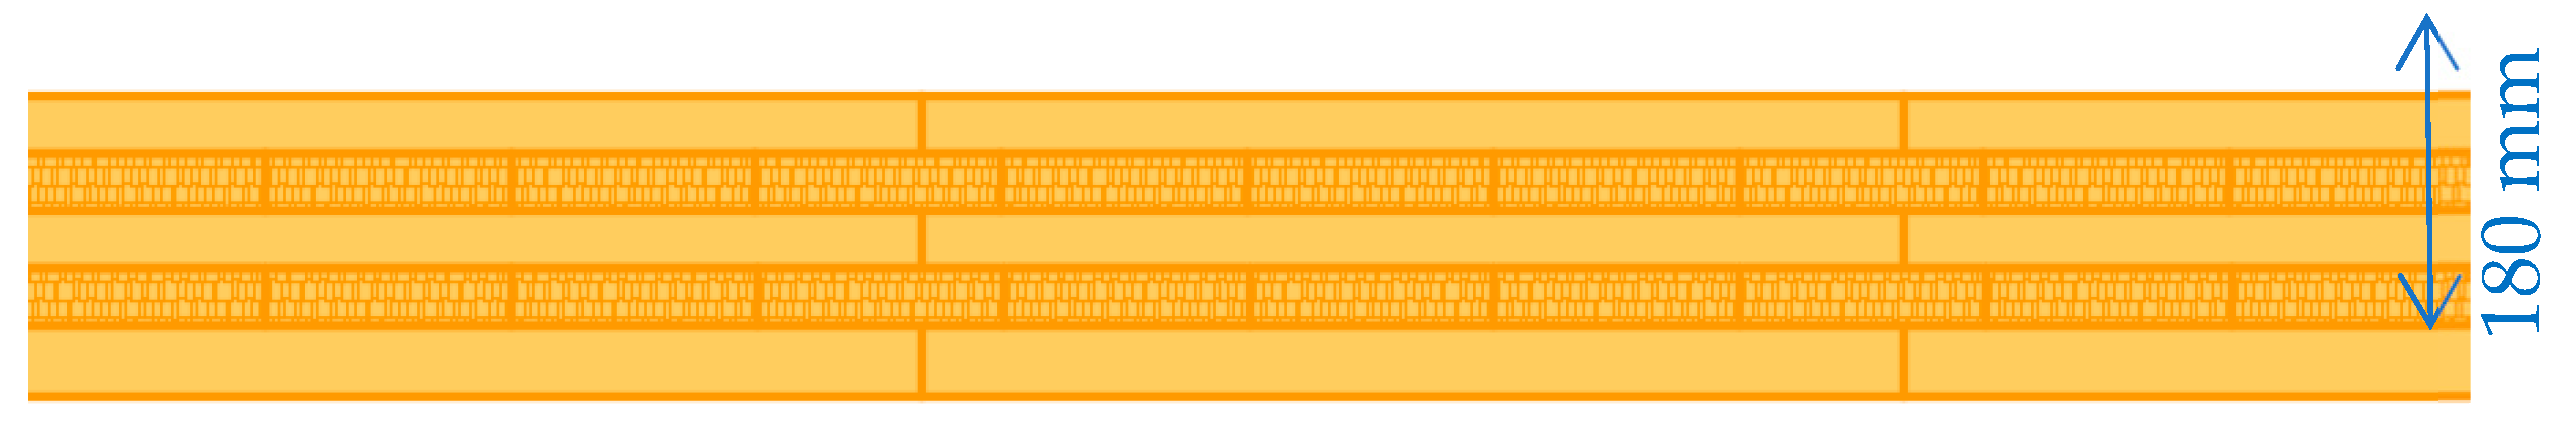
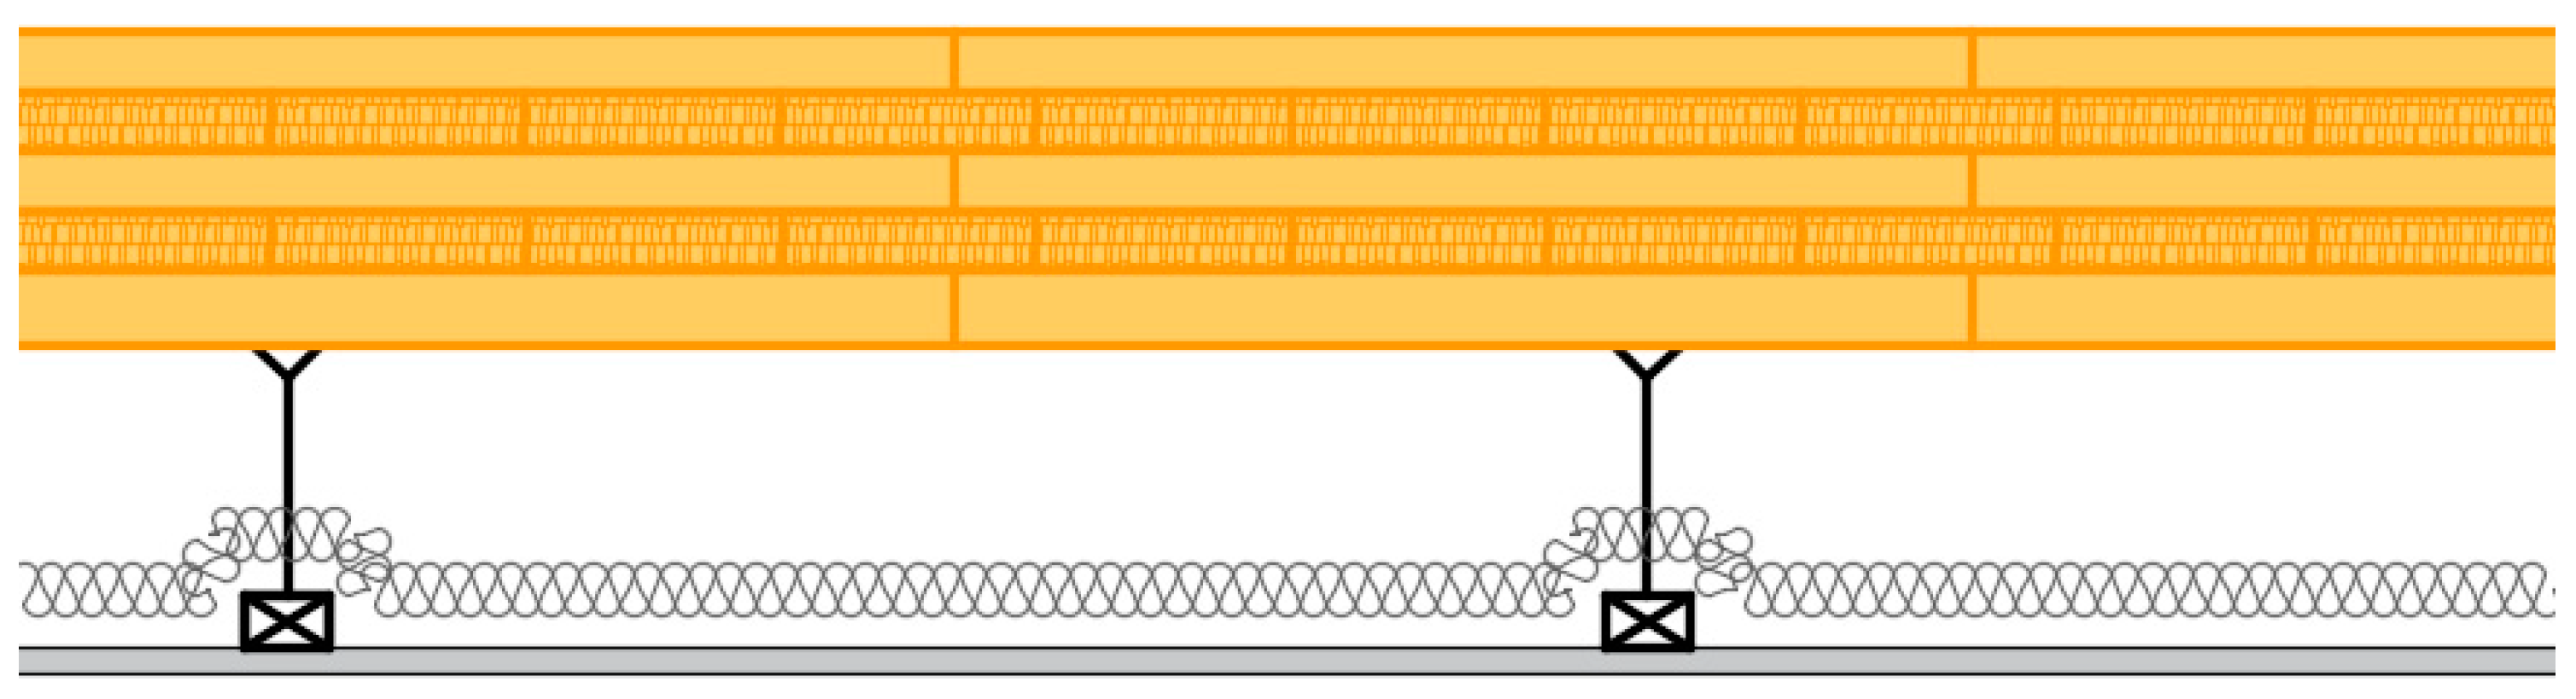
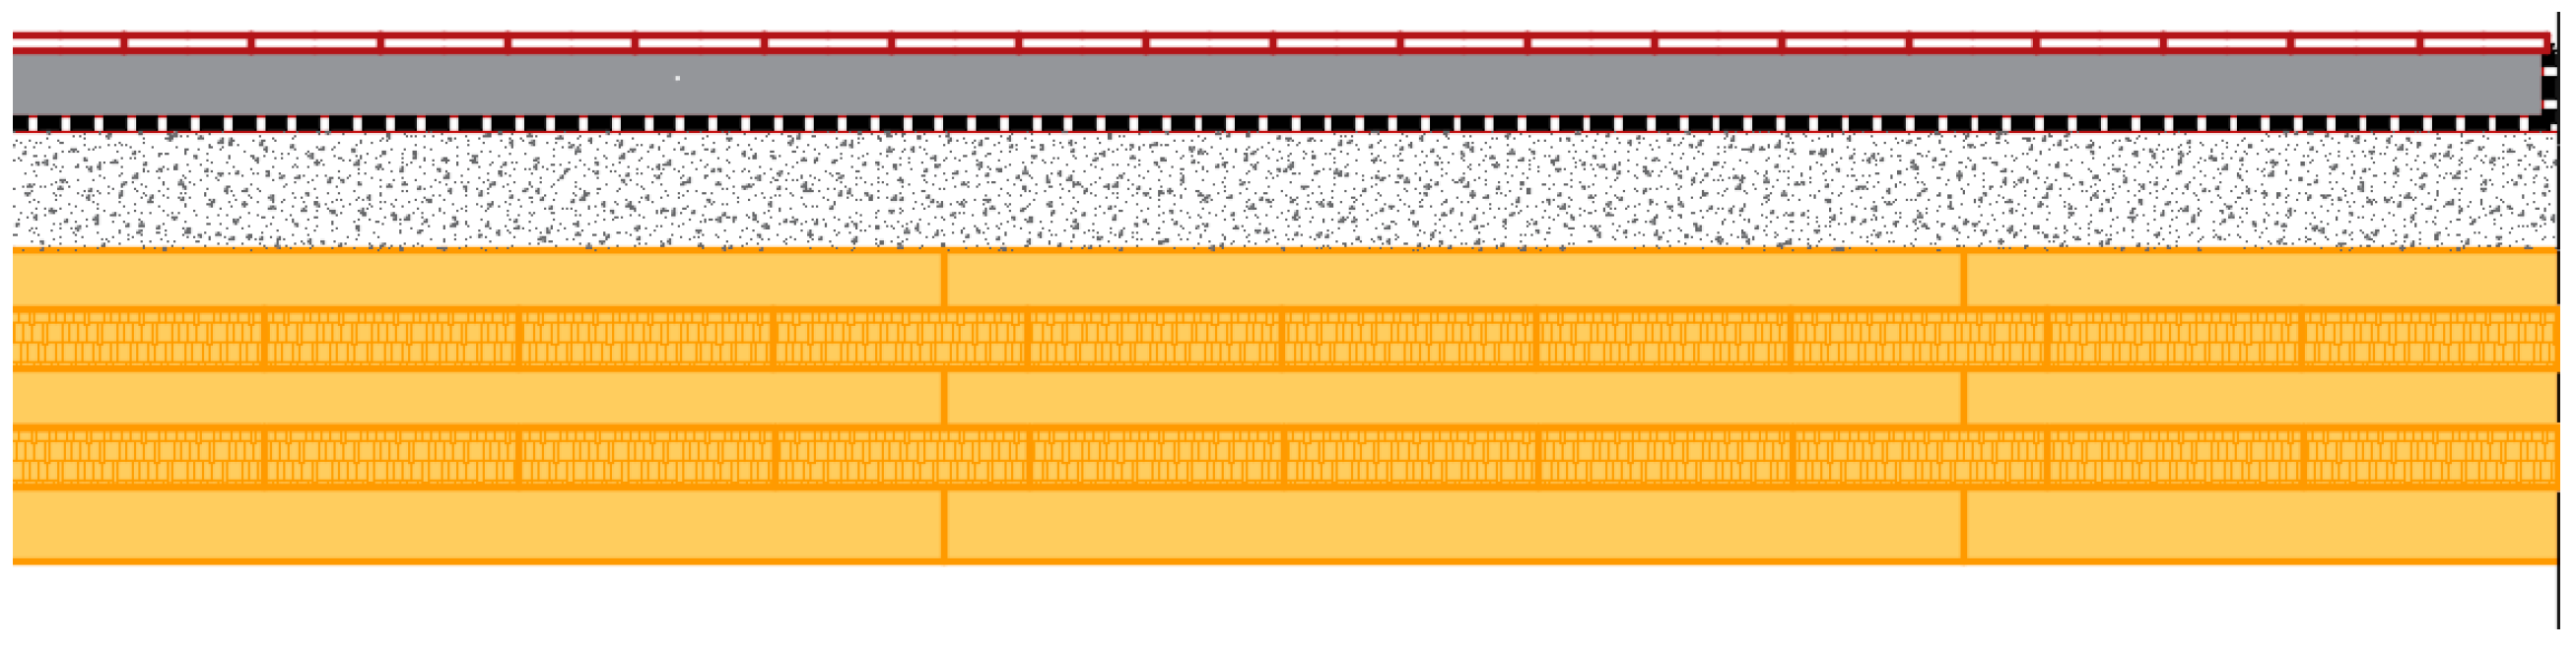
2.1. Investigated Structures

Different configurations of floor structures were built and tested, in order to understand their influence on sound insulation and impact noise reduction, as follows:
  • Bare floor;
  • Bare floor coupled with suspended ceiling;
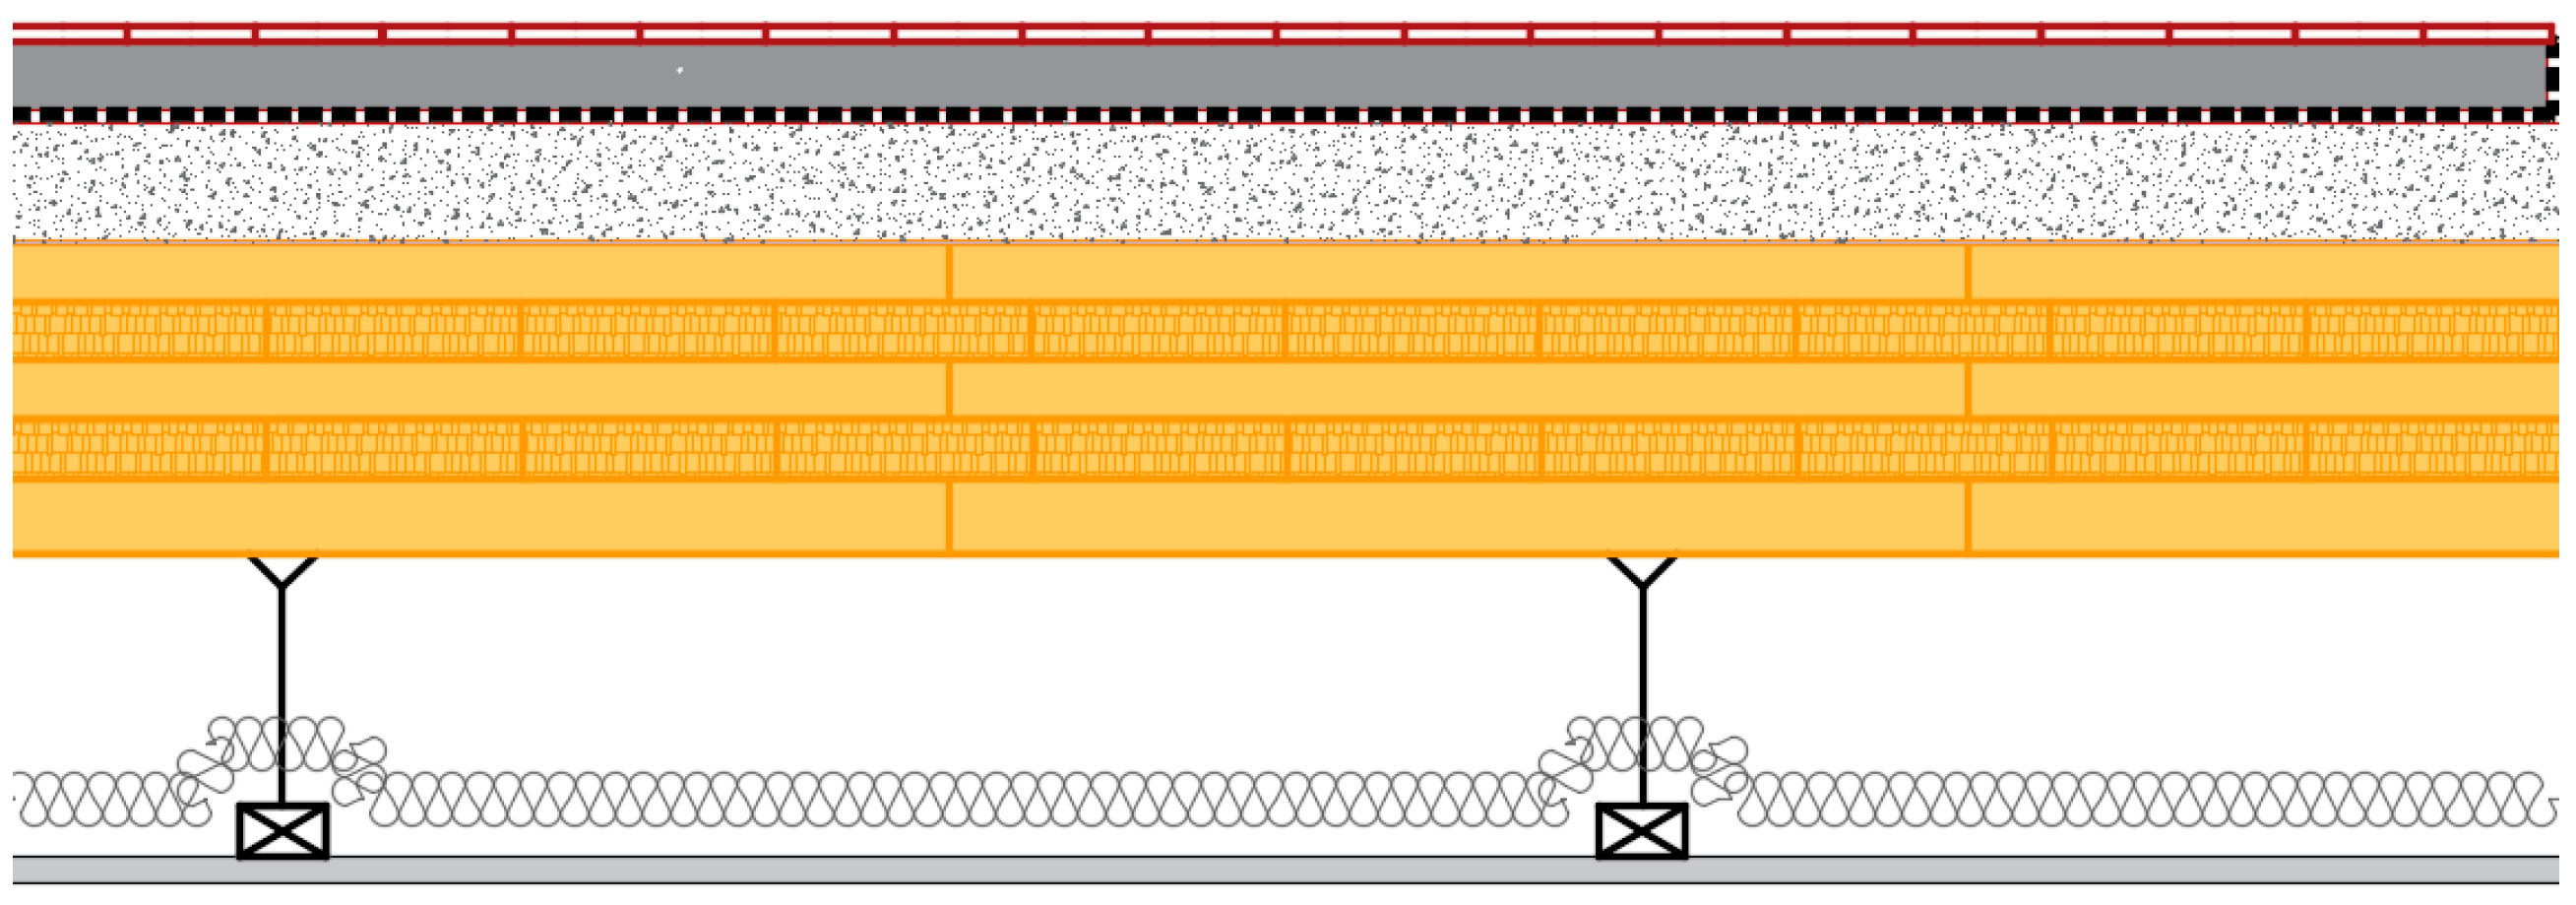
  • Bare floor coupled with a floating floor;
  • Bare floor coupled both with suspended ceiling (rigid connections) and floating floor.
The first configuration deals with the characterization of the bare floor. This structure features a thickness of 180 mm of Cross Laminated Timber as reported in Figure 3.
The second studied configuration presents a common solution used in timber buildings: suspended ceiling (configuration 2). A suspended ceiling is used for the following most frequent reasons: (i) including HVAC systems and thermos-hygrometric indoor conditions [25], (ii) including air or fluids pipes or ducts [26,27], (iii) protecting timber structures from fire [28]. Less frequently, it is intended to be used as a sound insulation layer or impact noise reduction technology. In Figure 4, the configuration 2 is depicted.
This solution does not interfere in vibration transmission but does on the airborne noise one. Accordingly, the suspended ceiling acts as an added layering, namely another and different impedance from the bare floor. Thus, it constitutes a sound insulating element laid between the source (vibrating floor) and the receiver (room). Subsequently, its influence is related to the airborne noise more than the structure borne one.
The third configuration features a well-established technology for impact noise reduction: a floating floor. Using this decoupling approach, vibration transmission is decreased by means of the mass-spring effect [29,30]. It is known that this technology diminishes the transmitted noise by decoupling the covering heavyweight screed from the bare floor. In this way, vibrations are reduced and thus the transmission to the other room will be significantly reduced. Configuration 3 is represented in Figure 5.
In order to investigate also the coupled effect of both suspended ceiling and floating floor on cross laminated timber, a further configuration (configuration 4, -Figure 6) was considered.
In Table 1, different layers used and tested are reported, describing their thickness, density, and elasticity.

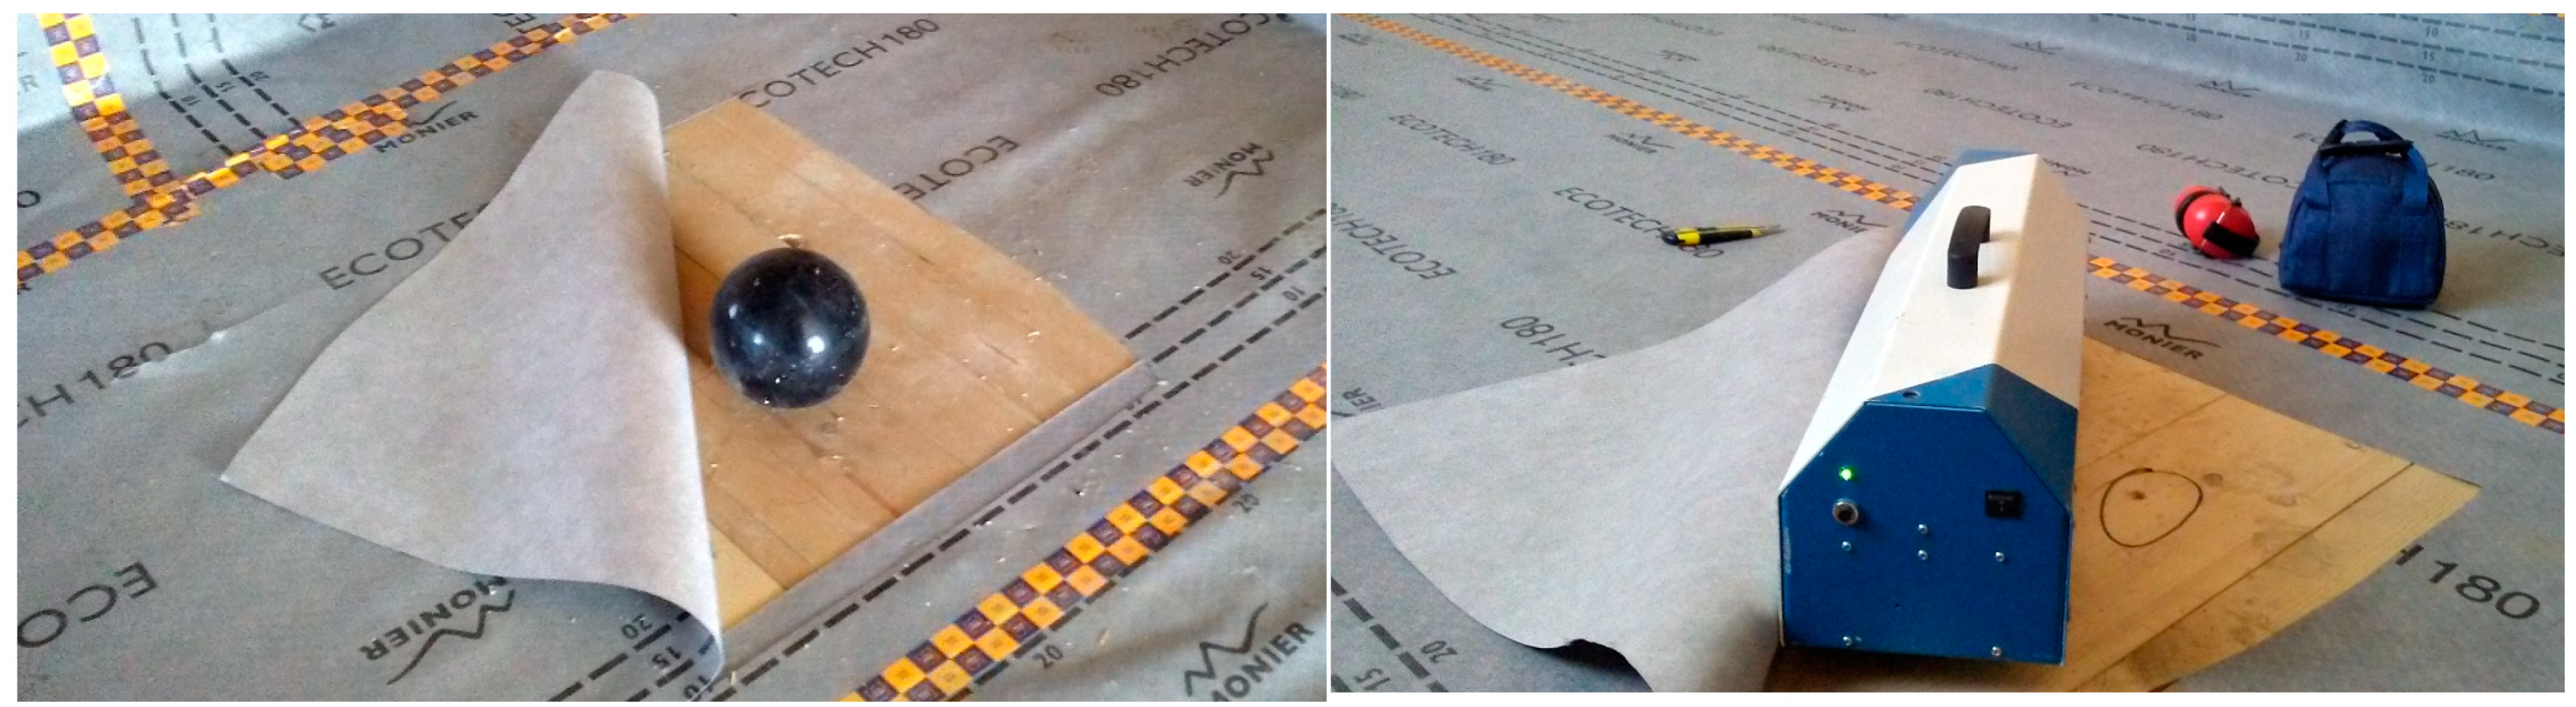
2.2. Experimental Structures Characterization

In order to investigate the influence of different layers on bare CLT, three different noise excitation sources were used: dodecahedral speaker for airborne noise generation, ISO tapping machine for heavyweight impact noise generation, and rubber ball for lightweight noise generation (Figure 7). Four different floors were tested for each configuration. For the sake of brevity, only average results are presented and discussed.
The measurement methods of airborne and impact sound insulation were conducted in accordance with international standards ISO 16283 part 1 (airborne noise) [31] and part 2 (impact noise) [32]. In particular, part 2 of the standard has recently introduced the use of the rubber ball also at an international level, associating it to subjective perception evaluation. The indices are calculated in accordance with the procedures indicated in the ISO 717 standards part 1 (airborne noise) and part 2 (impact noise).
The used tapping machine features the following characteristics:
  • five hammers placed in a line. The distance between centerlines of hammers is (100 ± 3) mm;
  • the distance between the center of the supports of the tapping machine and the centerlines of neighboring hammers is at least 100 mm;
  • height of fall of the hammers is 40 ± 2 mm;
  • the mass of each hammer is 500 ± 12 g from which it follows that the velocity at impact should be 0.886 ± 0.022 m/s. The tolerance limits of the velocity may be increased to a maximum of ±0.033 m/s if it is ensured that the hammer mass lies within accordingly reduced limits of 500 ± 6 g;
  • the falling direction of the hammers is perpendicular to the test surface to within ±0.5°.
  • the part of the hammer carrying the impact surface is cylindrical with a diameter of 30 ± 0.2 mm;
  • the impact surface shall be of hardened steel and is spherical with a curvature radius of 500 ± 100 mm;
  • the mean time between impacts is 100 ± 5 ms. The time between successive impacts is 100 ± 20 ms;
  • the time between impact and lift of the hammer is less than 80 ms;
  • the weight of the tapping machine is less than 25 kg.
The rubber ball generates the impact force exposure level LFE in each octave band shown in Table 2, when it is dropped vertically in a free fall from the height of 100 cm ± 1 cm, measured from the bottom of the rubber ball to the surface of the floor under test. The used rubber ball features the following characteristics:
(a) hollow ball of 180 mm in diameter with 30 mm thickness;
(b) effective mass of (2.5 ± 0.1) kg;
(c) coefficient of restitution of 0.8 ± 0.1.
The impact force exposure level, LFE, is expressed by Equation (1):
L FE = 10 lg [ 1 T ref t 1 t 2 F 2 ( t ) F 0 2 dt ]   ( dB )
where F(t) is the instantaneous force acted on the floor under test when the rubber ball is dropped on the floor [N], F0 = 1 N is the reference force, t2 − t1 is the time range of the impact force [s], and Tref = 1 s is the reference time interval. In Table 2, the standard rubber ball force is depicted.
The dodecahedral source features 12 speaker units. All speaker units in the same cabinet radiate in phase. The directivity of loudspeakers is approximately uniform and omnidirectional.

2.3. Acoustic Parameters

The apparent sound reduction index R′ is calculated in accordance with Equation (2):
R = L 1 L 2 + 10 log S A   ( dB )
L1 is the energy-average sound pressure level in the source room (dB);
L2 is the energy-average sound pressure level in the receiving room (dB);
S is area of the common partition [m2];
A is the equivalent absorption area in the receiving room [m2];
The normalized impact sound pressure level generated by standard tapping machine is calculated using Equation (3):
L n = L i + 10 lg A A 0   ( dB )
where A0 = 10 m2 is the reference equivalent absorption area.
The maximum impact sound pressure level measured with rubber ball L′i,Fmax is the maximum sound pressure level, tested using the “fast” time constant.
From the values measured in 1/3 octave bands it is possible to derive the evaluation indices R′w, L′n,w, and L′iA,Fmax according to ISO 717 part 1 and 2 standard. R′w and L′n,w are evaluated in the frequency range 100–3150 Hz, while L′iA,Fmax is the A-weighted sound pressure level evaluated both in the frequency range 50–630 Hz and 20–2500 Hz. This last extended range was performed in order to consider low frequency comfort according to Späh et al. [20].

2.4. Acoustic Models

In order to verify if available traditional models are suitable for acoustic performance predictions of Cross Laminated Timber floors, in the following, for the four presented configurations, analytical equations retrieved from literature and standard are presented. It has to be highlighted here that, at present, for the impact rubber ball, no analytical model is available for the noise prediction in the receiving room.
For the bare floor, the traditional model is the ISO 12354-2 [32]. In this view, analytic expression is reported in Equation (4):
L n = 155 [ ( 30 log m floor ) + ( 10 log T s ) + ( 10 log σ ) + ( 10 log f f ref ) ]   ( dB )
where m′floor is the mass per square meter [kg/m2] of the bare floor, Ts is the structural reverberation time, σ is the radiation efficiency, f is the excitation frequency, and fref is the reference frequency at 1000 Hz.
The structural reverberation time is calculated according to Equation (5):
T s = 2.2 f   η   [ s ]
where η is the overall damping.
The radiation efficiency is calculated according to Equation (6), using the Waterhouse correction [33]:
σ = p 2 4 ρ 0 c 0 A ( 1 + S T λ 0 8 V ) ρ 0 c 0 S T v 2
where ρ0c0 is the air impedance, A is the absorption area retrieved from the reverberation time [m2], ST is the floor area [m2], V is the volume of the receiving room [V], and v is the vibration velocity [m/s].
For the floating floor, the Cremer’s equation is available [34], according to Equation (7):
Δ L n , w , floating , Cremer = 30 log f f 0   ( dB )
where f0 is the resonance frequency [Hz] of the floating floor composed by the resilient layer and the screed and expressed by Equation (8):
f 0 = 1 2 π   s m screed   [ Hz ]
where s′ is the dynamic stiffness of resilient layer [MN/m3] and m′screed is the mass per square meter [kg/m2] of the screed.
Finally, some models are present for sound insulation prediction of lightweight partitions. Anyway, most of them are related only to the weighted index and do not provide a frequency trend. The only available approach could be the Sharp’s one [35,36], providing a frequency domain formulation, reported in Equation (9):
R = 20 log ( m partition   f ) 47.2   ( dB )
where m′partition is the mass per square meter [kg/m2] of the wall or floor.

3. Results and Discussion

3.1. Impact Noise–Tapping Machine

The impact sound pressure level results in 1/3 octave bands for bare CLT floors are shown in Figure 8.
Interestingly, the impact sound pressure levels of the weighted index measured using the tapping machine as the generator provide very similar results for all the different horizontal partitions. This is very important since it demonstrates that all the further studies and noise reduction actions will have very similar influence on all bare floors. The retrieved differences depend on floor dimensions, receiving room shapes and volumes [37]. Accordingly, in the low frequency range, some differences are evidenced. In the middle frequencies (1000–2000 Hz), they tend to offer very similar results, while at higher ranges, again, some diversities are present.
In Table 3, the 1/3 octave band average trend and the standard deviation are reported. It is evident how for most 1/3 octave frequency bands, the standard deviation falls within the ±3 dB range. This permit to consider the average data reliable and thus a reference.
When using Equation (4), the predicted trend is not similar to the measured one, as depicted in Figure 9.
It is possible to highlight that for middle-low frequencies, the model more or less fits the measured values. In Table 4, the difference between measured (average) and calculated values are reported. It could be noticed that low and middle frequencies (125–800 Hz) present very good agreement. Accordingly, the prediction falls within a range of ±3 dB. In contrast, from 1000 Hz on, the model is not able to correctly fit middle-high and high frequencies, mostly because the measurement of the structural reverberation time is measured using hard-surface sources (hammer). When the head of the hammer impinges the wood, it tends to present a resilient behavior (compared to concrete) on middle and high frequencies. For this reason, the measurement could not accurately determine this parameter, thus affecting acoustic performance predictions.
When considering a suspended ceiling addition, no analytical model is present in literature or in standards.
In Figure 10, the results are reported when the exciting source is the tapping machine. It can be seen how different configurations can act on the impact noise reduction when compared to the average impact noise of the bare CLT floor (configuration 1). Accordingly, when at the bare floor a suspended ceiling is added (configuration 2), a significant noise reduction both in frequency and weighted index is verified. In particular, this reduction follows the trend of the average bare floor almost constantly.
When considering the range of 250–3150 Hz, we can also easily derive a regressive equation (Equation (10)):
Δ L n , w , ceiling = 0.028   ( f ) + 23.8   ( dB )
where f is the frequency [Hz].
The results could be fitted, with a regression coefficient of R2 = 0.89. By means of this equation, it could be possible to estimate the effect of this kind of suspended ceiling on a generic CLT floor of 20 cm thickness.
Moving onto configuration 3 (only floating floor and bare CLT floor), it could be acknowledged that a similar reduction is proposed, compared to configuration 2. Here, low frequencies (100–200 Hz) are reduced more efficiently, as well as high frequencies (1600–4000 Hz). However, this technology could not work properly, because its performance requires a heavy mass as bare floor. In this case, a cross laminated plate could not represent this element, because of its lightweight structure.
When applying Equation (7) to configuration 3, a different resulting trend is produced. In Figure 11, the frequency tendencies of the two impact noise reductions are depicted. Clearly, Cremer’s model cannot be applied to this kind of wooden partitions, since it fails by a large amount.
The main reason is that Cremer’s model considers the bare floor as completely rigid, featuring an ideally infinite mass in comparison to the floating floor. In the case of CLT floors, this does not happen. Accordingly, the density of a CLT floor is 90 kg/m2, very similar to the floating floor. It is evident that the bare timber floor cannot be considered neither more rigid nor more massive than the floating floor, thus significantly affecting the application of Cremer’s model.
When investigating the frequency influence on the measured noise reduction index reported in Figure 11, in the range 250–3150 Hz, a relation can be found, as expressed in Equation (11), with a regression coefficient of R2 = 0.70. However, a poor influence of frequency on impact noise reduction is highlighted:
Δ L n , w , floating , CLT   model   = 0.012   f + 22.9   ( dB )
when combining the two technologies in the bare floor (configuration 4), a significant reduction is verified, in comparison to configuration 1 (bare CLT floor) and to both configuration 2 and 3. Anyway, when combining Equations (10) and (11), the obtained result is not reliable (Figure 12).
The retrieved equation from measured values is reported below, with a regression coefficient of R2 = 0.81 (Equation (12)).
Δ L n , w , overall   = 1.9   f + 40.1   ( dB )
Here, we can see that frequency affects more significantly impact sound reduction, in comparison to configuration 2 and 3. It is thus evident that we have to avoid the combination of the two equations related to single actions, as the merging would lead to a significant underestimation of the final results.

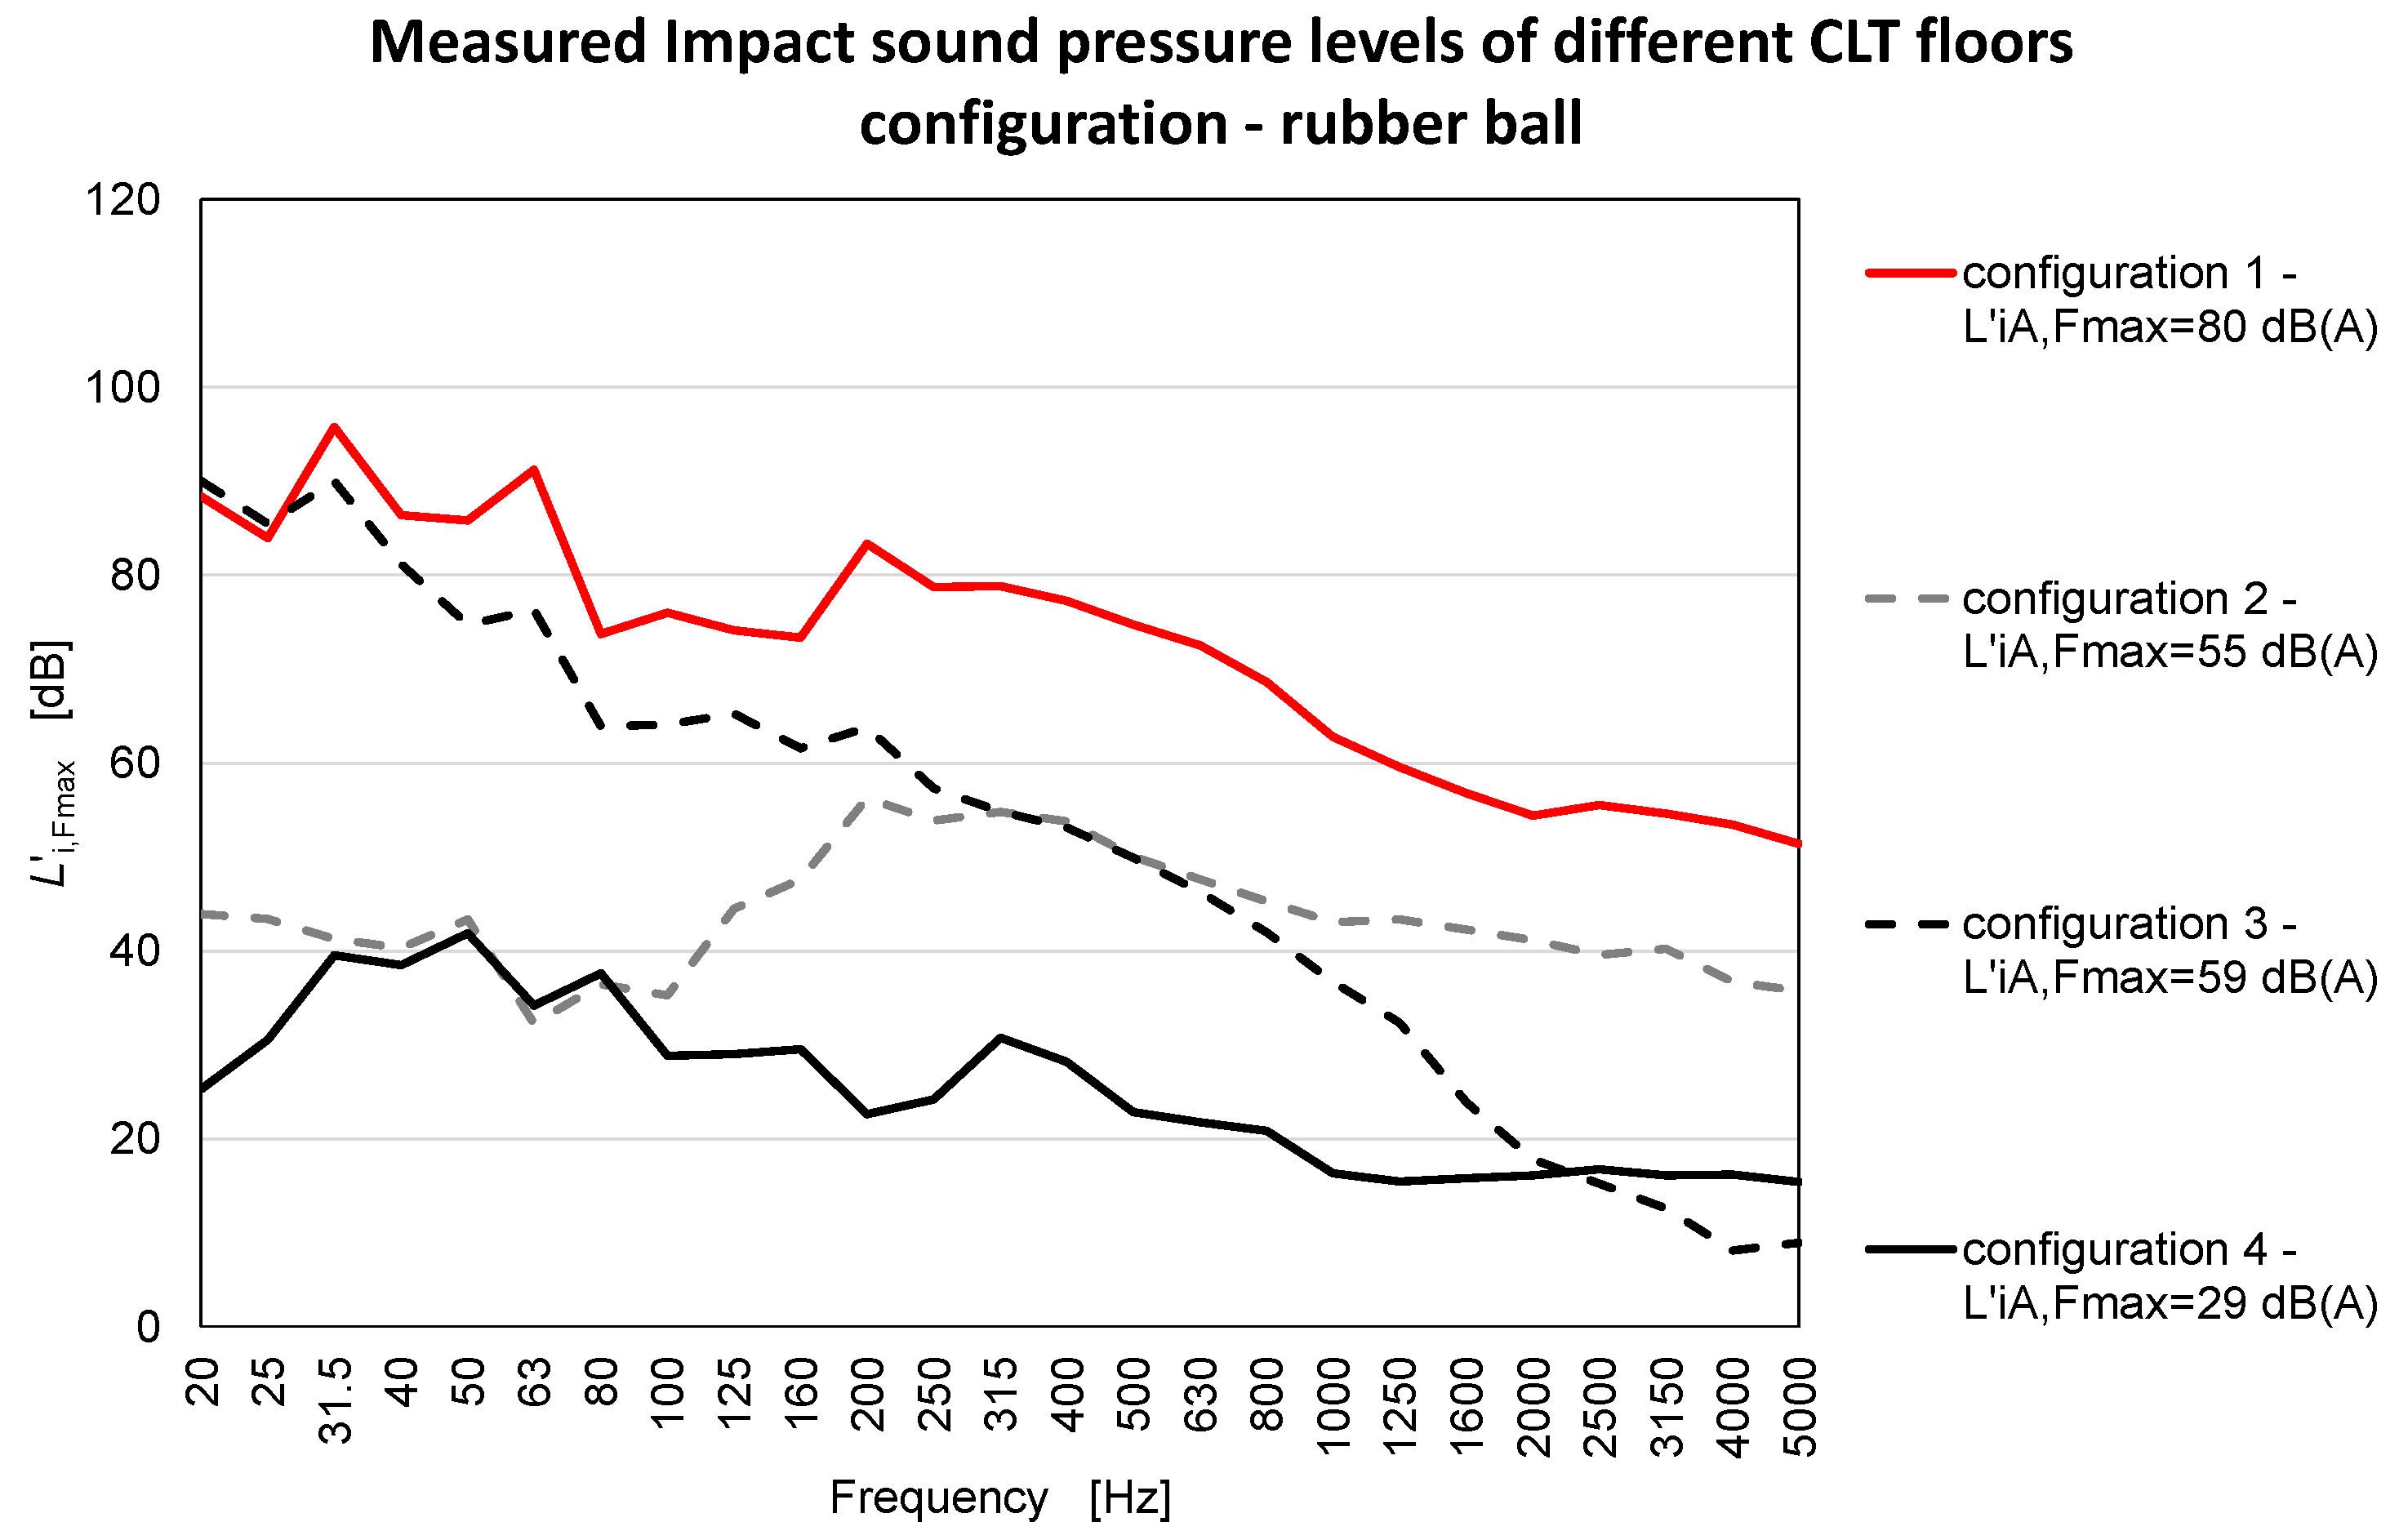
3.2. Impact Noise–Rubber Ball

When using the impact ball as noise source, we have to consider that the excitation is different from the traditional tapping machine. As reported above, this methodology injects into the structures an impulse which is poor of middle-high frequencies (800–5000 Hz) and focuses its action in the range 100–630 Hz. The results of the standardized maximum impact sound pressure relate to bare and lined CLT floors are shown in Figure 13. As demonstrated above, bare CLT floors mostly present the same frequency trends when excited. Therefore, for the sake of brevity, only average bare floor trends are presented hereafter.
From Figure 13, it is evident that configuration 2 acts efficiently in noise reduction especially at low (20–100 Hz) and high frequencies (1600–5000 Hz). The presence of the fibrous material within the ceiling air gap could influence the impact noise propagation. However, when the resonance frequency is overcome (over 80 Hz), its efficiency significantly decreases. Since the measured trend is composed by three different zones, showing three different behaviors, it is not worthy to infer a regressive equation.
When only floating floor is considered (configuration 3), it is evident how the provided noise reduction is significantly lower. This is mainly due to the fact that the floating floor works at a different frequency range. It was previously demonstrated [38] that this technology reduces significantly the transmission on middle-high frequency ranges (1000–5000 Hz). When using the rubber ball, this range is not injected in the floor, as reported in Table 2. For this reason, a smaller reduction is found, compared to configuration 2. In this case, the trend presents a homogeneous behavior and therefore a regressive approach may be used. The result is presented in Equation (13), with a regression coefficient of R2 = 0.97:
Δ L iA , Fmax , floating   = 35.1 log ( f ) 49.5   ( dB )
It is interesting to note that, in comparison to tapping machine excitation, the equation is not linear anymore, but it follows a logarithmic trend, based on the exciting frequency.
When considering suspended ceiling and floating floor together (configuration 4), a significant overall reduction is verified. Accordingly, in some frequencies, the background noise could have influenced the results, since they are comparable to it.
In this case too, the trend presents a homogeneous behavior and therefore a regressive approach can be used. The result is presented in Equation (14), with a regression coefficient of R2 = 0.74.
Δ L iA , Fmax , floating   = 10 log ( f ) 38.1   ( dB )
In this case, the frequency contribution is less significant than the configuration 3 represented by Equation (13) and a logarithmic trend is evidenced.

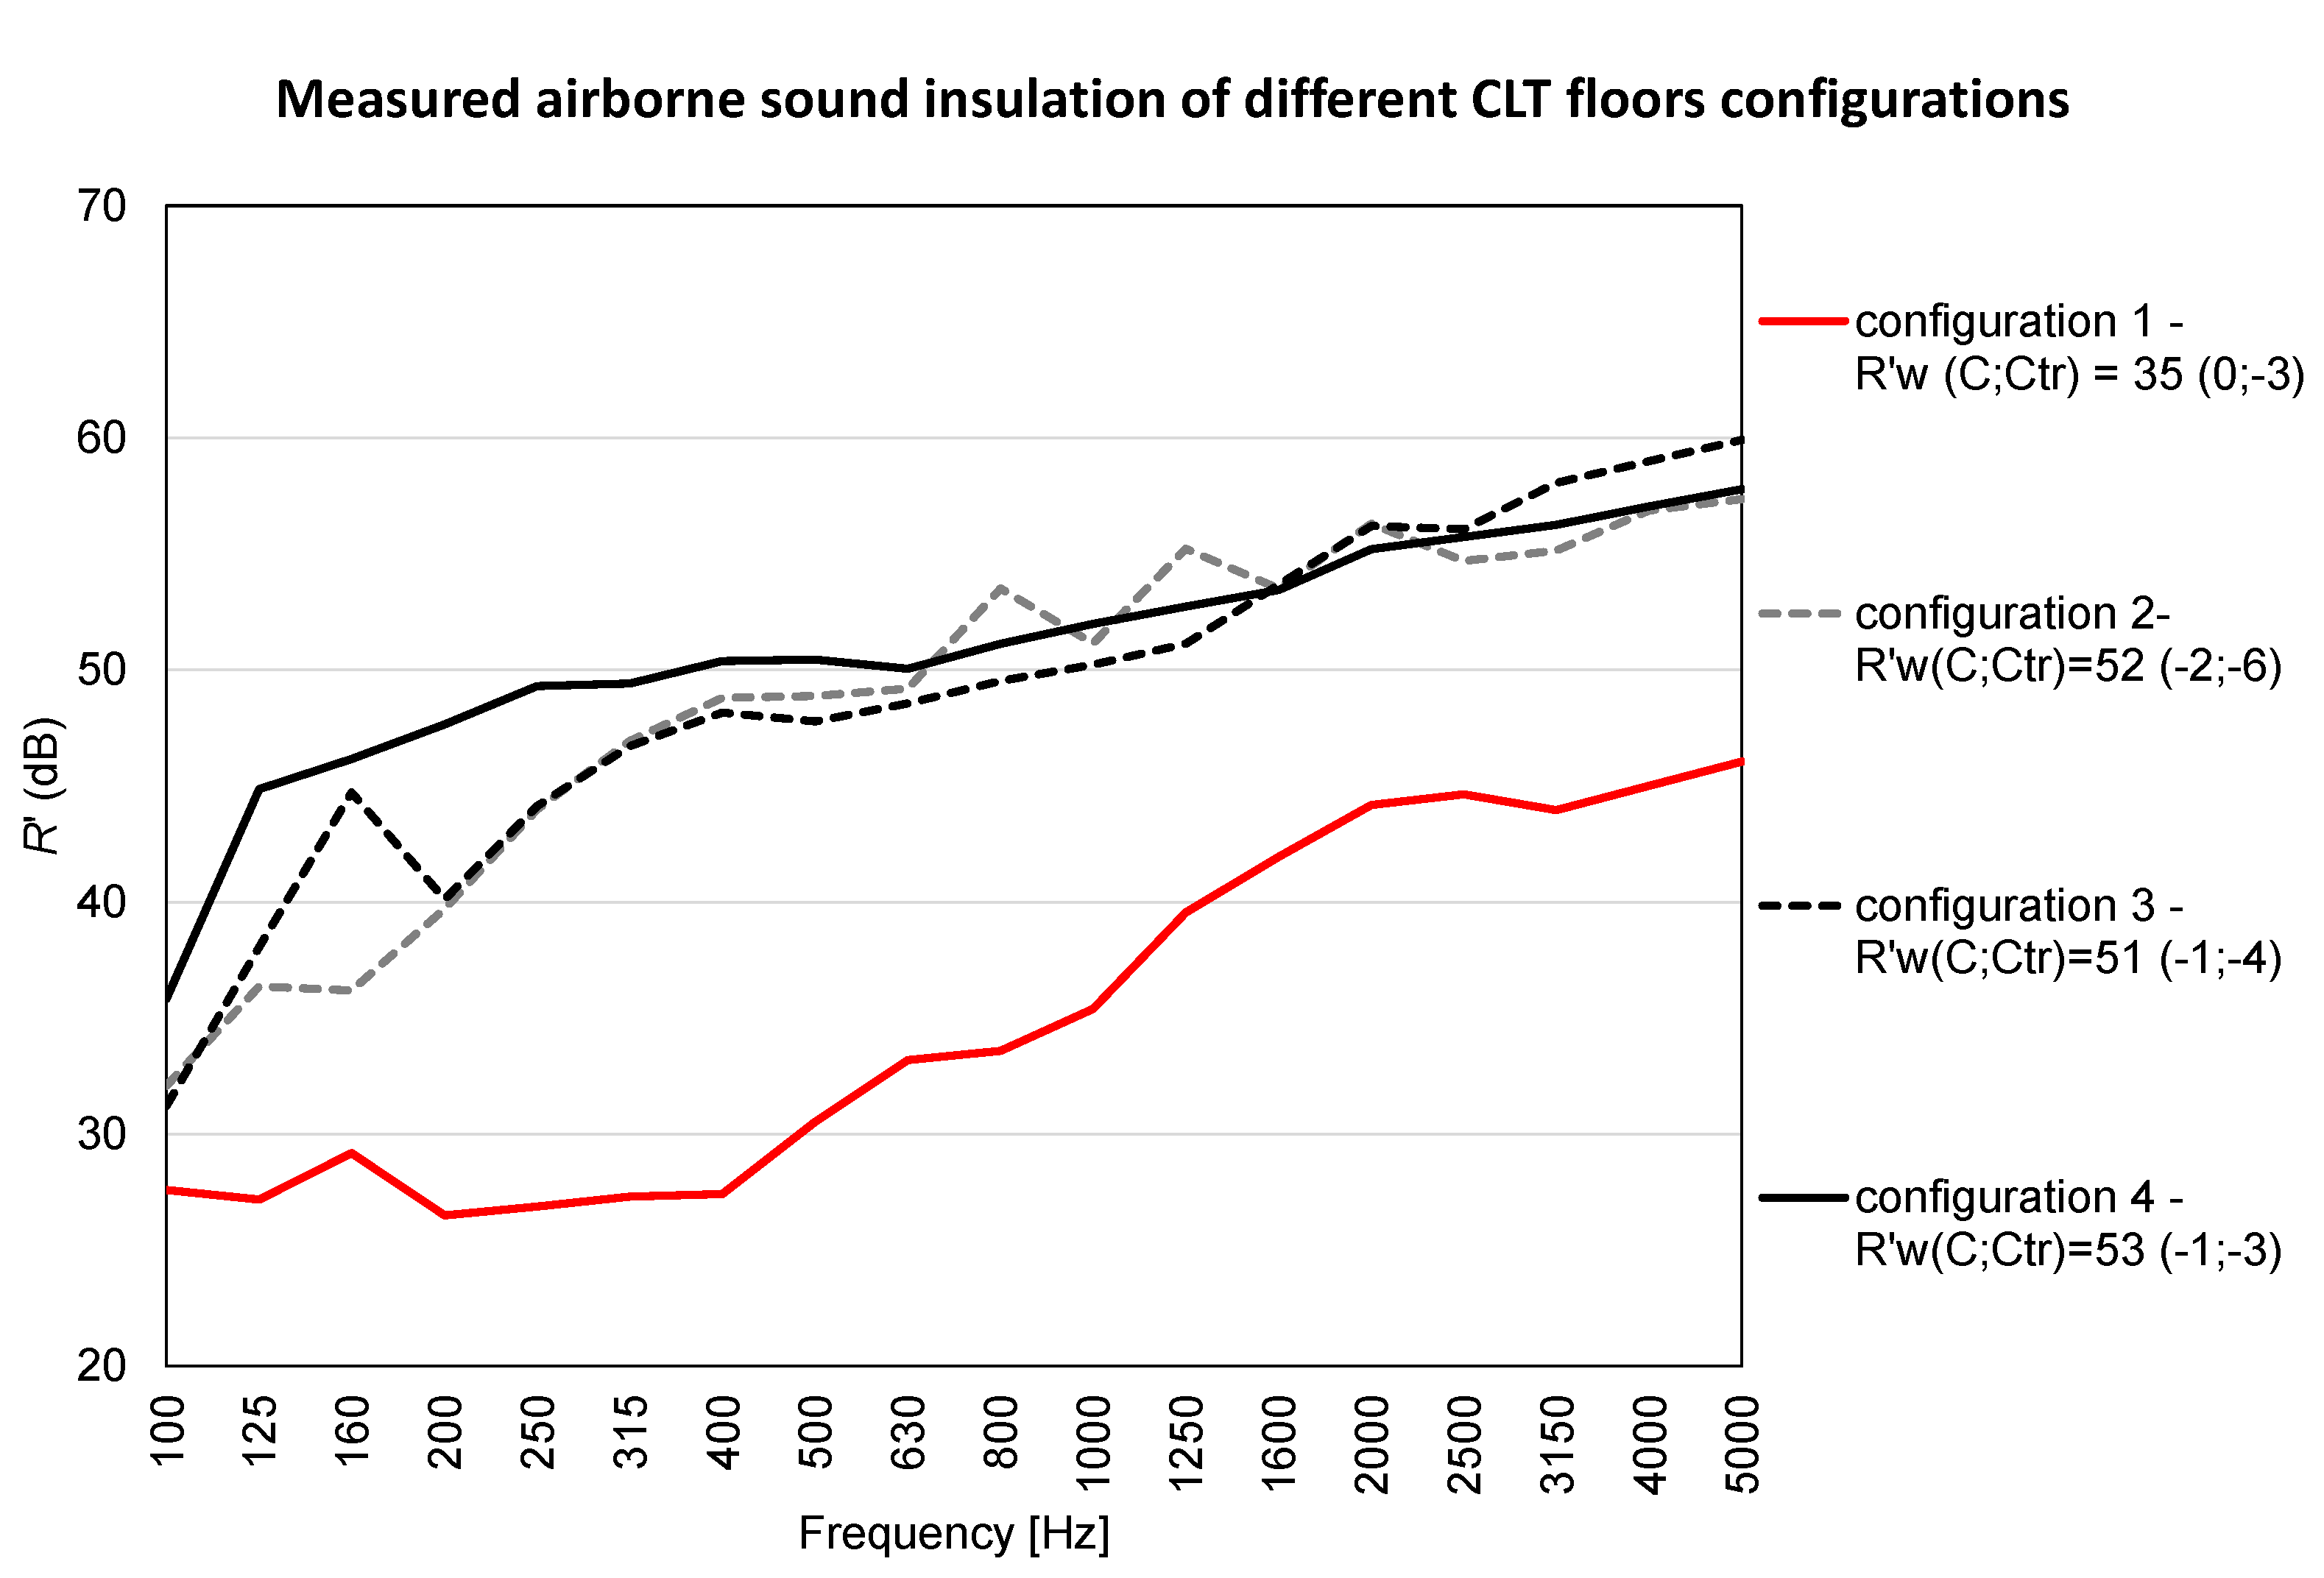
3.3. Airborne Sound Insulation

The investigation of the sound insulation to airborne noise is useful in order to understand if the actions of the floating floor and of the suspended ceiling, applied for impact noise reduction, can influence also soundwaves propagation in air. For this reason, in Figure 14, the measured trends are reported.
It is evident how the bare floor provides very poor frequency performances, while the addition of a suspended ceiling (configuration 2) positively affects sound insulation. In this case, also floating floor (configuration 3) positively affects sound insulation, showing a very similar trend compared to configuration 2. When combining the two solutions, some significant improvements can be seen at middle-low frequencies, until 1600 Hz.
In Table 5, the results of the calculated frequency sound insulation are reported. In addition, the difference Δn between the measured and the calculated values (using Equation (9) are included after each configuration. It is interesting to notice that configuration 1 (bare floor) is not fitted robustly. Accordingly, differences up to −19.8 dB are verified, with a mean value of −13.9 dB. When considering the suspended ceiling addition (configuration 2), we can verify a significant improvement of the sound insulation prediction. A maximum of 9.8 dB difference is provided, featuring a mean value of −1.6 dB. It is worthy to highlight that from 100 to 2000 Hz, the prediction falls within a range of ± 3 dB, with the exception of 315 Hz (3.7 dB) and 400 Hz (3.5 dB). This fact demonstrates how low, middle, and middle-high frequencies can be successfully calculated using Sharp’s theory.
When considering only floating floor addition to the bare floor (configuration 3), the prediction is not to be considered robust and reliable. Differences are significant (up to −12.4 dB) with a mean value of −6.3 dB. A different trend is verified for the complete layering (configuration 4). For low frequencies (100 Hz–500 Hz), a good prediction is provided, falling within the ± 3 dB range, with the exception of 125 Hz (4.2 dB) and 160 Hz (3.2 dB). From 630 Hz, a constant increase in the difference is verified, reaching its maximum at 5000 Hz (−15.0 dB) and a mean value of −5 dB.
As an overall result, we can say that the Sharp’s model provides a reliable prediction only for configuration 2 up to middle frequencies, while for the other configurations, no consistent trends are found. For all configurations, the Sharp’s model tends to overestimate the sound insulation and the worst range is represented by high frequencies (>1600 Hz).

3.4. Weighted Indexes Results

Even if weighted indexes do not provide frequency information, thus eliminating some of the interesting results, it is evident how it is easier to compare measurements using just the single index instead of 18 different values (1/3 octave bands). For this reason, results in terms of weighted index are reported in Table 6.
It is possible to notice that, for impact noise reduction using the tapping machine, the significant variation is caused by the use of whether a suspend ceiling or a floating floor is similar. Anyway, when applying the second configuration, it is possible to notice that the reduction is different if measured with the rubber ball or with the tapping machine. According to the standard, L′iA,Fmax,50–630 is the parameter representing the subjective evaluation of the noise disturbance produced by floor impact sound. Conversely, according to literature [20], L′iA,Fmax,20–2500 is more accurate. In this case, we can see no significant difference comparing the two parameters.
Considering configuration 3, we can see that almost the same impact reduction is measured with both tapping machine and rubber ball and that no significant difference is found between L′iA,Fmax,50–630 and L′iA,Fmax,20–2500.
Moving to configuration 4, a significant difference can be reported between tapping machine and rubber ball test, evidencing how, for the latter, a significant improvement in performance is assessed in comparison with the bare floor.
From the sound insulation point of view, when adding a technology of impact noise reduction, we can see a substantial increment of the performances. Anyway, (i) changing the configurations or (ii) merging them do not vary importantly final results.
Another overall finding is that configuration 3 (floating floor) and 4, where the combination of the two technologies ensures a more insulated partition, are capable to respect the law requirements of most European countries [39].

4. Conclusions

In this work, airborne and impact noise insulation measurements were carried out on a building featuring Cross Laminated Timber floors. In particular, the apparent sound reduction index and the impact sound pressure level measured with a normalized generator and rubber ball impulses were measured step-by-step during the construction phase. In particular, the application of floating floor, suspended ceiling, and the merging of these two technologies applied to the bare Cross Laminated Timber floor was investigated.
Findings highlighted how this lightweight sustainable timber structures do not present the same performances of heavyweight ones. We can then resume our main conclusions as follows:
-
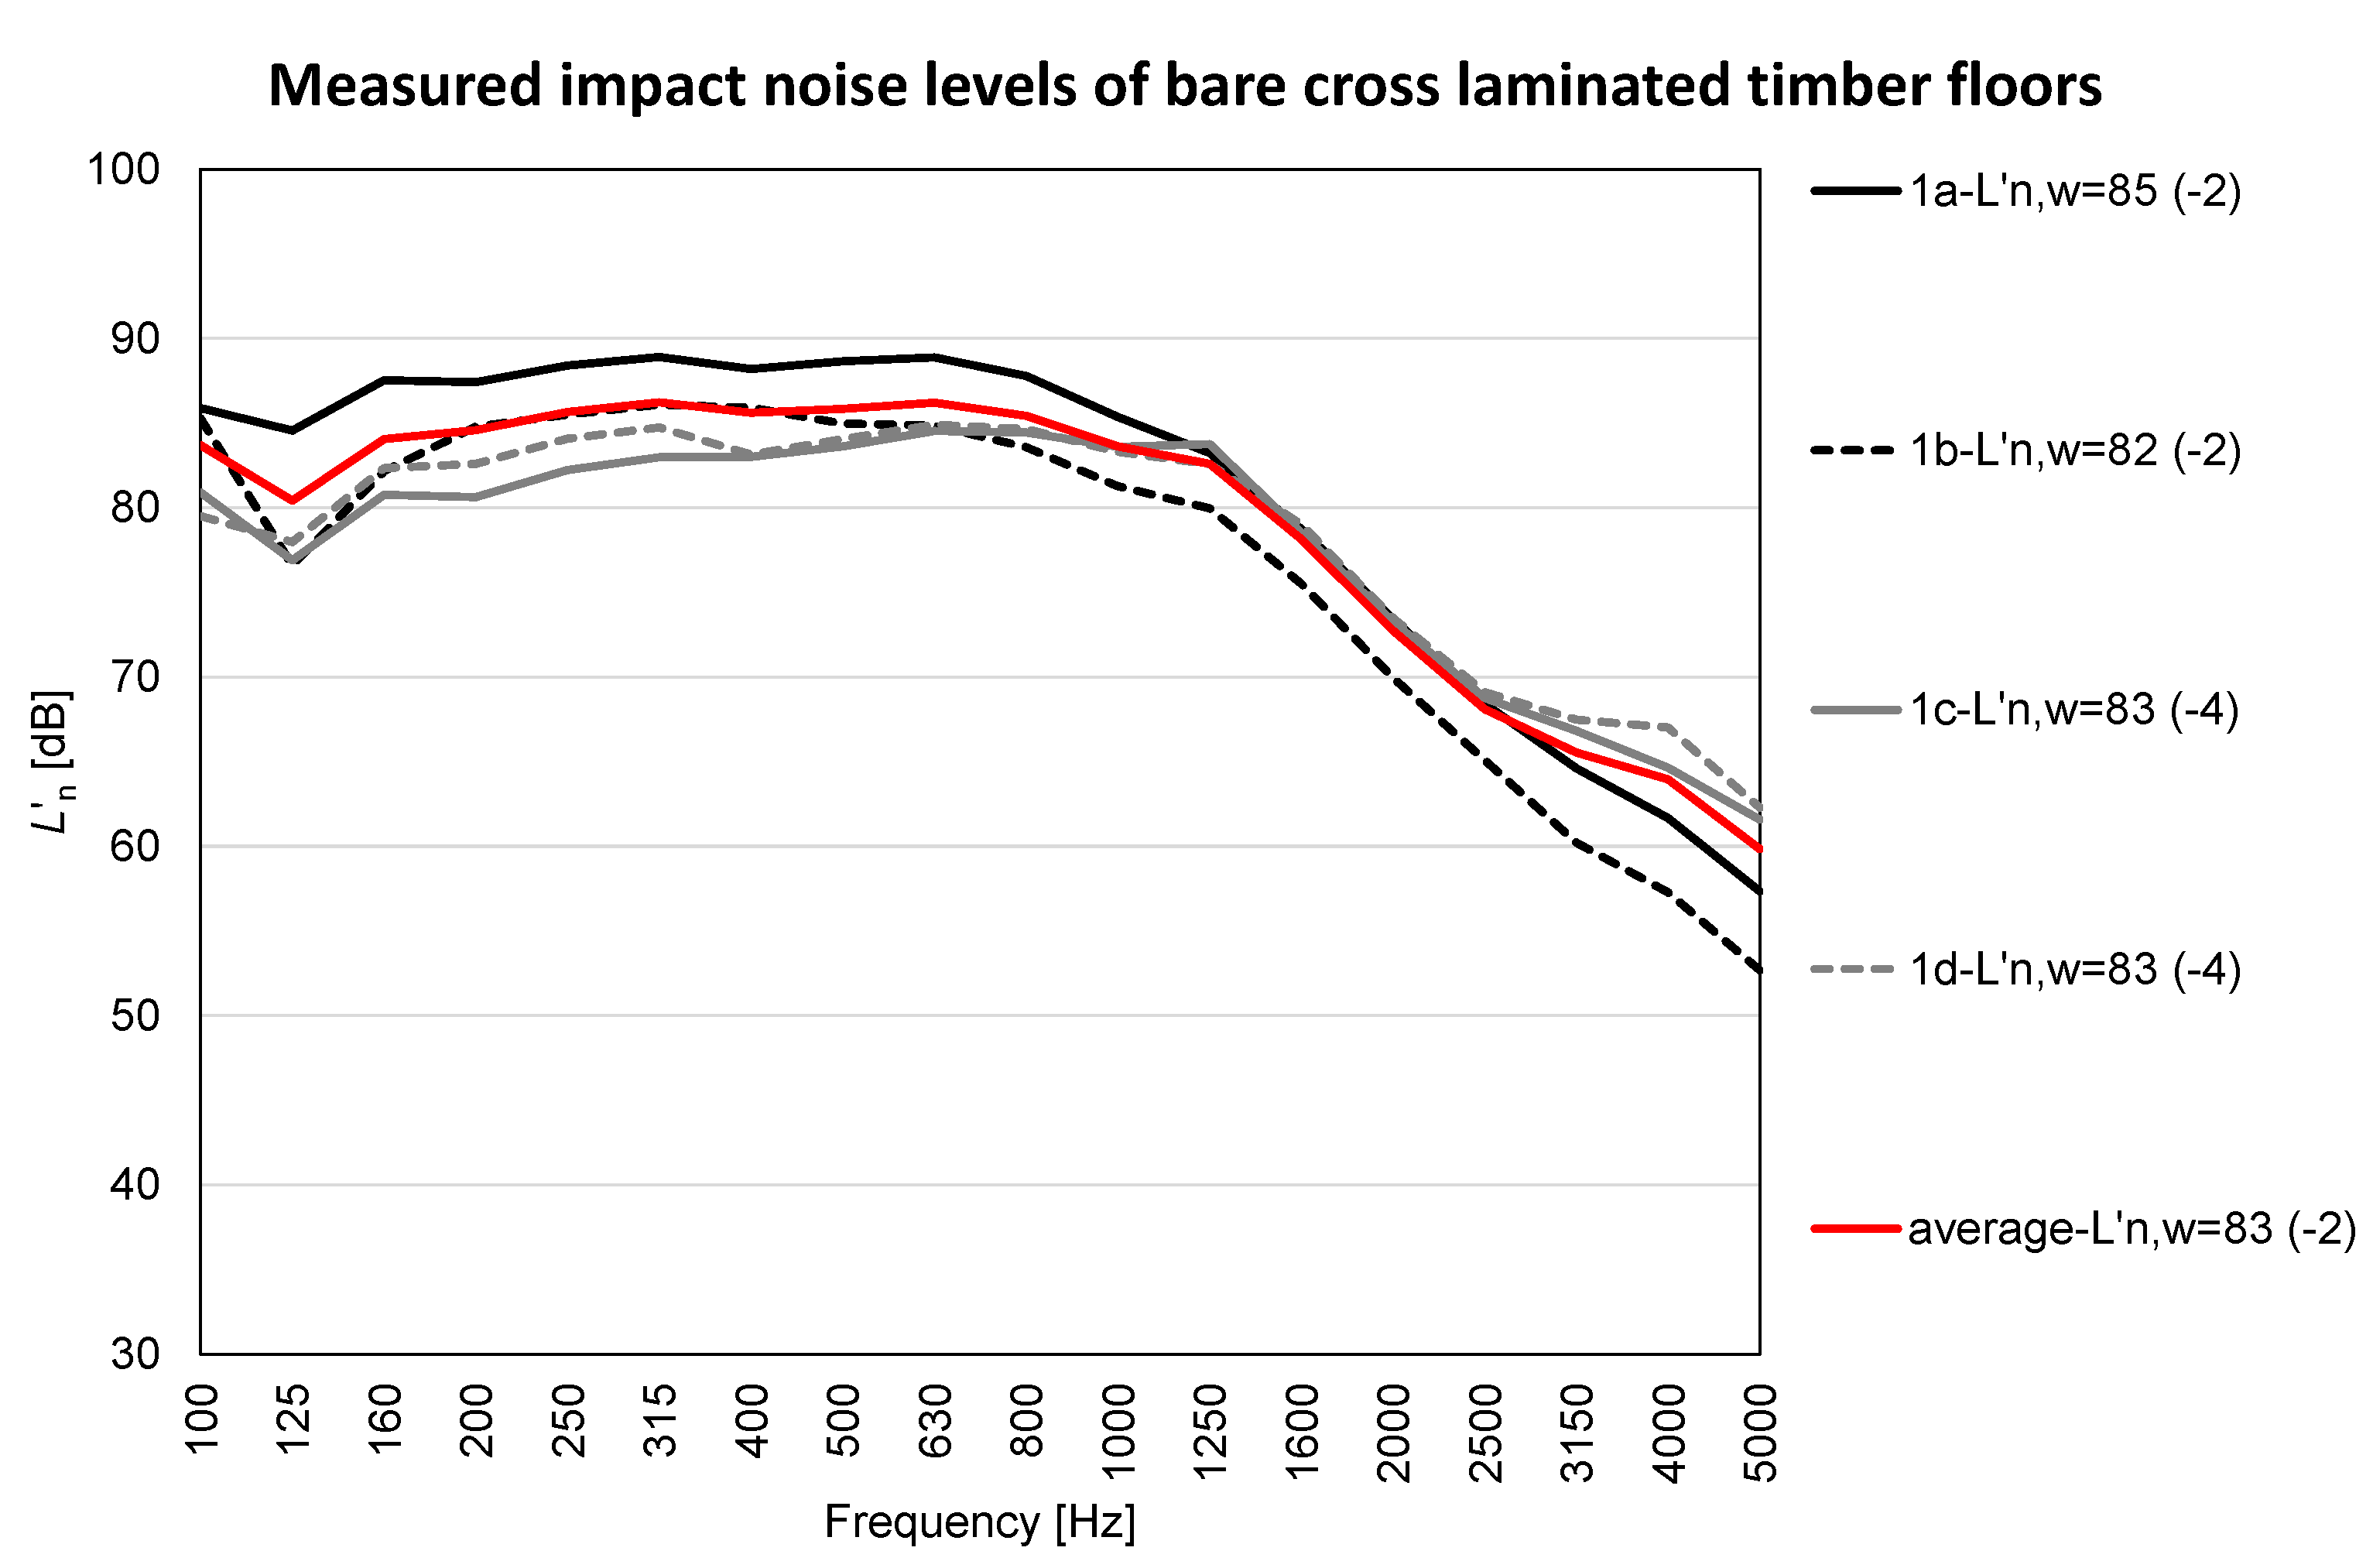
the bare Cross Laminated Timber floors present similar acoustic performances, thus an average trend can be considered;
-
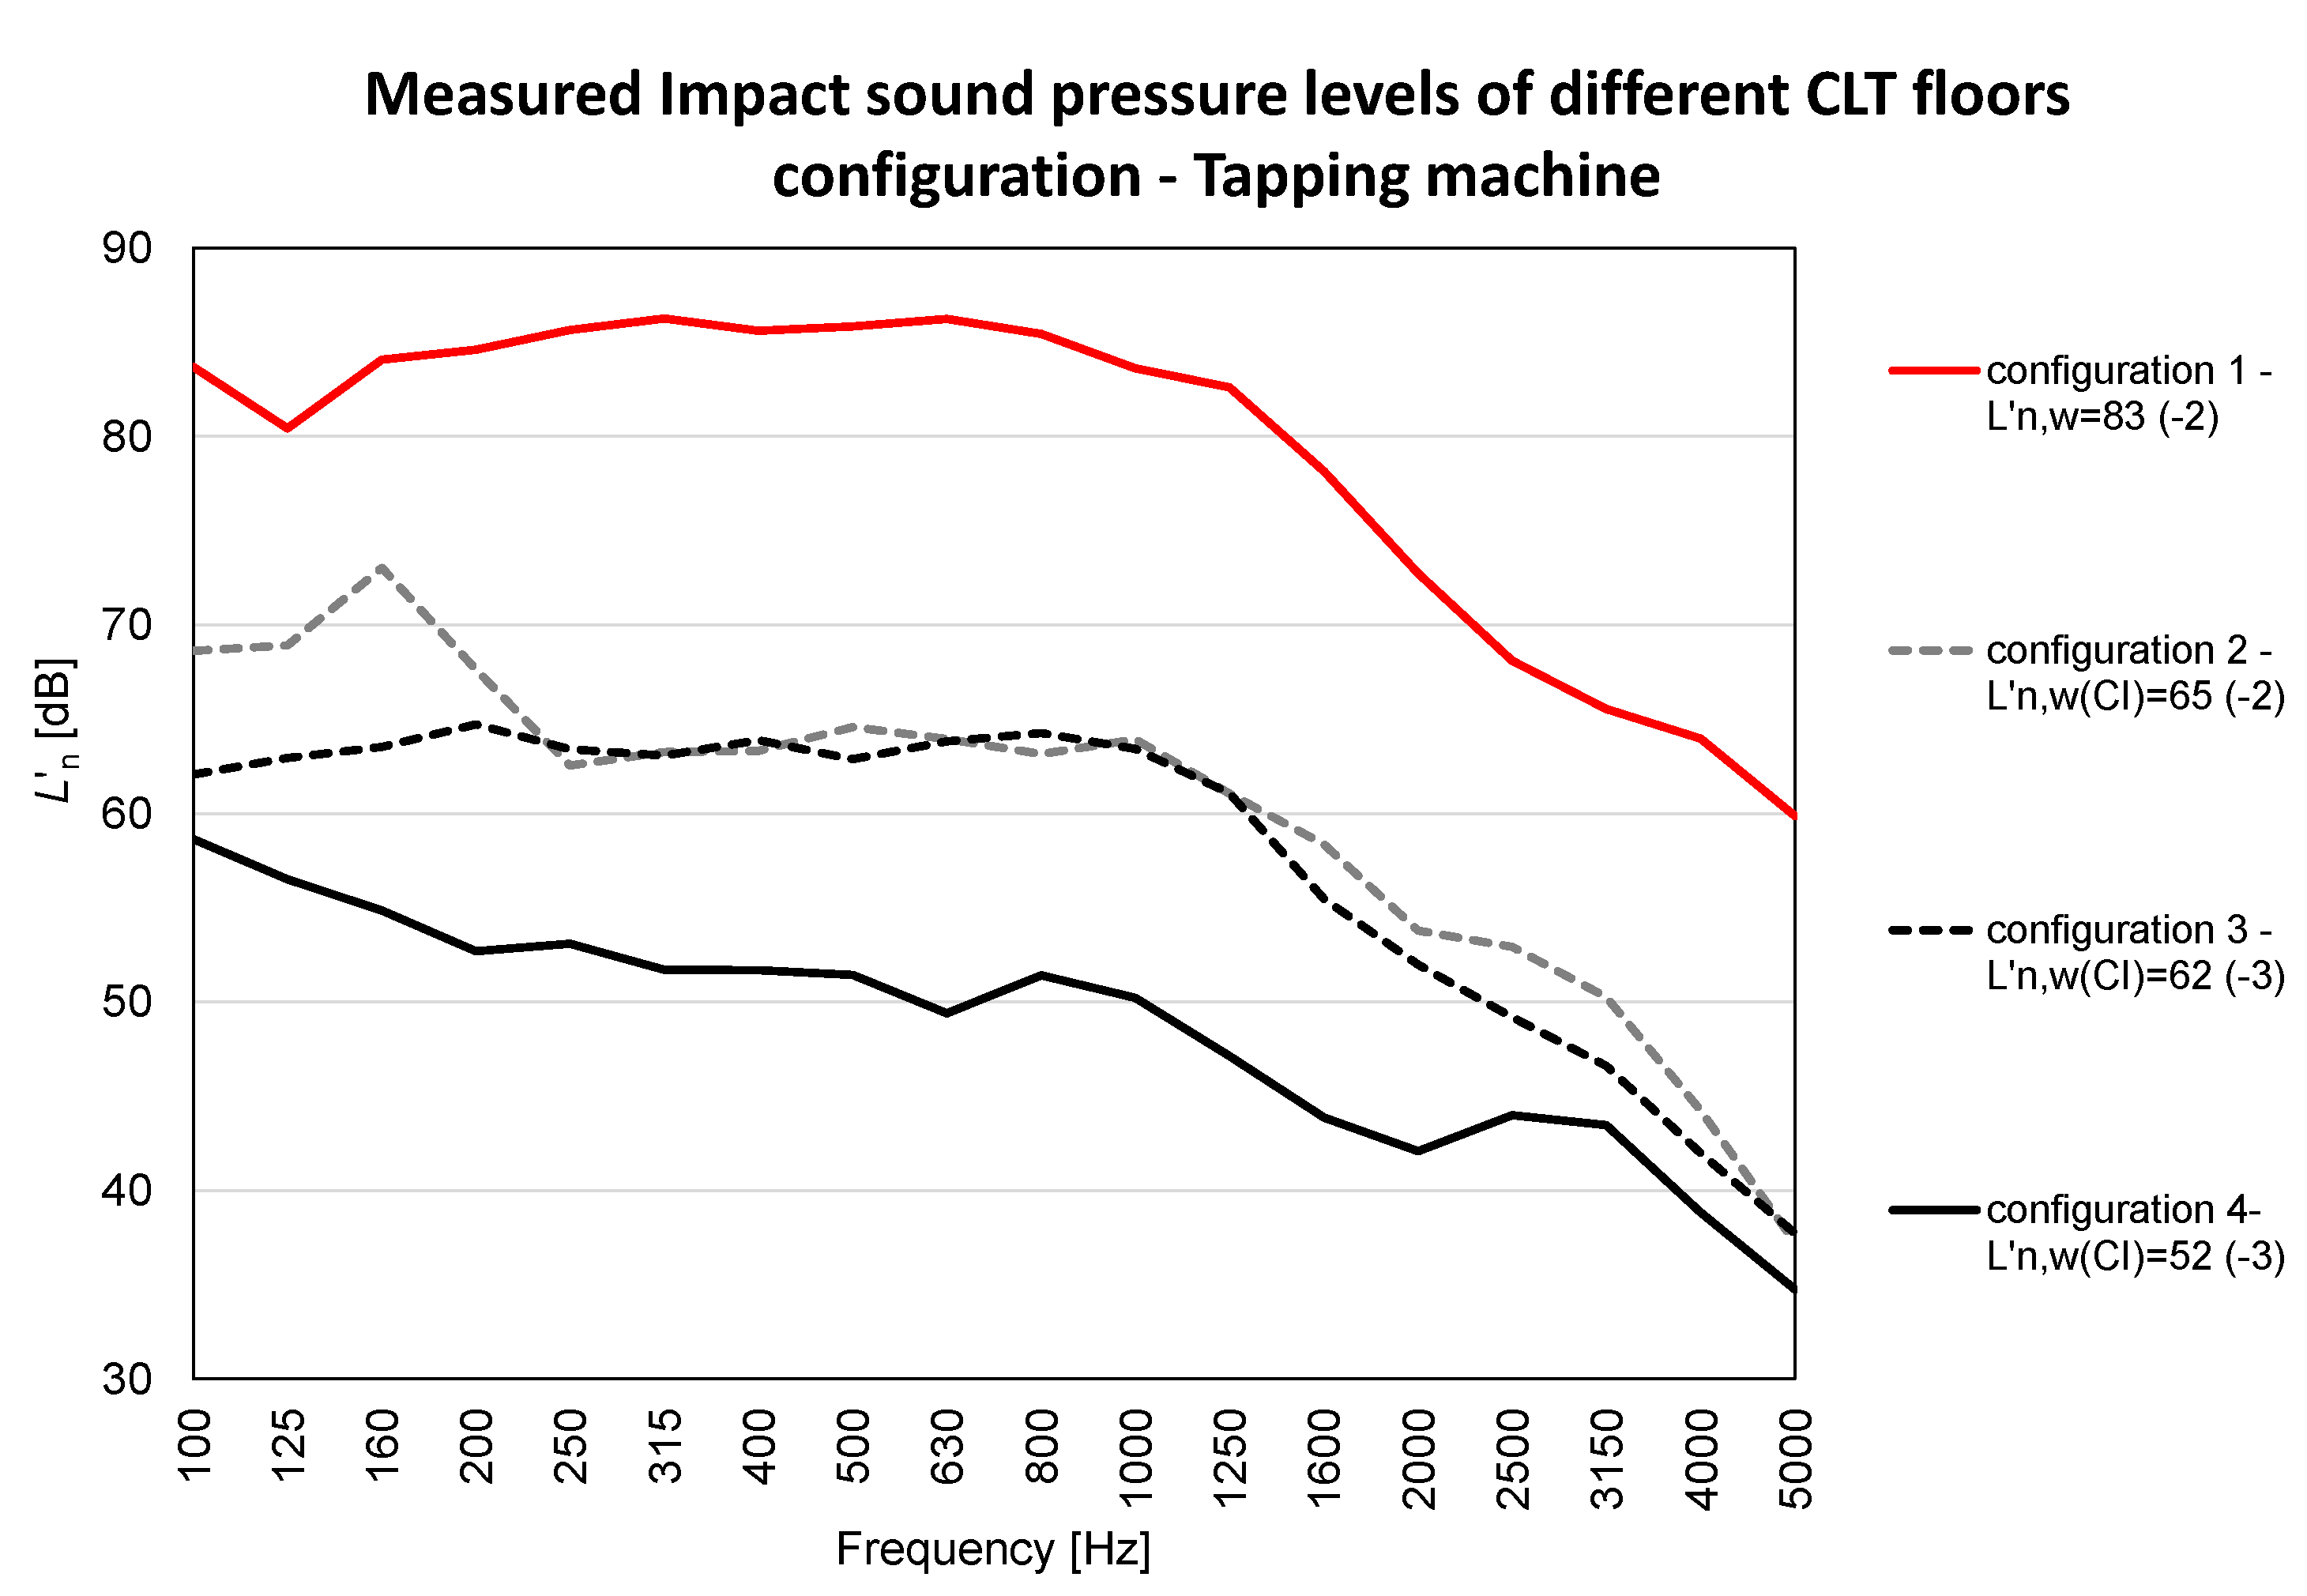
the impact noise reduction offered by suspended ceiling or floating floor excited by a tapping machine is very similar. Regression equations demonstrate that frequencies do not play a significant role; the same consideration is possible even when considering both these techniques at the same time.
-
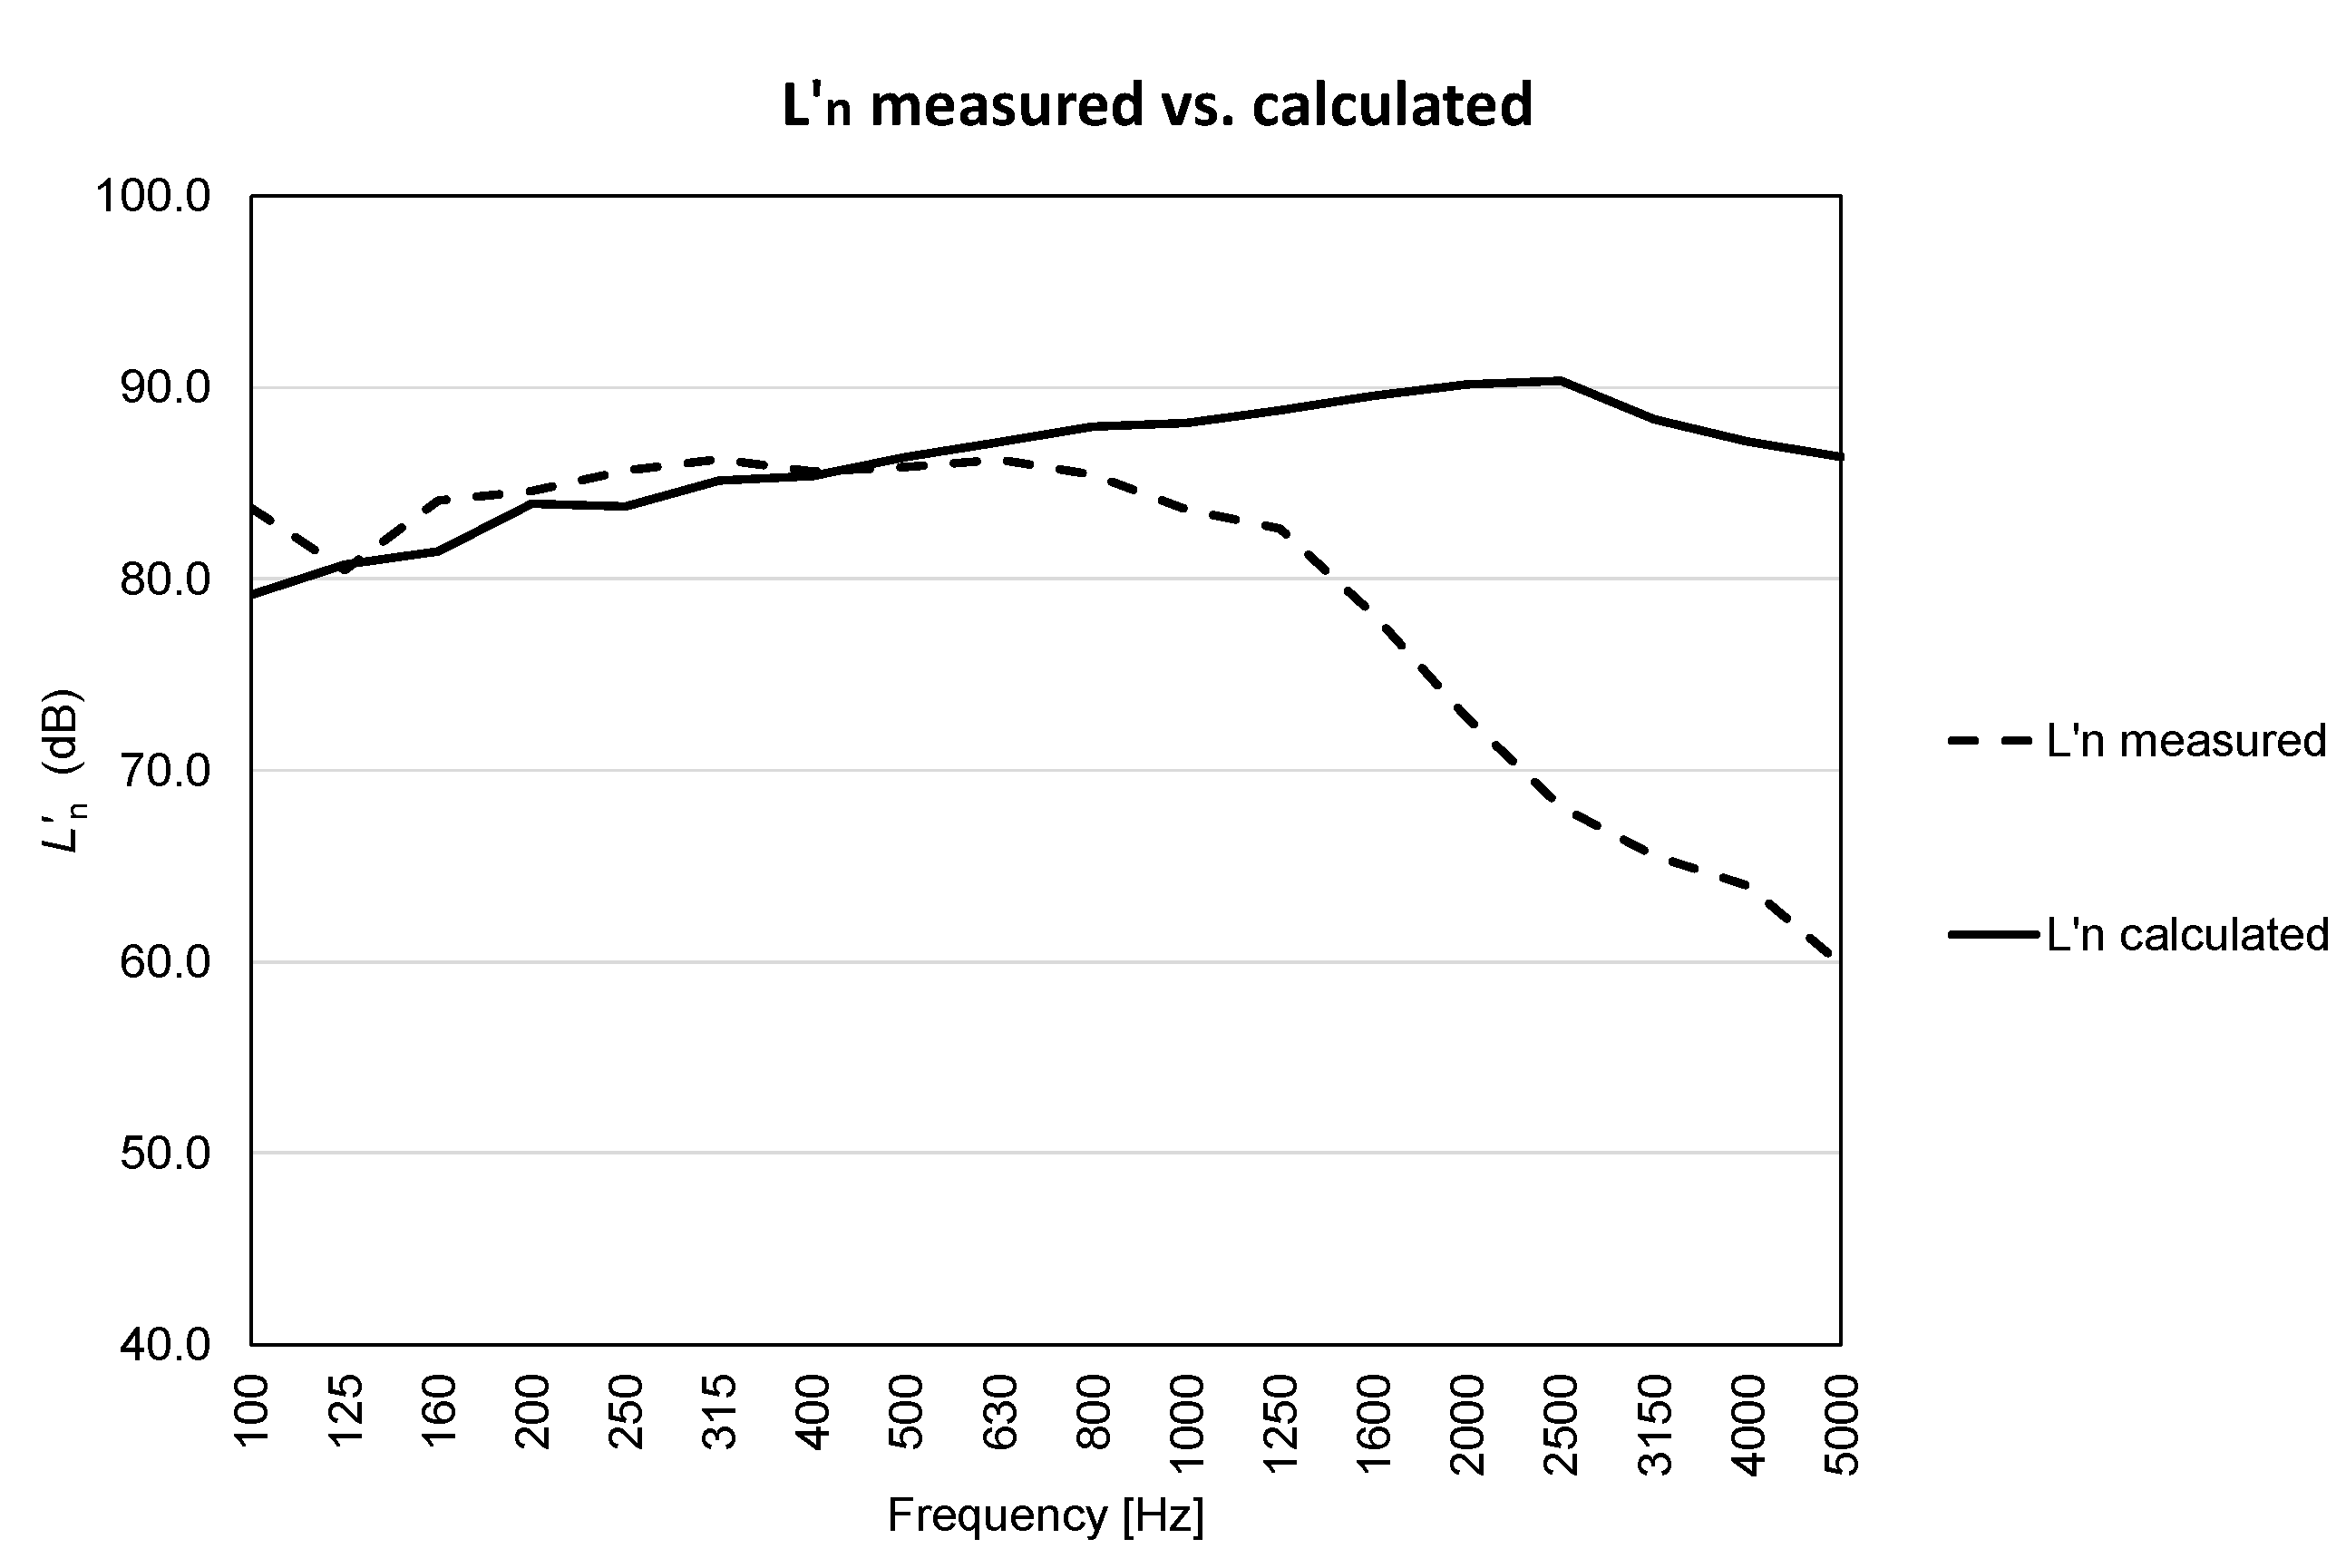
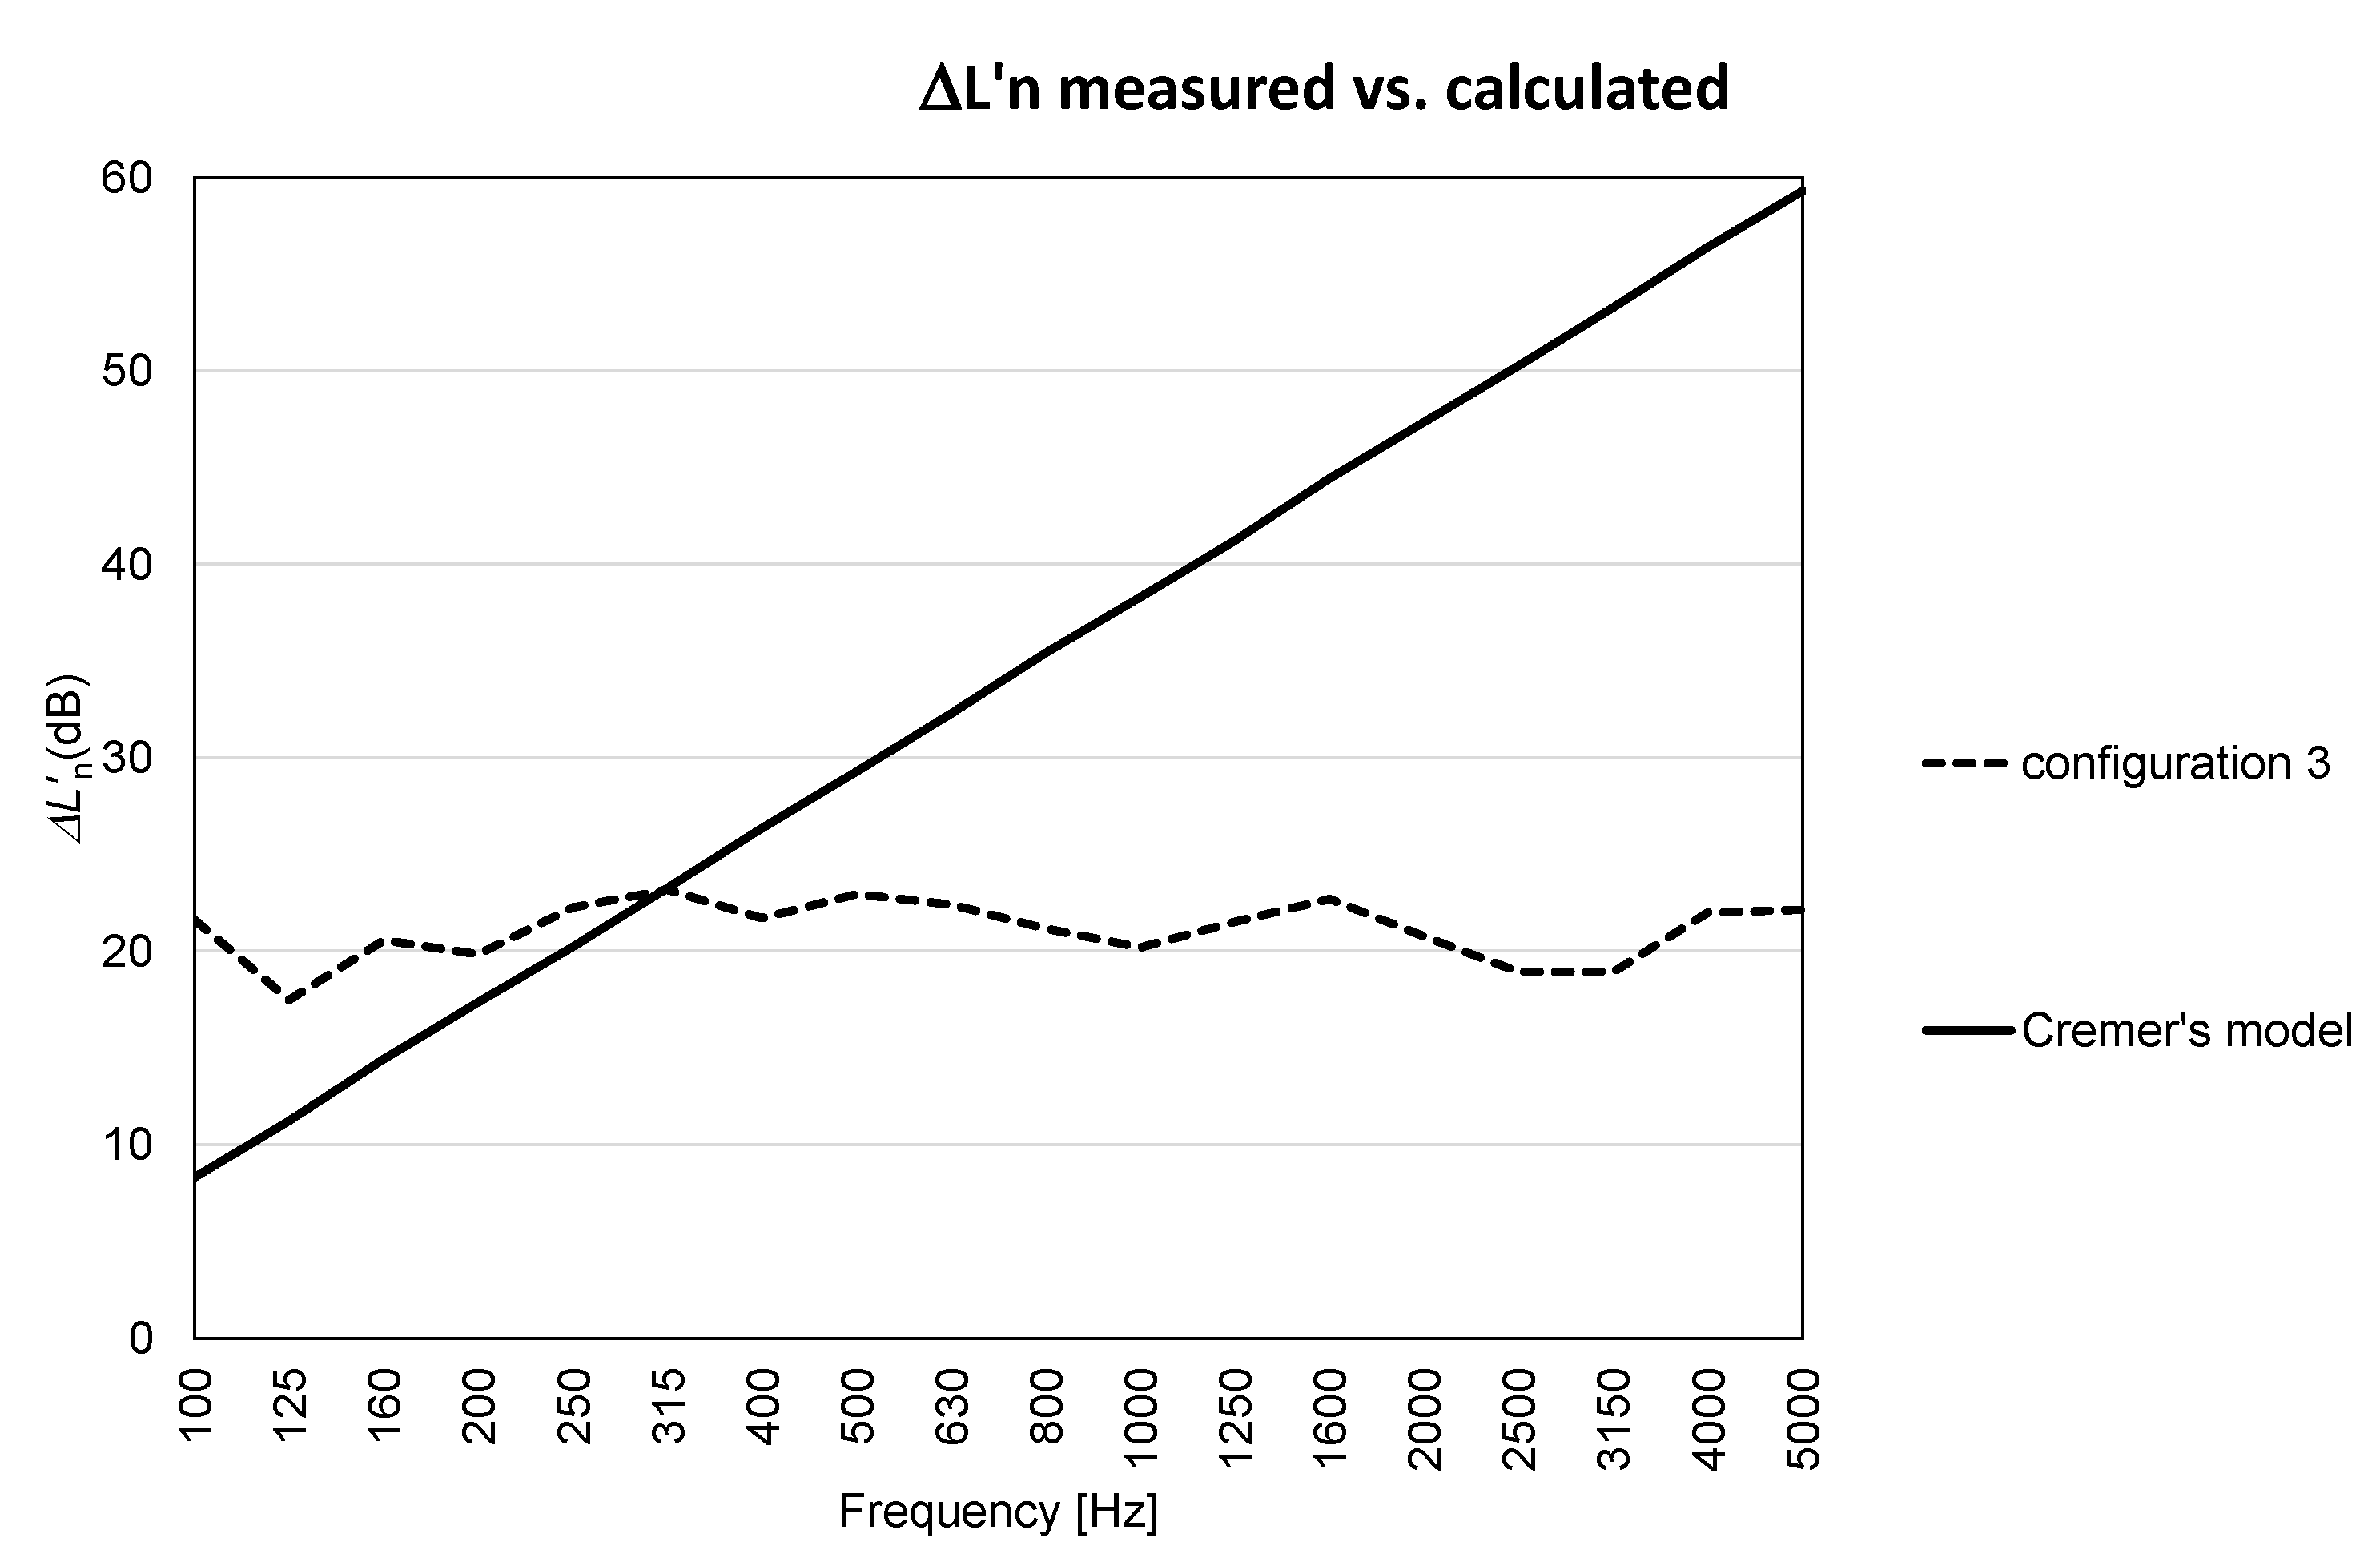
the Cremer’s equation does not work with this structure. In particular, for middle-low frequency, Cremer’s law fails by a large amount.
-
when excited by a rubber ball, a suspended ceiling acts better than the floating floor, especially at low frequencies. The floating floor presents a linear-decreasing trend, which anyway is not able to reduce efficiently the impulse injected by the rubber ball;
-
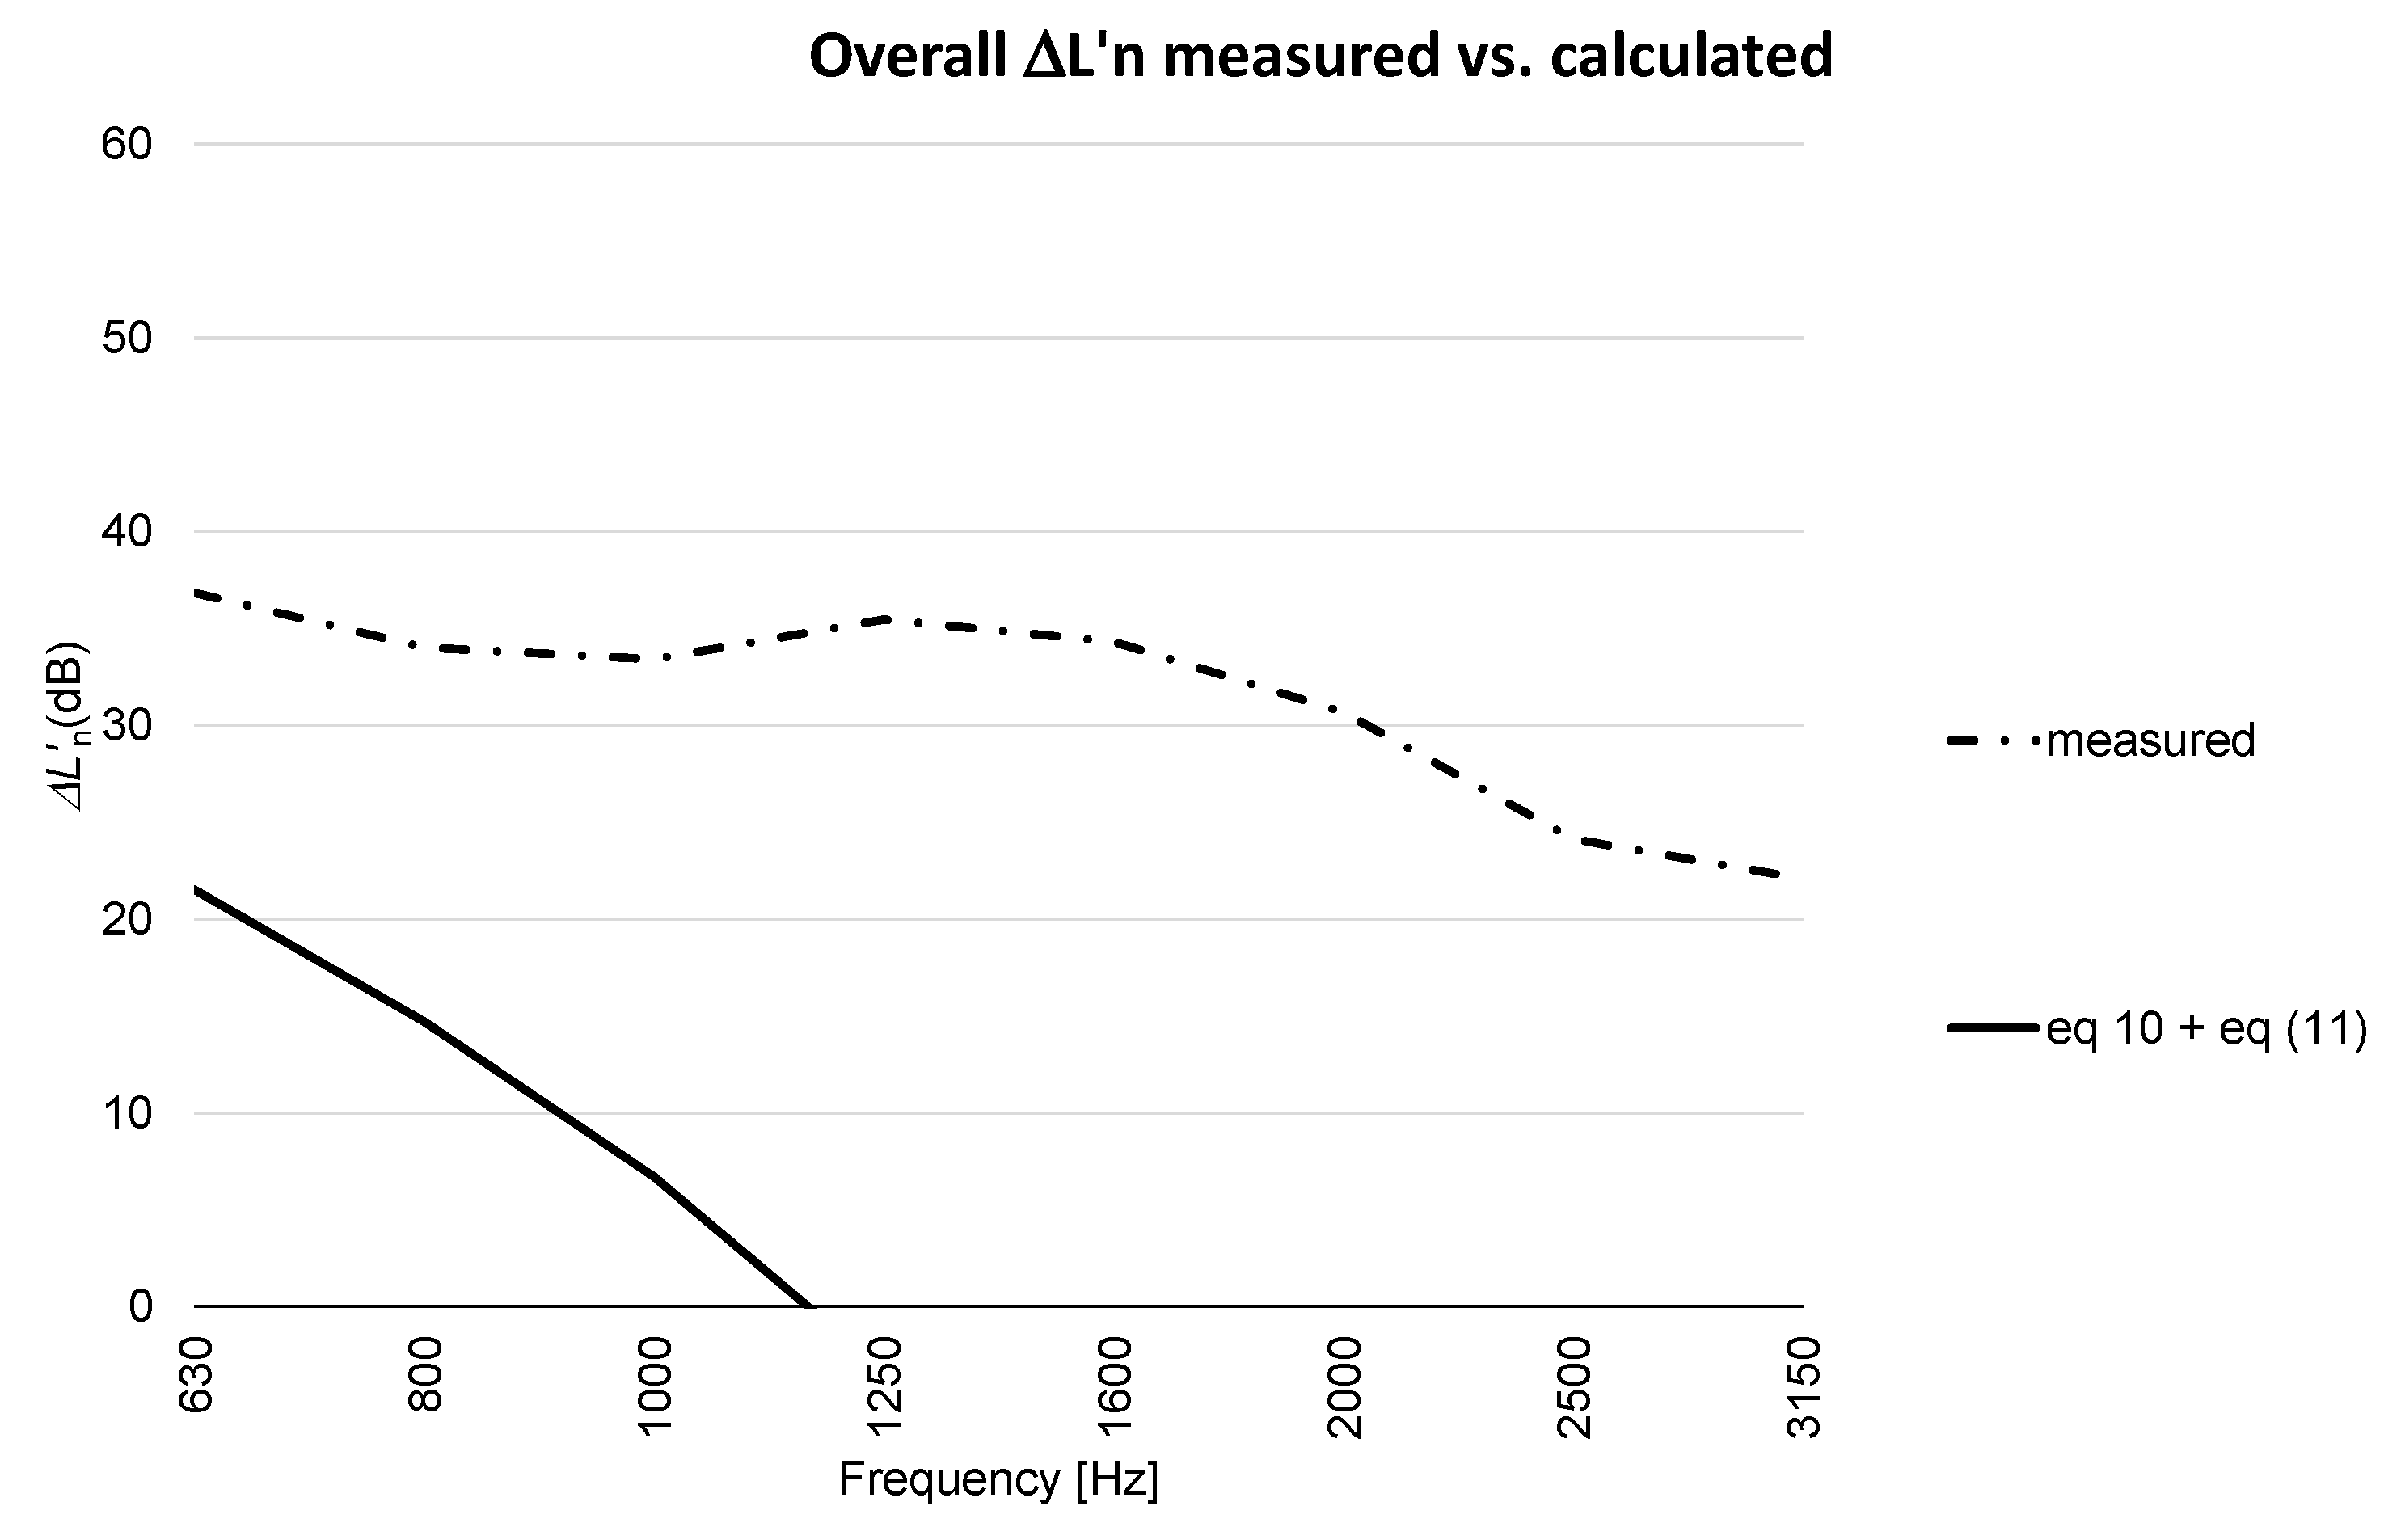
in the case of airborne sound insulation, both floating floor and suspended ceiling offer similar improvements. When merging the two technologies, no significant performance increasing is assessed. In this case, no analytical model was found to correctly predict the final results.

Author Contributions

F.B. and M.C. developed the research. F.B. and M.C. defined the methods and comparisons. F.B and M.C. studied and analyzed typical wooden structure. F.B. and M.C. performed acoustic measurements. M.C. and F.B. collected data and analyses results. M.C. and A.G. overviewed and supervised the research. M.C. and F.B. wrote the paper. All authors edited and proofread the paper. All authors have read and agreed to the published version of the manuscript.

Funding

This work was developed within the Interreg Project BIGWOOD, Interreg V-A Italy-Austria 2014–2020 (code ITAT 1081 CUP: I54I18000300006), which is gratefully acknowledged. This work was supported by the Open Access Publishing Fund of the Free University of Bozen-Bolzano.

Acknowledgments

Authors would like to really thank Ater Trieste for their precious help in this research and specifically Andrea Zeriali.

Conflicts of Interest

The authors declare that they have no known competing financial interests or personal relationships that could have appeared to influence the work reported in this paper.

References

  1. Ramage, M.H.; Burridge, H.; Busse-Wicher, M.; Fereday, G.; Reynolds, T.; Shah, D.U.; Wu, G.; Yu, L.; Fleming, P.; Densley-Tingley, D.; et al. The Wood from the Trees: The Use of Timber in Construction. Renew. Sustain. Energy Rev. 2017, 68, 333–359. [Google Scholar] [CrossRef]
  2. Frangi, A.; Fontana, M.; Knobloch, M. Fire Design Concepts for Tall Timber Buildings. Struct. Eng. Int. 2008, 18, 148–155. [Google Scholar] [CrossRef]
  3. Kuzman, M.K.; Sandberg, D. A New Era for Multi-Storey Timber Buildings in Europe; Forest Products Society: Portlan, OR, USA, 2016. [Google Scholar]
  4. Smith, I.; Frangi, A. Overview of Design Issues for Tall Timber Buildings. Struct. Eng. Int. 2008, 18, 141–147. [Google Scholar] [CrossRef]
  5. Kaiser, A.; Larsson, M.; Girhammar, U.A. From File to Factory: Innovative Design Solutions for Multi-Storey Timber Buildings Applied to Project Zembla in Kalmar, Sweden. Front. Archit. Res. 2019, 8, 1–16. [Google Scholar] [CrossRef]
  6. Kuzmanovska, I.; Gasparri, E.; Monné, D.T.; Aitchison, M. Tall Timber Buildings: Emerging Trends and Typologies. In Proceedings of the WTCE 2018, Seoul, Korea, 20–23 August 2018. [Google Scholar]
  7. Mayo, J. Solid Wood: Case Studies in Mass Timber Architecture, Technology and Design; Routledge: England, UK, 2015; ISBN 978-1-317-58749-1. [Google Scholar]
  8. Asiz, A.; Smith, I. Connection System of Massive Timber Elements Used in Horizontal Slabs of Hybrid Tall Buildings. J. Struct. Eng. 2011, 137, 1390–1393. [Google Scholar] [CrossRef]
  9. Bolvardi, V.; Pei, S.; van de Lindt, J.W.; Dolan, J.D. Direct Displacement Design of Tall Cross Laminated Timber Platform Buildings with Inter-Story Isolation. Eng. Struct. 2018, 167, 740–749. [Google Scholar] [CrossRef]
  10. Di Bella, A.; Mitrovic, M. Acoustic Characteristics of Cross-Laminated Timber Systems. Sustainability 2020, 12, 5612. [Google Scholar] [CrossRef]
  11. Pérez, M.; Fuente, M. Acoustic Design through Predictive Methods in Cross Laminated Timber (CLT) Panel Structures for Buildings. In Proceedings of the Internoise, Innsbruck, Austria, 15–18 September 2013. [Google Scholar]
  12. Pagnoncelli, L.; Fuente, M. Cross-Laminated Timber System (CLT): Laboratory and in Situ Measurements of Airborne and Impact Sound Insulation. In Proceedings of the EuroRegio Conference, Porto, Portugal, 13–15 June 2016. [Google Scholar]
  13. Öqvist, R.; Ljunggren, F.; Ågren, A. On the Uncertainty of Building Acoustic Measurements—Case Study of a Cross-Laminated Timber Construction. Appl. Acoust. 2012, 73, 904–912. [Google Scholar] [CrossRef]
  14. Ljunggren, F.; Simmons, C.; Hagberg, K. Findings from the AkuLite Project: Correlation between Measured Vibro-Acoustic Parameters and Subjective Perception in Lightweight Buildings. In Proceedings of the Internoise, Innsbruck, Austria, 15–18 September 2013. [Google Scholar]
  15. Zhang, X.; Hu, X.; Gong, H.; Zhang, J.; Lv, Z.; Hong, W. Experimental Study on the Impact Sound Insulation of Cross Laminated Timber and Timber-Concrete Composite Floors. Appl. Acoust. 2020, 161, 107173. [Google Scholar] [CrossRef]
  16. Kim, K.-W.; Jeong, G.-C.; Yang, K.-S.; Sohn, J. Correlation between Dynamic Stiffness of Resilient Materials and Heavyweight Impact Sound Reduction Level. Build. Environ. 2009, 44, 1589–1600. [Google Scholar] [CrossRef]
  17. Fortini, M.; Granzotto, N.; Piana, E.A. Vibro-Acoustic Characterization of a Composite Structure Featuring an Innovative Phenolic Foam Core. Appl. Sci. 2019, 9, 1276. [Google Scholar] [CrossRef] [Green Version]
  18. Vardaxis, N.-G.; Bard, D.; Persson Waye, K. Review of Acoustic Comfort Evaluation in Dwellings—Part I: Associations of Acoustic Field Data to Subjective Responses from Building Surveys. Build. Acoust. 2018, 25, 151–170. [Google Scholar] [CrossRef] [Green Version]
  19. Vardaxis, N.-G.; Bard, D. Review of Acoustic Comfort Evaluation in Dwellings: Part II—Impact Sound Data Associated with Subjective Responses in Laboratory Tests. Build. Acoust. 2018, 25, 171–192. [Google Scholar] [CrossRef]
  20. Späh, M.; Hagberg, K.; Bartlomé, O.; Weber, L.; Leistner, P.; Liebl, A. Subjective and Objective Evaluation of Impact Noise Sources in Wooden Buildings. Build. Acoust. 2013, 20, 193–213. [Google Scholar] [CrossRef]
  21. Ågren, A.; Ljunggren, F.; Jarnerö, K.; Bolmsvik, Å. Flanking Transmission in Light Weight Timber Houses with Elastic Flanking Isolators. In Proceedings of the Internoise, New York, NY, USA, 19–22 September 2012. [Google Scholar]
  22. Mahn, J.; Müller-Trapet, M. Characterization of Laminated Timber Building Elements to Estimate Flanking Transmission. INTER-NOISE and NOISE-CON Congress and Conference Proceedings. Inst. Noise Control Eng. 2019, 259, 4170–4178. [Google Scholar]
  23. Ågren, A.; Ljunggren, F. In Situ Measured Flanking Transmission in Light Weight Timber Houses with Elastic Flanking Isolators: Part II. In Proceedings of the Internoise, Innsbruck, Austria, 15–18 September 2013. [Google Scholar]
  24. Rabold, A.; Hessinger, J. Flanking Transmission at Impact Sound Excitation—Calculation According to DIN 4109 and PrEN ISO 12354-2—INTER-NOISE and NOISE-CON Congress and Conference Proceedings. Inst. Noise Control Eng. 2016, 253, 4308–4317. [Google Scholar]
  25. Tronchin, L. Variability of Room Acoustic Parameters with Thermo-Hygrometric Conditions. Appl. Acoust. 2021, 177, 107933. [Google Scholar] [CrossRef]
  26. Herzog, T.; Natterer, J.; Schweitzer, R.; Volz, M.; Winter, W. Timber Construction Manual; Birkhäuser: Basel, Switzerland, 2012; ISBN 978-3-0346-1463-4. [Google Scholar]
  27. Östman, B.; Brandon, D.; Frantzich, H. Fire Safety Engineering in Timber Buildings. Fire Saf. J. 2017, 91, 11–20. [Google Scholar] [CrossRef] [Green Version]
  28. Cho, T. Vibro-Acoustic Characteristics of Floating Floor System: The Influence of Frequency-Matched Resonance on Low Frequency Impact Sound. J. Sound Vib. 2013, 332, 33–42. [Google Scholar] [CrossRef]
  29. Schiavi, A. Improvement of Impact Sound Insulation: A Constitutive Model for Floating Floors. Appl. Acoust. 2018, 129, 64–71. [Google Scholar] [CrossRef]
  30. ISO 16283-1:2014. Acoustics—Field Measurement of Sound Insulation in Buildings and of Building Elements—Part 1: Airborne Sound Insulation; ISO: Geneva, Switzerland, 2014. [Google Scholar]
  31. ISO 16283-2:2020. Acoustics—Field Measurement of Sound Insulation in Buildings and of Building Elements—Part 2: Impact Sound Insulation; ISO: Geneva, Switzerland, 2020. [Google Scholar]
  32. ISO 12354-2. Building Acoustics—Estimation of Acoustic Performance of Buildings from the Performance of Elements—Part 2: Impact Sound Insulation between Rooms; ISO: Geneva, Switzerland, 2017. [Google Scholar]
  33. Carl, H. Sound Insulation; Butterworth-Heinemann: Oxford, UK, 2007; 648p, ISBN 978-0-7506-6526-1. £55.99, [PDF Document]; Available online: https://fdocuments.in/document/sound-insulation-carl-hopkins-butterworth-heinemann-oxford-uk-2007-648.html (accessed on 18 May 2021).
  34. Cremer, L. Theorie Der Schalldämmung Dünner Wände Bei Schrägem Einfall. Akust Z 1942, 7, 81–104. [Google Scholar]
  35. Bies, D.A.; Hansen, C.H. Engineering Noise Control: Theory and Practice; Spon: London, UK, 1995; p. 745. [Google Scholar]
  36. Woo, S.-H.A. The Measurement of Transmission Loss and Absorption Coefficient of the Rat and Porcine Skin: Synthesizing Artificial Material for an Implantable Microphone Test. Appl. Acoust. 2013, 74, 1388–1393. [Google Scholar] [CrossRef]
  37. Hagberg, K.G. Evaluating Field Measurements of Impact Sound. Build. Acoust. 2010, 17, 105–128. [Google Scholar] [CrossRef]
  38. Hui, C.K.; Ng, C.F. New Floating Floor Design with Optimum Isolator Location. J. Sound Vib. 2007, 303, 221–238. [Google Scholar] [CrossRef]
  39. Rasmussen, B. Sound Insulation between Dwellings. Comparison of National Requirements in Europe and Interaction with Acoustic Classification Schemes. In Proc 23rd International Congress on Acoustics; Deutsche Gesellschaft für Akustik: Aachen, Germany, 2019. [Google Scholar]
Figure 1. Realization of the test-building.
Applsci 11 05938 g001
Figure 2. Pictures of the internal partition.
Applsci 11 05938 g002
Figure 3. Configuration 1: Bare floor.
Applsci 11 05938 g003
Figure 4. Configuration 2: Bare floor coupled with suspended ceiling.
Applsci 11 05938 g004
Figure 5. Configuration 3: Bare floor coupled with floating floor.
Applsci 11 05938 g005
Figure 6. Configuration 4: Bare floor coupled with floating floor and suspended ceiling.
Applsci 11 05938 g006
Figure 7. Tapping machine and rubber ball used to test the impact noise of CLT floors.
Applsci 11 05938 g007
Figure 8. In situ measurements of normalized impact sound pressure level (tapping machine) for four bare CLT floors (configuration 1).
Applsci 11 05938 g008
Figure 9. Measured vs. predicted impact noise.
Applsci 11 05938 g009
Figure 10. Impact sound pressure level for CLT floors (configurations 1, 2, 3, and 4). Source: tapping machine.
Applsci 11 05938 g010
Figure 11. Comparison between Cremer’s and measured Δ L n , w for configuration 3.
Applsci 11 05938 g011
Figure 12. Measured vs. calculated Δ L n , w .
Applsci 11 05938 g012
Figure 13. Impact sound pressure level for CLT floors (configurations 1, 2, 3, and 4). Source: rubber ball.
Applsci 11 05938 g013
Figure 14. Airborne sound insulation for CLT floors (configurations 1, 2, 3, and 4).
Applsci 11 05938 g014
Table 1. Floor elements description.
ElementThickness d [mm]Density ρ [kg/m3]Dynamic Stiffness s′ [Mn/m3]
Screed401150-
Resilient layer970011
Screed100400-
Waterproof membrane0.233-
CLT floor panel.180470-
Air layer621-
Rock wool panel6070-
Gypsum board1.25730-
Table 2. Impact force exposure level octave band of the rubber ball [32].
Octave Band Centre Frequency
[Hz]
Impact Force Exposure Level, LFE
(dB re 1 N)
31.539.0 ± 1.0
6331.0 ± 1.5
12523.0 ± 1.5
25017.0 ± 2.0
50012.5 ± 2.0
Table 3. Average trend and standard deviation of averaged impact sound pressure levels (tapping machine).
Frequency [Hz]IMPACT Noise Average (dB)Standard Deviation (dB)
10083.73.2
12580.43.7
16084.13.0
20084.62.9
25085.72.6
31586.22.5
40085.62.5
50085.82.3
63086.22.1
80085.41.8
100083.61.7
125082.61.7
160078.21.6
200072.71.7
250068.11.9
315065.53.3
400064.04.2
500059.94.4
Table 4. Average trend and difference between measured and calculated values (Δ).
Frequency [Hz]Impact Noise Average (dB)Δ (dB)
10083.74.6
12580.4−0.3
16084.12.7
20084.60.7
25085.71.9
31586.21.1
40085.60.2
50085.8−0.5
63086.2−0.9
80085.4−2.5
100083.6−4.5
125082.6−6.2
160078.2−11.4
200072.7−17.4
250068.1−22.2
315065.5−22.8
400064.0−23.2
500059.9−26.5
Table 5. Calculated sound insulation values, using Sharp’s theory. Δn represents the difference between the measured and calculated results.
Configuration and Difference (dB)
Frequency [Hz]1Δ12Δ23Δ34Δ4
10031.9−4.333.2−1.238.4−7.238.8−3.0
12533.8−6.635.21.240.3−2.240.84.1
16036.0−6.837.3−1.142.52.342.93.2
20037.9−11.439.20.544.4−4.344.82.8
25039.8−13.041.22.846.3−2.246.82.5
31541.9−14.643.23.748.3−1.648.80.6
40043.9−16.545.33.550.4−2.350.9−0.5
50045.9−15.347.21.752.4−4.652.8−2.4
63047.9−14.749.20.054.4−5.854.8−4.8
80049.9−16.451.32.256.4−6.956.9−5.8
100051.9−16.553.2−2.158.4−8.258.8−6.8
125053.8−14.355.20.060.3−9.260.8−8.0
160056.0−14.057.3−3.862.5−8.862.9−9.5
200057.9−13.759.2−3.064.4−8.264.8−9.6
250059.8−15.261.2−6.566.3−10.366.8−11.1
315061.9−17.963.2−8.168.3−10.368.8−12.5
400063.9−18.965.3−8.470.4−11.470.9−13.8
500065.9−19.867.2−9.872.4−12.472.8−15.0
Table 6. Impact noise and airborne sound insulation weighted index results for each configuration.
ConfigurationL′n,w (dB)L′iA,Fmax,50–630 (dB)L′iA,Fmax,20–2500 (dB)R′ (dB)
183808035
265555652
Δ218252417
362596051
Δ321212016
452293153
Δ431514918
Publisher’s Note: MDPI stays neutral with regard to jurisdictional claims in published maps and institutional affiliations.

