Featured Application
Solid Electrolyte Cells for Energy Conversion.
Abstract
Ceramics samples with the nominal composition [(ZrO2)0.95(Y2O3)0.05]1-x[PrOy]x and praseodymia contents of x = 0.05–0.15 were prepared by the direct firing of compacted 5YSZ + PrOy mixtures at 1450–1550 °C for 1–9 h and characterized for prospective applicability in reversible solid oxide cells. XRD and SEM/EDS analysis revealed that the dissolution of praseodymium oxide in 5YSZ occurs via the formation of pyrochlore-type Pr2Zr2O7 intermediate. Increasing PrOy additions results in a larger fraction of low-conducting pyrochlore phase and larger porosity, which limit the total electrical conductivity to 2.0–4.6 S/m at 900 °C and 0.28–0.68 S/m at 700 °C in air. A longer time and higher temperature of firing promotes the phase and microstructural homogenization of the ceramics but with comparatively low effect on density and conductivity. High-temperature processing leads to the prevailing 3+ oxidation state of praseodymium cations in fluorite and pyrochlore structures. The fraction of Pr4+ at 600–1000 °C in air is ≤2% and is nearly independent of temperature. 5YSZ ceramics with praseodymia additions remain predominantly oxygen ionic conductors, with p-type electronic contribution increasing with Pr content but not exceeding 2% for x = 0.15 at 700–900 °C. The average thermal expansion coefficients of prepared ceramics are in the range of 10.4–10.7 ppm/K.
1. Introduction
Limited fossil fuel reserves and growing environmental concerns push forward the development of alternative energy technologies based on renewable sources—wind, solar, biomass, and others. Daily and seasonal fluctuations in the availability of renewable energy and the corresponding gaps between demand and supply reveal a key role of energy storage in the integration of renewable energy into the electrical grid and off-grid applications. One of the most promising energy conversion and storage technologies enabling the efficient utilization of renewable energy is electrochemical solid electrolyte cells. While the solid oxide electrolysis cell (SOEC) may utilize electrical energy supplied by a renewable source to split water and generate hydrogen as energy storage or fuel, the solid oxide fuel cell (SOFC) converts chemical energy stored in the form of hydrogen back to electricity on demand [1,2,3,4,5]. The most common components of both types of cells include yttria-stabilized zirconia (YSZ) solid electrolyte, composite Ni–YSZ fuel electrode, and ceramic perovskite-like oxygen electrode. If properly designed, the cell may operate alternately in fuel cell and electrolyzer regimes (reversible solid oxide cell or rSOC) [6].
The SOEC technology is currently at moderate TRL (technology readiness level), and long-term degradation remains one of the main challenges obstructing the widespread adoption of solid oxide electrolysis cells as practical hydrogen generation systems. A specific degradation mechanism in SOEC relates to delamination of the oxygen electrode and accompanying processes occurring at the electrolyte/oxygen electrode interface [3,7,8,9]. The mechanisms of delamination were studied for LSM (La1-xSrxMnO3-δ), LSFC (La1-xSrxFe1-yCoyO3-δ), and other perovskite-type oxygen electrodes. The common view is that high oxygen partial pressure buildup within the pores, grain boundaries and other defects in the near-interface electrolyte layer and also at the electrode/electrolyte interface under anodic polarization results in intergranular fractures in the electrolyte surface layer and cracking and delamination at the electrode/electrolyte interface [7,8,9]. These irreversible degradation processes are contributed or promoted by the interdiffusion of cations with the formation of undesired phases at the interface, insufficient ionic conductivity, and, consequently, the electrochemical activity of the oxygen electrode, and other factors.
The electrochemical studies of rSOCs operation revealed that the degradation occurring at the electrolyte/oxygen electrode interface can be slowed down if a cell operates in a reversible SOEC/SOFC regime and that the degradation occurring in the SOEC regime may be partially recovered during the operation in SOFC mode if the cycles duration does not exceed a certain limit [8,9,10]. Although further long-term studies and fundamental understanding of this phenomenon are still required, the experimental observations raise prospects to halt degradation and to develop self-healing approaches based on reversible SOEC/SOFC cycles [11]. One possible approach may be based on the introduction of redox-active components with oxygen storage capacity in the form of inclusions into the surface layer of solid electrolyte or as a thin buffer layer at the electrode/electrolyte interface capable of oxygen uptake under anodic polarization to prevent oxygen pressure build-up and reverting to oxygen loss in fuel cell mode. To enhance the chemical and thermomechanical compatibility, these components can be based on zirconia co-substituted by yttrium and variable-valence cations such as manganese [12,13,14,15] or praseodymium.
Praseodymium oxide exhibits rich redox chemistry under oxidizing conditions. The average oxidation state of praseodymium cations in PrOy at atmospheric oxygen pressure varies between 3.67+ in Pr6O11 at temperatures below ~350 °C to 3+ in Pr2O3 above 1300 °C [16,17,18]. Under equilibrium conditions at elevated temperatures (>1500 °C), praseodymium substitutes into the zirconia lattice with the formation of solid solutions based on monoclinic ZrO2, cubic ZrO2 and pyrochlore-type Pr2Zr2O7 [19,20,21,22]. Increasing the praseodymium content in (ZrO2)1-x(PrOy)x was reported to enhance ionic conductivity, with a maximum observed at x = 0.25, and to increase p-type electronic conductivity [23,24]. The compositions containing 9–40 mol.% of PrOy were found to be predominantly oxygen ionic conductors with an ionic contribution to the total conductivity of ≥80% [23,24]. Metastable cubic fluorite-type ZrO2–PrOy solid solutions can also be prepared at moderate temperatures. Narula et al. [25] reported that fluorite-type Zr1-xPrxO2-δ (x = 0.25, 0.50, 0.75) prepared by sol-gel processing retains a single-phase fluorite structure at temperatures ≤ 900 °C in air. Bellakki et al. [26] claimed the formation of the entire range of nanocrystalline Zr1-xPrxO2-δ solid solutions with a cubic fluorite structure by combustion synthesis. In both cases, temperature-programmed reduction studies confirmed that the oxygen storage capacity of solid solutions increases with increasing Pr content.
Available data on ternary ZrO2–Y2O3–PrOy solid solutions and praseodymium substitutions into YSZ are limited. Hereafter, the conventional abbreviation nYSZ is used to refer to n mol.% yttria-stabilized zirconia, e.g., 8YSZ corresponds to (ZrO2)0.92(Y2O3)0.08. The formation of a solid solution with a cubic fluorite-type structure at 1600 °C was confirmed for (ZrO2)0.82(Y2O3)0.04(Pr2O3)0.05 [27]. The solubility of praseodymia was reported to be up to at least x ~ 0.22 in (6YSZ)1-x(PrOy)x and to be limited to x ~ 0.20 for (8.7YSZ)1-x(PrOy)x at 1650 °C [28,29]. As for binary solid solutions, doping by praseodymium into YSZ was found to introduce p-type electronic conductivity [28].
The present work is focused on the assessment of thermal treatment conditions and praseodymia contents on the properties of ZrO2–Y2O3–PrOy mixed oxides for prospective applicability as redox-active inclusions or buffer layers at the electrolyte/oxygen electrode interface of solid electrolyte cells. The preparation method relied on the direct firing of simple powder mixtures of 5 mol.% yttria partially stabilized zirconia (5YSZ) and praseodymium oxide to assess the conditions for the facile processing of solid oxide cell components. As the excessive concentration of lower-valence dopants typically results in a decline in ionic conductivity in fluorite-type zirconia-based solutions due to point defect association [30], 5YSZ was selected as a starting material with a somewhat lower yttria content compared to conventional 8YSZ. The emphasis in this work was on the effect of PrOy content and direct firing conditions (temperature and time) on properties relevant for the application including phase composition, ionic and electronic transport properties, Pr oxidation state and associated redox behavior, and thermomechanical compatibility with 8YSZ in terms of thermal expansion.
2. Materials and Methods
The nominal compositions were formulated as [(ZrO2)0.95(Y2O3)0.05]1-x[PrOy]x with x varying between 0.05 and 0.15. Table 1 lists the nominal cation compositions recalculated to give the fractions of binary oxides and the cation ratio in the fluorite-type AO2 formula unit. The samples were prepared using 5 mol.% yttria partially stabilized zirconia (5YSZ, Innovnano, Portugal, d50 = 500 nm) and praseodymium oxide Pr6O11 (Alfa Aesar, 99.5% purity). Praseodymium oxide was preliminarily annealed at 1000 °C for 2 h to remove adsorbates and slowly cooled (2 °C/min) down to room temperature. The powders of initial reagents were mixed in the appropriate proportions and ball-milled with ethanol for 4 h at 150 rpm using nylon containers, Tosoh tetragonal zirconia milling media and Retsch S1 planetary mill. After drying the milled powders, green disk-shaped samples (∅ 18 mm, thickness ~ 1.5 mm) were compacted by uniaxial pressing at 40 MPa. The generic firing schedule included controlled heating/cooling at 5 °C/min with the firing temperature Tf in the range 1450–1550 °C and the firing time tf in the range 1–9 h. The experimental plan was designed employing the Taguchi method [31] and is detailed in Table 2. The firing of samples was done using alumina plates as supports covered with alumina cups; each sample was placed on a bed of powder of identical cation composition. Dense 5YSZ and 8YSZ ceramics samples for comparative studies were prepared using commercial powders (5YSZ, Innovnano, Portugal, and 8YSZ, Tosoh, Japan) and sintered at 1600 °C for 10 h.

Table 1.
Nominal cation compositions of prepared Pr-substituted [(ZrO2)0.95(Y2O3)0.05]1-x[PrOy]x ceramics.
Table 2.
Taguchi planning of firing conditions and Pr contents in [(ZrO2)0.95(Y2O3)0.05]1-x[PrOy]x ceramics.
Sintered ceramics samples were polished and cut into rectangular bars for electrical and dilatometric measurements. The density of prepared ceramics (ρexp) was calculated from the geometric dimensions and mass of polished samples. Powdered samples for X-ray diffraction (XRD) and thermogravimetric analysis (TGA) were prepared by grinding sintered ceramics in a mortar.
XRD patterns were recorded at room temperature on a Rigaku D/Max-B diffractometer (CuKα radiation) and a PANalytical X’Pert PRO MRD diffractometer (CuKα radiation). Microstructural studies were done by scanning electron microscopy (SEM, Hitachi SU-70 microscope) coupled with energy dispersive spectroscopy (EDS, Bruker Quantax 400 detector). TGA was carried out using Setaram SetSys 16/18 instrument (sensitivity 0.4 µg, initial sample weight ~ 0.55 g) on heating/cooling at 2 °C/min in flowing air or isothermally on redox cycling between air and 10%H2–N2 atmosphere. The thermochemical expansion was measured employing a vertical Linseis L75 dilatometer in flowing air or 10%H2–N2 mixture with a constant heating/cooling rate of 3 °C/min.
The electrical conductivity (σ) was determined by AC impedance spectroscopy (Agilent 4284A precision LCR meter, frequency range 20 Hz–1 MHz) using bar-shaped ceramic samples with applied porous Pt electrodes (Heraeus CL-11-5349 platinum paste, sintering at 1000 °C for 30 min). The conductivity was calculated as σ = L/(A × R) where L and A are the length and cross-sectional area of the sample, respectively, and R is the total ohmic resistance of the sample extracted from the impedance spectroscopy data. The measurements were done in air in the temperature range 500–1050 °C in a stepwise cooling regime (25° step, with ≥20 min equilibration at each step) or isothermally on redox cycling between air and 10%H2–N2 atmosphere at 900 °C. The average oxygen ion transference numbers () under air/O2 gradients were determined at 700–900 °C by the electromotive force (EMF) technique modified to take the electrode polarization into account (Gorelov’s modification [32,33,34]). In the classical EMF method, the average of oxide sample with negligible electrode polarization resistance is obtained as a ratio of measured EMF (Eexp) and theoretical Nernst voltage (Etheor) of concentration cell:
where RO and Re are the partial oxygen ionic and electronic resistance of the sample, respectively. Non-negligible electrode polarization (Rη) leads to underestimated values. Gorelov’s modification [32,33,34] is based on the measurement of EMF of the cell as a function of external resistance (RM) closing the circuit. In this case, the system is described by:
The true value can be obtained by linear regression of collected experimental data using the model:
where A and B are the regression parameters, their ratio gives partial electronic resistance Re = A/B, and the following applies:
where Rtotal is the total ohmic resistance of the sample determined by AC impedance spectroscopy. The gas-tightness of disk-shaped ceramic samples used for the EMF measurements was verified by the absence of physical leakages under the total pressure gradient of 2–3 atm at room temperature. The samples were hermetically sealed onto tubular YSZ measuring cell using G018-281 glass (Schott, Mainz, Germany) in the form of tape-casted glass rings and a glass paste (a mixture of glass powder with terpineol and ethyl cellulose).
Oxygen partial pressure p(O2) during the experiments in controlled atmospheres was monitored using YSZ potentiometric sensors. A representative p(O2) value in 10%H2–N2 atmosphere at 900 °C was 3 × 10⁻²⁰ atm.
3. Results and Discussion
3.1. Evolution of Phase Composition and Microstructure
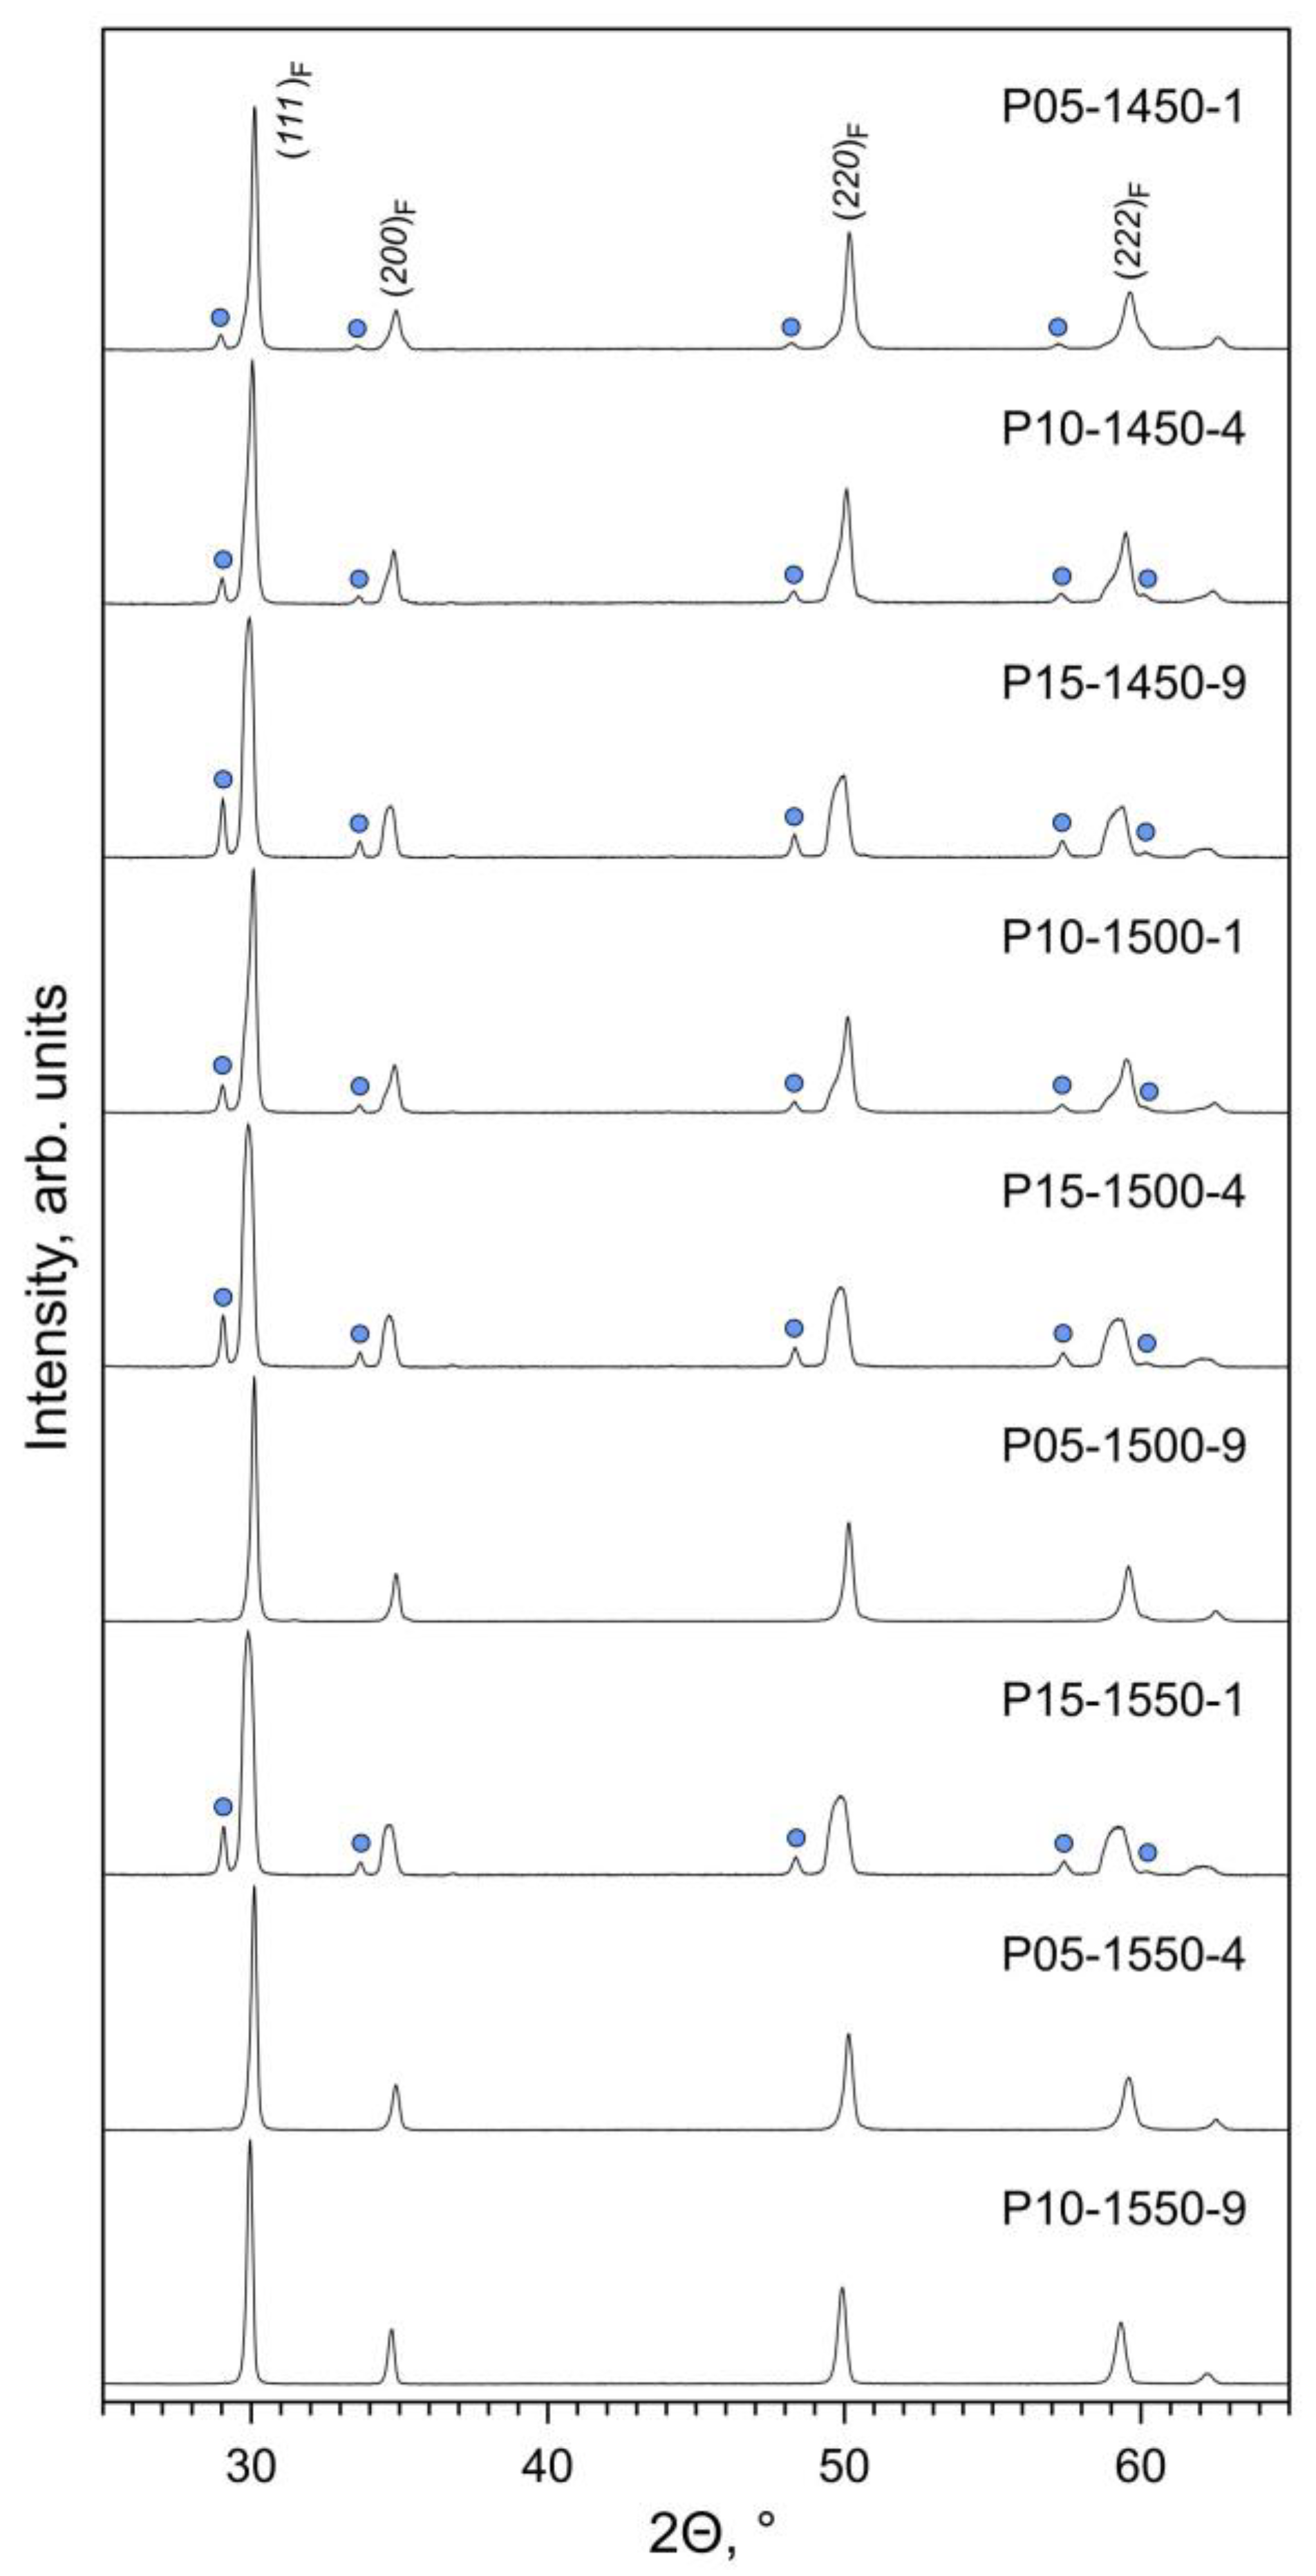
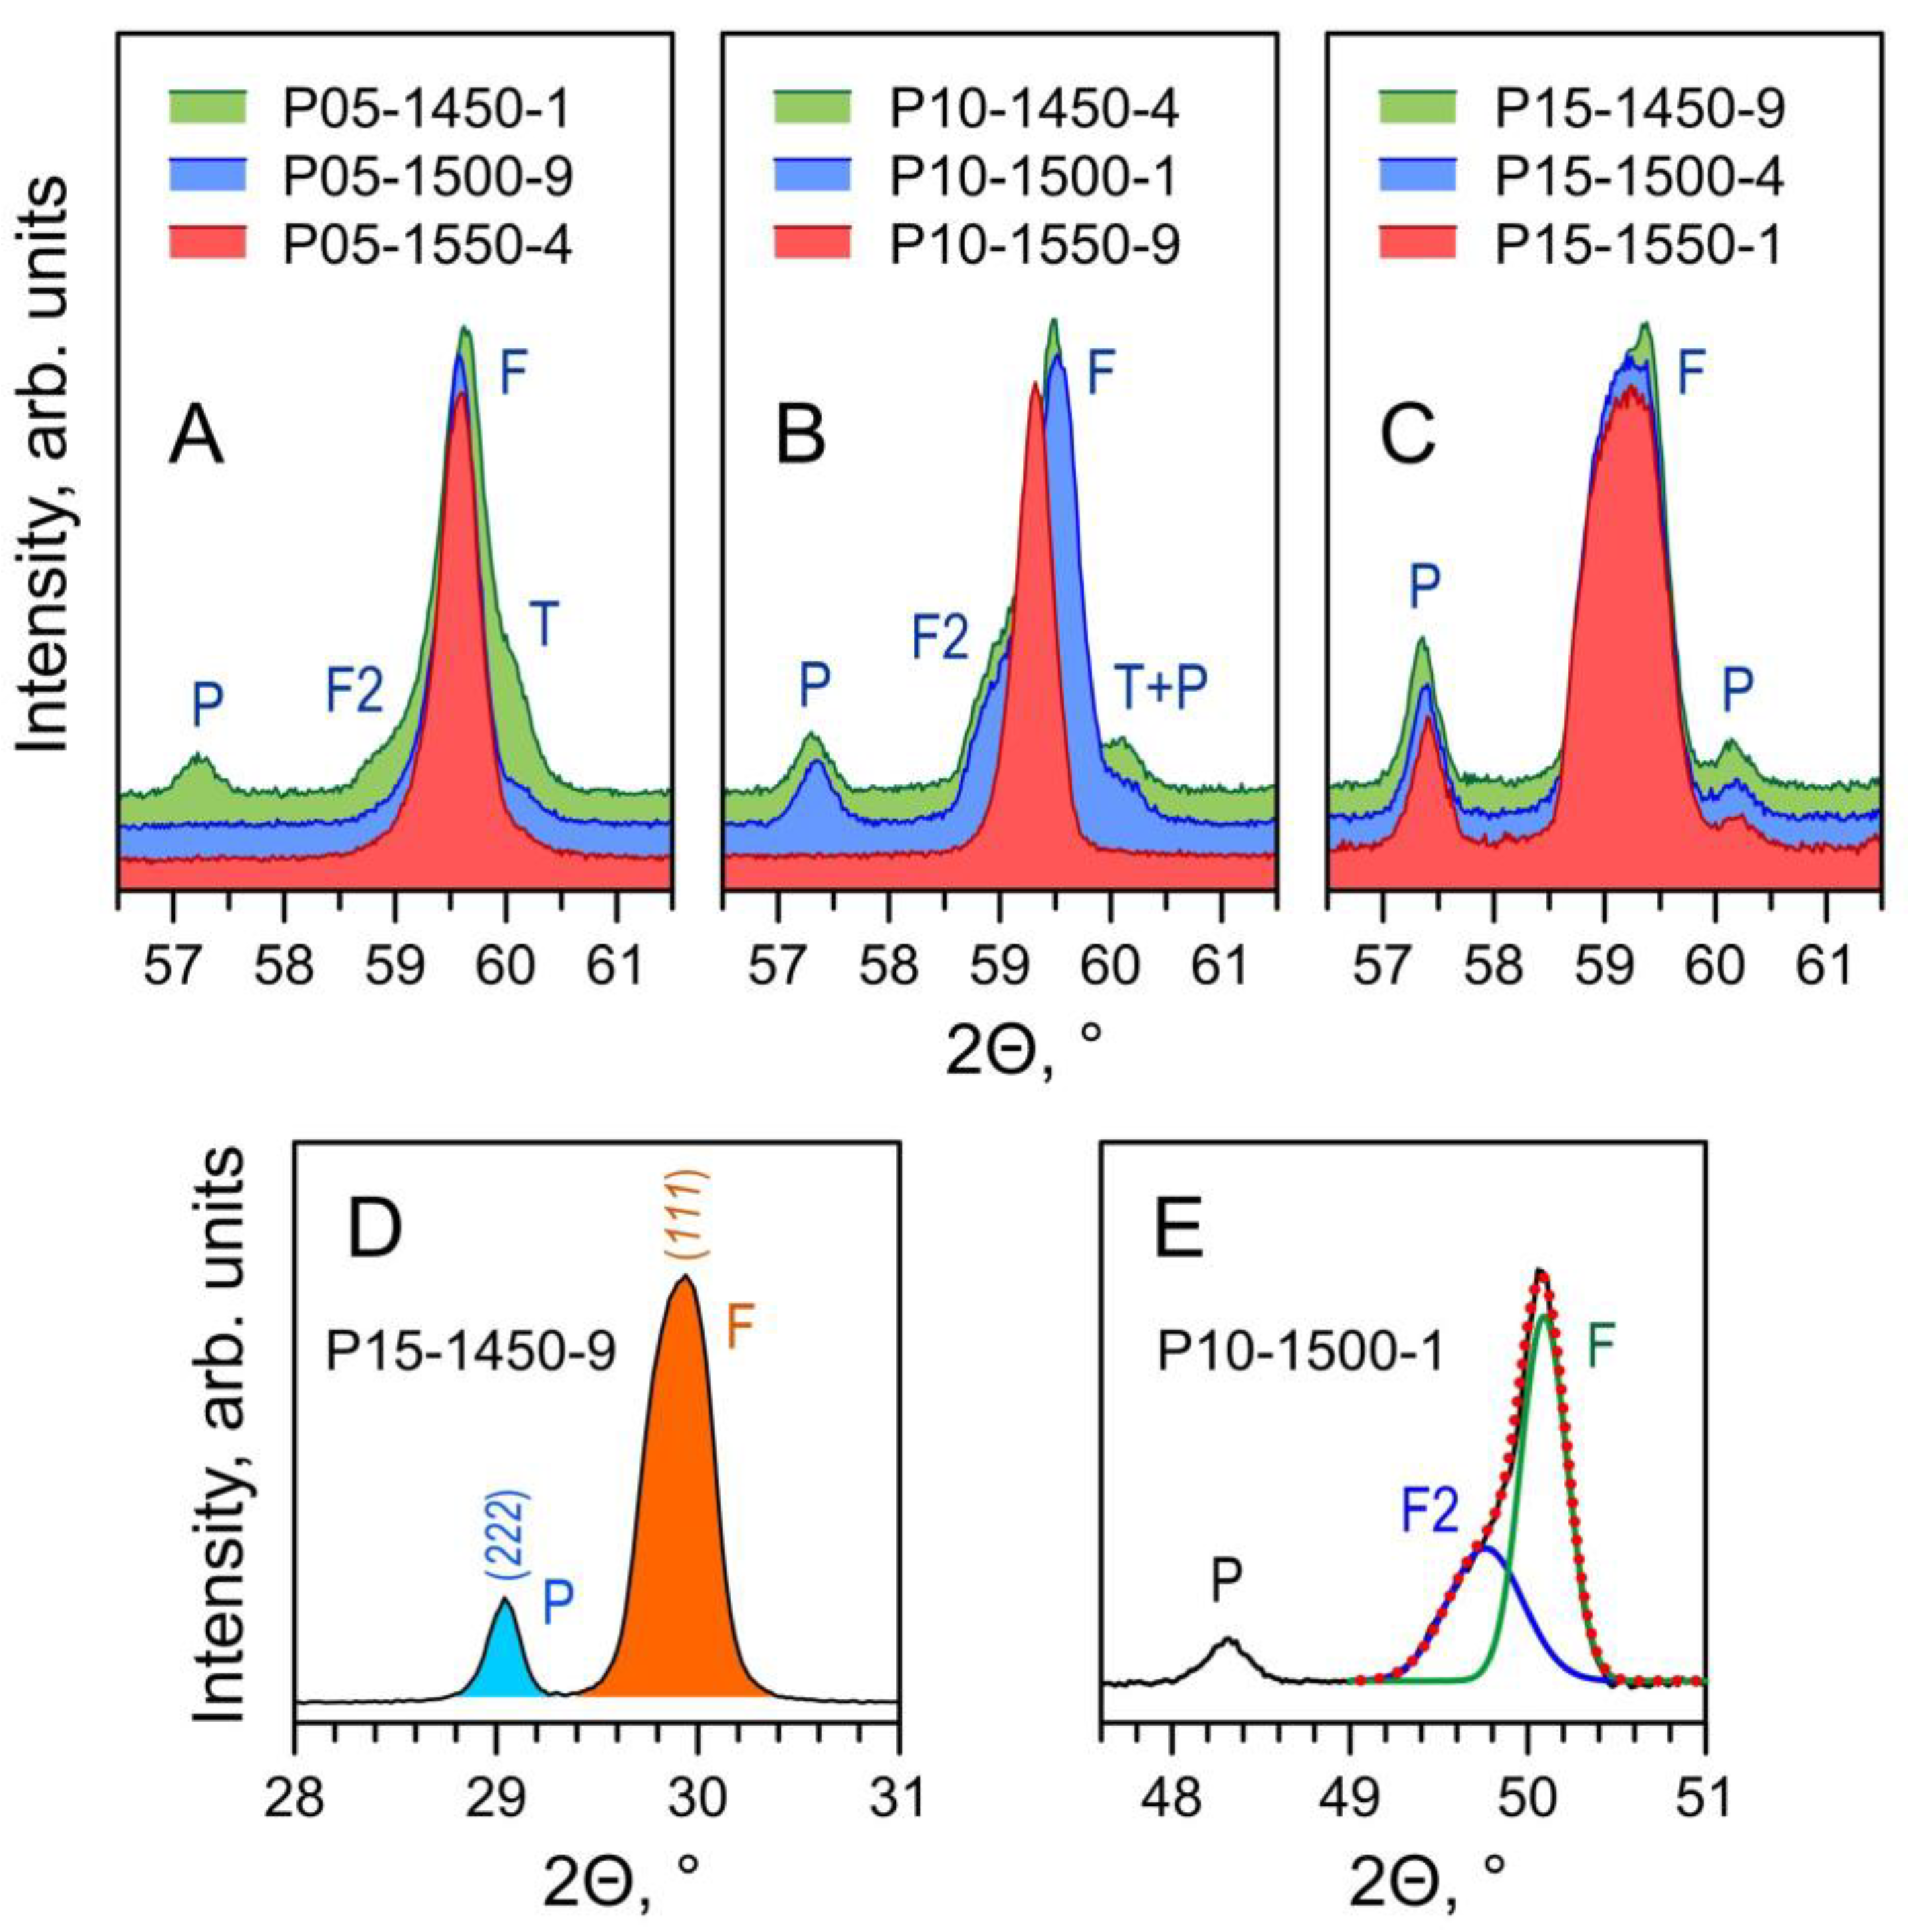
The phase composition of the prepared Pr-substituted 5YSZ ceramics is defined by the equilibrium phase relationships at the given firing temperature and by the kinetics of the solid-state reaction and cation diffusion. XRD analysis of the as-prepared samples (Figure 1) shows a prevailing fluorite (F) phase and the onset of a Pr2Zr2O7-based pyrochlore (P) phase. Furthermore, one also observes a clear splitting of the reflections assigned to the fluorite phase (Figure 2A–C).
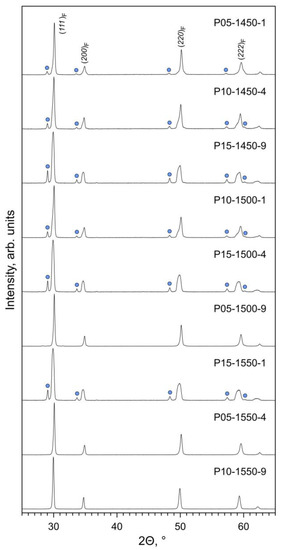
Figure 1.
XRD patterns of as-prepared Pr-substituted 5YSZ ceramic samples. The reflections of the fluorite phase are indexed in Fmm space group. The circles mark the main reflections of the pyrochlore phase (ICDD PDF no. 01-078-7481).
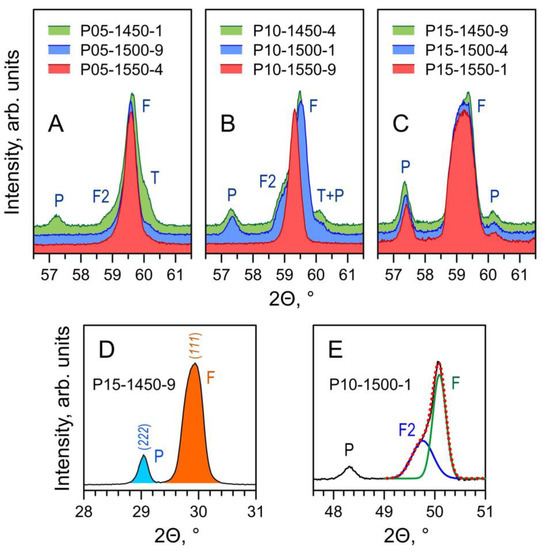
Figure 2.
(A–C) Fragments of XRD patterns of Pr-substituted 5YSZ ceramics illustrating the evolution of the phase composition with firing temperature; (D) example of integration of pyrochlore (222) peak and fluorite (111) peak to compute the corresponding peak ratio; (E) example of de-convolution of the (220) peak of the fluorite phase. Notation: F—main fluorite phase; F2—Pr-rich secondary fluorite phase; T—original tetragonal 5YSZ; P—pyrochlore phase.
The ternary diagrams of the ZrO2–Y2O3–Pr2O3 or ZrO2–Y2O3–PrOy systems have not been reported so far. Still, it is possible to make plausible predictions on equilibrium phase compositions based on the available diagrams of the related ZrO2–Y2O3–Ln2O3 systems. As the ionic radius of Nd3+ is the closest to that of Pr3+ [35], the ternary diagram of the ZrO2–Y2O3–Nd2O3 system can be expected to resemble that of ZrO2–Y2O3–Pr2O3 counterpart in the high-temperature range, when praseodymium is in a 3+ oxidation state in air (T ≥ 1300 °C [17,18]). Based on the most recent diagrams of the ZrO2–Y2O3–Nd2O3 system by Fabrichnaya [36,37], the samples with the nominal cation compositions selected in the present work (Table 1) are expected to be ternary fluorite-type solid solutions at 1600 °C under equilibrium conditions. The field of fluorite phase narrows with decreasing temperature, and the composition with a lower Pr content (x = 0.05) at 1400 °C belongs to the two-phase T + F field comprising tetragonal and cubic fluorite ZrO2-based phases [36,37]. According to the earlier diagram of the ZrO2–Y2O3–Nd2O3 system at 1600 °C proposed by Hinatsu and Muromura [38], the x = 0.05 and x = 0.15 compositions correspond to the T + F and F regions, respectively, while x = 0.10 is located at the boundary between the two fields. Furthermore, comparative analysis of available ternary diagrams of the ZrO2–Y2O3–Ln2O3 systems, where Ln = La [39,40,41], Nd [36,37,38] and Sm [42], suggests also that the boundary between the T + F and F fields for a smaller Ln = Pr cation should be shifted towards a slightly higher dopant content compared to the Nd-based system. At the same time, all the inspected diagrams suggest that the praseodymium contents in the sintered ceramic samples are too low for the co-existence of the pyrochlore-type Pr2Zr2O7 phase under equilibrium conditions at 1400–1600 °C.
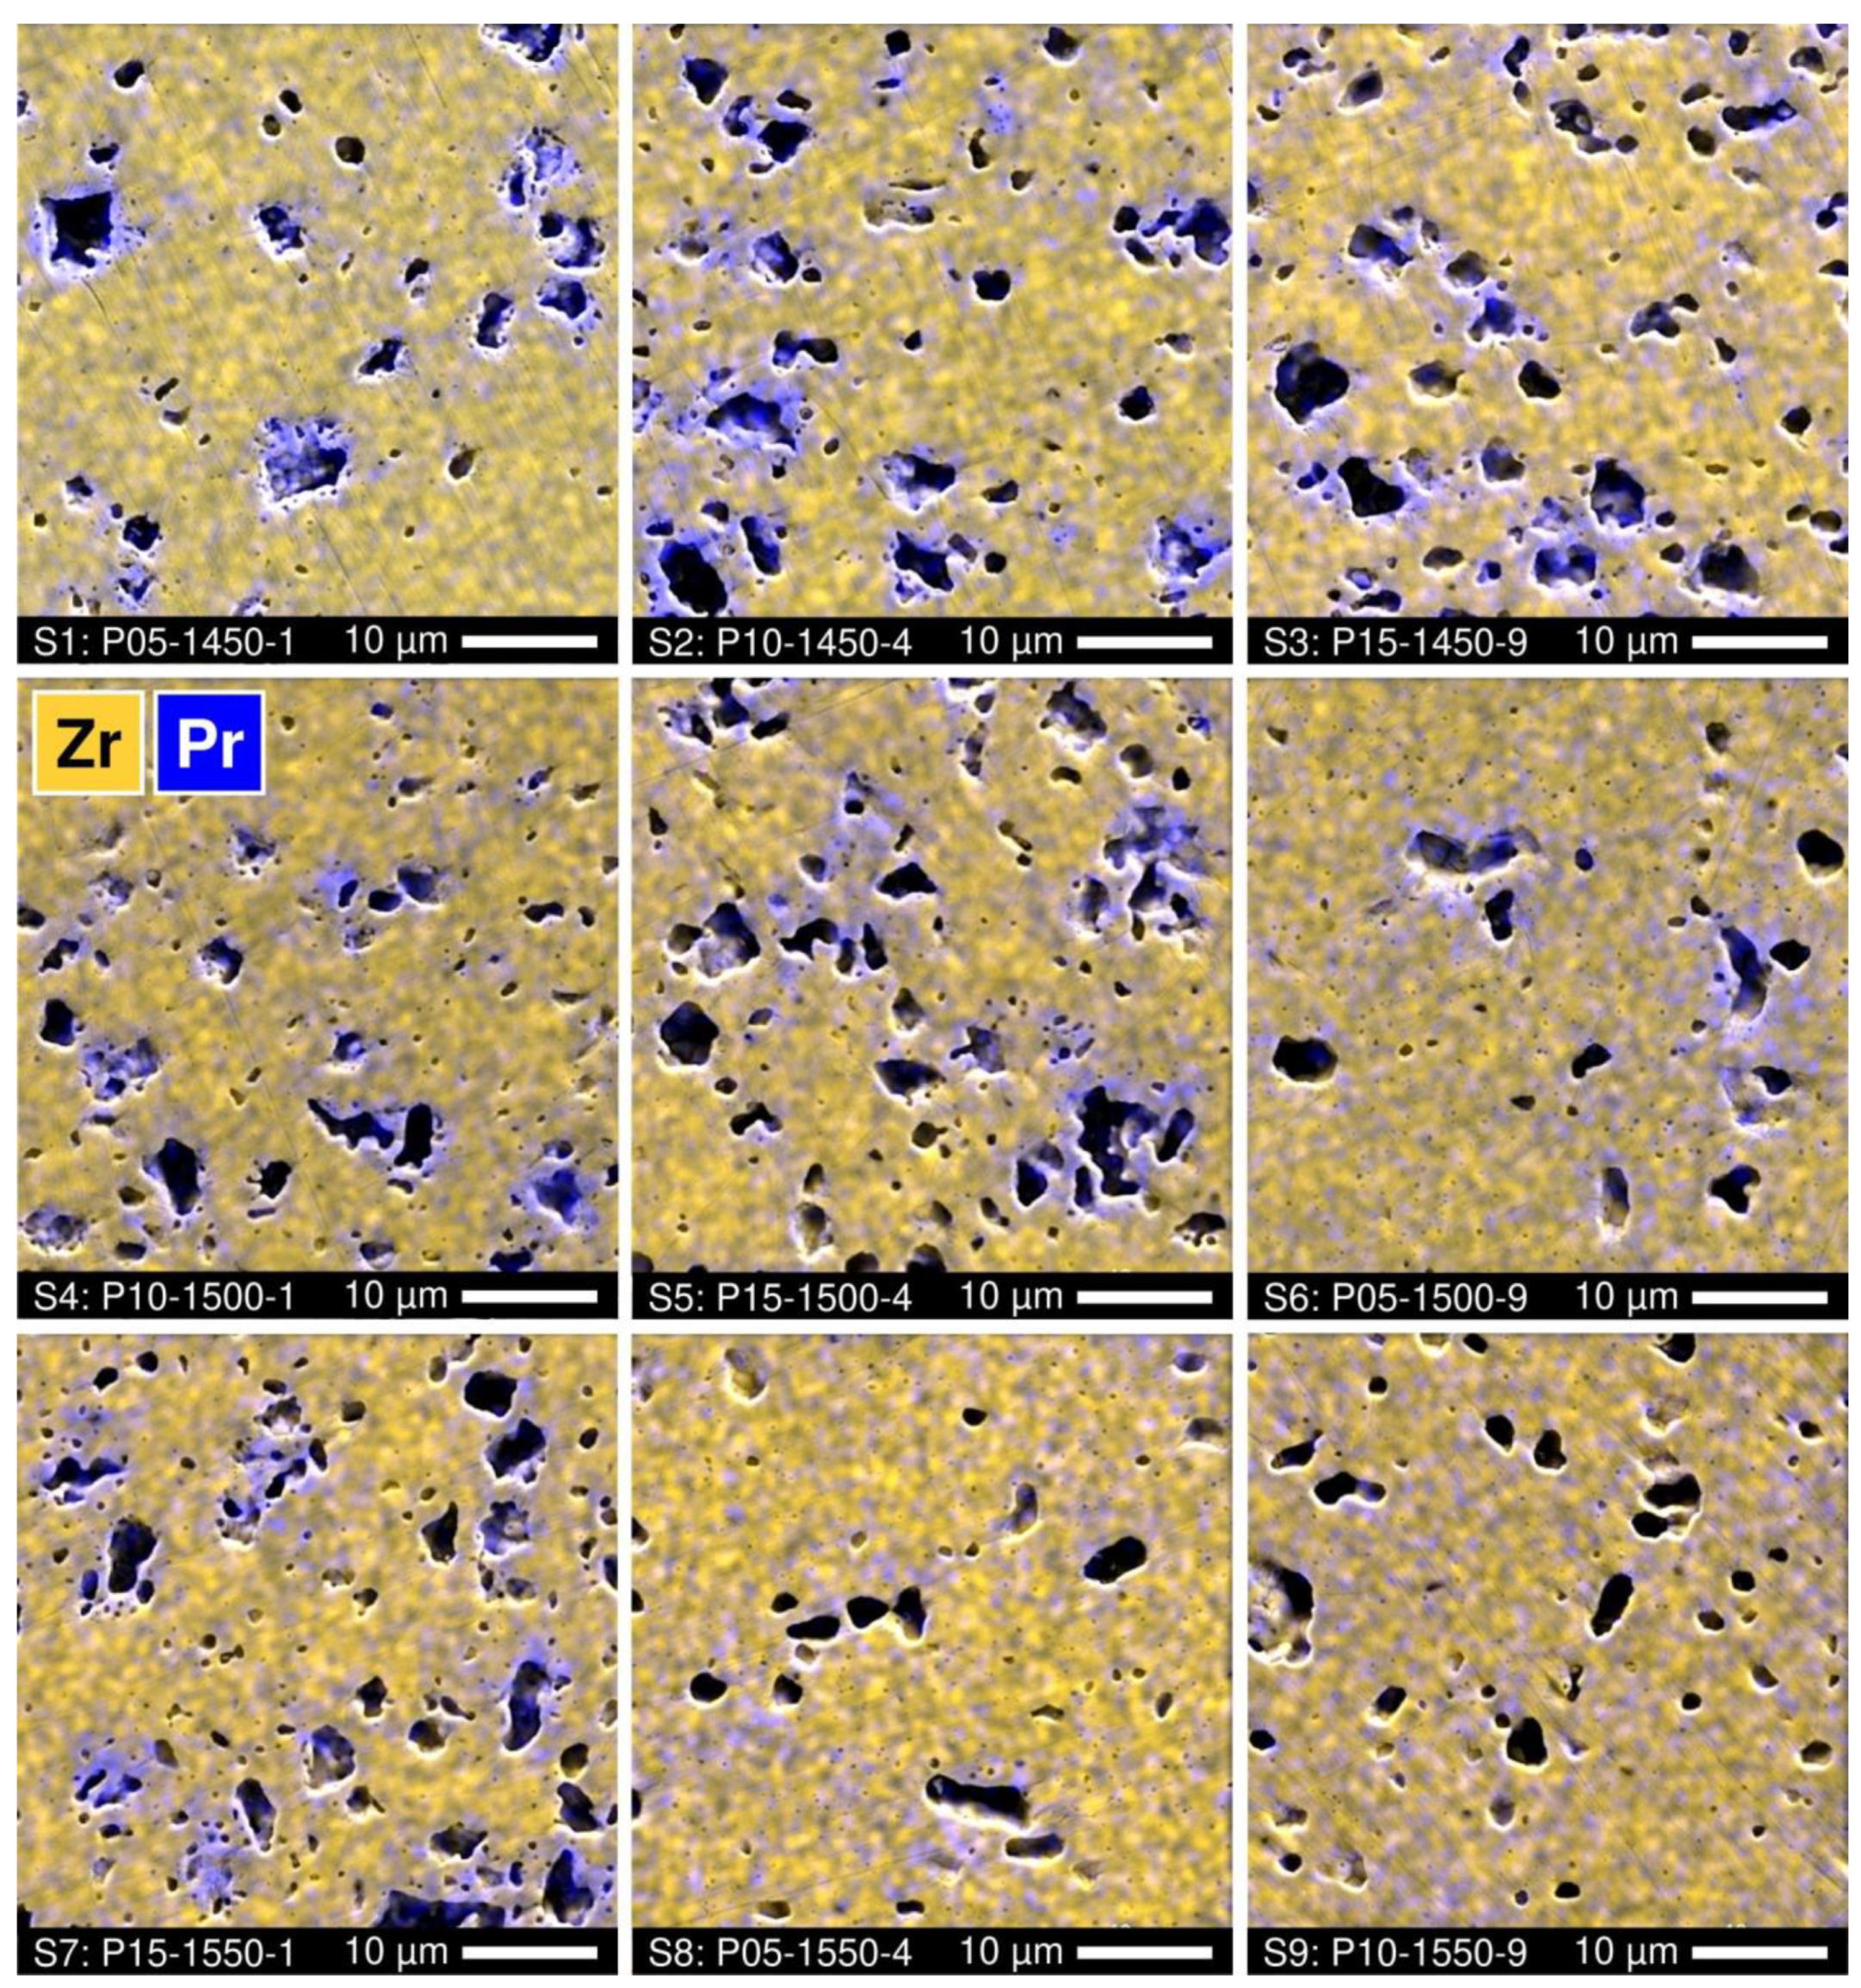
Further insight into the phase evolution in the course of the direct firing of 5YSZ samples with PrOy additions is provided by the microstructural studies. All the ceramic samples demonstrate a noticeable porosity (Figure 3). Visually, the volume fraction of the pores increases with increasing praseodymium content and reasonably decreases with increasing time and temperature of firing. The EDS analysis showed the accumulation of praseodymium near the surface of the pores. Again, the distribution of cations becomes more homogeneous with increasing temperature and duration of firing (Figure 3).
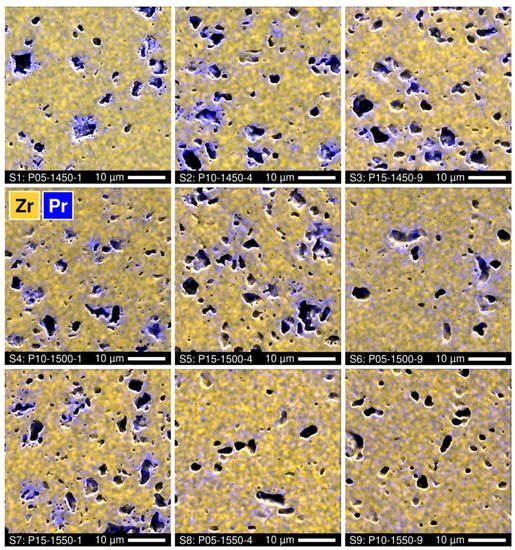
Figure 3.
SEM micrographs of polished Pr-substituted 5YSZ ceramics with overlaid EDS elemental mapping.
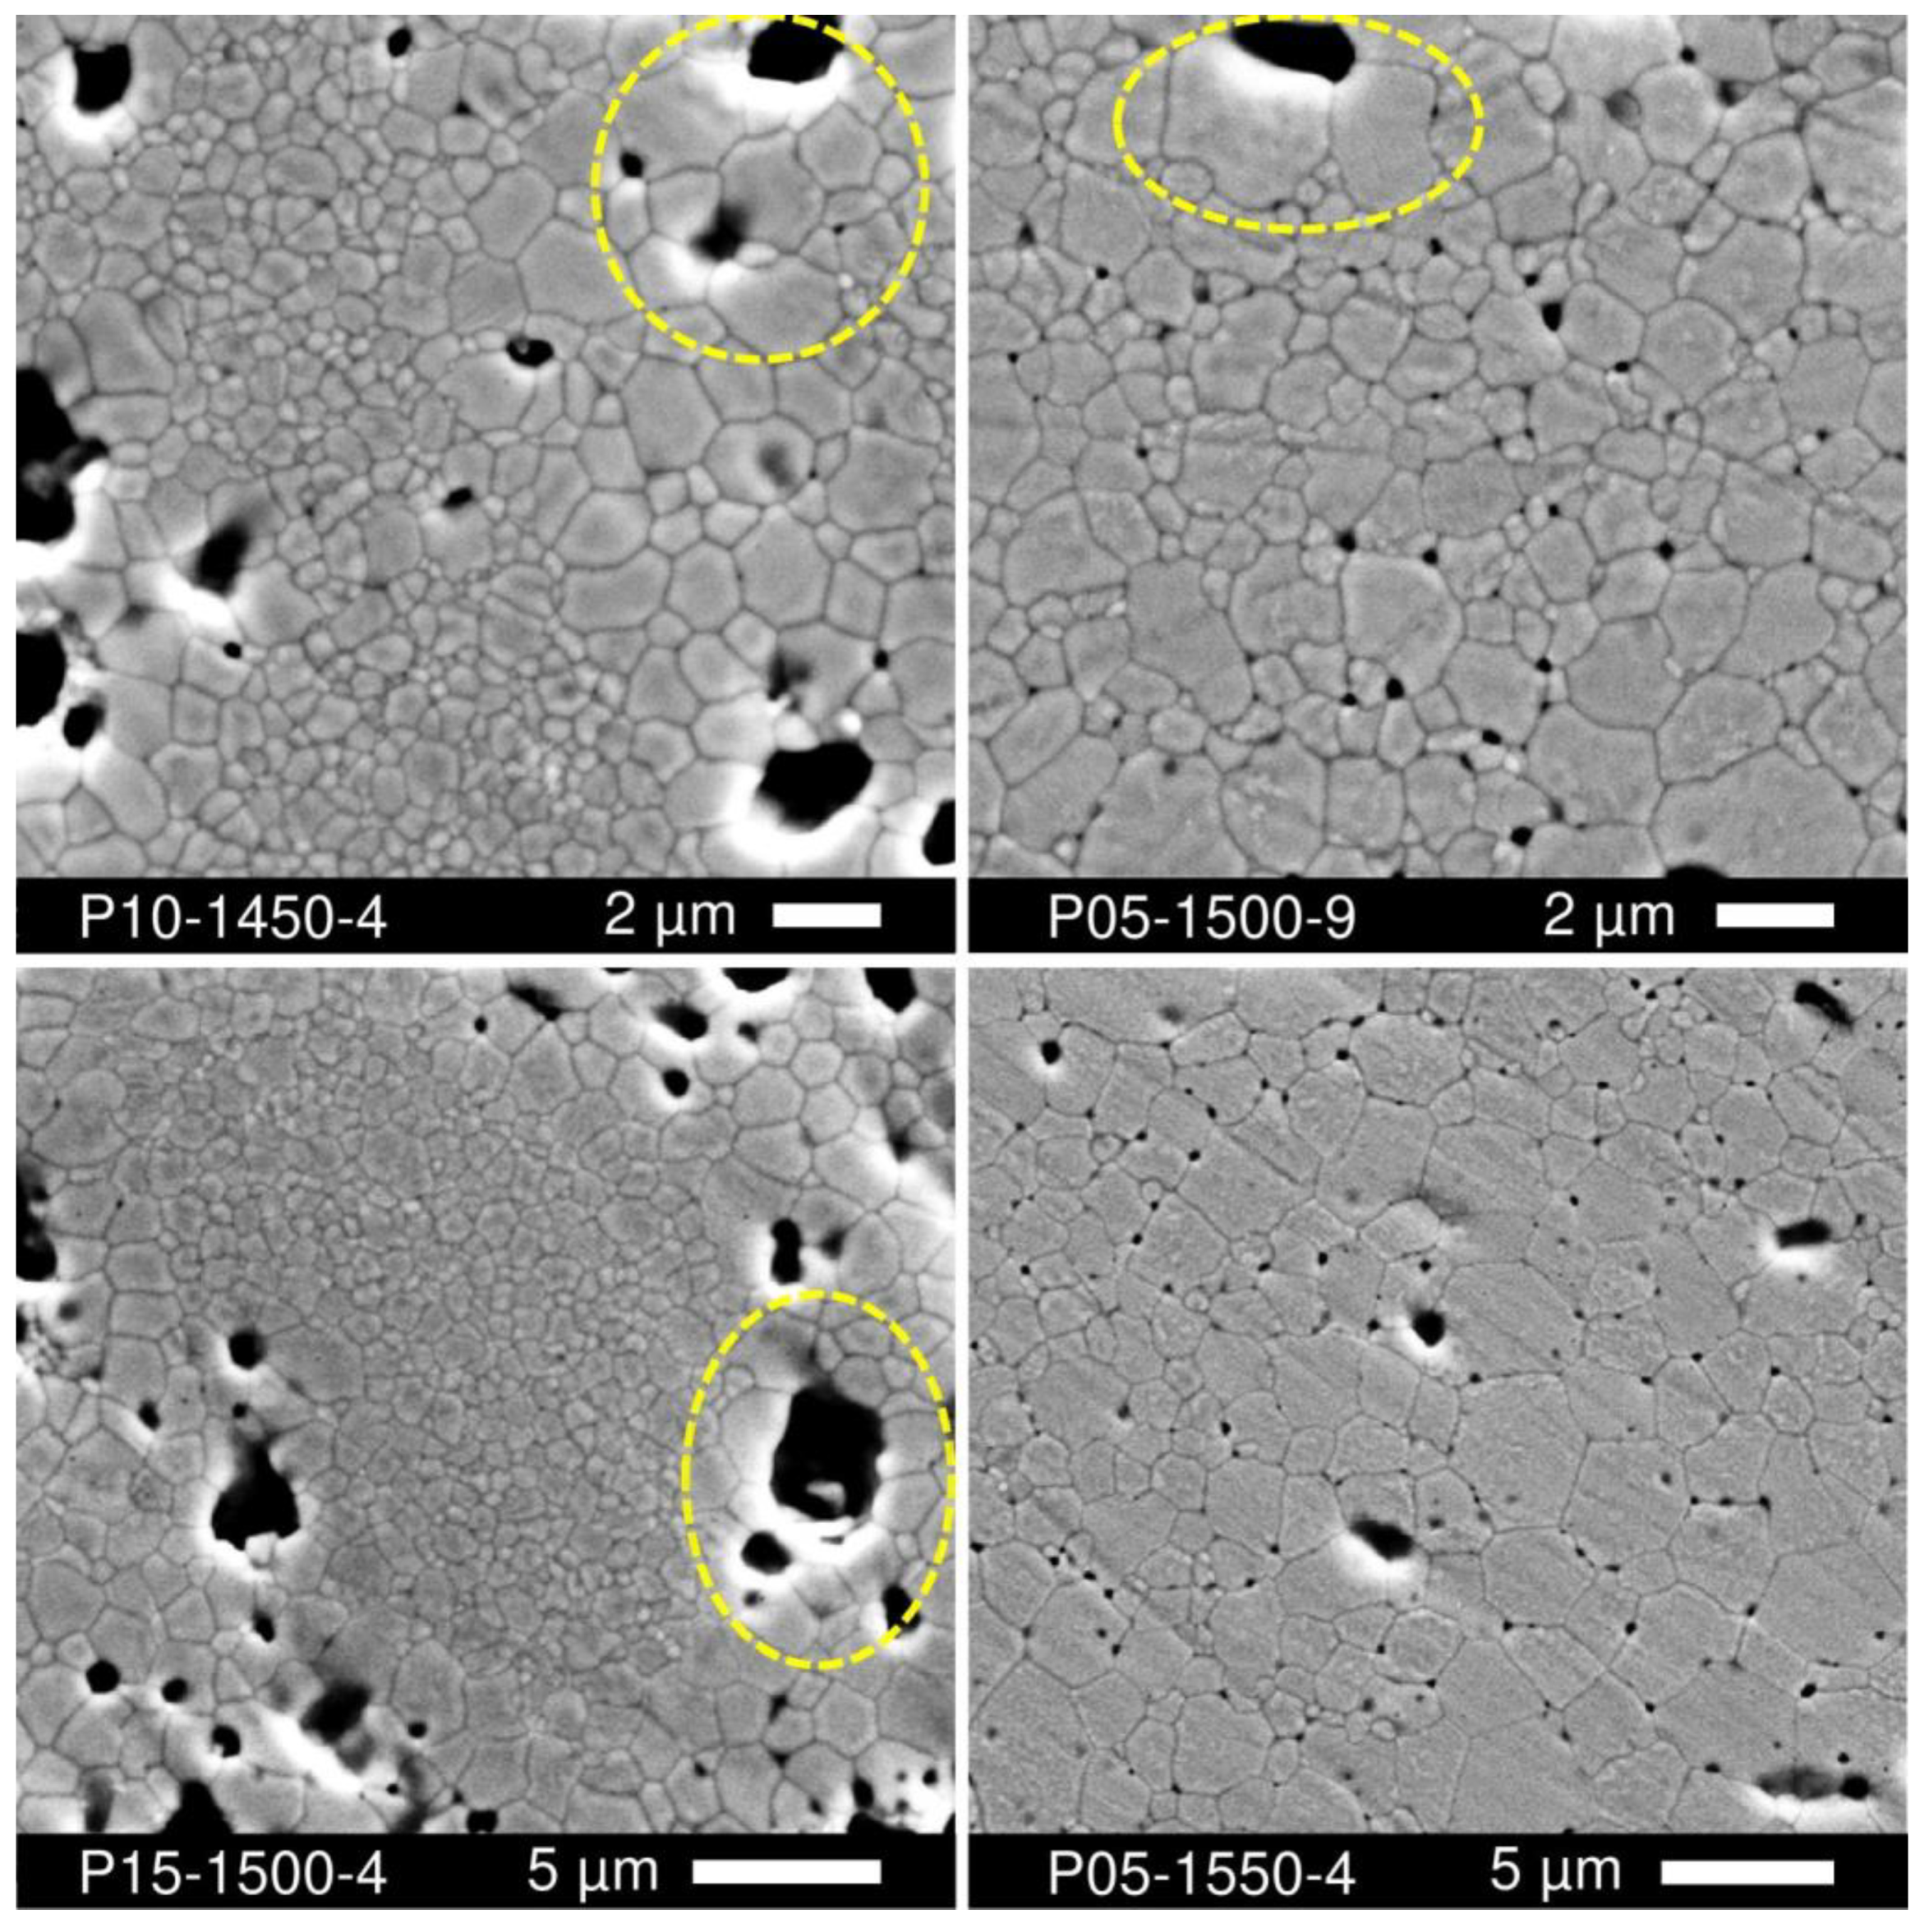
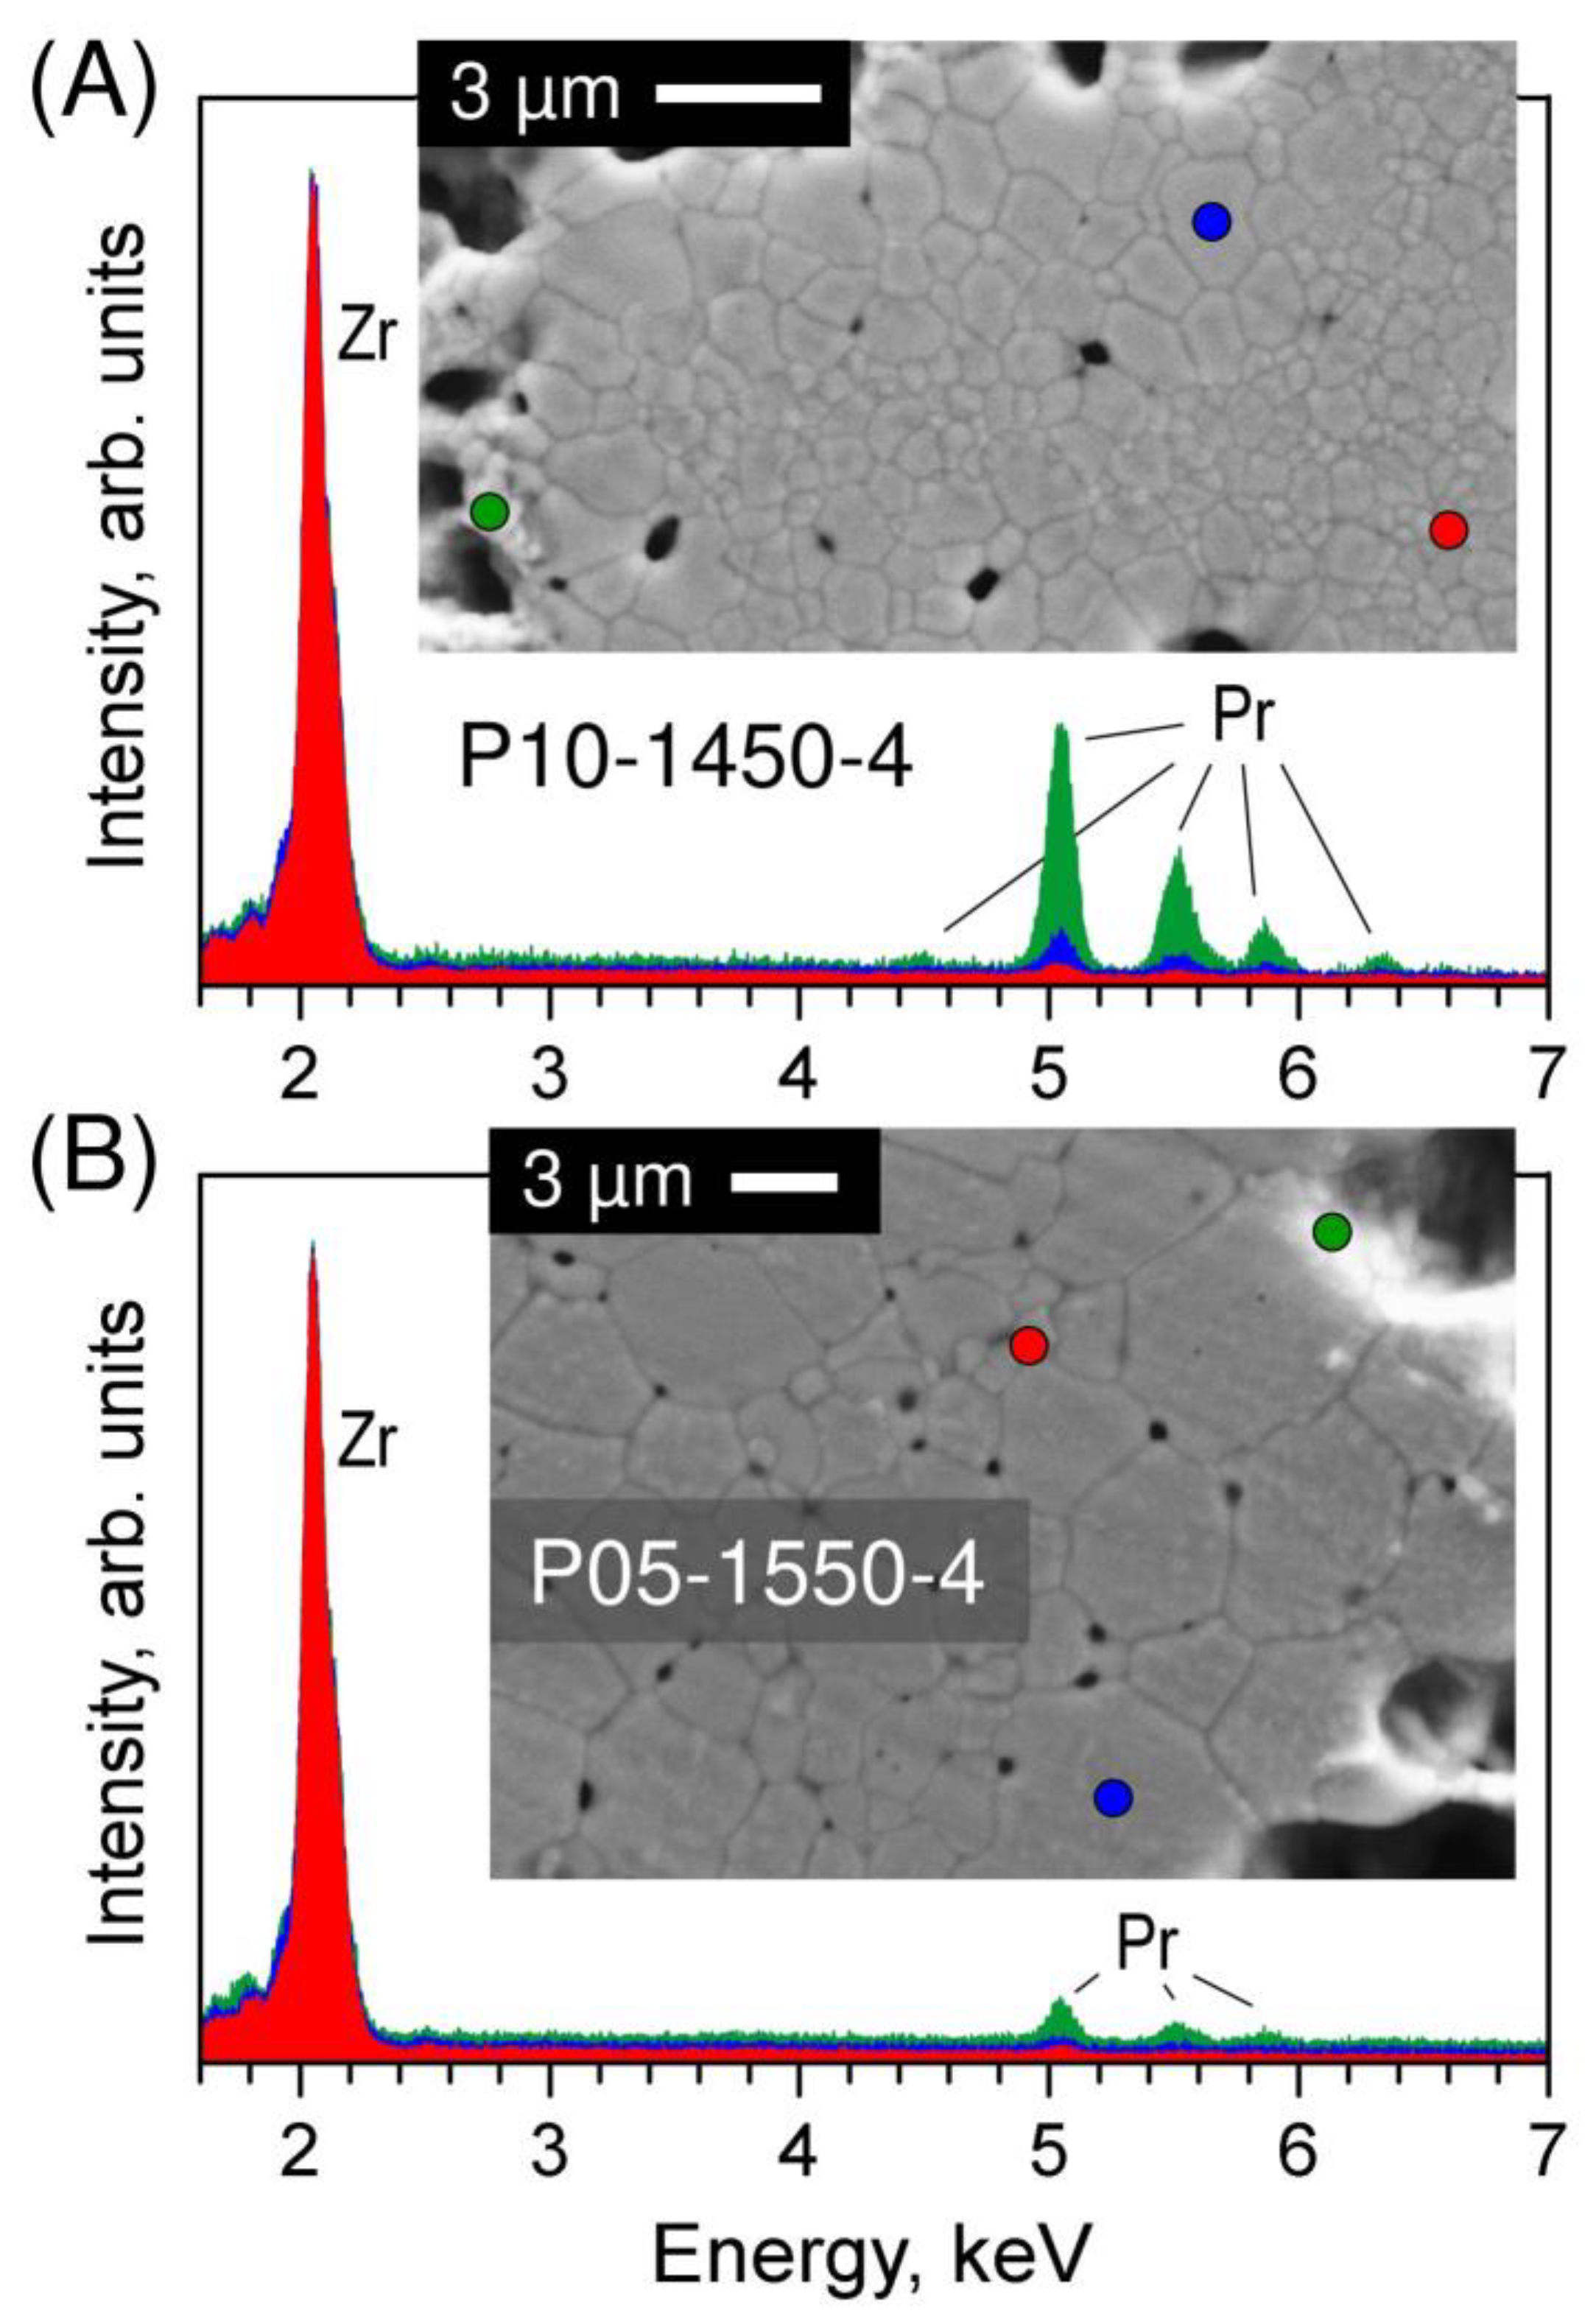
SEM inspection of the polished and thermally etched samples also revealed inhomogeneities in the grain size distribution (Figure 4). For lower Tf and shorter tf, larger grains (1–3 µm) surround the pores, while small grains (0.2–1.2 µm) fill the volume between the pores. The grain size distribution is correlated with praseodymium elemental distribution. As an example, Figure 5A shows the EDS spectra collected from different points of the P10-1450-4 sample. The results imply that the praseodymium concentration in the large grains is noticeably higher than in the small grains, which is in close agreement with the structural evidence of fluorite peak splitting (Figure 2), and increases drastically near the pore surface indicating the preferential location of the secondary pyrochlore Pr2Zr2O7 phase. Increasing the time and temperature of firing promotes a more homogeneous distribution of the grain size and praseodymium concentration across the sample volume (Figure 3 and Figure 4). Still, the accumulation of Pr near the pore surface is detectable by EDS analysis even in the samples with a longer firing at 1500–1550 °C (Figure 3 and Figure 5B).

Figure 4.
SEM micrographs of polished and thermally etched Pr-substituted 5YSZ ceramics. Thermal etching included heating in air to 1400 °C followed by immediate cooling (heating/cooling at 5 °C/min). Circles show that larger grain sizes are often associated with porosity.

Figure 5.
EDS spectra collected from selected points of (A) P10-1450-4 and (B) P05-1550-4 ceramics showing the difference in Pr elemental distribution between small grains, large grains and pores surface. The spectra are normalized to the intensity of the main Zr peak and slightly shifted along y-axis for clarity. Blue dot: larger grain; red dot: smaller grain; green dot: near-pore area.
In combination, the XRD and SEM/EDS data suggest the following scheme of the phase evolution during direct firing. The pores in the ceramic samples may be due to poorer packing near praseodymium oxide agglomerates in the green powder mixture after ball-milling and compaction of the 5YSZ + PrOy samples or due to hindered shrinkage as reactive firing proceeds. Independently of temperature, the solid-state reaction proceeds through the initial formation of the pyrochlore-type Pr2Zr2O7 phase at the PrOy/5YSZ contacts. This is followed by the diffusion of praseodymium from the formed layer of the pyrochlore phase into the bulk of the samples, under Pr2Zr2O7/(Zr,Y,Pr)O2-δ/5YSZ phase gradients inducing grain growth by Pr-enrichment and possibly also the onset of porosity by a Kirkendall-like effect, as demonstrated for interdiffusion in YSZ/YDC (YDC = yttria-doped ceria) [43]. In addition, local grain growth may hinder microstructural rearrangement, possibly combined with grain boundary pinning by Pr2Zr2O7 particles, preventing the densification and elimination of the remaining porosity. Note also the irregular shape of this porosity (Figure 3).
The phase evolution is well illustrated by the changes in the XRD peaks shape/splitting with increasing temperature of firing. The substitution by Pr into 5YSZ is expected to increase the lattice parameters due to differences between the ionic radii of Pr4+ (rVI = 0.85 Å) and Pr3+ (rVI = 0.99 Å) relative to Zr4+ (rVI = 0.72 Å) and Y3+ (rVI = 0.90 Å) [35]. In addition to the fluorite (F) phase, the XRD pattern of the P05-1450-1 sample (Figure 2A) suggests the presence of unreacted tetragonal 5YSZ (T), second praseodymium-enriched fluorite (F2) and pyrochlore (P) phases. Increasing Tf promotes the dissolution of the T and P phases and the merging of the F and F2 phases into a single fluorite-type phase with an intermediate lattice parameter for P05-1550-4. A similar picture is observed for the x = 0.10 samples (Figure 2B). In the case of the samples with the largest (x = 0.15) praseodymia additions, the firing time was insufficient for the full homogenization of the samples. For all Tf, the samples contain the pyrochlore-type intermediate, while the broadening of the peaks seems to imply the transient distribution of the lattice parameters of the fluorite phase (Figure 2C).
The area ratio of the main peaks of the pyrochlore and fluorite phases, A(222)P/A(111)F, was obtained by the integration of the corresponding reflections (Figure 2D) and used as a criterion for the relative contents of a pyrochlore to fluorite phases and its dependence on the overall composition and firing conditions. The deconvolution of the main and secondary fluorite phase peaks was performed by assuming two Gaussian distributions (Figure 2E). The peaks of the main contribution at slightly higher 2Θ were used to evaluate the lattice parameters by the Nelson–Riley method [44] based on extrapolation of:
The results are summarized in Table 3.
Table 3.
Density, lattice parameter of the main fluorite phase, pyrochlore-to-fluorite peak area ratio, conductivity at 700 °C, and activation energy for electrical conductivity.
3.2. Praseodymium Oxidation State
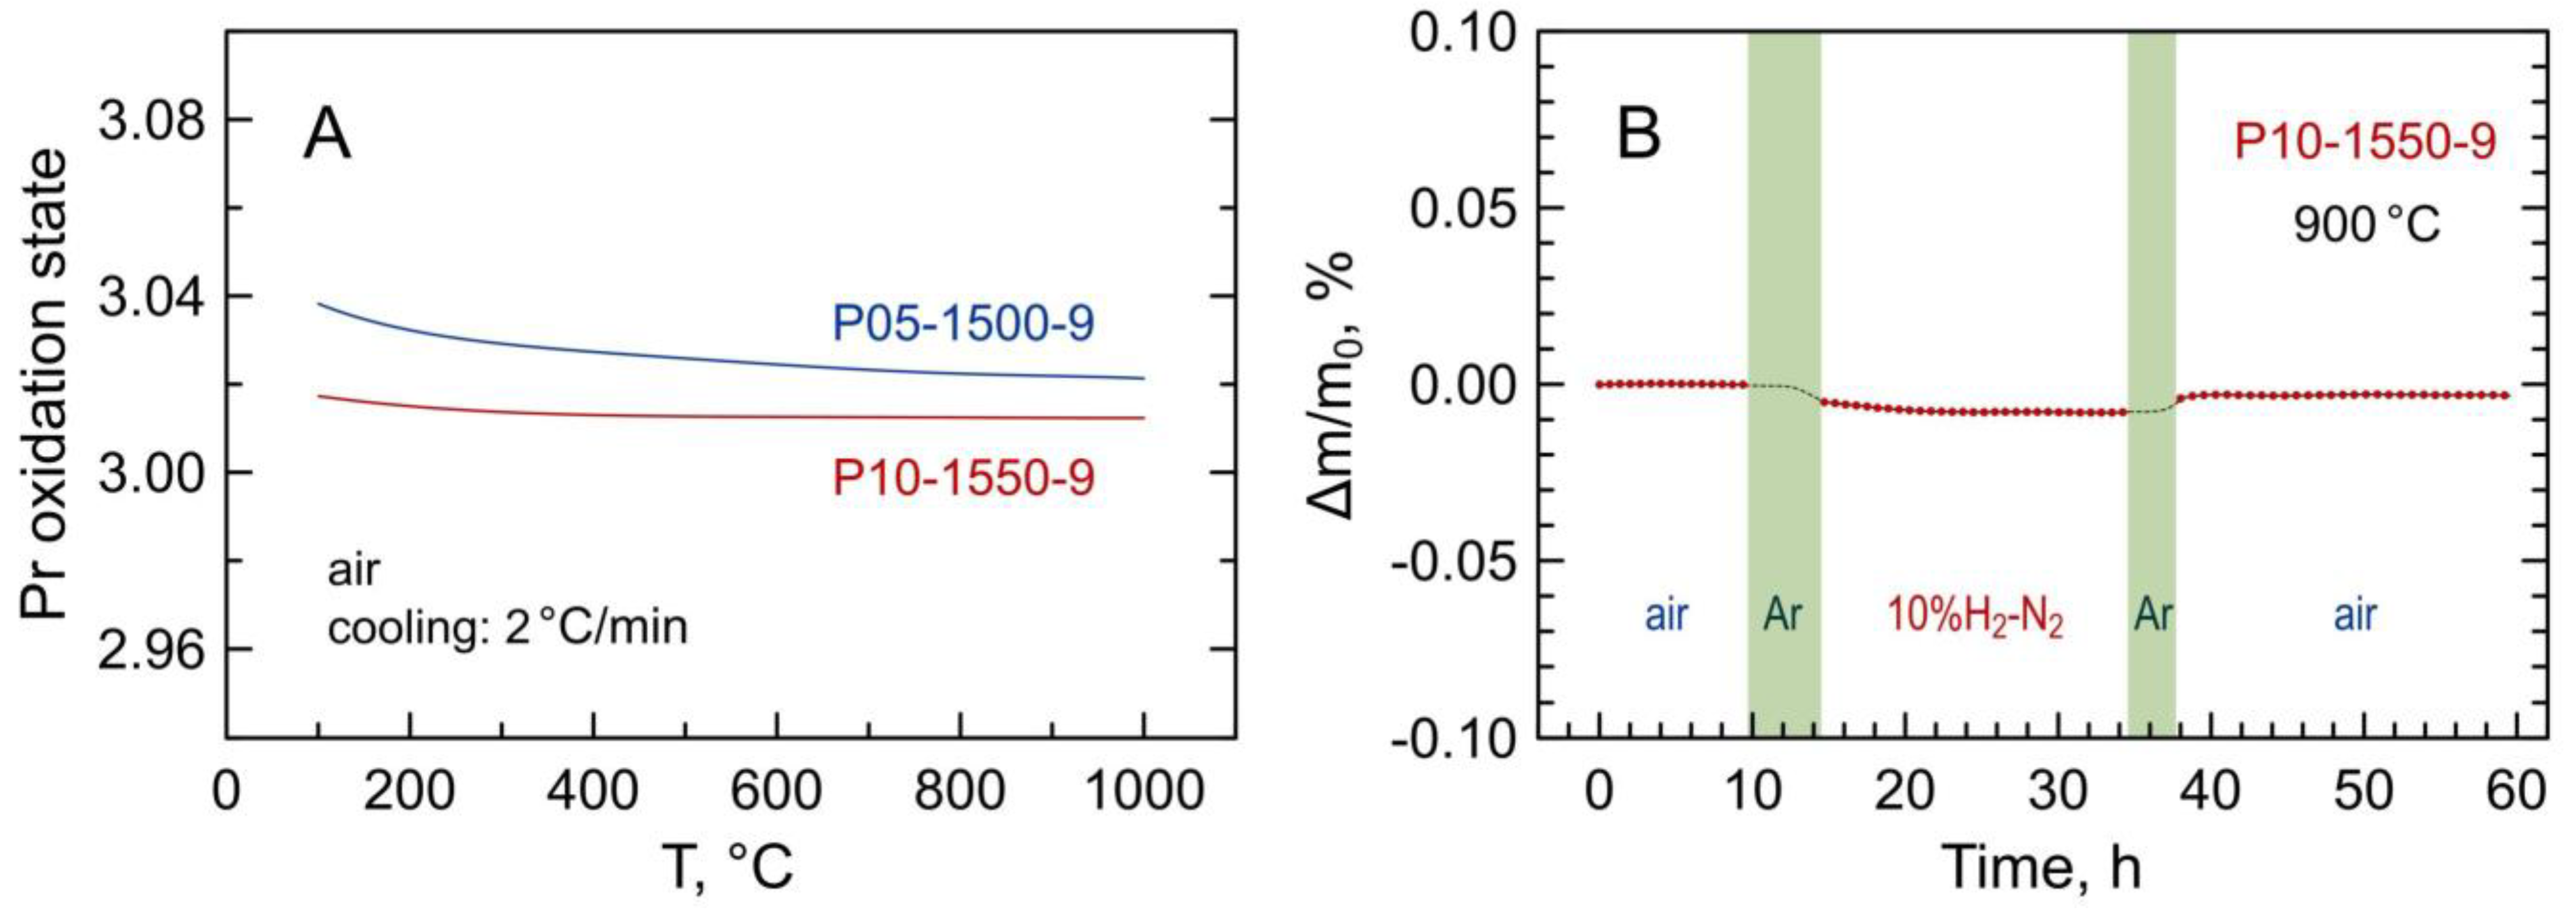
Figure 6A illustrates the variations of the average oxidation state of praseodymium cations in selected Pr-substituted 5YSZ samples on temperature cycling in air estimated from the thermogravimetric data. As praseodymium is the only variable-valence cation in the prepared materials, the absolute values of oxygen content in the samples and Pr oxidation state were calculated from the thermogravimetric data on reduction in 10%H2–N2 flow (Figure 6B) assuming the nominal overall cation composition and that all praseodymium cations in the reduced samples are in 3+ state:
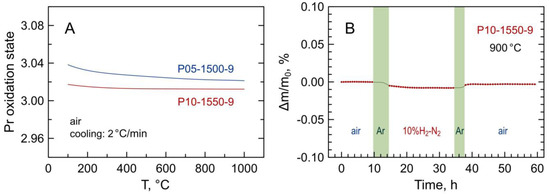
Figure 6.
(A) Temperature dependence of average oxidation state of praseodymium cations in air estimated from the thermogravimetric data; (B) relative weight change of powdered P10-1550-9 sample in one ox → red → ox cycle at 900 °C. Shadowed areas in (B) correspond to the flushing of the system with inert gas between oxidizing and reducing atmospheres.
Thus, the change of the mass on reduction was assigned to the oxygen release from the oxide sample associated with the Pr4+ → Pr3+ reduction allowing the calculation of the average oxidation state of the praseodymium cations and the fraction of Pr4+ in the oxidized samples.
The results indicate that Pr3+ prevails in the studied materials; the estimated fraction of Pr4+ at 600–1000 °C is 1.3–2.1% with respect to the total praseodymium content. Furthermore, the average praseodymium valence shows a very weak temperature dependence in air. This differs from the binary praseodymium oxide where the average oxidation state of praseodymium in air varies between approximately 3.66+ below 300 °C and 3.42+ at 1000 °C [17,18], and from Mn-substituted 5YSZ where manganese valence changes reversibly from ~2.9+ at T ≤ 300 °C to (2.50–2.56)+ at 1000 °C in air [15]. On the other hand, the obtained results are in agreement with the literature reports suggesting the prevailing trivalent state of praseodymium cations in zirconia-rich (ZrO2)1-x(PrOy)x ceramics [24,29] and Pr2Zr2O7-based pyrochlores [45] sintered at high temperatures.
3.3. Electrical Conductivity in Air
Electrical studies were done using bar-shaped ceramics samples. Impedance spectroscopy of these samples revealed only two contributions in the frequency range 20 Hz–1 MHz: high-frequency (HF) semicircle attributed to the bulk properties of the sample, and a low-frequency (LF) contribution assigned to the electrode process. The spectra were fitted using a simple (RHFǀǀCPEHF)(RLFǀǀCPELF) equivalent circuit (where R is the resistance and CPE is the constant phase element [46]) to extract the total ohmic resistance RHF of the sample. The calculated specific capacitance for the HF and LF contributions was on the order of ~10−10 F/cm and ~10−4 F/cm, respectively. No grain boundary or secondary phase contributions could be detected and extracted from the impedance spectroscopy data for this sample geometry even at temperatures around 500 °C (Figure 7).
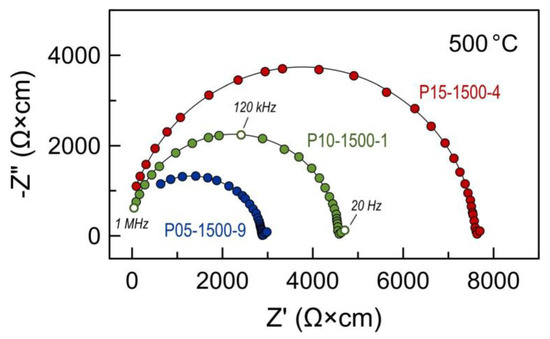
Figure 7.
Examples of impedance spectra of Pr-substituted 5YSZ ceramics at 500 °C in air.
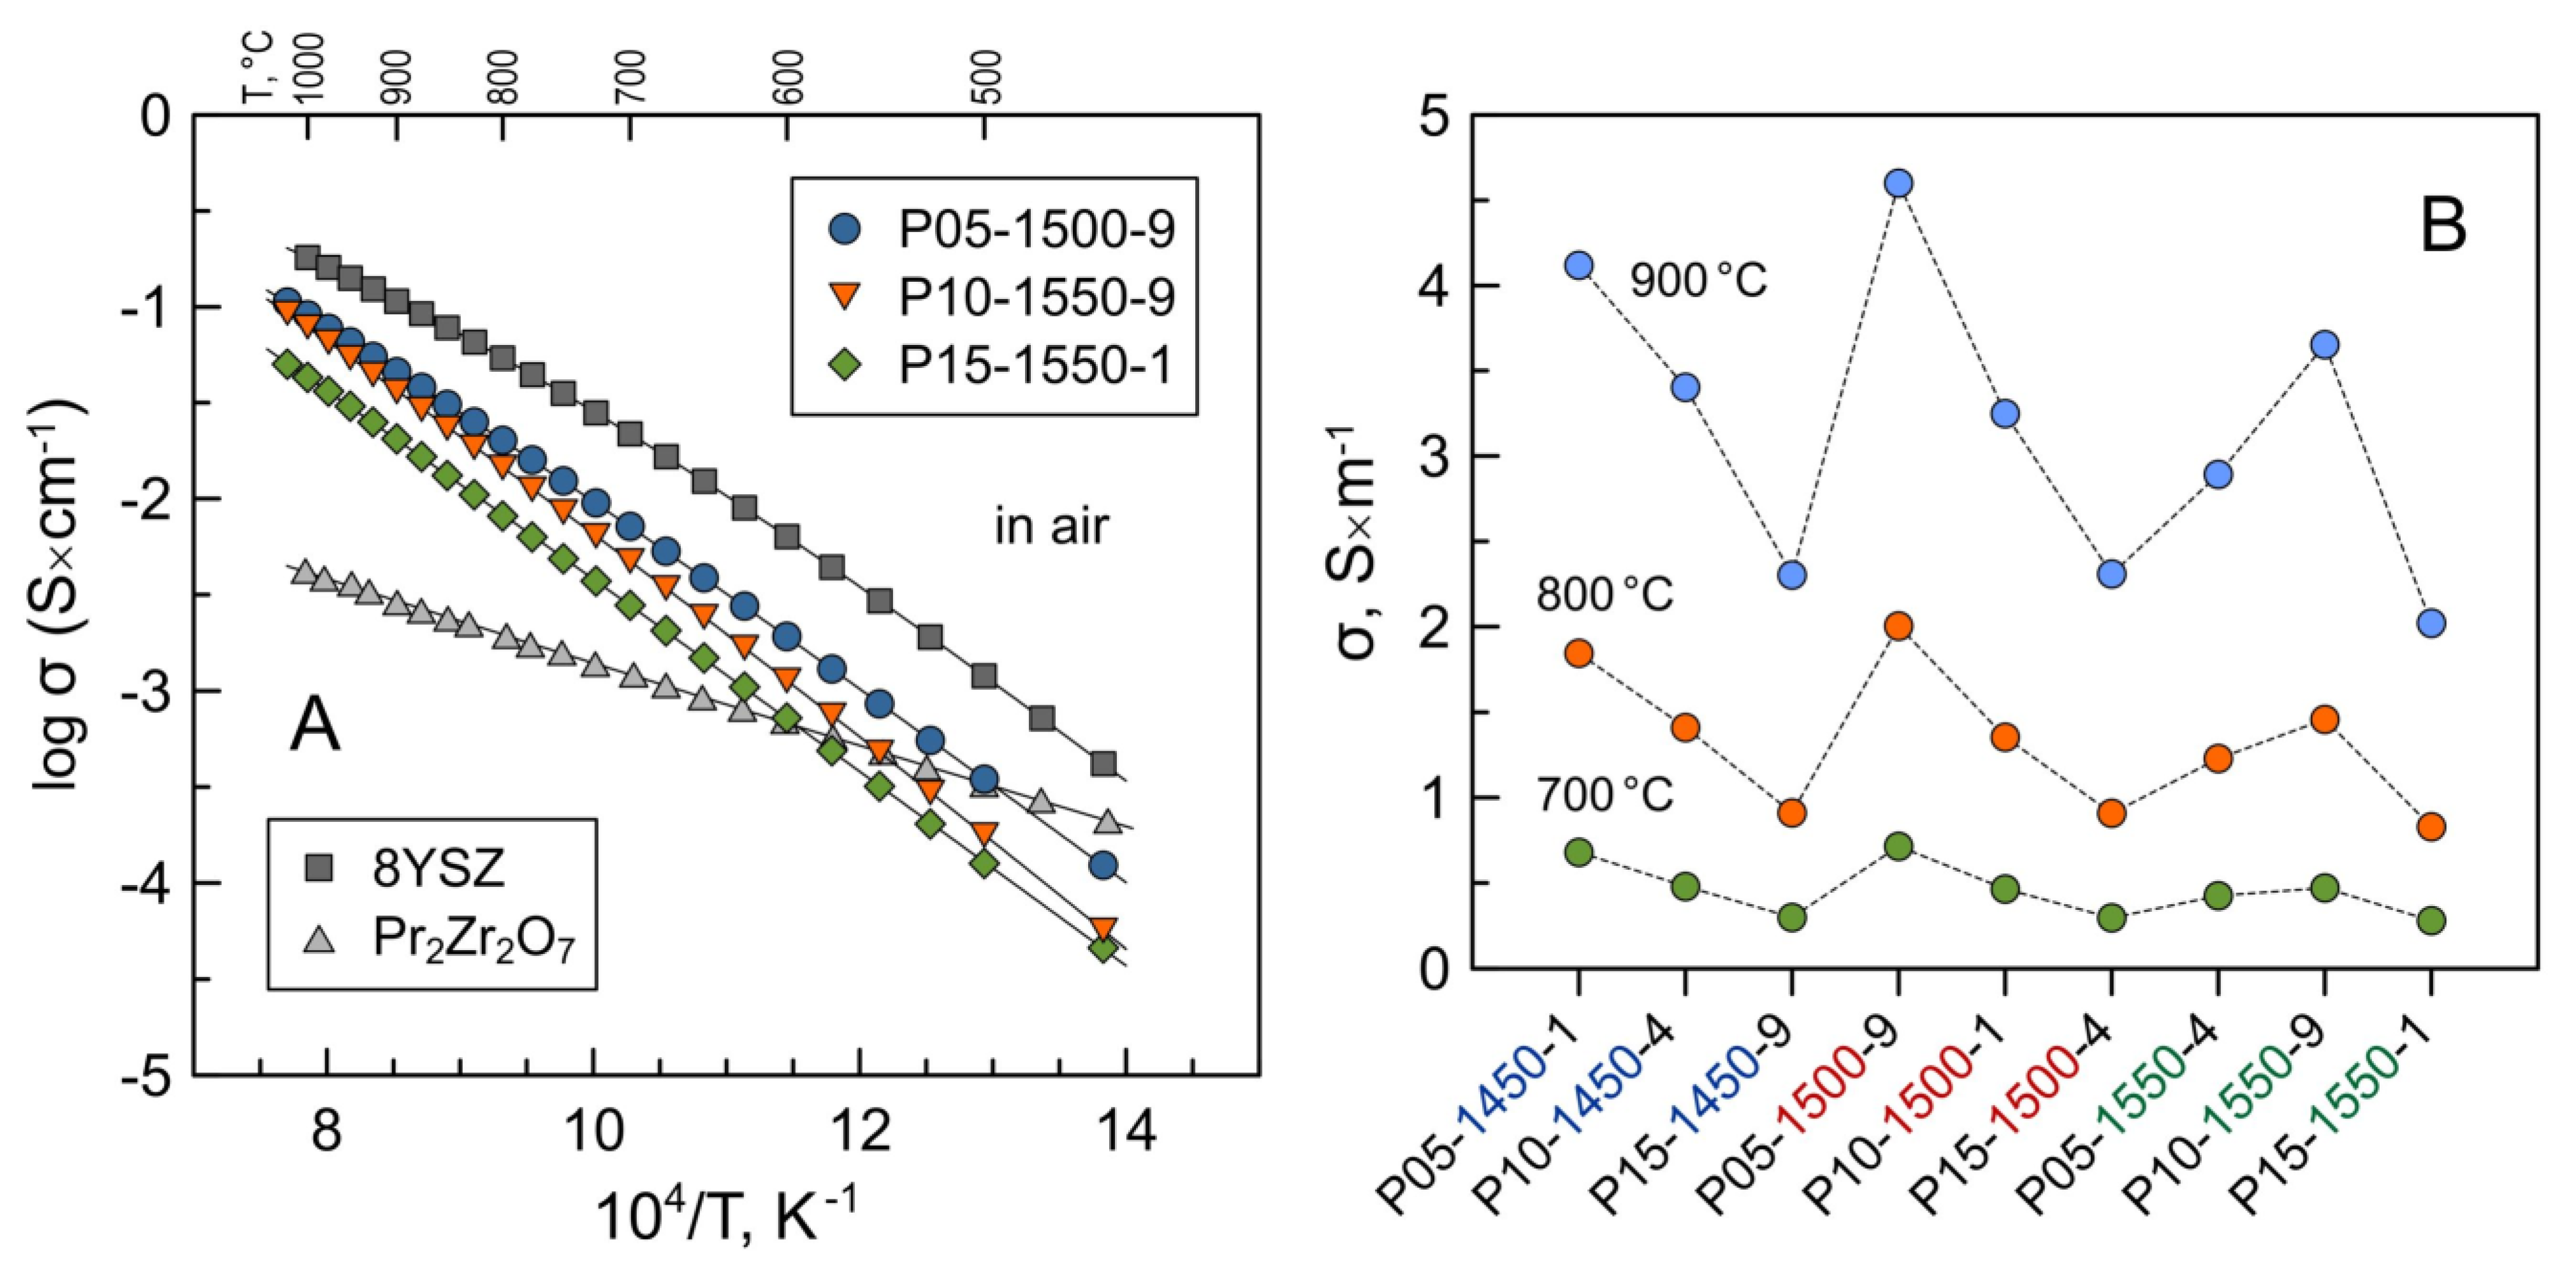
The data on the electrical conductivity of Pr-substituted 5YSZ are summarized in Figure 8 and Table 3. The conductivity exhibit nearly linear behavior in Arrhenius coordinates, lnσT-1/T, similar to yttria-stabilized zirconia electrolytes. The conductivity of prepared ceramics varies in the range 2.0–4.1 S/m at 900 °C and 0.28–0.68 S/m at 700 °C and is lower compared to dense 8YSZ ceramics. The activation energy for electrical conductivity at 500–1050 °C for all the samples varies in a narrow range of 1.0–1.1 eV (Table 3).
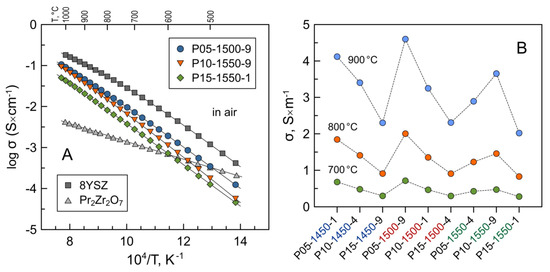
Figure 8.
(A) Temperature dependence of electrical conductivity of selected Pr-substituted 5YSZ ceramics in air; (B) isothermal data on the electrical conductivity of Pr-substituted 5YSZ samples in air at 700, 800 and 900 °C. The data on 8YSZ (this work) and pyrochlore-type Pr2Zr2O7 [44] are shown for comparison.
The measurements of oxygen ion transference numbers of selected samples by the modified EMF technique demonstrated that these materials are predominantly oxygen ionic conductors under oxidizing conditions close to atmospheric oxygen pressure (Table 4). The contribution of electronic conductivity, estimated as σe = σ(1 − ), to the total conductivity at 700–900 °C increases with increasing praseodymium content from 0.3–0.4% for P05-1500-9 to 0.9–1.9% for P15-1500-4 at p(O2) = 0.21–1.00 atm. A minor increase in the electronic contribution can be attributed to the introduction of p-type electronic transport with an increasing concentration of Pr cations in the zirconia lattice [23,24] and/or to the presence of a non-negligible fraction of the pyrochlore-type phase in the latter sample. Stoichiometric Pr2Zr2O7 is known to be a mixed ionic–electronic conductor with prevailing p-type electronic conductivity under oxidizing conditions [45,47]. The total conductivity of Pr2Zr2O7 at 700–1000 °C is 0.5–1.5 orders of magnitude lower compared to 8YSZ and the studied Pr-substituted 5YSZ ceramics (Figure 8A). Thus, the segregation of the pyrochlore-type phase has a negative impact on the total electrical conductivity of ceramic samples.
Table 4.
Observed Eexp/Eth values and oxygen-ion transference numbers of Pr-substituted 5YSZ ceramics determined by the modified EMF technique under air/O2 gradient.
3.4. Analysis of the Impact of the Firing Conditions and Pr Content
The results of the firing experiments designed using Taguchi planning to assess the impact of Pr additions and firing conditions on the density ρexp, structural features (pyrochlore-to-fluorite peak area ratio A(222)P/A(111)F, lattice parameter of the main fluorite phase aF), and electrical properties (electrical conductivity at 700 °C and corresponding activation energy EA) of the 5YSZ ceramics are summarized in Table 3.
A preliminary examination of the changes in the density of the fired ceramics (Table 3) suggests a prevailing effect of Pr contents, and this is confirmed by the correlation matrix calculated with standard Microsoft Excel formulae (Table 5). This negative dependence on Pr contents is counterintuitive, taking into account the higher atomic mass of Pr relative to Zr and Y, and indicates a negative impact on sintering, which cannot be reversed by increasing the firing temperature. Note also the negative correlation between density and lattice parameter. In fact, the lattice parameter of the main fluorite phase increases with nominal Pr contents and also with firing conditions, as revealed by the correlation matrix (Table 5) and as expected for the incorporation of larger Pr3+ cations into the fluorite YSZ lattice.
Table 5.
Correlation matrix for the impact of firing conditions and contents of Pr on the properties of ceramics (density, lattice parameter of the main fluorite phase, pyrochlore-to-fluorite peak ratio, conductivity at 700 °C and activation energy).
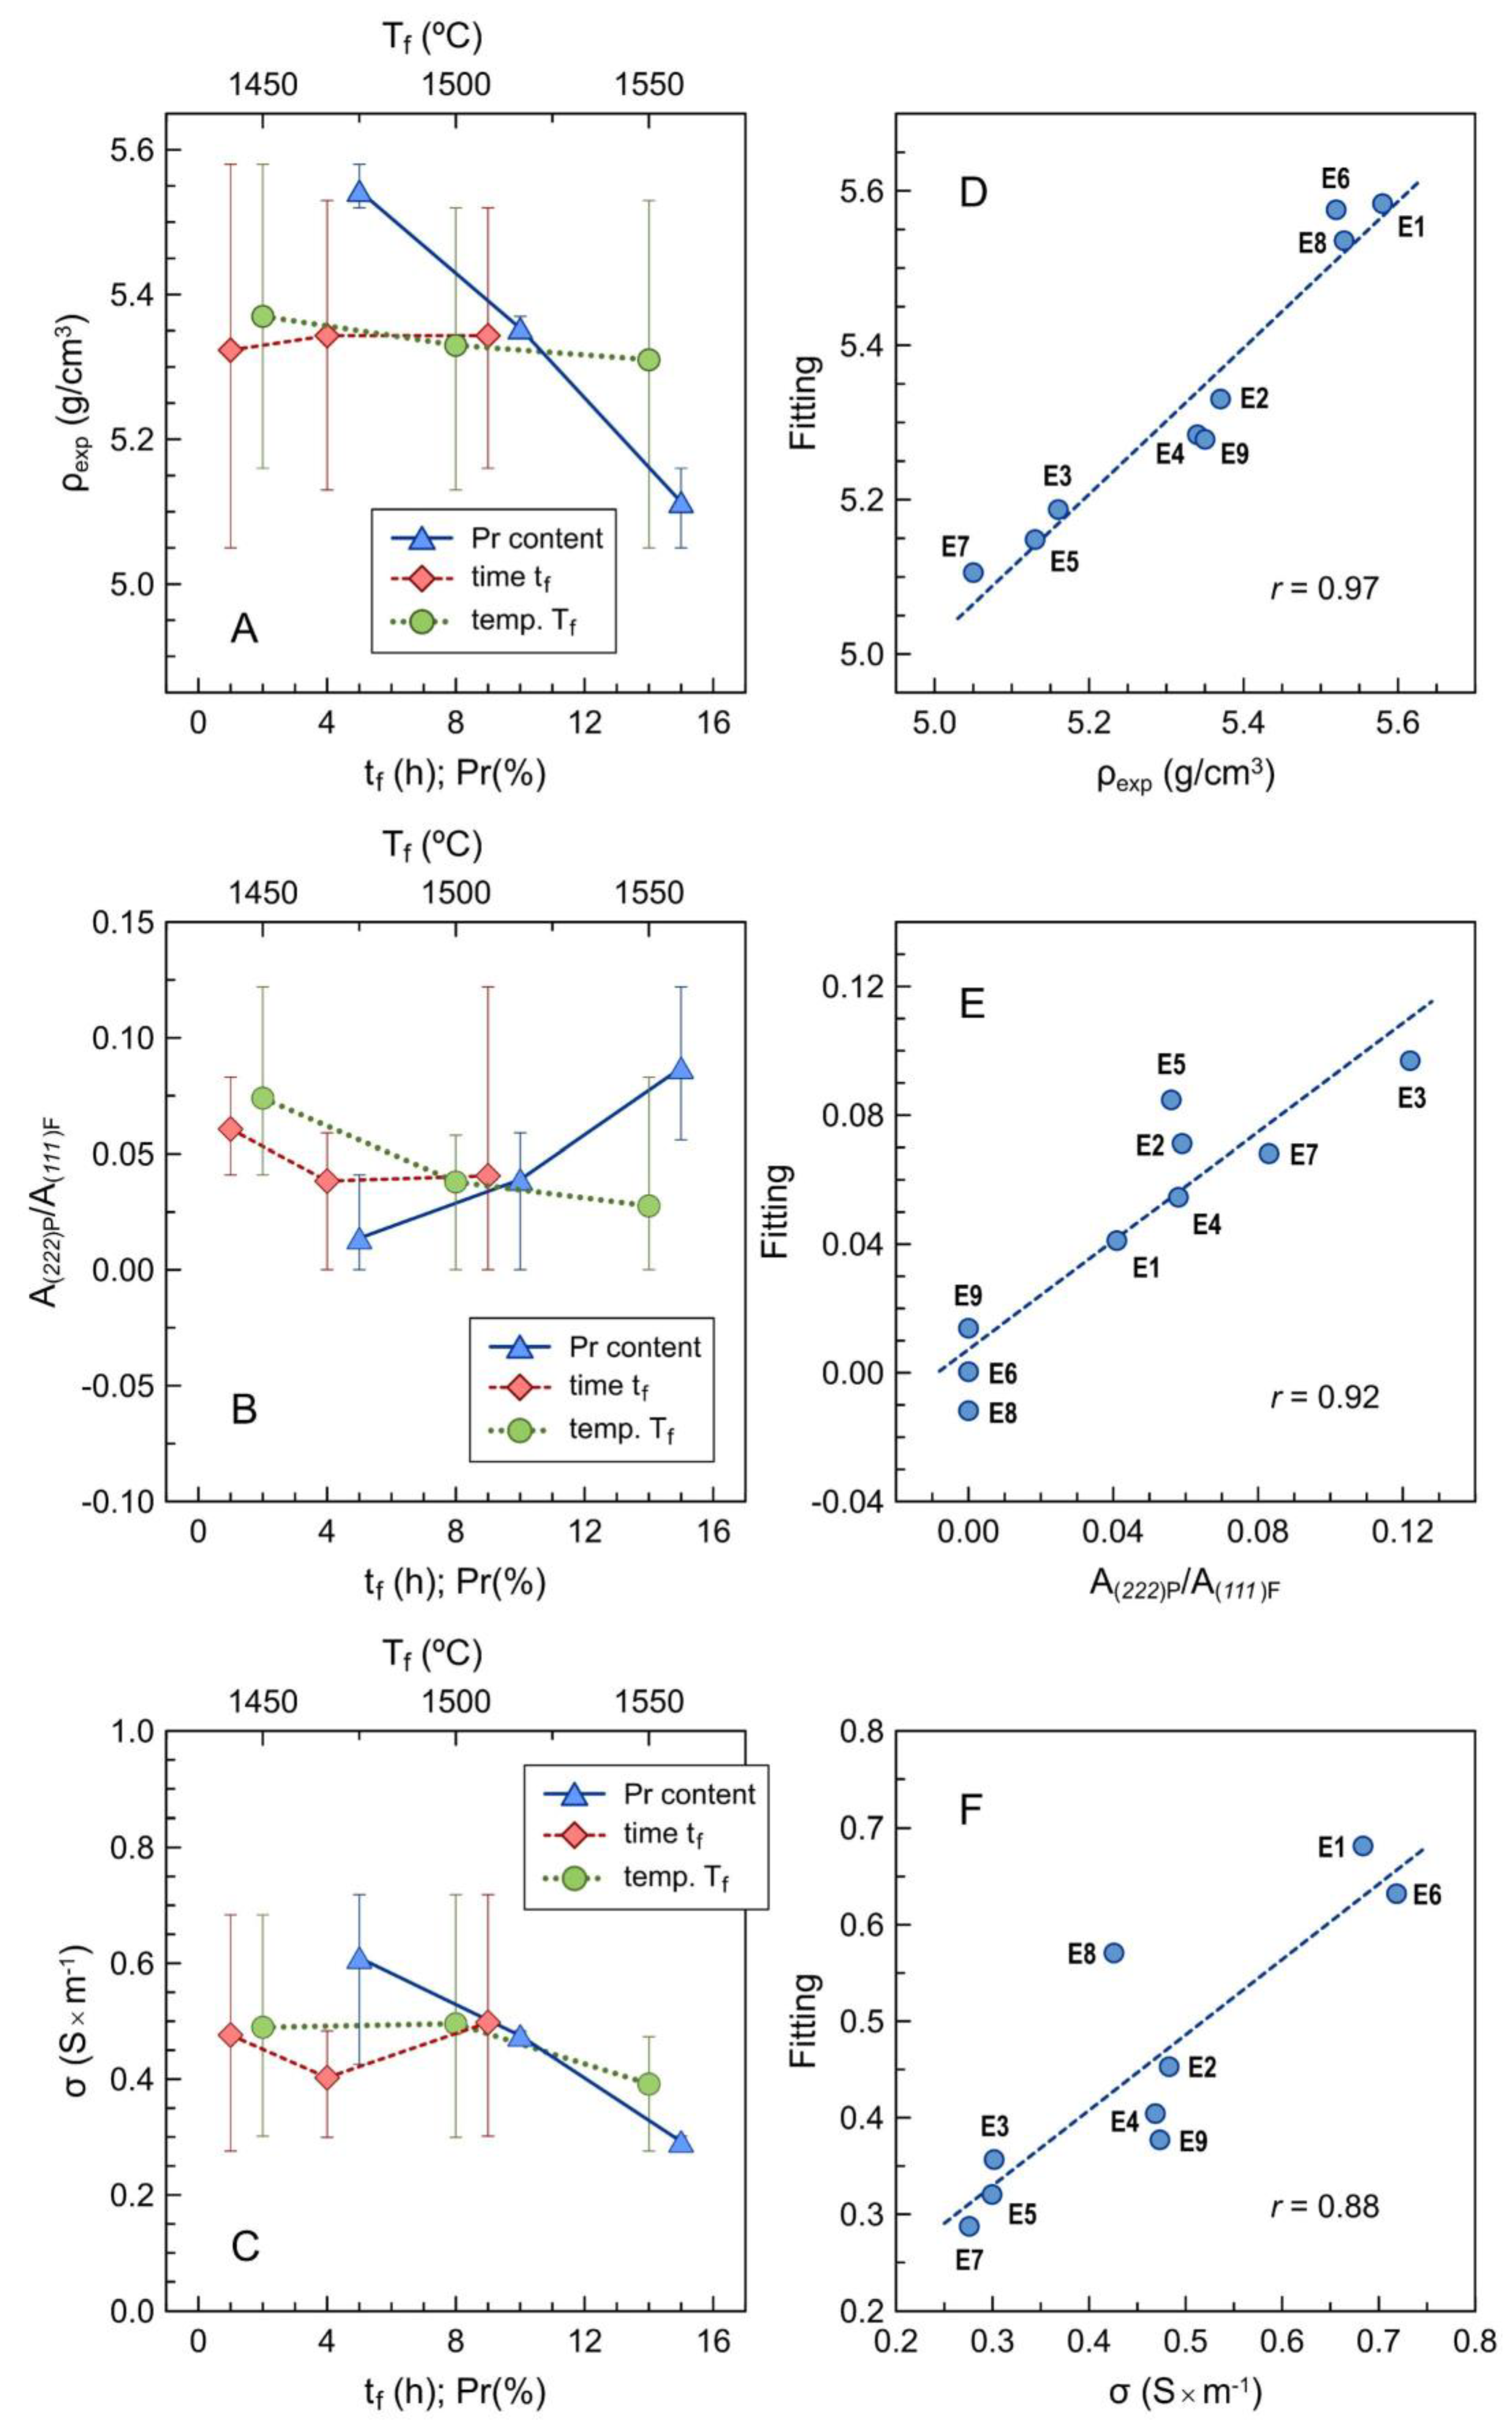
The dependence of density on individual parameters is also demonstrated by averaging the results for every level, as shown in Figure 9A. This confirms the prevailing dependence on Pr contents, and that a poor signal-to-noise ratio prevents statistical relevance for dependence on other parameters.
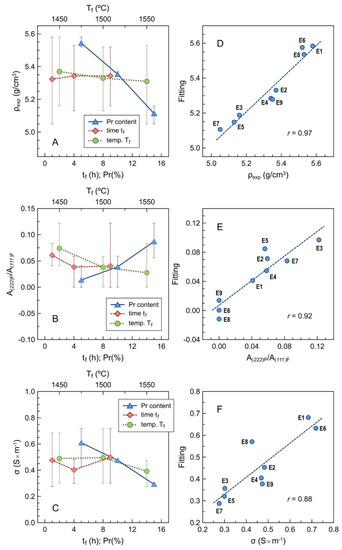
Figure 9.
Averaged results for the dependence of (A) density, (B) pyrochlore-to-fluorite peak area ratio and (C) electrical conductivity at 700 °C on the individual factors, with corresponding errors bars to emphasize the signal-to-noise ratio; (D–F) multivariate fitting vs. experimental results for the corresponding parameters using Equations (8) and (9). The fitting parameters are given in Table 6.
The relative contents of the pyrochlore phase also increase mainly with nominal Pr contents, as indicated by the area peak ratio A(222)P/A(111)F (Figure 9B). The opposite effects of firing temperature are probably due to kinetic limitations by the direct firing of precursor powder mixtures. As already mentioned, the actual contents of Pr are lower than expected for the onset of the pyrochlore phase in either binary ZrO2–Pr2O3 [19,20,21,22] or ternary ZrO2–Y2O3–Ln2O3 (Ln = La, Nd, Sm) systems [36,37,38,39,40,41,42] under equilibrium conditions at elevated temperatures.
The impact on the conductivity is mainly ascribed to the contents of Pr (Figure 9C), and this may be attributed to a combination of microstructural and structural changes, as revealed also by a positive correlation between conductivity and density (and therefore an inverse correlation between conductivity and porosity), and negative correlation with the lattice parameter of the main conducting phase (Table 5). The effects of activation energy are also consistent with structural changes, which combine the effects of nominal Pr contents and also the effects of firing temperature and firing time (Table 5), which contribute to an increase in the effective content of the main fluorite phase.
Further confirmation for the dependence of density, structural features and properties on the nominal composition and the firing conditions were obtained by multivariate fitting. However, one performed the following transformation of these variables, as expected for the thermal activation of the sluggish microstructural or structural changes after direct firing. For the effects on density:
This may be linearized by reverting to logarithmic scales:
where Tf is in K, tf is in h, Pr content is in nominal % (see Table 1), and the multivariate fitting (Figure 9D) yields the parameters shown in Table 6. Table 6 also shows the overall changes (Δρ) expected on varying each factor independently while keeping the other factors at their intermediate level; this is consistent with the corresponding correlations in Table 5.
Table 6.
Multivariate fitting coefficients, Equations (8) and (9), for the dependence of the properties of ceramics on firing conditions and praseodymium contents.
Similar transformations of independent variables were assumed to perform multivariate analysis for changes in conductivity and its activation energy, and also for the lattice parameter. This dependence for a generic property Y is given by:
and the relevant coefficients and impact on these properties are shown in Table 6. These values confirm the guidelines provided by the correlation matrix. The improved quality of multivariate fitting (Figure 9D–F) can be assessed by comparing the values of the correlation coefficient r shown in Table 6 with the correlation matrix in Table 5.
Multivariate analysis of the effects on the onset of the pyrochlore phase cannot be based on log-log scales since this phase is absent in some samples or its residual content is below the detection limit of X-ray diffraction. In this case, multivariate analysis was performed without the transformation of independent variables, yielding:
where Tf is in °C, tf is in h, and Pr content is in nominal %.
The revealed effects of firing conditions and praseodymia additions on the properties of 5YSZ ceramics are in agreement with the proposed pathway of the phase evolution during the direct firing of pelletized precursors and underline the key role of kinetic limitations. Increasing praseodymia additions results mainly in a larger fraction of the low-conducting pyrochlore phase and a lower density (a higher porosity). This, in turn, has a negative effect on the ionic conductivity, which is lower compared to dense 8YSZ ceramics (Figure 8A). Increasing the time and temperature of firing promotes the homogenization of the samples with corresponding effects on the properties, but the statistical relevance of these variables within the selected ranges is lower compared to PrOy additions.
3.5. Thermal Expansion
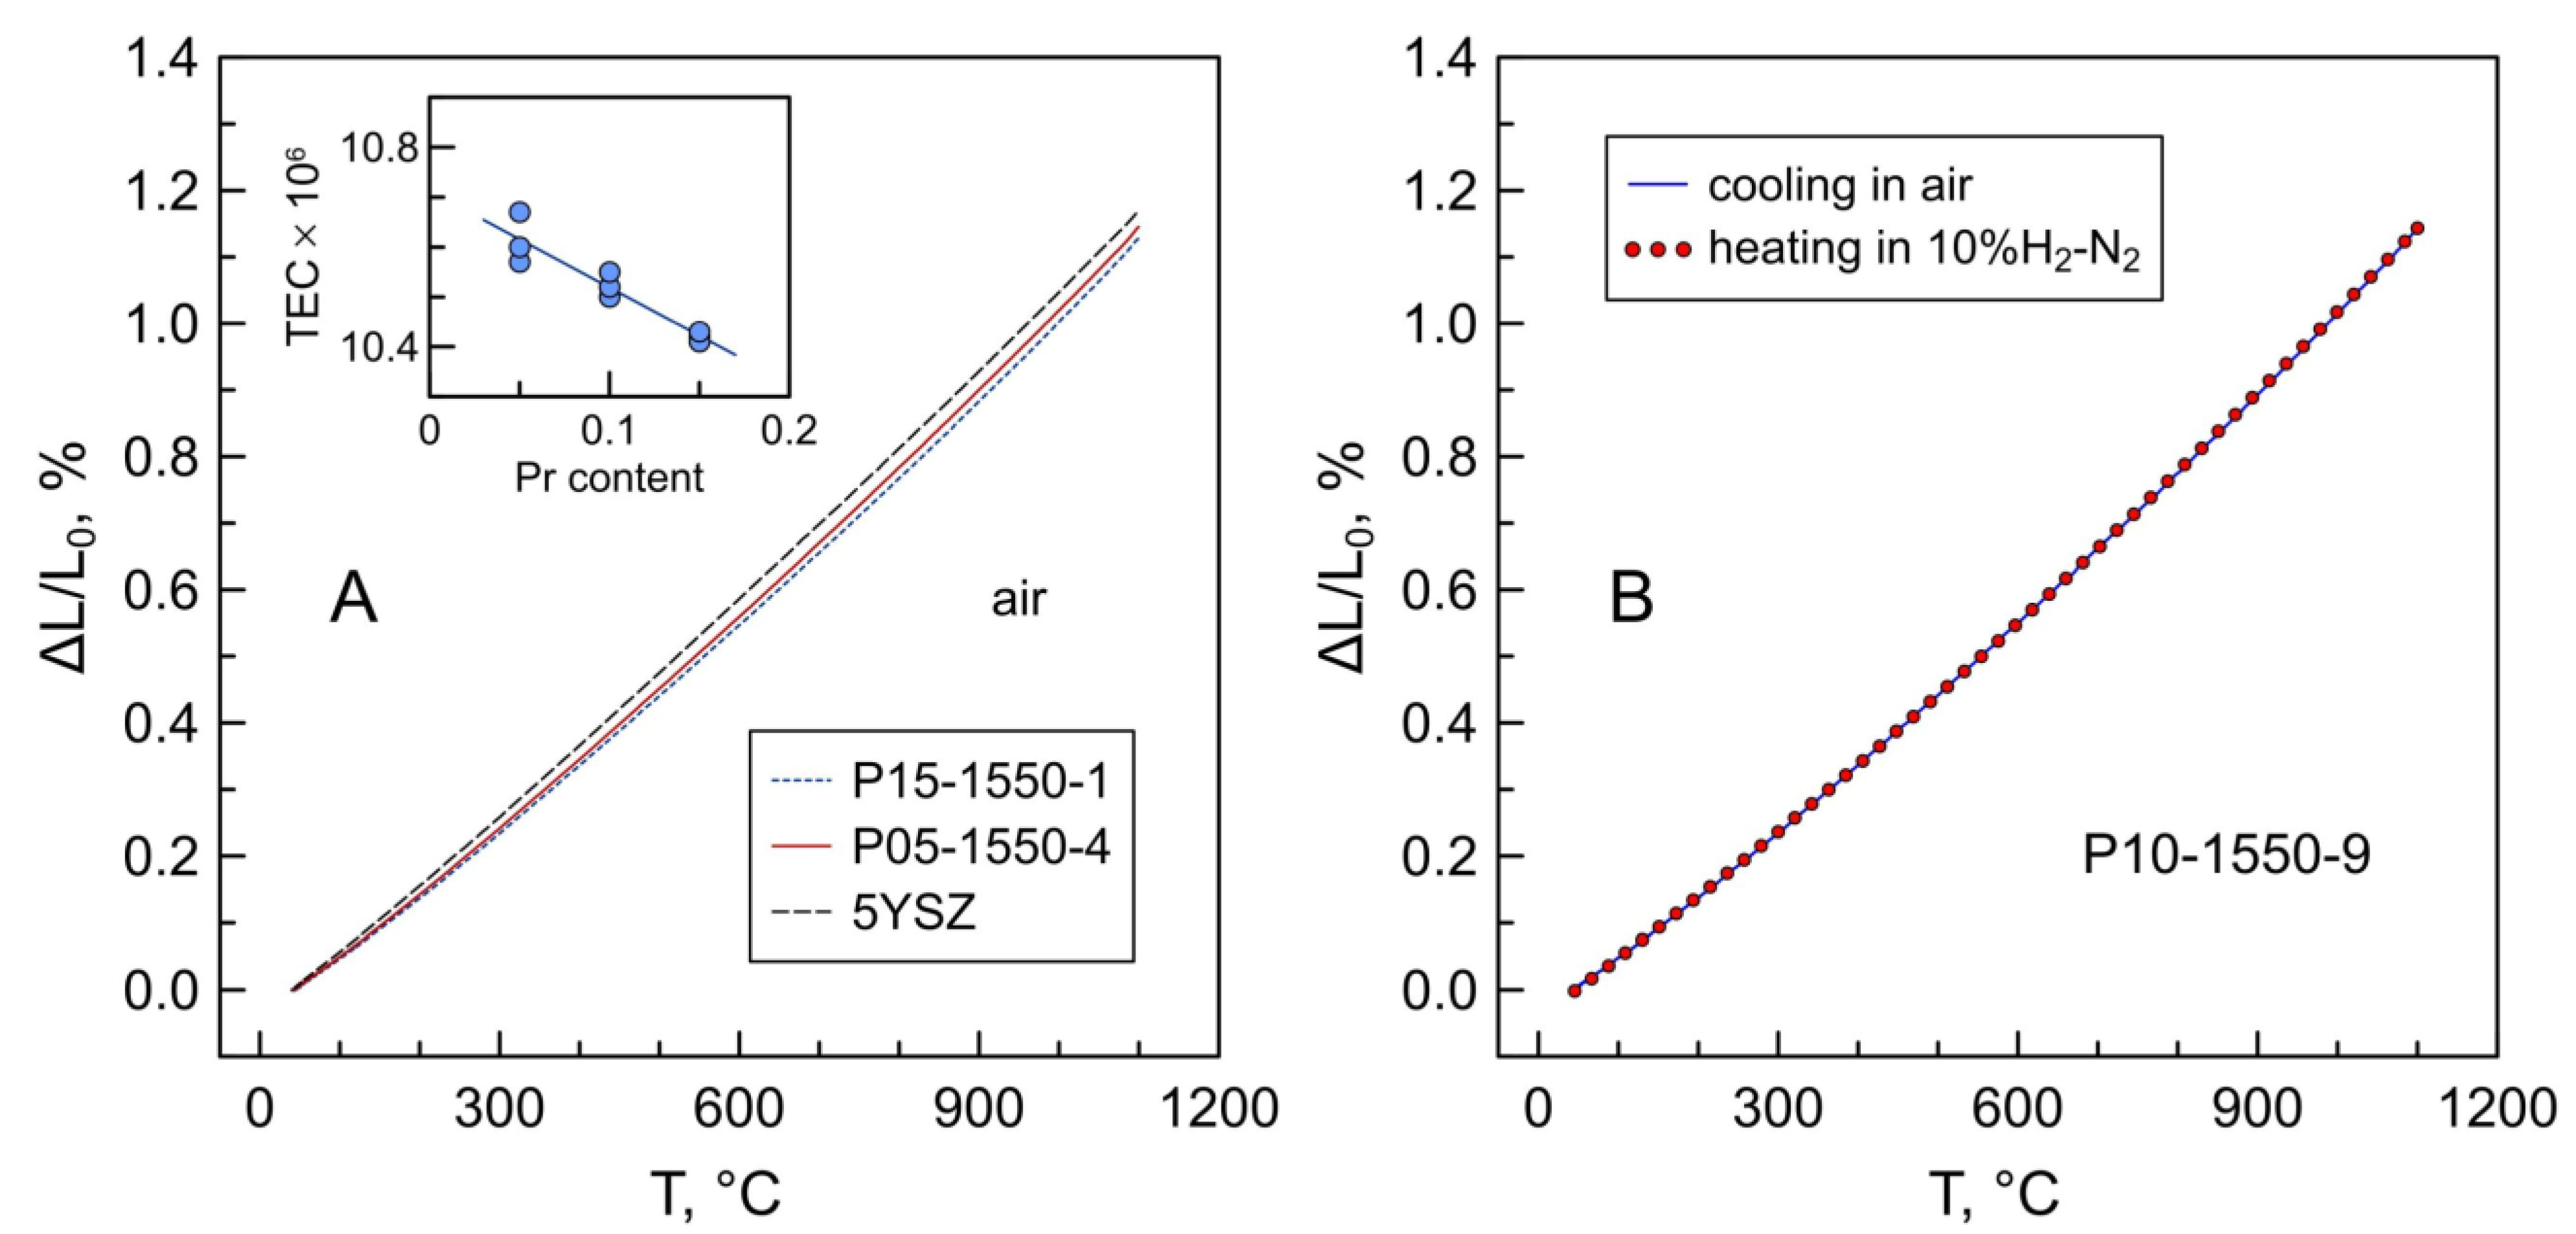
The dilatometric curves of Pr-substituted 5YSZ on temperature cycling between room temperature and 1100 °C in air resemble the dilatometric behavior of 5YSZ and 8YSZ ceramics. No evidence of chemical contribution to the thermal expansion of the studied materials was detected under oxidizing conditions. This is in agreement with the TGA data showing a nearly constant oxidation state of praseodymium cations under these conditions (Figure 6A). The average thermal expansion coefficients (TECs) tend to decrease slightly with increasing praseodymium content (inset in Figure 10A and Table 7). A similar trend is observed for the (ZrO2)1-x(Y2O3)x system, for which a decrease in thermal expansion with increasing yttria content (despite increasing lattice parameter) was attributed to the increase in the binding energy of the crystal and the bulk modulus [48]. The average TECs of Pr-substituted 5YSZ perfectly match that of the conventional 8YSZ solid electrolyte (Table 7).
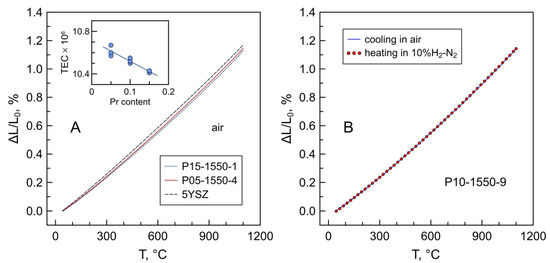
Figure 10.
(A) Dilatometric curves of 5YSZ and Pr-substituted 5YSZ ceramics in air; (B) dilatometric curves of P10-1550-9 ceramics on cooling in air followed by heating in reducing 10%H2–N2 atmosphere. The inset shows the trend in variation of the average TEC with nominal praseodymium content.
Table 7.
Average thermal expansion coefficients of Pr-substituted 5YSZ ceramics in air at 25–1100 °C.
3.6. Behavior on Redox Cycling
The exposure to reducing conditions is expected to induce the complete reduction in the fraction of Pr4+ to Pr3+ and, therefore, a lattice expansion caused by the difference in ionic radii of tetravalent and trivalent praseodymium. However, as discussed above, the fraction of Pr4+ in the studied samples is low, ≤2% of the total praseodymium content. As a result, the transformation of the residual Pr4+ to Pr3+ on heating in a 10%H2–N2 atmosphere has a negligible effect on the thermochemical expansion of Pr-substituted 5YSZ ceramics (Figure 10B). This behavior is different from, for instance, Mn-substituted 5YSZ ceramics where Mn3+ ↔ Mn2+ redox changes cause substantial dimensional variations on thermal cycling between reducing and oxidizing atmospheres [15].
One should also note that the stabilization of the prevailing 3+ oxidation state of praseodymium cations under oxidizing conditions results in a low oxygen storage capacity. The estimations from the thermogravimetric data (Figure 6B) showed that the oxygen storage capacity of the samples P05-1500-9 and P10-1550-9 at 900 °C is limited to 2.0–2.5 µmol/g on cycling between oxidizing and highly reducing conditions.
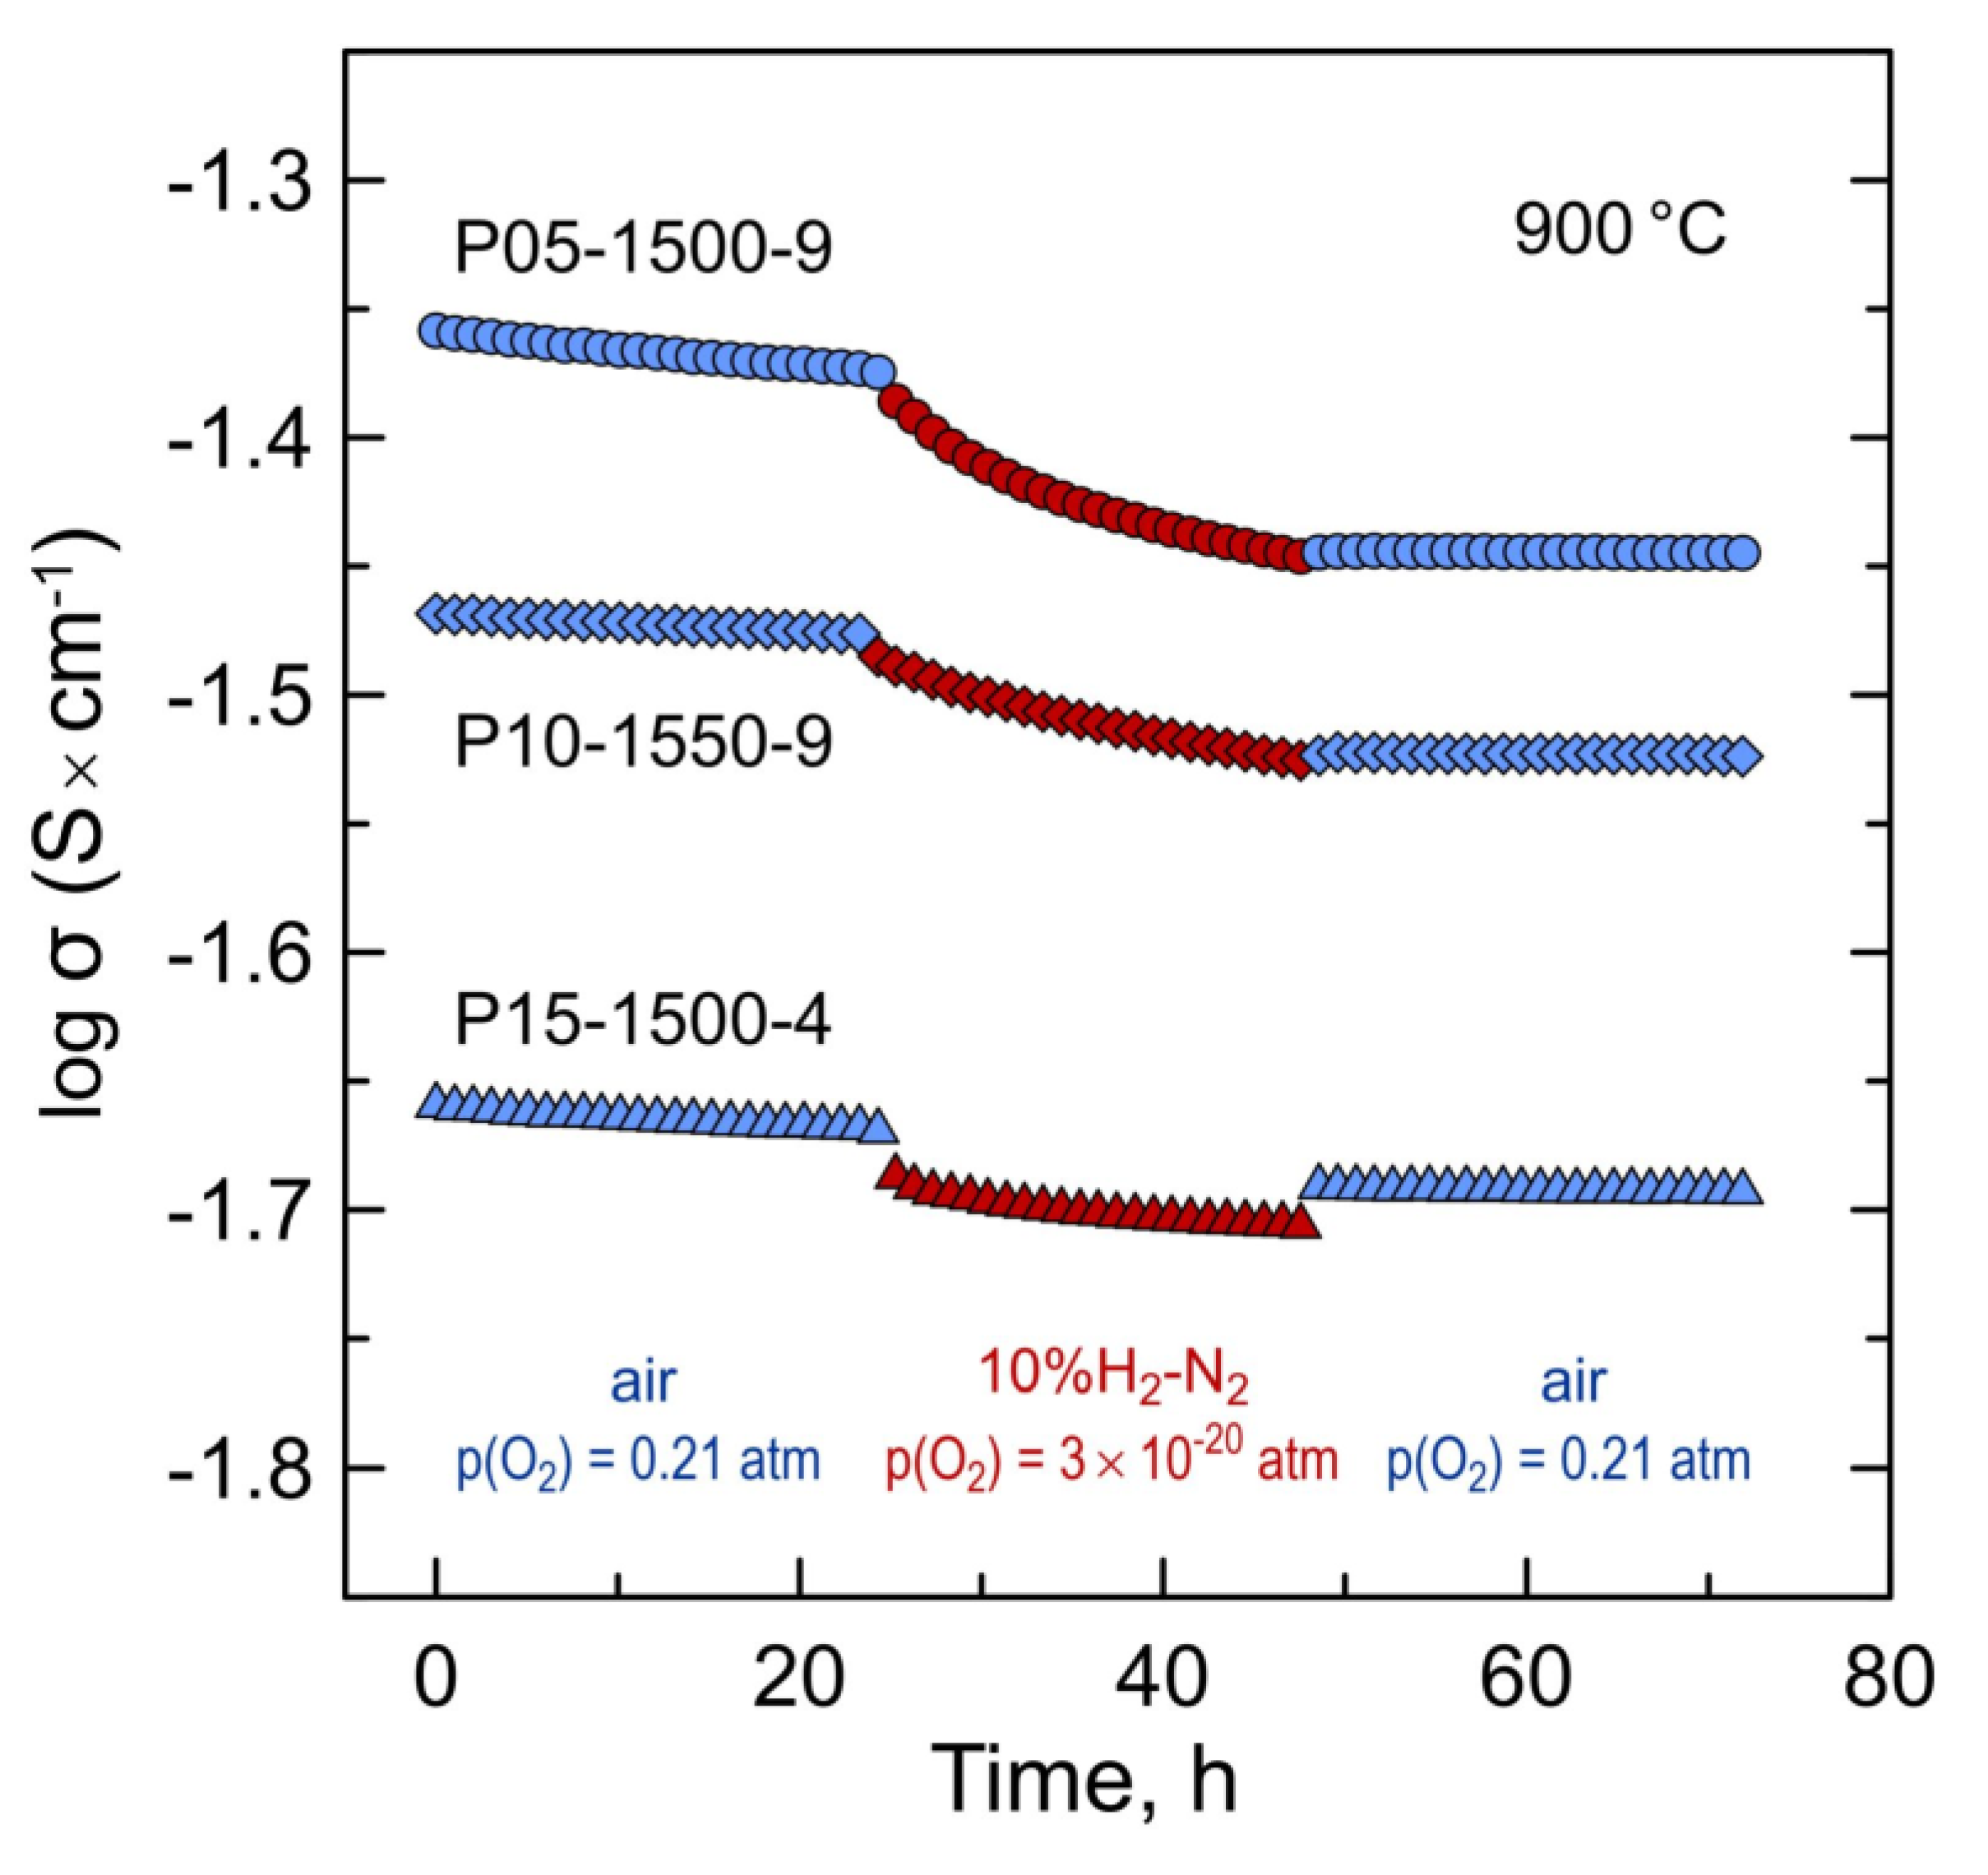
The exposure to a reducing atmosphere results, however, in irreversible changes in electrical conductivity. Figure 11 illustrates the variations in the electrical conductivity of selected samples in a relatively short reduction–oxidation cycle at 900 °C. Switching from oxidizing to reducing conditions induces a slow decrease in the conductivity with time which cannot be attributed to a drop in partial p-type electronic conductivity. On returning back to atmospheric oxygen pressure, the level of conductivity is not recovered to the initial level, but remains stable with time.

Figure 11.
Variations of electrical conductivity of selected Pr-substituted 5YSZ samples in one ox → red → ox cycle at 900 °C.
The changes in electrical conductivity in ox–red–ox cycles coincide with the thermogravimetric data for powdered samples in a similar cycle showing that the weight changes and, therefore, the Pr oxidation state was not fully reversible after re-oxidation at 900 °C (Figure 6B). In particular, the average oxidation state of Pr cations after one redox cycle at 900 °C dropped irreversibly from 3.021+ to 3.016+ for P05-1500-9 and from 3.013+ to 3.008+ for P10-1550-9. Thus, the changes in electrical conductivity are interrelated with the changes in the oxidation state of praseodymium. At the same time, no structural alterations could be detected by XDR after short-term redox cycles at 900 °C. The variations in the calculated fluorite lattice parameters of P05-1500-9 and P10-1550-9 samples after either thermogravimetric or electrical studies were ≤0.015%.
Note that the aging of conductivity (a slow decrease in ionic conductivity) with time at elevated temperatures, around 1000 °C, is known for yttria-stabilized zirconia [30,50]. The proposed mechanisms responsible for aging include a continuous transformation to a lower conducting phase (i.e., cubic to tetragonal) and oxygen vacancy ordering processes. Most likely, similar phenomena are responsible for the conductivity changes in Pr-substituted 5YSZ ceramics. In particular, according to the available phase diagrams [19,20,21], the thermodynamically equilibrium phase composition of the (ZrO2)1-x(PrOy)x system for x = 0.02–0.42 at 900 °C corresponds to a mixture of monoclinic ZrO2- and cubic Pr2Zr2O7-based phases. Apparently, exposure to reducing conditions may facilitate the processes that cause a reduction in conductivity with time.
4. Conclusions
The dissolution of praseodymium oxide in 5YSZ at 1450–1550 °C is kinetically limited and occurs via the formation of pyrochlore-type Pr2Zr2O7 intermediate. High-temperature treatments result in the stabilization of Pr3+ in fluorite or pyrochlore structures. The fraction of Pr4+ at 600–1000 °C in air is ≤2%. The praseodymium content has the main impact on the properties of [(ZrO2)0.95(Y2O3)0.05]1-x[PrOy]x ceramics prepared by the direct firing of compacted 5YSZ + PrOy mixtures. Increasing praseodymia additions results in a larger fraction of the pyrochlore-type phase and larger porosity, which limit the total electrical conductivity to 2.0–4.6 S/m at 900 °C and 0.28–0.68 S/m at 700 °C in air. Increasing the time and temperature of firing promotes the phase and microstructural homogenization of the ceramics, but with a comparatively low effect on density and conductivity. 5YSZ with praseodymia additions remains a predominantly oxygen ionic conductor. The p-type electronic contribution to the total electrical conductivity increases with Pr content, but does not exceed 2% for x = 0.15 at 700–900 °C. The average thermal expansion coefficients of the prepared ceramics are in the range of 10.4–10.7 ppm/K slightly decreasing with praseodymium additions. Exposure to reducing atmospheres seems to facilitate the low-temperature phase re-equilibration.
Author Contributions
Conceptualization and methodology, J.R.F. and A.Y.; investigation, A.N., A.B., A.Ż. and A.Y.; data analysis, A.N., J.R.F. and A.Y.; writing—original draft preparation, J.R.F., A.N. and A.Y.; writing—review and editing, A.N., J.R.F., A.B., A.Ż. and A.Y.; supervision, project administration and funding acquisition, J.R.F. and A.Y. All authors have read and agreed to the published version of the manuscript.
Funding
PhD scholarship of A.N. is funded by the FCT (grant SFRH/BD/116853/2016). This work was supported by the projects HEALING (POCI-01-0145-FEDER-032036) and CARBOSTEAM (POCI-01-0145-FEDER-032295) funded by FEDER through COMPETE2020—Programa Operacion-al Competitividade e Internacionalização (POCI) and by national funds through FCT/MCTES, and by the project CICECO—Aveiro Institute of Materials (UIDB/50011/2020 and UIDP/50011/2020), financed by national funds through the FCT/MCTES and when appropriate co-financed by FEDER under the PT2020 Partnership Agreement. A.Ż. gratefully acknowledges financial support from the Ministry of Science and Higher Education of the Republic of Poland for Statutory Grant CPE/098/STAT-MN-AZ/20 in the Institute of Power Engineering.
Data Availability Statement
The data are contained within the article and/or available from the corresponding author upon reasonable request.
Conflicts of Interest
The authors declare no conflict of interest.
References
- Jo, S.; Sharma, B.; Park, D.H.; Myung, J. Materials and nano-structural processes for use in solid oxide fuel cells: A review. J. Kor. Ceram. Soc. 2020, 57, 135–151. [Google Scholar] [CrossRef]
- Ahmed, K.; Föger, K. Perspectives in solid oxide fuel cell-based microcombined heat and power systems. J. Electrochem. Energy Conv. Stor. 2017, 14, 031005. [Google Scholar] [CrossRef]
- Zheng, Y.; Wang, J.; Yu, B.; Zhang, W.; Chen, J.; Qiao, J.; Zhang, J. A review of high temperature co-electrolysis of H2O and CO2 to produce sustainable fuels using solid oxide electrolysis cells (SOECs): Advanced materials and technology. Chem. Soc. Rev. 2017, 46, 1427–1463. [Google Scholar] [CrossRef]
- Ye, L.; Xie, K. High-temperature electrocatalysis and key materials in solid oxide electrolysis cells. J. Energy Chem. 2021, 54, 736–745. [Google Scholar] [CrossRef]
- Hauch, A.; Küngas, R.; Blennow, P.; Hansen, A.B.; Hansen, J.B.; Mathiesen, B.V.; Mogensen, M.B. Recent advances in solid oxide cell technology for electrolysis. Science 2020, 370, eaba6118. [Google Scholar] [CrossRef]
- Mogensen, M.B.; Chen, M.; Frandsen, H.L.; Graves, C.; Hansen, J.B.; Hansen, K.V.; Hauch, A.; Jacobsen, T.; Jensen, S.H.; Skafte, T.L.; et al. Reversible solid-oxide cells for clean and sustainable energy. Clean Energy 2019, 3, 175–201. [Google Scholar] [CrossRef]
- Wang, Y.; Li, W.; Ma, L.; Li, W.; Liu, X. Degradation of solid oxide electrolysis cells: Phenomena, mechanisms, and emerging mitigation strategies-A review. J. Mater. Sci. Technol. 2020, 55, 35–55. [Google Scholar] [CrossRef]
- Chen, K.; Jiang, S.P. Review-Materials degradation of solid oxide electrolysis cells. J. Electrochem. Soc. 2016, 163, F3070–F3083. [Google Scholar] [CrossRef]
- Khan, M.S.; Xu, X.; Knibbe, R.; Zhu, Z. Air electrodes and related degradation mechanisms in solid oxide electrolysis and reversible solid oxide cells. Renew. Sustain. Energy Rev. 2021, 143, 110918. [Google Scholar] [CrossRef]
- Graves, C.; Ebbesen, S.D.; Jensen, S.H.; Simonsen, S.B.; Mogensen, M.B. Eliminating degradation in solid oxide electrochemical cells by reversible operation. Nat. Mater. 2015, 14, 239–244. [Google Scholar] [CrossRef] [PubMed]
- Chen, K.; Liu, S.S.; Ai, N.; Koyama, M.; Jiang, S.P. Why solid oxide cells can be reversibly operated in solid oxide electrolysis cell and fuel cell modes? Phys. Chem. Chem. Phys. 2015, 17, 31308–31315. [Google Scholar] [CrossRef] [PubMed]
- Pomykalska, D.; Bućko, M.M.; Rękas, M. Electrical conductivity of MnOx–Y2O3–ZrO2 solid solutions. Solid State Ionics 2010, 181, 48–52. [Google Scholar] [CrossRef]
- Li, N.; Keane, M.; Mahapatra, M.K.; Singh, P. Mitigation of the delamination of LSM anode in solid oxide electrolysis cells using manganese-modified YSZ. Int. J. Hydrogen Energy 2013, 38, 6298–6303. [Google Scholar] [CrossRef]
- Natoli, A.; Yaremchenko, A.; Frade, J.R. Structural design of 5 mol.% yttria partially stabilized zirconia (5Y-PSZ) by addition of manganese oxide and direct firing. Ceramics 2020, 3, 345–358. [Google Scholar] [CrossRef]
- Natoli, A.; Arias-Serrano, B.I.; Rodríguez-Castellón, E.; Żurawska, A.; Frade, J.R.; Yaremchenko, A.A. Mixed ionic-electronic conductivity, redox behavior and thermochemical expansion of Mn-substituted 5YSZ as an interlayer material for reversible solid oxide cells. Materials 2021, 14, 641. [Google Scholar] [CrossRef] [PubMed]
- Adachi, G.; Imanaka, N. The binary rare earth oxides. Chem. Rev. 1998, 98, 1479–1514. [Google Scholar] [CrossRef] [PubMed]
- Hyde, B.G.; Bevan, D.J.M.; Eyring, L. On the praseodymium+oxygen system. Phil. Trans. R. Soc. Lond. A 1966, 259, 583–614. [Google Scholar] [CrossRef]
- Knop, O.; Brisse, F.; Castelliz, L. Pyrochlores. V. Thermoanalytic, X-ray, neutron, infrared, and dielectric studies of A2Ti2O7 titanates. Can. J. Chem. 1969, 47, 971–990. [Google Scholar] [CrossRef]
- Krasilnikov, M.D.; Vinokurov, I.V.; Nikitina, S.D. Physicochemical properties of solid solutions in the zirconium dioxide-praseodymium oxide system in air. In Proceedings of the Physical Chemistry and Electrochemistry of Molten and Solid Electrolytes, Abstracts of 7th All-Union Conference on Physical Chemistry of Ionic Melts and Solid Electrolytes, Sverdlovsk, Russia, 18–20 September 1979; Ural Scientific Center, Academy of Sciences of USSR: Sverdlovsk, Russia, 1979; Volume 3, pp. 123–125. [Google Scholar]
- Krasilnikov, M.D. Physicochemical Study of the Zirconia-Praseodymia-Ytterbia System. Ph.D. Thesis, Institute of Chemistry of Silicates, Academy of Sciences of USSR, Leningrad, Russia, 1978. [Google Scholar]
- Yokokawa, H.; Sakai, N.; Kawada, T.; Dokiya, M. Phase diagram calculations for ZrO2 based ceramics: Thermodynamic regularities in zirconate formation and solubilities of transition metal oxides. In Science and Technology of Zirconia V, Proceedings of Fifth International Conference on the Science and Technology of Zirconia, Melbourne, Australia, 16–21 August 1992; Badwal, S.P.S., Bannister, M.J., Hannink, R.H.J., Eds.; Technomic Publishing Co., Inc.: Lancaster, PA, USA, 1993; pp. 59–68. [Google Scholar]
- Lambert Bates, J.; Weber, W.J.; Griffin, C.W. Solid oxide fuel cell electrodes based on In2O3-PrO1.83-ZrO2. In Proceedings of the First International Symposium on Solid Oxide Fuel Cells, Hollywood, FL, USA, 16–18 October 1989; ECS Proceedings Volume 1989-19. Electrochemical Society: Pennington, NJ, USA, 1989; pp. 141–156. [Google Scholar] [CrossRef]
- Volchenkova, Z.S. Electrical conductivity of solid oxides. XII. The system ZrO2-PrO1.83; Institute of Electrochemistry, Ural Branch of Academy of Sciences of USSR: Sverdlovsk, Russia, 1966; pp. 139–148. [Google Scholar]
- Volchenkova, Z.S. Ionic and electronic conductivity of samples from the ZrO2-PrO1.83 system. In Chemistry of High-Temperature Materials, Proceedings of Second All-Union Conference on the High-Temperature Chemistry of Oxides, Leningrad, Russia, 26–29 November 1965; Springer Science + Business Media: New York, NY, USA, 1969; pp. 69–73. [Google Scholar]
- Narula, C.K.; Haack, L.P.; Chun, W.; Jen, H.W.; Graham, G.W. Single-phase PrOy-ZrO2 materials and their oxygen storage capacity: A comparison with single-phase CeO2-ZrO2, PrOy-CeO2, and PrOy-CeO2-ZrO2 materials. J. Phys. Chem. B 1999, 103, 3634–3639. [Google Scholar] [CrossRef]
- Bellakki, M.B.; Shivakumara, C.; Baidya, T.; Prakash, A.S.; Vasanthacharya, N.Y.; Hegde, M.S. Synthesis, structure and oxygen-storage capacity of Pr1-xZrxO2-δ and Pr1-x-yPdyZrxO2-δ. Mater. Res. Bull. 2008, 43, 2658–2667. [Google Scholar] [CrossRef]
- Badenes, J.A.; Llusar, M.; Calbo, J.; Tena, M.A.; Monrós, G. Influence of synthesis method and praseodymium doping on properties of yttrium stabilised zirconia. Br. Ceram. Trans. 2001, 100, 251–255. [Google Scholar] [CrossRef]
- Huang, J.Q. Characterization of Mixed Conducting Praseodymia-Yttria-Zirconia, and a New Method for Detecting Electronic Leakage in Blocking Electrode Technique. Ph.D. Thesis, University of Pennsylvania, Philadelphia, PA, USA, 2000. [Google Scholar]
- Huang, J.Q.; Worrell, W.L. Synthesis and characterization of mixed-conducting praseodymia-doped yttria-stabilized zirconia. In Proceedings of the Symposium on High-Temperature Materials, Philadelphia, PA, USA, 13–15 May 2002; ECS Proceedings Volume 2002-5. Electrochemical Society: Pennington, NJ, USA, 2002; pp. 16–25. [Google Scholar]
- Liu, T.; Zhang, X.; Wang, X.; Yu, J.; Li, L. A review of zirconia-based solid electrolytes. Ionics 2016, 22, 2249–2262. [Google Scholar] [CrossRef]
- Mori, T. Taguchi Methods: Benefits, Impacts, Mathematics, Statistics, and Applications; ASME: New York, NY, USA, 2011. [Google Scholar]
- Gorelov, V.P. Transport number determinations in ionic conductors using EMF measurements with active load. Sov. Electrochem. 1988, 24, 1272–1274. [Google Scholar]
- Kharton, V.V.; Yaremchenko, A.A.; Viskup, A.P.; Mather, G.C.; Naumovich, E.N.; Marques, F.M.B. Ionic and p-type electronic conduction in LaGa(Mg,Nb)O3-δ perovskites. Solid State Ionics 2000, 128, 79–90. [Google Scholar] [CrossRef]
- Pascual, M.J.; Kharton, V.V.; Tsipis, E.V.; Yaremchenko, A.A.; Lara, C.; Durán, A.; Frade, J.R. Transport properties of sealants for high-temperature electrochemical applications: RO-BaO-SiO2 (R = Mg, Zn) glass-ceramics. J. Eur. Ceram. Soc. 2006, 26, 3315–3324. [Google Scholar] [CrossRef]
- Shannon, R.D. Revised effective ionic radii and systematic studies of interatomic distances in halides and chaleogenides. Acta Crystallogr. A 1976, 32, 751–767. [Google Scholar] [CrossRef]
- Fabrichnaya, O.; Savinykh, G.; Schreiber, G.; Seifert, H.J. Phase relations in the ZrO2–Nd2O3–Y2O3 system: Experimental study and CALPHAD assessment. Int. J. Mat. Res. 2010, 101, 1354–1360. [Google Scholar] [CrossRef]
- Fabrichnaya, O.; Savinykh, G.; Schreiber, G.; Seifert, H.J. Phase relations in the ZrO2-Nd2O3-Y2O3 system: Experimental study and advanced thermodynamic modeling. J. Phase Equilib. Diffus. 2011, 32, 284–297. [Google Scholar] [CrossRef]
- Hinatsu, Y.; Muromura, T. Phase relations in the systems ZrO2-Y2O3-Nd2O3 and ZrO2-Y2O3-CeO2. Mater. Res. Bull. 1986, 21, 1343–1349. [Google Scholar] [CrossRef]
- Andrievskaya, E.R.; Lopato, L.M.; Ragulya, A.V.; Red’ko, V.P. The system ZrO2-Y2O3-La2O3 and prospective materials on its basis. In Ceramics: Getting into the 2000’s-Part A, Advances in Science and Technology Vol.13, Proceedings of the 9th CIMTEC-World Ceramics Congress and Forum on New Materials, Florence, Italy, 14–19 June 1998; Techna: Faenza, Italy, 1999; pp. 109–116. [Google Scholar]
- Colombo, M. Phase relations in ZrO2–La2Zr2O7–Y2Zr2O7 system. Br. Ceram. Trans. 1999, 98, 271–273. [Google Scholar] [CrossRef]
- Fabrichnaya, O.; Savinykh, G.; Schreiber, G. Phase relations in the ZrO2–La2O3–Y2O3–Al2O3 system: Experimental studies and phase modelling. J. Eur. Ceram. Soc. 2013, 33, 37–49. [Google Scholar] [CrossRef]
- Fabrichnaya, O.; Savinykh, G.; Zienert, T.; Schreiber, G.; Seifert, H.J. Phase relations in the ZrO2–Sm2O3–Y2O3–Al2O3 system: Experimental investigation and thermodynamic modelling. Int. J. Mater. Res. 2012, 103, 1469–1487. [Google Scholar] [CrossRef]
- Mitsuyasu, H.; Nonaka, Y.; Eguchi, K. Analysis of solid state reaction at the interface of yttria-doped ceria / yttria-stabilized zirconia. Solid State Ionics 1998, 113–115, 279–284. [Google Scholar] [CrossRef]
- Nelson, J.B.; Riley, D.P. An experimental investigation of extrapolation methods in the derivation of accurate unit cell dimensions of crystals. Proc. Phys. Soc. 1945, 57, 160–177. [Google Scholar] [CrossRef]
- Shlyakhtina, A.V.; Abrantes, J.C.C.; Gomes, E.; Shchegolikhin, A.N.; Vorobieva, G.A.; Maslakov, K.I.; Knotko, A.V.; Shcherbakova, L.G. Effect of Pr3+/Pr4+ ratio on the oxygen ion transport and thermomechanical properties of the pyrochlore and fluorite phases in the ZrO2-Pr2O3 system. Int. J. Hydrogen Energy 2016, 41, 9982–9992. [Google Scholar] [CrossRef]
- Barsoukov, E.; Macdonald, J.R. Impedance Spectroscopy: Theory, Experiment, and Applications, 2nd ed.; John Wiley & Sons, Inc.: Hoboken, NJ, USA, 2005. [Google Scholar]
- Holtappels, P.; Poulsen, F.W.; Mogensen, M. Electrical conductivities and chemical stabilities of mixed conducting pyrochlores for SOFC applications. Solid State Ionics 2000, 135, 675–679. [Google Scholar] [CrossRef]
- Hayashi, H.; Saitou, T.; Maruyama, N.; Inaba, H.; Kawamura, K.; Mori, M. Thermal expansion coefficient of yttria stabilized zirconia for various yttria contents. Solid State Ionics 2005, 176, 613–619. [Google Scholar] [CrossRef]
- Dole, S.L.; Hunter, O., Jr. Elastic properties of hafnium and zirconium oxides stabilized with praseodymium or terbium oxide. J. Am. Ceram. Soc. 1983, 66, C47–C49. [Google Scholar] [CrossRef]
- Hattori, M.; Takeda, Y.; Sakaki, Y.; Nakanishi, A.; Ohara, S.; Mukai, K.; Lee, J.H.; Fukui, T. Effect of aging on conductivity of yttria stabilized zirconia. J. Power Sources 2004, 126, 23–27. [Google Scholar] [CrossRef]

Publisher’s Note: MDPI stays neutral with regard to jurisdictional claims in published maps and institutional affiliations. |
© 2021 by the authors. Licensee MDPI, Basel, Switzerland. This article is an open access article distributed under the terms and conditions of the Creative Commons Attribution (CC BY) license (https://creativecommons.org/licenses/by/4.0/).