1. Introduction
Decreasing the number of intersection accidents has been one of the most important challenges in ensuring traffic safety. According to the National Highway Safety Transportation Administration (NHTSA), from 2009 to 2018, the number of fatalities and injuries from accidents at intersections accounted for 26% of total fatalities and injuries from traffic accidents, and the number of fatalities and injuries at intersection accidents is slightly increasing [
1]. In Japan, 42% of traffic accidents have occurred at intersections; however, excluding cases when the signals were ignored, right-turn accidents accounted for nearly 47% of those that occurred at intersections, which is the highest percentage in terms of intersection accidents [
2]. Generally, an intersection right-turn (or left-turn in right-hand traffic) is a difficult task for drivers because drivers must be aware of oncoming traffic and crossing bicycles and pedestrians. Both cyclists and pedestrians may cross the road from the right and left sides, and these unpredictable situations can easily affect the judgement of drivers, thus increasing the risk of accidents [
3]. From these facts, reducing right-turn accidents can be an important goal in reducing the overall traffic accidents. Further, this paper is particularly focused on right-turn accidents as recent statistical data have revealed that the accident rates for left-turns are not relatively high in Japan.
To reduce the number of accidents at intersections, especially when vehicles make right-turns, extensive research on advanced driver assistance systems (ADAS) has been conducted from the perspective of active driver assistance. Research on ADAS that use vehicle-to-vehicle (V2V) or vehicle-to-infrastructure (V2I) communication was expected to reduce the number of accidents at intersections. By obtaining information on oncoming traffic and crossing pedestrians from transmitters fitted on infrastructure or other traffic communication participants, the systems alert to avoid collisions with objects coming from blind spots [
4,
5,
6,
7,
8,
9,
10,
11]. V2I communication has also been used for a highly automated driving function to determine the right timing to turn at an intersection [
12,
13]. Systems dependent on communication facilities are effective when both the surrounding vehicles and infrastructures have communication devices; however, it requires wide-ranging cooperation including manufacturers and local government. Therefore, it may take several years to deploy such facilities to entire city roads. It is against this backdrop that we found the need to develop and put more value on the ADAS without depending on the V2V or V2I communication.
For the challenge of avoiding collisions while turning right at intersections, without depending on communication technology, ADAS or other risk prediction methods have been proposed [
14,
15,
16,
17,
18,
19,
20,
21]. Our research group proposed an ADAS that enables the prediction of the potential risk of objects darting out from the blind spot during intersection right-turning [
22,
23]. This ADAS assists deceleration to a moderate, safe speed by determining the potential risk by predicting the conflict point between the ego vehicle and the blinded darting-out object. These studies required a high-accuracy trajectory to predict the conflict point. The trajectory prediction method we have proposed in this paper is expected to fulfill the requirement.
In the following text, we briefly review previous studies that have correctly predicted the trajectory of the vehicle. Some researchers took the approach of planning the intersection turning path for automated vehicles by generating the target path from digital maps [
24,
25]. However, for most driver assistance systems, especially for systems in urban areas including intersection turnings, drivers were required to hold the steering wheel even during the assistance. Hence, the design of the ADAS requires the driver’s input, such as dynamic steering wheel motion. Thus, the trajectory prediction method that uses only digital maps is not suitable in ADAS for turning at intersections. Other studies on trajectory prediction proposed methods that stochastically predicted the future trajectory from the observed previous motion of the ego vehicle [
19,
20,
26,
27]. However, stochastic prediction makes the risk assessment and decision making a more complex problem. Besides, there are no big advantages in using the stochastic methods for turning at intersections because the destination of the ego vehicle during turning is usually obvious and definitive. Thus, our proposal intends to provide a trajectory that is adaptive to the driver’s input rather than the prediction method from digital maps. Further, our proposed method is more accurate at prediction than the stochastic methods.
To enhance the accuracy of trajectory prediction, a smooth trajectory must be generated by considering both the driver’s input and the vehicle’s current state. However, on the one hand, the smoother the trajectory becomes, the higher the calculation costs incurred to generate the curve. On the other hand, trajectory predictions for ADAS require real-time calculation ability, and therefore, a higher calculation cost is not acceptable. Our main concern is balancing the smoothness and calculation cost of the curve while developing the trajectory prediction method.
The main objective of this paper is to propose a trajectory prediction method in ADAS for safe turning at intersections without depending on V2V or V2I communication and to evaluate the effectiveness of the proposed trajectory prediction method.
Our approach was to initially interpret features of the intersection based on several parameters. Then, we aimed to generate a smooth path as a solution to a problem that was defined as follows: to generate a smooth trajectory in a two-dimensional plane under conditions of the extracted parameters and the driver’s steering wheel input. While evaluating the effectiveness of the proposed method, the following three points were emphasized: First, the objective was to evaluate the prediction accuracy—evaluating the accuracy of several trajectory prediction methods by comparing the predicted trajectories and an actual path in data acquisition experiments at real urban intersections; Second, the adaptability of the trajectory prediction method to ADAS for intersection turning—an important aspect of the evaluation of this adaptability is that the trajectory can be generated before driving into an intersection to allow sufficient time for assistance by ADAS; Third, a practical utility for various sizes and shapes of the intersections—to evaluate this point, the data acquisition experiments were conducted at various intersections that included acute or obtuse angle turns and from small to large intersections.
In this paper, we present a method to predict the future intersection turning trajectory of the ego vehicle by focusing on right-turn scenarios at intersections. The main contributions of this paper are proposing a geometrical trajectory prediction method that generates a smooth and continuous curve for intersection turns and revealing the effectiveness of the proposal with a vehicle driving experiment at actual urban intersections.
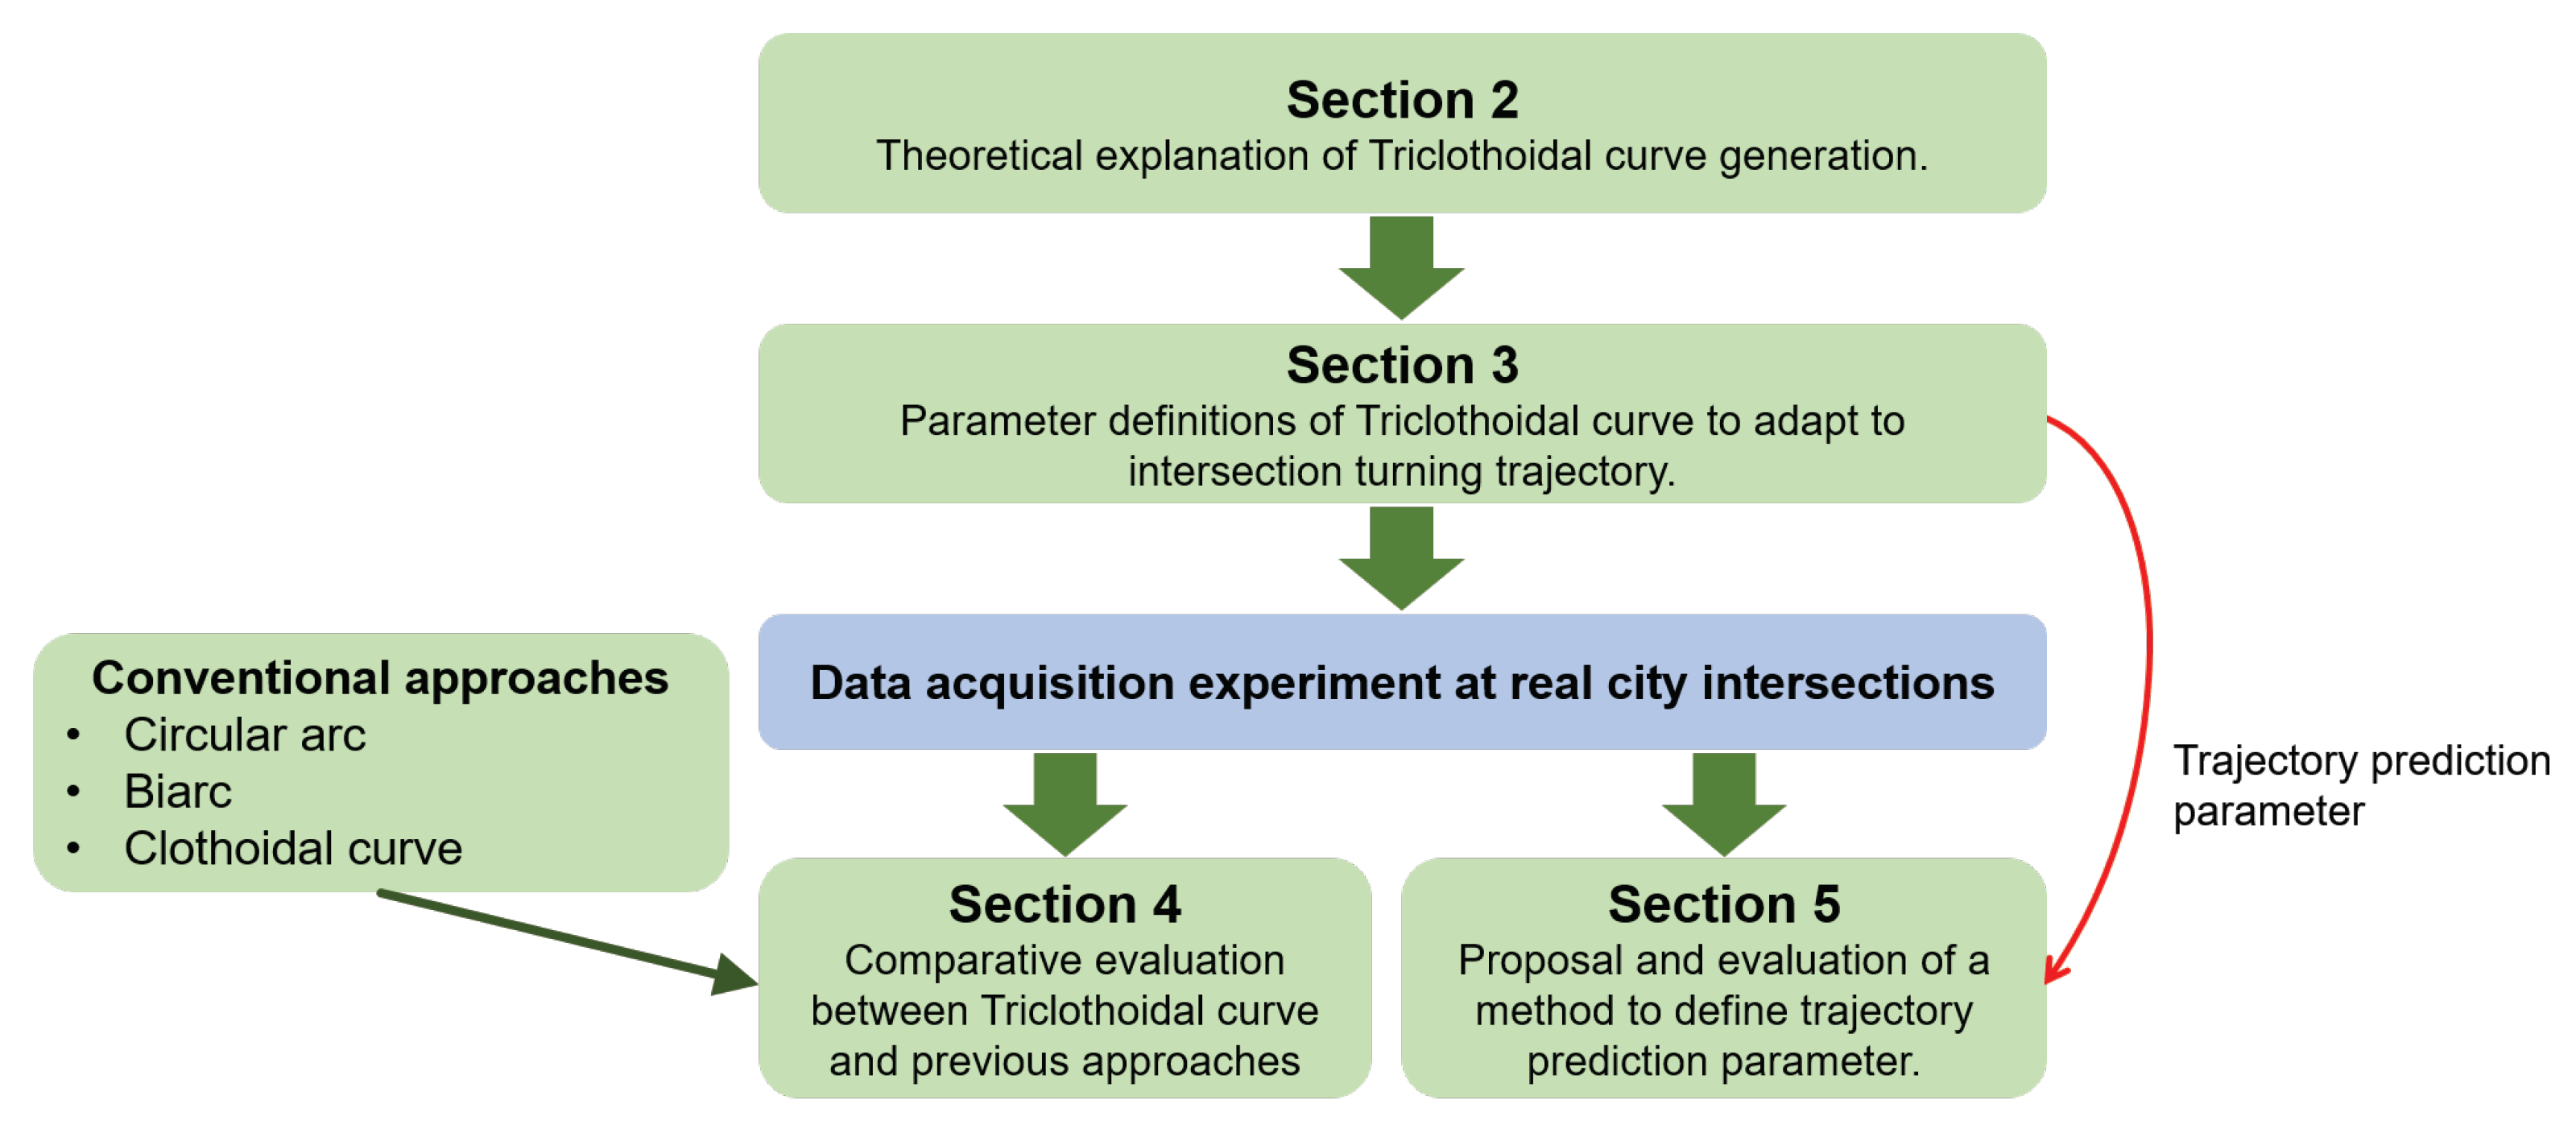
The structure of this paper is shown in
Figure 1.
Section 2 introduces several curve generation methods that can obtain a reasonably smooth curve at a modest calculation cost. Later, this section explains a derivation and an algorithm to generate a smooth curve using a Triclothoidal curve.
Section 3 covers the definitions of parameters and coordinates to adopt the Triclothoidal curve to the vehicle turning trajectory at the intersections.
Section 4 presents data acquisition experiments in urban intersections in Tokyo. Later, this section evaluates the effectiveness of our proposed method by comparing it with other conventional curve generation methods from the results of data acquisition experiments. Finally,
Section 5 proposes a parameter estimation method to define the boundary conditions of the Triclothoidal curve generation from the driving data from the experiment vehicle and intersection geometries. Further data acquisition experiments at the real urban intersections evaluate the validity of the parameter estimation method.
2. Trajectory Prediction Methods at Intersection Right Turning
This section explains methods for generating a geometric path for trajectory prediction. More specifically, this section discusses a circular arc, a Biarc curve, a clothoidal curve, and our proposed Triclothoidal curve. The following text provides a brief description of these curves wherein details of the proposed method are included. A comparison of the prediction accuracy of these curves is provided in a subsequent section.
One of the simplest geometric shapes we can assume as a right-turn path is a circular arc. We can generate a circular arc by determining only two variables; namely, the direction of the initial point (current location of the ego vehicle) and the turning radius. However, the path of the circular arc can specify either the position or direction at the terminal point, and therefore, we can use only one of these two terminal conditions. On the contrary, in the intersection turning scenarios, specifying both location and direction at the terminal point has the advantage of predicting the trajectory accurately. Besides, the intersection geometries enable us to define the position and direction at the terminal point. Here, the following methods can specify both position and direction at the terminal point.
Combining two arcs (Biarc) is one way to obtain enough degrees of freedom to satisfy both the position and the direction at the endpoint. Kimia et al. showed that such a Biarc can be generated in a straightforward manner (i.e., there is no need to conduct an iterative calculation to obtain the curve) by determining the initial and terminal positions and directions [
28].
The clothoidal curve is another candidate of the path that can specify both the position and the direction at the endpoint. Furthermore, the linearly changing curvature, which is a feature of the clothoidal, has an advantage in terms of driving comfort [
29]; hence, it is expected to be closer to the actual route. Bertolazzi and Frego proposed a method to obtain the clothoidal curve easily [
30]; therefore we can adopt it in the ADAS. By using Bertolazzi’s method, a curve can be obtained by solving a nonlinear equation of one variable. This is a sufficiently small calculation cost even if real-time calculations are assumed.
To generate a more probable predicted route, it is preferable to consider the amount of steering and not only the current vehicle direction. This means that the curvature at the initial position should be specifiable. However, none of the above three methods can specify the curvature at the initial point due to a lack of degrees of freedom in the curve. Therefore, we propose to obtain the required degrees of freedom by combining three clothoidal curves (Triclothoidal curve). We also propose an easier method for determining such a curve. Our method can generate the predicted route by solving simultaneous equations with, at most, two variables. The cost of this calculation is reasonable when compared to the case of the clothoidal curve.
Other methods to generate paths for the ground vehicles, trajectory generation methods with Bézier curve, spline curve, and B-spline curve, have been proposed [
31,
32,
33]. However, although these curves can define the positions of the initial and terminal points, they require the definition of three or more control points. Thus, these methods must determine another control point in addition to the initial and terminal points. Lattarulo et al. proposed a trajectory planning method that determines the control point of the Bézier curve by defining the design parameter of the intersection. However, this study provided neither theoretical definitions of the design parameter nor geometrical relationships between the intersection characteristics [
34]. Besides, Lattarulo’s proposal did not consider the steering angle, and the curvature at the initial point was always zero. Hence, the method was effective for the digital map-based trajectory planning, but was not suitable for the real-time vehicle trajectory prediction.
To summarize, the Triclothoidal curve has three advantages for the intersection turning trajectory prediction for ADAS: First, the curve can be generated by specifying only two control points—the initial and terminal points; second, the curve can predict the future vehicle motion from the current turning curvature of the vehicle; third, the curve traces a smooth curve without discontinuity in curvature.
2.1. Problem Formulation for Triclothoidal Curve
Without loss of generality, we can define the coordinate and state as shown in
Figure 2.
are the positions of the path, the length, tangent angle, and curvature, respectively. Subscripts 0 and
f represent initial and terminal points with states that are normalized by using the direct distance between these points.
Assuming that
s is the independent variable, the differential equations of the states can be expressed as follows:
where
is the change rate of the curvature, and it is constant in one clothoidal curve.
2.2. Method to Obtain Triclothoidal Curve
The proposed Triclothoidal curve is as shown in
Figure 3. It must be noted that the states of a point on a Triclothoidal curve whose distance is
s from the initial point is represented by
. The curvature rates of the clothoidal curves that are components of the Triclothoidal curve are
. Subscripts
on variables
and
show the states at the connecting point of the
ith and
jth clothoidal curves. It is assumed that each clothoidal curve has the same length and that the length of the Triclothoidal curve is
L.
Integrating Equation (
1) from the initial point, the states at the terminal point can be obtained by the following equations:
where the states at the connecting points are
We must determine the four variables
, and
L so that the values of Equations (
2)–(
5) match the terminal values provided by the boundary conditions of the curve generation problem or the intersection layout. Note that, considering the definition of coordinates,
x,
y positions at the initial and terminal points are always
and
, respectively; hence, the boundary conditions that we can set arbitrarily are
, and
. In other words, the Triclothoidal curve is uniquely defined if we determine the tangent angles and curvatures of the curve both at the initial and terminal points. The relationships between these arbitrarily definable boundary conditions and intersection layouts are discussed in the next section.
The following are problem reductions where four unknown variables are determined by solving nonlinear equations with, at most, two variables.
Introducing the new variables
and substituting them into Equations (
4) and (
5),
and
L can be derived with the functions of
and
as shown in Equations (
10) and (
11).
where
. In the case where
and
, Equations (
10) and (
11) are reduced to:
In the case where
and
, we can get
In addition to these, in the case of
,
L can be eliminated from Equations (
4) and (
5) as:
Applying variable transformation
in Equations (
2) and (
3), we can obtain the following equations:
By substituting Equations (
10)–(
15) into the above Equations (
18) and (
19), the remaining unknown variables reduce to two, namely
and
. Moreover, in the case of
, by substituting Equations (
16) and (
17) into Equation (
19),
becomes the only unknown variable.
These unknown variables can be obtained by solving the above-defined equations or simultaneous equations with one or two variables. The remaining unknown variables of the Triclothoidal curve are determined by Equations (
10) and (
11).
Although iterative calculations are required to solve the simultaneous equations, we can provide reasonable initial assumptions. If we assume that
and
and substitute it into Equation (
19), the initial guesses for iterative calculations will be as follows:
where subscript
represents the initial guesses for iterative calculations.
In the case of
, the initial guess of
is
An additional remark on this calculation is that these initial guesses are derived based on the assumption that the path is a straight line. Therefore, the accuracy of the initial guesses becomes degraded when the intersection layout configuration contains a large curvature of the radius. However, the degradation does not affect the iteration process for the determination of unknown variables.
Based on the discussion in this section, the algorithm to obtain the Triclothoidal curve can be summarized as follows:
- 1.
Consider Equations (
18) and (
19) as non-linear equations with unknowns
and
(i.e., the equations include numerical integration);
- 2.
Solve the equations with initial guesses of the unknowns or Equations (
20)–(
22);
- 3.
Use Equations (
12)–(
17) to derive
and
L;
- 4.
Derive the change rate of the curvature of each clothoidal curve or from the definitions of ;
- 5.
Derive the Triclothoidal curve by integrating Equation (
1) from
to
L with
.
3. Definitions of Parameters and Coordinates for Trajectory Generation at Intersection
One of the most imperative features of the Triclothoidal curve is that the curve is uniquely determined by the boundary conditions, namely, the position, angle, and curvature at both the initial and terminal points of the curve. Besides, these conditions are the only inputs to generate the curve and no other inputs are required. Therefore, the trajectory prediction with the Triclothoidal curve requires only the ego vehicle’s current position and a simple map. Thus, it has a substantial advantage for implementing the ADAS without being equipped with additional sensors or much intersection information. Hence, this section focuses on the Triclothoidal curve and explains the definitions of parameters and coordinates to apply the Triclothoidal curve generation to trajectory prediction at intersection turning.
To apply the Triclothoidal curve to the trajectory prediction, at first, the initial and terminal points for intersection turning are defined. As shown in
Figure 4, the initial point is defined as the center of the rear wheel axle of the ego vehicle, and the terminal point is defined as a point on the central part of the escaping road of the intersection. When the escaping road has multiple lanes, the terminal point is defined as the central part of those lanes. Here, introducing a vehicle coordinate system
, an origin of the coordinates is defined as a center of the rear wheel axle of the ego vehicle.
In this coordinate system, the following boundary conditions are defined to generate the Triclothoidal curve. The positions at the initial point for the Triclothoidal curve generation are defined as , and the initial direction of the curve is defined as the ego vehicle’s longitudinal direction. Therefore, the initial angle of the curve on the coordinate system is always 0. The initial curvature can be geometrically derived as under the ego vehicle’s steering angle and wheelbase .
In order to define the conditions at the terminal point of the curve, and to adapt to the various sizes of the intersection, the terminal point is defined as an adjustable point on the lane center of the escaping road (point A in
Figure 4).
The positions at the terminal point
can be adjusted by a distance parameter
. This parameter
is defined as the distance from point B to the terminal position. The point B is a crossing point of the ego vehicle’s longitudinal centerline and the lane center of the escaping road. The distance parameter
is an important parameter for controlling the accuracy of the predicted trajectory. The method to decide the parameter
is described in
Section 5. The terminal direction of the curve is equal to the relative angle
from the ego vehicle’s driving direction to the direction of the escaping road of the intersection. In this study, we regard the shape of the escaping road as a straight road and, therefore, the curvature at the terminal point is defined as 0.
Then, the boundary conditions are transformed from the coordinate system
into the coordinate system
, which was explained in
Section 2, as shown in
Figure 4. The coordinates
are rotated at a rotation angle
, and the distances in the coordinates are normalized by the direct distance between the initial and terminal points. By applying this coordinate transformation, the conditions at the initial and terminal points to generate the Triclothoidal curve
can be expressed as follows:
where the angle
is
.
To summarize, the Triclothoidal trajectory for the intersection turning can be predicted by simply giving the following values: the lane center positions along the escaping road, the relative angle from the ego vehicle’s driving direction to the direction of the escaping road , the steering angle, and the distance parameter .
4. Trajectory Prediction Performance Evaluation
This section evaluates the trajectory prediction performance by comparing it to other trajectory prediction methods. On-road data acquisition experiments were conducted at 31 urban intersections in Tokyo, Japan to evaluate the prediction performance in a real environment.
For acquiring the driving data, an experiment vehicle was equipped with additional sensors: a LiDAR, two GPS antennae, and an inertia measurement unit (IMU). While the experiment vehicle drove into the intersection and made a right-turn, the vehicle speed, steering wheel angle, GPS position, yaw angle, accelerations, and point cloud data from LiDAR were acquired by a data recorder. From the acquired data, the driving paths of the experiment vehicle could be obtained. These driving paths were used as references to evaluate the prediction performances of the trajectory prediction methods.
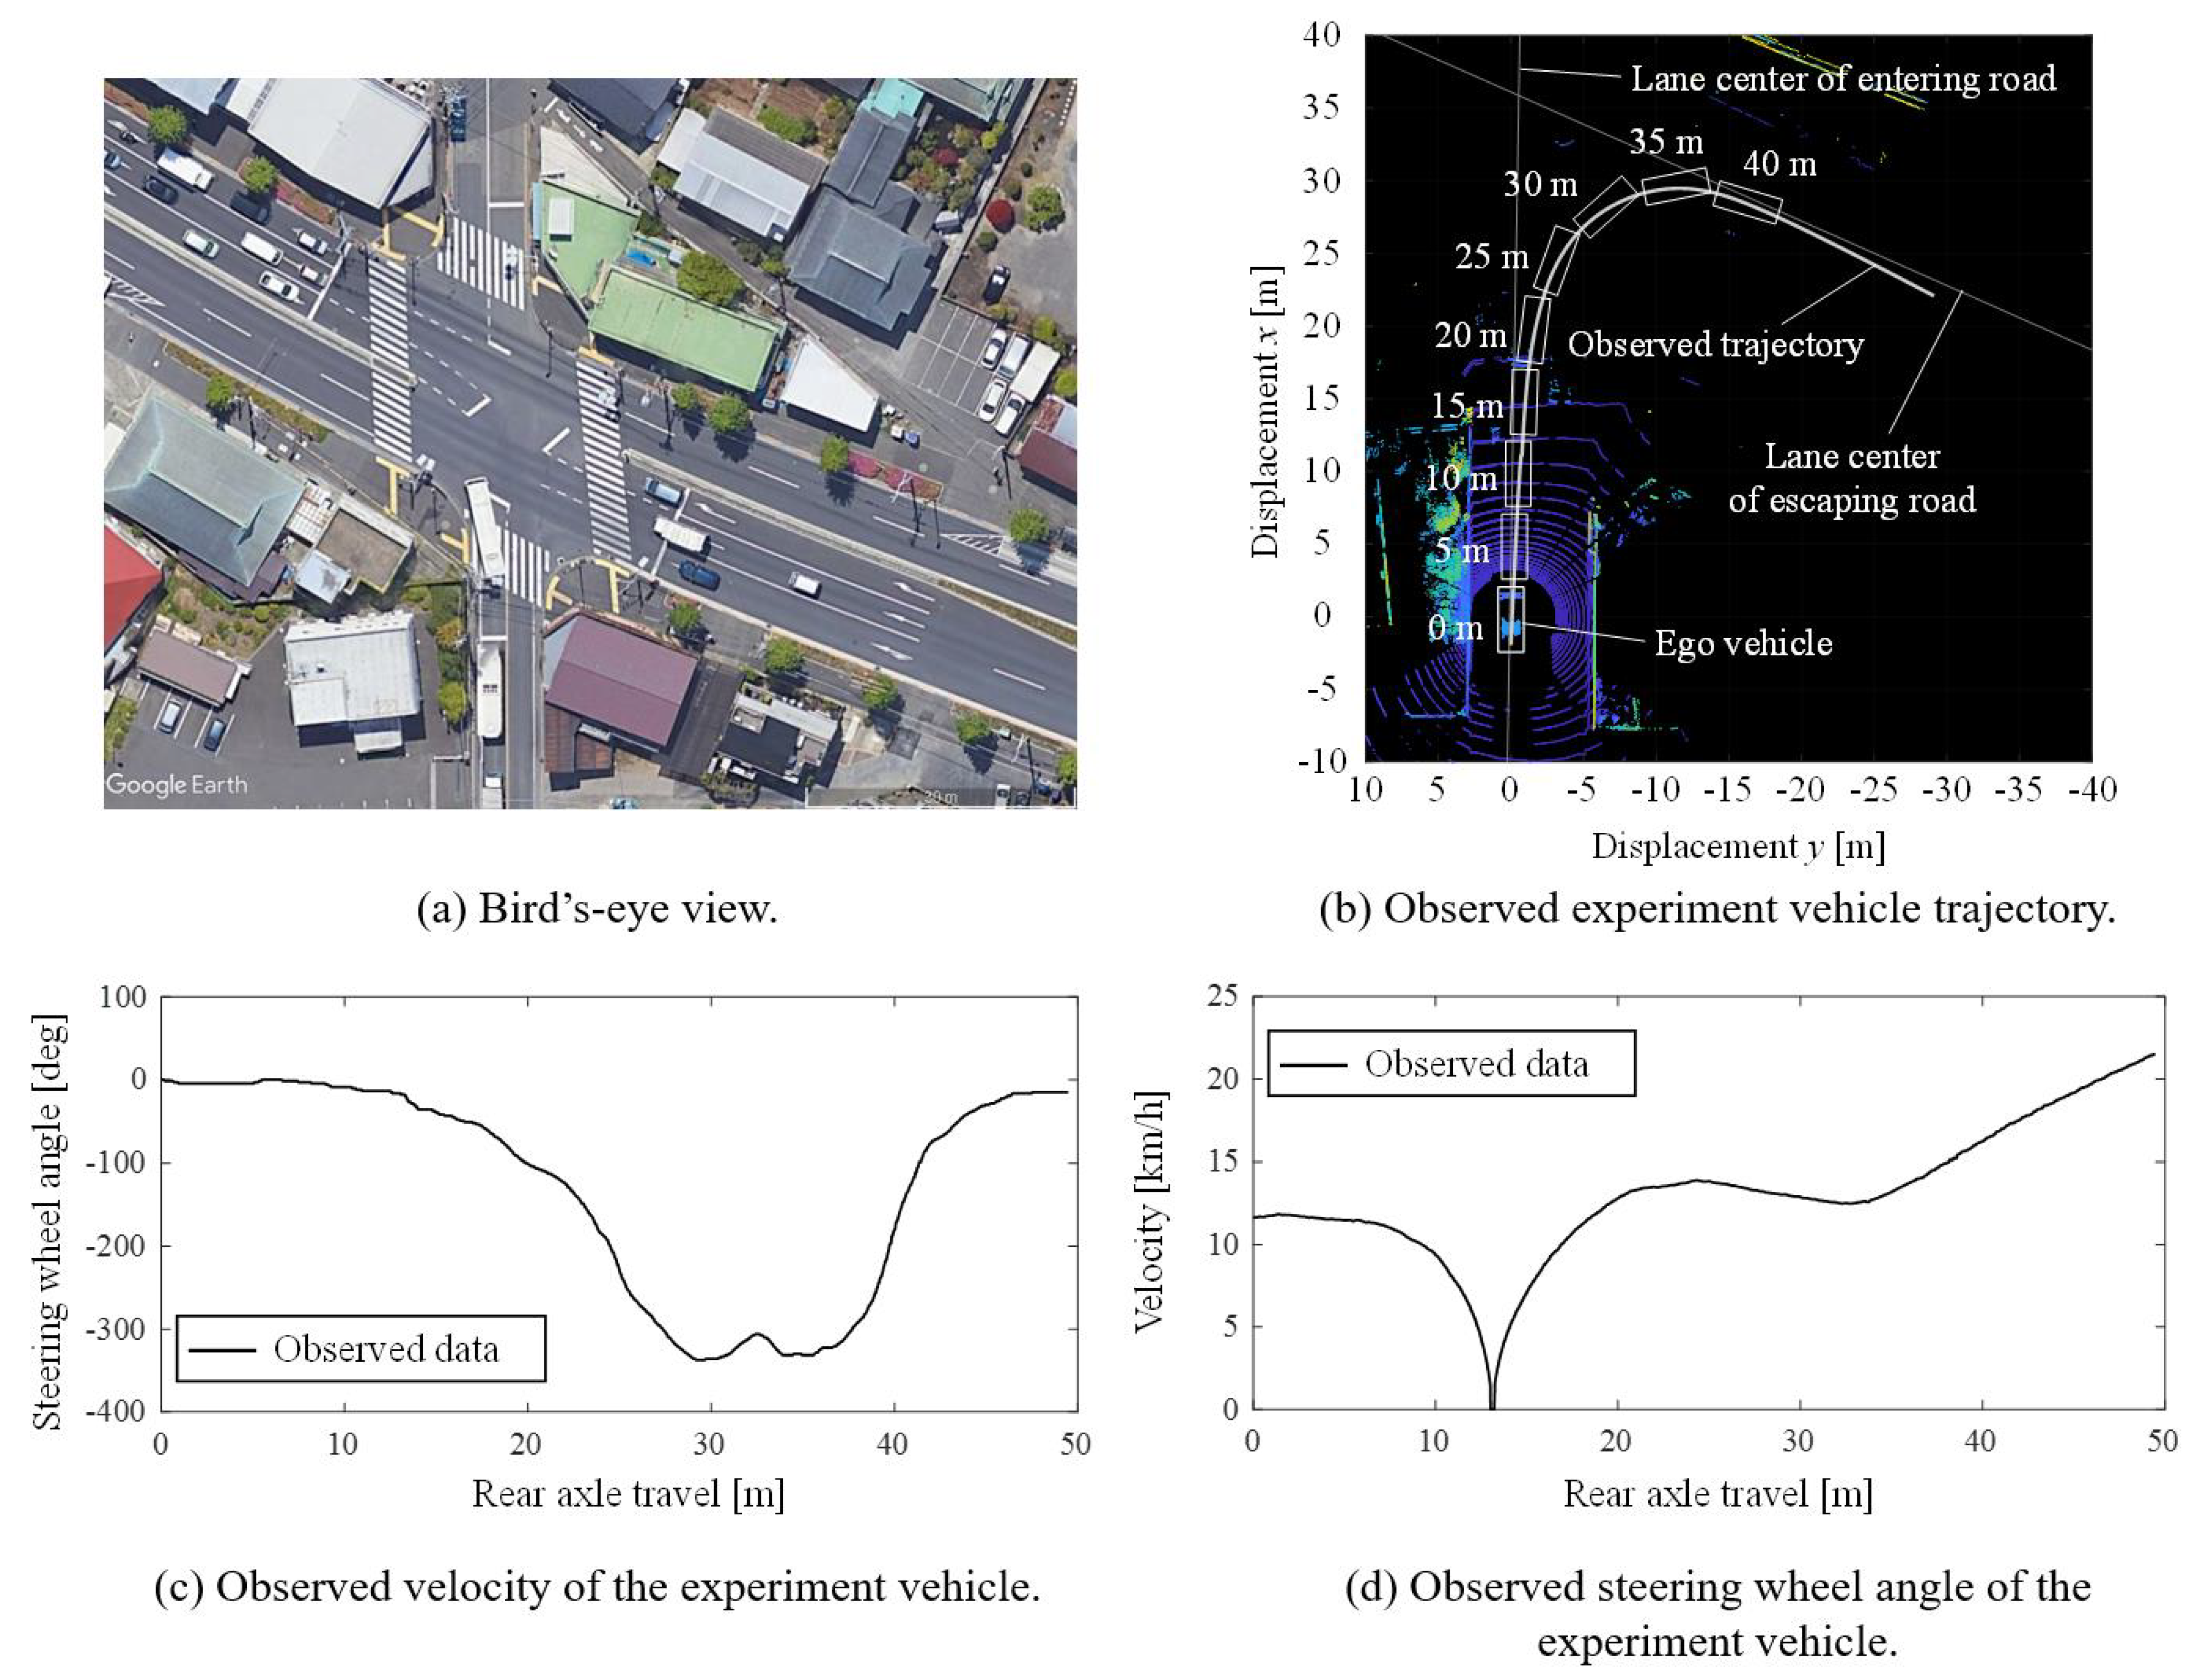
An example of making a right turn at the intersection from the data acquisition experiments is shown in
Figure 5. This figure contains four subfigures:
Figure 5a shows a bird’s-eye view of the intersection;
Figure 5b shows point cloud data and the observed driver’s path in the experiment;
Figure 5c,d shows the recorded results of observed velocity and steering wheel angle in the experiment, respectively. On the point cloud data in
Figure 5b, a white line indicates the path that the experiment vehicle took. White boxes on the point cloud data indicate the positions of the ego vehicle. The boxes are plotted every 5 m on the right turning maneuver. The distance values by the white boxes show the travel distances of the vehicle at each box.
From the acquired driving data, the prediction performance was evaluated as follows. First, from the point cloud data, the position of the escaping road and the relative angle from the ego vehicle to the escaping road were derived. Second, from the recorded vehicle data, given the trajectory prediction parameters and the intersection information, geometrical trajectories of each method, including the proposed Triclothoidal curve, were sequentially calculated in every time frame. Finally, comparing the recorded actual path of the ego vehicle and the predicted trajectories, the effectiveness of the prediction performance of each prediction method was evaluated.
Figure 6 shows the point clouds data from turning right at the intersection, the observed trajectory, and the predicted trajectories from each trajectory prediction method: (a) a circular arc with a constant radius; (b) a circular arc considering the steering angle; (c) Biarc curve; (d) a clothoidal curve; and (e) Triclothoidal curve. In
Figure 6, a white broken line indicates the path that the experiment vehicle took. White boxes on the point cloud data indicate the positions of the ego vehicle. The boxes are plotted every 5 m of the turning right maneuver. Green lines indicate the predicted trajectories. Green lines are also plotted every 5 m of the turning right maneuver.
Figure 7 shows the comparison of the curvatures of the observed driving data and the predicted trajectories for each trajectory prediction method. A black, bold solid line shows the curvature from the observed data and the colored fine solid lines show the curvature of the predicted trajectories. The predicted curvatures are plotted every 5 m of the turning right maneuver. The colors of the predicted trajectories correspond to the positions of the vehicle. The left-side tip of each colored line corresponds to each position of the vehicle that was represented in
Figure 6 as white boxes. Note that, in the experiments, the parameters such as turning radius for (a) the circular arc with a constant radius, and distance parameters
to define the terminal point positions for (c) Biarc, (d) clothoidal curve, and (e) the Triclothoidal curve, were optimized by minimizing the prediction error between the predicted trajectory and the actual driving path from the experiment data.
We can see from
Figure 6 and
Figure 7 that, while the methods using circular arc trajectories (a) and (b) were not required to define the position of the terminal point, the prediction accuracy was lower, especially before entering the intersection. The deviations of the curvature between observed data and prediction were large. The prediction accuracy of the (c) Biarc curve, (d) clothoidal curve, and (e) Triclothoidal curve was higher; however, the (c) Biarc curve and (d) clothoidal curve swelled out to the left at the beginning of the prediction because the predicted curvature of those curves were positive values at the beginning. On the other hand, because (e) the Triclothoidal curve considers the current steering angle of the vehicle, this method could predict the curvature as negative values so that the predicted trajectory does not swell out to the left. In addition, the Triclothoidal curve could predict the curvature of the driver’s intersection right-turn accurately.
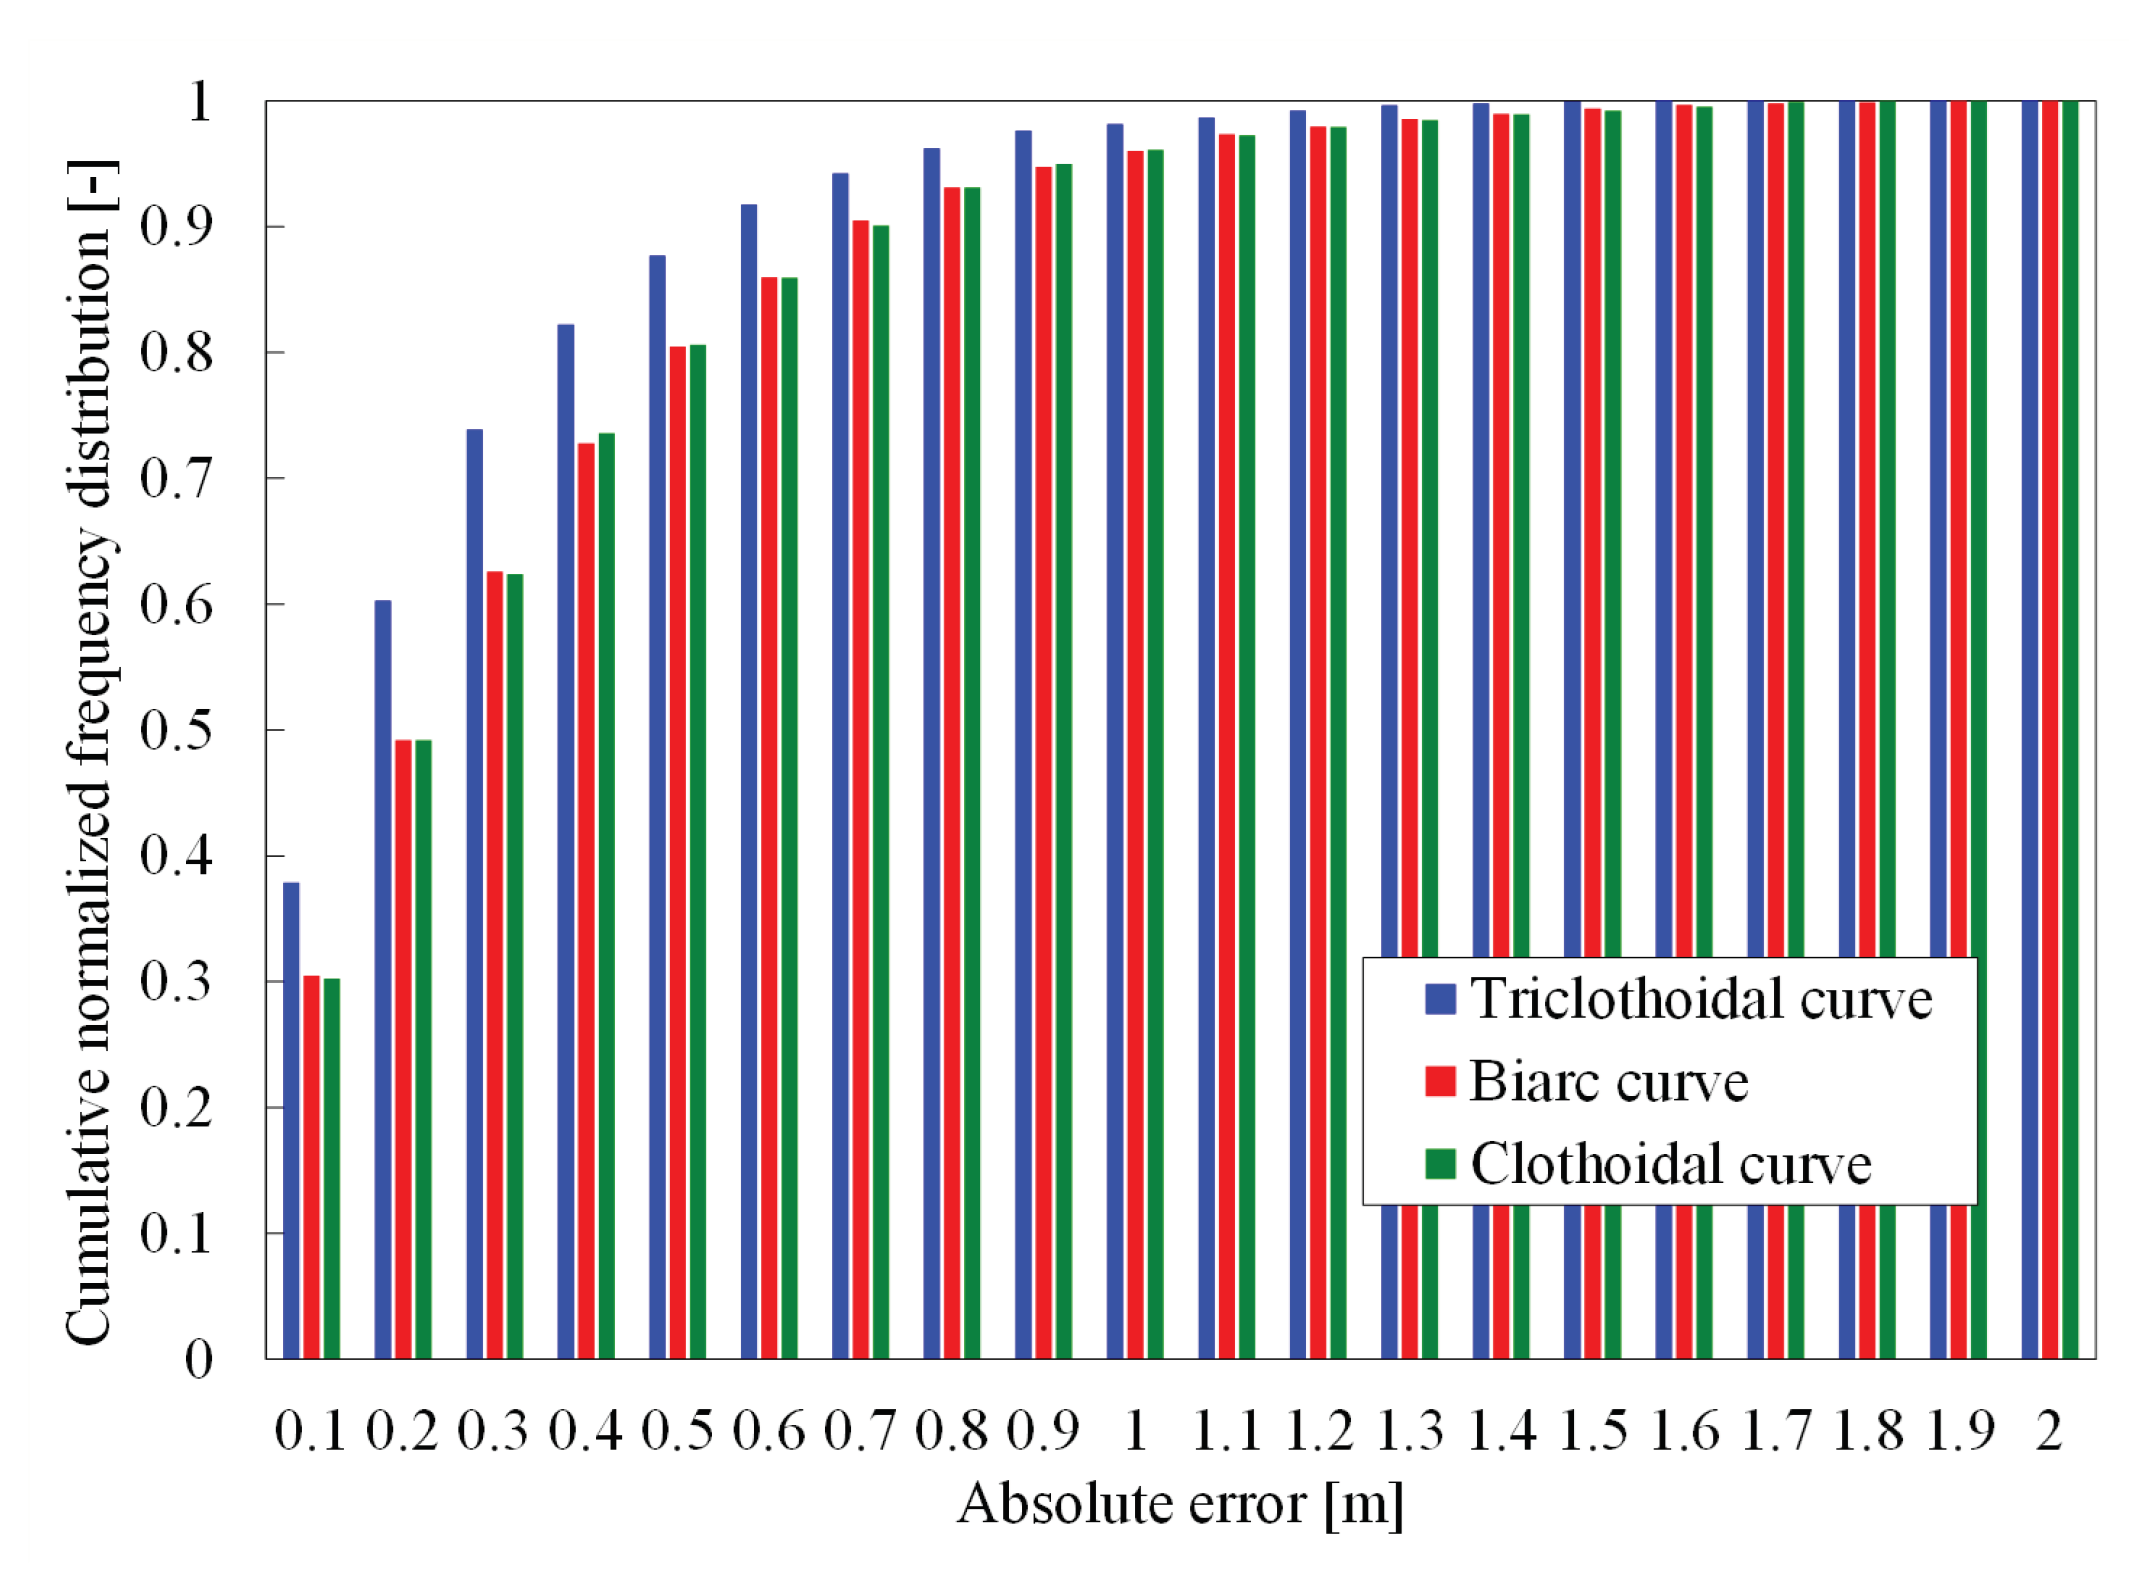
Figure 8 shows the comparison of the absolute prediction error between the trajectory prediction methods, (c) Biarc curve, (d) clothoidal curve, and (e) Triclothoidal curve, from the driving experiments at 31 urban intersections in Tokyo. In the evaluation, prediction curves were generated every 5 m the ego vehicle travelled, and errors between the predicted trajectory and the observed actual path were calculated every 1 m step. The absolute errors were the measured deviations in the normal direction from the actual driving path of the ego vehicle and the errors were only used before and during the time the vehicle passed through the intersection. Therefore, the prediction errors after turning right were not considered. From the result, more than 70% of the predictions by the Triclothoidal curve had less than 0.3 m of absolute error. Comparing to the other prediction methods, the Triclothoidal curve was overwhelmingly accurate.
In order to evaluate another aspect of the prediction performance by the Triclothoidal curve, we statistically estimated the trajectory prediction accuracy at the population of the urban intersection right-turn. We introduced the maximum absolute prediction errors as another index to evaluate the prediction performance and measured them from the lateral distance between the first trajectory prediction at the entrance of the intersection and the actual driving trajectory.
Assuming the distribution of the maximum absolute prediction errors at the 31 intersections is normal, 95% confidence intervals of the population mean of the maximum absolute prediction error under each predicted curve were derived as shown in
Table 1.
We also evaluated the significance of the population mean of the maximum absolute prediction errors between the prediction methods with t-tests. We assumed a null hypothesis, that the population means of the maximum absolute errors were the same and tested the significance at the 5% level. The test indicated that the t-value between the Biarc curve and the Triclothoidal curve (B–T) was 6.724, and the t-value between the clothoidal curve and the Triclothoidal curve (C–T) was 4.887. The t-value when the alpha value and degrees of freedom were 0.05 and 30, respectively, was 2.042, so we could reject the null hypotheses for both B–T and C–T. Thus, in the population of the urban intersections, the trajectory prediction method with the Triclothoidal curve could predict a significantly accurate right-turn trajectory compared with the conventional methods.
From the evaluations, the trajectory prediction with the Triclothoidal curve had a strong advantage over the trajectory prediction at the intersection right-turn.
5. Parameter Estimation for Trajectory Prediction
In
Section 3, we explained that the distance parameter
affects the accuracy of the predicted trajectory. However, the determination of the parameter was not clarified. This section presents a practical method for estimating the consistent value of the distance parameter
from the intersection driving data.
5.1. Parameter Estimation Equation
In this research, the terminal point was defined as mentioned in
Section 3. The position of the terminal point was decided as a point on the central part of the lane of the escaping road of the intersection with the distance
from Point B. From this definition, the accuracy of the trajectory prediction is highly dependent on the distance parameter
. To predict the turning trajectory with high accuracy, the distance
has to be estimated before generating the turning trajectory. We hypothesized that there is a correlation between the distance parameter
and the shape of the intersections. Here, as shown in
Figure 9, the distance from the central part of the driving lane to the right-side edge of the entering road was defined as
, and the distance from the driving center lane to the right-side edge of the escaping road was defined as
, and the crossing angle of the entering road and the escaping road was defined as
.
The correlations between the parameters were estimated by linear regression
by using the results from the data acquisition experiments at 31 intersections. The size of the intersections and the angles of right turns were measured using Google Earth Pro. Some assumptions for variables
x were prepared as listed in
Table 2. From the experiments at 31 intersections, the parameters
in each experimental scenario were calculated from the acquired driving data by optimizing the predicted trajectory to minimize the error from the recorded actual driving path. From the assumptions
x and calculated
, the coefficients
a,
b and correlation coefficient in
were decided by the linear regression as shown in
Table 2.
From the table,
and
had a slightly strong linear correlation between
and
x.
is an area of a parallelogram consisting of
and
; however, because the correlation by
had a negative correlation, the correlation coefficient by
became lower than the coefficient by
. In contrast, the correlation coefficient of
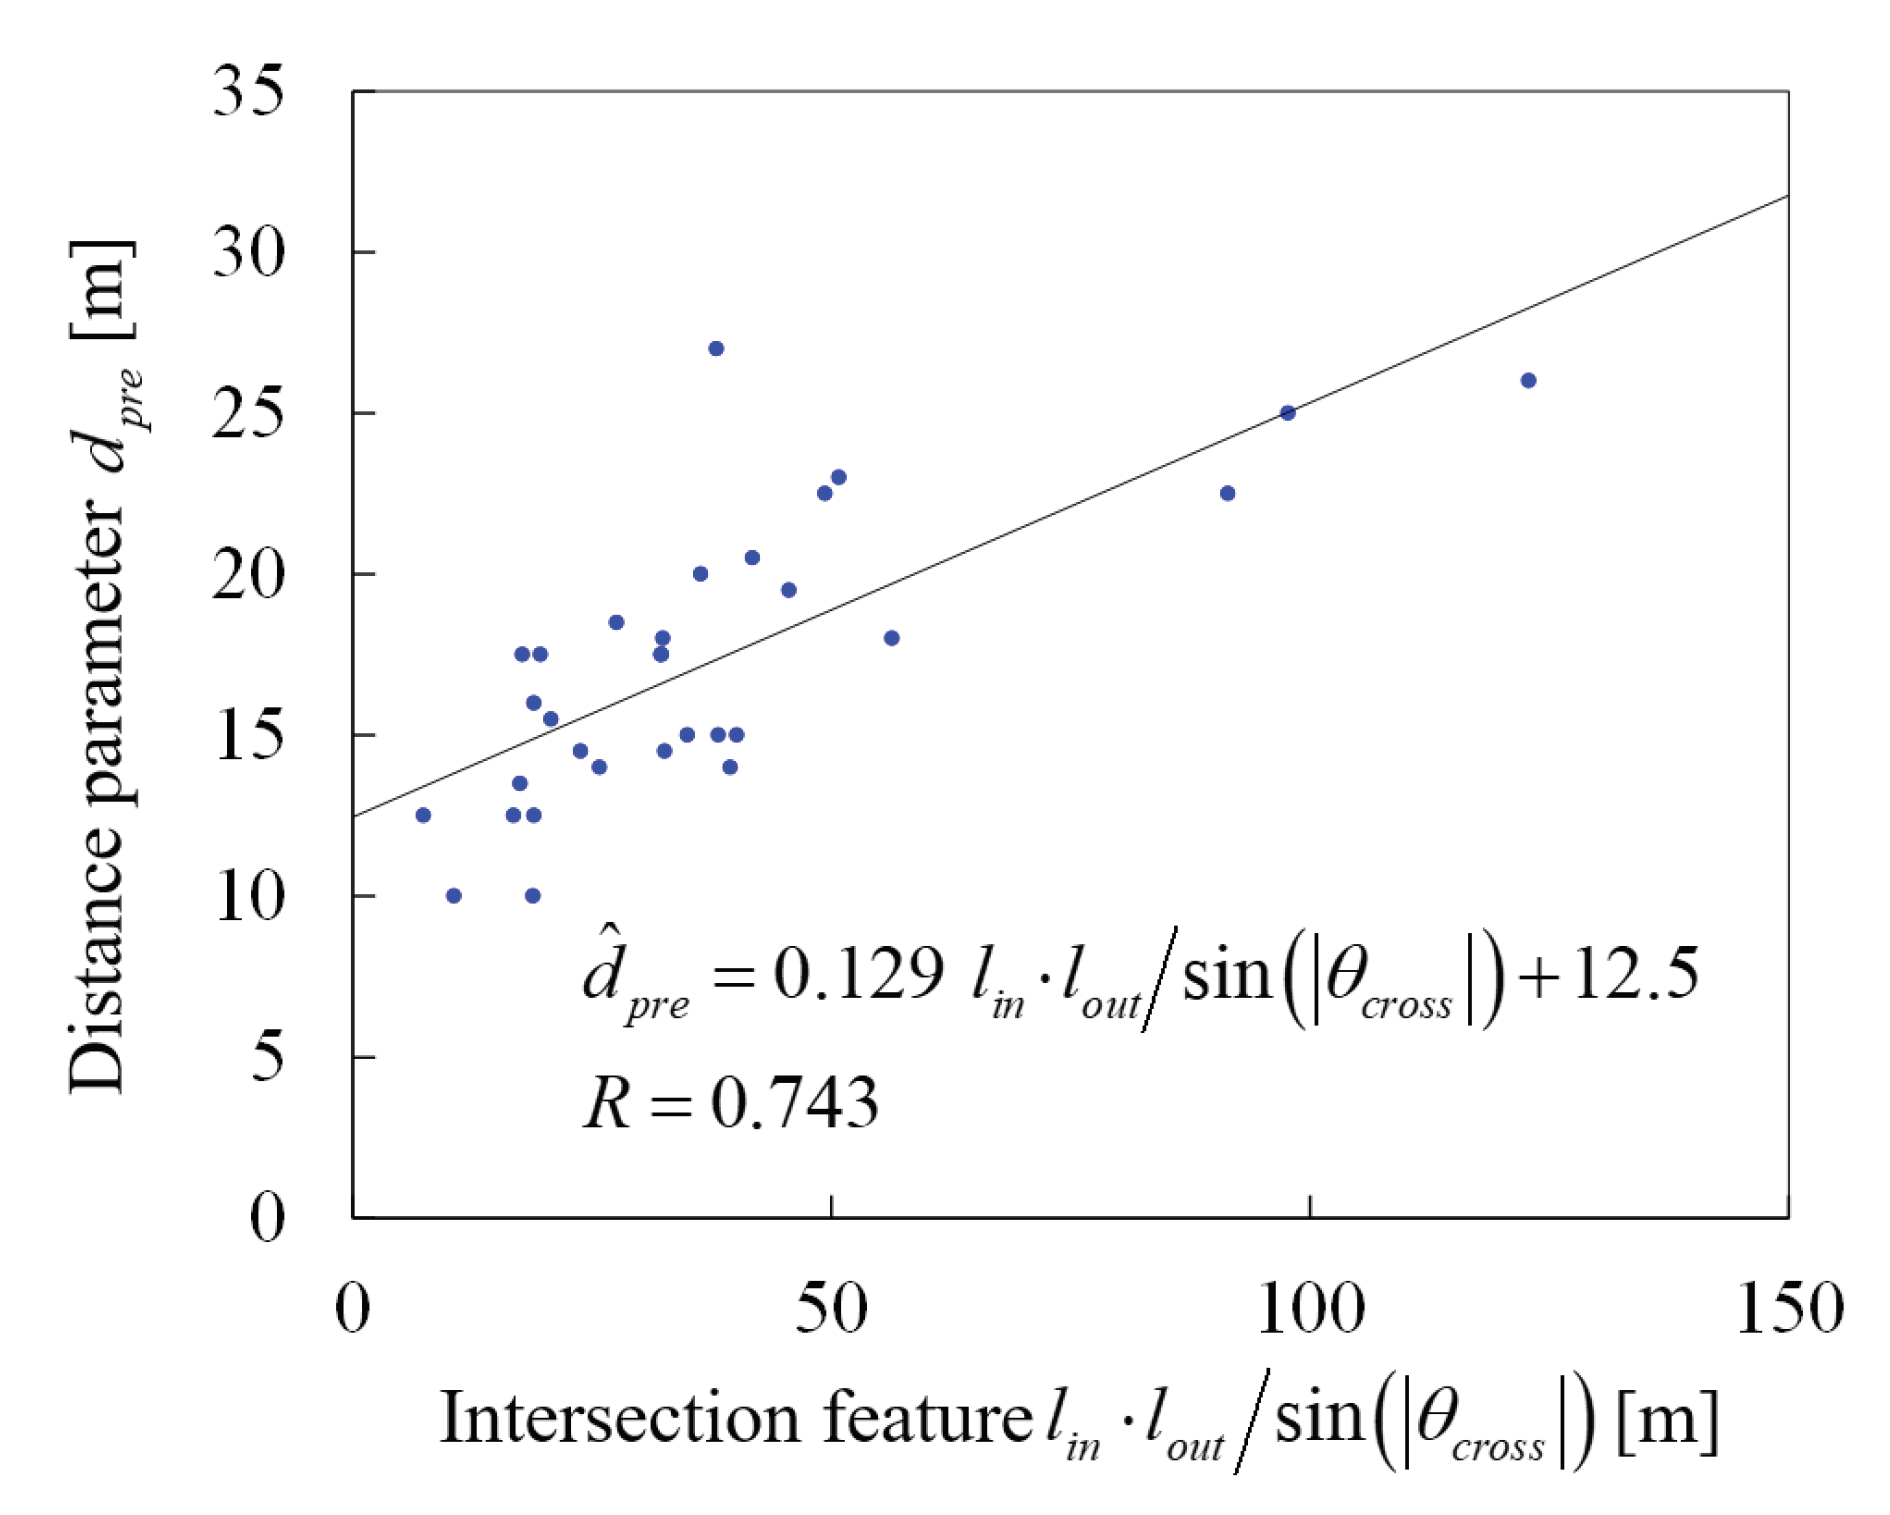
was the highest in the assumptions, and there was a slightly strong linear correlation between
and
x. A scatter plot of the correlation between
and
is shown in
Figure 10. In this study, choosing
, an equation to estimate a distance parameter
was defined as
5.2. Performance Evaluation with Estimated Parameter
By using the derived Equation (
25), the parameter
for the trajectory prediction can be estimated with given information about the shape of the intersections. To evaluate the accuracy of the trajectory prediction, additional intersection right-turn experiments were conducted at the other three intersections. The specification and estimated parameter
of the three intersections are shown in
Table 3.
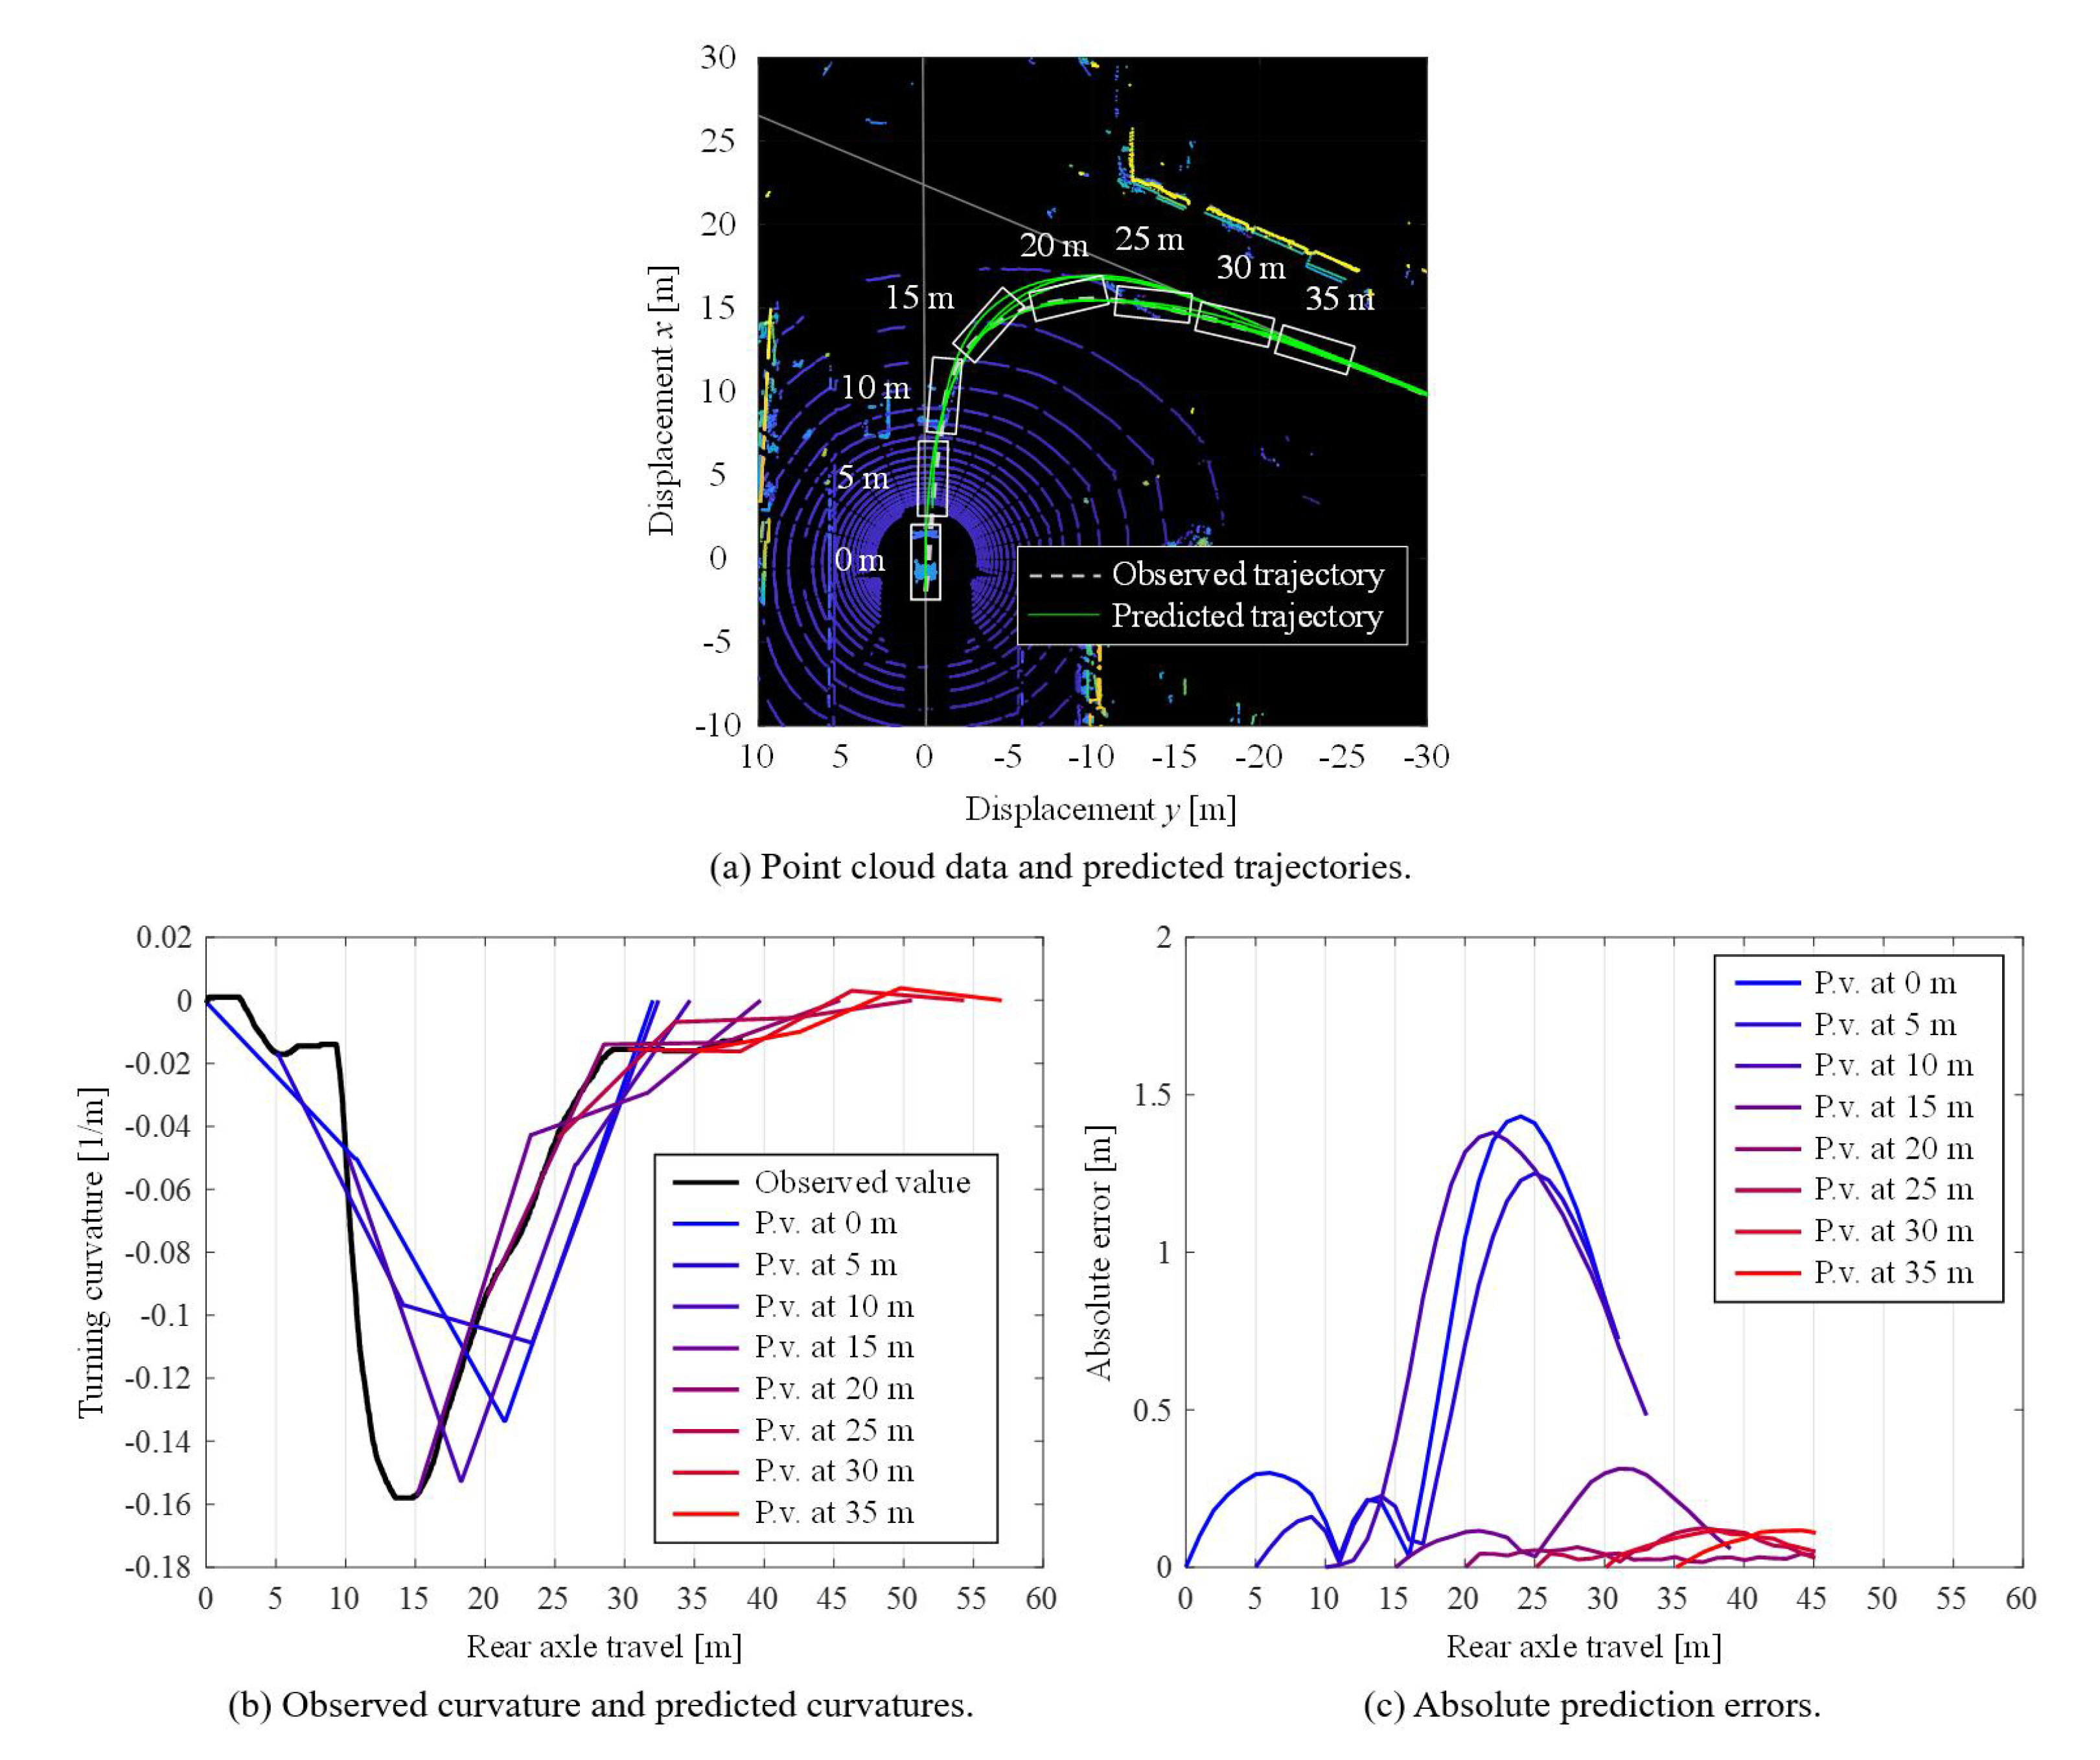
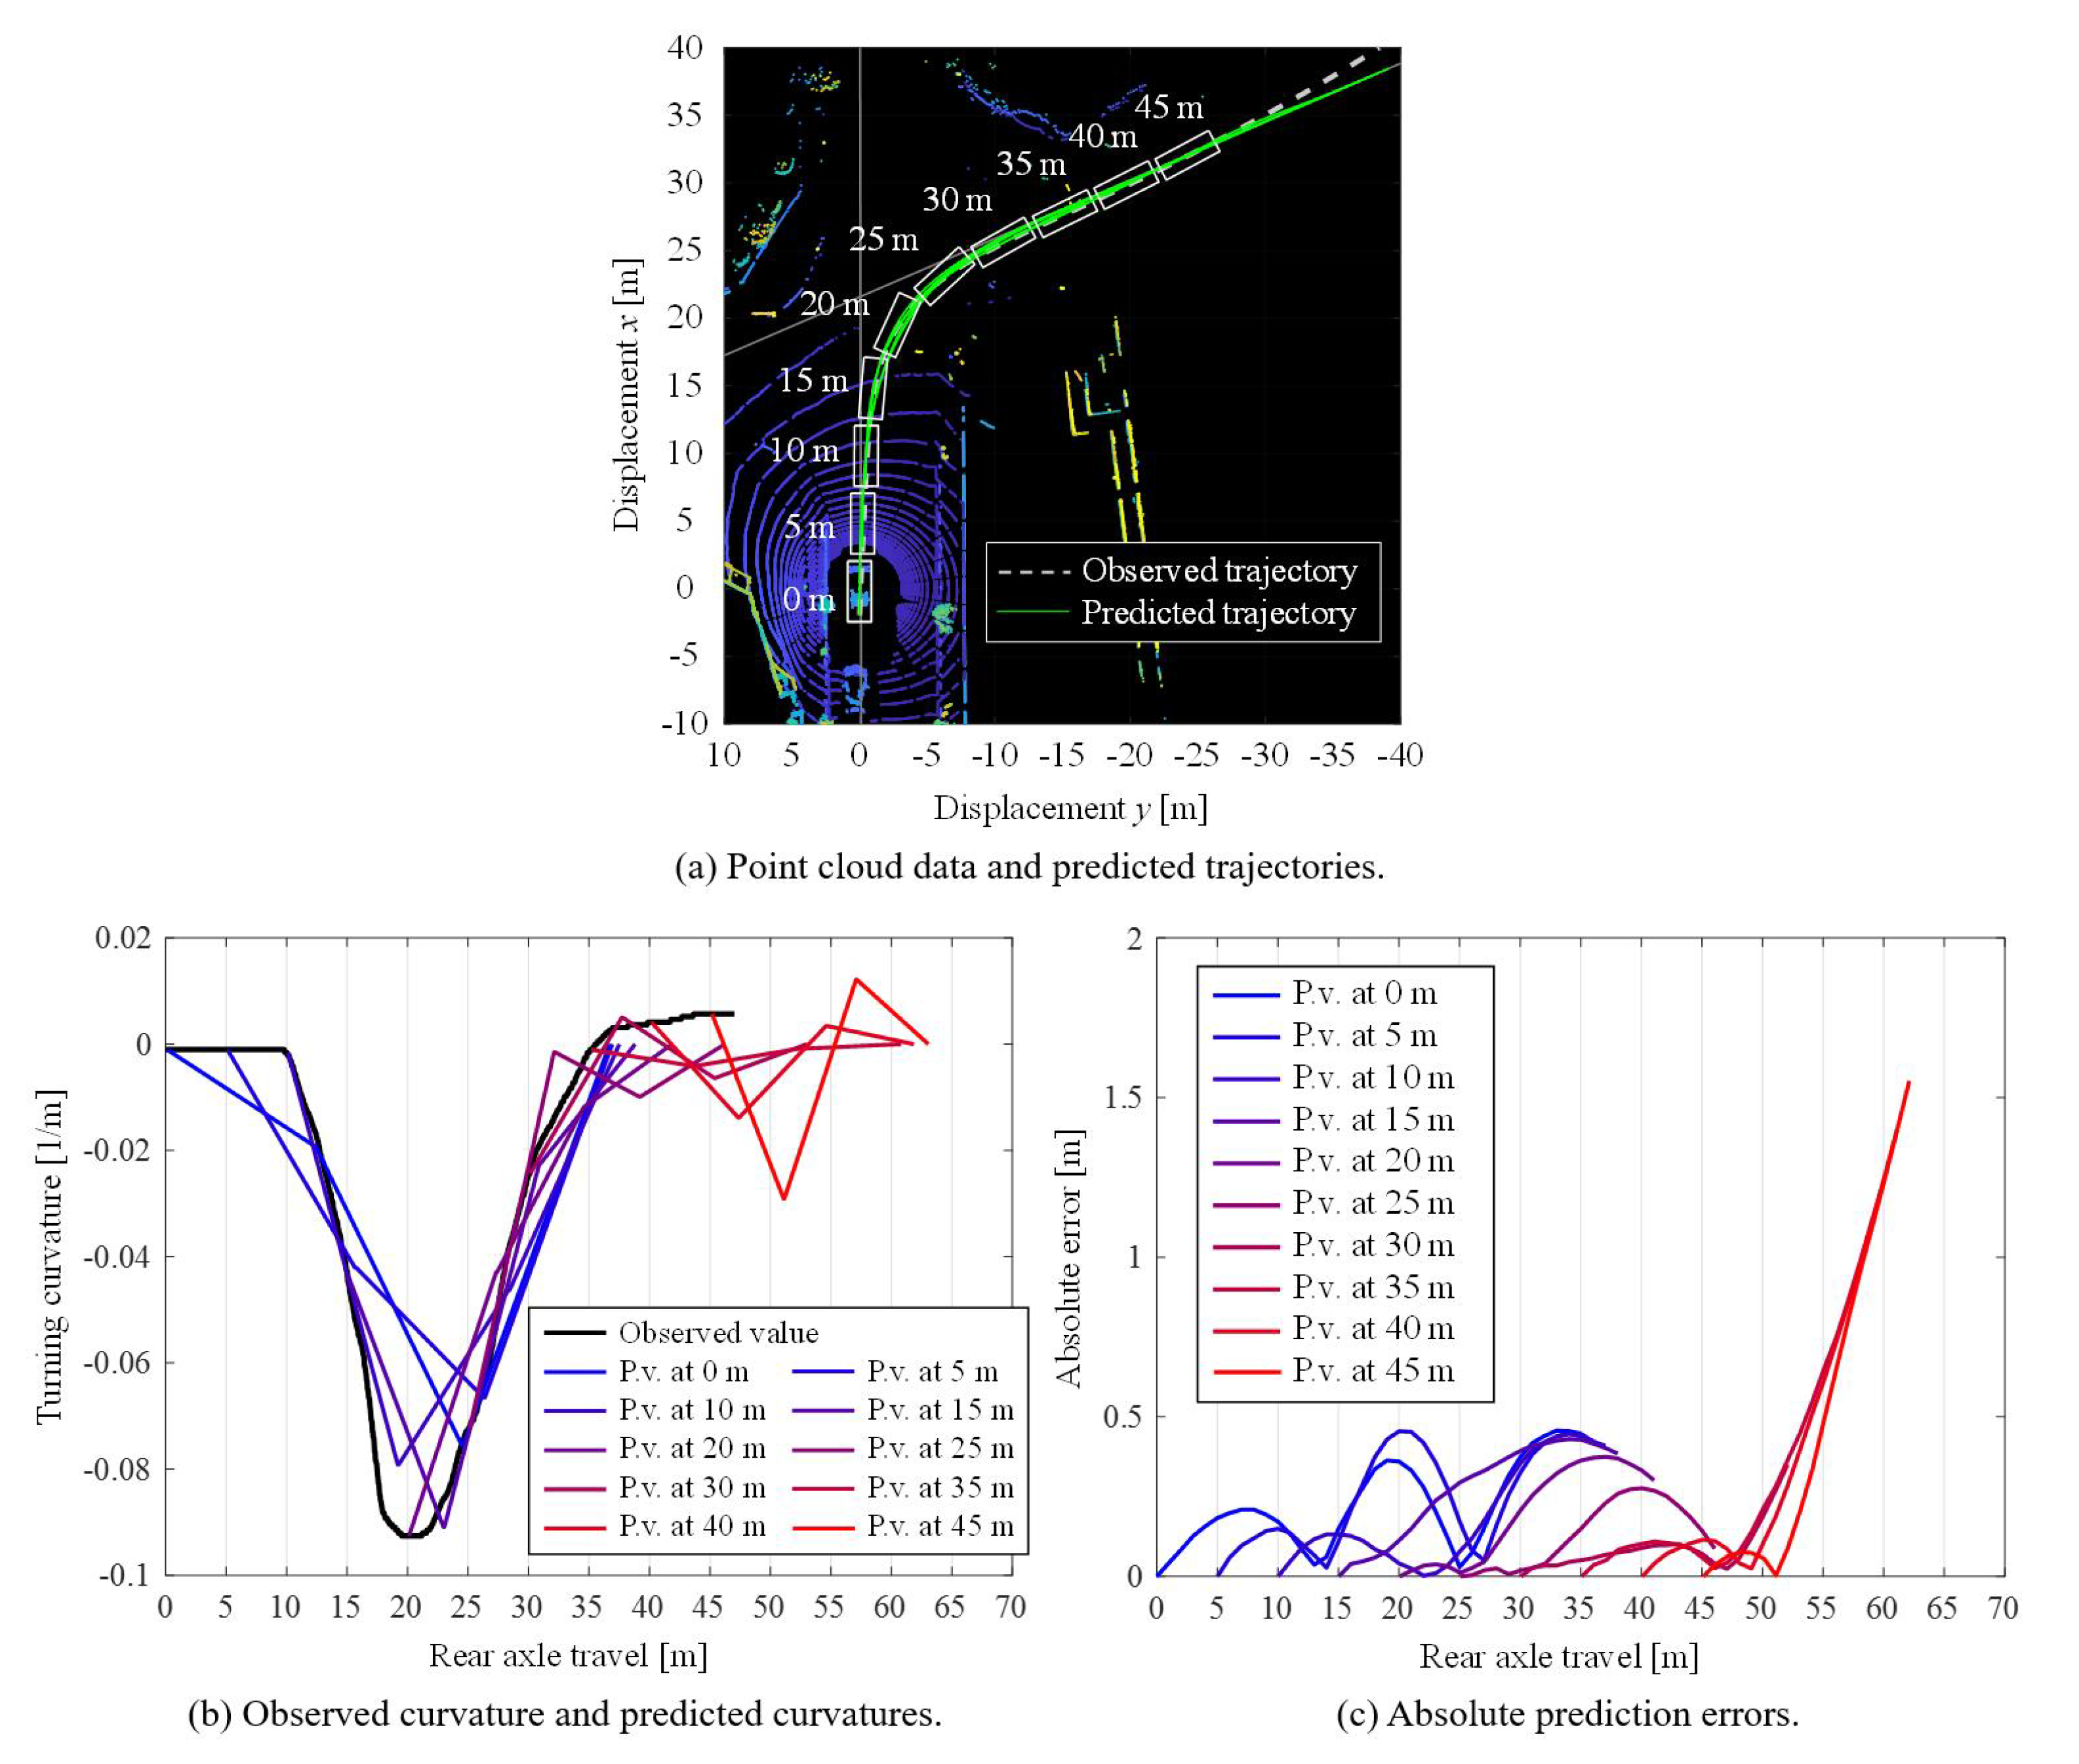
Figure 11,
Figure 12 and
Figure 13 show the experiment results of intersection ID 2-1, 2-2, and 2-3, respectively, by using the estimated parameter
, and
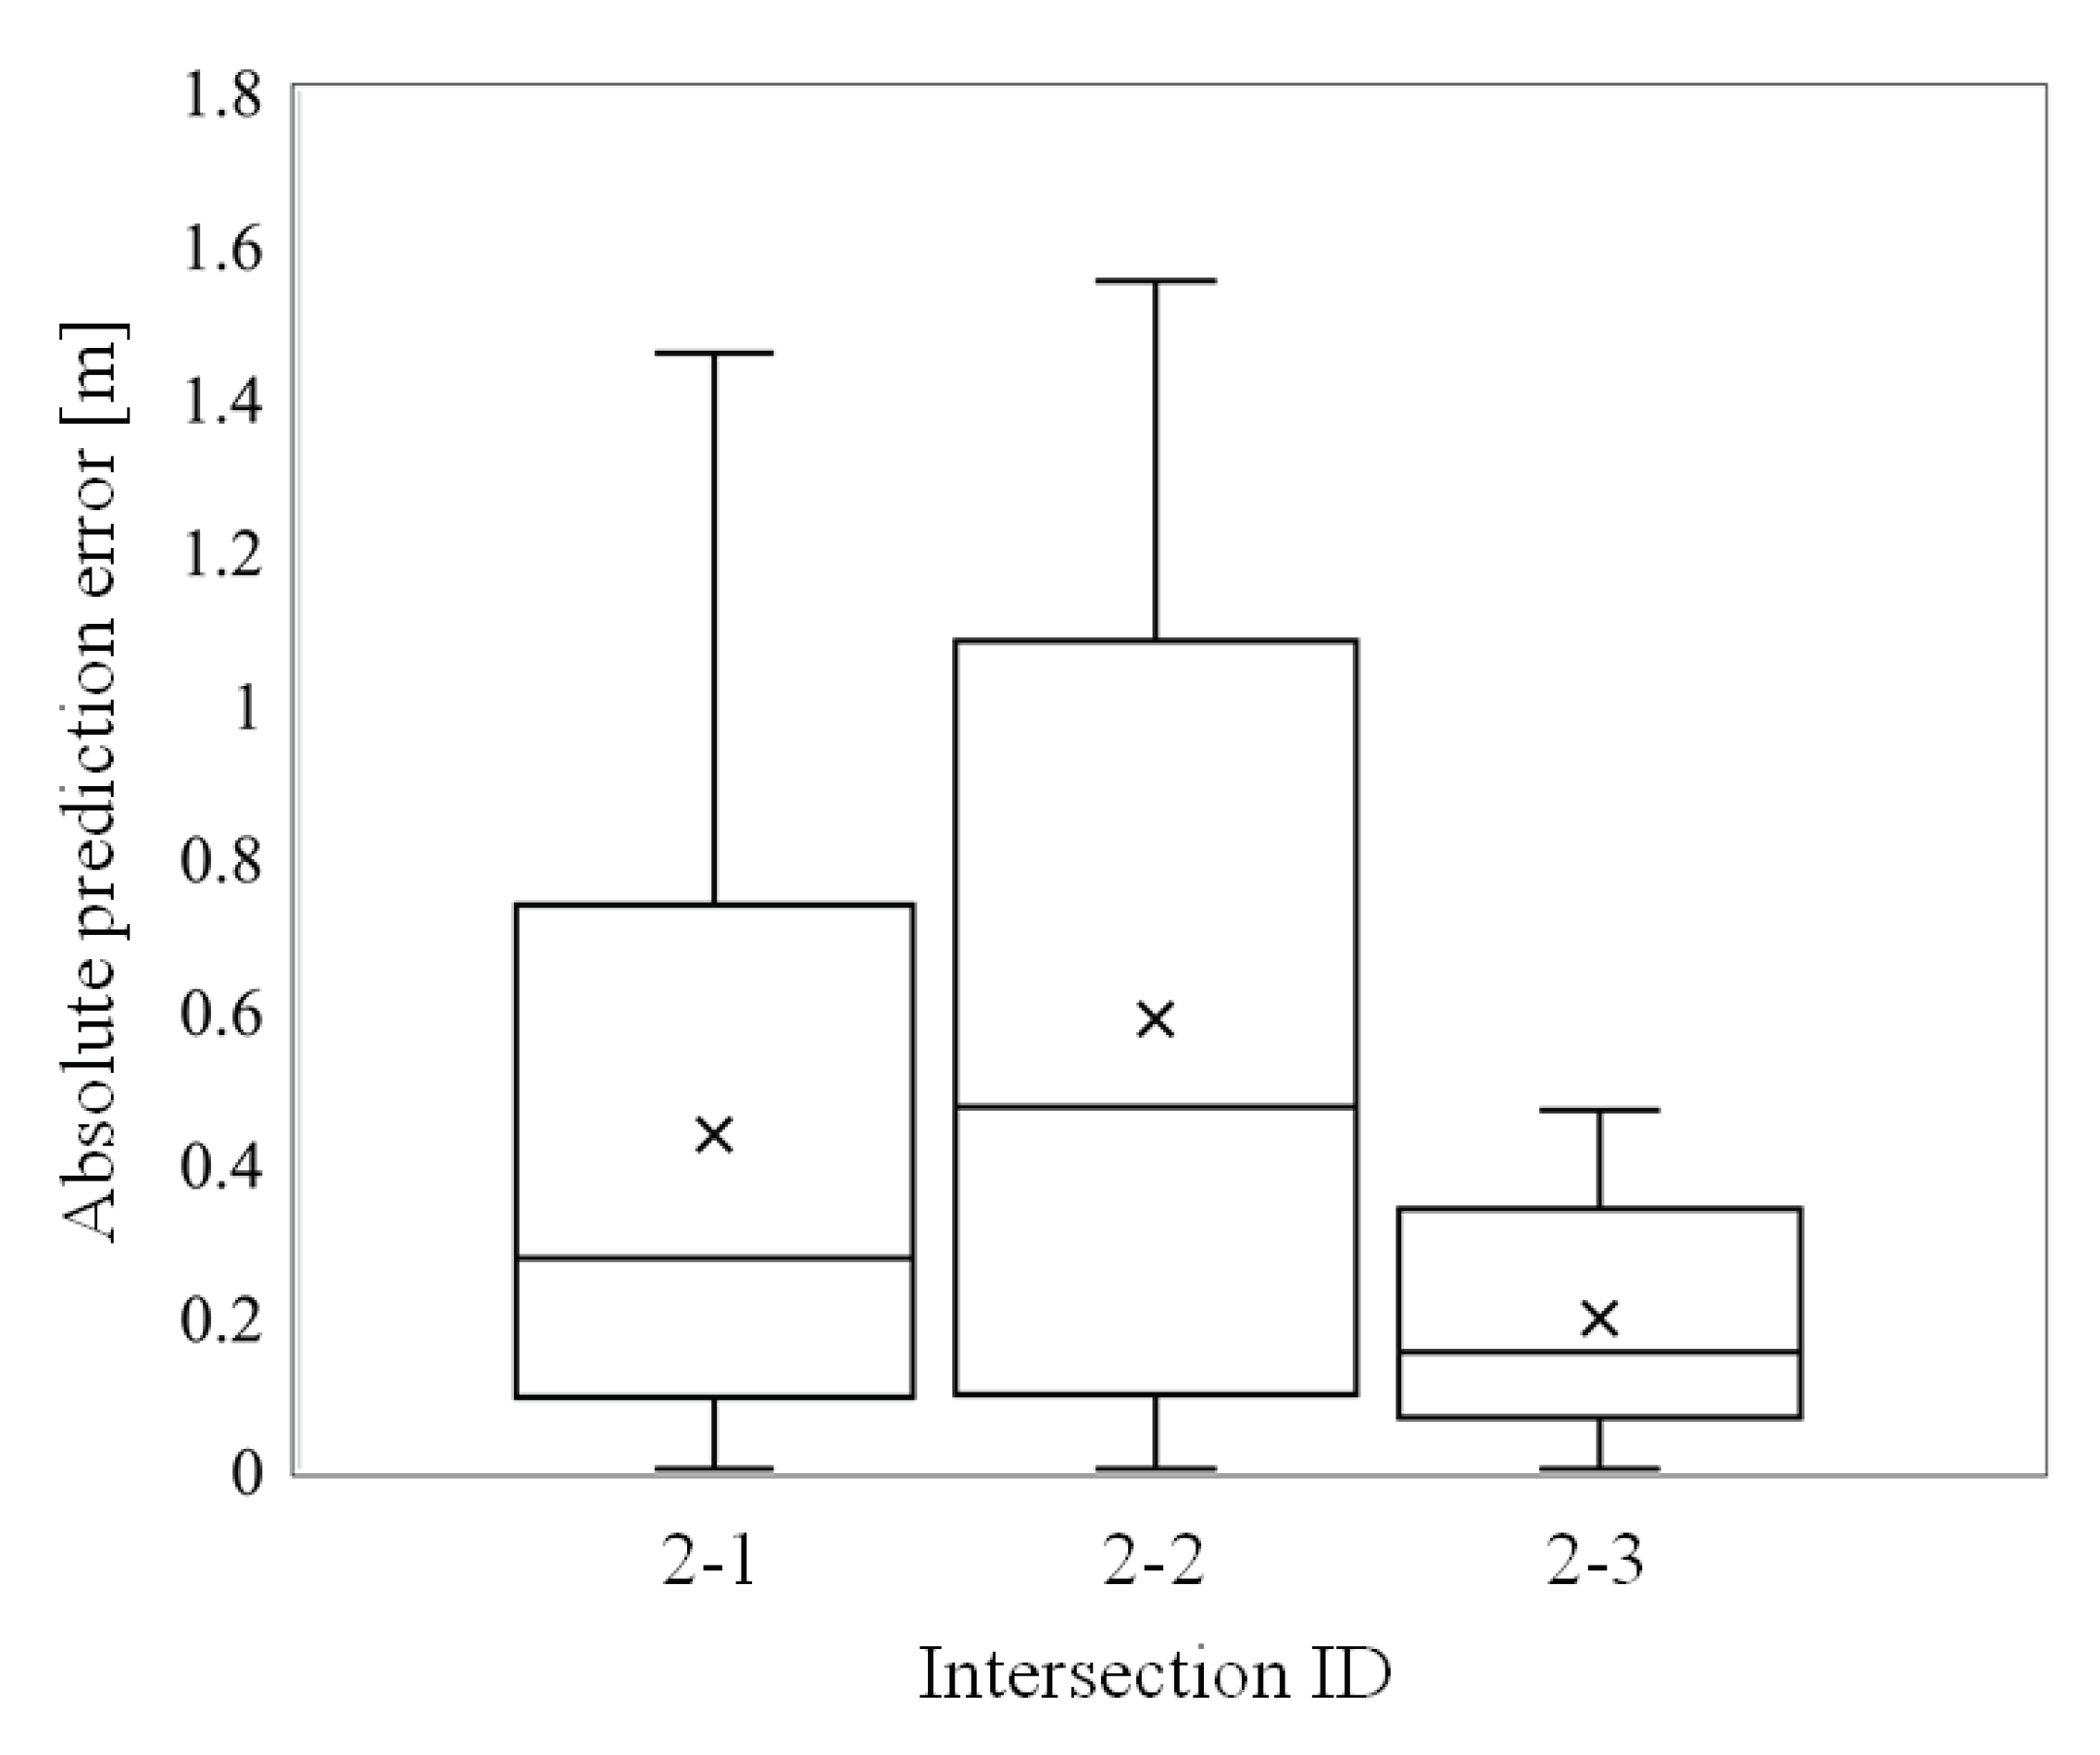
Figure 14 shows the box plot of the absolute prediction error between the predicted trajectories and the actual driving paths.
The trajectory predictions were calculated at 20 Hz. The absolute prediction errors in
Figure 11,
Figure 12,
Figure 13 and
Figure 14 refer to the deviation of the predicted vehicle rear axle trajectory in the curvilinear normal direction concerning the actual measured driving path. These errors were measured at every 0.5 m interval of each predicted trajectory. To evaluate trajectory prediction errors only around the intersections, in
Figure 14, the evaluated section was limited to the displacement
[m]. As can be seen in
Figure 11,
Figure 12 and
Figure 13, the trajectory predictions with the estimated parameters could predict the right turning trajectory overall, and the method could predict the vehicle trajectory before the vehicle drove into the intersection. The graphs that show absolute prediction errors indicate that the errors were suppressed under 1.6 m in all cases. After the turning started, the prediction errors became suppressed to around 0.5 m. In the result of the intersection ID 2-3, some absolute errors became larger at the end of the predictions; however, these errors were from the displacement after the vehicle completed the turning, therefore these errors were not included in the evaluation.
Moreover, in most predictions, prediction errors at prediction positions that were shorter than 15 m ahead of the vehicle position were very low, at around 0.5 m. Thus, for driver assistance systems that require short-range trajectory prediction, such as emergency braking or steering assistance, the results showed that the proposed method could effectively predict the future positions of the ego vehicle.
As can be seen in
Figure 14, 75% of absolute errors in all cases were less than 1.2 m and, especially in the intersection ID 2-3, 75% of prediction errors were less than 0.4 m. In addition, 50% of absolute errors in all cases were less than 0.5 m. These results indicate that the proposed method had high prediction precision and accuracy. However, there was a variance in prediction errors by the intersection shapes. To improve the accuracy of the prediction, more intersection turning data may be needed to tune the parameter estimation in Equation (
25).
6. Conclusions
In order to predict the vehicle’s right-turn trajectory during the intersection turning without depending on V2V or V2I communication technology, this paper presented a turning trajectory prediction method using the Triclothoidal curve. The Triclothoidal curve consists of three clothoidal curves sequentially connecting without discontinuities in the curvature. In this paper, we proposed the curve generation method and how to apply the Triclothoidal curve to the intersection trajectory prediction method. By using the Triclothoidal curve, the proposed prediction method could predict the turning trajectory by simply providing the steering angle, terminal point direction, and terminal point position. The driving data acquisition experiments conducted at actual urban intersections evaluated the effectiveness of the proposed method. A parameter estimation equation derived the geometrical correlation between the terminal point position of the Triclothoidal curve and the shape and size of the urban intersection.
In this paper, the data acquisition experiments were conducted with a manual driving car. In the next step, we will evaluate the effectiveness of the driver assistance by implementing the trajectory prediction to the autonomous or ADAS functions for intersections such as a collision avoidance system or a steering assistance system.
This paper has contributed to the research on ADAS for intersection turning in the following ways:
A geometrical trajectory prediction method using the Triclothoidal curve enabled the generation of a smooth and continuous turning trajectory with a simple, fast, and real-time capable low calculation cost;
The proposed definitions of the terminal point of the prediction trajectory adapted to the variable sizes, lanes, and shapes of the intersections. The terminal point was calculated by giving only three geometrical parameters: intersection crossing angle and road widths of the entering road and exiting road;
The driving data acquisition experiments revealed that the trajectory prediction method using the Triclothoidal curve was superior to the conventional curve generation methods, such as the circular arc, Biarc curve, and clothoidal curve, and was effective in real urban intersections;
We expect to broaden the application of the proposed Triclothoidal curve generation method beyond the intersection right-turn to other situations such as left-turn or overtaking, because the curve can be generated by giving the steering angle, terminal point direction, and terminal point position.
As a further evolution of the proposed trajectory prediction method, it is also necessary to consider the adoption of communication technologies. Especially in autonomous driving technology, Vehicle-to-Everything (V2X) communication, including X2V, is a key technology. V2V and V2I communications are especially essential for intersection safety. As an example of V2X technology, 5G New Radio (NR) is expected to realize the reliable and large-capacity V2X communication via a cellular network [
35]. Using this 5G NR technology, we expect the proposed method to realize the following functions: First, to provide an accurately predicted trajectory to other traffic participants enabling the mitigation of collision risk with oncoming objects in the invisible area; Second, to obtain the position, heading, steering angle, and target direction of other vehicles through communication, enabling the prediction of the trajectory of the surrounding objects; Third, to obtain the other vehicles’ turning trajectory data, which can be utilized as a priori information to improve the accuracy of trajectory prediction.
