Article

Influences of the Pretreatments of Residual Biomass on Gasification Processes: Experimental Devolatilizations Study in a Fluidized Bed

by
Stefania Lucantonio
,
Andrea Di Giuliano
and
Katia Gallucci
*
Department of Industrial and Information Engineering and Economics (DIIIE), University of L’Aquila, Piazzale E. Pontieri 1-loc. Monteluco di Roio, 67100 L’Aquila, Italy
*
Author to whom correspondence should be addressed.
Appl. Sci. 2021, 11(12), 5722; https://doi.org/10.3390/app11125722
Submission received: 2 June 2021 / Revised: 17 June 2021 / Accepted: 18 June 2021 / Published: 20 June 2021

Abstract

:
The European research project CLARA (chemical looping gasification for sustainable production of biofuels, G.A. 817841) investigated chemical looping gasification of wheat straw pellets. This work focuses on pretreatments for this residual biomass, i.e., torrefaction and torrefaction-washing. Devolatilizations of individual pellets were performed in a laboratory-scale fluidized bed made of sand, at 700, 800, and 900 °C, to quantify and analyze the syngas released from differently pretreated biomasses; experimental data were assessed by integral-average parameters: gas yield, H2/CO molar ratio, and carbon conversion. A new analysis of devolatilization data was performed, based on information from instantaneous peaks of released syngas, by simple regressions with straight lines. For all biomasses, the increase of devolatilization temperature between 700 and 900 °C enhanced the thermochemical conversion in terms of gas yield, carbon conversion, and H2/CO ratio in the syngas. Regarding pretreatments, the main evidence is the general improvement of syngas quality (i.e., composition) and quantity, compared to those of untreated pellets; only slighter differentiations were observed concerning different pretreatments, mainly thanks to peak quantities, which highlighted an improvement of the H2/CO molar ratio in correlation with increased torrefaction temperature from 250 to 270 °C. The proposed methods emerged as suitable straightforward tools to investigate the behavior of biomasses and the effects of process parameters and biomass nature.

1. Introduction

The EU’s Renewable Energy Directive (RED II) has set the goal of achieving a 14% renewable energy share in the transport sector by 2030 [1], and residual biomasses and agro-industrial waste can be exploited as sources to produce sustainable second generation biofuels [2], which are expected to significantly reduce greenhouse gas emissions [2,3].
The gasification of residual biomass, to produce advanced biofuels, is a promising technology to achieve the goals of RED II. Gasification is a mature thermochemical conversion process suitable for biomasses, with syngas (mixture of H2, CO, CO2, CH4, possibly diluted by steam and/or N2 [4]) as the main product; syngas is primarily used to generate heat and electricity, and is potentially exploitable to synthesize advanced biofuels (the latter option has not yet been fully implemented at the industrial scale) [5]. Gasification consists of partial oxidation of the carbon contained in the biomass (or in other carbonaceous fuels) at high temperature (750–1150 °C [6]), using a controlled amount of an oxidant agent (air, pure oxygen, steam, or mixtures of them) [6]. Pure oxygen ensures the production of a high heating value and nitrogen-free syngas, the latter feature being advantageous for the synthesis of biofuels; however, the provision of pure oxygen requires an air separation unit (ASU), which is usually associated with high capital and operational costs [5]. The chemical looping gasification (CLG) process is a new gasification concept, which avoids nitrogen dilution without requiring an ASU and allows for decent fuel conversions [5,7,8]. The difference between CLG and conventional gasification methods is represented by the oxygen source: the gaseous oxidant agents are replaced by the lattice oxygen provided by metal oxides (MexOy) [9]. These metal oxides for CLG are called oxygen carriers (OC). A suitable reactor configuration for CLG is the dual fluidized bed reactor: one fluidized bed works as a gasifier (steam and/or CO2 as fluidizing agents, while the OC particles provide oxygen); the other bed works as a burner (air as the oxidizing and fluidizing agent, the OC recovers oxygen); the OC particles continuously circulate from one bed to the other [10].
The ongoing European research project CLARA (chemical looping gasification for sustainable production of biofuels, G.A. 817841 [11]) aims to develop an efficient technology to produce liquid fuels by the Fischer–Tropsch synthesis [12], which converts the syngas obtained by the CLG of selected biogenic residues [13]. Concretely, CLARA’s final objective is to prove the feasibility of a complete residual biomass-to-fuel chain up to the 1 MWth scale in an industrially relevant environment, with a target cold gas efficiency of 82%, carbon conversion of 98%, and the level of tar in outlet syngas lower than 1 mg Sm−3 [14,15]. Even though CLG is rather flexible concerning the nature of raw solid fuel, one of the main focuses and novelty points of CLARA deals with the study of biomass pretreatments, carried out in order to improve fuel performances during their thermochemical conversion, in terms of fuel energy density and avoidance of sintering/agglomeration phenomena of fluidized bed particles with fuel ashes [15,16].
CLARA has selected wheat straw as a residual biomass of interest for CLG, investigating the effects from several pretreatments, such as torrefaction, washing, addition of minerals; those pretreatments, described in detail elsewhere [15,16,17], were mainly focused on the issue of agglomeration avoidance during the reduction-oxidation cycles of CLG, involving both OC particles and biomass ashes [15]. This work focuses on torrefaction and washing influences on the pyrolytic behavior of pretreated biomass.
Torrefaction is a mild form of pyrolysis at temperatures ranging between about 200 and 300 °C, in an inert environment [18]. Tumuluru et al. [18] reported that biomass torrefaction improves its physical properties, such as: grindability; particle size and distribution; pelletability; proximate and ultimate composition (moisture, carbon, and hydrogen content); calorific value; storability, thanks to increased resistance towards biological degradation. Ru et al. [19] investigated physicochemical characteristics of fast-growing poplar, torrefied at 200, 225, 250, 275, and 300 °C; they found that: (i) torrefaction reduced biomass hemicellulose content because of dehydration, deacetylation, and cleavage of ether linkages; (ii) H/C decreases while O/C and heating value increase as the torrefaction temperature is increased. Stelte et al. [20] focused on the correlation between wheat straw torrefaction (in the range 150–300 °C) and pelletizing properties, concluding that the pelletizing process results in mechanically strong pellets (with higher heating value and reduced moisture adsorption) for torrefaction temperature lower than or equal to 250 °C. Di Giuliano et al. [15], thanks to the research carried out at CENER (Centro Nacional de Energías Renovables), found that torrefaction was effective in the removal of Cl from wheat straw, therefore suggesting this pretreatment as a de-chlorinating operation, which prevents the formation of pollutants derived from Cl and the accelerated corrosion issues in facilities for thermochemical processes, such as CLG.
The washing pretreatment may be used to remove alkali and alkaline earth metals (AAEM) [15,21]. Cen et al. [21] studied the AAEM content and the pyrolytic behavior of rice straw, washed with water, aqueous HCl solution or aqueous phase bio-oil; they found that K, Ca, Mg, and Na were removed thanks to washing by each of the three liquids, with removal efficiencies always between 90–100% as to the HCl solution and aqueous phase bio-oil, while quite lower with water (~80% for K, ~10% for Ca, ~25% for Mg, and ~75% for Na); with regard to the pyrolytic behavior of washed rice straw, they found that the pretreatment with water had little effect on developed non-condensable gases.
This work thoroughly investigates the influence of some pretreatments on the thermochemical decomposition of wheat straw and the produced syngas. In this regard, experiments were carried out involving devolatilizations in a fluidized bed made up of sand. Devolatilization is a key step of a generic gasification process, and strongly influences the amount and composition of the produced gas [22], so devolatilization results may detect possible primary effects of pretreatments on the thermochemical behavior of wheat straw. The fluidized bed made up of inert sand was chosen in so that: (i) biomasses could be studied in a reactor configuration similar to that of CLG developed in the CLARA project; (ii) possible redox effects from solids (such as OC) could be excluded and only those influences strictly due to biomass pretreatments could emerge. Devolatilization tests were performed on pellets of differently pretreated biomasses, firstly elaborating data by methods described elsewhere [10,23]. In addition, a further analysis of the same data was introduced, based on information taken from the instantaneous peaks of gas release during devolatilizations, treated by simple regressions with straight lines. This represents a point of novelty, since the introduced method is quite straightforward as far as both experimental and mathematical approaches are concerned.

2. Materials and Methods

2.1. Investigated Biomasses

The biomass investigated in this work is wheat straw, one of the biogenic residues selected within the CLARA project [10,15,16,24]. Wheat straw was in the form of pellets, useful to facilitate their transport, storage, and handling, and closer to its possible commercial utilization. Those wheat straw pellets underwent some pretreatments, i.e., torrefaction and torrefaction followed by washing, as described extensively elsewhere [10,15,16,17,25]. The torrefied and torrefied-washed pellets were also compared to the untreated wheat straw pellets (studied elsewhere [10]), which were considered as a reference material to infer the effects from pretreatments on syngas, if any. From here on, biomasses are named as indicated in Table 1. These biomasses were characterized by proximate and ultimate analyses, which allowed determining the moisture and ash contents, and the elemental composition; some of these data are available in [17,24] and were used in Equation (3) of this work. Chemical analysis and ash melting tests were also performed on investigated biomasses, as reported by Di Giuliano et al. [15], to quantify respectively the content of inorganics and the melting temperature of biomass ashes.

2.2. Bed Material and Conditions of Devolatilization Tests

Devolatilizations were carried out in a laboratory scale fluidized bed reactor. The granular bed was made up of sand, an inert material used to perform devolatilizations in the absence of particles with proven oxidizing properties (such as OC exploited in CLG). The physical properties of sand are summarized in Table 2. Nitrogen (N2) was used as the fluidizing gas, to avoid the provision of external oxygen, at 1.5 times the minimum fluidization velocity of sand, so to ensure similar fluid-dynamic conditions for all tests. Under the selected conditions (700, 800, and 900 °C in N2), sand particles (Table 2) belong to the Group B of generalized Geldart classification [26]. The minimum fluidization velocities (umf), calculated according to the method adopted by Di Giuliano et al. [15,27,28], are summarized in Table 2.

2.3. Experimental Apparatus and Procedure for Devolatilization Tests

Devolatilization tests, as anticipated in Section 2.2, were carried out for all biomasses listed in Table 1 at three temperature levels (700, 800, and 900 °C), with N2 as the fluidizing agent, in a fluidized bed made up of sand. The related experimental apparatus at laboratory-scale was depicted and fully described in detail elsewhere [10,23]. For the sake of clarity, it is also briefly described in the following.
A mass flow controller allowed N2 to be fed into the windbox of a cylindrical quartz reactor (5 cm internal diameter), in which the devolatilizations took place. Sand was loaded inside, in such a quantity to form a 7.5 cm high bed (1.5 times the internal diameter of the reactor). The reactor was heated by a cylindrical electric furnace, with temperature controlled by a thermocouple directly submerged in the bed. The syngas produced by devolatilizations left the reactor freeboard together with N2, and both passed through an ice trap, which operated a first separation of condensable species and entrained fine solids. Downstream, a double-pipe condenser (ethylene glycol on the shell-side at −4°C, gas flow on the tube-side) allowed the forced separation of water and other condensable substances. The dry and cold syngas passed through filters for a further cleaning, then reached gas detectors: (i) a micro-gas chromatograph (µGC) (Agilent 490, Agilent Technologies Italia S.p.A., Cernusco sul Naviglio (MI), Italy), to identify the hydrocarbons in the syngas (qualitative identification from a not exhaustive list of detected species, as discussed in [10,23]); (ii) an online ABB station, with analyzers measuring the volumetric concentrations of H2, CO, CO2, CH4, and hydrocarbons expressed in ppm of “equivalent C3H8”. From here on, equivalent C3H8 is named “C3H8,eq.” and such quantity excludes CH4, separately measured and accounted.

2.4. Processing of Devolatilization Data

For each pair “biomass kind-temperature”, three repetitions of devolatilization were performed (i.e., three pellets of the same kind were devolatilized at each temperature).
Each pellet was devolatilized individually and completely before feeding the following one. Because of this procedure, as already evidenced in [10,23], the experimental process is intrinsically at unsteady-state.
Thanks to the hypothesis of N2 as the internal standard, it was possible to determine the instantaneous molar flow rates of the gases (Fi,out, with i as the generic gaseous species produced by the devolatilization tests, quantified by the ABB system: H2, CO, CO2, CH4, C3H8,eq.). Figure 1 (Section 3.1) shows examples of these instantaneous flow rates from individual devolatilizations as functions of time (t), characteristically shaped as asymmetric peaks [29,30].
The evaluation of devolatilization performances by integral-average values, already proposed by the same research team in [10,23], was adopted in this work to calculate: gas yield (ηav, Equation (1)); H2/CO molar ratio (λav, Equation (2)); carbon conversion (χcav, Equation (3)); the superscript “av” means “integral-average”.
η a v = i F i , o u t   d t m p w i t h   i = H 2 , C O , C O 2 , C H 4   a n d   C 3 H 8 , e q .   ;   m p = m a s s   o f   p e l l e t   ( g )
λ a v = F H 2 , o u t   d t F C O , o u t   d t
χ C a v = 12   ( g   m o l 1 ) × j [ n j × F j , o u t   d t ] m p × ( 1 % m o i s t u r e a r 100 ) × ( 1 % a s h d b 100 ) × ( % C d a f 100 )   × 100 w i t h   j = C O , C O 2 , C H 4   a n d   C 3 H 8 , e q .   ;   m p = m a s s   o f   p e l l e t   ( g ) n j = n u m b e r   o f   c a r b o n s   a t o m s   i n   j % m o i s t u r e a r = m o i s t u r e   c o n t e n t   a s   w t %   i n   a s   r e c i e i v e d   ( a r )   b i o m a s s % a s h d b = a s h   c o n t e n t   a s   w t %   i n   b i o m a s s   o n   d r y   b a s i s   ( d b ) % C d a f = e l e m e n t a l   c a r b o n   a s   w t %   i n   b i o m a s s   o n   d r y   a s h   f r e e   b a s i s   ( d a f )
As to these parameters (Equations (1)–(3), the arithmetic average out of the three repetitions and the related standard deviation were calculated for each set “biomass kind-temperature”, and the resulting values were represented by bar-charts in Figure 2 (Section 3.1).
This work introduces a further method to analyze devolatilization performances, which focuses on the quantitatively most representative moment of unsteady-state devolatilizations of individual pellets, i.e., the top of Fi,out devolatilization peaks as functions of time (see Figure 1), when the highest gas release occurred.
The procedure to elaborate this data follows:
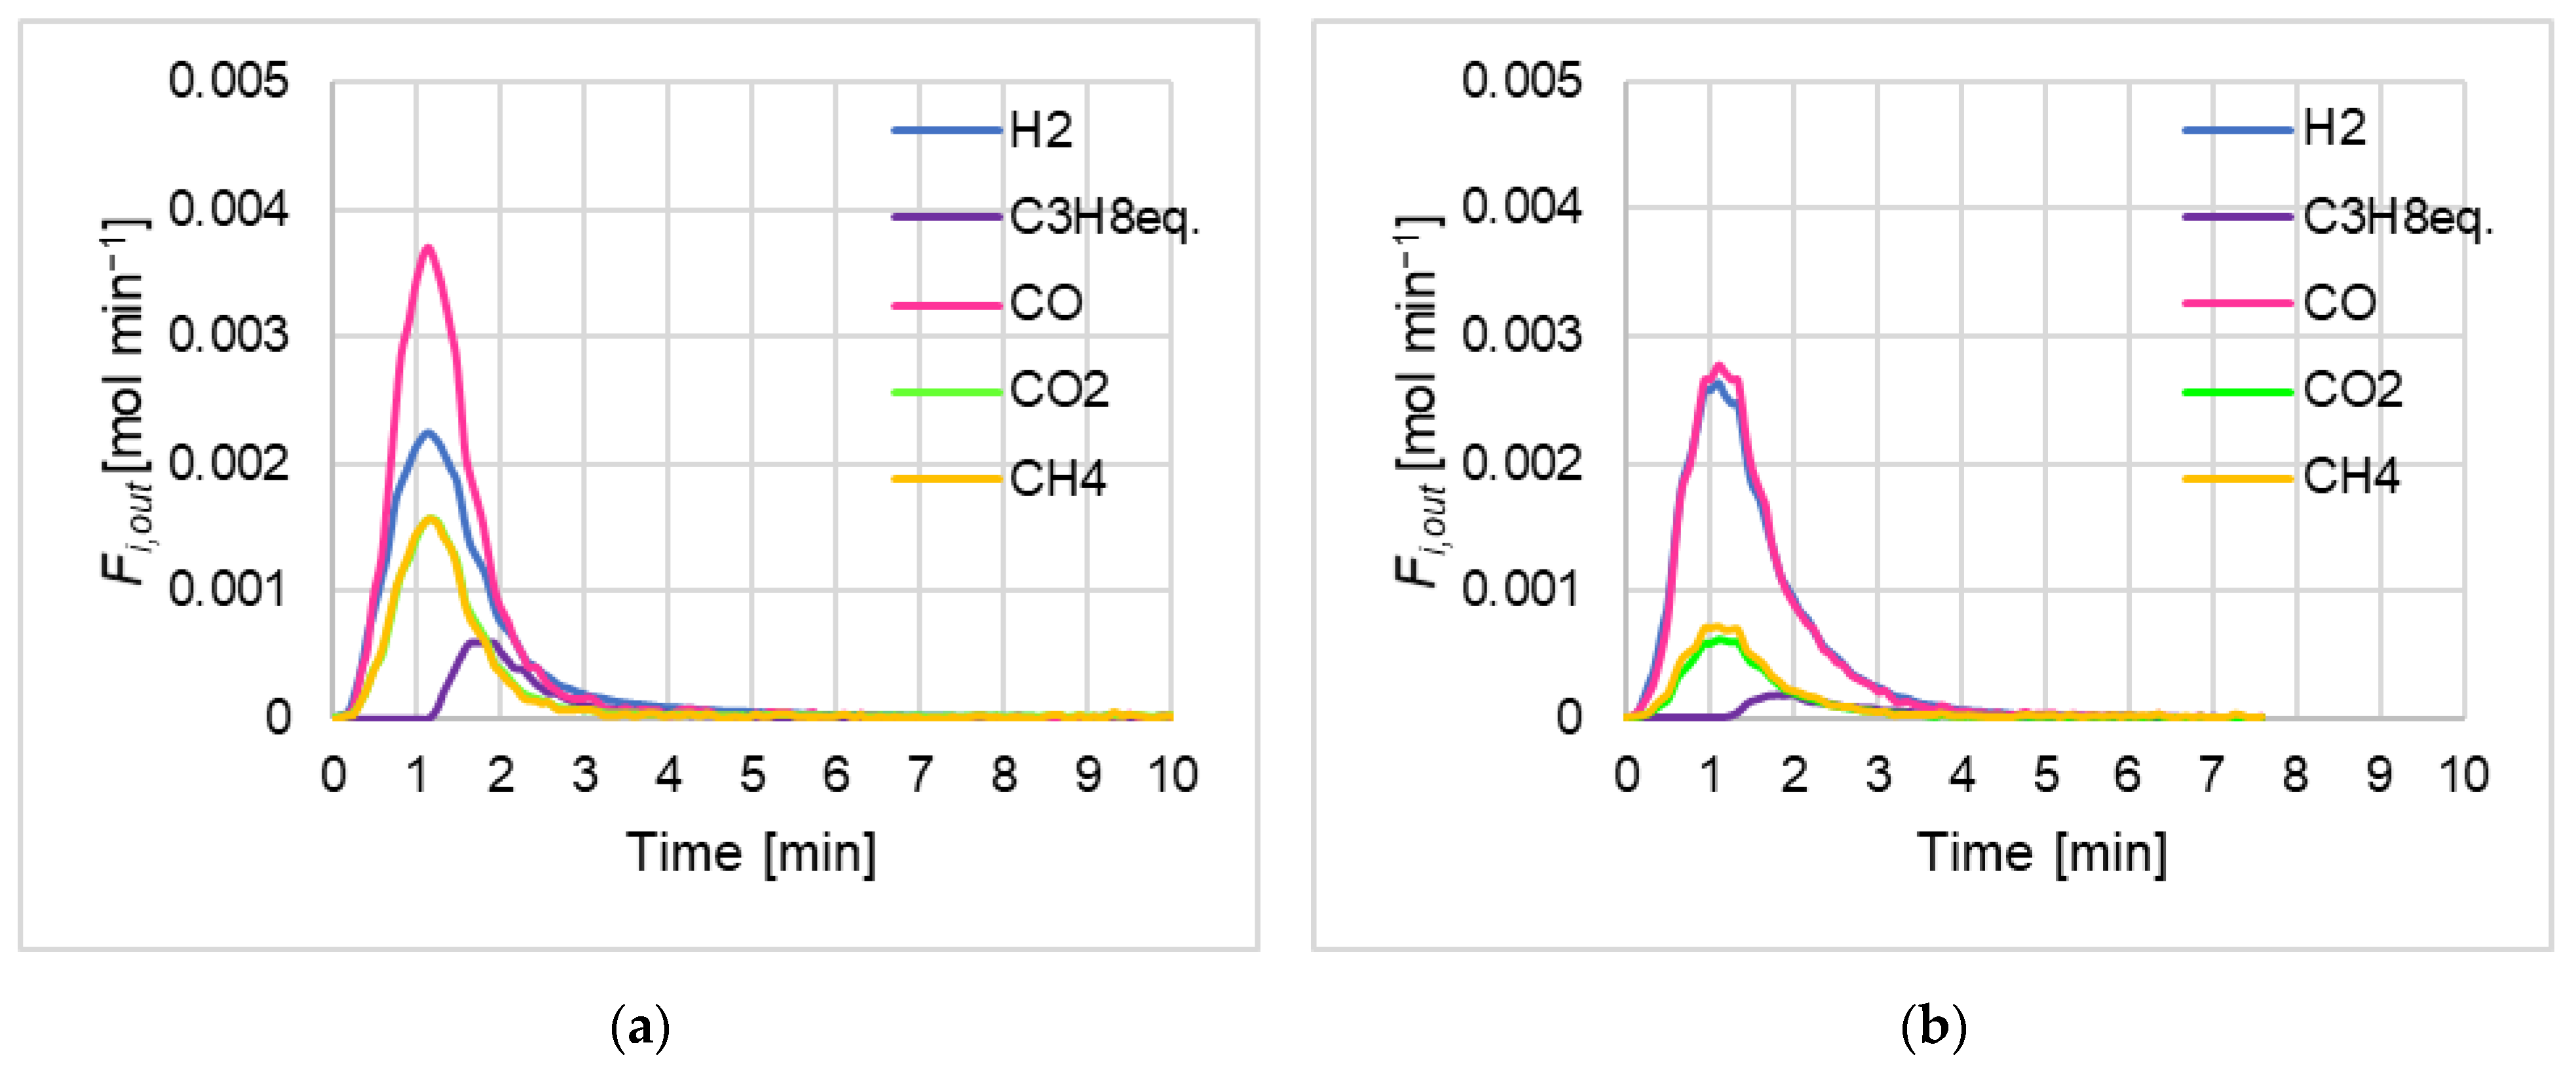
  • for each set “biomass kind-temperature” and for each of the three repetitions, the highest released flow rate (i.e., peak top of Fi,out in Figure 1) was identified for each quantified species (i = H2, CO, CO2, CH4, and C3H8,eq.);
  • a neighborhood of 7 Fi,out experimental points was selected, centered on the considered peak top;
  • the arithmetic average ( F i , o u t , p , Equation (4), where “p” superscript means “peak”) was calculated out of these 7 points.
In addition, the distribution among peaks of released gases—namely H2, CO, CO2, CH4, and C3H8,eq.—was calculated, in terms of molar fractions on a nitrogen-free basis ( Y i , o u t p , Equation (5)). For each temperature value and each gaseous species, three points were obtained (one per test), corresponding to the three repetitions for each kind of biomass; therefore, for the generic gaseous species i, 9 values of Y i , o u t p were obtained, evenly distributed on the three temperature levels 700, 800, 900 °C.
F i , o u t p = k = 1 7 F i , o u t , k 7 w i t h   i = H 2 , C O , C O 2 , C H 4   a n d   C 3 H 8 , e q .   ;   k = n u m b e r   o f   e x p e r i m e n t a l   p o i n t
Y i , o u t p = F i , o u t p i F i , o u t p w i t h   i = H 2 , C O , C O 2 , C H 4   a n d   C 3 H 8 , e q  
Moreover, a parameter called “specific maximum gas production” (SMGP) was introduced and calculated by Equation (6). This parameter is a local value expressed as a specific gas yield per unit of biomass and unit of time, which focuses on the devolatilization phenomenon around the peak top of released gas flow rate.
S M G P = i F i , o u t p m p w i t h   i = H 2 , C O , C O 2 , C H 4   a n d   C 3 H 8 , e q .   ;   m p = m a s s   o f   p e l l e t   ( g )
Analogously to Y i , o u t p , 9 SMGP values resulted for each kind of biomass, evenly distributed on the three temperature levels 700, 800, 900 °C.
For each 9-points set of Y i , o u t p or SMGP as functions of devolatilization temperature, a regression was performed by means of dedicated Microsoft Excel tool, under the assumption of straight line (Equation (7)) as the modeling equation for Y i , o u t p or SMGP dependency on devolatilization temperature (T). This assumption was supported by observing the approximately linear trends of devolatilization performances experimentally determined by Zeng et al. [30], with tests at different temperature levels, progressively increased by 50 °C in the range 600–900 °C.
Z = m   T [ ° C ] + q w i t h   Z = Y i , o u t p   o r   S M G P   ;   m = s l o p e   ; q = i n t e r c e p t   a t   T = 0

3. Results

Figure 1 shows two examples of results (out of 63), obtained from devolatilizations of individual pellets, expressed in terms of Fi,out. As already reported by [10,23], Fi,out curves as functions of time have an asymmetrical shape, due to the unsteady-state of each devolatilization.

3.1. Results from Devolatilization Tests: Integral-Average Quantities

Figure 2 shows the overall results of the devolatilization tests carried out using sand as the bed material, in anoxic conditions due to N2 supply, at three temperature levels (700, 800, and 900 °C). The data of the three repetitions of the untreated WSP pellets were adapted from [10]. The bar-charts in Figure 2 summarize the devolatilization results in terms of integral-average parameters: (i) gas yield (ηav, Equation (1)), (ii) H2/ CO molar ratio (λav, Equation (2)), and (iii) carbon conversion ( χ C a v , Equation (3)), calculated by the procedure described in Section 2.4. For each set “biomass kind-temperature” in Figure 2, the bar heights represent the average values of the considered quantity out of the three repetitions, the associated error bars represent the related standard deviations.

3.2. Results from Devolatilization Peaks: Regression Analyses

As described in Section 2.4, the molar fractions on N2-free basis ( Y i , o u t p , Equation (5)) of the gases and the SMGP (Equation (6)) were calculated, focusing on the peaks top of gas release during devolatilizations of individual pellets.
Figure 3 shows the results of this calculations from devolatilizations of WSP pellets at each temperature level, provided with regression straight lines (Equation (7)). For the sake of clarity, the slopes (m, Equation (7)) and y-axis intercepts (q, Equation (7)) of regression straight lines were collected in Table 3 for devolatilizations of WSP pellets.
Figure 4 and Figure 5 show the results of peak analyses on devolatilizations data for torrefied (WSP-T1, WSP-T2, WSP-T3) and torrefied-washed pellets (WSP-T1W, WSP-T2W, WSP-T3W). In order to facilitate comparisons, the graphs of the molar fractions ( Y i , o u t p , Equation (5)) of the six pellets were collected in Figure 4, while Figure 5 collects the graphs of SMGP for the same biomasses. Table 4 and Table 5 are associated with Figure 4 and Figure 5, respectively, reporting the coefficients m and q (Equation (7)) of regression straight lines.

4. Discussion

Before a detailed discussion of devolatilization results, it is worth to stress that this study aimed to strictly examine the influences from wheat straw pretreatments and devolatilization temperatures on pellets thermochemical behavior. For this reason, tests were carried out in an inert atmosphere and with a unique bed material, devoid of those oxidative properties typical of the OC investigated within CLARA project [5,10,15,31]. In such a way, results did not depend on the type of bed material or any external oxygen supply.

4.1. Integral-Average Quantities

Figure 2 highlights that the devolatilization temperature is a parameter with a significant effect on devolatilization performances, whatever the considered biomass kind; for all biomasses, the gas yield (ηav, Equation (1), Figure 2a) and the H2/CO molar ratio (λav, Equation (2), Figure 2b) grew as the temperature was increased. With regard to the carbon conversion ( χ C a v , Equation (3), Figure 2c), the difference between values at 800 and 900 °C was not always evident (net of standard deviations), so that trends with respect to temperature were not as much clear as in the case of ηav and λav. Anyway, one can state that the temperature increasing from 700 to 800 °C always improved χ C a v . As a matter of fact, Wang et al. [32] reported how the gas yield, the carbon conversion and the H2 and CO content in the syngas increased as the devolatilization temperature was increased, with experiments on sawdust pellets in a fluidized bed reactor, within the range 750–950 °C. Consequently, considerations about Figure 2 may suggest that one should obtain the best performance of thermochemical conversion of wheat straw biomasses by operating at the highest tested temperature (900 °C).
In general, the increase in gas yield (ηav, Equation (1), Figure 2a) is not necessarily accompanied by an improvement in syngas quality (e.g., in terms of H2/CO ratio for Fischer-Tropsch synthesis). Remarkably, in the case of study of this work, the H2/CO molar ratio (λav, Equation (2), Figure 2b) grew together with gas yield (ηav, Equation (1), Figure 2a) as the temperature was increased; in other words, there is a general improvement in the quality and quantity of the syngas due to the increase of devolatilization temperature, which in turn appeared to enhance the extent of reforming and cracking reactions.
In addition to the devolatilization temperature influence, minor effects due to pretreatments were observed on devolatilization performances.
A comparison between the results of torrefied pellets (WSP-T1, WSP-T2, WSP-T3) and those of WSP, suggested that:
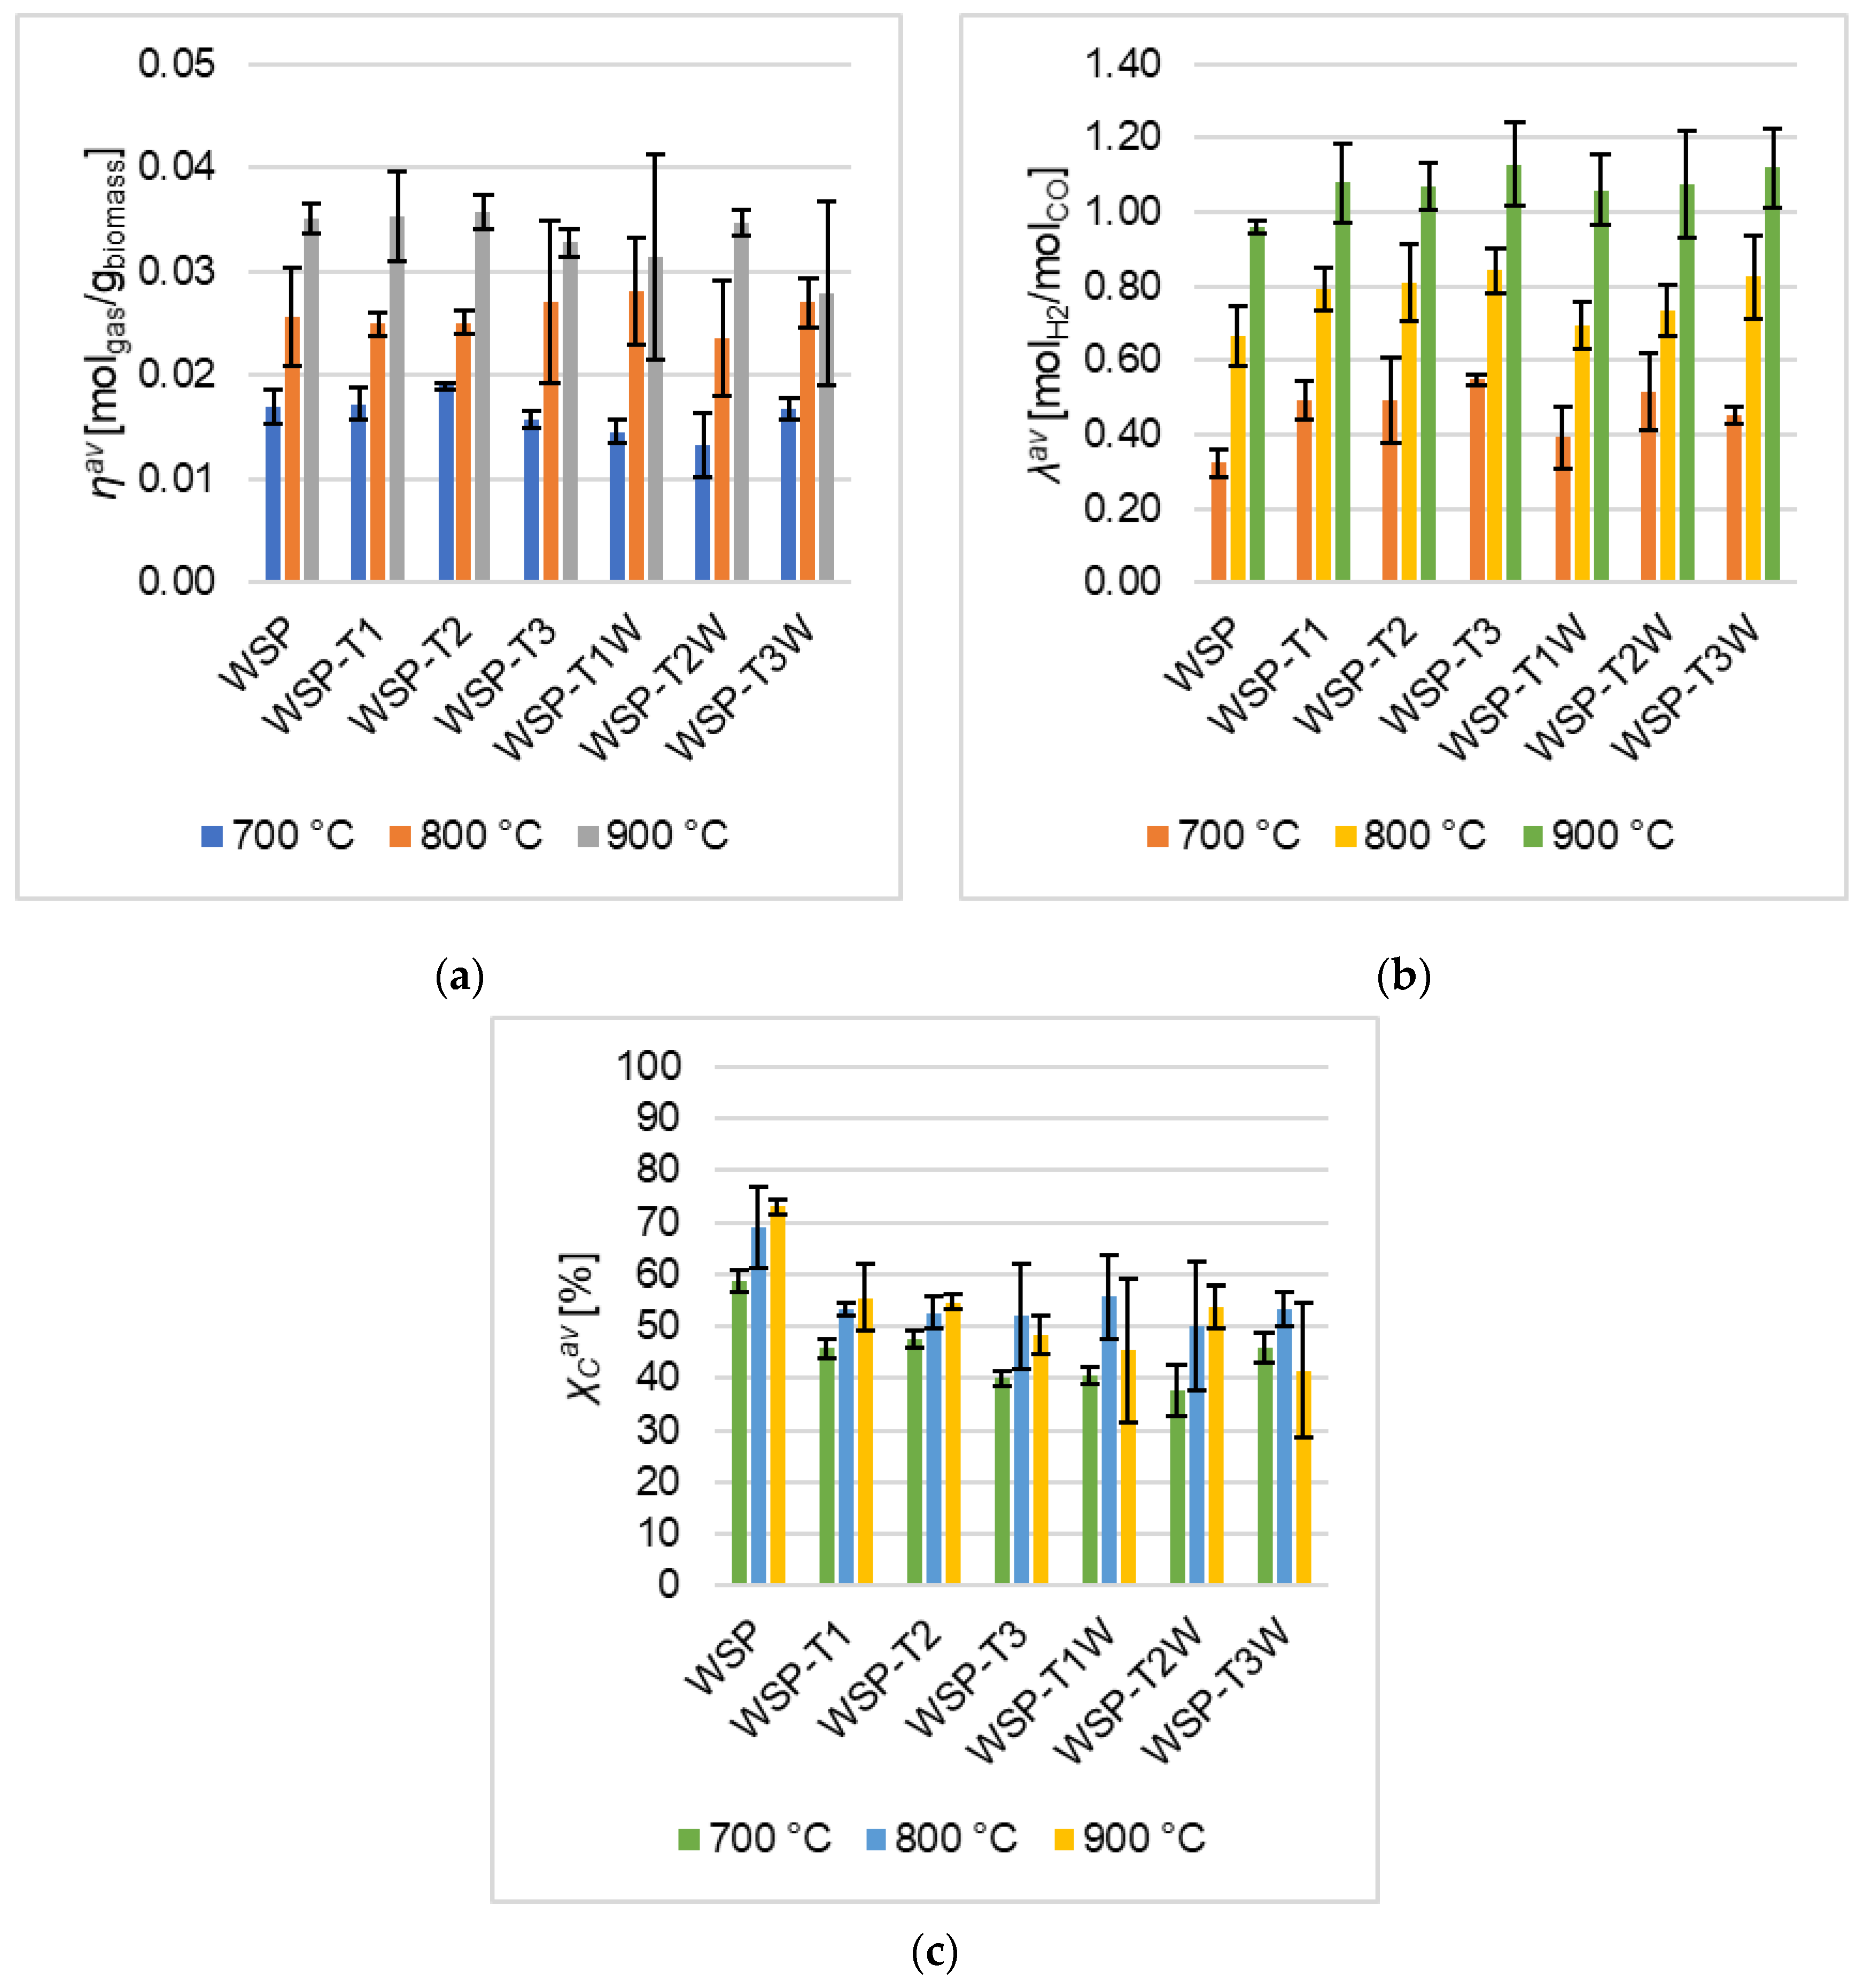
  • the ηav of torrefied pellets was close to that of WSP (Figure 2a), with differences even less evident if standard deviations are taken into account;
  • the λav of torrefied pellets is slightly higher than that of WSP (Figure 2b);
  • with torrefied pellets, a substantial decrease of the χ C a v emerged in comparison to the same quantity of WSP (Figure 2c); this is in agreement with the expected effects of the torrefaction pretreatment (defined elsewhere [17]). As highlighted by Fan et al. [33], torrefaction can lead to a reduction of carbon conversion in the thermochemical conversion of the biomass, because of devolatilization, polycondensation, and carbonization which occur during the pretreatment; as a matter of fact, Niu et al. [34] referred that torrefaction increased the elemental carbon content per unit of mass, because of the release of volatiles (such as water and CO2), which in turn made the biomass properties shift towards those of coal [35].
With regard to torrefied samples (WSP-T1, WSP-T2, WSP-T3), a further focus was performed on effects of torrefaction temperature:
  • no evident influences emerged on gas yield (ηav, Equation (1), Figure 2);
The highest H2/CO molar ratio (λav, Equation (2), Figure 2b) resulted for WSP-T3; Zhang et al. [36] found that 270 °C was the best torrefaction temperature for pelletized pine and spruce sawdust, among investigated values of 240, 270, 300, and 330 °C: they carried out devolatilizations by thermogravimetric measurements and determined, by kinetic analyses, that the activation energy of H2 release was minimum when the torrefaction temperature was equal to T3 (270 °C).
Concerning the torrefied-washed samples (WSP-T1W, WSP-T2W, WSP-T3W), a comparison with the corresponding torrefied pellets (WSP-T1, WSP-T2, WSP-T3) evidenced that ηav (Figure 2a), λav (Figure 2b), and χ C a v (Figure 2c) did not substantially vary, net of standard deviations. The washing pretreatment after torrefaction did not produce significant improvements, at least in terms of gas yield, H2/CO molar ratio, and carbon conversion. These results can be justified by considering that the washing pretreatment with water was strictly applied to remove AAEM from the biomass [37]. On the other hand, it is worth to stress that the washing pretreatment improves some other properties of wheat straw from the gasification process point of view, since the release of contaminants (e.g., KCl, H2S) is preliminary reduced, and therefore the post-processing requirements in the cleaning unit of syngas may decrease [17].

4.2. Peak Quantities
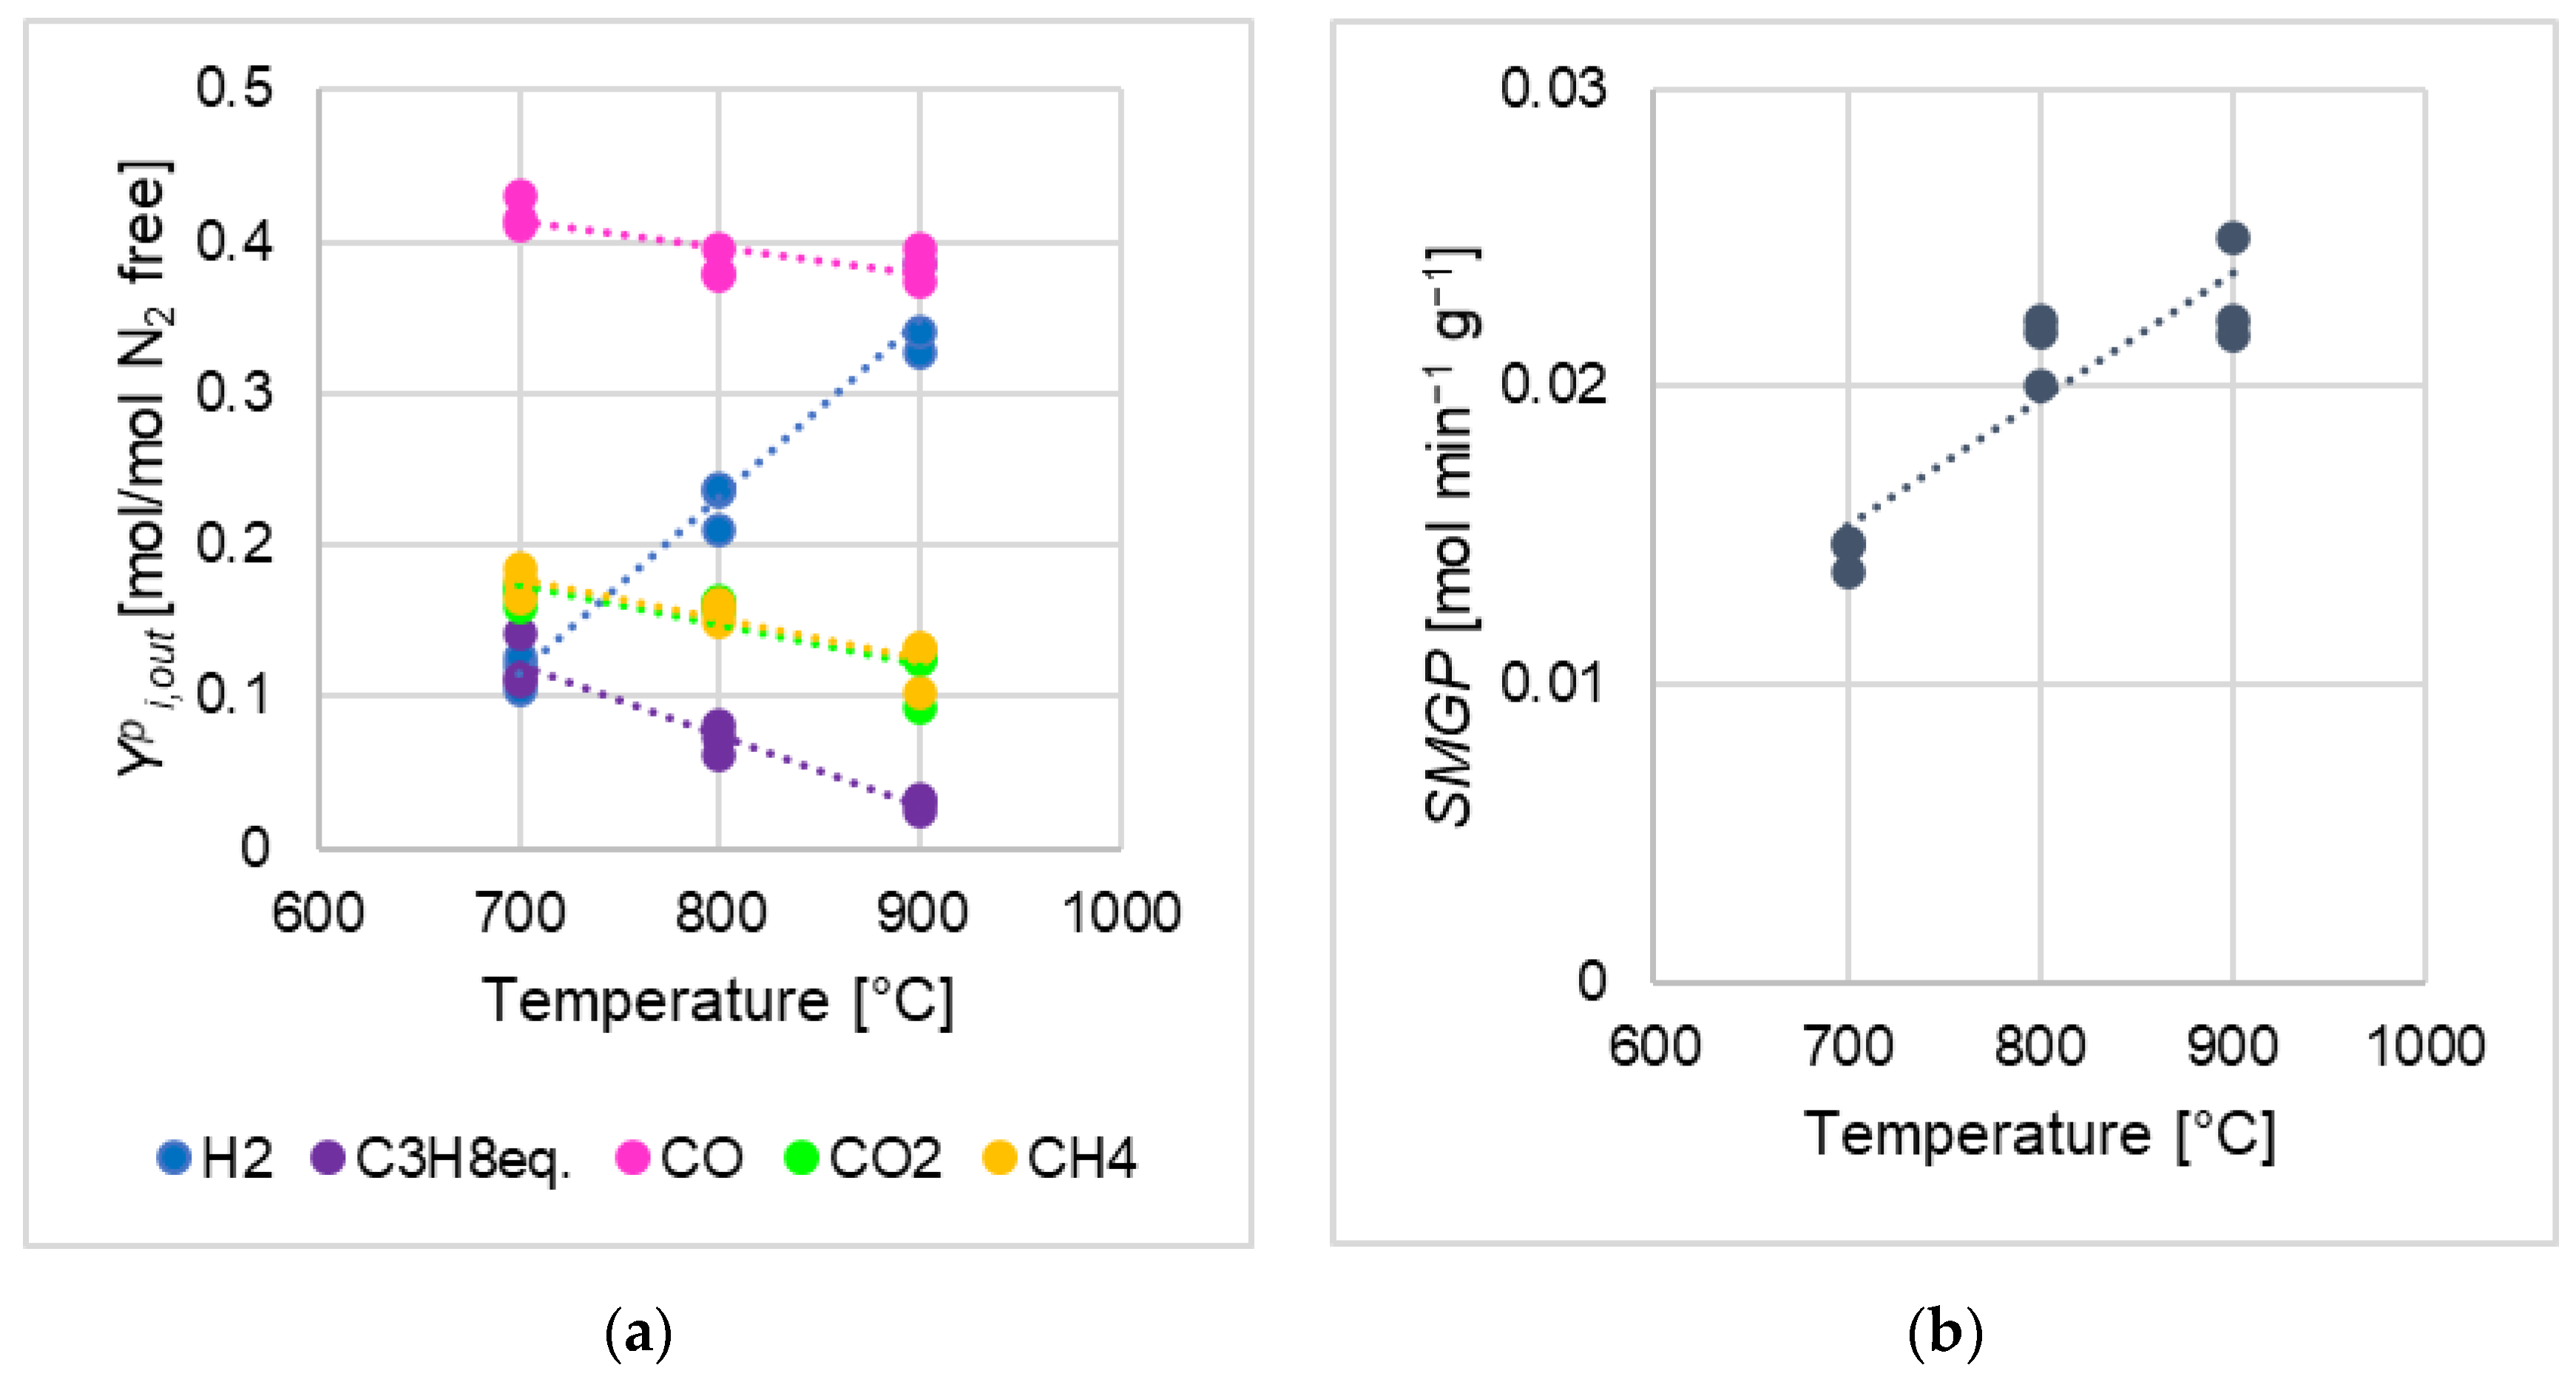
Figure 4 and Figure 5 summarize the results of devolatilization data analysis focused on peak quantities.
In general, for all kinds of biomass, Figure 3a and Figure 4 suggest that:
  • Y C H 4 , o u t p , Y C O 2 , o u t p , Y C 3 H 8 ,   e q . , o u t p (Equation (5)) decreased as the devolatilization temperature was increased, for all kinds of biomasses; qualitative identification analyses with the µGC AGILENT 490 found a high number of hydrocarbons species at 700 °C (i-C4H10, n-C4H10, C5H12, i-C5H12, n-C5H12, C6H6, C2H4/C2H2, C2H6, C3H8, C3H4), just some of them at 800 °C (n-C4H10, C6H6, C2H4/C2H2, C2H6, C3H8), while at 900 °C none of them was detected;
  • Y H 2 , o u t p (Equation (5)) increased as the temperature was increased for all kinds of biomasses;
  • Y C O , o u t p (Equation (5)) of pretreated pellets (Figure 4), was quite constant or slightly increased as the temperature was increased, while Y C O , o u t p of WSP (Figure 3a) decreased.
These observations matched well with the discussion about integral-average parameters in Section 4.1, which highlighted that the higher the devolatilization temperature the higher the H2/CO ratio, hypothesizing an enhancement of reforming and cracking reactions of hydrocarbons due to the increasing of devolatilization temperature.
Table 3 and Table 4 show the coefficients m and q of regression straight lines obtained for Y i , o u t p :
  • m is an index of the effects due to the variations of devolatilization temperature on the Y i , o u t p distribution in the syngas; for a generic gaseous species i, a positive m means that Y i , o u t p increases as the temperature was increased (and vice versa), and the higher of the absolute value of m, the more abrupt the Y i , o u t p variation due to temperature (somehow related to similar temperature effects represented by values of the Arrhenius activation energy);
  • q may not have a proper physical-chemical interpretation for a given i species (anyway, it is likely interpretable analogously to the preexponential factor of Arrhenius function); in any case, being m equal, the higher the q the greater the tendency of a given biomass to release i;
Overall, for all investigated biomasses, m and q values related to Y i , o u t p (i = H2, CO, CO2, CH4, and C3H8,eq., Equation (5)) did not severely differ one to another for each considered gaseous species (Table 3 and Table 4); this was in agreement with the abovementioned observations about Figure 3a and Figure 4, which generally showed quite similar trends and absolute values for Y i , o u t p of the seven investigated biomasses.
Nevertheless, without prejudice to what was said in the previous sentence, the quantifications offered by m and q highlighted some minor differences between the behaviors of biomasses, associated to their devolatilization peaks; in this regard, Figure 6 compares regression lines obtained by m and q values from Table 3 and Table 4 for Y i , o u t p (i = H2, CO, CO2, CH4, and C3H8,eq., Equation (5)):
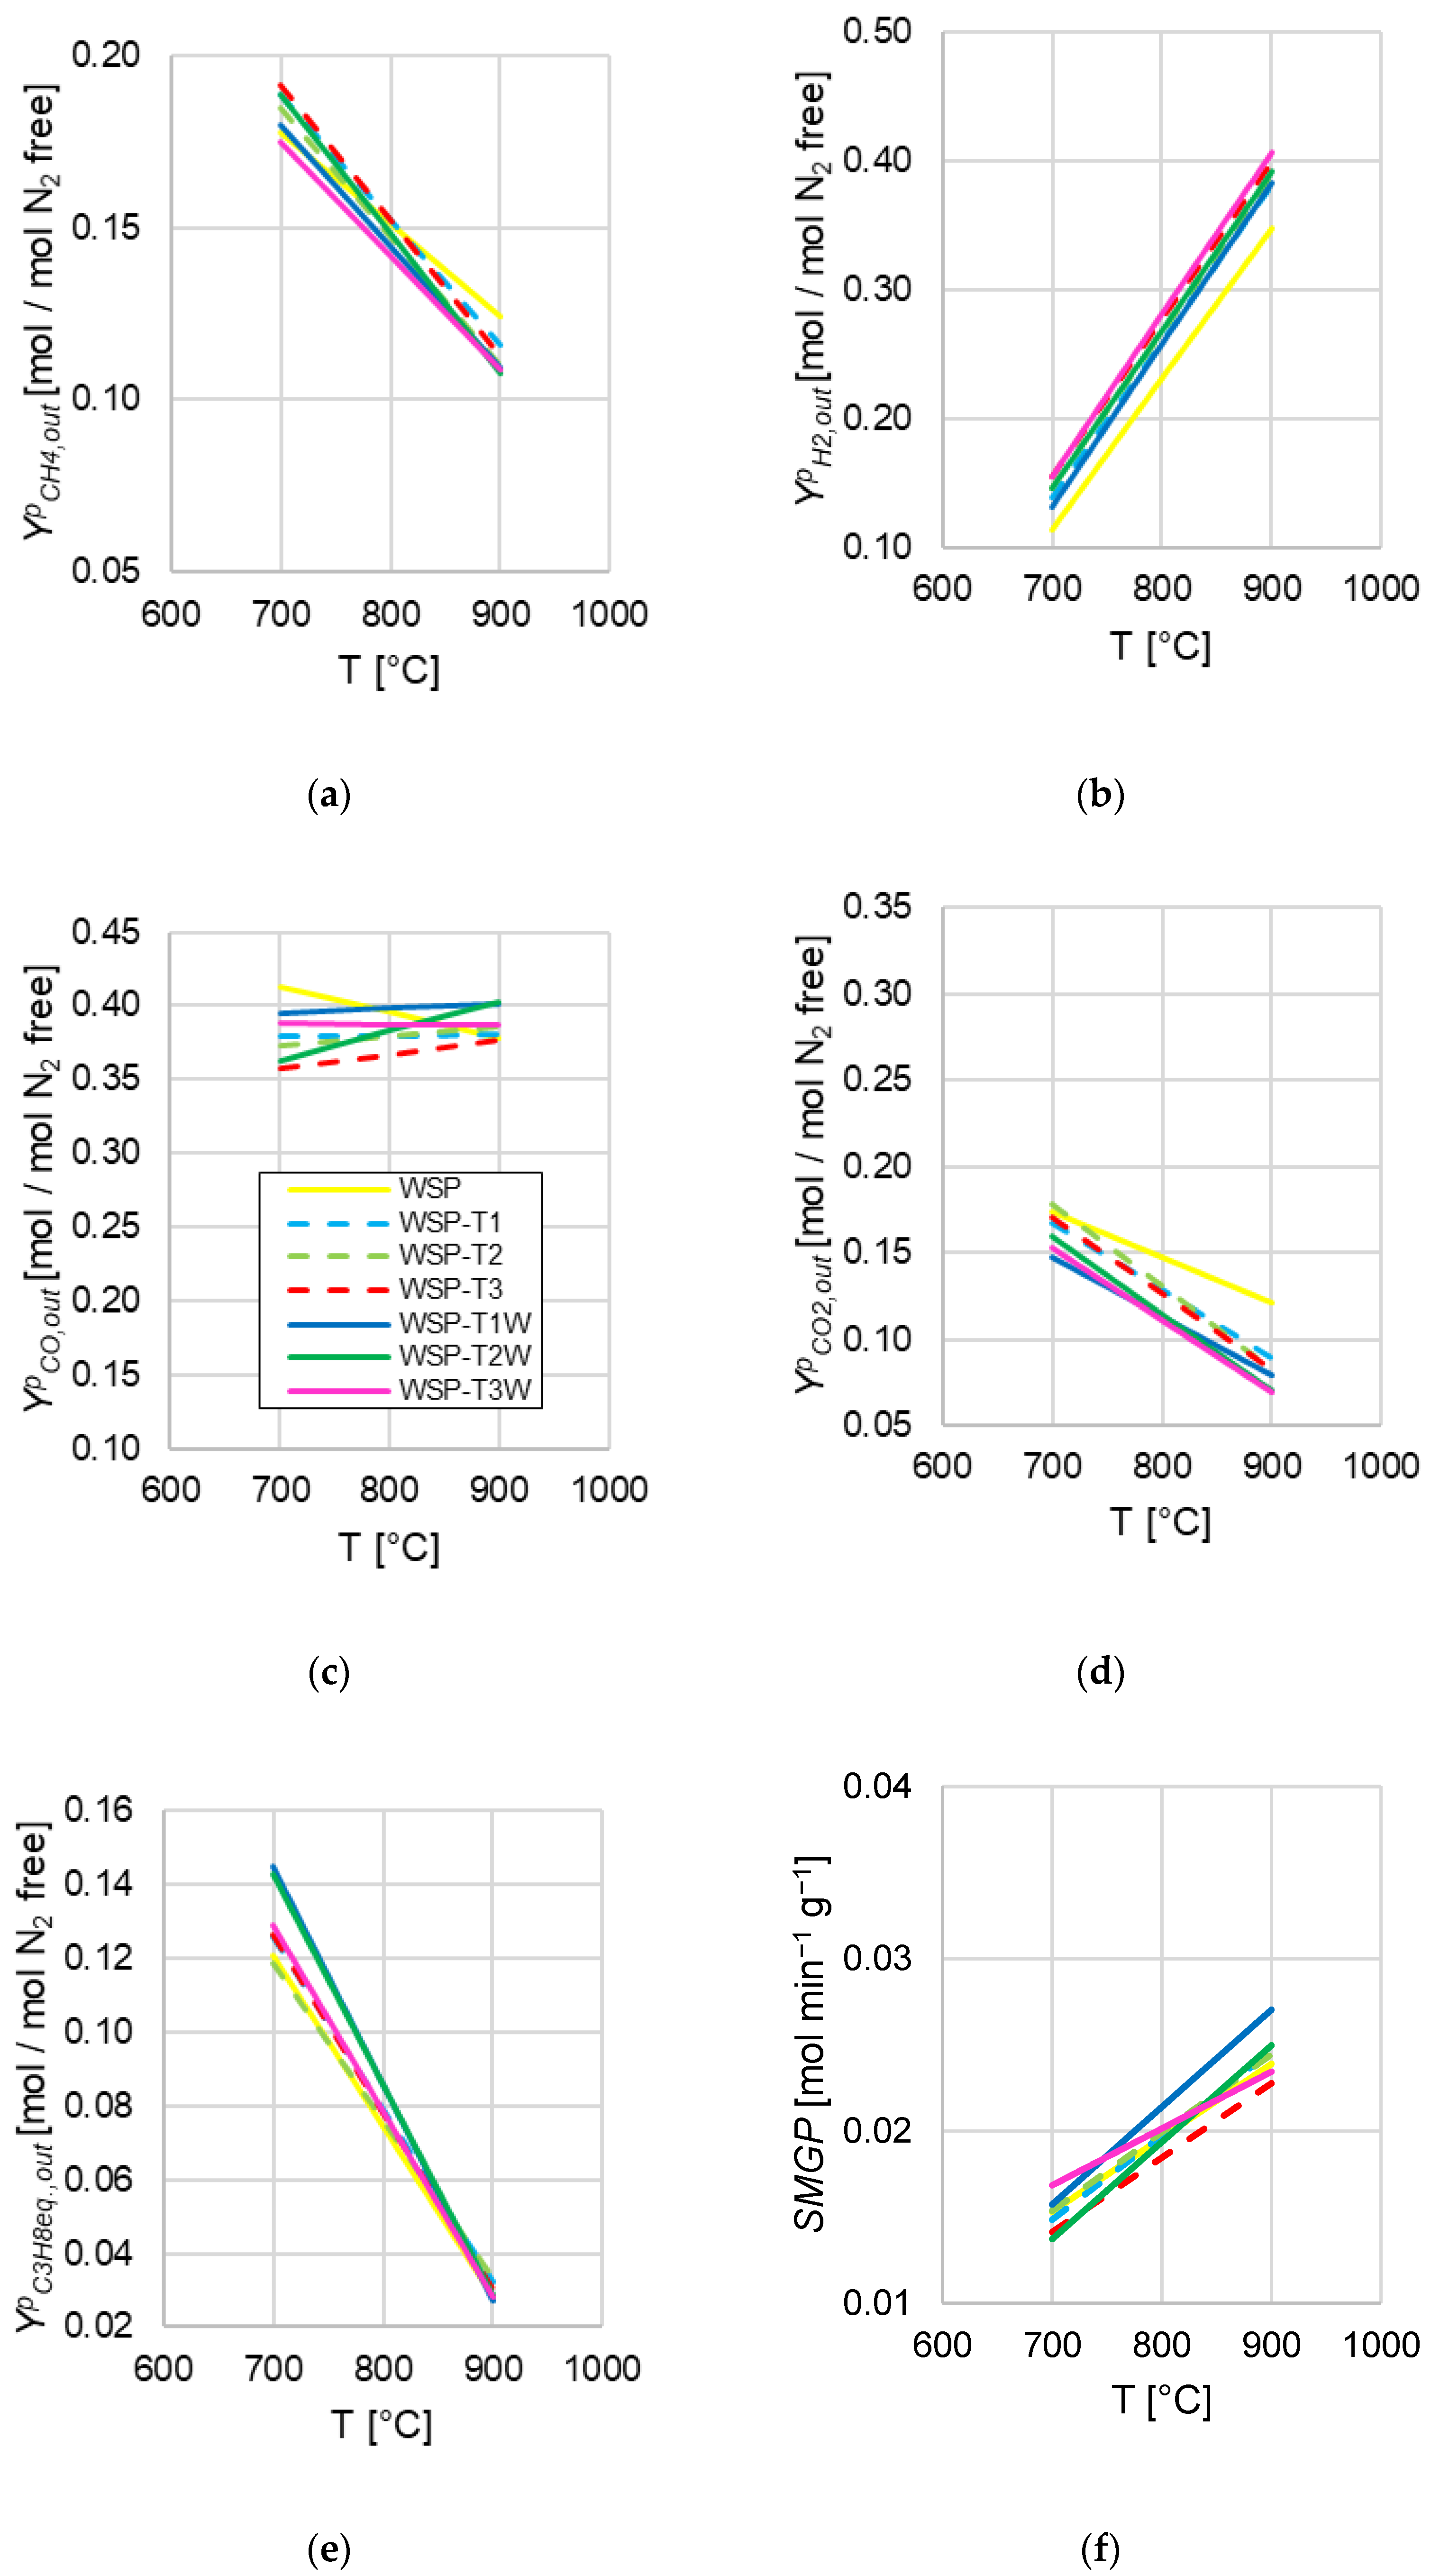
  • WSP appeared as less likely to release H2 (Figure 6b) and more likely to release CO2 (Figure 6d) than pretreated wheat straw pellets; this could be related to the results of Qing et al. [38], who experimentally found that carbonaceous gases (CO2 and CO) are more easily released than H2 during the preliminary torrefaction pretreatment;
  • With regard to CH4 release (Figure 6a), a significant differentiation between WSP and pretreated wheat straw pellets emerged at 900 °C, with Y C H 4 , o u t p of WSP resulting as the highest value at that temperature;
  • As to CO (Figure 6c), a poorer influence from devolatilization temperature emerged, also taking into account the distribution of the Y C O , o u t p experimental points which originated the regression lines (Figure 4);
  • As far as hydrocarbons are concerned (C3H8eq, Figure 6e), at 700 °C WSP-T1W and WSP-T2W showed the highest Y C 3 H 8   e q , o u t p , but at higher temperatures, the behavior of all biomasses became uniform;
  • When considering torrefied (WSP-T1, WSP-T2, WSP-T3) and torrefied-washed pellets (WSP-T1W, WSP-T2W, WSP-T3W) as two groups, they showed a slight behavioral difference in terms of CO2 peak release (Figure 6d); for all other gas components, when individually considered, clear effects ascribable to the specific pre-treatment or the variation of torrefaction temperature could not be inferred;
  • For each biomass, the H2/CO molar ratio related to peak analyses ( Y H 2 , o u t p / Y C O , o u t p ) was calculated as the ratio between the respective Y H 2 , o u t p and Y C O , o u t p straight lines in Figure 6b,c at a given temperature, obtaining the results summarized in Table 6; remarkably, a direct influence from torrefaction temperature emerged: the higher this parameter, the greater the H2/CO molar ratio related to peaks (with a negligible exception of the very close values of WSP-T2W and WSP-T3W at 700 °C), in fair agreement with evidences obtained by the analysis of integral-average quantities and the already cited literature evidence from Zhang et al. [36] (Section 4.1); in addition, relative percentage variation of H2/CO ratio related to peaks were calculated with WSP values as references ( Δ ( H 2 / C O ) p , Table 6), and WSP-T3 always exhibited the greatest variation at each temperature, with the absolutely most pronounced at 700 °C.
Figure 5 and Table 5 summarize the results from the regression data analysis regarding the SMGP parameter (Equation (6)).
Figure 3b and Figure 5 suggest that the predominant effect on SMGP derives from the increase of the devolatilization temperature: for all the biomasses, SMGP increased as the devolatilization temperature was increased, in agreement with the integral average gas yield (ηav, Equation (1), Figure 2a). This corroborates the reliability of both analysis methods.
Overall, by comparing SMGP lines in Figure 6f, substantial differences did not emerge in relation to pretreatments.

5. Conclusions

In this work, devolatilization tests of untreated and pretreated wheat straw pellets were carried out at three temperature levels (700, 800, and 900 °C), in a fluidized bed made up of sand.
Integral-average gas yield, H2/CO molar ratio, and carbon conversion were determined from gas release data obtained by devolatilizations of individual pellets. Whatever the considered biomass, all these parameters increased as the temperature was increased, with a general improvement in syngas quality and productivity. Concerning the specific pretreatments:
  • No evident influences on the integral-average gas yield emerged;
  • All pretreated wheat straw pellets showed integral-average H2/CO molar ratios higher than those of untreated wheat straw: the highest value was recorded for wheat straw pellet torrefied at 270 °C (the highest explored devolatilization temperature);
  • Integral-average carbon conversion of untreated wheat straw pellets was significantly higher that of pretreated pellets;
  • The washing pretreatment after torrefaction did not produce significant improvements in term of integral-average gas yield, H2/CO molar ratio, and carbon conversion, when compared to only-torrefied ones.
Because of the intrinsically unsteady-state of devolatilizations (performed for individual pellets), a new analysis method of devolatilization data was proposed, focused on the peak in the experimental curves of released flow rates of syngas components (CO, CO2, H2, CH4, and hydrocarbons as C3H8,eq.). Trends of syngas compositions as functions of devolatilization temperature were obtained by regressions with straight lines. Similarly, trends regarding the parameter “specific maximum gas production” were also obtained. As to fractions of gas species, the regressed trends offered some further information, which were not inferred from the previous integral-average analysis:
  • The higher the devolatilization temperature, the greater the H2 fraction in the syngas, at the expenses of CO2, CH4, and hydrocarbons;
  • All pretreatments improved the H2/CO molar ratio related to peaks, in comparison to the same ratio obtained from untreated wheat straw;
  • A direct influence from torrefaction temperature emerged on H2/CO molar ratio related to peaks, corroborating the less clear indication obtained by the integral average analyses.
Observations from the two kinds of analysis were in fair agreement with literature.
The integral average estimations and the regression peak analysis both appeared as general and straightforward methods to investigate the thermochemical behavior of biomasses, as well as the influences from operating conditions and biomass nature. Together with the experimental procedure of devolatilization of a few pellets, they constitute a faster and simpler procedure to select the more promising biomasses and operating conditions during a preliminary screening phase, in comparison to a more complex and time-demanding experimental campaign based on a continuous gasification process.
An additional outcome of this work is the provision of elaborated experimental data for further studies with modeling purposes, which also allow careful extrapolation (out of the experimentally explored temperature range) by means of linear regressed trends.
As a general remark, the torrefaction pretreatment brings in several advantages (e.g., grindability, pelletability, storability, increased heating value, higher H2/CO molar ratio in devolatilized syngas), while the related operational costs may be limited—thanks to the low required temperatures—and easily compensated via heat recoveries in the intensified industrial configuration of a CLG plant.

Author Contributions

Conceptualization, A.D.G. and K.G.; methodology, A.D.G. and K.G.; software, S.L. and A.D.G.; validation, A.D.G. and K.G.; formal analysis, A.D.G. and K.G.; investigation, S.L., A.D.G. and K.G.; resources, K.G.; data curation, S.L., A.D.G. and K.G.; writing—original draft preparation, S.L.; writing—review and editing, S.L., A.D.G. and K.G.; visualization, S.L. and A.D.G.; supervision, A.D.G. and K.G.; project administration, K.G.; funding acquisition, K.G. All authors have read and agreed to the published version of the manuscript.

Funding

This research and the APC were funded by the Horizon 2020 Framework program of the European Union, CLARA project, G.A. 817841.

Data Availability Statement

The data presented in this study are available on request from the corresponding author.

Acknowledgments

The production and characterization of biomass pellets by the research team of National Renewable Energy Centre of Spain (CENER) is acknowledged, occurred within the CLARA project. The authors warmly thank Giampaolo Antonelli for his technical support.

Conflicts of Interest

The authors declare no conflict of interest. The funders had no role in the design of the study; in the collection, analyses, or interpretation of data; in the writing of the manuscript, or in the decision to publish the results.

References

  1. EUR-Lex—32018L2001—EN—EUR-Lex. Available online: https://eur-lex.europa.eu/legal-content/en/TXT/?uri=CELEX:32018L2001 (accessed on 7 November 2020).
  2. Molino, A.; Larocca, V.; Chianese, S.; Musmarra, D. Biofuels production by biomass gasification: A review. Energies 2018, 11, 811. [Google Scholar] [CrossRef] [Green Version]
  3. Naik, S.N.; Goud, V.V.; Rout, P.K.; Dalai, A.K. Production of first and second generation biofuels: A comprehensive review. Renew. Sustain. Energy Rev. 2010, 14, 578–597. [Google Scholar] [CrossRef]
  4. Amaro, J.; Rosado, D.J.M.; Mendiburu, A.Z.; dos Santos, L.R.; de Carvalho, J.A. Modeling of syngas composition obtained from fixed bed gasifiers using Kuhn–Tucker multipliers. Fuel 2021, 287, 119068. [Google Scholar] [CrossRef]
  5. Dieringer, P.; Marx, F.; Alobaid, F.; Ströhle, J.; Epple, B. Process control strategies in chemical looping gasification-A novel process for the production of biofuels allowing for net negative CO2 emissions. Appl. Sci. 2020, 10, 4271. [Google Scholar] [CrossRef]
  6. Heidenreich, S.; Foscolo, P.U. New concepts in biomass gasification. Prog. Energy Combust. Sci. 2015, 46, 72–95. [Google Scholar] [CrossRef]
  7. Mattison, T.; Hildor, F.; Li, Y.; Linderholm, C. Negative emissions of carbon dioxide through chemical-looping combustion (CLC) and gasification (CLG) using oxygen carriers based on manganese and iron. Mitig. Adapt. Strateg. Glob. Chang. 2020, 25, 497–517. [Google Scholar] [CrossRef] [Green Version]
  8. Mendiara, T.; García-Labiano, F.; Abad, A.; Gayán, P.; de Diego, L.F.; Izquierdo, M.T.; Adánez, J. Negative CO2 emissions through the use of biofuels in chemical looping technology: A review. Appl. Energy 2018, 232, 657–684. [Google Scholar] [CrossRef]
  9. Mohamed, U.; Zhao, Y.; Yi, Q.; Shi, L.; Wei, G.; Nimmo, W. Evaluation of life cycle energy, economy and CO2 emissions for biomass chemical looping gasification to power generation. Renew. Energy 2021. [Google Scholar] [CrossRef]
  10. Di Giuliano, A.; Lucantonio, S.; Gallucci, K. Devolatilization of residual biomasses for chemical looping gasification in fluidized beds made up of oxygen-carriers. Energies 2021, 14, 311. [Google Scholar] [CrossRef]
  11. CLARA—Chemical Looping Gasification for Sustainable Production of Biofuels. Available online: https://clara-h2020.eu/ (accessed on 26 May 2021).
  12. Faba, L.; Díaz, E.; Ordóñez, S. Recent developments on the catalytic technologies for the transformation of biomass into biofuels: A patent survey. Renew. Sustain. Energy Rev. 2015, 51, 273–287. [Google Scholar] [CrossRef]
  13. The Concept: From Biomass to Biofuel—CLARA. Available online: https://clara-h2020.eu/the-concept/ (accessed on 17 October 2020).
  14. Marx, F.; Dieringer, P.; Ströhle, J.; Epple, B. Design of a 1 MWth pilot plant for chemical looping gasification of biogenic residues. Energies 2021, 14, 2581. [Google Scholar] [CrossRef]
  15. Di Giuliano, A.; Funcia, I.; Pérez-Vega, R.; Gil, J.; Gallucci, K. Novel application of pretreatment and diagnostic method using dynamic pressure fluctuations to resolve and detect issues related to biogenic residue ash in chemical looping gasification. Processes 2020, 8, 1137. [Google Scholar] [CrossRef]
  16. Biomass Pre-Treatment—CLARA. Available online: https://clara-h2020.eu/biomass-pre-treatment/ (accessed on 9 November 2020).
  17. Dieringer, P.; Funcia, I.; Soleimani, A.; Liese, T. Public Report II. Available online: https://clara-h2020.eu/wp-content/uploads/2020/11/CLARA_PublicReport2.pdf (accessed on 26 May 2021).
  18. Tumuluru, J.S.; Sokhansanj, S.; Hess, J.R.; Wright, C.T.; Boardman, R.D. A review on biomass torrefaction process and product properties for energy applications. Ind. Biotechnol. 2011, 7, 384–401. [Google Scholar] [CrossRef] [Green Version]
  19. Ru, B.; Wang, S.; Dai, G.; Zhang, L. Effect of torrefaction on biomass physicochemical characteristics and the resulting pyrolysis behavior. Energy Fuels 2015, 29, 5865–5874. [Google Scholar] [CrossRef]
  20. Stelte, W.; Nielsen, N.P.K.; Hansen, H.O.; Dahl, J.; Shang, L.; Sanadi, A.R. Reprint of: Pelletizing properties of torrefied wheat straw. Biomass Bioenergy 2013, 53, 105–112. [Google Scholar] [CrossRef]
  21. Cen, K.; Zhang, J.; Ma, Z.; Chen, D.; Zhou, J.; Ma, H. Investigation of the relevance between biomass pyrolysis polygeneration and washing pretreatment under different severities: Water, dilute acid solution and aqueous phase bio-oil. Bioresour. Technol. 2019, 278, 26–33. [Google Scholar] [CrossRef] [PubMed]
  22. Jand, N.; Foscolo, P.U. Decomposition of wood particles in fluidized beds. Ind. Eng. Chem. Res. 2005, 44, 5079–5089. [Google Scholar] [CrossRef]
  23. Malsegna, B.; Di Giuliano, A.; Gallucci, K. Experimental study of absorbent hygiene product devolatilization in a bubbling fluidized bed. Energies 2021, 14, 2399. [Google Scholar] [CrossRef]
  24. Shadle, L. F luidized B ed C hemical L ooping. Available online: https://clara-h2020.eu/deliverables/ (accessed on 26 May 2021).
  25. Unidad de Pretratamiento—Cener BIO2C. Available online: https://www.bio2c.es/es/unidad-de-pretratamiento/ (accessed on 11 May 2021).
  26. Gibilaro, L.G. Fluidization-Dynamics; Butterworth-Heinemann: Oxford, UK; Woburn, MA, USA, 2001. [Google Scholar]
  27. Yang, W.-C. Handbook of Fluidization and Fluid-Particle Systems; Marcel Dekker: New York, NY, USA, 2003; ISBN 082470259X. [Google Scholar]
  28. Grace, J.R. Fluidized bed hydrodynamics. In Handbook of Multiphase Systems; Hemisphere Publishing Corp.: London, UK, 1982; pp. 6–8. [Google Scholar]
  29. Werther, J.; Ogada, T.; Borodulya, V.A.; Dikalenko, V.I. Devolatilisation and combustion characteristics of sewage sludge in a bubbling fluidized bed furnace. In The Institute of Energy’s Second International Conference on Combustion & Emissions Control; Elsevier: Amsterdam, The Netherlands, 1995; pp. 149–158. [Google Scholar]
  30. Zeng, X.; Wang, Y.; Yu, J.; Wu, S.; Zhong, M.; Xu, S.; Xu, G. Coal pyrolysis in a fluidized bed for adapting to a two-stage gasification process. Energy Fuels 2011, 25, 1092–1098. [Google Scholar] [CrossRef]
  31. Condori, O.; García-Labiano, F.; de Diego, L.F.; Izquierdo, M.T.; Abad, A.; Adánez, J. Biomass chemical looping gasification for syngas production using ilmenite as oxygen carrier in a 1.5 kWth unit. Chem. Eng. J. 2021, 405, 126679. [Google Scholar] [CrossRef]
  32. Wang, S.; Song, T.; Yin, S.; Hartge, E.U.; Dymala, T.; Shen, L.; Heinrich, S.; Werther, J. Syngas, tar and char behavior in chemical looping gasification of sawdust pellet in fluidized bed. Fuel 2020, 270, 117464. [Google Scholar] [CrossRef]
  33. Fan, Y.; Tippayawong, N.; Wei, G.; Huang, Z.; Zhao, K.; Jiang, L.; Zheng, A.; Zhao, Z.; Li, H. Minimizing tar formation whilst enhancing syngas production by integrating biomass torrefaction pretreatment with chemical looping gasification. Appl. Energy 2020, 260, 114315. [Google Scholar] [CrossRef]
  34. Niu, Y.; Lv, Y.; Lei, Y.; Liu, S.; Liang, Y.; Wang, D.; Hui, S. Biomass torrefaction: Properties, applications, challenges, and economy. Renew. Sustain. Energy Rev. 2019, 115, 109395. [Google Scholar] [CrossRef]
  35. Medic, D.; Darr, M.; Shah, A.; Potter, B.; Zimmerman, J. Effects of torrefaction process parameters on biomass feedstock upgrading. Fuel 2012, 91, 147–154. [Google Scholar] [CrossRef]
  36. Zhang, R.; Zhang, J.; Guo, W.; Wu, Z.; Wang, Z.; Yang, B. Effect of torrefaction pretreatment on biomass chemical looping gasification (BCLG) characteristics: Gaseous products distribution and kinetic analysis. Energy Convers. Manag. 2021. [Google Scholar] [CrossRef]
  37. Chen, D.; Mei, J.; Li, H.; Li, Y.; Lu, M.; Ma, T.; Ma, Z. Combined pretreatment with torrefaction and washing using torrefaction liquid products to yield upgraded biomass and pyrolysis products. Bioresour. Technol. 2017, 228, 62–68. [Google Scholar] [CrossRef] [PubMed]
  38. Chen, Q.; Zhou, J.; Liu, B.; Mei, Q.; Luo, Z. Influence of torrefaction pretreatment on biomass gasification technology. Chin. Sci. Bull. 2011, 56, 1449–1456. [Google Scholar] [CrossRef] [Green Version]
Figure 1. Example of H2, CO, CO2, CH4, and C3H8,eq. outlet molar flow rates (Fi,out) as functions of time, produced by devolatilizations in the sand fluidized bed of (a) WSP at 800 °C; (b) WSP-T1 at 900 °C. WSP data adapted from [10].
Applsci 11 05722 g001
Figure 2. Experimental results of devolatilization tests for all kind of pellets, as functions of temperature (700, 800, and 900°C): (a) integral average gas yield (ηav, Equation (1)); (b) integral average H2/CO molar ratio (λav, Equation (2)); (c) integral average carbon conversion (χcav, Equation (3)); WSP data adapted from [10].
Applsci 11 05722 g002
Figure 3. Experimental results from devolatilization peaks for WSP pellets as functions of temperature (points), with regression straight lines (dotted): (a) molar fractions on N2 free-basis of produced gases at devolatilization peaks ( Y i , o u t p Equation (5)); (b) SMGP (Equation (6)).
Applsci 11 05722 g003
Figure 4. Experimental results from devolatilizations of torrefied and torrefied-washed pellets. Molar fractions on N2 free-basis of produced gases at devolatilization peaks ( Y i , o u t p , Equation (5)), as functions of temperature (points), with regression straight lines (dotted), for: (a) WSP-T1; (b) WSP-T1W; (c) WSP-T2; (d) WSP-T2W; (e) WSP-T3; and (f) WSP-T3W.
Applsci 11 05722 g004
Figure 5. Experimental results from devolatilizations of torrefied and torrefied-washed pellets. SMGP (Equation (6)) as a function of temperature (points), with regression straight lines (dotted), for: (a) WSP-T1; (b) WSP-T1W; (c) WSP-T2; (d) WSP-T2W; (e) WSP-T3; (f) WSP-T3W.
Applsci 11 05722 g005
Figure 6. Regression lines obtained from data at the top of devolatilization peaks, compared for investigated biomasses: (a) Y C H 4 , o u t p   (Equation (5)); (b) Y H 2 , o u t p   (Equation (5)); (c) Y C O , o u t p   (Equation (5)); (d) Y C O 2 , o u t p   (Equation (5)); (e) Y C 3 H 8 e q . , o u t p   (Equation (5)); (f) SMGP (Equation (6)); the legend in (c) is valid for the entire Figure.
Applsci 11 05722 g006
Table 1. Names of biomasses investigated in this work with specification of the related pretreatment.
Name of BiomassCharacteristic of the Pellet
WSPWheat Straw Pellet
WSP-T1Wheat Straw Pellet—Torrefied at T1 = 250 °C
WSP-T2Wheat Straw Pellet—Torrefied at T2 = 260 °C
WSP-T3Wheat Straw Pellet—Torrefied at T3 = 270 °C
WSP-T1WWheat Straw Pellet—Torrefied at T1 and Washed
WSP-T2WWheat Straw Pellet—Torrefied at T2 and Washed
WSP-T3WWheat Straw Pellet—Torrefied at T3 and Washed
Table 2. Physical and fluid-dynamic properties of sand, adapted from [10]: particles diameter (dp) and particle density (ρp); minimum fluidization velocity (umf) in N2 as a function of temperature (T), with the indication of the related generalized Geldart Group [26].
MaterialSand
dp (μm)212–250
ρp (kg m−3)2.6 × 10³
T  (°C)umf  (cm s−1)Generalized Geldart Group [27]
7002.4B
8004.4B
9002.9B
Table 3. Slopes (m, Equation (7)) and y-axis intercepts (q, Equation (7)) of the regression straight lines of Y i , o u t p   (Equation (5), i = H2, CO, CO2, CH4, and C3H8,eq.) and SMGP (Equation (6)), for WSP pellets.
Species of Gasm
[Mol Mol N2 Free−1 °C−1]
q
[Mol Mol N2 Free−1]
H21.170 × 10−3−7.050 × 10⁻¹
C3H8eq.−4.622× 10−44.440 × 10−1
CO−1.730 × 10−45.340 × 10−1
CO2−2.686 × 10⁻⁴ 3.622 × 10⁻¹
CH4−2.672 × 10−43.648 × 10−1
SMGPm
[mol min−1 g−1 °C−1]
q
[mol min−1 g−1]
4.293 × 10⁻¹−1.475 × 10⁻²
Table 4. Slopes (m, Equation (7)) and y-axis intercepts (q, Equation (7)) of the regression straight lines of Y i , o u t p (Equation (5), i = H2, CO, CO2, CH4, and C3H8,eq.) for torrefied and torrefied-washed pellets.
Type of BiomassSpecies of Gasm
(Mol Mol N2 Free−1 °C−1)
q
(Mol Mol N2 Free−1)
WSP-T1H21.213 × 10−3−7.106 × 10⁻¹
C3H8eq−4.654 × 10−44.514 × 10−1
CO8.298 × 10−63.733 × 10⁻¹
CO2−3.932 × 10−44.429 × 10−1
CH4−3.631 × 10−44.429 × 10−1
WSP-T2H21.217 × 10−3−7.064 × 10⁻¹
C3H8eq−4.272 × 10−44.177 × 10−1
CO6.025 × 10−53.311 × 10⁻¹
CO2−4.774 × 10−45.125 × 10−1
CH4−3.721 × 10−44.450 × 10−1
WSP-T3H21.221 × 10−3−6.999 × 10⁻¹
C3H8eq−4.802 × 10−44.624 × 10−1
CO9.178 × 10−52.936 × 10⁻¹
CO2−4.400 × 10−44.780 × 10−1
CH4−3.924 × 10−44.659 × 10−1
WSP-T1WH21.255 × 10−3−7.466 × 10⁻¹
C3H8eq−5.867 × 10−45.553 × 10−1
CO2.963 × 10−53.747 × 10⁻¹
CO2−3.447 × 10−43.892 × 10−1
CH4−3.535 × 10−44.274 × 10−1
WSP-T2WH21.224 × 10−3−7.107 × 10⁻¹
C3H8eq−5.705 × 10−45.420 × 10−1
CO1.980 × 10−42.247 × 10⁻¹
CO2−4.458 × 10−44.715 × 10−1
CH4−4.053 × 10−44.725 × 10−1
WSP-T3WH21.256 × 10−3−7.236 × 10⁻¹
C3H8eq−5.044 × 10−44.821 × 10−1
CO−3.523× 10−63.903 × 10−1
CO2−4.187 × 10−44.457 × 10−1
CH4−3.295 × 10−44.054 × 10−1
Table 5. Slopes (m, Equation (7)) and y-axis intercepts (q, Equation (7)) of the regression straight lines of SMGP (Equation (6)) for torrefied and torrefied-washed pellets.
Biomassm
[Mol Min−1 g−1 °C−1]
q
[Mol Min−1 g−1]
WSP-T14.882 × 10−5−1.933 × 10⁻²
WSP-T24.534 × 10−5−1.636 × 10⁻²
WSP-T34.312 × 10−5−1.605 × 10⁻²
WSP-T1W5.648 × 10−5−2.380 × 10⁻²
WSP-T2W5.618 × 10−5−2.560 × 10⁻²
WSP-T3W3.297 × 10−5−6.241 × 10⁻³
Table 6. Peak analyses at 700, 800, and 900 °C: H2/CO molar ratio related to peaks, obtained as the ratio between regression lines of Y H 2 , o u t p   and Y C O , o u t p   (Equation (7), m and q from Table 3 and Table 4) for each biomass; relative percentage variation of H2/CO ratio related to peaks, referred to WSP values Δ ( H 2 / C O ) p .
Biomass700 °C800 °C900 °C
Y H 2 , o u t p / Y C O , o u t p Δ ( H 2 / C O ) p Y H 2 , o u t p / Y C O , o u t p Δ ( H 2 / C O ) p Y H 2 , o u t p / Y C O , o u t p Δ ( H 2 / C O ) p
(molH2 molCO−1)(%)(molH2 molCO−1)(%)(molH2 molCO−1)(%)
WSP0.2800.5800.920
WSP-T10.37320.68171.009
WSP-T20.39410.70211.0110
WSP-T30.43570.75291.0615
WSP-T1W0.33210.65110.954
WSP-T2W0.40460.70200.975
WSP-T3W0.40450.73241.0514
Publisher’s Note: MDPI stays neutral with regard to jurisdictional claims in published maps and institutional affiliations.

