
Process Simulation of Steam Gasification of Torrefied Woodchips in a Bubbling Fluidized Bed Reactor Using Aspen Plus


Abstract
1. Introduction
2. Modeling Methods
2.1. Process Assumption
- The process is modeled in steady-state and isothermal conditions.
- The reactive gases are H2, CO, CO2, CH4, and H2O.
- N2, NH3, H2S, and SO2 are considered chemically inert components in gasification reactions.
- The char is modeled with only components of carbon black and ash.
- All gases are uniformly distributed within the emulsion phase.
- Particles are spherical and of uniform size. Their average diameter remains unchanged during the gasification.
- Char gasification starts in the dense zone and completes in the freeboard.
- Ash and sand are chemically inert under process conditions.
- There are two regions in the fluidized bed reaction: bed and freeboard.
- The bubbling regime is maintained in the bed region.
- The volumetric flow rate of gas increases along with the reactor height, corresponding to the gas products generated.
- The mixing of solid particles in the reactor is perfect.
- The reactor is divided into many control volumes with constant hydrodynamic parameters.
- The fluidized bed is one-dimensional.
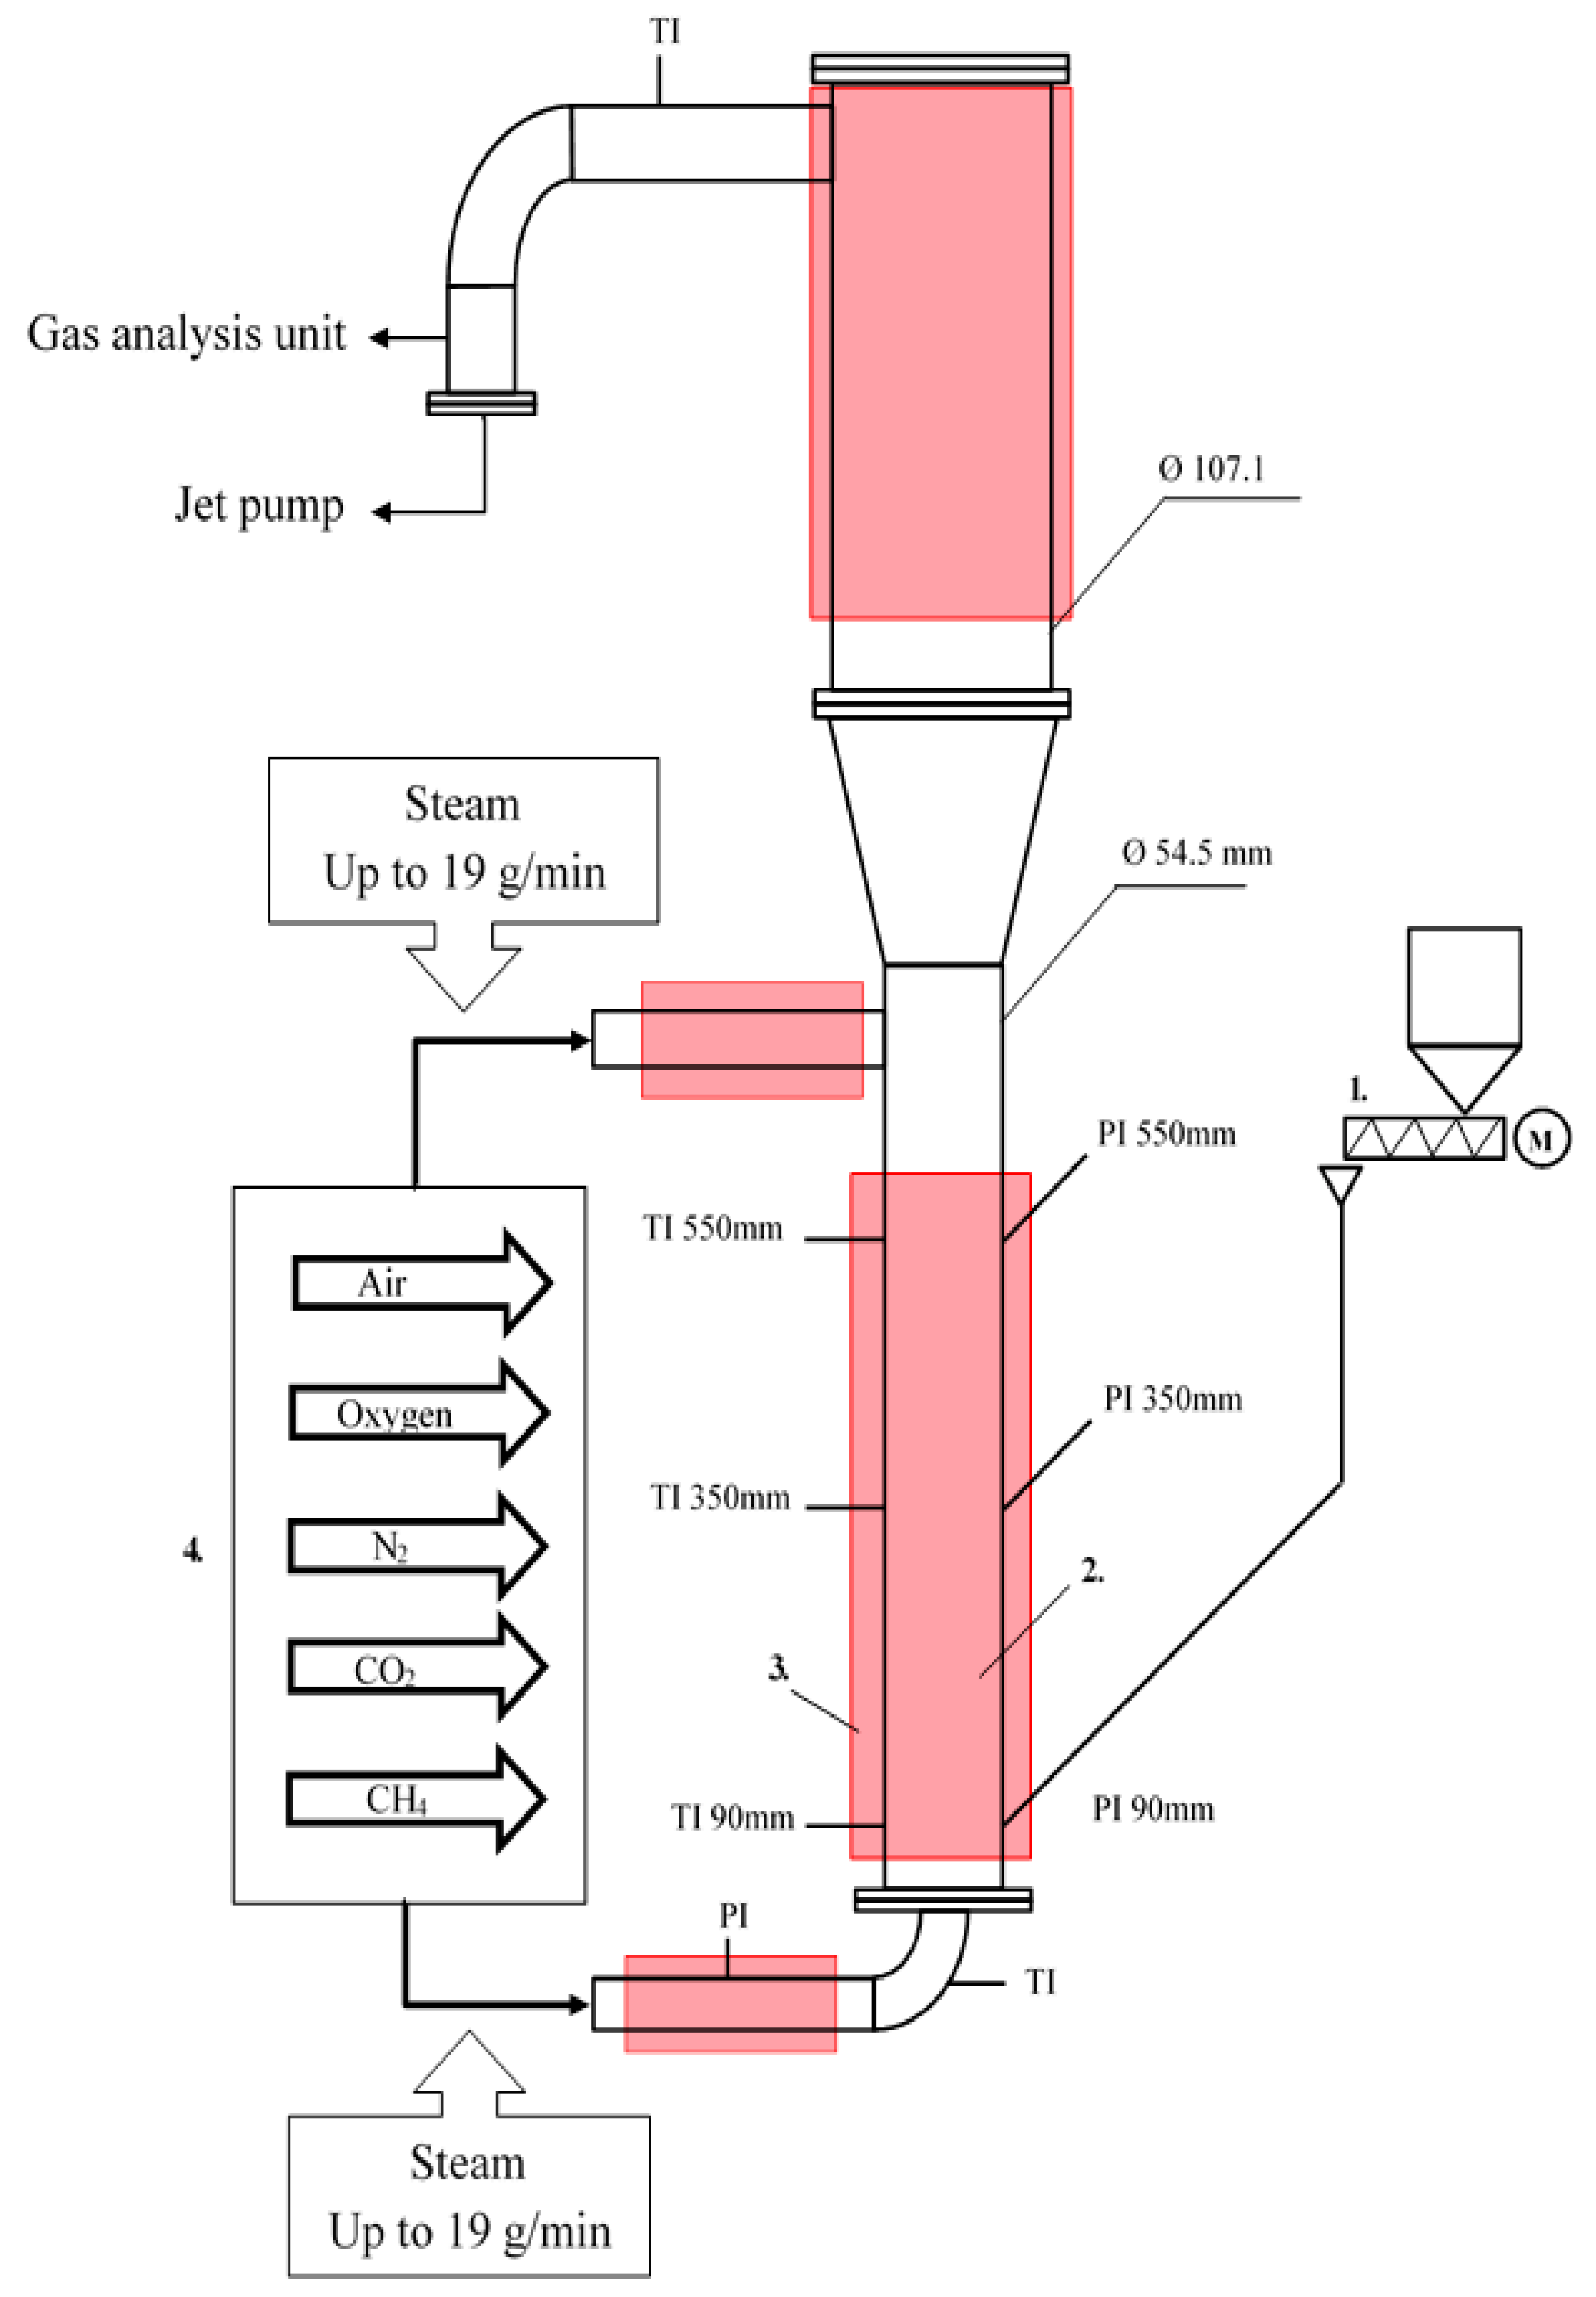
2.2. Experimental Facility
2.3. Reaction Kinetics
2.4. Hydrodynamic Calculation
2.4.1. Bed Hydrodynamic
2.4.2. Freeboard Dynamics
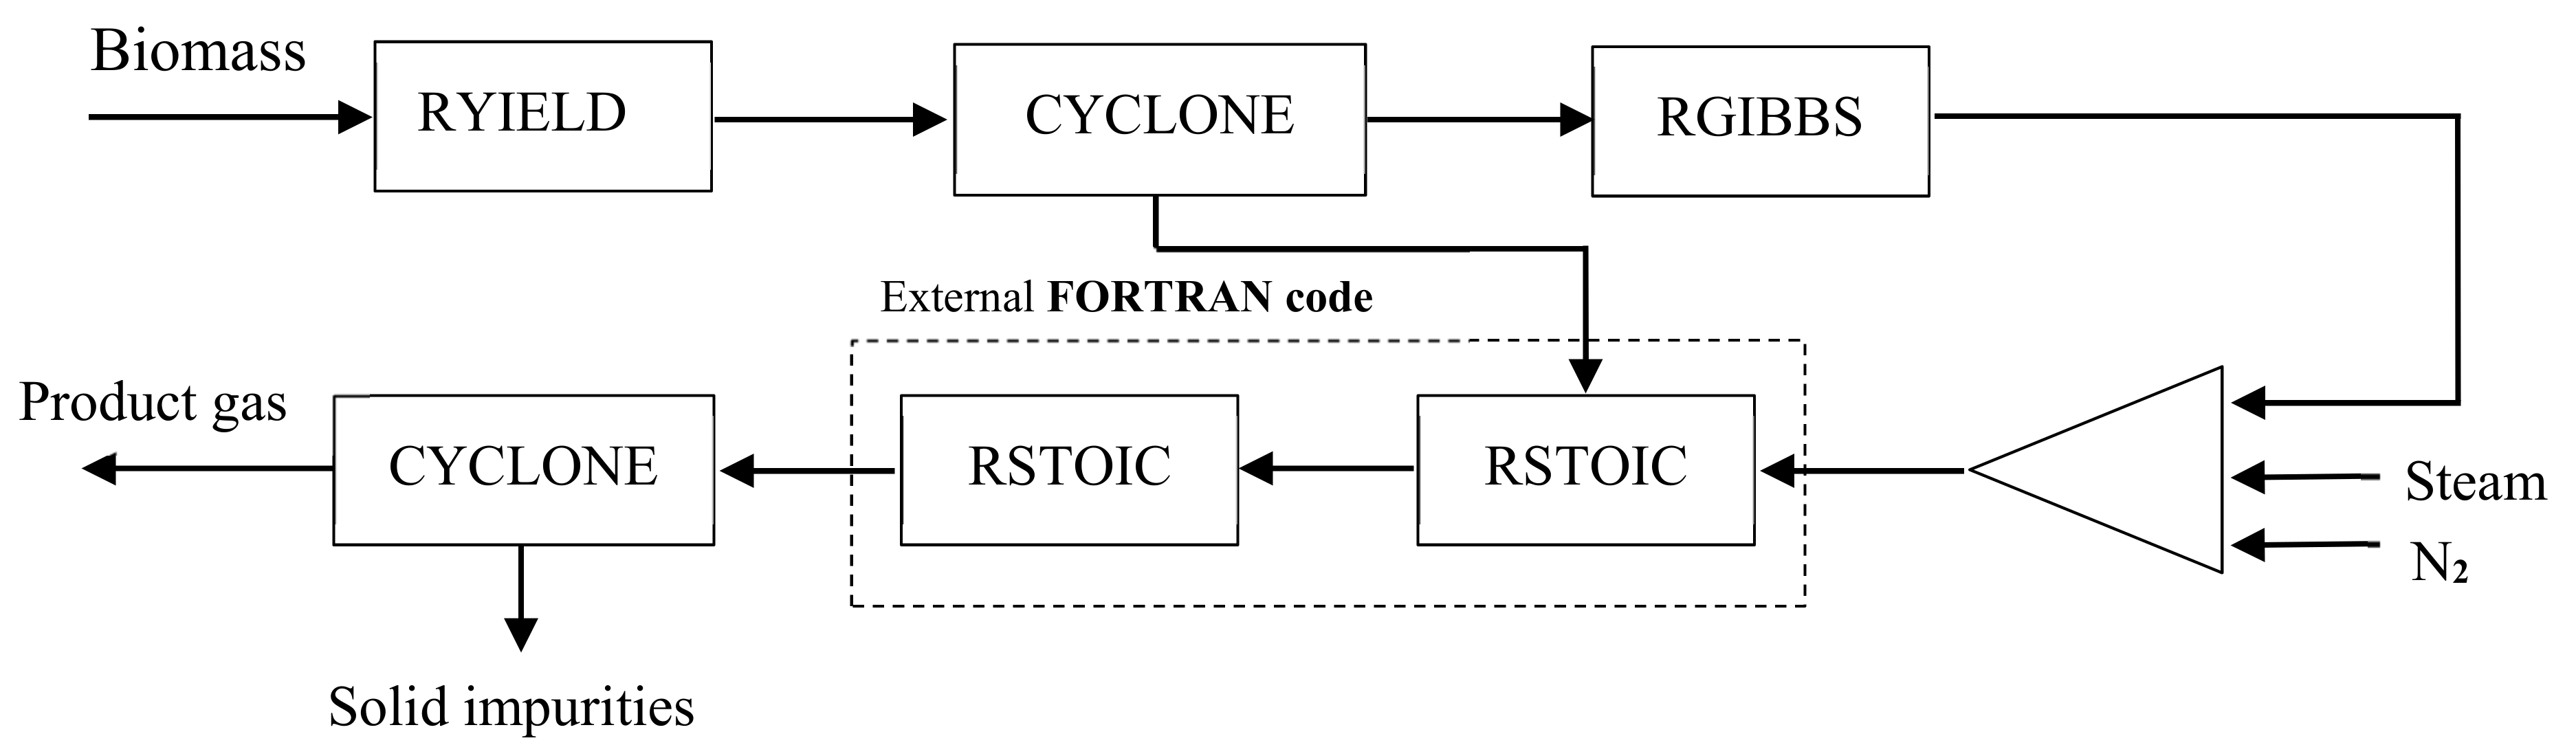
2.5. Aspen Plus Model
2.5.1. Biomass Characteristics
2.5.2. Biomass Decomposition
2.5.3. Char Gasification
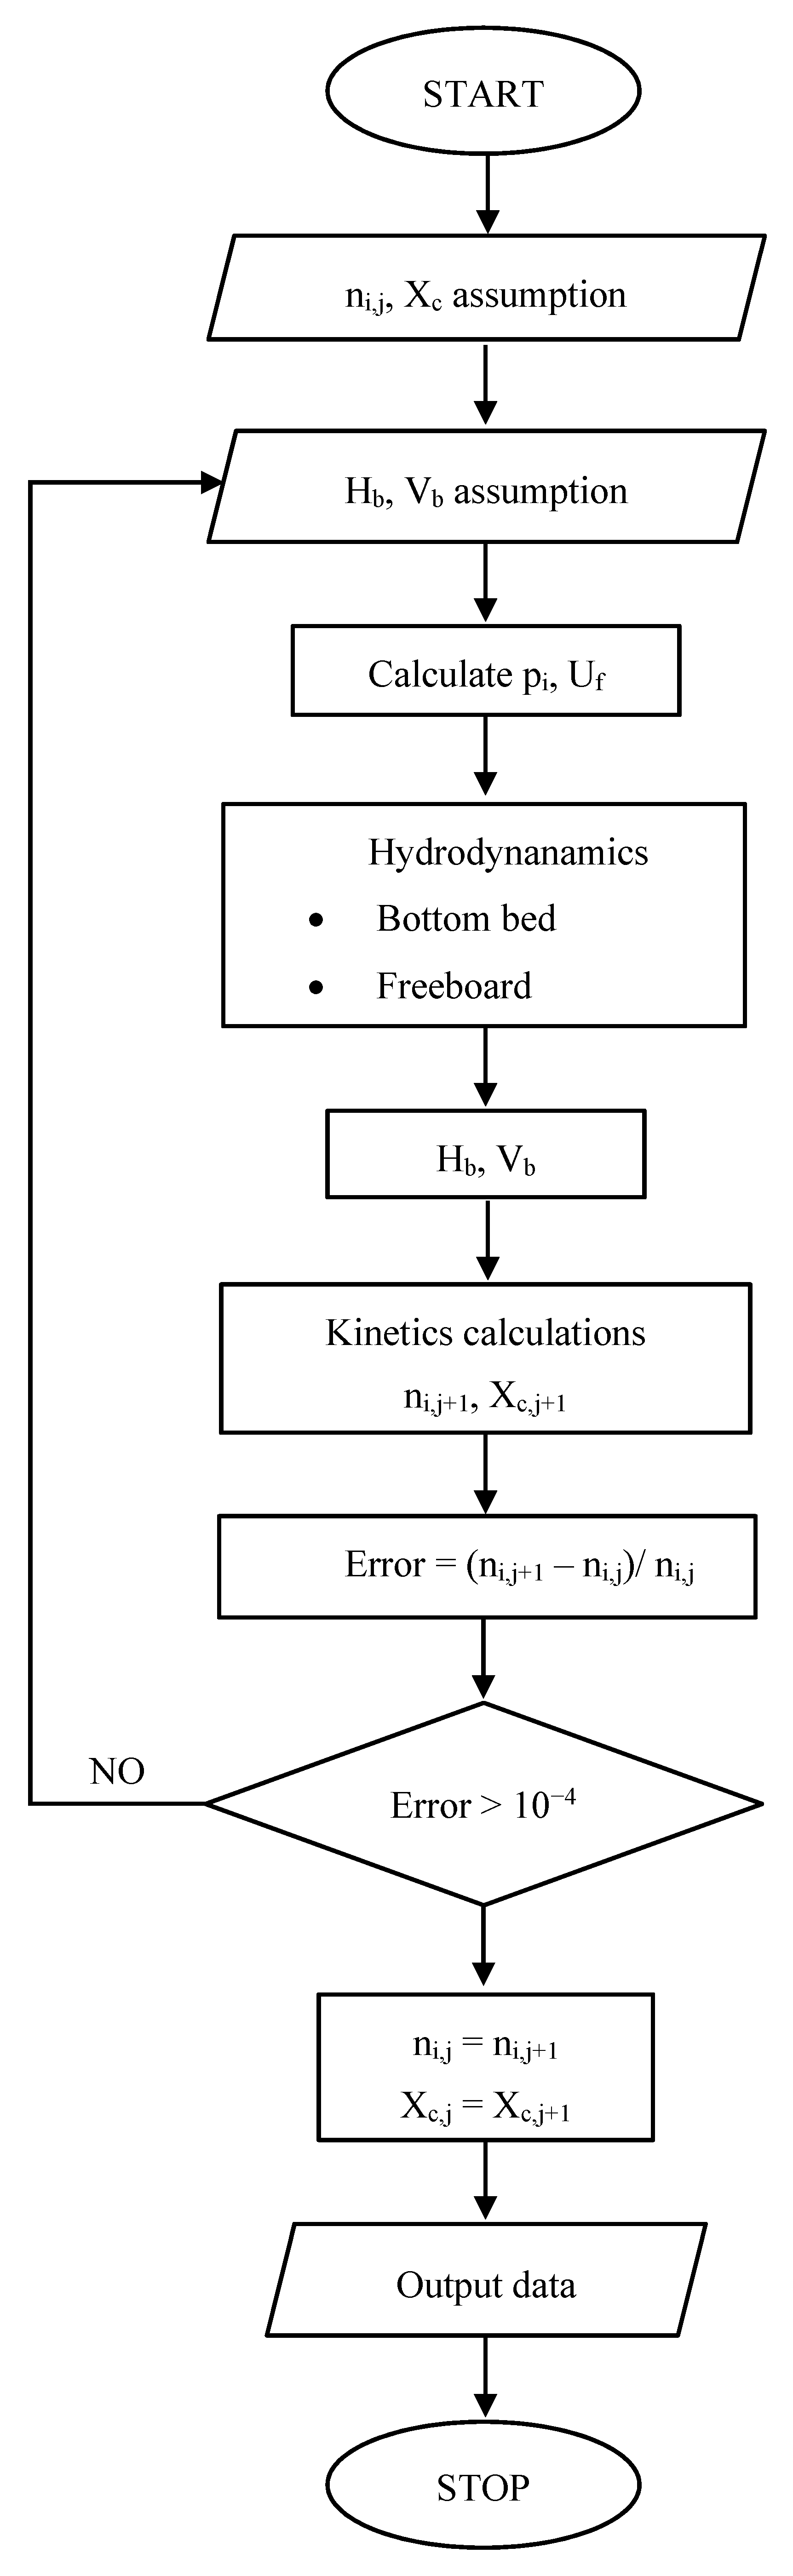
2.5.4. Calculation Procedure
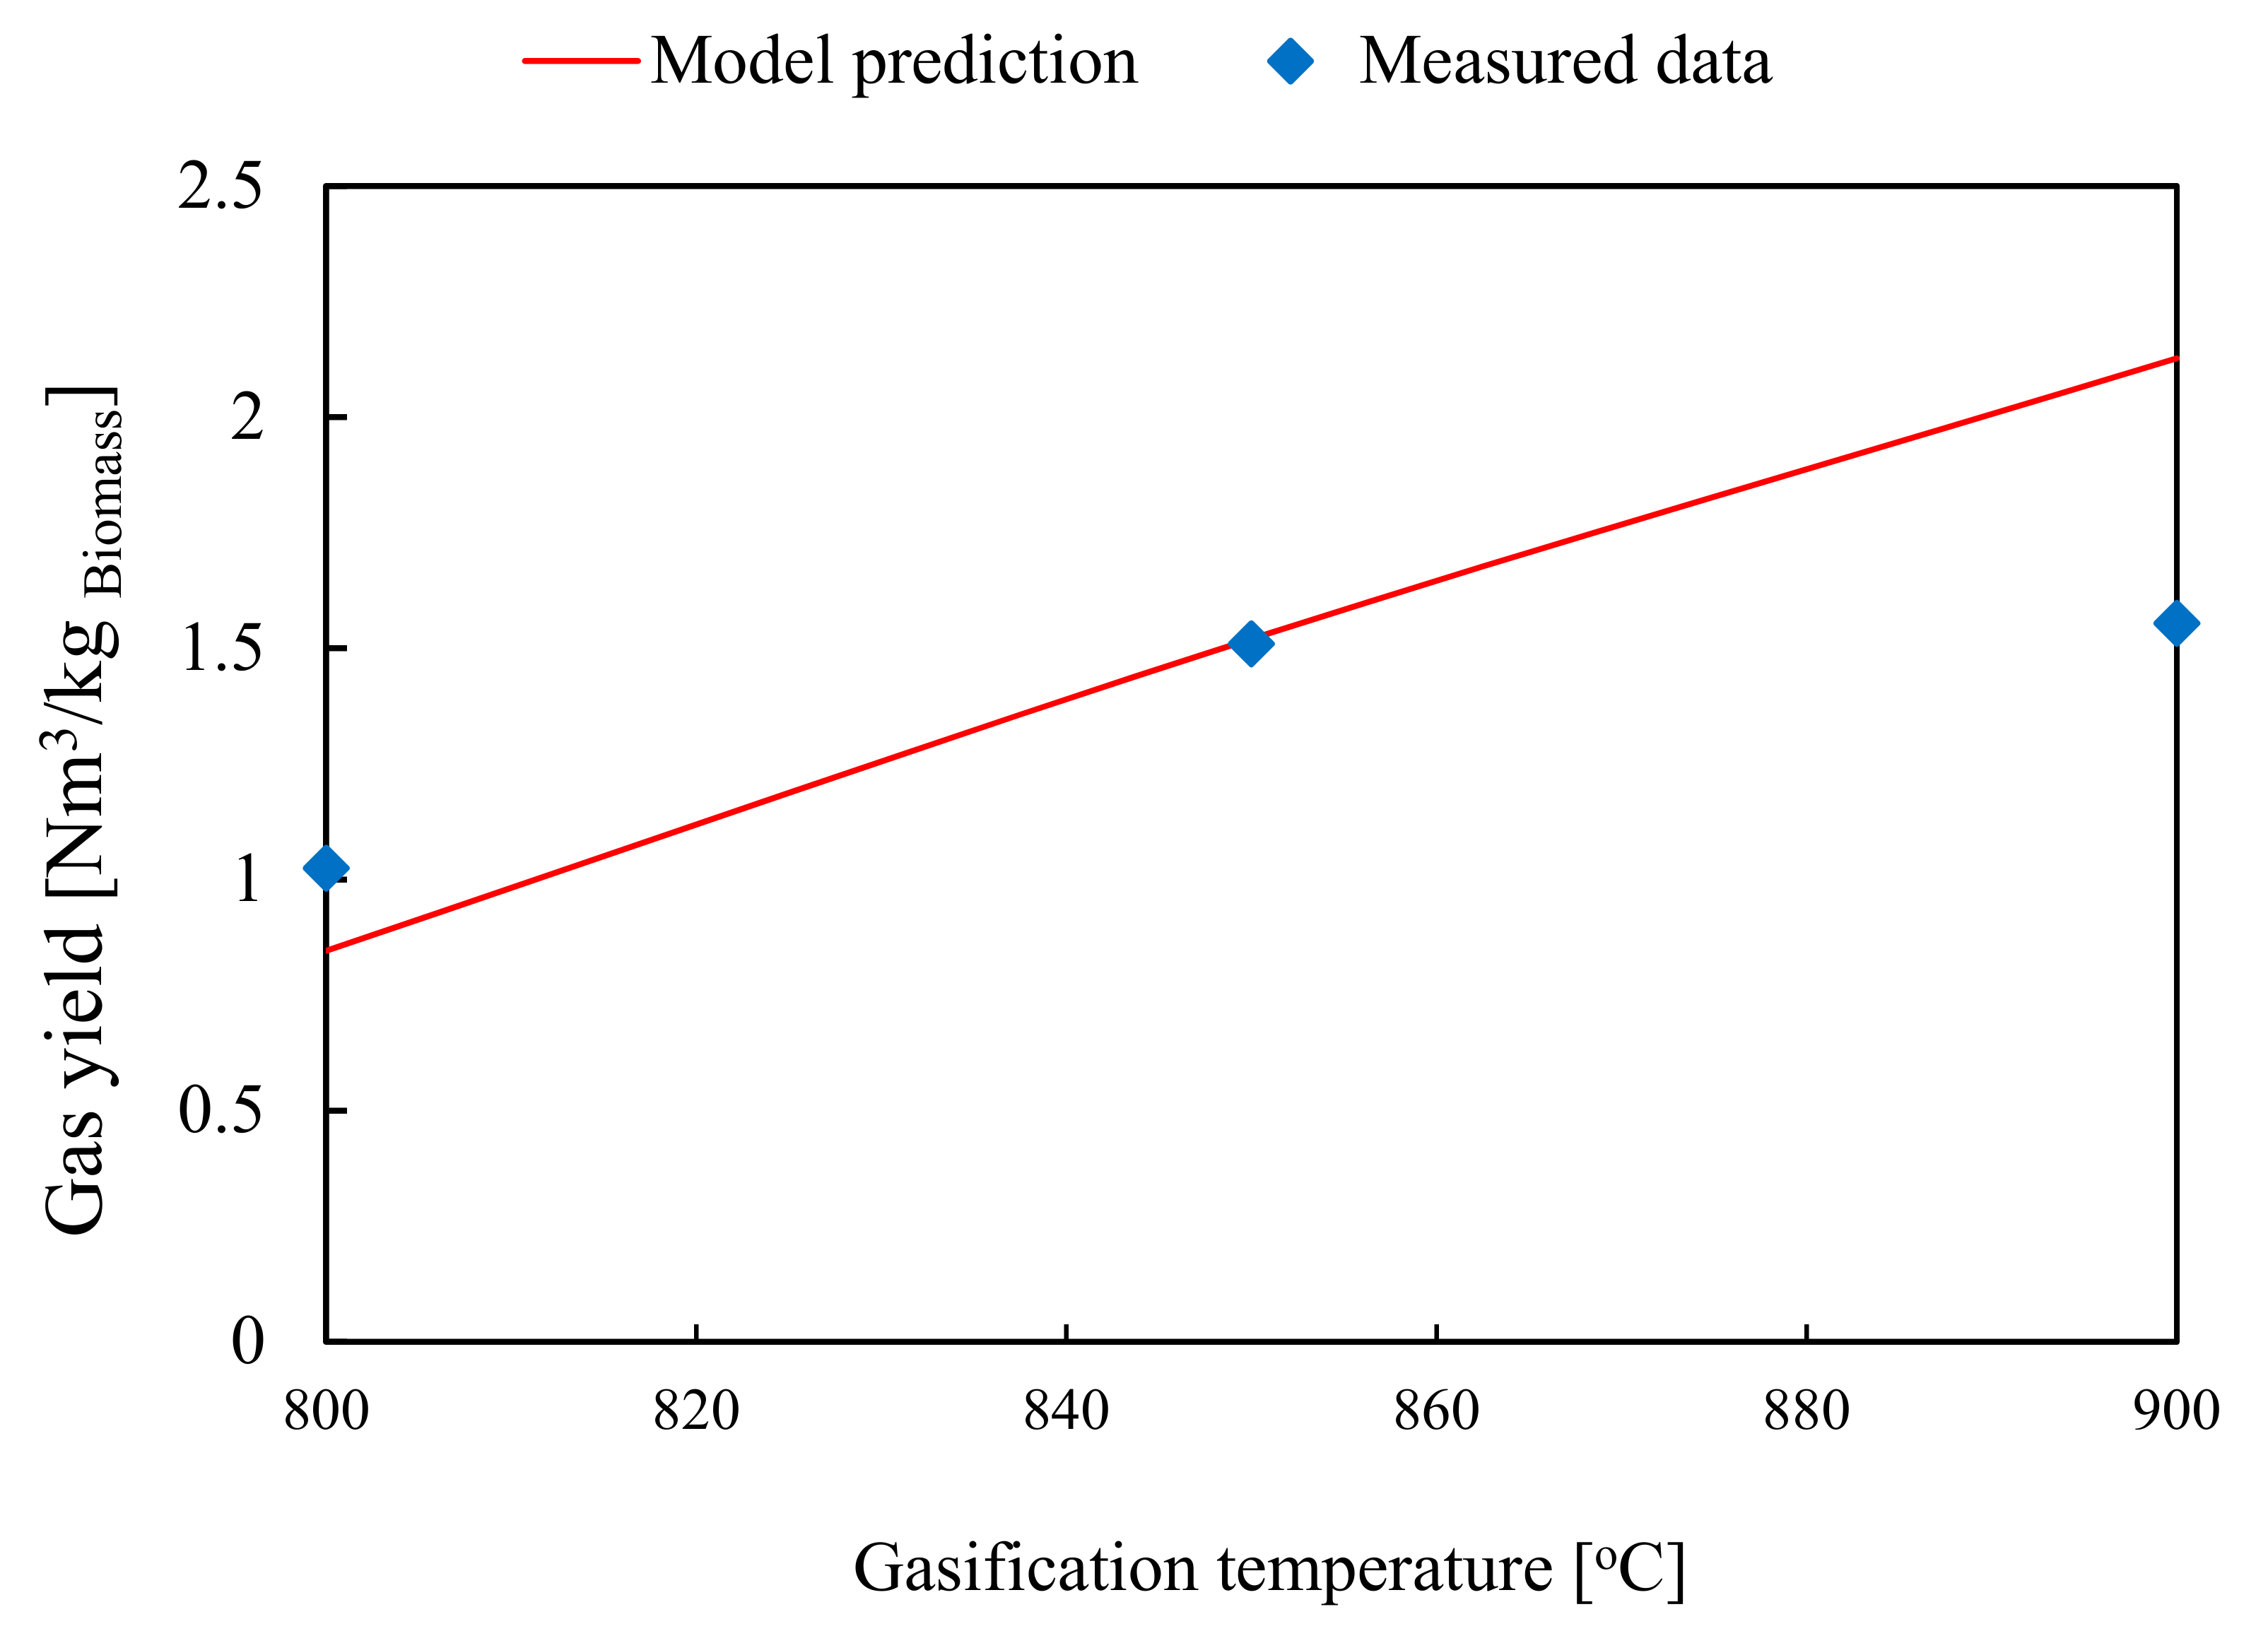
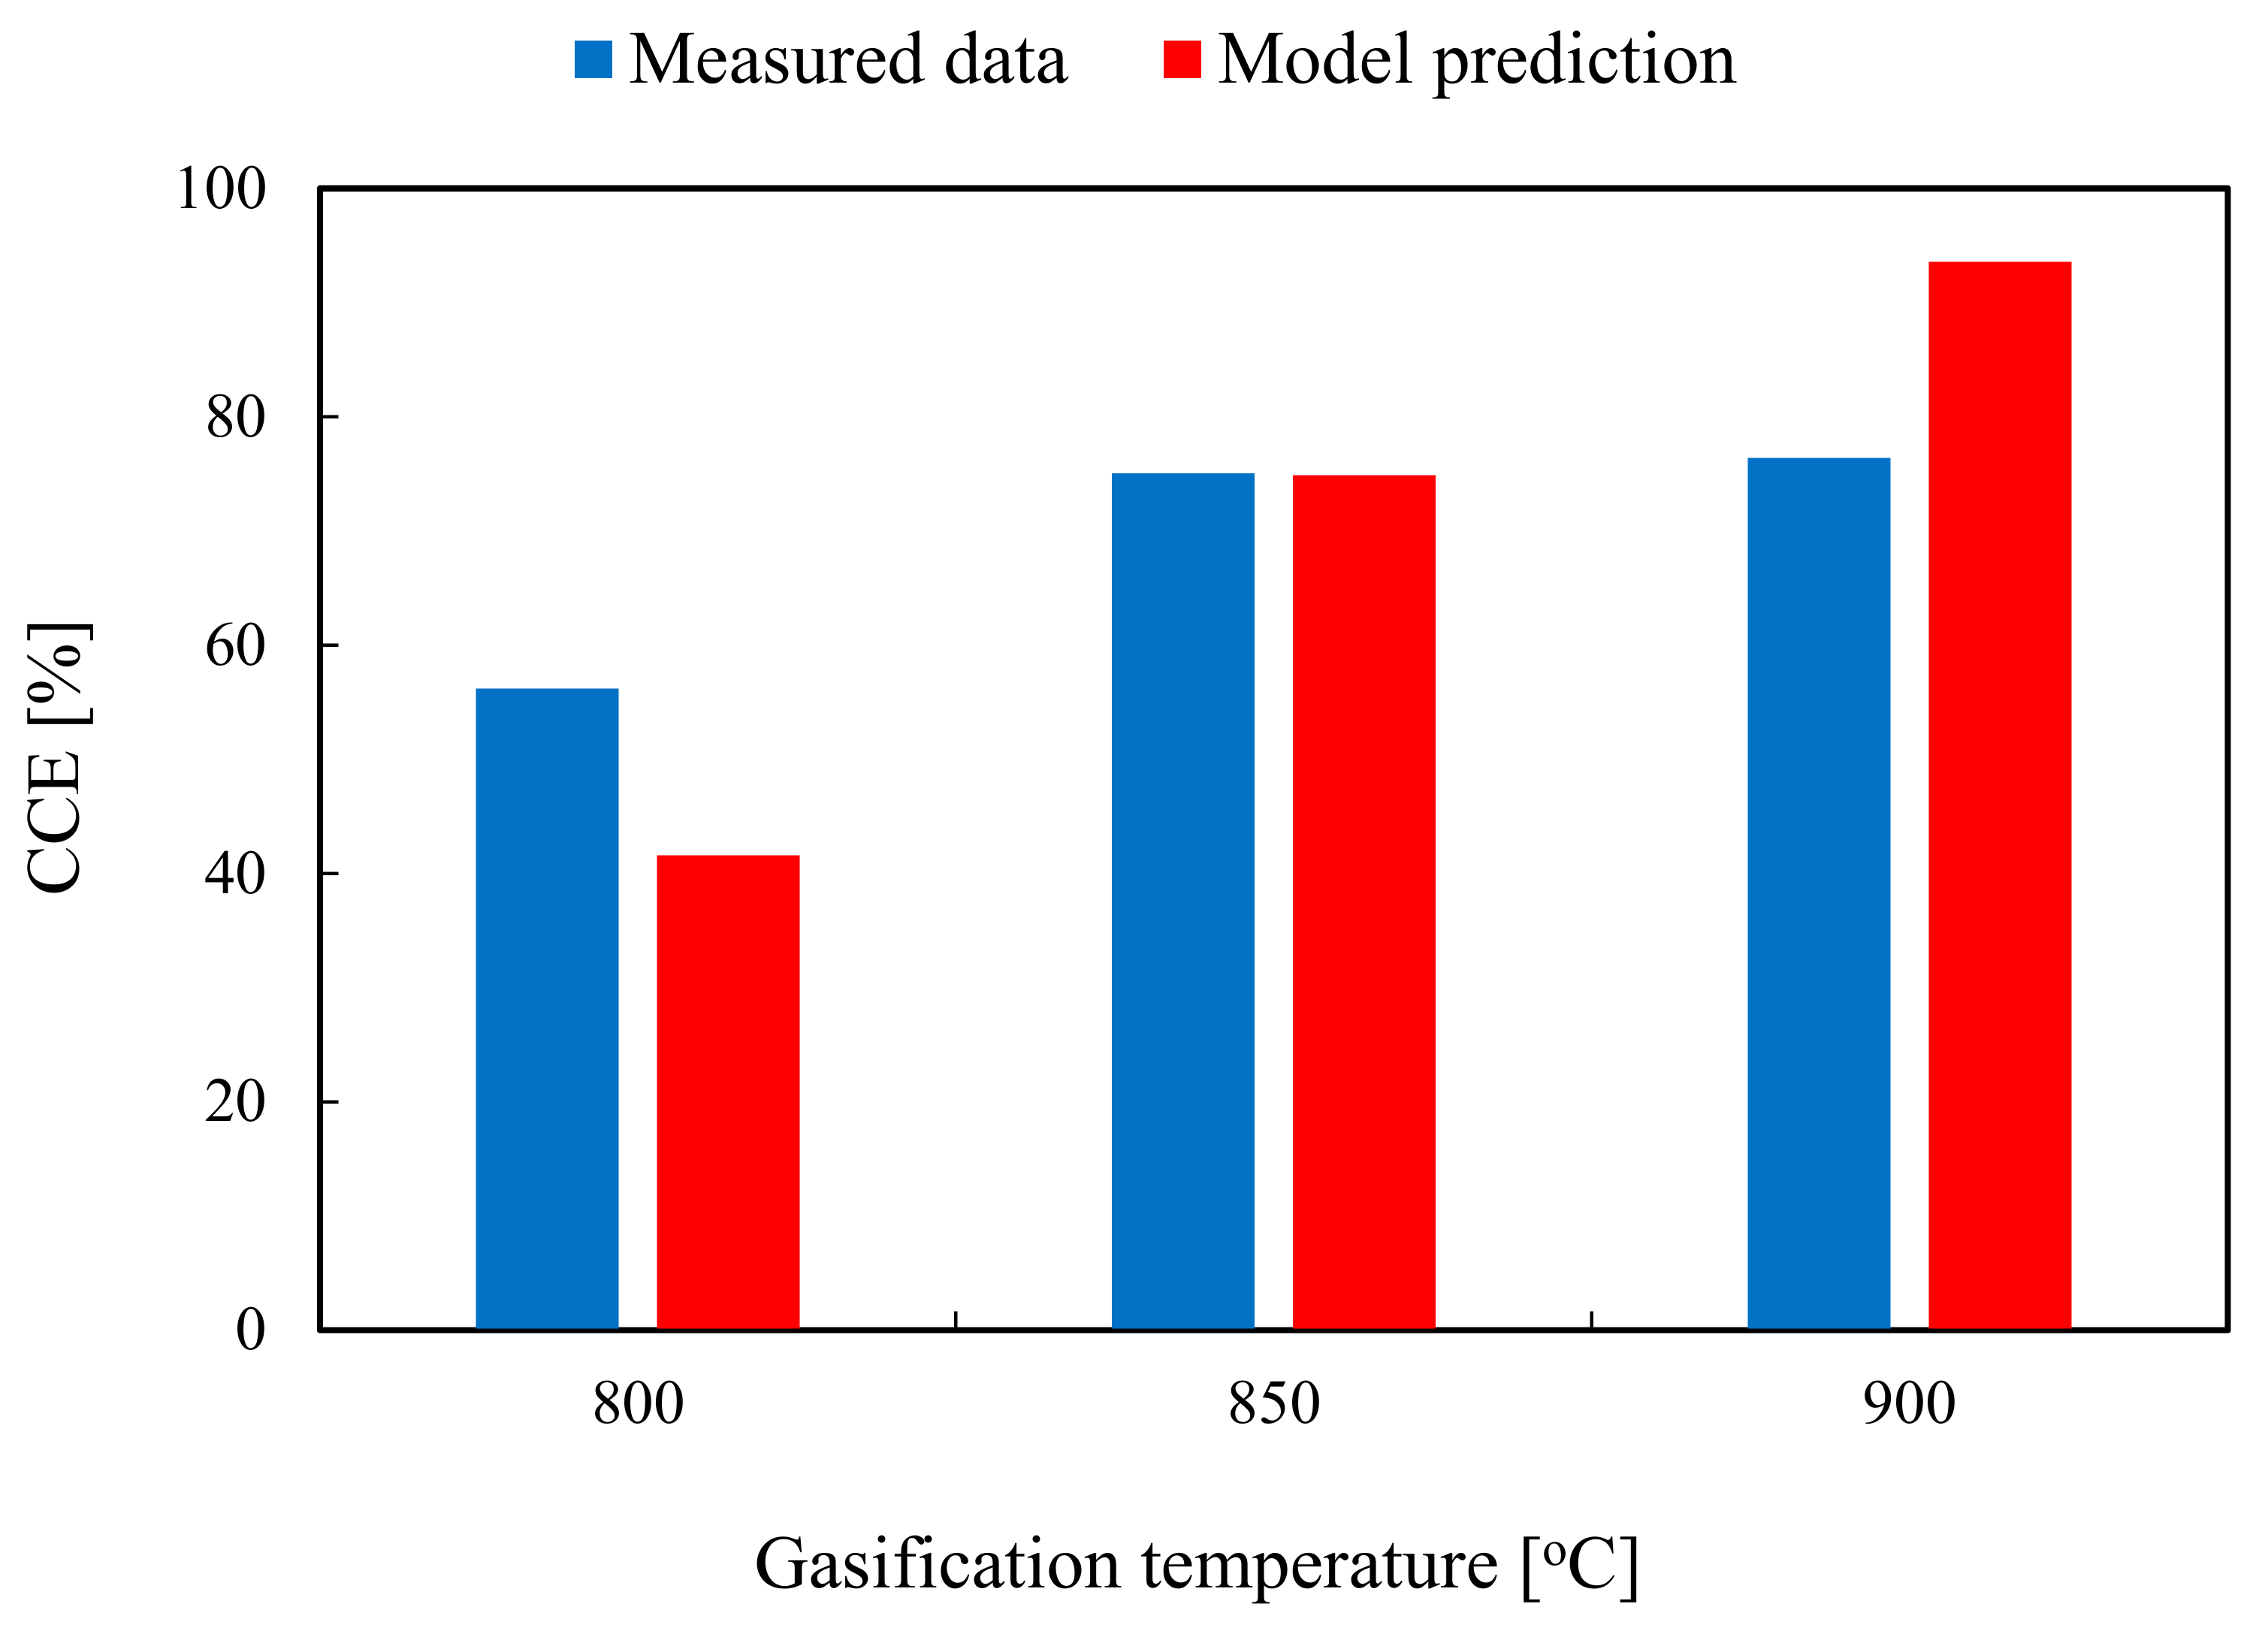
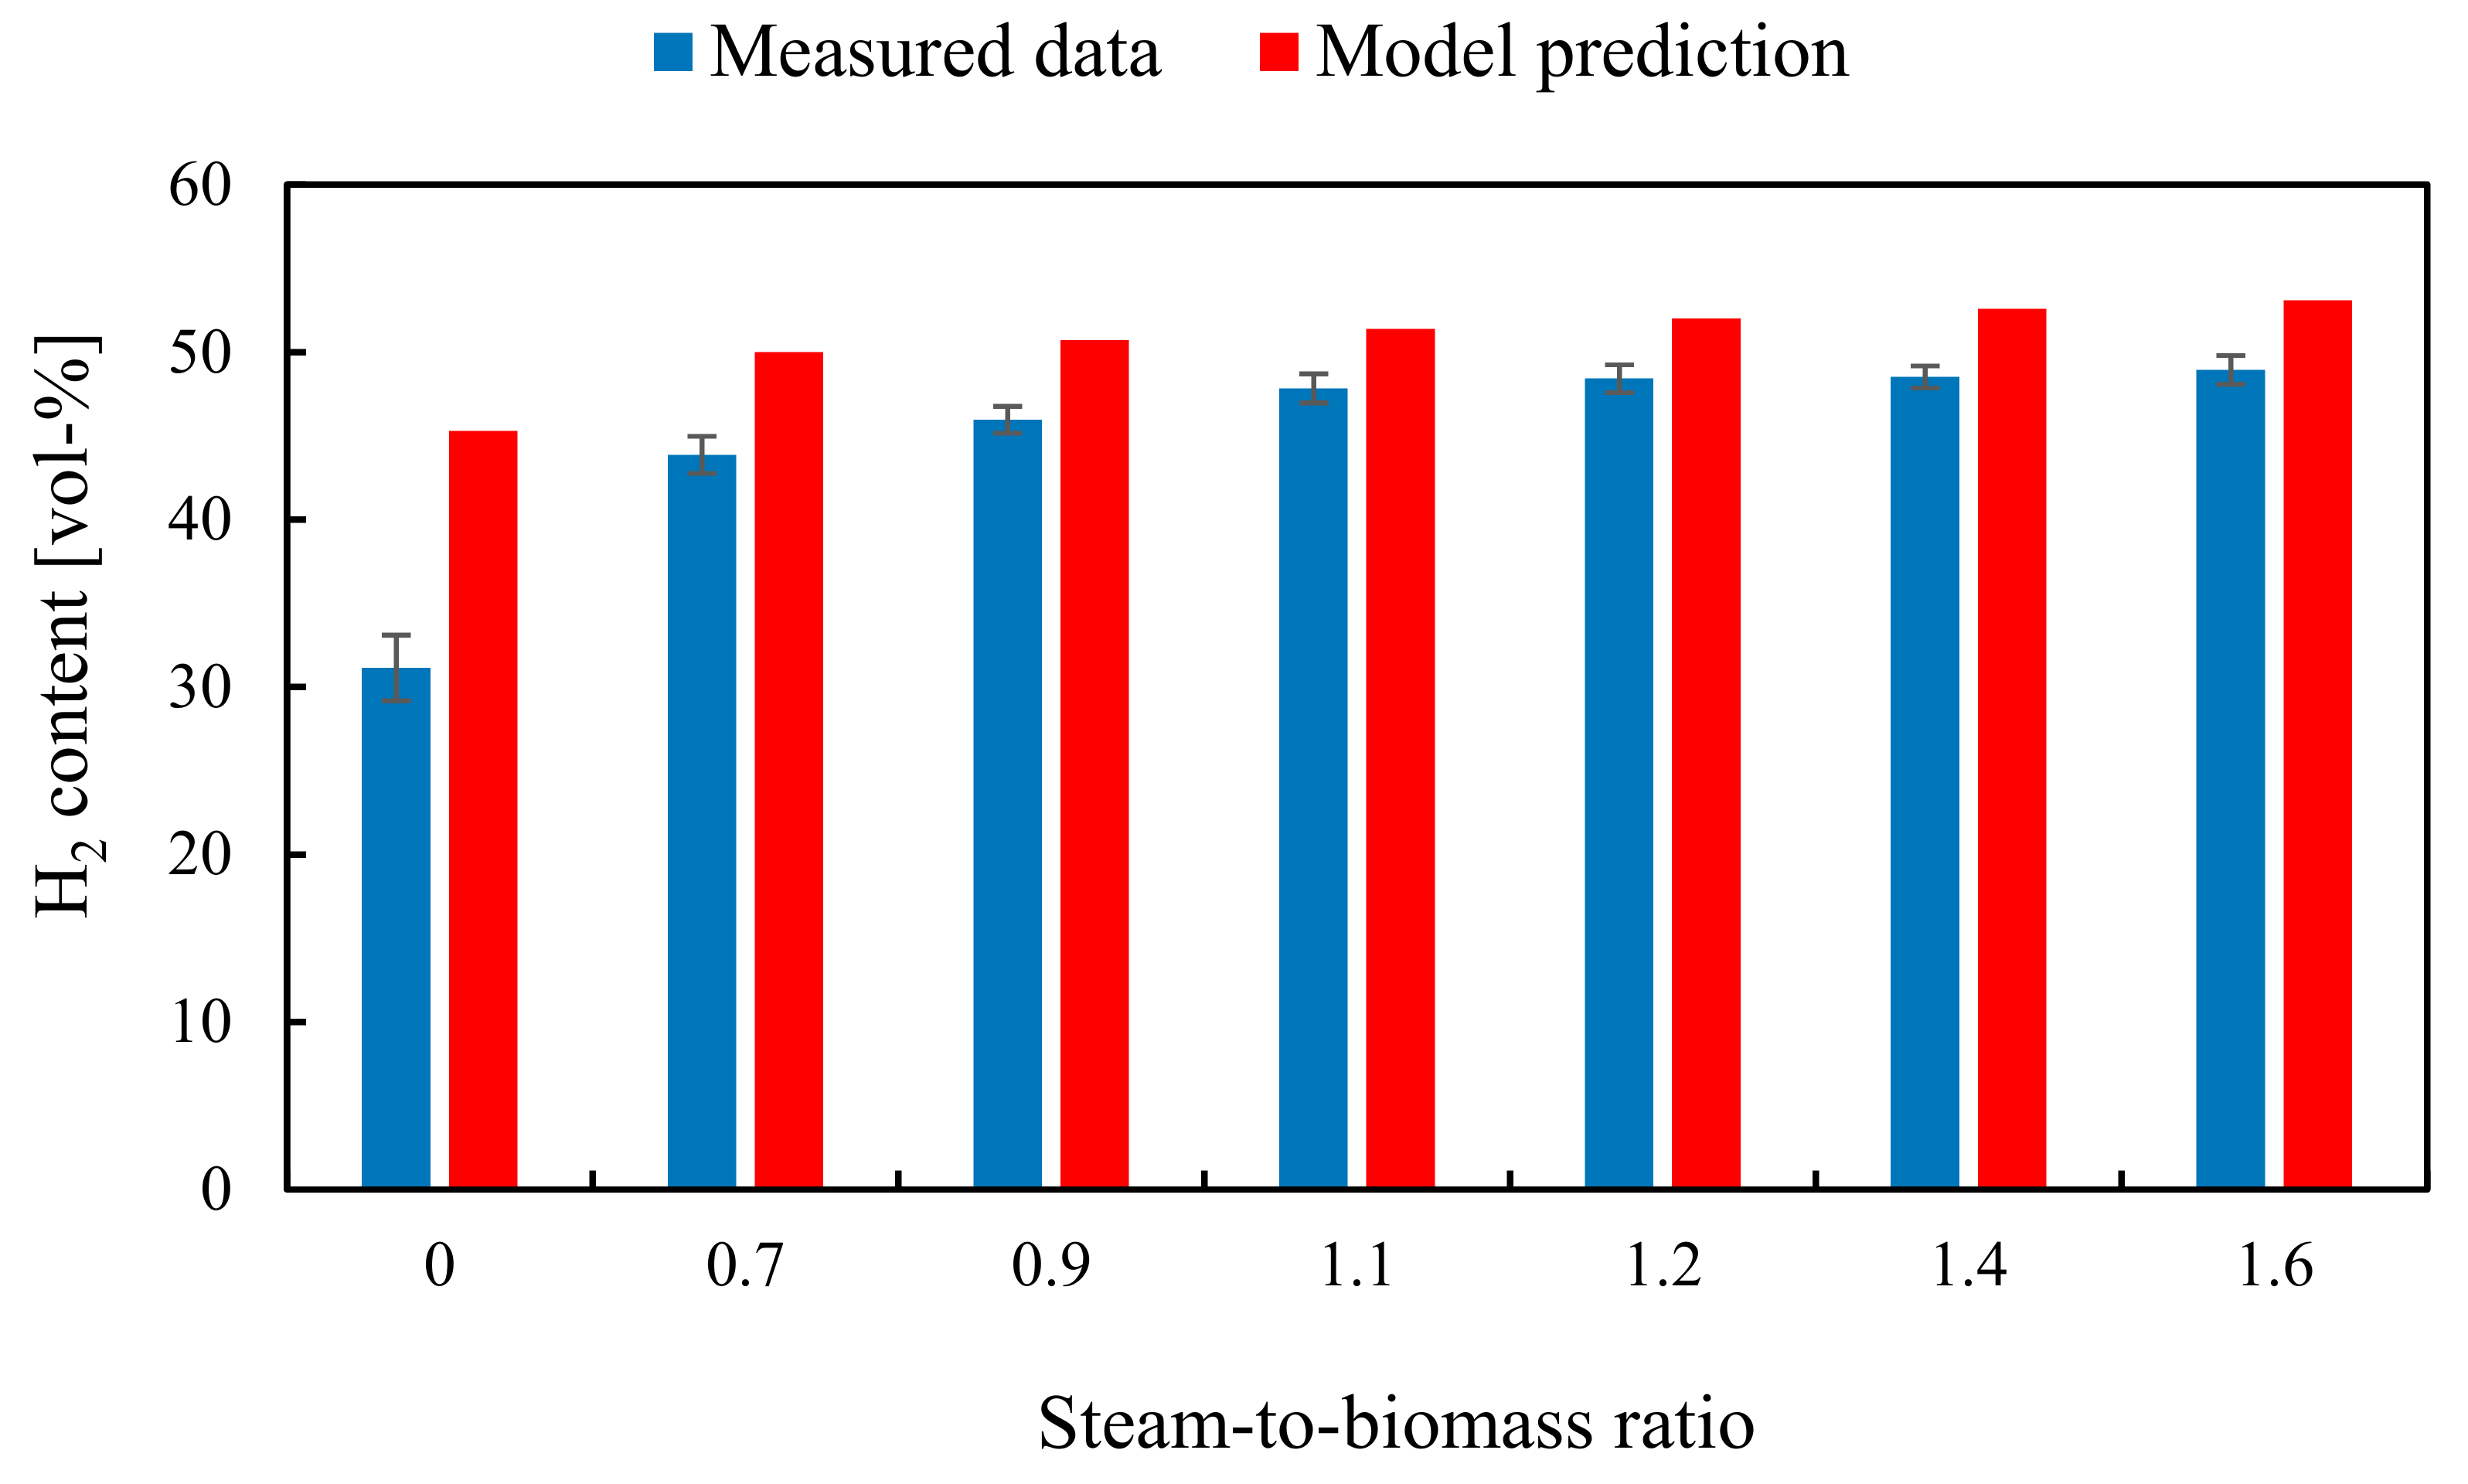
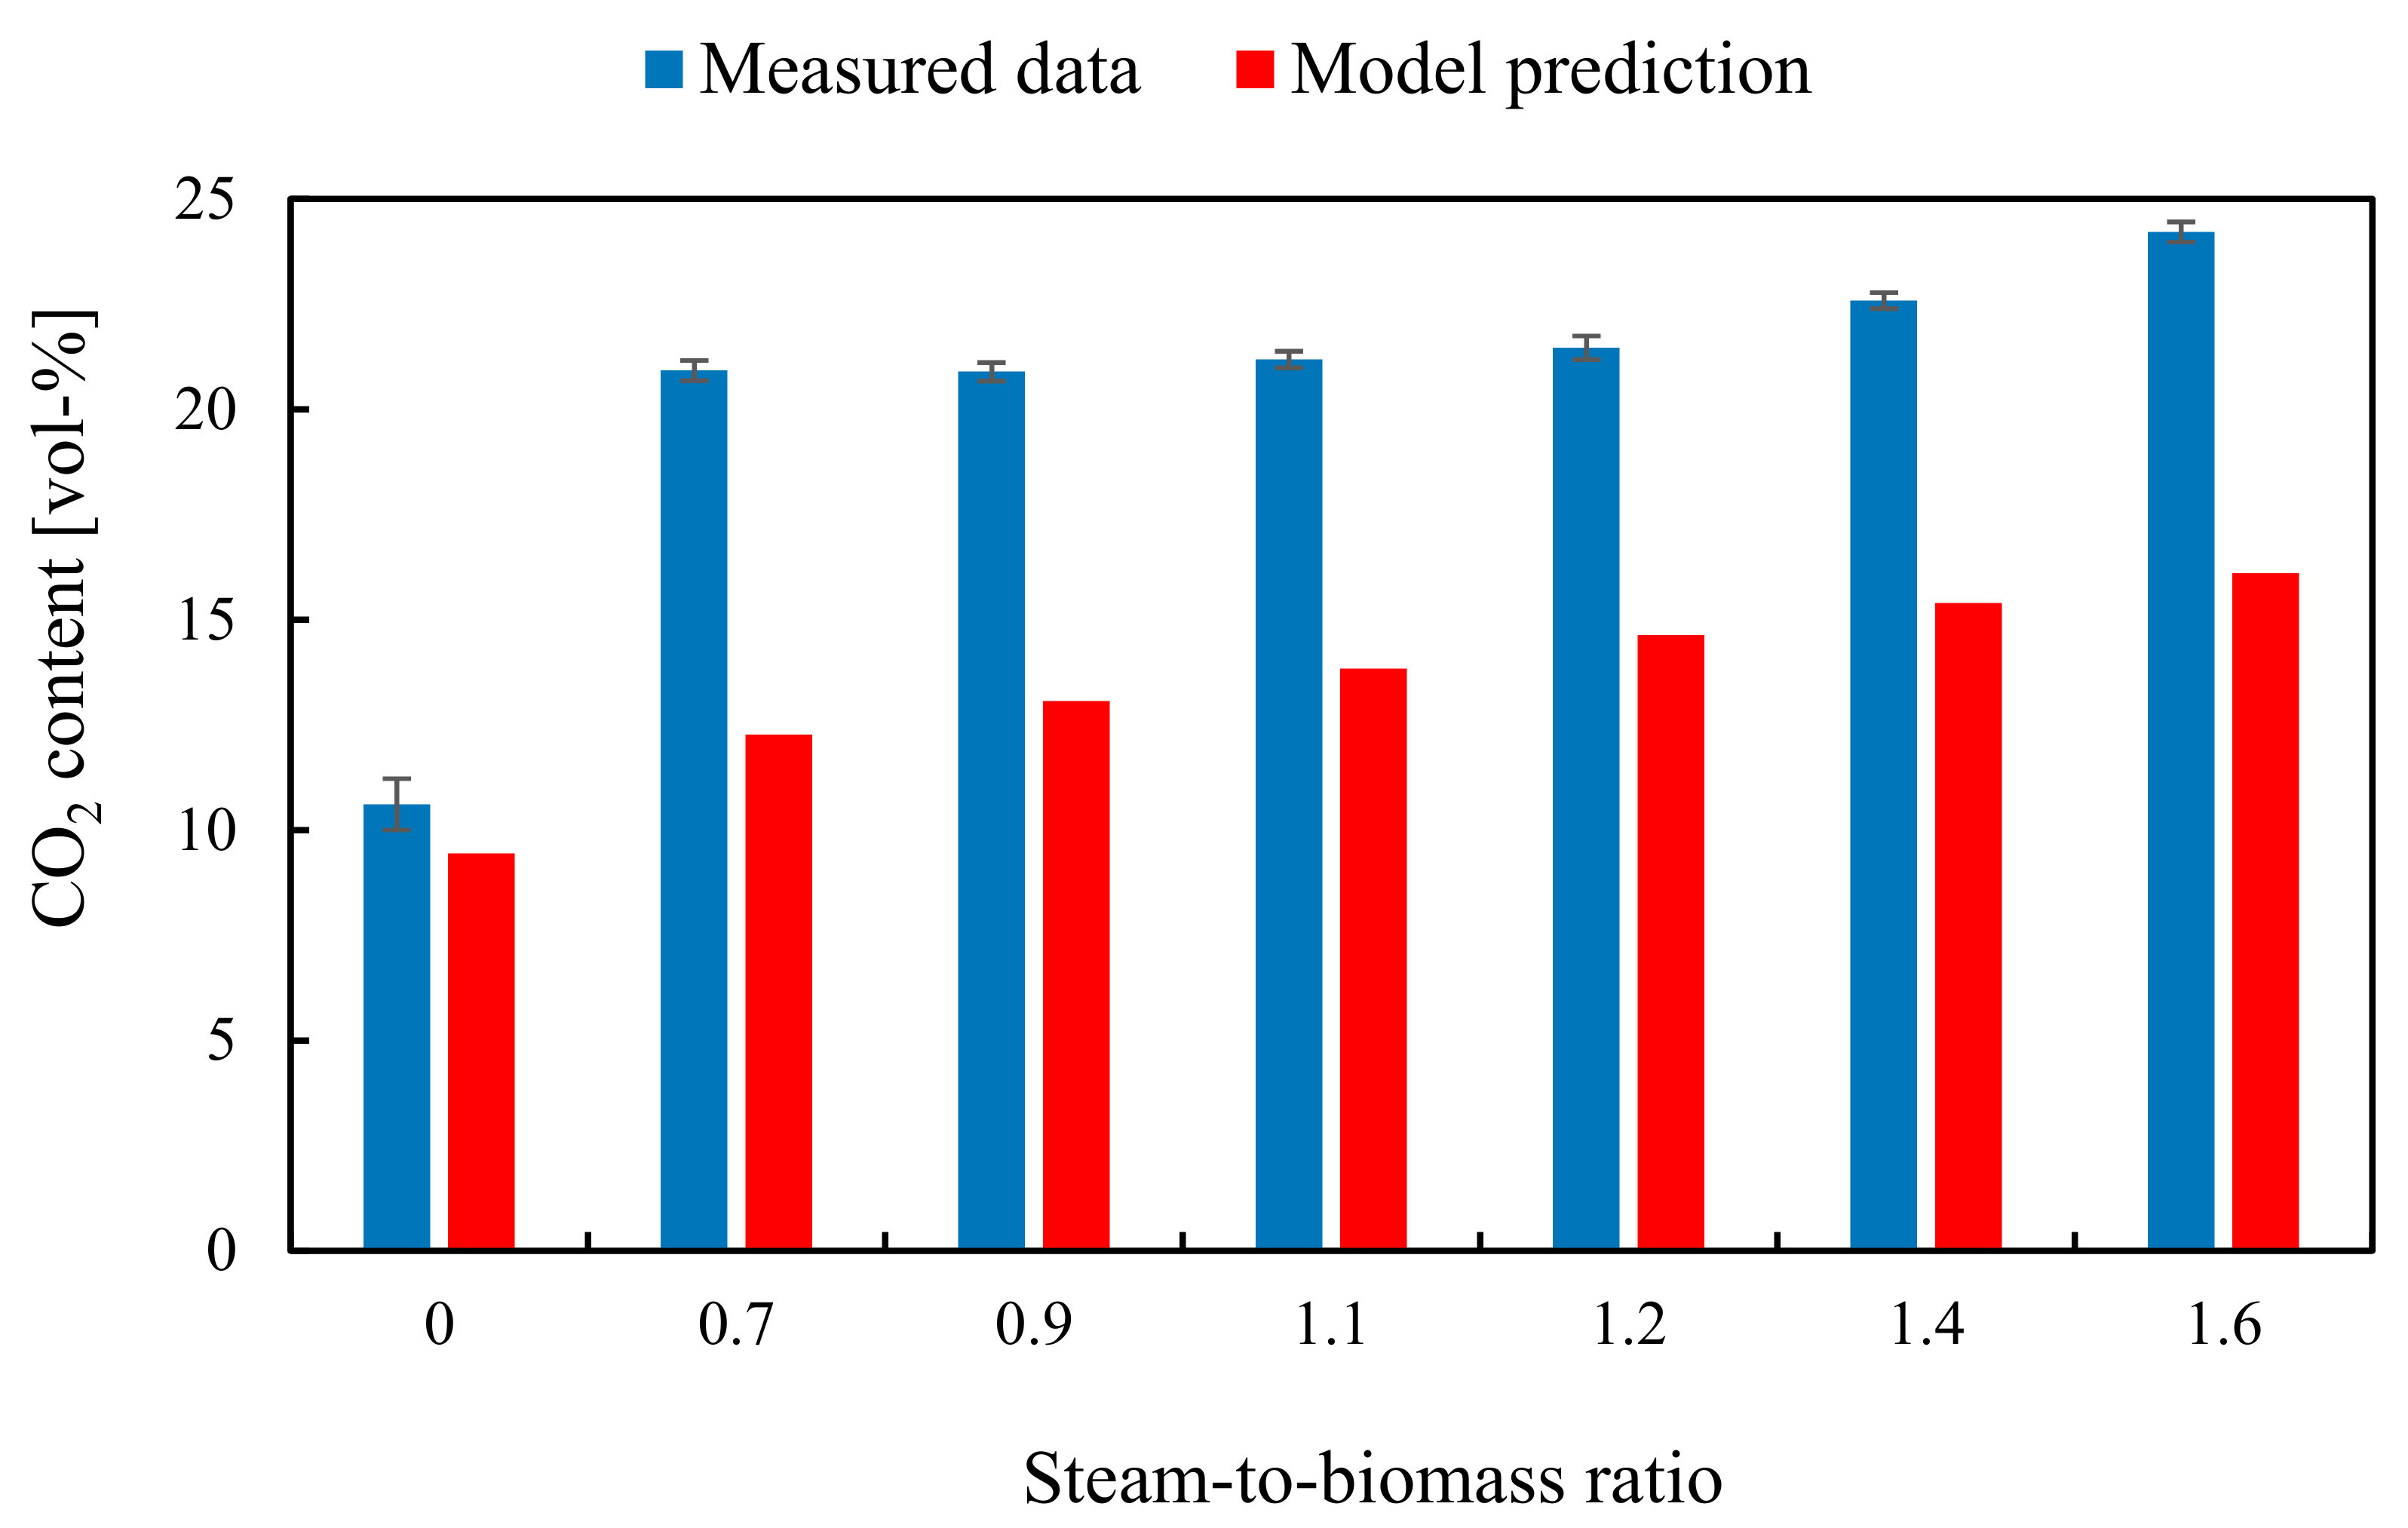
2.6. Model Validation
3. Results and Discussion
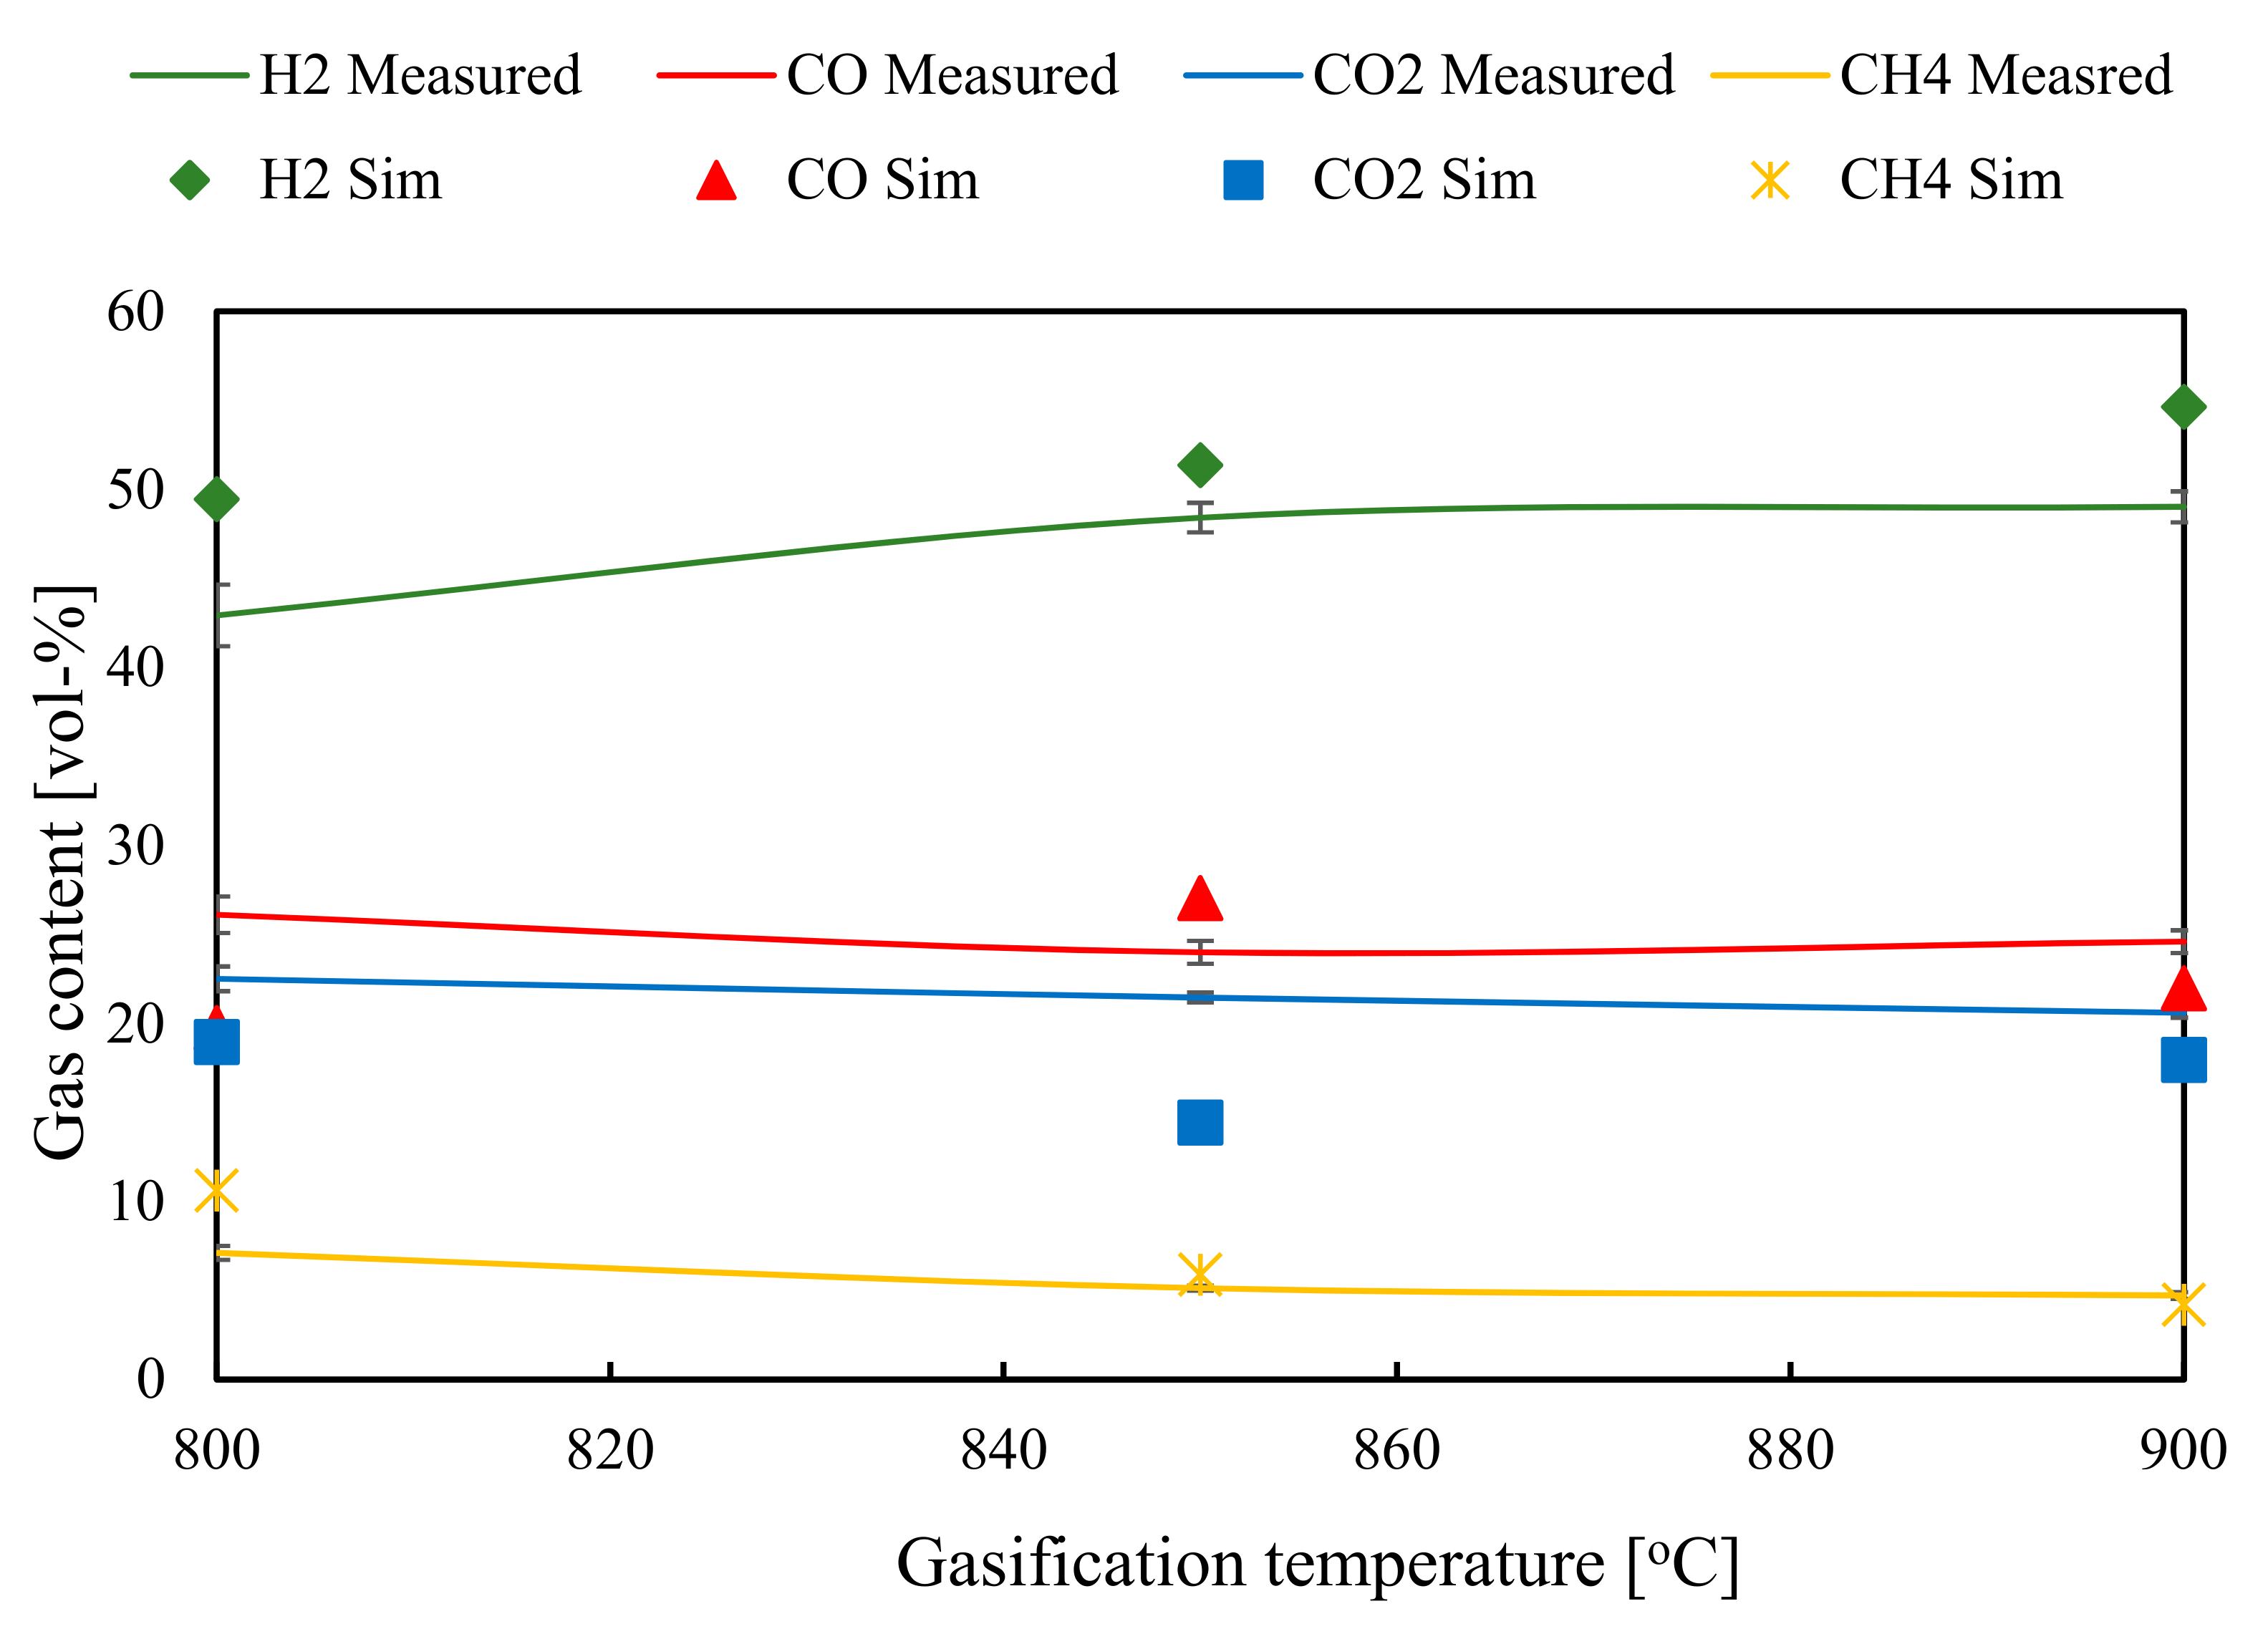
3.1. Effect of Gasification Temperature
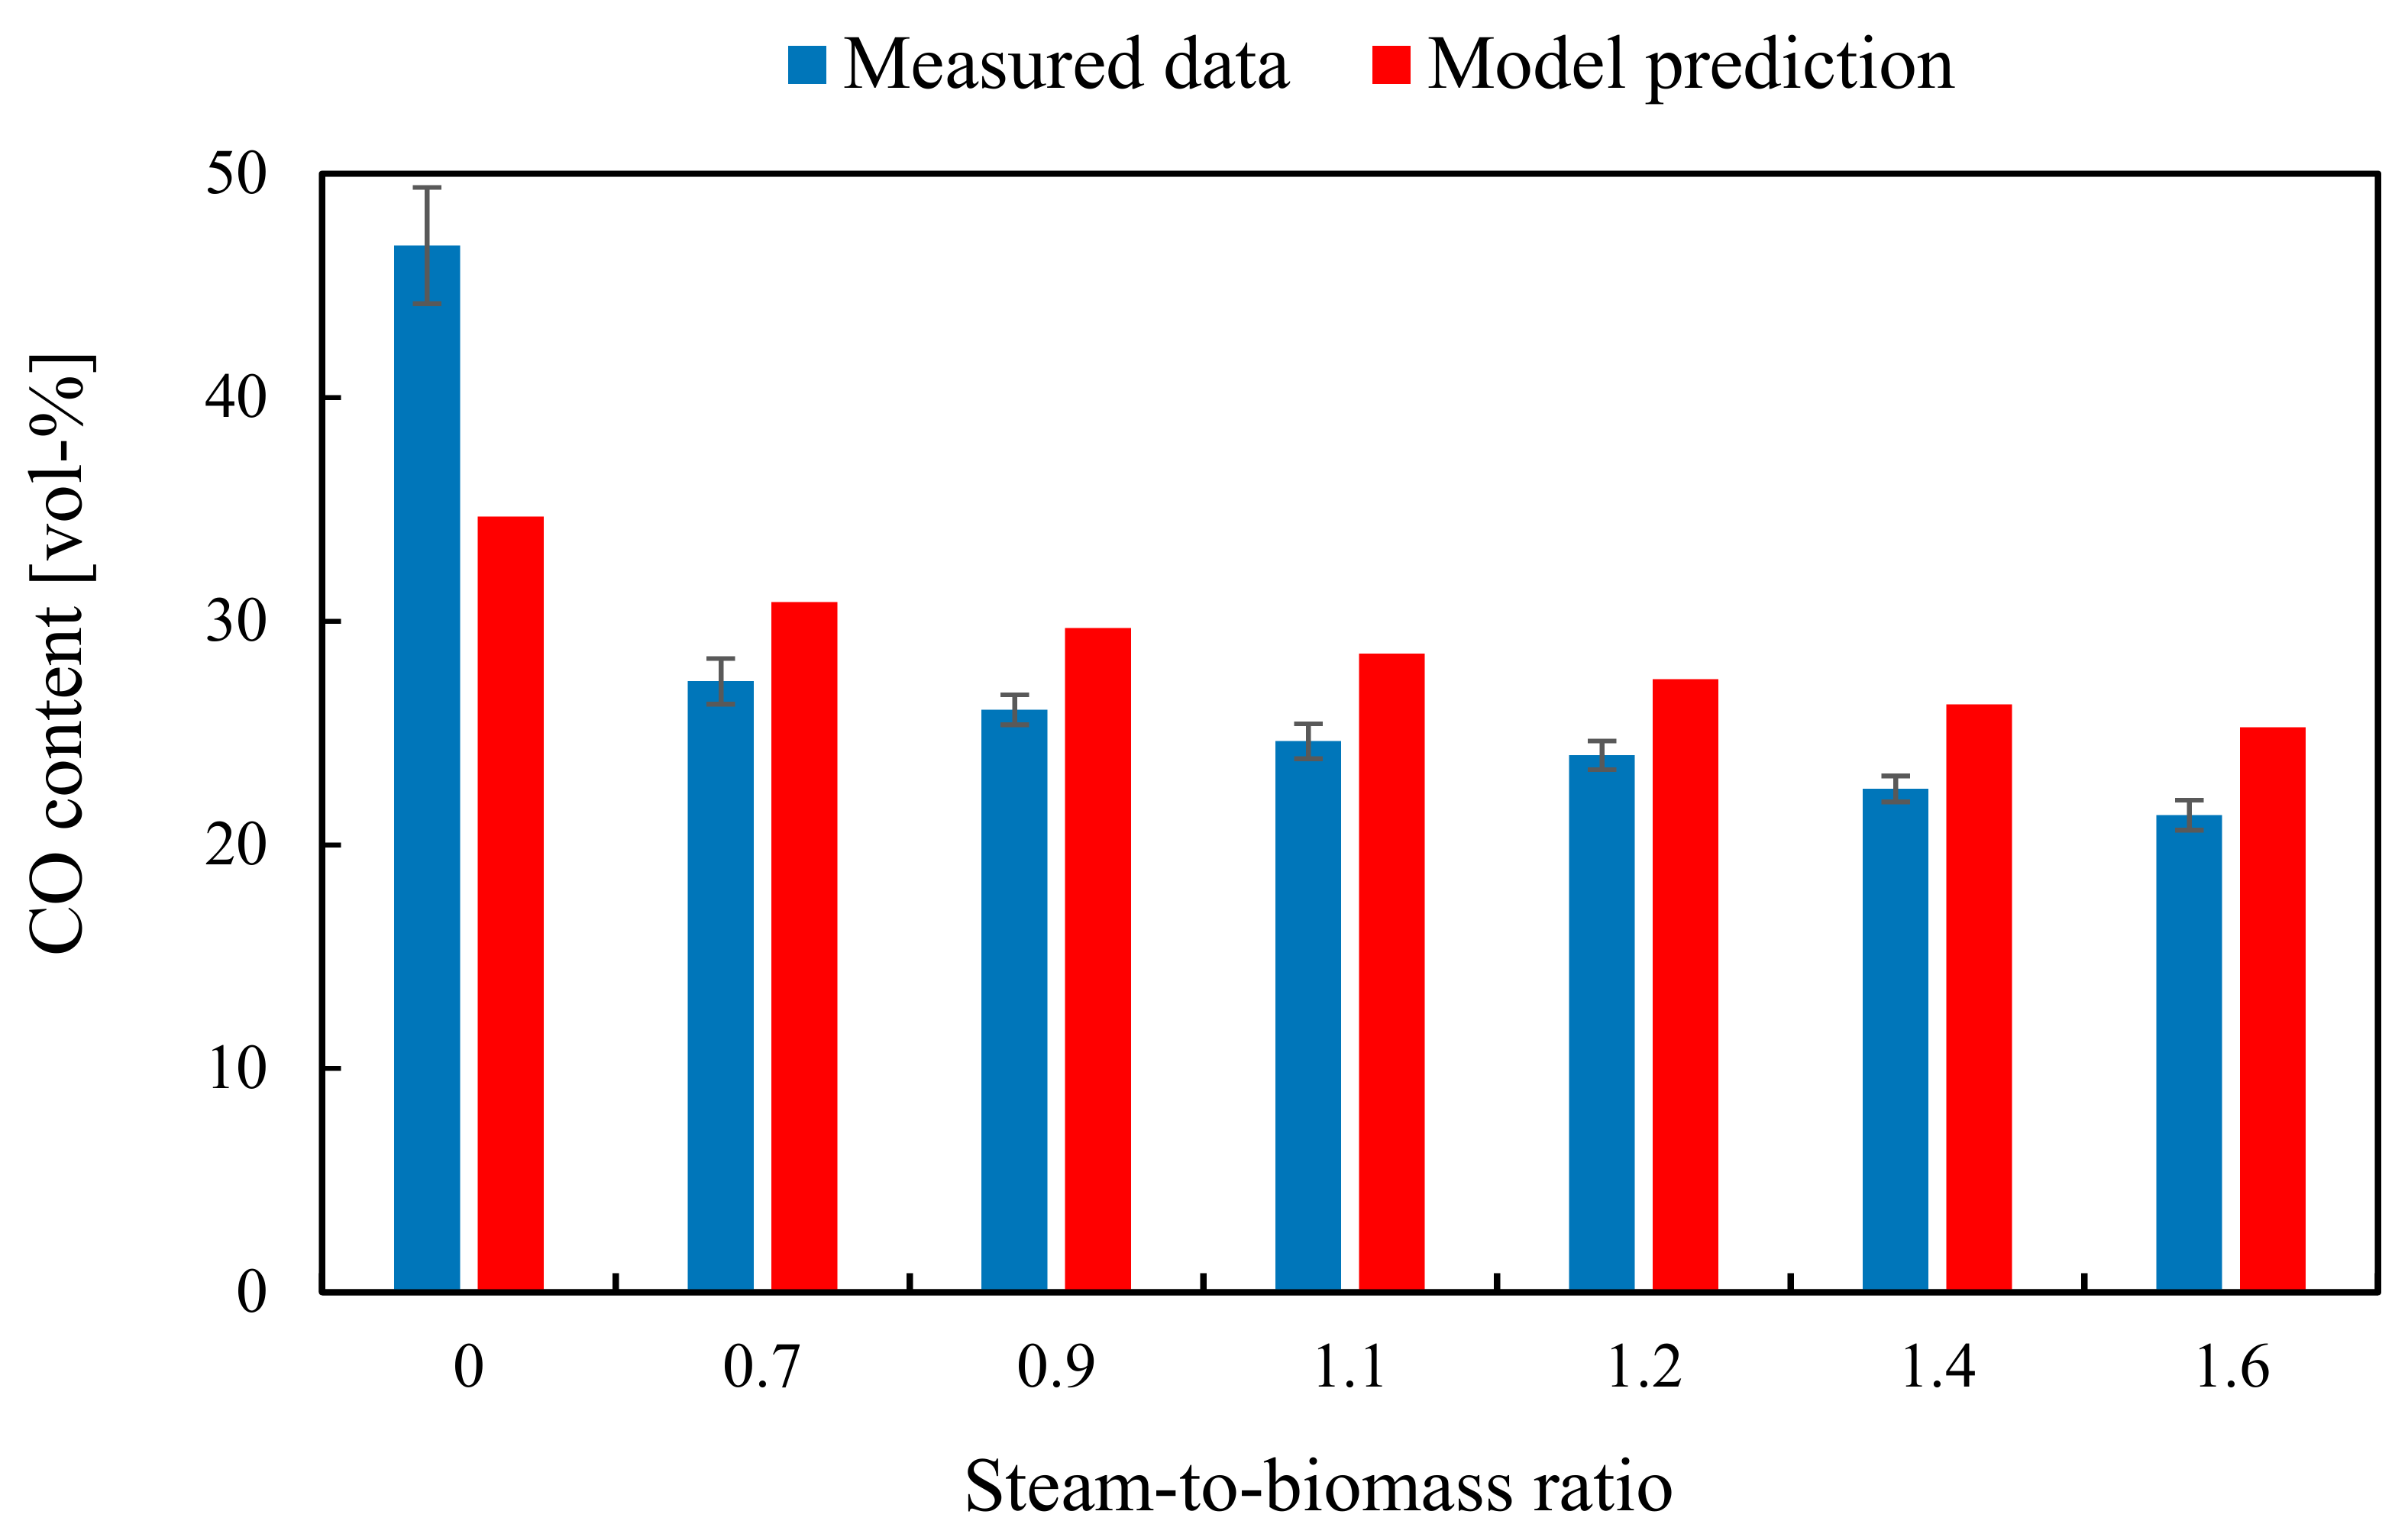
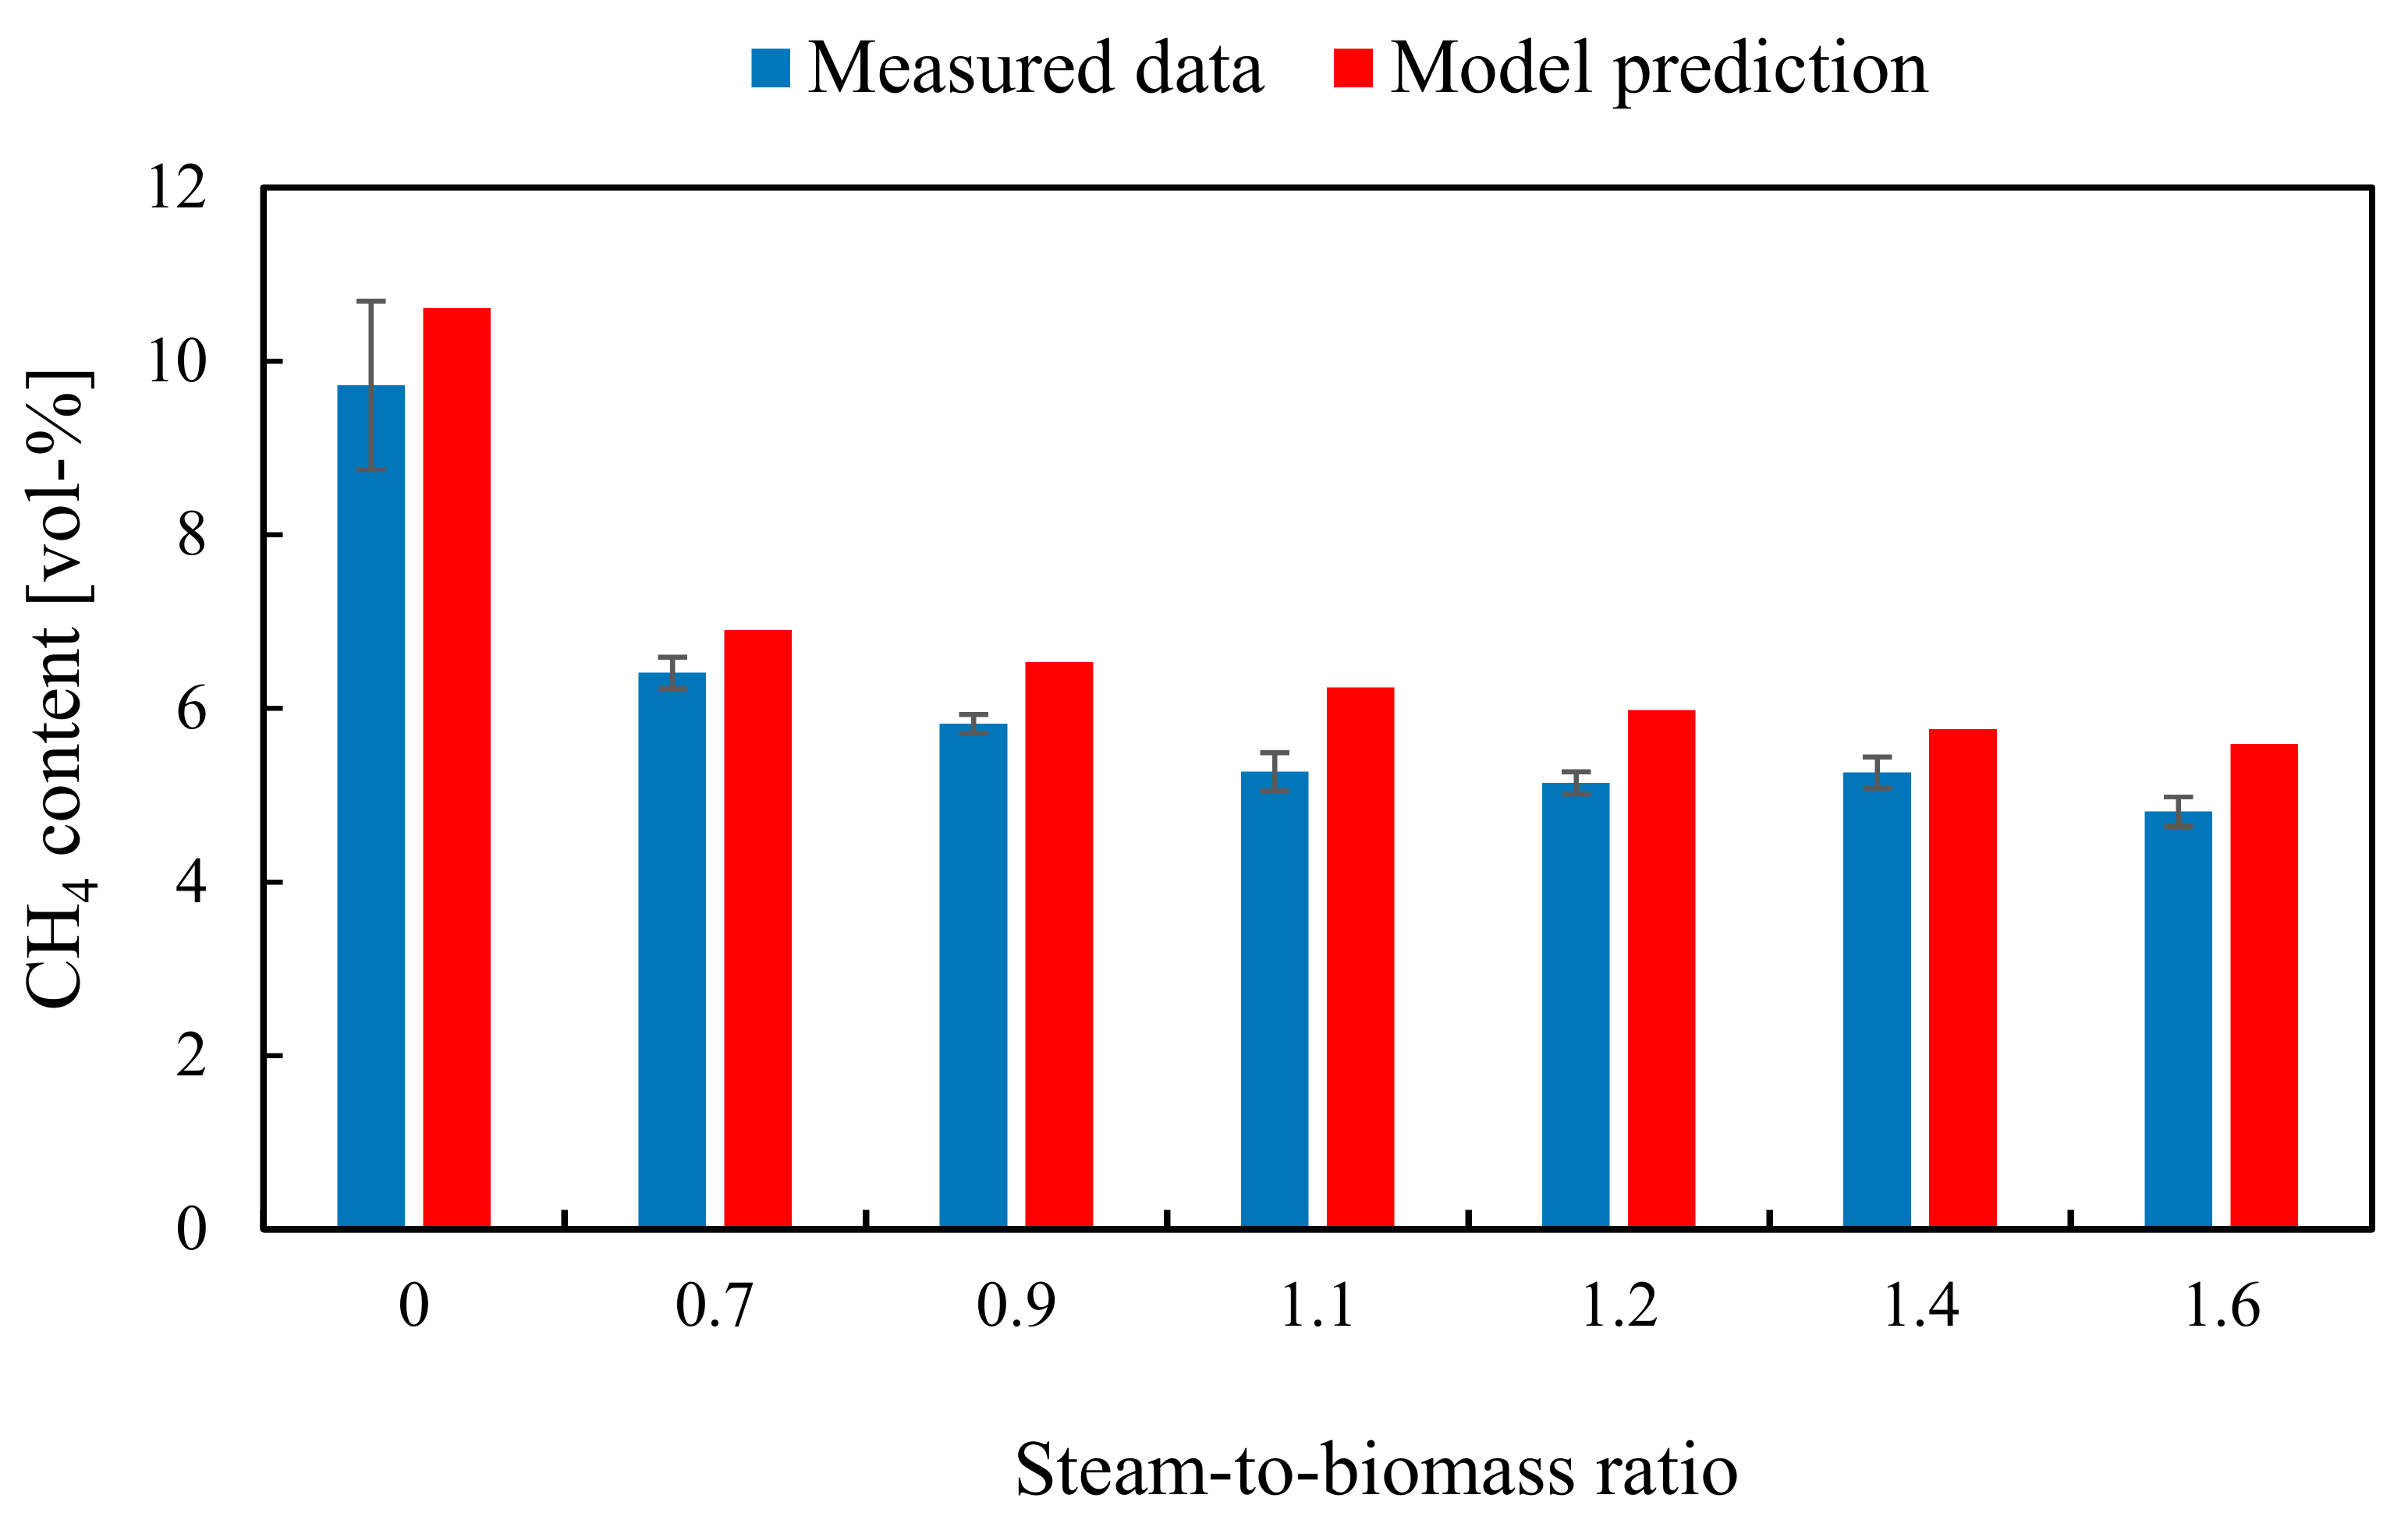
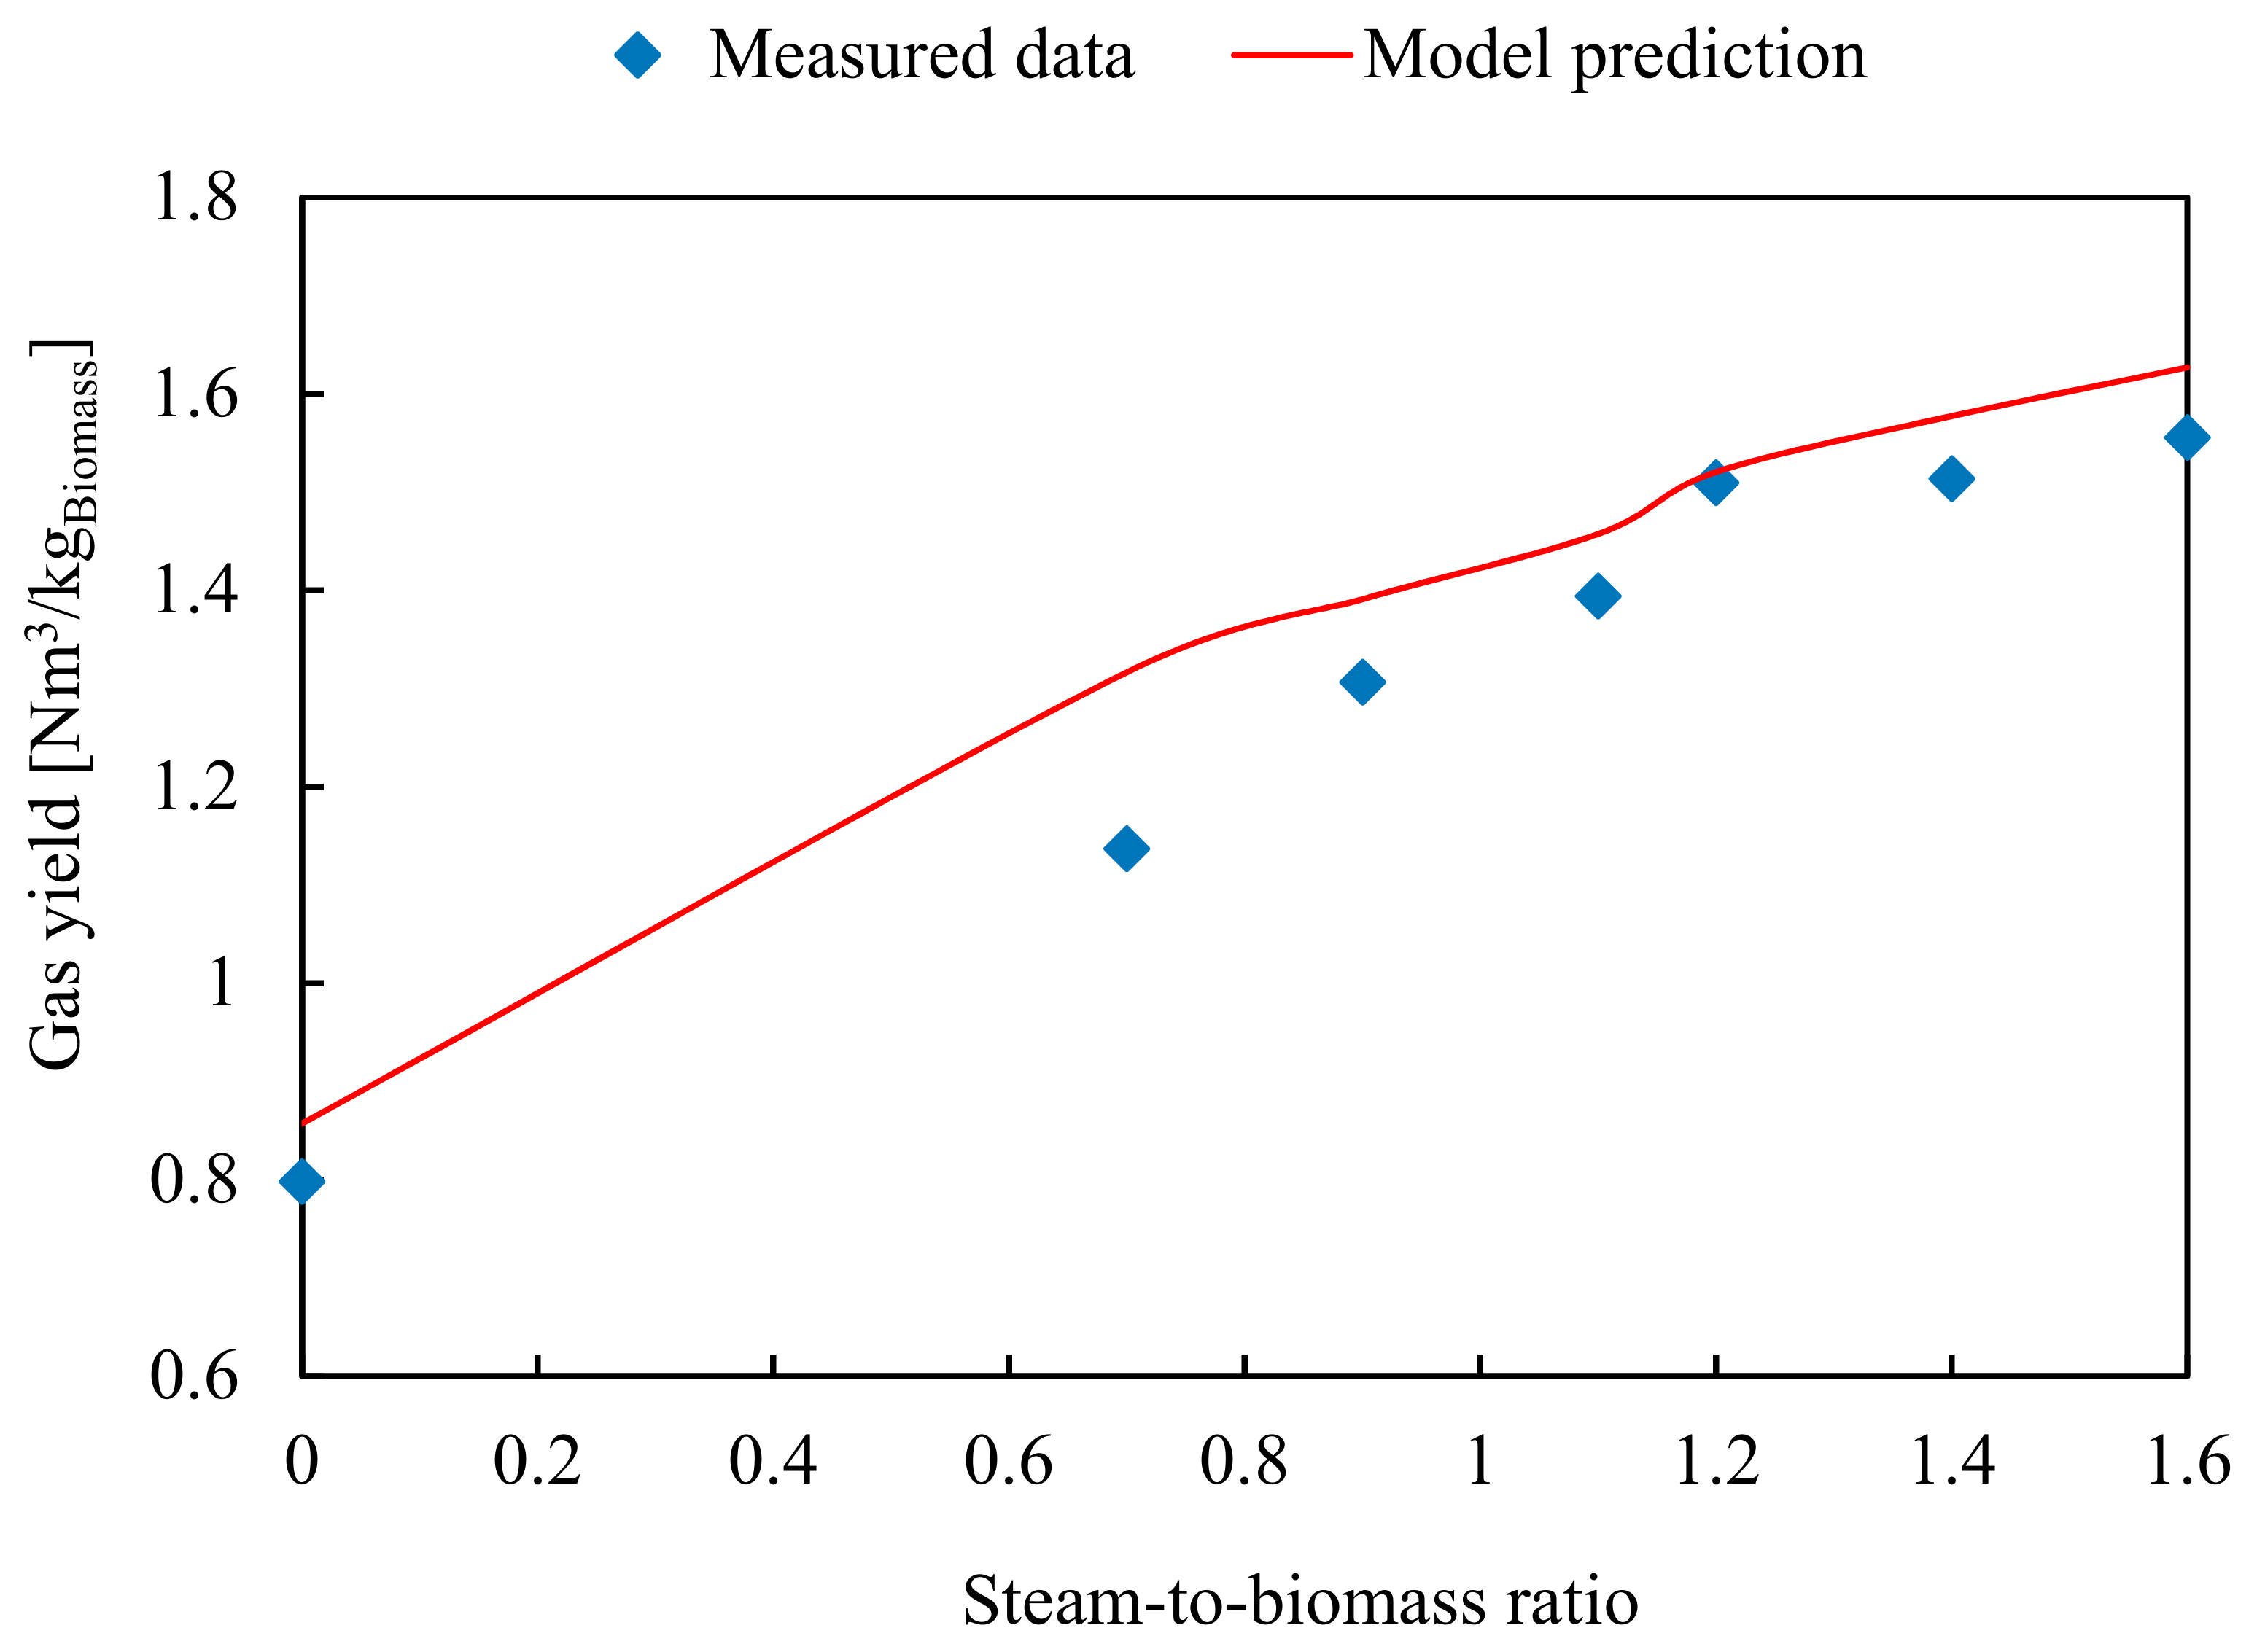
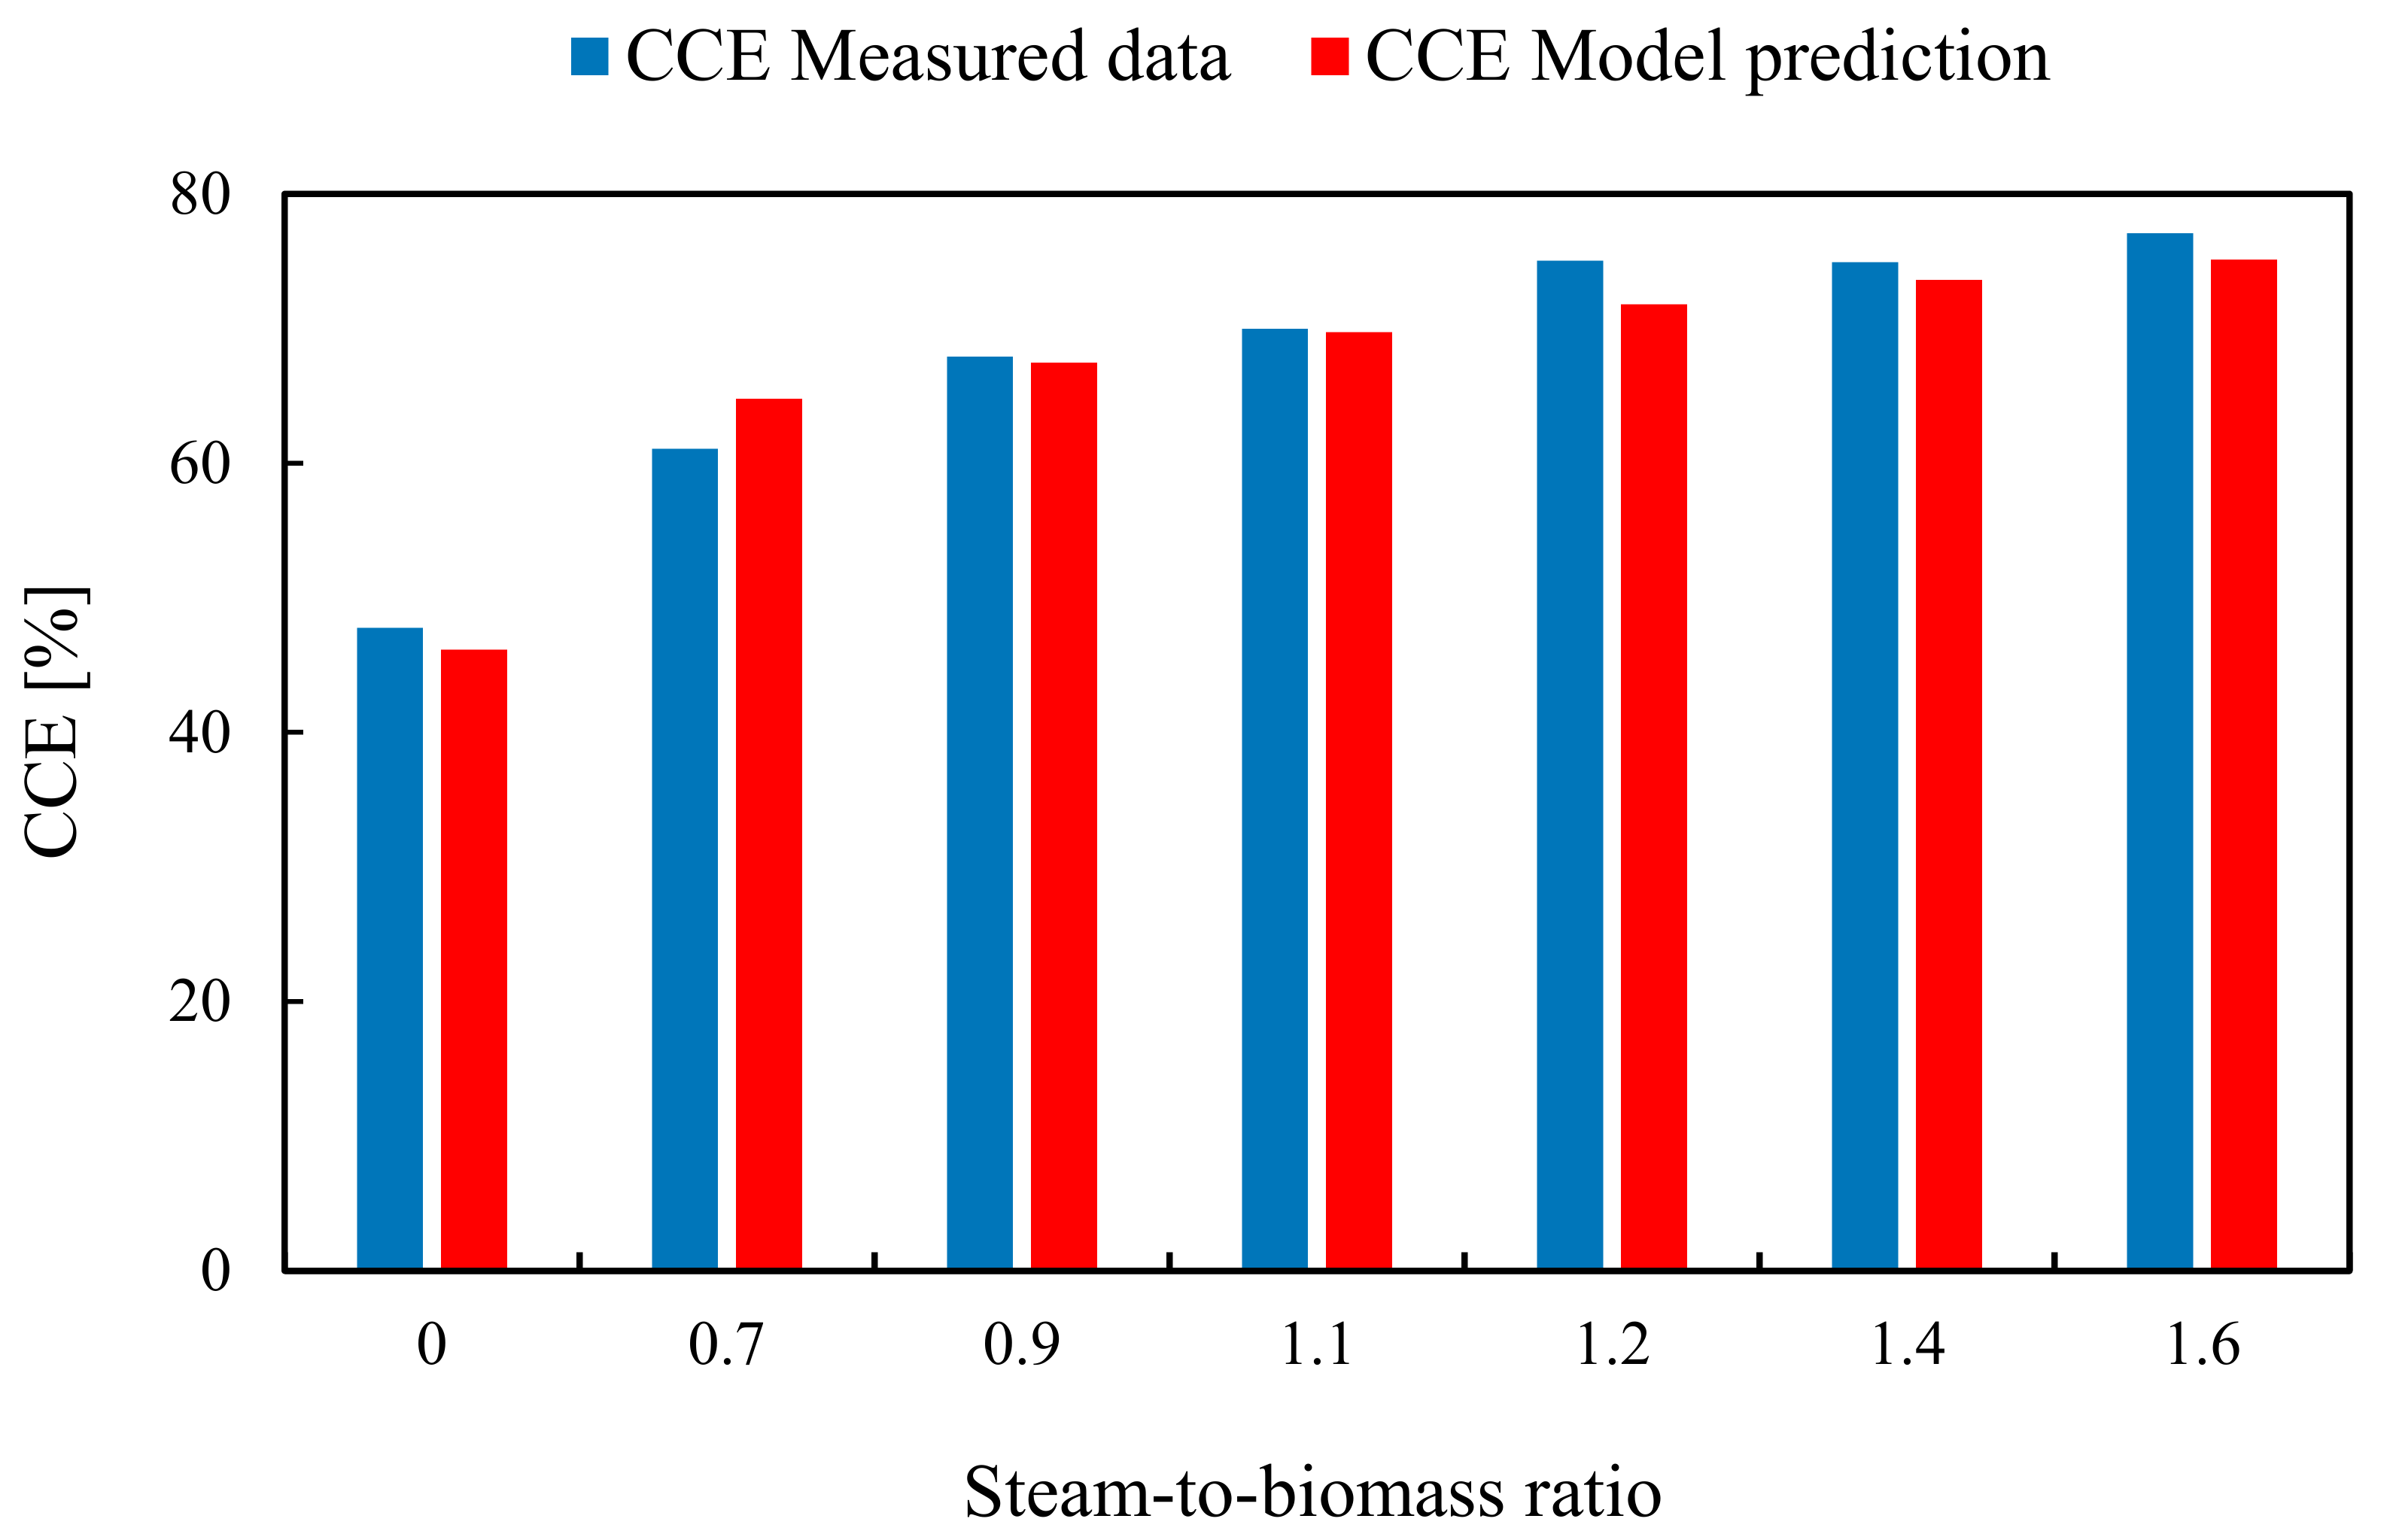
3.2. Effect of Steam-to-Biomass Ratio
4. Conclusions
- At higher temperatures, the gasification process is favored. Here, the hydrogen production and the carbon conversion efficiency are increased, while the amount of carbon monoxide and methane in the product gas is decreased.
- Increasing the steam amount in the reactor promotes the performance of biomass gasification. The SB steam-to-biomass ratio strongly enhances the content and yield of hydrogen in the product gas as well as improves the gas yield and the carbon conversion efficiency.
- It is noteworthy that the model predictions are in good agreement with the experimental data, and the model is capable of simulating the performance of biomass gasification under various operating conditions, i.e., operating temperature and steam-to-biomass ratio. The minor deviations between the simulation model and the measured data are related to the model limitations, i.e., simplified calculations in bed hydrodynamics and kinetics.
Author Contributions
Funding
Institutional Review Board Statement
Informed Consent Statement
Data Availability Statement
Conflicts of Interest
References
- Sikarwar, V.S.; Zhao, M.; Fennell, P.S.; Shah, N.; Anthony, E.J. Progress in biofuel production from gasification. Prog. Energy Combust. Sci. 2017, 61, 189–248. [Google Scholar] [CrossRef]
- McKendry, P. Energy production from biomass (Part 3): Gasification technologies. Bioresour. Technol. 2002, 83, 55–63. [Google Scholar] [CrossRef]
- Basu, P. Chapter 5—Gasification Theory and Modeling of Gasifiers. In Biomass Gasification and Pyrolysis; Basu, P., Ed.; Academic Press: Boston, MA, USA, 2010; pp. 117–165. [Google Scholar] [CrossRef]
- Spath, P.L.; Dayton, D.C. Preliminary Screening—Technical and Economic Assessment of Synthesis Gas to Fuels and Chemicals with Emphasis on the Potential for Biomass-Derived Syngas; National Renewable Energy Lab.: Golden, CO, USA, 2003. [CrossRef]
- Berrueco, C.; Recari, J.; Güell, B.M.; Alamo, G.D. Pressurized gasification of torrefied woody biomass in a lab scale fluidized bed. Energy 2014, 70, 68–78. [Google Scholar] [CrossRef]
- Chen, W.-H.; Chen, C.-J.; Hung, C.-I.; Shen, C.-H.; Hsu, H.-W. A comparison of gasification phenomena among raw biomass, torrefied biomass and coal in an entrained-flow reactor. Appl. Energy 2013, 112, 421–430. [Google Scholar] [CrossRef]
- Dupont, C.; Nocquet, T.; Da Costa, J.A.; Verne-Tournon, C. Kinetic modelling of steam gasification of various woody biomass chars: Influence of inorganic elements. Bioresour. Technol. 2011, 102, 9743–9748. [Google Scholar] [CrossRef]
- Xiao, R.; Yang, W. Kinetics characteristics of straw semi-char gasification with carbon dioxide. Bioresour. Technol. 2016, 207, 180–187. [Google Scholar] [CrossRef]
- Wang, G.; Zhang, J.; Hou, X.; Shao, J.; Geng, W. Study on CO2 gasification properties and kinetics of biomass chars and anthracite char. Bioresour. Technol. 2015, 177, 66–73. [Google Scholar] [CrossRef] [PubMed]
- Fermoso, J.; Gil, M.V.; Pevida, C.; Pis, J.J.; Rubiera, F. Kinetic models comparison for non-isothermal steam gasification of coal–biomass blend chars. Chem. Eng. J. 2010, 161, 276–284. [Google Scholar] [CrossRef]
- Bouraoui, Z.; Jeguirim, M.; Guizani, C.; Limousy, L.; Dupont, C.; Gadiou, R. Thermogravimetric study on the influence of structural, textural and chemical properties of biomass chars on CO2 gasification reactivity. Energy 2015, 88, 703–710. [Google Scholar] [CrossRef]
- Dahou, T.; Defoort, F.; Thiéry, S.; Grateau, M.; Campargue, M.; Bennici, S.; Jeguirim, M.; Dupont, C. The Influence of Char Preparation and Biomass Type on Char Steam Gasification Kinetics. Energies 2018, 11, 2126. [Google Scholar] [CrossRef]
- Molina, A.; Mondragón, F. Reactivity of coal gasification with steam and CO2. Fuel 1998, 77, 1831–1839. [Google Scholar] [CrossRef]
- Ergun, S.; Mines, U.S.B.O. Kinetics of the Reactions of Carbon Dioxide and Steam with Coke; U.S. Government Printing Office: Boston, MA, USA, 1962.
- Suraj, P.; George, J.; Arun, P.; Muraleedharan, C. Theoretical and experimental feasibility study of groundnut shell gasification in a fluidized bed gasifier. Biomass Convers. Biorefinery 2020, 10, 735–742. [Google Scholar] [CrossRef]
- Rupesh, S.; Muraleedharan, C.; Arun, P. ASPEN plus modelling of air–steam gasification of biomass with sorbent enabled CO2 capture. Resour. Technol. 2016, 2, 94–103. [Google Scholar] [CrossRef]
- Beheshti, S.; Ghassemi, H.; Shahsavan-Markadeh, R. Process simulation of biomass gasification in a bubbling fluidized bed reactor. Energy Convers. Manag. 2015, 94, 345–352. [Google Scholar] [CrossRef]
- Yan, L.; Lim, C.J.; Yue, G.; He, B.; Grace, J.R. One-dimensional modeling of a dual fluidized bed for biomass steam gasification. Energy Convers. Manag. 2016, 127, 612–622. [Google Scholar] [CrossRef]
- Aghaalikhani, A.; Schmid, J.C.; Borello, D.; Fuchs, J.; Benedikt, F.; Hofbauer, H.; Rispoli, F.; Henriksen, U.B.; Sárossy, Z.; Cedola, L. Detailed modelling of biomass steam gasification in a dual fluidized bed gasifier with temperature variation. Renew. Energy 2019, 143, 703–718. [Google Scholar] [CrossRef]
- Shahbaz, M.; Taqvi, S.A.; Loy, A.C.M.; Inayat, A.; Uddin, F.; Bokhari, A.; Naqvi, S.R. Artificial neural network approach for the steam gasification of palm oil waste using bottom ash and CaO. Renew. Energy 2019, 132, 243–254. [Google Scholar] [CrossRef]
- Zhou, L.; Yang, Z.; Tang, A.; Huang, H.; Wei, D.; Yu, E.; Lu, W. Steam-gasification of biomass with CaO as catalyst for hydrogen-rich syngas production. J. Energy Inst. 2019, 92, 1641–1646. [Google Scholar] [CrossRef]
- Eri, Q.; Peng, J.; Zhao, X. CFD simulation of biomass steam gasification in a fluidized bed based on a multi-composition multi-step kinetic model. Appl. Therm. Eng. 2018, 129, 1358–1368. [Google Scholar] [CrossRef]
- Ghasemzadeh, K.; Khosravi, M.; Tilebon, S.S.; Aghaeinejad-Meybodi, A.; Basile, A. Theoretical evaluation of PdAg membrane reactor performance during biomass steam gasification for hydrogen production using CFD method. Int. J. Hydrogen Energy 2018, 43, 11719–11730. [Google Scholar] [CrossRef]
- Ostermeier, P.; Fischer, F.; Fendt, S.; DeYoung, S.; Spliethoff, H. Coarse-grained CFD-DEM simulation of biomass gasification in a fluidized bed reactor. Fuel 2019, 255, 115790. [Google Scholar] [CrossRef]
- Kraft, S.; Kirnbauer, F.; Hofbauer, H. CPFD simulations of an industrial-sized dual fluidized bed steam gasification system of biomass with 8 MW fuel input. Appl. Energy 2017, 190, 408–420. [Google Scholar] [CrossRef]
- Chen, T.; Ku, X.; Lin, J.J.C. CFD simulation of the steam gasification of millimeter-sized char particle using thermally thick treatment. Combust. Flame 2020, 213, 63–86. [Google Scholar] [CrossRef]
- Yang, S.; Fan, F.; Wei, Y.; Hu, J.; Wang, H.; Wu, S. Three-dimensional MP-PIC simulation of the steam gasification of biomass in a spouted bed gasifier. Energy Convers. Manag. 2020, 210, 112689. [Google Scholar] [CrossRef]
- George, J.; Arun, P.; Muraleedharan, C. Stoichiometric Equilibrium Model Based Assessment of Hydrogen Generation through Biomass Gasification. Procedia Technol. 2016, 25, 982–989. [Google Scholar] [CrossRef]
- Mirmoshtaghi, G.; Li, H.; Thorin, E.; Dahlquist, E. Evaluation of different biomass gasification modeling approaches for fluidized bed gasifiers. Biomass Bioenergy 2016, 91, 69–82. [Google Scholar] [CrossRef]
- Kaushal, P.; Tyagi, R. Advanced simulation of biomass gasification in a fluidized bed reactor using ASPEN PLUS. Renew. Energy 2017, 101, 629–636. [Google Scholar] [CrossRef]
- Nikoo, M.B.; Mahinpey, N. Simulation of biomass gasification in fluidized bed reactor using ASPEN PLUS. Biomass Bioenergy 2008, 32, 1245–1254. [Google Scholar] [CrossRef]
- Acar, M.; Böke, E. Simulation of Biomass Gasification Process Using Aspen Plus. In Proceedings of the 14th International Conference of Combustion, Karabük, Turkey, 25–27 April 2018. [Google Scholar]
- Pala, L.P.R.; Wang, Q.; Kolb, G.; Hessel, V. Steam gasification of biomass with subsequent syngas adjustment using shift reaction for syngas production: An Aspen Plus model. Renew. Energy 2017, 101, 484–492. [Google Scholar] [CrossRef]
- Neves, D.; Thunman, H.; Matos, A.; Tarelho, L.; Gómez-Barea, A. Characterization and prediction of biomass pyrolysis products. Prog. Energy Combust. Sci. 2011, 37, 611–630. [Google Scholar] [CrossRef]
- Puig-Arnavat, M.; Bruno, J.C.; Coronas, A. Review and analysis of biomass gasification models. Renew. Sustain. Energy Rev. 2010, 14, 2841–2851. [Google Scholar] [CrossRef]
- Molino, A.; Chianese, S.; Musmarra, D. Biomass gasification technology: The state of the art overview. J. Energy Chem. 2015, 25, 10–25. [Google Scholar] [CrossRef]
- Li, X.T.; Grace, J.R.; Lim, C.J.; Watkinson, A.P.; Chen, H.P.; Kim, J.R. Biomass gasification in a circulating fluidized bed. Biomass Bioenergy 2004, 26, 171–193. [Google Scholar] [CrossRef]
- Lv, P.M.; Xiong, Z.H.; Chang, J.; Wu, C.Z.; Chen, Y.; Zhu, J.X. An experimental study on biomass air–steam gasification in a fluidized bed. Bioresour. Technol. 2004, 95, 95–101. [Google Scholar] [CrossRef] [PubMed]
- Gómez-Barea, A.; Arjona, R.; Ollero, P. Pilot-Plant Gasification of Olive Stone: A Technical Assessment. Energy Fuels 2005, 19, 598–605. [Google Scholar] [CrossRef]
- Roos, C.J. Clean Heat and Power Using Biomass Gasification for Industrial and Agricultural Project; U.S. Department of Energy Clean Energy Application Center: Washington, DC, USA, 2010; p. 64.
- Carlassara, L. Modeling and Optimization of Biomass Gasification Systems. Master’s Thesis, Technical University of Denmark, Kongens Lyngby, Denmark, 2009. [Google Scholar]
- Parthasarathy, P.; Narayanan, K.S. Hydrogen production from steam gasification of biomass: Influence of process parameters on hydrogen yield—A review. Renew. Energy 2014, 66, 570–579. [Google Scholar] [CrossRef]
- Matsui, I.; Kunii, D.; Furusawa, T. Study of fluidized bed steam gasification of char by thermogravimetrically obtained kinetics. J. Chem. Eng. Jpn. 1985, 18, 105–113. [Google Scholar] [CrossRef]
- Abad, A.; Gayán, P.; de Diego, L.F.; García-Labiano, F.; Adánez, J. Fuel reactor modelling in chemical-looping combustion of coal: 1. model formulation. Chem. Eng. Sci. 2013, 87, 277–293. [Google Scholar] [CrossRef]
- Abad, A.; Adánez, J.; de Diego, L.F.; Gayán, P.; García-Labiano, F.; Lyngfelt, A. Fuel reactor model validation: Assessment of the key parameters affecting the chemical-looping combustion of coal. Int. J. Greenh. Gas Control 2013, 19, 541–551. [Google Scholar] [CrossRef]
- Kunii, D.; Levenspiel, O. CHAPTER 3—Fluidization and Mapping of Regimes. In Fluidization Engineering, 2nd ed.; Kunii, D., Levenspiel, O., Eds.; Butterworth-Heinemann: Boston, MA, USA, 1991; pp. 61–94. [Google Scholar] [CrossRef]
- Nguyen, N.M.; Alobaid, F.; May, J.; Peters, J.; Epple, B. Experimental study on steam gasification of torrefied woodchips in a bubbling fluidized bed reactor. Energy 2020, 202, 117744. [Google Scholar] [CrossRef]
- Udomsirichakorn, J.; Salam, P.A. Review of hydrogen-enriched gas production from steam gasification of biomass: The prospect of CaO-based chemical looping gasification. Renew. Sustain. Energy Rev. 2014, 30, 565–579. [Google Scholar] [CrossRef]
- Florin, N.H.; Harris, A.T. Hydrogen production from biomass coupled with carbon dioxide capture: The implications of thermodynamic equilibrium. Int. J. Hydrogen Energy 2007, 32, 4119–4134. [Google Scholar] [CrossRef]


| Fluidized Bed Reactor | |
| Temperature (°C) | 800–900 |
| Pressure (bar) | 0.92 |
| Diameter (m) | 0.0545 |
| Height (m) | 0.55 |
| Bed Material (Silica Sand) | |
| Mean particle size (m) | 177 × 10−6 |
| Density (kg/m3) | 2650 |
| Mass weight (kg) | 0.8 |
| Steam | |
| Temperature (°C) | 300 |
| Flow rate (kg/h) | 0–0.084 |
| Concentration (%) | 0–33.33 |
| Species | Method | Range | Unit | Rel. Error in % |
|---|---|---|---|---|
| CO2 | Infrared | 0–100 | Vol.% | <0.5 |
| CO | Infrared | 0–20 | Vol.% | <0.5 |
| CH4 | Infrared | 0–5 | Vol.% | <0.5 |
| H2 | Paramagnetic | 0–20 | Vol.% | <0.5 |
| O2 | Paramagnetic | 0–25 | Vol.% | <0.5 |
| H2O | CO2 | Unit | ||
|---|---|---|---|---|
| k0,H2O | 1.02 × 10¹¹ | k0,CO2 | 9.62 × 10¹⁰ | kPa−1 min−1 |
| Ea1,H2O | 281.86 | Ea1,CO2 | 284.36 | kJ/mol |
| K0,H2O | 60.34 | K0,CO2 | 3.63 | kPa−1 |
| Ea2,H2O | 61.69 | Ea2,CO2 | 40.08 | kJ/mol |
| K0,H2 | 1.56 × 10⁻¹⁰ | K0,CO | 2.24 × 10⁻¹⁰ | kPa−1 |
| Ea3,H2 | −203.46 | Ea3,CO | −195.64 | kJ/mol |
| Property | Value | Note | |
|---|---|---|---|
| Proximate analysis (wt.%) | Moisture | 5.28 | As received |
| Volatile matter | 70.75 | As received | |
| Fixed carbon | 22.82 | As received | |
| Ash | 1.15 | As received | |
| Ultimate analysis (wt.% daf) | C | 54.46 | Dry basis |
| H | 5.99 | Dry basis | |
| O | 39.31 | Dry basis | |
| N | 0.24 | Dry basis | |
| S | 0.00254 | Dry basis | |
| HHV (MJ/kg) | 20.97 | As received | |
| LHV (MJ/kg) | 19.26 | As received | |
| Bulk density (kg/m3) | 161.71 | As received | |
| Mean particle diameter (μm) | 296.65 | Mass-weighted average diameter |
| Component | Wt.% | Component | wt.% |
|---|---|---|---|
| Ash | 1.09 | H2O | 11.05 |
| CO | 46.9 | N2 | 0.22 |
| C | 17.53 | CO2 | 6.69 |
| CH4 | 15.39 | H2S | 0.0025 |
| H2 | 1.12 |
| Parameters | Mean Error | |||||
|---|---|---|---|---|---|---|
| H2 | CO | CO2 | CH4 | Gas Yield | CCE | |
| T (°C) | 0.115 | 0.17 | 0.222 | 0.303 | 0.235 | 0.2 |
| SBR | 0.193 | 0.174 | 0.329 | 0.134 | 0.076 | 0.033 |
Publisher’s Note: MDPI stays neutral with regard to jurisdictional claims in published maps and institutional affiliations. |
© 2021 by the authors. Licensee MDPI, Basel, Switzerland. This article is an open access article distributed under the terms and conditions of the Creative Commons Attribution (CC BY) license (http://creativecommons.org/licenses/by/4.0/).
Share and Cite
Nguyen, N.M.; Alobaid, F.; Epple, B. Process Simulation of Steam Gasification of Torrefied Woodchips in a Bubbling Fluidized Bed Reactor Using Aspen Plus. Appl. Sci. 2021, 11, 2877. https://doi.org/10.3390/app11062877
Nguyen NM, Alobaid F, Epple B. Process Simulation of Steam Gasification of Torrefied Woodchips in a Bubbling Fluidized Bed Reactor Using Aspen Plus. Applied Sciences. 2021; 11(6):2877. https://doi.org/10.3390/app11062877
Chicago/Turabian StyleNguyen, Nhut M., Falah Alobaid, and Bernd Epple. 2021. "Process Simulation of Steam Gasification of Torrefied Woodchips in a Bubbling Fluidized Bed Reactor Using Aspen Plus" Applied Sciences 11, no. 6: 2877. https://doi.org/10.3390/app11062877
APA StyleNguyen, N. M., Alobaid, F., & Epple, B. (2021). Process Simulation of Steam Gasification of Torrefied Woodchips in a Bubbling Fluidized Bed Reactor Using Aspen Plus. Applied Sciences, 11(6), 2877. https://doi.org/10.3390/app11062877