
GIS-Based Evaluation Method for Accessibility of Social Infrastructure Facilities

Abstract
1. Introduction
2. Accessibility
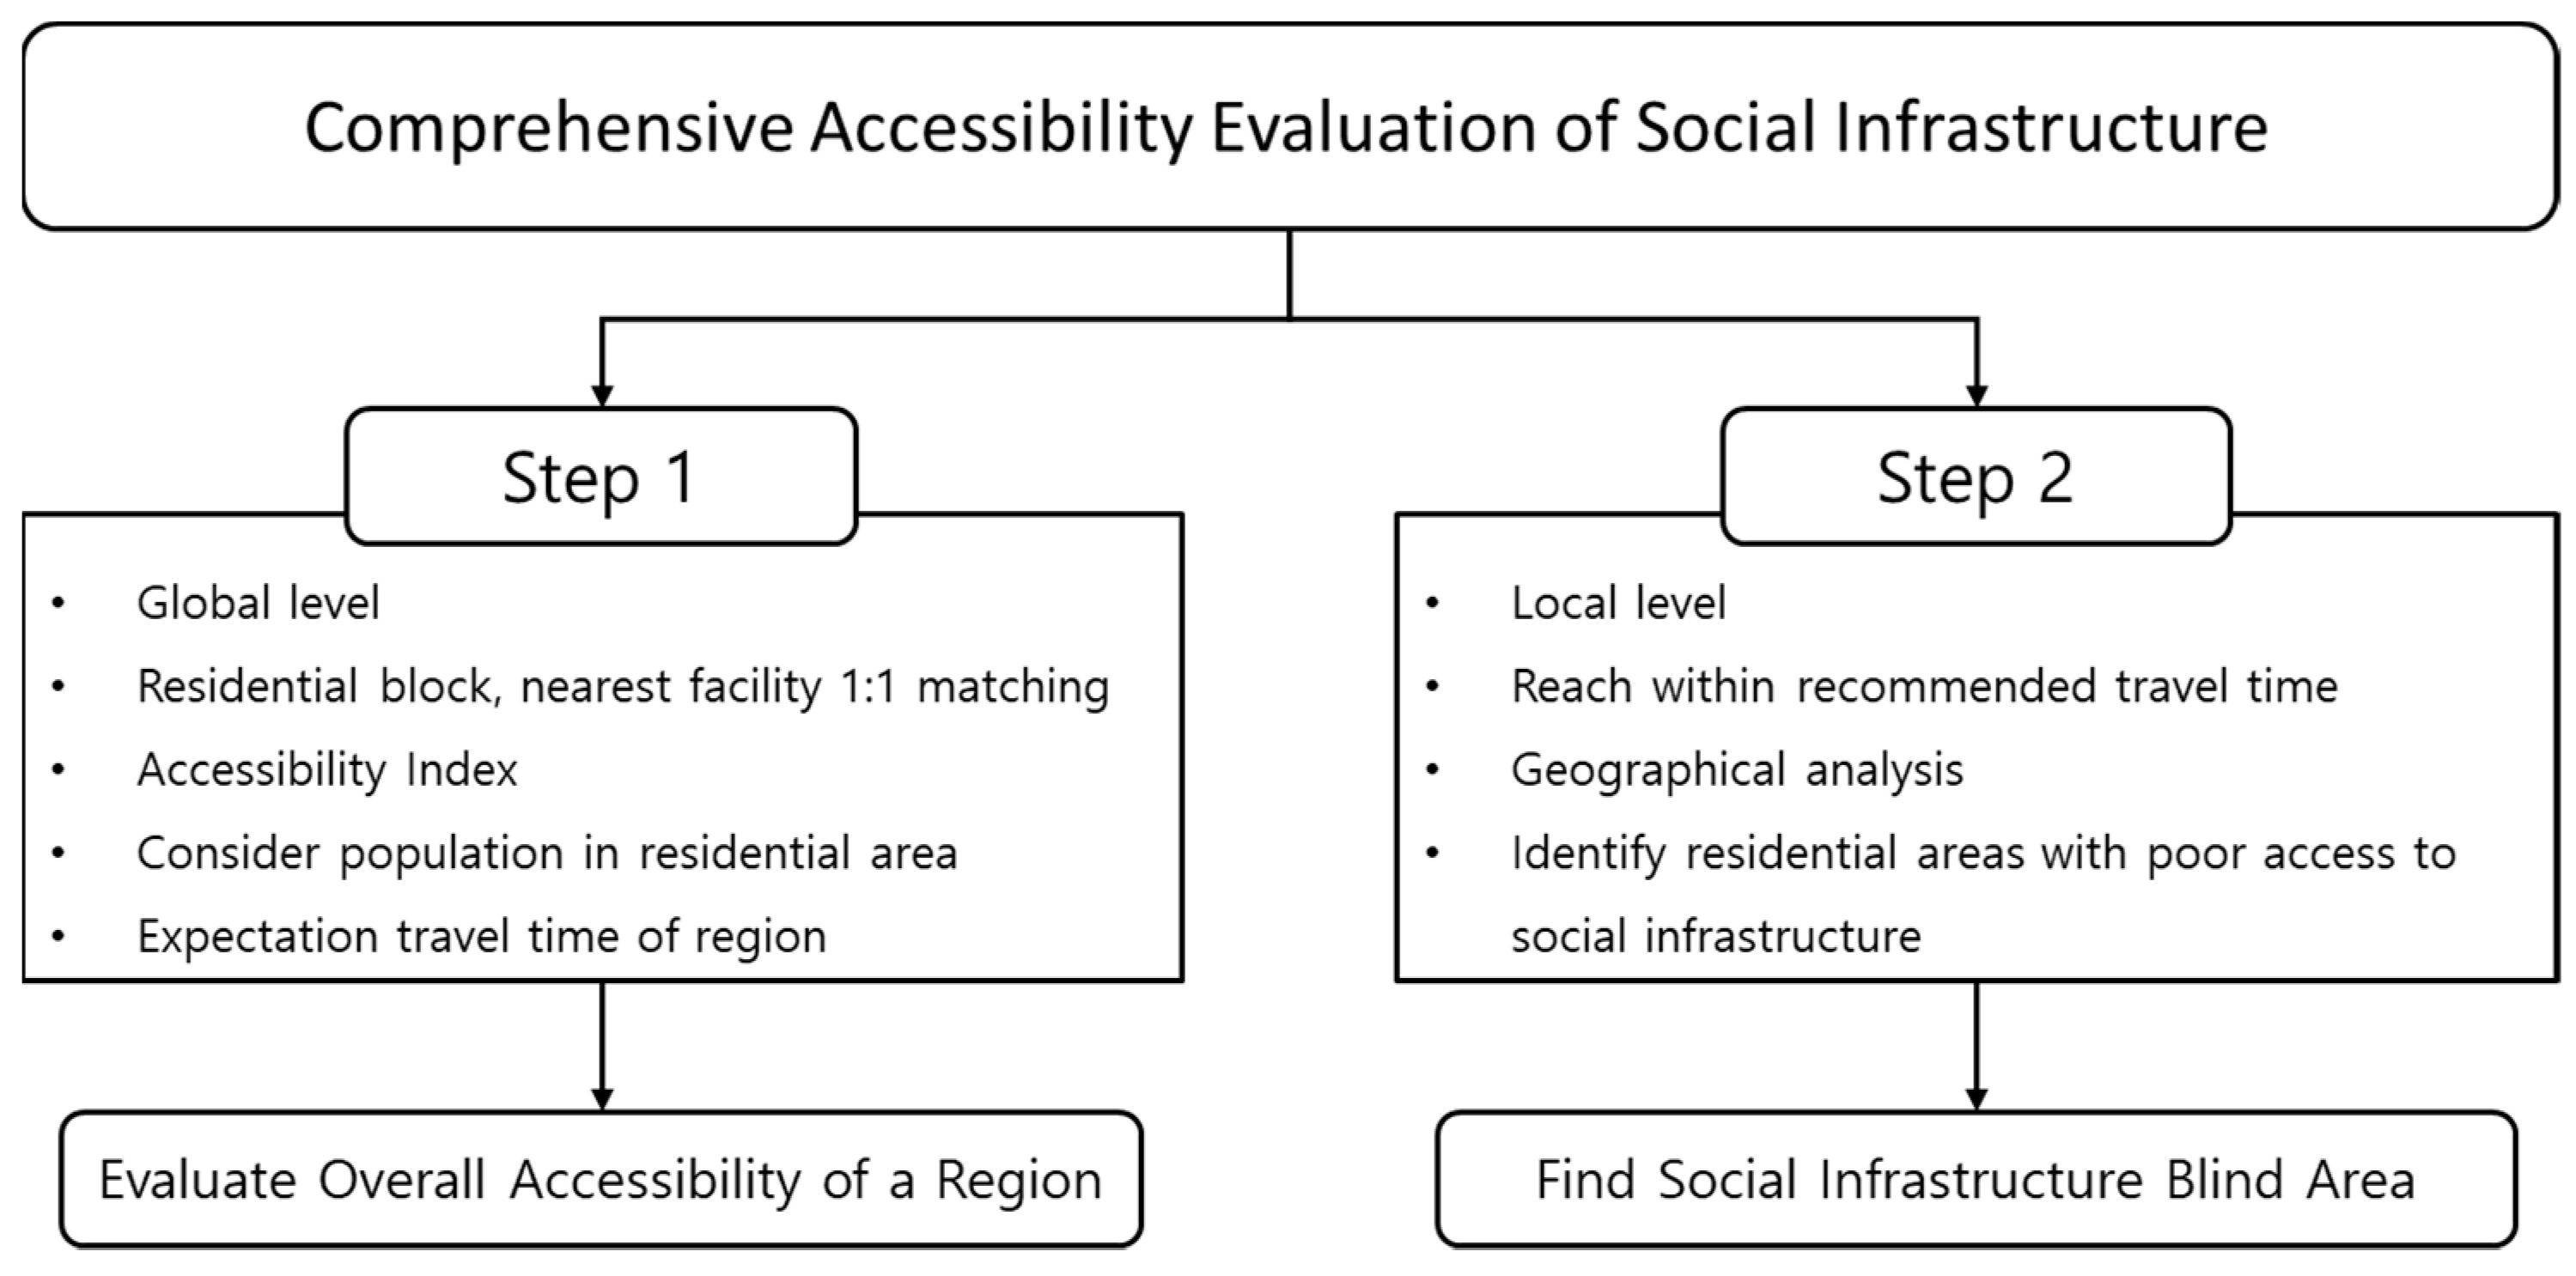
3. Methodology
3.1. Social Infrastructure Planning
3.2. Accessibility Index
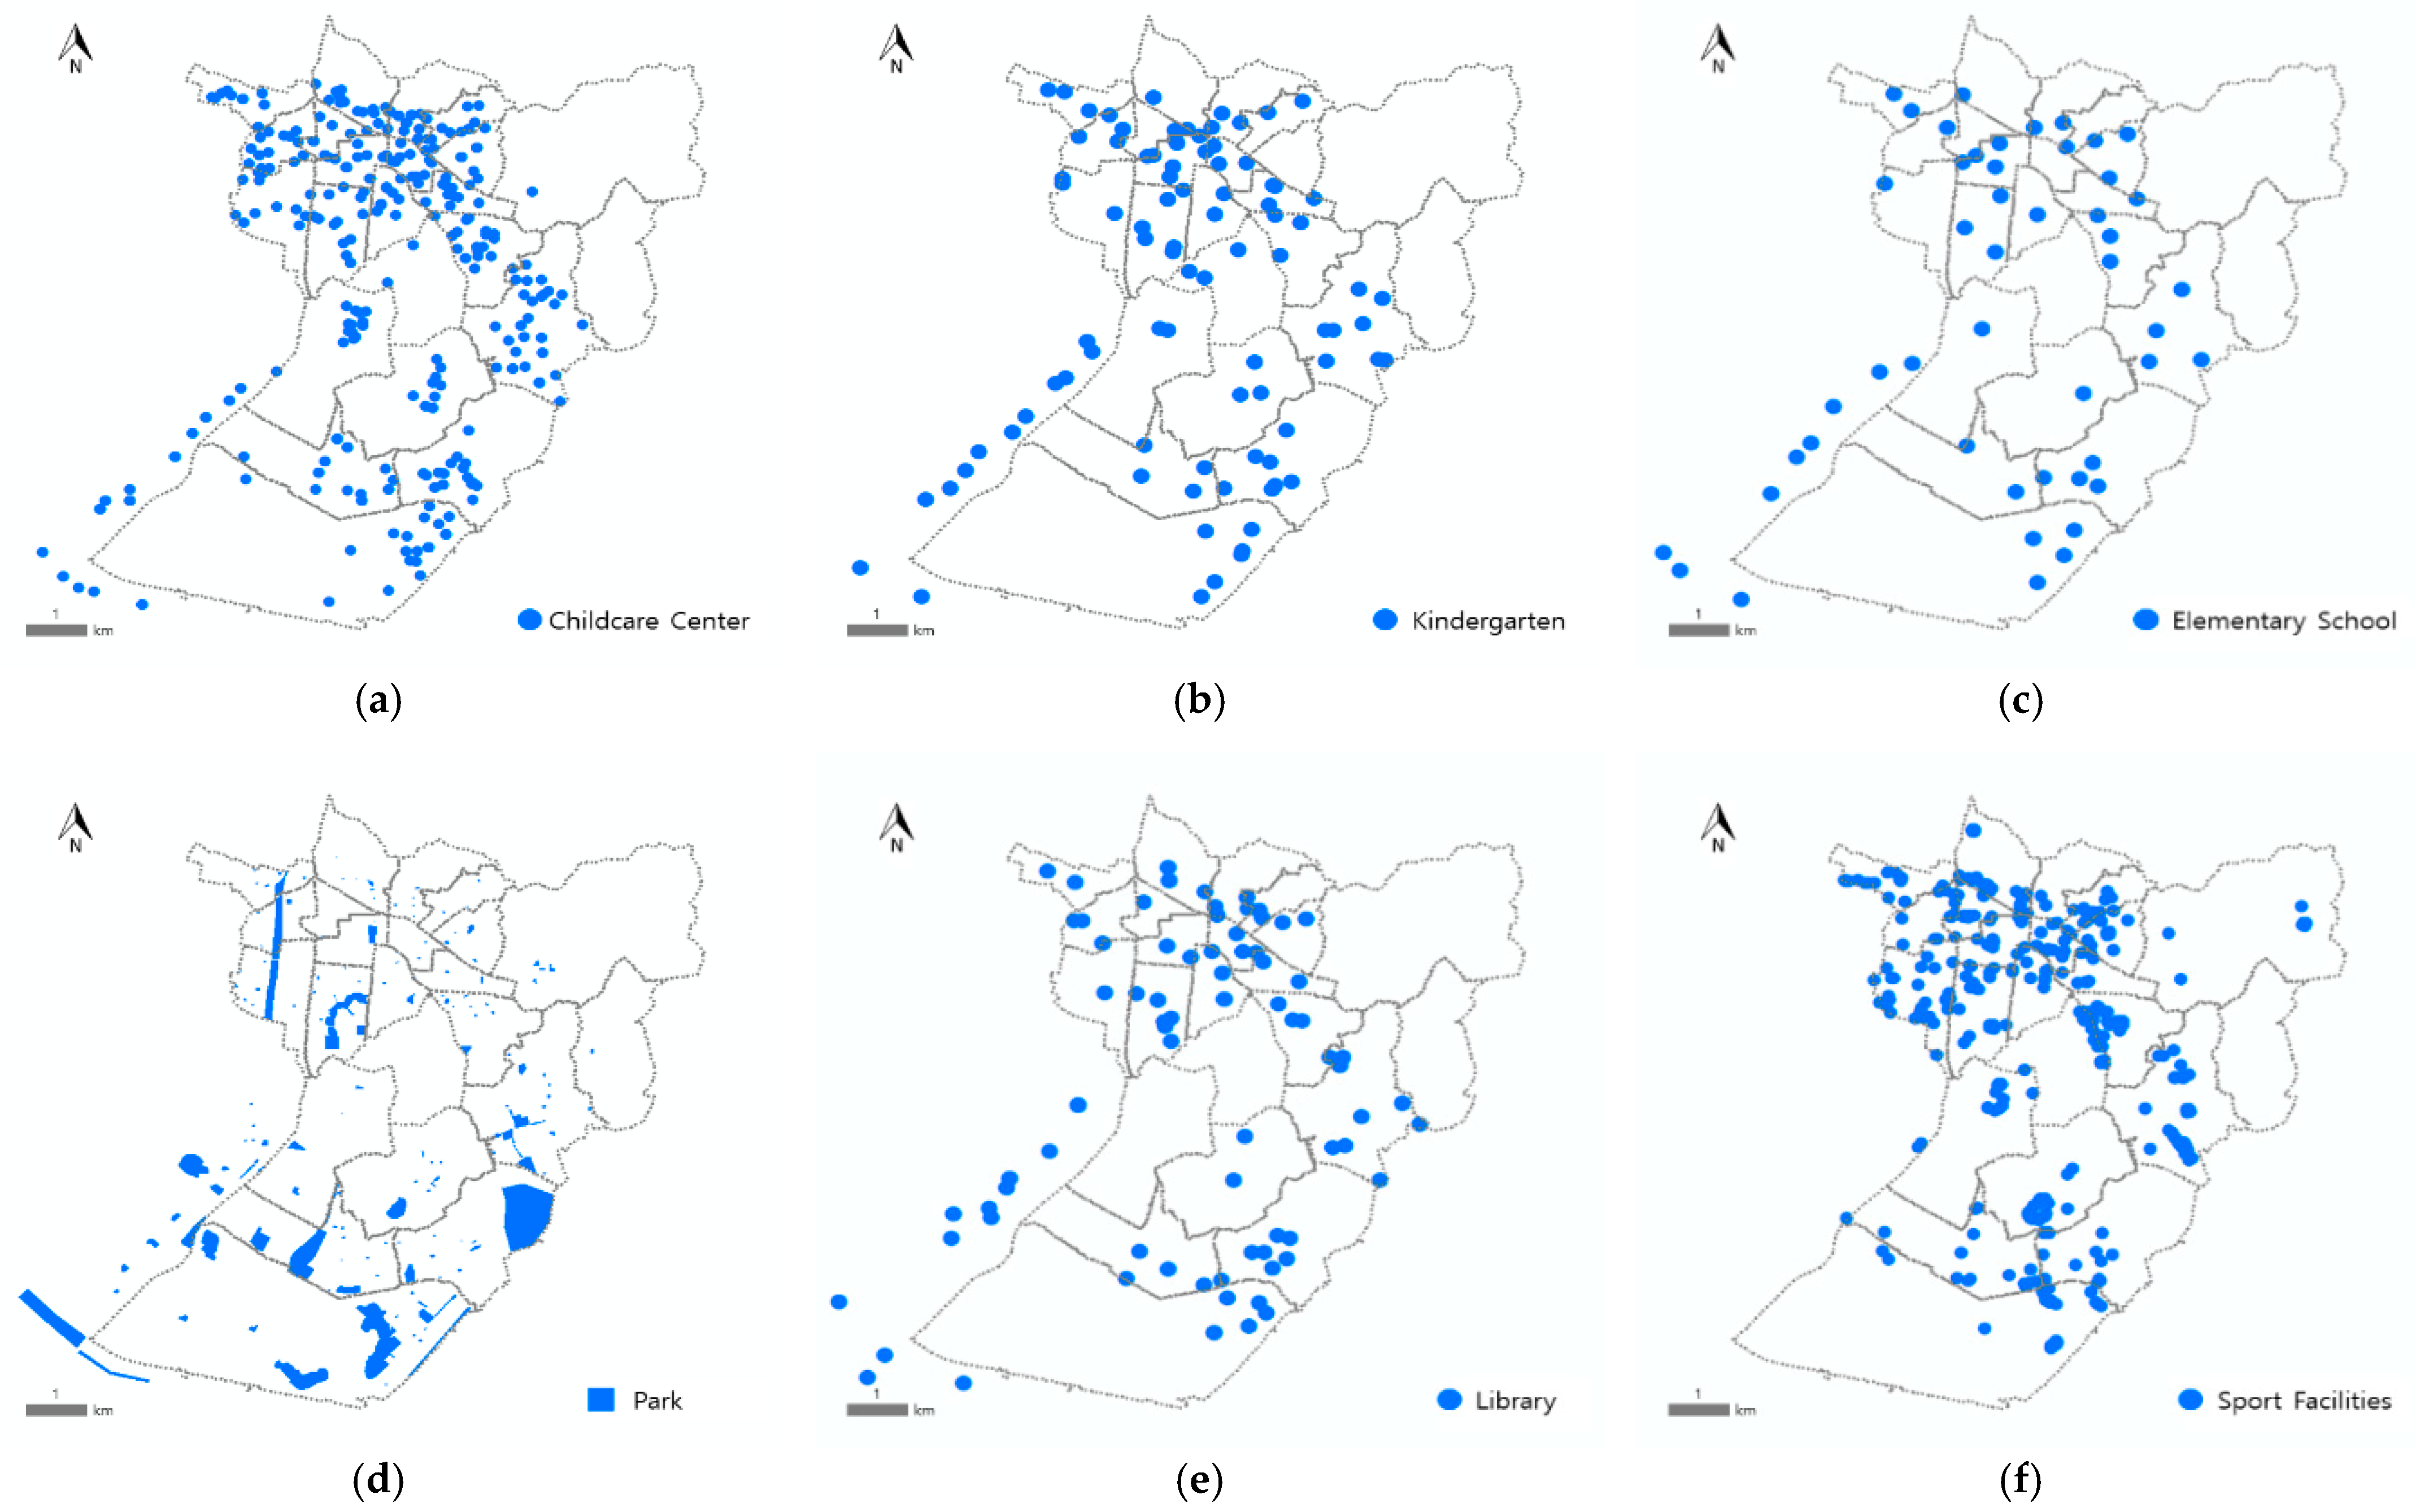
3.3. Data
3.3.1. Spatial Data
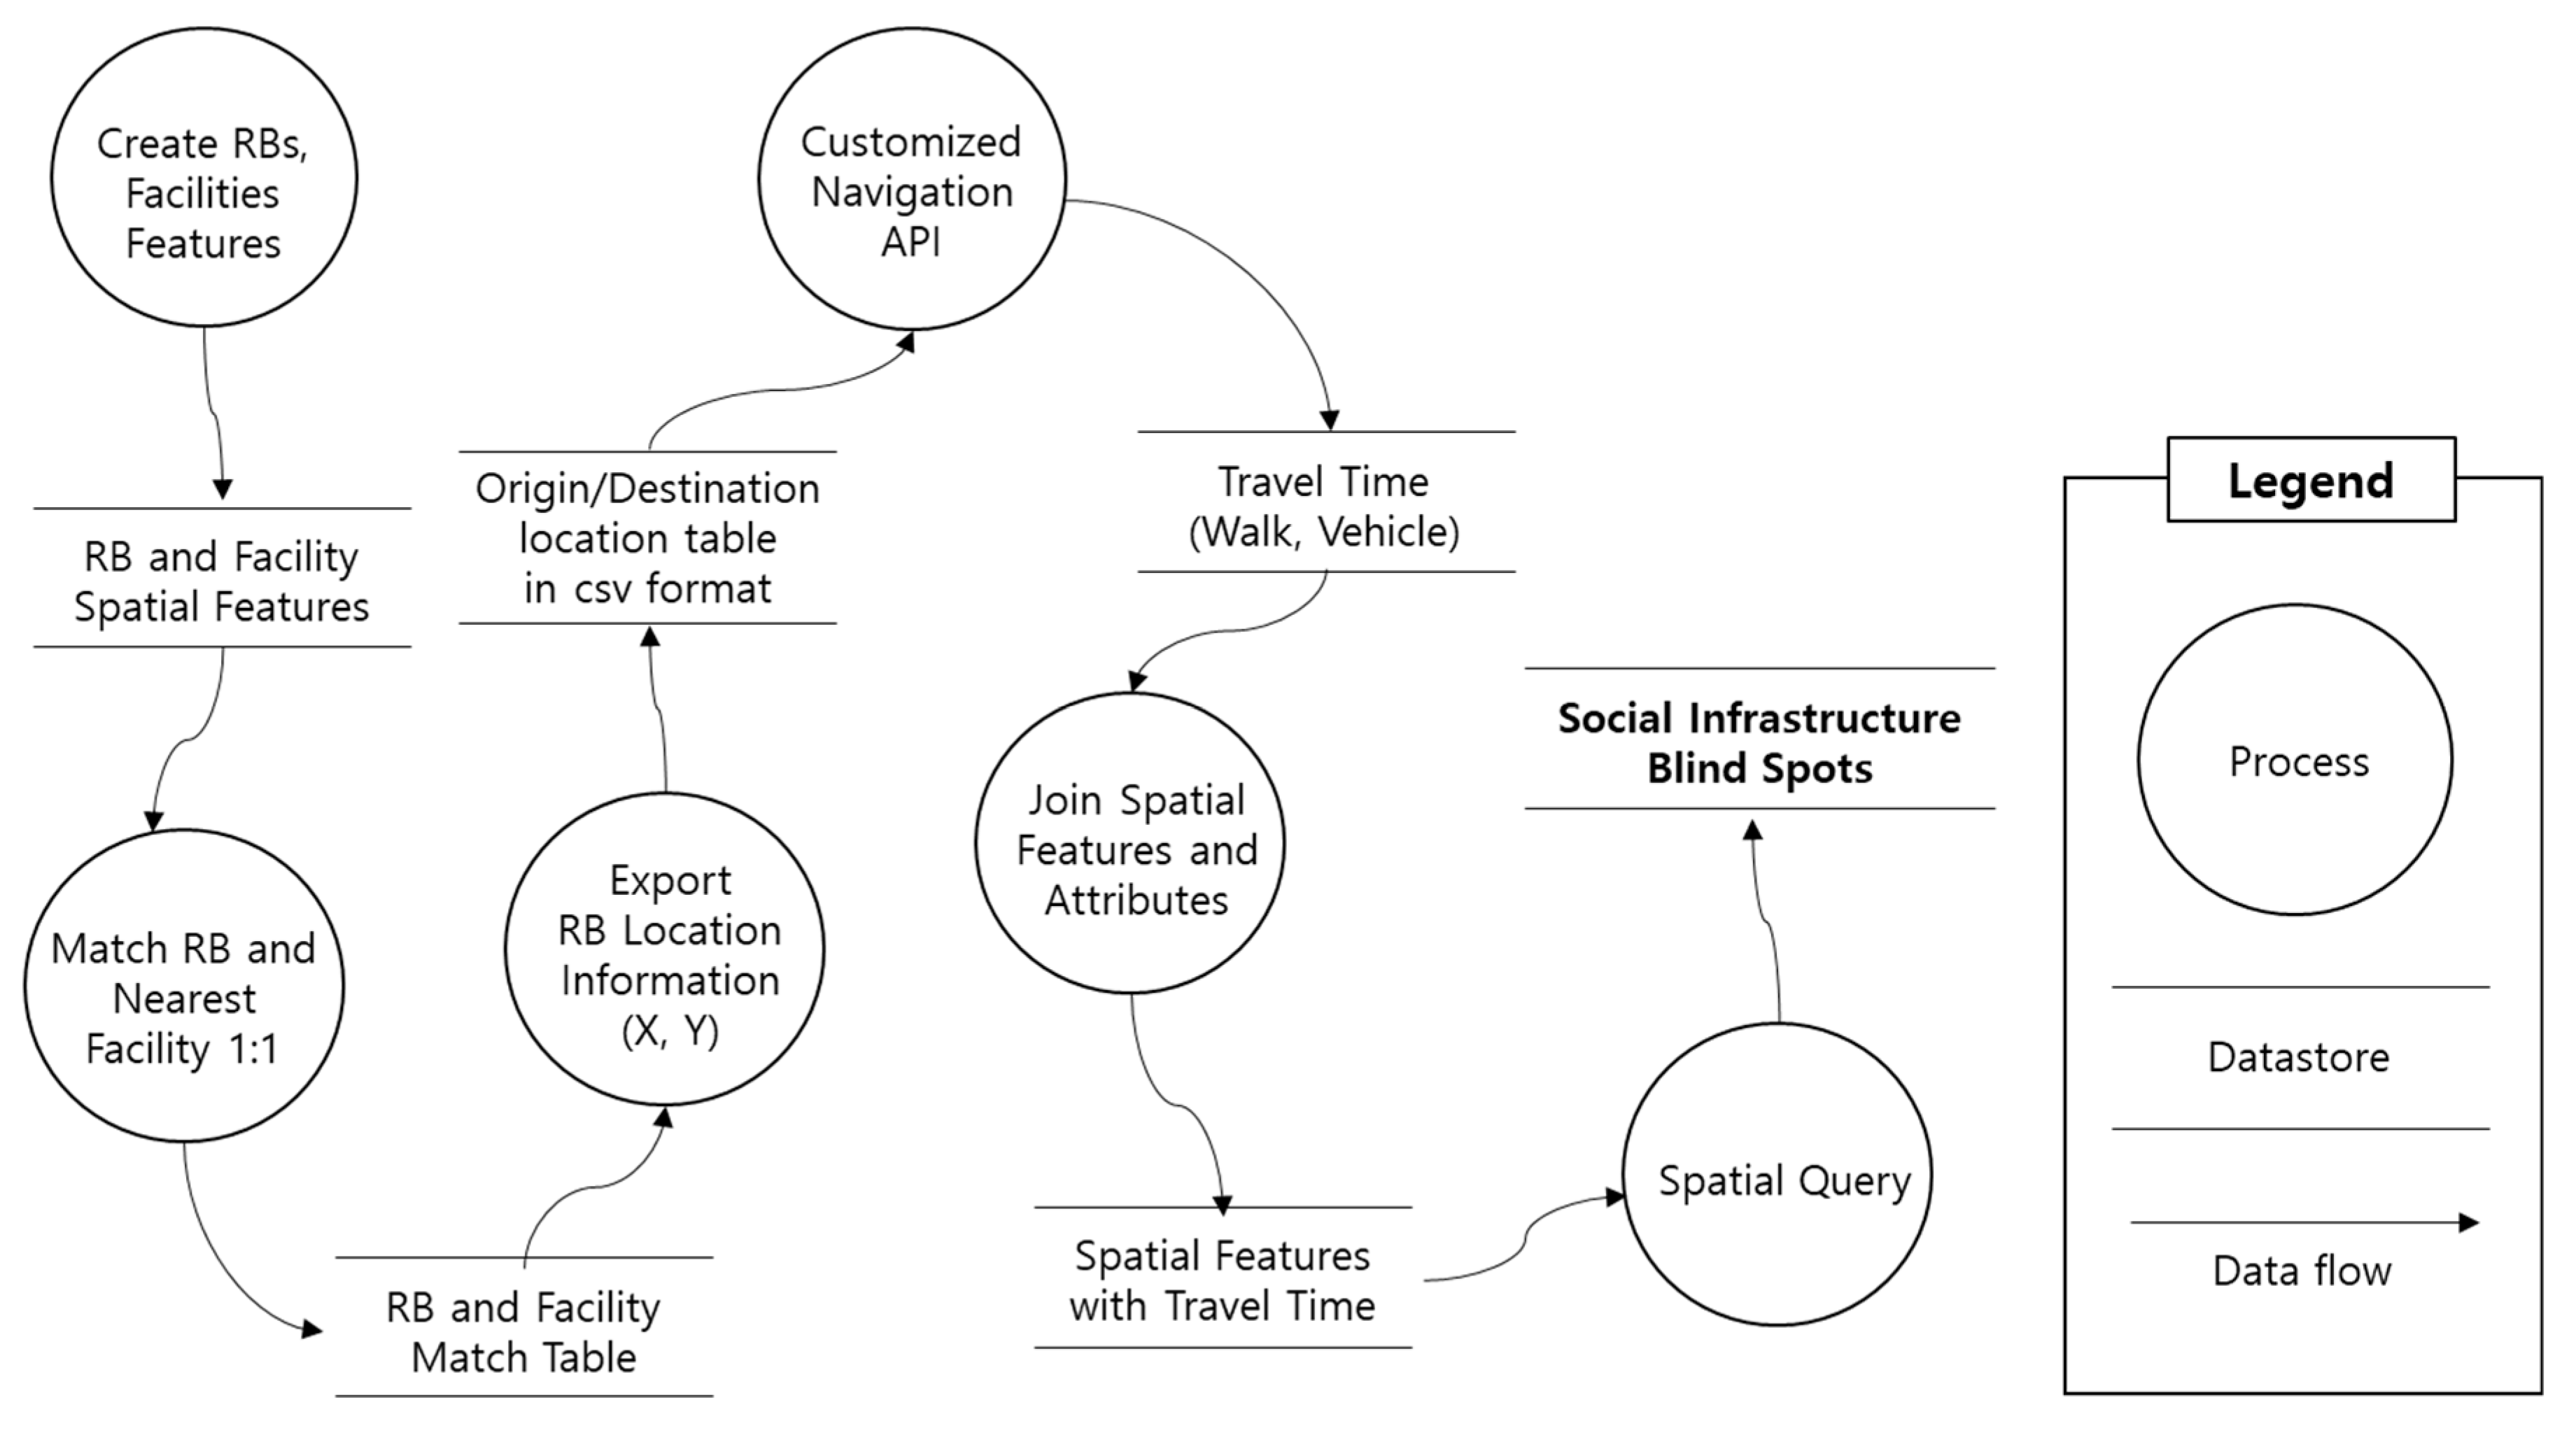
3.3.2. Travel Time Calculation Using Navigation API
3.4. Identifying Social Infrastructure Blind Spot
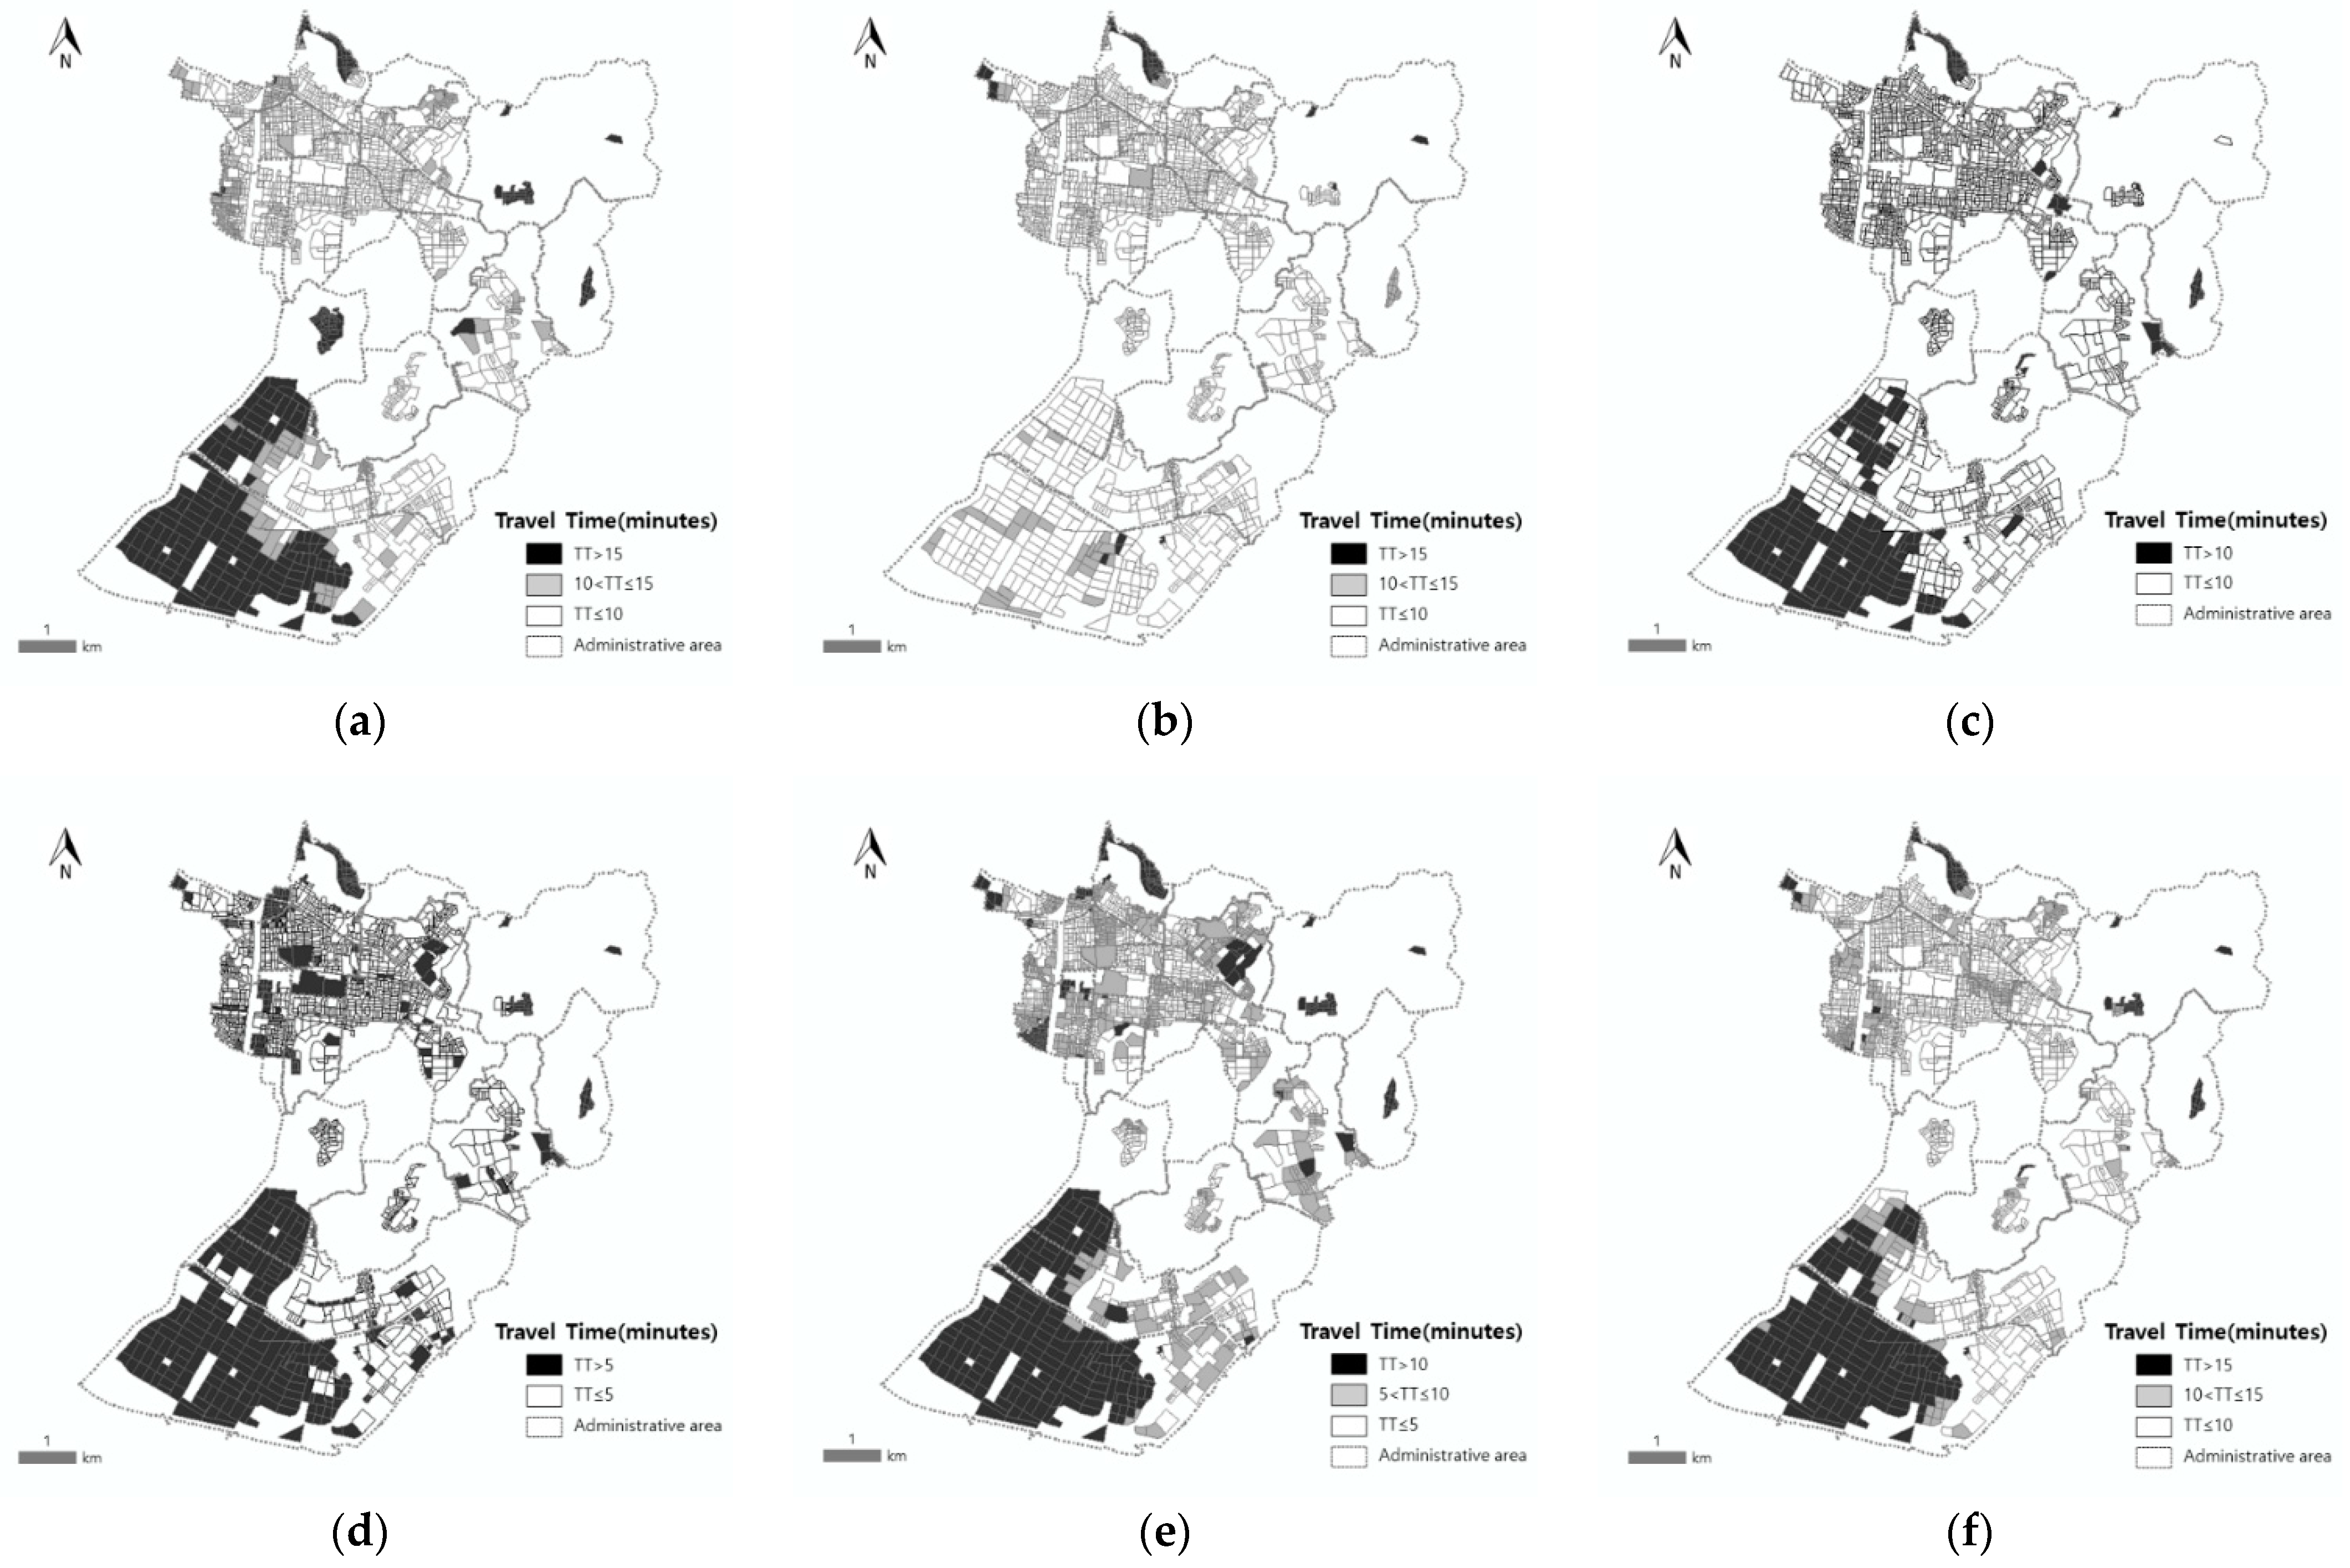
4. Results
4.1. AI
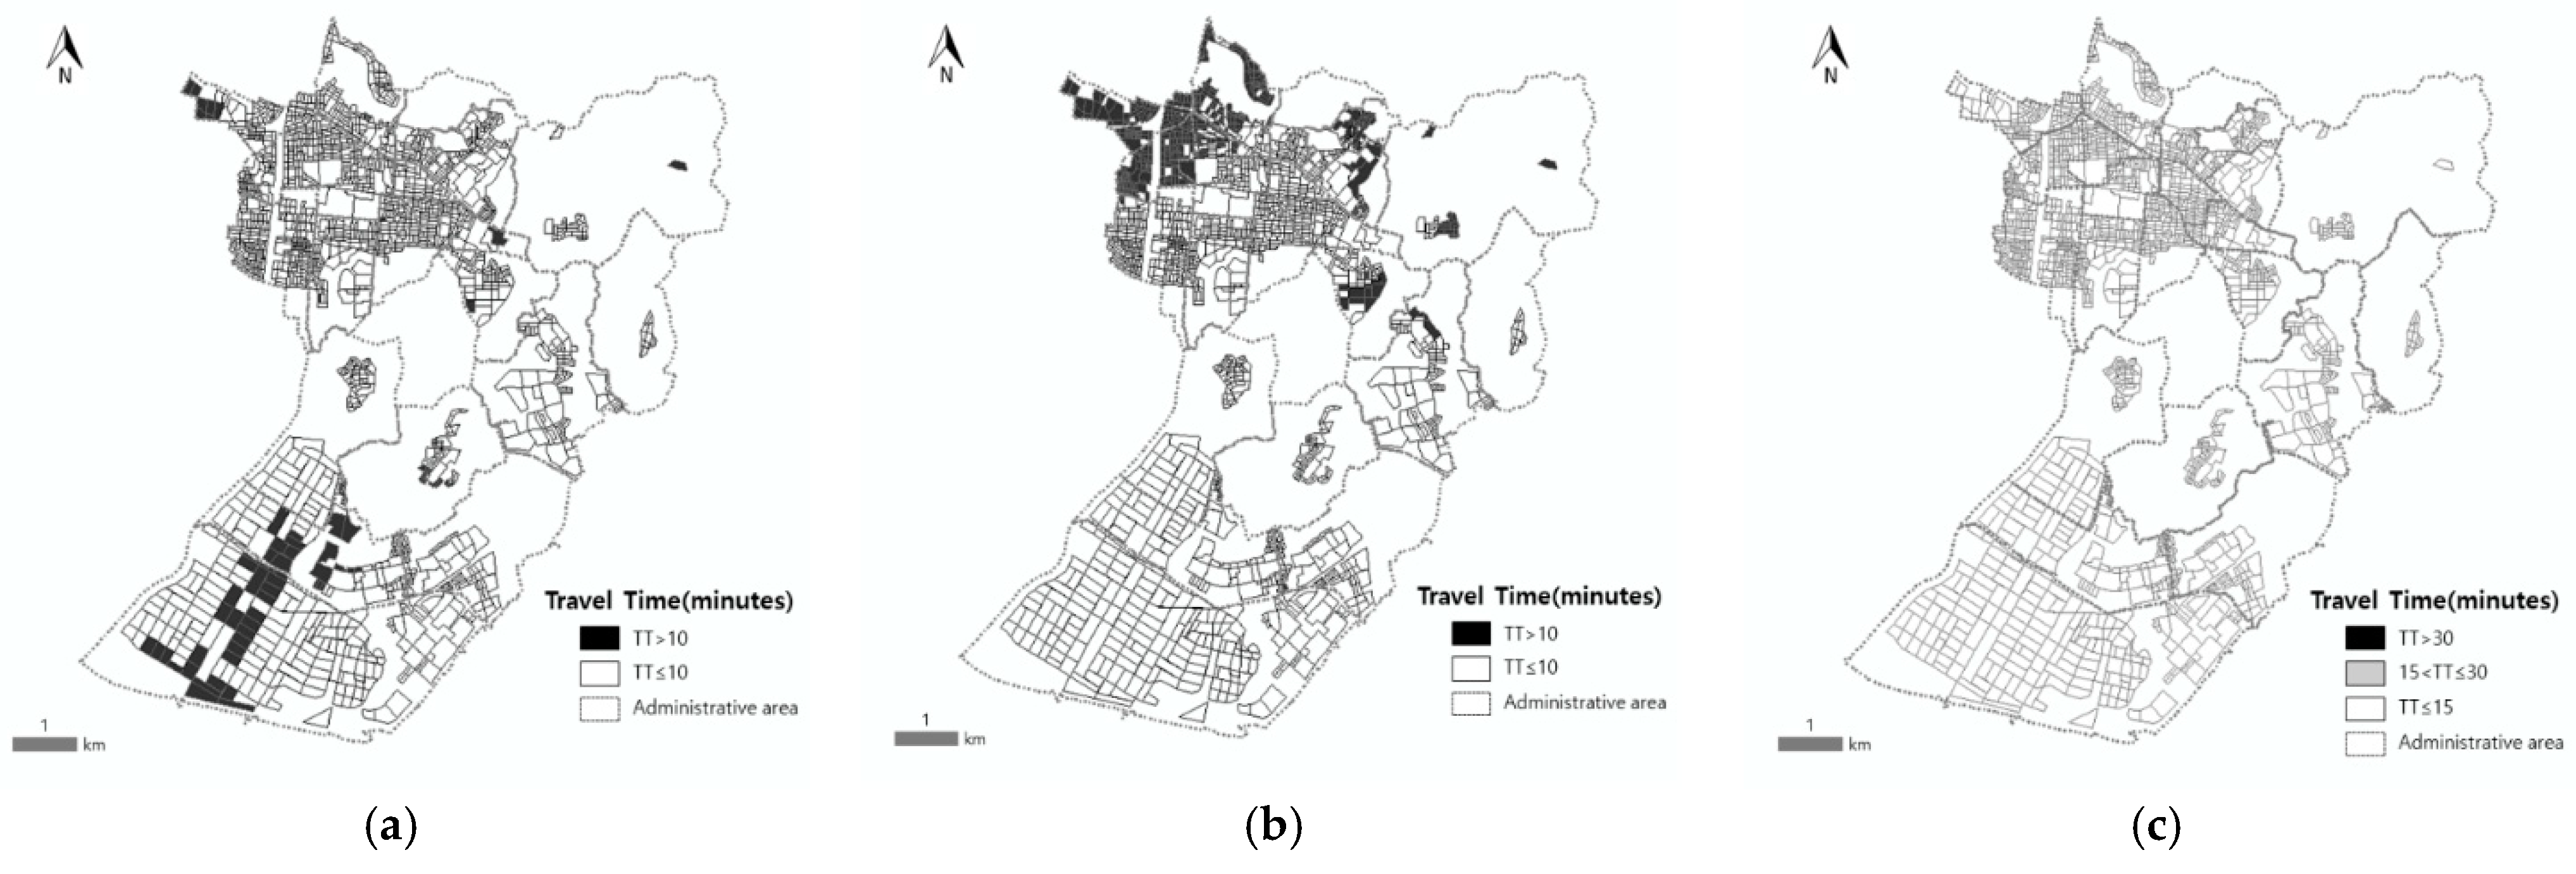
4.2. RBs with Poor Access to Social Infrastructure
5. Discussions
- The travel time used in this study was obtained by navigation API that provided more accurate travel time and distance than those by any other tools. Therefore, the results in this study are closer to the actual value. This has not been attempted in the field of social infrastructure planning. Most previous studies used distance as access data [17,22,25]; however, the travel time may be different even at the same distance, especially in cities.
- The AI is easy to understand because it represents an intuitive index for the overall accessibility in minutes of a region. Accessibility index in a score is difficult to understand and to use to set a goal, even if the relative comparison is possible [23,24,25,31]. Therefore, urban planners can understand and compare the overall accessibility to social infrastructure and identify regional gaps.
- This study suggested a method to identify the residential areas with poor access to social infrastructure and compute the population residing in those areas. The method was applied to an actual case to validate the applicability. The results showed that the method effectively identified residential areas with poor access to social infrastructure. This result can help authorities establish social infrastructure planning when determining which facilities to supply to which area.
- The two-step evaluation method presented in this study provides a comprehensive understanding of the social infrastructure accessibility of a region. Previous studies have often been limited to global evaluation by computing accessibility indices of cities or neighborhoods and showing them on a map [17,22,23,25,31]. However, this study includes not only global evaluation, but also individual residential block-level analysis based on the same database.
6. Conclusions
Author Contributions
Funding
Institutional Review Board Statement
Informed Consent Statement
Conflicts of Interest
References
- United Way of Greater Toronto and Canadian Council on Social Development. Poverty by Postal Code: The Geography of Neighbourhood Poverty, 1981–2001; United Way of Greater Toronto: Toronto, ON, Canada, 2004. [Google Scholar]
- Cronin, B. Guide to Social Infrastructure Planning; Wyndham City Council: Wyndham, VIC, Australia, 2009.
- City of Melbourne. Community Infrastructure Development Framework; City of Melbourne: Melbourne, Australia, 2014.
- Bundesministerium für Verkehr und digitale Infrastruktur. Regionalstrategie Daseinsvorsorge: Leitfaden für die Praxis; Bundesministerium für Verkehr und digitale Infrastruktur: Berlin, Germany, 2016.
- London Plan Team. The Draft London Plan; London Plan Team: London, UK, 2019.
- MLIT (Ministry of Land Infrastructure, Transport and Tourism, Japan). Guidelines for Effective Use of Public Real Estate (PRE) for Community Development; MLIT: Tokyo, Japan, 2014.
- Barton, H.; Tsourou, C. Healthy Urban Planning in Practice: Experience of European Cities; WHO Regional Office for Europe: Copenhagen, Denmark, 2000. [Google Scholar]
- Seong, E.Y.; Lim, Y.K.; Lim, H.S. Accessibility and Availability of Neighborhood Facilities in old Residential Area. In All Public Information In-One; Architecture & Urban Research Institute: Sejong-si, Korea, 2013; pp. 1–151. [Google Scholar]
- Ministry of Land, Infrastructure and Transportation. National City Regeneration Basic Policy Partial Revision (Social Infrastructure Revision of National Minimum Standards); Notice No. 2018-1790; Ministry of Land, Infrastructure and Transportation: Sejong-si, Korea, 2018.
- Lim, Y.-R.; Chu, J.-M.; Shin, J.-Y.; Bae, H.-J.; Park, C.-S. Analysis on the Accessibility to Natural Greenspace and Urban Parks by Income Class Factors-Focusing on Seongnam-si, Gyeonggi-do. J. Korea Plan. Assoc. 2009, 44, 133–146. [Google Scholar]
- Ashiagbor, G.; Ofori-Asenso, R.; Forkuo, E.K.; Agyei-Frimpong, S. Measures of geographic accessibility to health care in the Ashanti Region of Ghana. Sci. Afr. 2020, 9, e00453. [Google Scholar] [CrossRef]
- Wang, D.; Qiao, C.; Liu, S.; Wang, C.; Yang, J.; Li, Y.; Huang, P. Accessibility of Spatial Accessibility to Residential Care Facilities in 2020 in Guangzhou by Small-Scale Residential Community Data. Sustainability 2020, 12, 3169. [Google Scholar] [CrossRef]
- Islam, M.S.; Aktar, S. Measuring physical accessibility to health facilities—A case study on Khulna City. World Health Popul. 2011, 12, 33–47. [Google Scholar] [CrossRef] [PubMed]
- Chen, B.Y.; Cheng, X.-P.; Kwan, M.-P.; Schwanen, T. Evaluation Spatial Accessibility to Healthcare Services under Travel time Uncertainty: A reliability-based floating catchment area approach. J. Transp. Geogr. 2020, 87, 102794. [Google Scholar] [CrossRef]
- Hu, S.; Song, W.; Li, C.; Lu, J. A multi-mode Gaussian-based two-step floating catchment area method for measuring accessibility of urban parks. Cities 2020, 105, 102815. [Google Scholar] [CrossRef]
- Wang, F.; Xu, Y. Estimating O-D Travel Time Matrix by Google Maps API: Implementation, Advantages and Implications. Ann. GIS 2011, 17, 199–209. [Google Scholar] [CrossRef]
- Jin, H.; Jin, F.; Hao, Q.; Zhu, H.; Yang, X. Measuring Public Transit Accessibility Based on Google Direction API. Open Transp. J. 2019, 13, 93–100. [Google Scholar]
- Macintyre, S. Deprivation amplification revisited; or, is it always true that poorer places have poorer access to resources for healthy diets and physical activity? Int. J. Behav. Nutr. Phys. Act. 2007, 4, 32. [Google Scholar] [CrossRef] [PubMed]
- Rodríguez-Espinosa, V.M.; Aguilera-Benavente, F.; Gómez-Delgado, M. Green infrastructure design using GIS and spatial analysis: A proposal for the Henares Corridor (Madrid-Guadalajara, Spain). Landsc. Res. 2020, 45, 26–43. [Google Scholar] [CrossRef]
- Vukmirovic, M.; Gavrilovic, S.; Stojanovic, D. The Improvement of the Comfort of Public Spaces as a Local Initiative in Coping with Climate Change. Sustainability 2019, 11, 6546. [Google Scholar] [CrossRef]
- Victoria State Government. Plan Melbourne 2017–2050. In Metropolitan Planning Strategy; Victoria State Government: Melbourne, Australia, 2017. [Google Scholar]
- Witten, K.; Pearce, J.; Day, P. Neighbourhood Destination Accessibility Index: A GIS tool for measuring infrastructure support for neighbourhood physical activity. Environ. Plan. A 2011, 43, 205–223. [Google Scholar] [CrossRef]
- Malachowski, A.; Dabski, M.; Wilk, W. Accessibility of public services in districts of Warsaw a comparative study. Miscellanea Geographica 2020, 24, 176–182. [Google Scholar] [CrossRef]
- Lotfi, S.; Koohsari, M.J. Measuring objective accessibility to neighborhood facilities in the city (A case study: Zone 6 in Tehran, Iran). Cities 2009, 26, 133–140. [Google Scholar] [CrossRef]
- Ashik, F.R.; Mim, F.R.; Neema, M.N. Towards vertical spatial equity of urban facilities: An integration of spatial and aspatial accessibility. J. Urban Manag. 2020, 9.1, 77–92. [Google Scholar] [CrossRef]
- De Alba-Martínez, H.; Grindlay, A.L.; Ochoa-Covarrubias, G. (In)Equitable Accessibility to Sustainable Transport from Universities in the Guadalajara Metropolitan Area, Mexico. Sustainability 2021, 13, 55. [Google Scholar] [CrossRef]
- Environmental Systems Research Institute (ESRI). ArcMAP 10.6.1; ESRI: Redlands, CA, USA, 2018. [Google Scholar]
- National Spatial Data Infrastructure Portal. Available online: http://www.nsdi.go.kr (accessed on 1 May 2020).
- Administrative Office of Namdong-gu. Available online: http://www.namdong.go.kr (accessed on 15 June 2020).
- Child School Info. Available online: http://e-childschoolinfo.moe.go.kr (accessed on 15 June 2020).
- Mavoa, S.; Witten, K.; McCreanor, T.; O’sullivan, D. GIS based destination accessibility via public transit and walking in Auckland, New Zealand. J. Transp. Geogr. 2012, 20, 15–22. [Google Scholar] [CrossRef]


| Data | Source | Spatial Data Type |
|---|---|---|
| Childcare centers | Child School Info [30] | Point |
| Kindergartens | Child School Info [30] | Point |
| Elementary Schools | Administrative Office [29] | Point |
| Parks | Administrative Office [29] | Polygon |
| Libraries | Administrative Office [29] | Point |
| Sports facilities | Administrative Office [29] | Point |
| Residential blocks | Census Shapes [28] | Point, Polygon |
| Population | Census of Population Data [28] | Text |
| Region | Class | Facility | Description | National Recommendation (min) |
|---|---|---|---|---|
| Town (Walki ng) | Learning | Library | Public, Private, Small library | 10~15 |
| Rest | Park | Neighborhood Park | 10~15 | |
| Athletic | Sports facility | Pool, Playground, PE Studio | Less than 10 | |
| Care | Childcare center | Public, Private | Less than 5 | |
| Education | Kindergarten | Public, Private | 5~10 | |
| Elementary school | - | 10~15 | ||
| City (Vehicle) | Learning | City library | Public | Less than 10 |
| Rest | City Park | Over 100,000 | Less than 10 | |
| Athletic | Sports facility | Stadium, Gym, Pool | 15~30 |
| Dong | Population | Population (%) | Library (min) | Park (min) | Sports Facility (min) | Childcare Center (min) | Kindergarten (min) | Elementary School (min) |
|---|---|---|---|---|---|---|---|---|
| Ganseok1 | 23,975 | 4.5 | 5.9 | 3.9 | 4.1 | 2.4 | 4.4 | 8.0 |
| Ganseok2 | 23,856 | 4.5 | 7.6 | 5.9 | 3.9 | 5.0 | 6.2 | 8.2 |
| Ganseok3 | 25,616 | 4.8 | 5.9 | 3.7 | 3.8 | 3.6 | 6.7 | 8.0 |
| Ganseok4 | 26,723 | 5.0 | 7.6 | 6.1 | 3.7 | 3.7 | 6.4 | 7.7 |
| Guwol1 | 32,488 | 6.1 | 4.3 | 3.1 | 3.5 | 2.8 | 5.1 | 5.6 |
| Guwol2 | 38,472 | 7.3 | 6.1 | 6.8 | 3.8 | 7.8 | 5.2 | 5.2 |
| Guwol3 | 27,196 | 5.1 | 8.7 | 3.2 | 2.9 | 3.6 | 6.5 | 8.7 |
| Guwol4 | 16,487 | 3.1 | 4.2 | 2.8 | 2.8 | 2.7 | 4.6 | 7.6 |
| Nonhyeon1 | 33,545 | 6.3 | 4.9 | 4.2 | 4.2 | 3.3 | 5.6 | 6.8 |
| Nonhyeon2 | 32,550 | 6.1 | 7.1 | 3.7 | 3.4 | 3.3 | 6.2 | 8.2 |
| Mansu1 | 16,597 | 3.1 | 4.7 | 2.9 | 6.8 | 2.6 | 5.0 | 7.3 |
| Mansu2 | 25,424 | 4.8 | 7.4 | 4.1 | 2.9 | 2.7 | 5.5 | 8.4 |
| Mansu3 | 18,070 | 3.4 | 4.1 | 2.5 | 2.4 | 1.8 | 2.8 | 3.7 |
| Mansu4 | 23,559 | 4.4 | 6.2 | 3.4 | 5.2 | 4.1 | 10.8 | 6.0 |
| Mansu5 | 16,336 | 3.1 | 3.8 | 3.7 | 2.4 | 2.2 | 3.7 | 8.4 |
| Mansu6 | 26,441 | 5.0 | 4.7 | 4.0 | 3.9 | 2.9 | 5.7 | 5.4 |
| Nonhyeon-gojan | 41,503 | 7.8 | 7.1 | 3.2 | 6.3 | 3.1 | 6.3 | 6.5 |
| Dorim | 9550 | 1.8 | 7.1 | 3.5 | 5.1 | 2.1 | 4.7 | 7.8 |
| Seochang | 54,513 | 10.3 | 8.3 | 5.3 | 5.3 | 3.4 | 7.5 | 7.3 |
| Unyeon | 454 | 0.1 | 24.7 | 13.7 | 27.9 | 24.1 | 28.6 | 29.3 |
| Jangsu | 4678 | 0.9 | 24.9 | 2.9 | 4.6 | 5.4 | 16.2 | 16.2 |
| Namchon | 12,538 | 2.4 | 21.0 | 3.0 | 2.4 | 2.2 | 4.3 | 4.6 |
| Min | 454 | 0.1 | 3.8 | 2.5 | 2.4 | 1.8 | 2.8 | 3.7 |
| Max | 54,513 | 10.3 | 24.9 | 13.7 | 27.9 | 24.1 | 28.6 | 29.3 |
| Average | 24,417 | 4.5 | 8.5 | 4.3 | 5.1 | 4.3 | 7.2 | 8.4 |
| Dong | Population | Population (%) | City Library (min) | City Park (min) | Sports Facility (min) |
|---|---|---|---|---|---|
| Ganseok1 | 23,975 | 4.5 | 3.2 | 12.7 | 5.5 |
| Ganseok2 | 23,856 | 4.5 | 3.9 | 10.2 | 5.1 |
| Ganseok3 | 25,616 | 4.8 | 1.8 | 9.9 | 3.3 |
| Ganseok4 | 26,723 | 5.0 | 7.3 | 17.7 | 6.5 |
| Guwol1 | 32,488 | 6.1 | 5.7 | 2.0 | 5.8 |
| Guwol2 | 38,472 | 7.3 | 4.8 | 5.7 | 6.4 |
| Guwol3 | 27,196 | 5.1 | 4.9 | 6.0 | 8.3 |
| Guwol4 | 16,487 | 3.1 | 4.2 | 2.5 | 3.6 |
| Nonhyeon1 | 33,545 | 6.3 | 6.4 | 4.7 | 5.4 |
| Nonhyeon2 | 32,550 | 6.1 | 9.8 | 3.4 | 6.0 |
| Mansu1 | 16,597 | 3.1 | 7.3 | 4.7 | 4.1 |
| Mansu2 | 25,424 | 4.8 | 4.3 | 9.0 | 5.6 |
| Mansu3 | 18,070 | 3.4 | 3.4 | 6.6 | 6.5 |
| Mansu4 | 23,559 | 4.4 | 6.6 | 9.3 | 2.7 |
| Mansu5 | 16,336 | 3.1 | 4.5 | 4.0 | 4.0 |
| Mansu6 | 26,441 | 5.0 | 7.7 | 9.7 | 2.6 |
| Nonhyeon-gojan | 41,503 | 7.8 | 4.0 | 4.4 | 7.5 |
| Dorim | 9550 | 1.8 | 8.6 | 3.7 | 3.5 |
| Seochang | 54,513 | 10.3 | 5.2 | 6.3 | 4.8 |
| Unyeon | 454 | 0.1 | 6.3 | 9.1 | 6.4 |
| Jangsu | 4678 | 0.9 | 7.0 | 11.6 | 7.1 |
| Namchon | 12,538 | 2.4 | 6.4 | 6.5 | 1.0 |
| Min | 454 | 0.1 | 1.8 | 2.0 | 1.0 |
| Max | 54,513 | 10.3 | 9.8 | 17.7 | 8.3 |
| Average | 24,417 | 4.5 | 5.6 | 7.3 | 5.1 |
| Facility Type | National Recommendation (min) | Population | Percent |
|---|---|---|---|
| Library | TT * ≤ 10 | 435,103 | 82% |
| 10 < TT ≤ 15 | 68,980 | 13% | |
| TT > 15 | 26,531 | 5% | |
| Park | TT ≤ 10 | 509,389 | 96% |
| 10 < TT ≤ 15 | 19,102 | 3.6% | |
| TT > 15 | 2122 | 0.4% | |
| Sports Facility | TT ≤ 10 | 509,389 | 96% |
| TT > 10 | 21,225 | 4% | |
| Childcare Center | TT ≤ 5 | 419,184 | 79% |
| TT > 5 | 111,429 | 21% | |
| Kindergarten | TT ≤ 5 | 233,470 | 44% |
| 5 < TT ≤ 10 | 244,082 | 46% | |
| TT > 10 | 53,061 | 10% | |
| Elementary School | TT ≤ 10 | 451,021 | 85% |
| 10 < TT ≤ 15 | 68,980 | 13% | |
| TT > 15 | 10,612 | 2% |
| Facility Type | National Recommendation (min) | Population | Percent |
|---|---|---|---|
| City Library | TT * ≤ 10 | 504,082 | 95% |
| TT > 10 | 26,531 | 5% | |
| City Park | TT * ≤ 10 | 408,572 | 77% |
| TT > 10 | 122,041 | 23% | |
| Sports Facility | TT ≤ 15 | 530,613 | 100% |
| 15 < TT ≤ 30 | 0 | 0% | |
| TT > 30 | 0 | 0% |
Publisher’s Note: MDPI stays neutral with regard to jurisdictional claims in published maps and institutional affiliations. |
© 2021 by the authors. Licensee MDPI, Basel, Switzerland. This article is an open access article distributed under the terms and conditions of the Creative Commons Attribution (CC BY) license (https://creativecommons.org/licenses/by/4.0/).
Share and Cite
Yhee, H.; Kim, S.; Kang, S. GIS-Based Evaluation Method for Accessibility of Social Infrastructure Facilities. Appl. Sci. 2021, 11, 5581. https://doi.org/10.3390/app11125581
Yhee H, Kim S, Kang S. GIS-Based Evaluation Method for Accessibility of Social Infrastructure Facilities. Applied Sciences. 2021; 11(12):5581. https://doi.org/10.3390/app11125581
Chicago/Turabian StyleYhee, Hayeon, Sungpyo Kim, and Sanghyeok Kang. 2021. "GIS-Based Evaluation Method for Accessibility of Social Infrastructure Facilities" Applied Sciences 11, no. 12: 5581. https://doi.org/10.3390/app11125581
APA StyleYhee, H., Kim, S., & Kang, S. (2021). GIS-Based Evaluation Method for Accessibility of Social Infrastructure Facilities. Applied Sciences, 11(12), 5581. https://doi.org/10.3390/app11125581