Article

BIM-GIS-Based Integrated Framework for Underground Utility Management System for Earthwork Operations

1
Department of Construction Engineering & Management, College of Civil Engineering, National University of Sciences and Technology (NUST), Risalpur Campus, Islamabad 44000, Pakistan
2
Department of Civil & Environmental Engineering, Hanyang University, Seoul 04763, Korea
3
Communication & Works Department, Khyber Pakhtunkhwa 25000, Pakistan
*
Authors to whom correspondence should be addressed.
These authors contributed equally to this work as corresponding author.
Appl. Sci. 2021, 11(12), 5721; https://doi.org/10.3390/app11125721
Submission received: 12 May 2021 / Revised: 2 June 2021 / Accepted: 9 June 2021 / Published: 20 June 2021

Abstract

:
Underground utilities are important assets that provide basic services for society’s daily life. They are generally very complex and remain unnoticed until they fail due to any particular reason. The stakeholders involved in the design, construction, and maintenance of utility infrastructure face many problems due to the traditional underground utility management system, resulting in injuries, loss of life, disruptions, project delays, and financial loss. The problem with the traditional system is that it uses 2D drawings and keeps unreliable information or a lack of updated information, which makes it an inefficient utility management system. With the advancement in construction information technology, we can address this effectively by integrating BIM and GIS. In this paper, a novel integrated BIM-GIS framework for underground utility management systems was developed on the basis of IFC to CityGML mapping. It provides an effective underground utility management system that facilitates designers in optimization of the design, assists in the excavator’s operator by providing real-time three-dimensional spatial information during the construction process, and acts as an as-built information database for utility facility management. For validation, a real-time project case study indicated that the proposed system can effectively provide comprehensive underground utility information at different project stages.

1. Introduction

1.1. Background

Underground utilities provide supplies of water, gas, electricity, and telecommunication so citizens can carry out their daily basic needs of life without any interruptions. However, due to the unavailability of data and the complexity of underground utilities, it is one of the major risks in earthwork operations. The poor information management of utility infrastructure leads towards utility damage, injuries, fatalities, disruptions, and project delays. Furthermore, it can lead to the direct and indirect financial impact on the construction projects, and direct financial impacts are easy to estimate. In contrast, indirect financial losses are complicated to quantify and address [1]. Underground space construction contains a large amount of risks [2]. Precise and detailed information about 3D geographic ground and underground infrastructure is needed to address the associated problem to facilitate in the design, construction, and maintenance stages.
Various countries have defined rules and regulations of pre-marking with flags, paint marks, and stakes for the excavation in the vicinity of utility lines. Implementation of these rules and regulations is not enough to avoid utility strikes. One of the main reasons for these strikes is the lack of information from as-built drawings regarding the depth, size, orientation, and exact location of buried utility [3]. Information about the existing utilities is insufficient and inaccurate in records to identify the true location of the utility before excavation [4]. Most of the information on underground utilities is provided in two-dimensional (2D) maps, making it very difficult to identify the utilities in the same coordinates and creating a large amount of confusion among excavation workers [5].
3D modeling and design tools enable construction managers and stakeholders to visualize real-world infrastructures that better understand construction projects at different life stages. Several researchers have worked in recent years to visualize the underground utilities in three-dimensional (3D) space. 3D visualization during the excavation work in earthwork projects has evolved in the last decade, and 3D design methodologies for earthwork sections have been standardized [6]. However, there is a lack of a mechanism for developing 3D models for the management of underground utilities and standardization of the process during the lifecycle of the projects. At the design stage, BIM models provide a better understanding to the stakeholder of the project [7]. During the construction, 3D technology uses automation techniques such as GPS machine guidance that links the 3D model with the construction equipment to guide the equipment operation with excellent accuracy and precision. There is an increase in interest in the 3D visualization of underground pipes, whereas this process is quite challenging [8]. At the operation and maintenance phase, 3D information about the existing assets such as underground utilities is very useful.
Different methodologies can be adopted for the 3D visualization of the underground utilities. It is very important to use a technique that clearly distinguishes each utility and precise location [5]. Furthermore, the surrounding environment, such as terrain, existing utilities, and other facilities, is important to consider as it can hugely impact construction activities. Geographic information system (GIS) provides information about existing facilities in a wider geographic context. Building information modeling (BIM) stores, manage, visualize, and interprets project information over the lifecycle. BIM technology allows for the construction managers to visualize the utility planning and design information during excavation work [9]. The advantages of BIM are providing rich 3D geometric and semantic information [10], while GIS supports the geospatial models with accurate coordinate information that helps in geovisualization-based decision making. GIS also allows for storing and managing the spatial information associated with the spatial feature, such as utility pipes in the relational database, that facilitate utility management.
GIS technology allows for spatial analysis on a larger geospatial scale using functional and physical spatial relationships; however, it lacks information about the assets. For example, the need and interest of utility infrastructure authorities are not limited to only planning information such as alignments and profiles, but also as-design and as-built information, which is not usually available in the GIS database [11]. On the other hand, BIM can provide comprehensive and detailed as-designed and as-built information about each existing and new facility [12]. Such capability of BIM can strongly enhance the traditional contextual GIS information and analysis of utility infrastructure. However, BIM lacks geospatial capabilities, which is also very important for long utility infrastructure. Therefore, the integrated BIM-GIS workflow is suggested to be a very helpful and crucial step forward in the visualization, management, and analysis of utility infrastructure.
The integrated BIM-GIS application in the utility infrastructure supports effective management of utility information over the different stages such as planning, designing, construction, and post-construction. The information in such an integrated system will be available for different applications. Many researchers have put effort to enhance the project workflow, such as heritage facility management [13,14], supply chain management information in the construction stage [15], emergency response [16], pedestrian route planning [17], assessment of building energy [18], and climate adaption [19]. This integration area is a fast-growing trend in recent years; however, it is still in the state of infancy in construction management for the utility infrastructure.
Despite the wide application of BIM-GIS in construction management, it is not easy to integrate these systems due to the difference in their modeling procedure, software, and standards. BIM and GIS have different semantic and geometry standards, limiting the optimal and smooth conversion of information models between these two systems. For instance, BIM uses industry foundation class (IFC) standards, while GIS is based on city geographic markup language (CityGML). IFC and CityGML are two widely used standards for BIM and GIS to exchange 3D geometric and semantic information. IFC represents a single 3D asset information in detail, while CityGML provides geographic asset information such as cities and infrastructure in a simple and less detailed format. Integrating BIM and GIS is highly acknowledged to be very useful to represent BIM detail information about the asset in GIS with accurate geospatial coordinates such as linking geography and geometric information, integrating ground and underground information, and incorporating detailed city model information. However, BIM-GIS application is still in its initial phase, and its integration potential is rarely utilized in the context of the utility infrastructure. This paper presents the integration of BIM-GIS for the visualization, management, and simulation of the utility infrastructure.

1.2. Previous BIM-GIS Integration

Despite the differences in the semantic and domains, BIM and GIS have been integrated for many applications. IFC standards represent and standardize BIM models, while CityGML is the standard and widely used schema for the GIS-based models. BIM domains are mainly focused on new design construction projects that contain very detailed information about each object, while the GIS domain mainly focuses on the existing assets at different stages of the project, supporting accurate geographic coordinate systems and geospatial analysis. The main advantage of BIM over GIS is the representation and management of comprehensive and detailed information; however, it lacks geospatial analysis support. On the other hand, GIS has an advantage over BIM in support of geospatial capabilities and the management of geospatial territory information about assets; however, the asset details are less. Initially, these two technologies were developed for different fields of application. The integration of the two technologies can be highly beneficial for the AEC industry and can hugely contribute to sustainable infrastructure practices [20]. The two systems have been integrated into the three methods in the literature: (1) BIM to GIS integration, (2) GIS into BIM integration, and (3) integration of both BIM and GIS into a new system.
The existing literature mainly focuses to integrate BIM data into GIS for different applications. Some of the application areas where BIM data are integrated into GIS includes urban development, site selection, indoor and outdoor emergency response management, and pedestrian pathway planning. Usually, GIS is used in urban management fields such as urban development, site selection, and fire response management; however, such tasks also require geometric and semantic information that can be provided by BIM. In this context, BIM data of the 3D semantic building model was integrated into GIS that was achieved by mapping the IFC data model into the CityGML data model for urban development [21]. In another example, three software components were developed to integrate BIM into GIS for site selection and fire response management by developing [22]. In the case of pedestrian route planning and emergency response management, the indoor and outdoor geospatial information is needed; however, achieving indoor information is very difficult and time-consuming. Therefore, using BIM to GIS data mapping, researchers developed a multi-purpose geometric network model (MGNM) to connect indoor and outdoor network and use them for emergency response and pedestrian route planning [17]. The results indicated that the BIM model providing indoor information and its integration with GIS links the outdoor information that can be used by practitioners for multiple purposes. In another study, a framework was developed on the basis of an ontology that collects information from a BIM model and integrates with GIS existing information for safe route planning to school in urban areas [23]. Moreover, in [24], the IFC-based BIM model was developed and integrated with ArcGIS using an interoperability tool to support indoor spatial analysis. It can be seen from the previous studies that most of the researchers used data mapping technique (IFC to CityGML mapping) for integration to enhance the application of existing GIS contextual information. Some of the studies used existing IFC and CityGML data models and commercial tools, such as [22,23,24,25], while many researchers have developed new tools and extensions [17,21,26]. In [27], a CityGML extension was developed called GeoBIM, which supports semantic IFC information transfer into CityGML.
The above-mentioned studies discuss the integration of BIM data into GIS for various applications, providing effective tools and methods. The other possible method to integrate these two systems is to transfer GIS data into BIM. This kind of integration is also achieved in many application areas such as environmental analysis and construction management. For example, the environment data, such as the climatic condition of the building, are usually available in the GIS environment; however, the GIS lacks the building interior information for more detailed climatic analysis. Therefore, GIS data are integrated with BIM for more detailed analysis [19]. Moreover, construction supply chain management highly relies on the existing surrounding information that is lacking in the BIM but can be obtained from the GIS. For this purpose, a plugin was developed that integrates BIM and GIS to map the supply chain process in the BIM and optimizes the construction supply chain management [15]. The process of integration can be achieved by connecting both systems with the use of a new platform. A district information model (DIM) was developed by integrating BIM and GIS into a new system. To achieve this objective, researchers utilized the BIM tool Autodesk Revit and GIS tool ArcGIS, which were integrated into a new platform, Autodesk Infraworks, preserving geometrical and semantic information [28]. The current study provides evidence of the successful application of BIM-GIS in many areas. Despite the wide capabilities of BIM-GIS integration, its application in the construction management field is still in the state of infancy. It needs to explore other purposes in different stages of the construction and actual implementation, such as utility infrastructure, which is the context of this paper.

1.3. Problem Statement and Research Scope

The literature review identifies that inefficient utility management from design to operation phase put earthwork operations at a high risk. The current utility management system uses 2D CAD drawings during the design and construction stages, which contains very limited information. Furthermore, the information significant for the operation and maintenance stages is gathered and managed in multiple formats such as excel spreadsheet, PDFs and Word documents, and images and photographs, which makes the workflow inefficient because it is very difficult to retrieve or update information from such a system. The use of such a poor utility management system may lead to property damage, injuries, fatalities, disruption to urban services such as water supply in case of water pipelines, wastewater distribution networks in case of sewerage, telecommunication in case of telephone lines, and energy in electric cables, etc. Moreover, it can create significant social and economic impacts as well as causing delays in the construction activities. Storing and managing the geographic location, size, materials, and other properties of the underground utility infrastructure in an integrated system can play a significant role in facilitating the visualization, digitization, and management of the utility infrastructure. However, it is very difficult in case of underground utilities because of their long geographic distribution, lack of standards, and the lack of information technology systems. Geographic information system (GIS) contains information about the geographic location and spatial coordinates, while building information modeling (BIM) contains information about the geometry and semantics in every detail. BIM integration with the GIS technology has been used in the AEC industry for many purposes such as supply chain management [15], geotechnical property modeling [29], cost estimation of roads [30], tunnel facility management [31], heritage facility management [13], site layout and construction safety planning [32], and space planning. However, the use of such an integrated system is rarely explored for the underground utility infrastructure.
This paper presents a novel integrated BIM-GIS framework for the management of underground utility infrastructure on the basis of modern construction engineering and information technology tools. BIM uses the IFC schema, while GIS is based on the CityGML schema. IFC contains information about the asset geometry and semantic in detail, while CityGML contains assets geographic information, location, geometry, and other spatial information in less detail. In the proposed study, the integration was achieved using open standard data model, IFC, and CityGML mapping. The use of open standard data model has the advantage of providing a collaborative environment and allows the stakeholders to manage, analyze, and exchange the utility infrastructure information at different stages. The integrated BIM-GIS model can be used for different project stages such as preliminary design, construction, and operation and maintenance stage, which has novelty because the application of the previous studies has mainly been focused on a single project stage. This framework provides a ready-to-use integrated BIM-GIS 3D utility infrastructure model with all the semantic information that can be used in the preliminary design stages to know about the geographic location, size, type, depth, and material of each pipe. The application of the integrated BIM-GIS model in the construction stage is to provide visual assistance in real-time design and underground utilities to the excavator operator with the machine guidance systems. Moreover, the integrated BIM-GIS utility infrastructure model contains all the significant information in a database that can be used by stakeholders in the operation and maintenance stage for making decisions. Finally, we implemented our novel integrated BIM-GIS framework on a real case study. It started with the detailed explanation of the surface and subsurface information collection and processing using advanced techniques such as GPR and UAV. The integrated model was used in the preliminary design stages to understand and visualize the geographic location, size, type, depth, and material of each utility network pipe. The integrated model was used in the machine guidance to provide visual assistance to the operator and avoid the strike between construction equipment and underground utility in the construction stage. The integrated BIM-GIS utility infrastructure model contains all the significant information in a database that can be used by stakeholders in the operation and maintenance stage for making decisions. The results show that the proposed methodology of BIM-GIS integration containing all the geometric and semantic information about the utility infrastructure can facilitate earthwork operations during the design, construction, and operation stage.

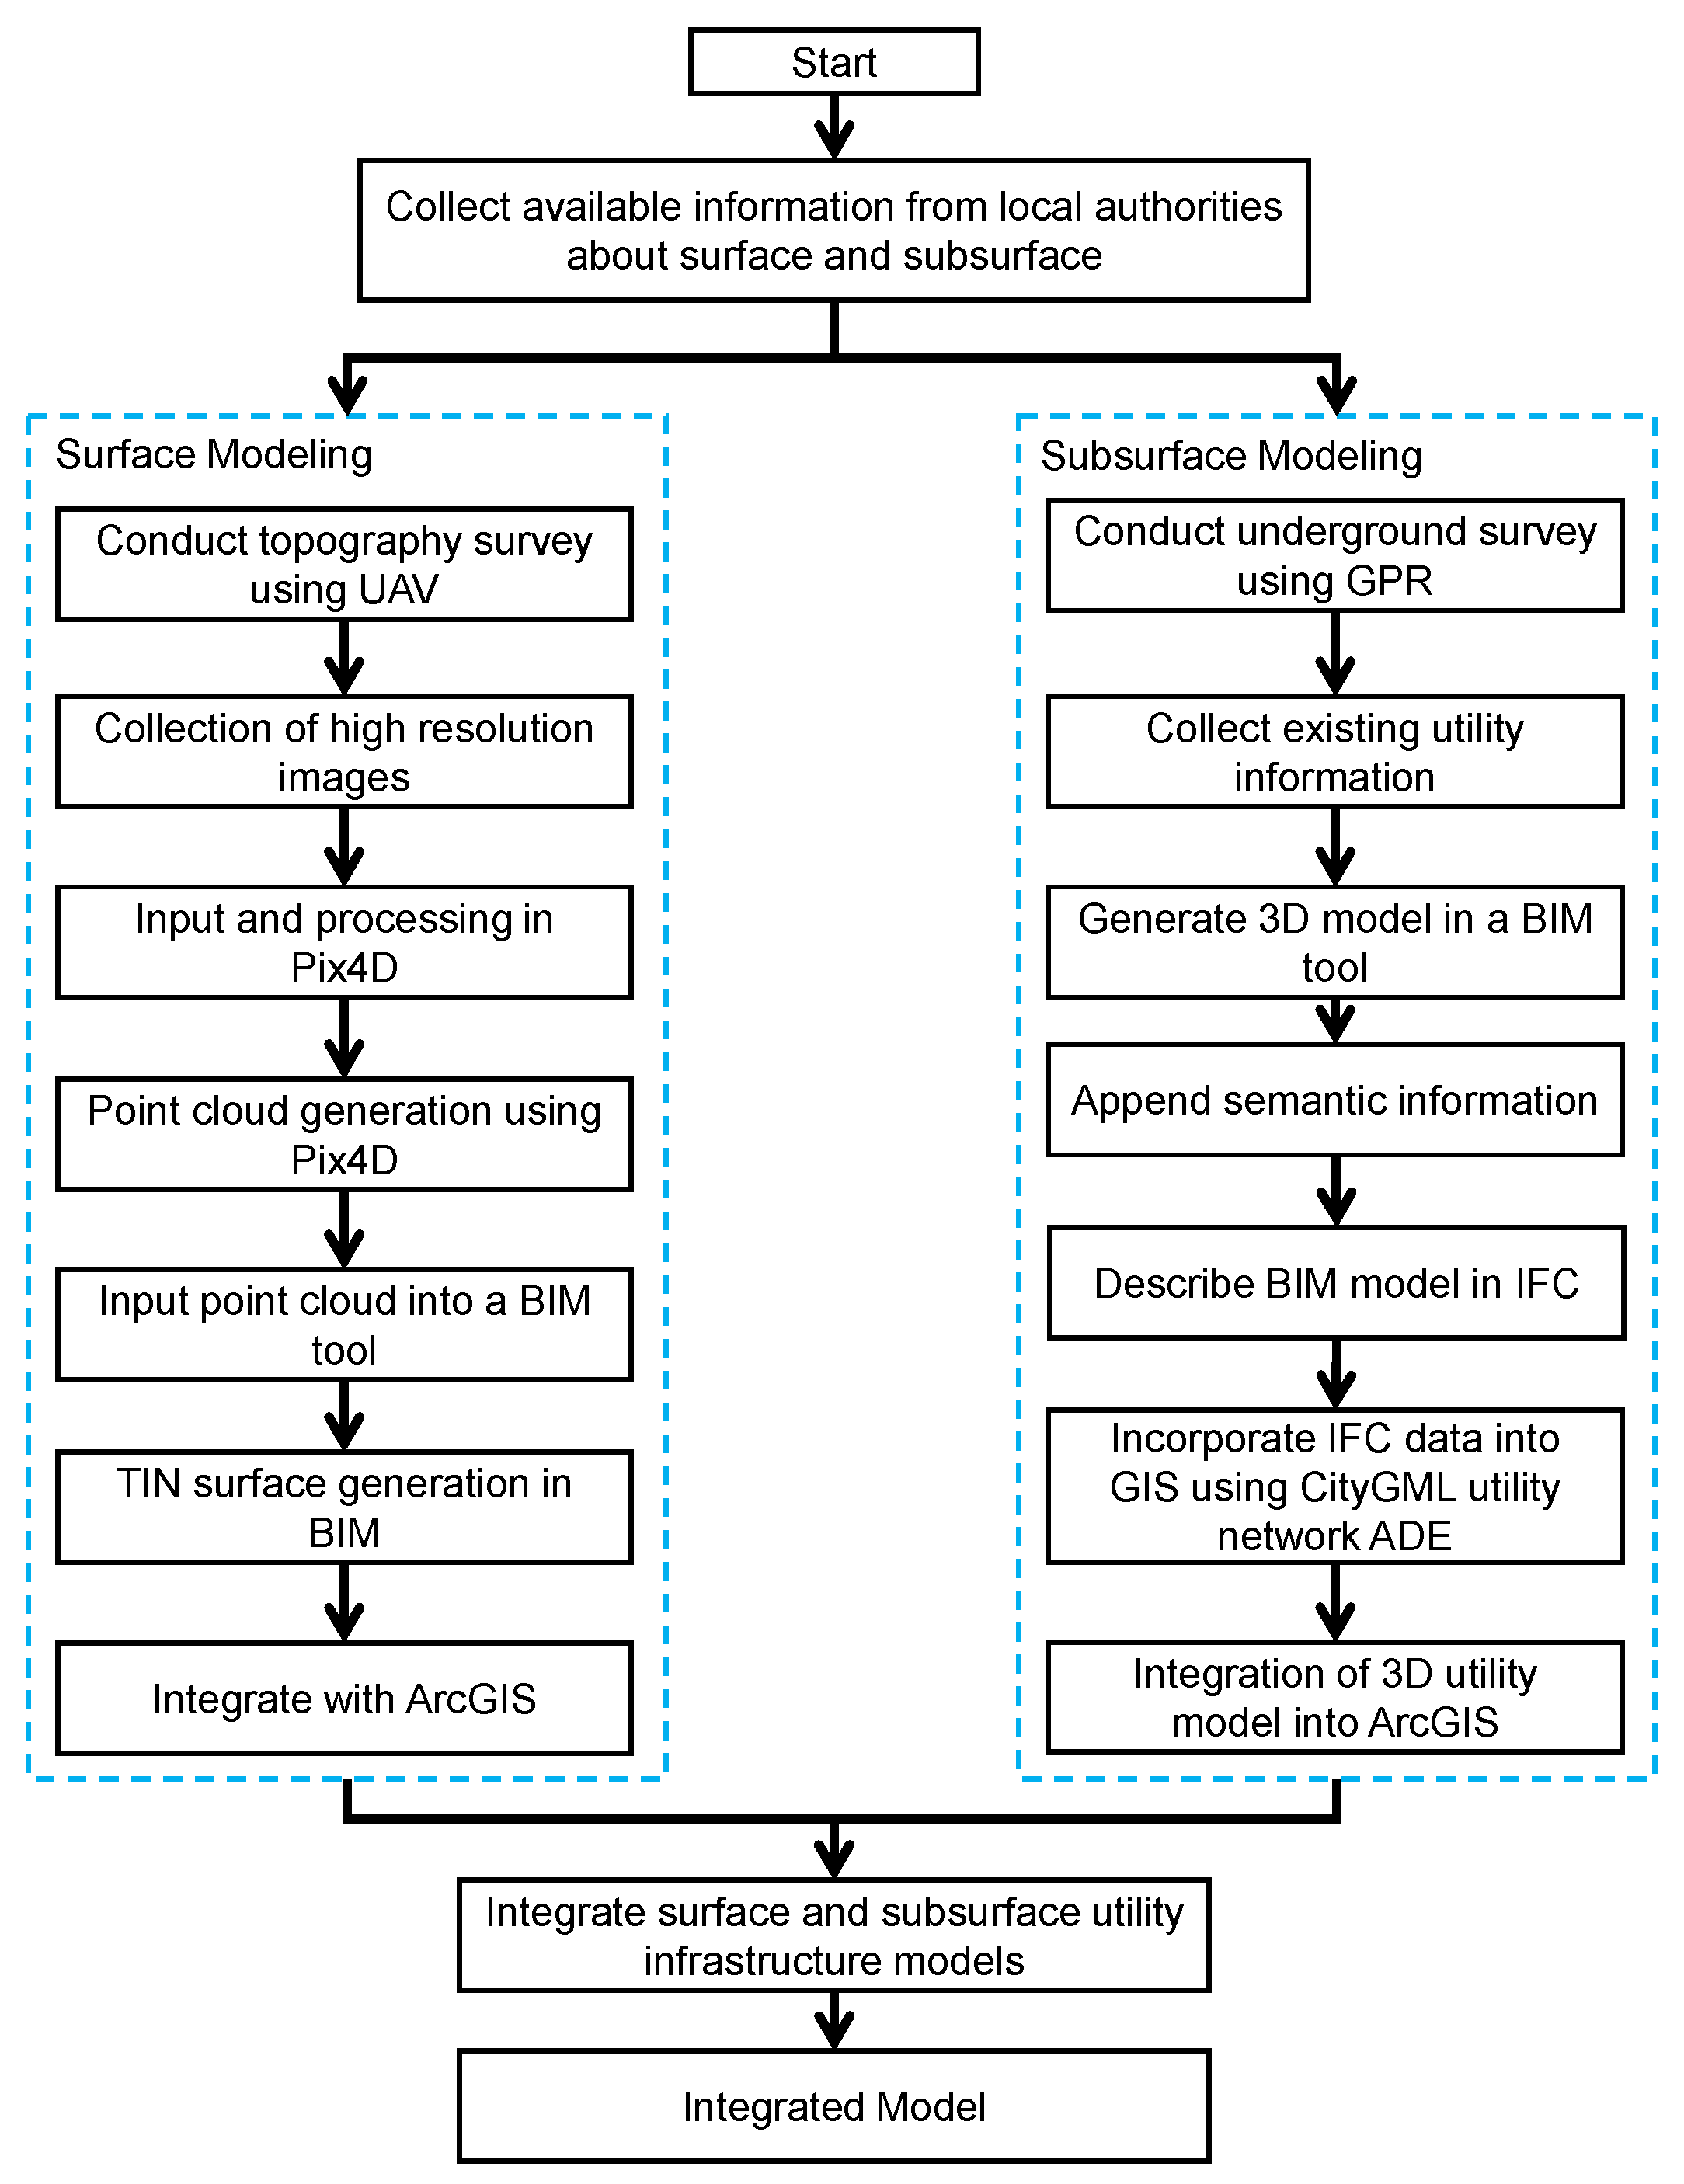
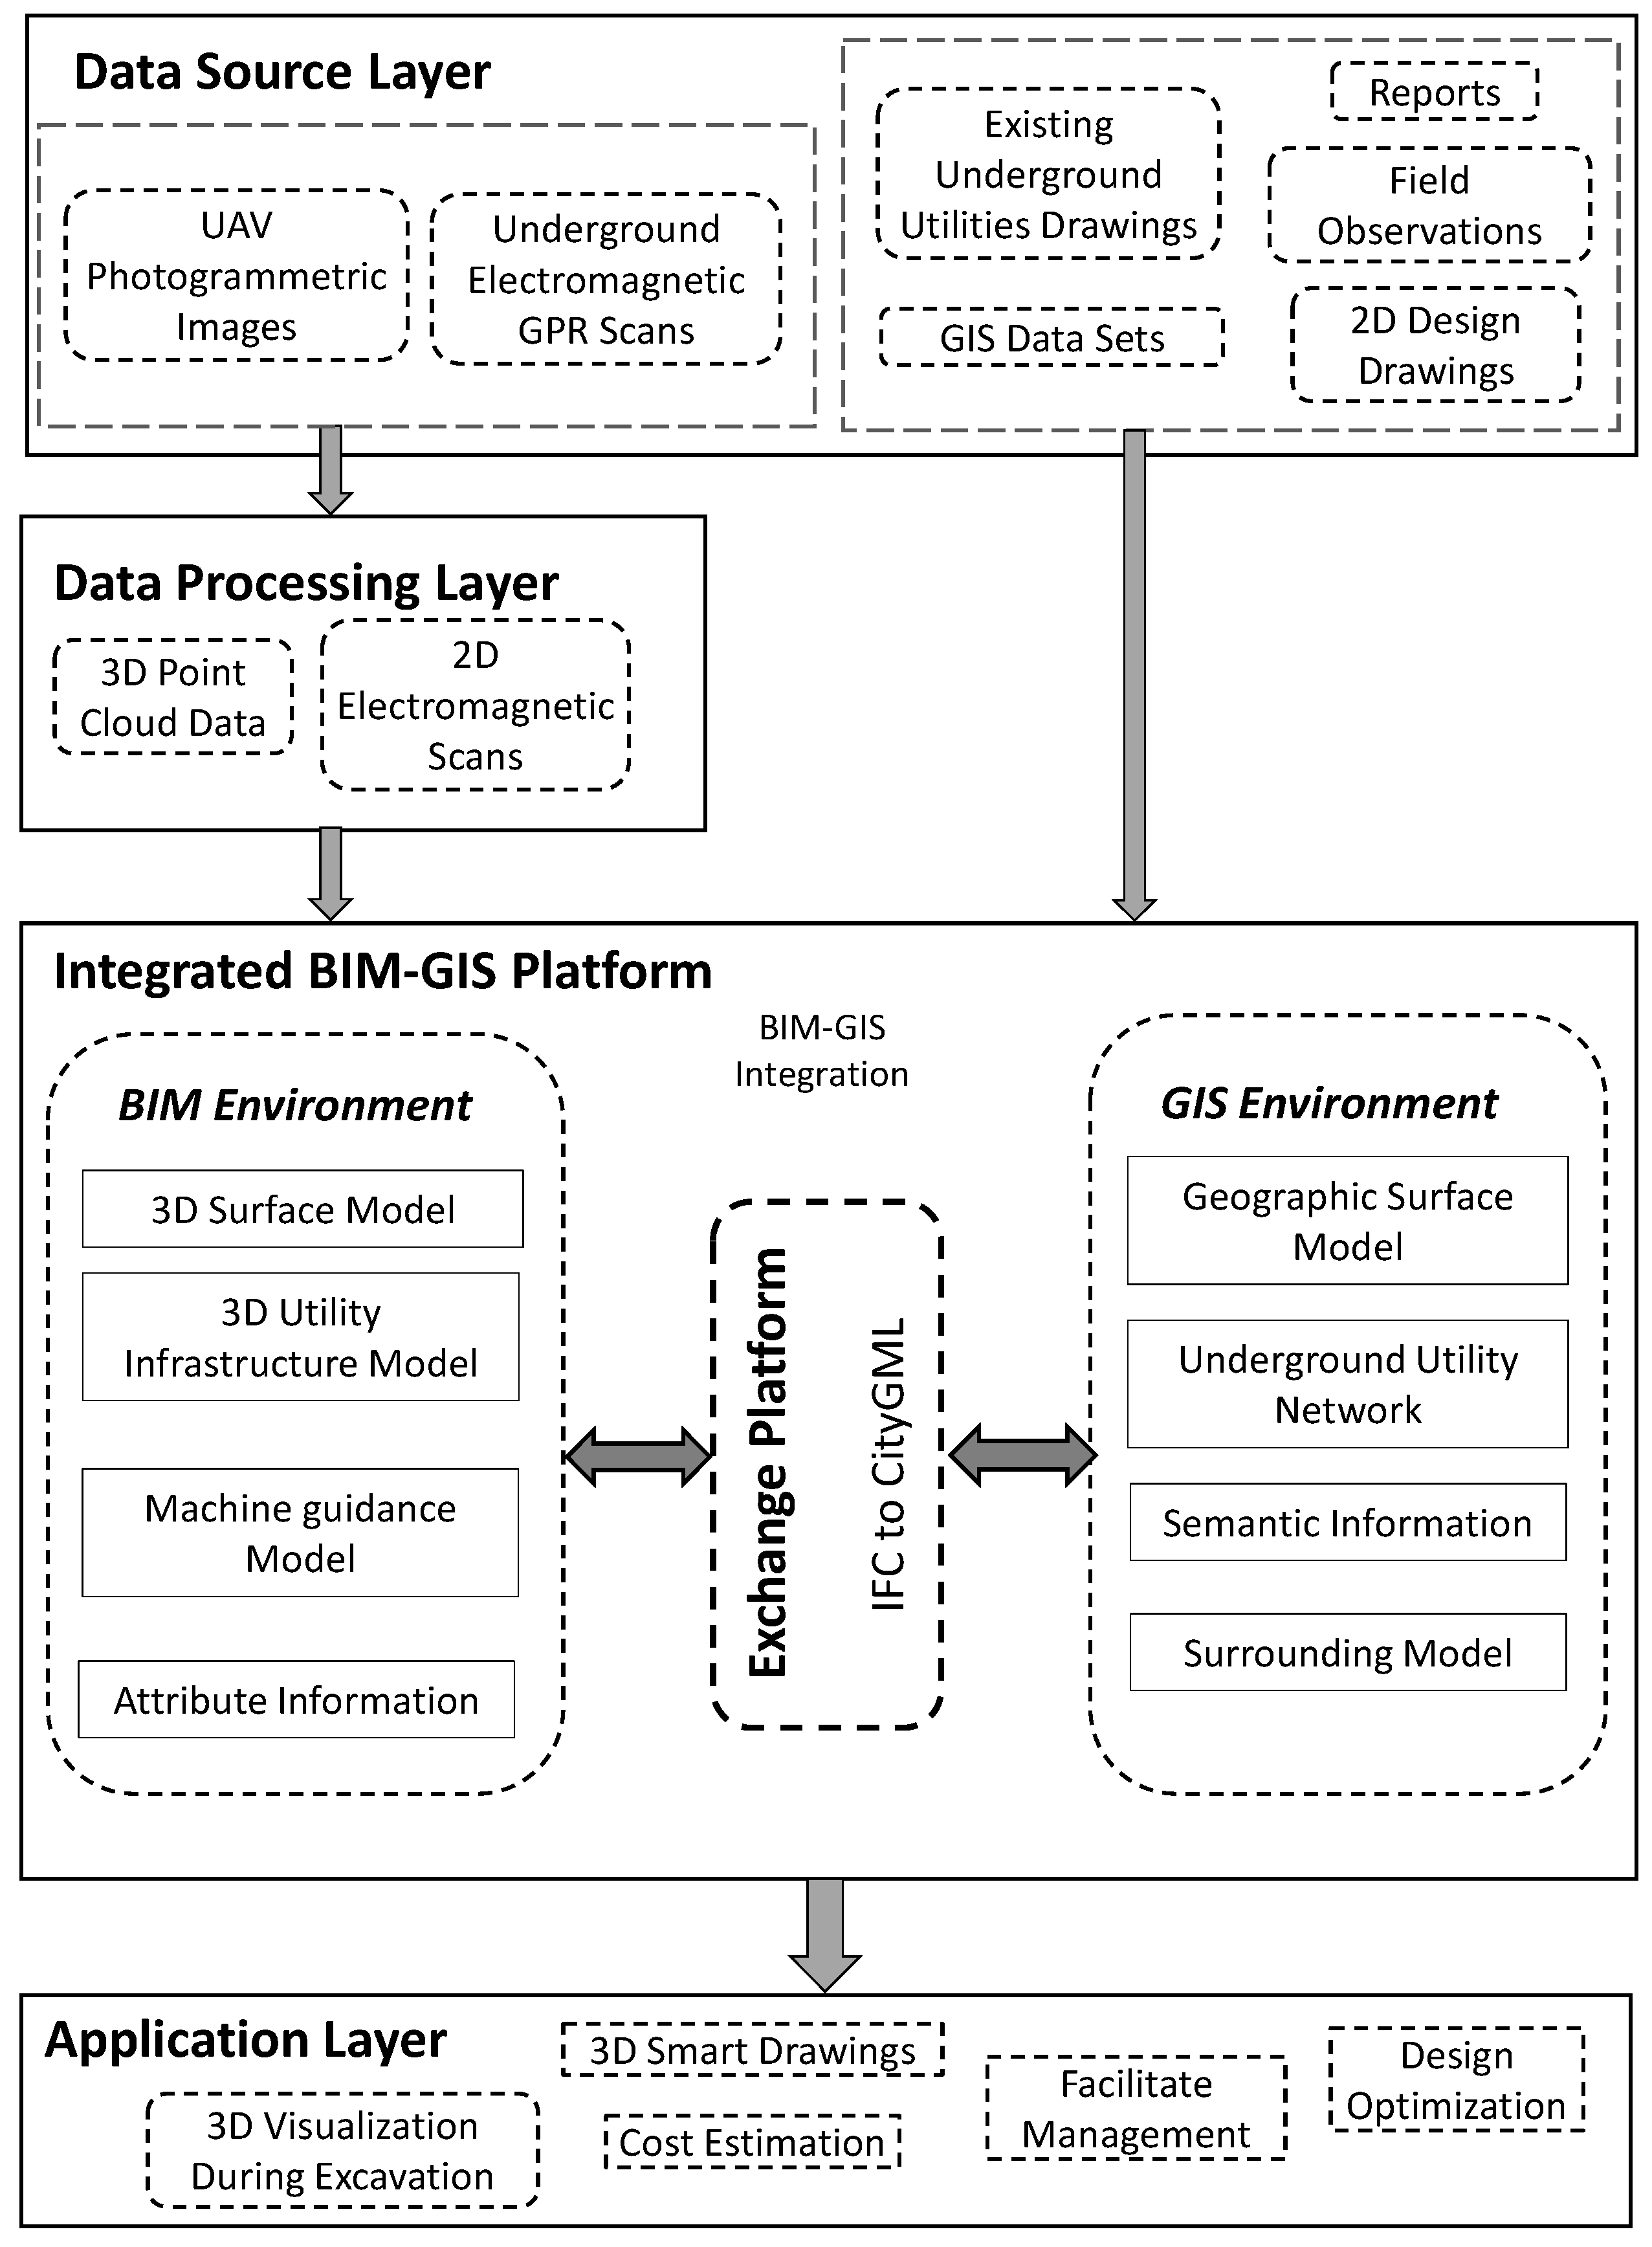
2. Materials and Methods

Integration of BIM and GIS framework is proposed in this research to visualize, simulate, and manage the underground utility infrastructure. The integrated BIM-GIS framework is comprised of the following layers: (1) data source layer, (2) data processing layer, (3) integrated BIM-GIS platform, and (4) application layer. The concept overview depicting the step-by-step framework is shown in Figure 1. Before the utility infrastructure is modeled, information about the utility pipes should be surveyed, gathered, and processed. The data on the geographic surface and subsurface information is collected in the data source layer using advantage surveying technology such as the unmanned aerial vehicle (UAV) technique for surface information and electromagnetic GPR for the subsurface information. In the data processing layer, the surveyed data can be processed to produce a dense point cloud from the UAV-collected data and CAD lines from the GPR collected data. The first represents the geographic surface information in great detail, and the second contains information about the location, depth, materials, and type of the utility infrastructure. All the utility information is modeled in the BIM environment, and extra information is appended to the utility pipes on the basis of IFC. The BIM model has been integrated with the GIS by mapping IFC to CityGML in the integrated BIM-GIS platform layer. The application layer contains all the necessary information that can be used in the application stages for many future designs, construction stages, and maintenance stages such as clash detection, design optimization, machine guidance, and facility management.

2.1. Data Source Layer

Data collection is one of the most important parts of this research work. Traditionally, the utility data are represented in two-dimensional CAD drawings; however, the problem with the 2D drawings is the lack of containing additional information. Moreover, it lacks the depiction of the depth information in the third dimension. Therefore, a three-dimensional BIM model is suggested in this framework for utility representation. For the development of BIM, which provides the information of underground utilities to the above surface reference, data about the existing terrain information and underground utility location needs to be surveyed. For existing terrain information, data can be collected using surveying techniques such as terrain traditional surveying techniques such as tachometry, total station (TS), and real-time kinematic global navigation satellite system (RTK GNSS), or the latest surveying techniques such as UAV photogrammetry and ranging (LiDAR) or airborne laser scanning (ALS) for the terrain and underground utility location detection. For existing underground utility information, there are several technologies such as infrared thermography, elastic wave method, wave impedance probe (WIF), low-frequency electromagnetic survey, passive magnetic fields (PMFs), and GPR. Existing information from the local government and consultants, such as CAD drawings, spreadsheets, and design reports, can also be acquired. For this research, existing information of terrain was collected using UAV photogrammetry, and for existing underground utility information, GPR technology was adopted. Moreover, existing information from the local government department and consultants was acquired in 2D CAD drawings.

2.1.1. Existing Terrain Information

Unmanned aerial vehicles (UAV/drone) have quickly become one of the most versatile tools on the earthwork construction site. Drones have become the job site’s aerial eye, speeding up data collection for earthwork projects, helping construction professionals work better and more productively. An extensive amount of research has been conducted in UAV photogrammetry for 3D mapping and modeling [33]. UAV application for terrain information gathering has become more reliable with the invention of accurate GPS and gyroscope technology.
Images are collected during the UAV flight equipped with a high-resolution camera and GPS (Figure 2). The developed flight planning software uses different parameters to compute a full flight plan consisting of the waypoints where the UAV takes the photos along its flight path automatically.

2.1.2. Underground Utility Information

GPR has become an integral part of any earthwork project in metropolitan cities, historical sites, utility installations, and maintenance projects. GPR is an old but very effective form of technology that is used to provide information about underground pipes, communication lines, tunnels, and archeological remains before excavation [34]. GPR is based on the simple working principle, electromagnetic energy transmitted through emitter antennas in the form of a pulse reflected from the underground target and received by receiver antenna [35]. The electromagnetic images are collected to determine the location of the underground utility. The selection of GPR depends upon the project type and information required regarding the project. The lower the frequency of the antennae, the deeper information can be obtained. The higher the frequency, the greater the resolution, i.e., scan detail. Figure 3 shows the application of GPR with a typical range of frequencies and penetration depth.
Existing utility information from previous underground utility records is acquired from the concerned government and service providers before the commencement of the project. The underground utility information collected from both sources provides a piece of reliable information.

2.2. Data Processing Layer

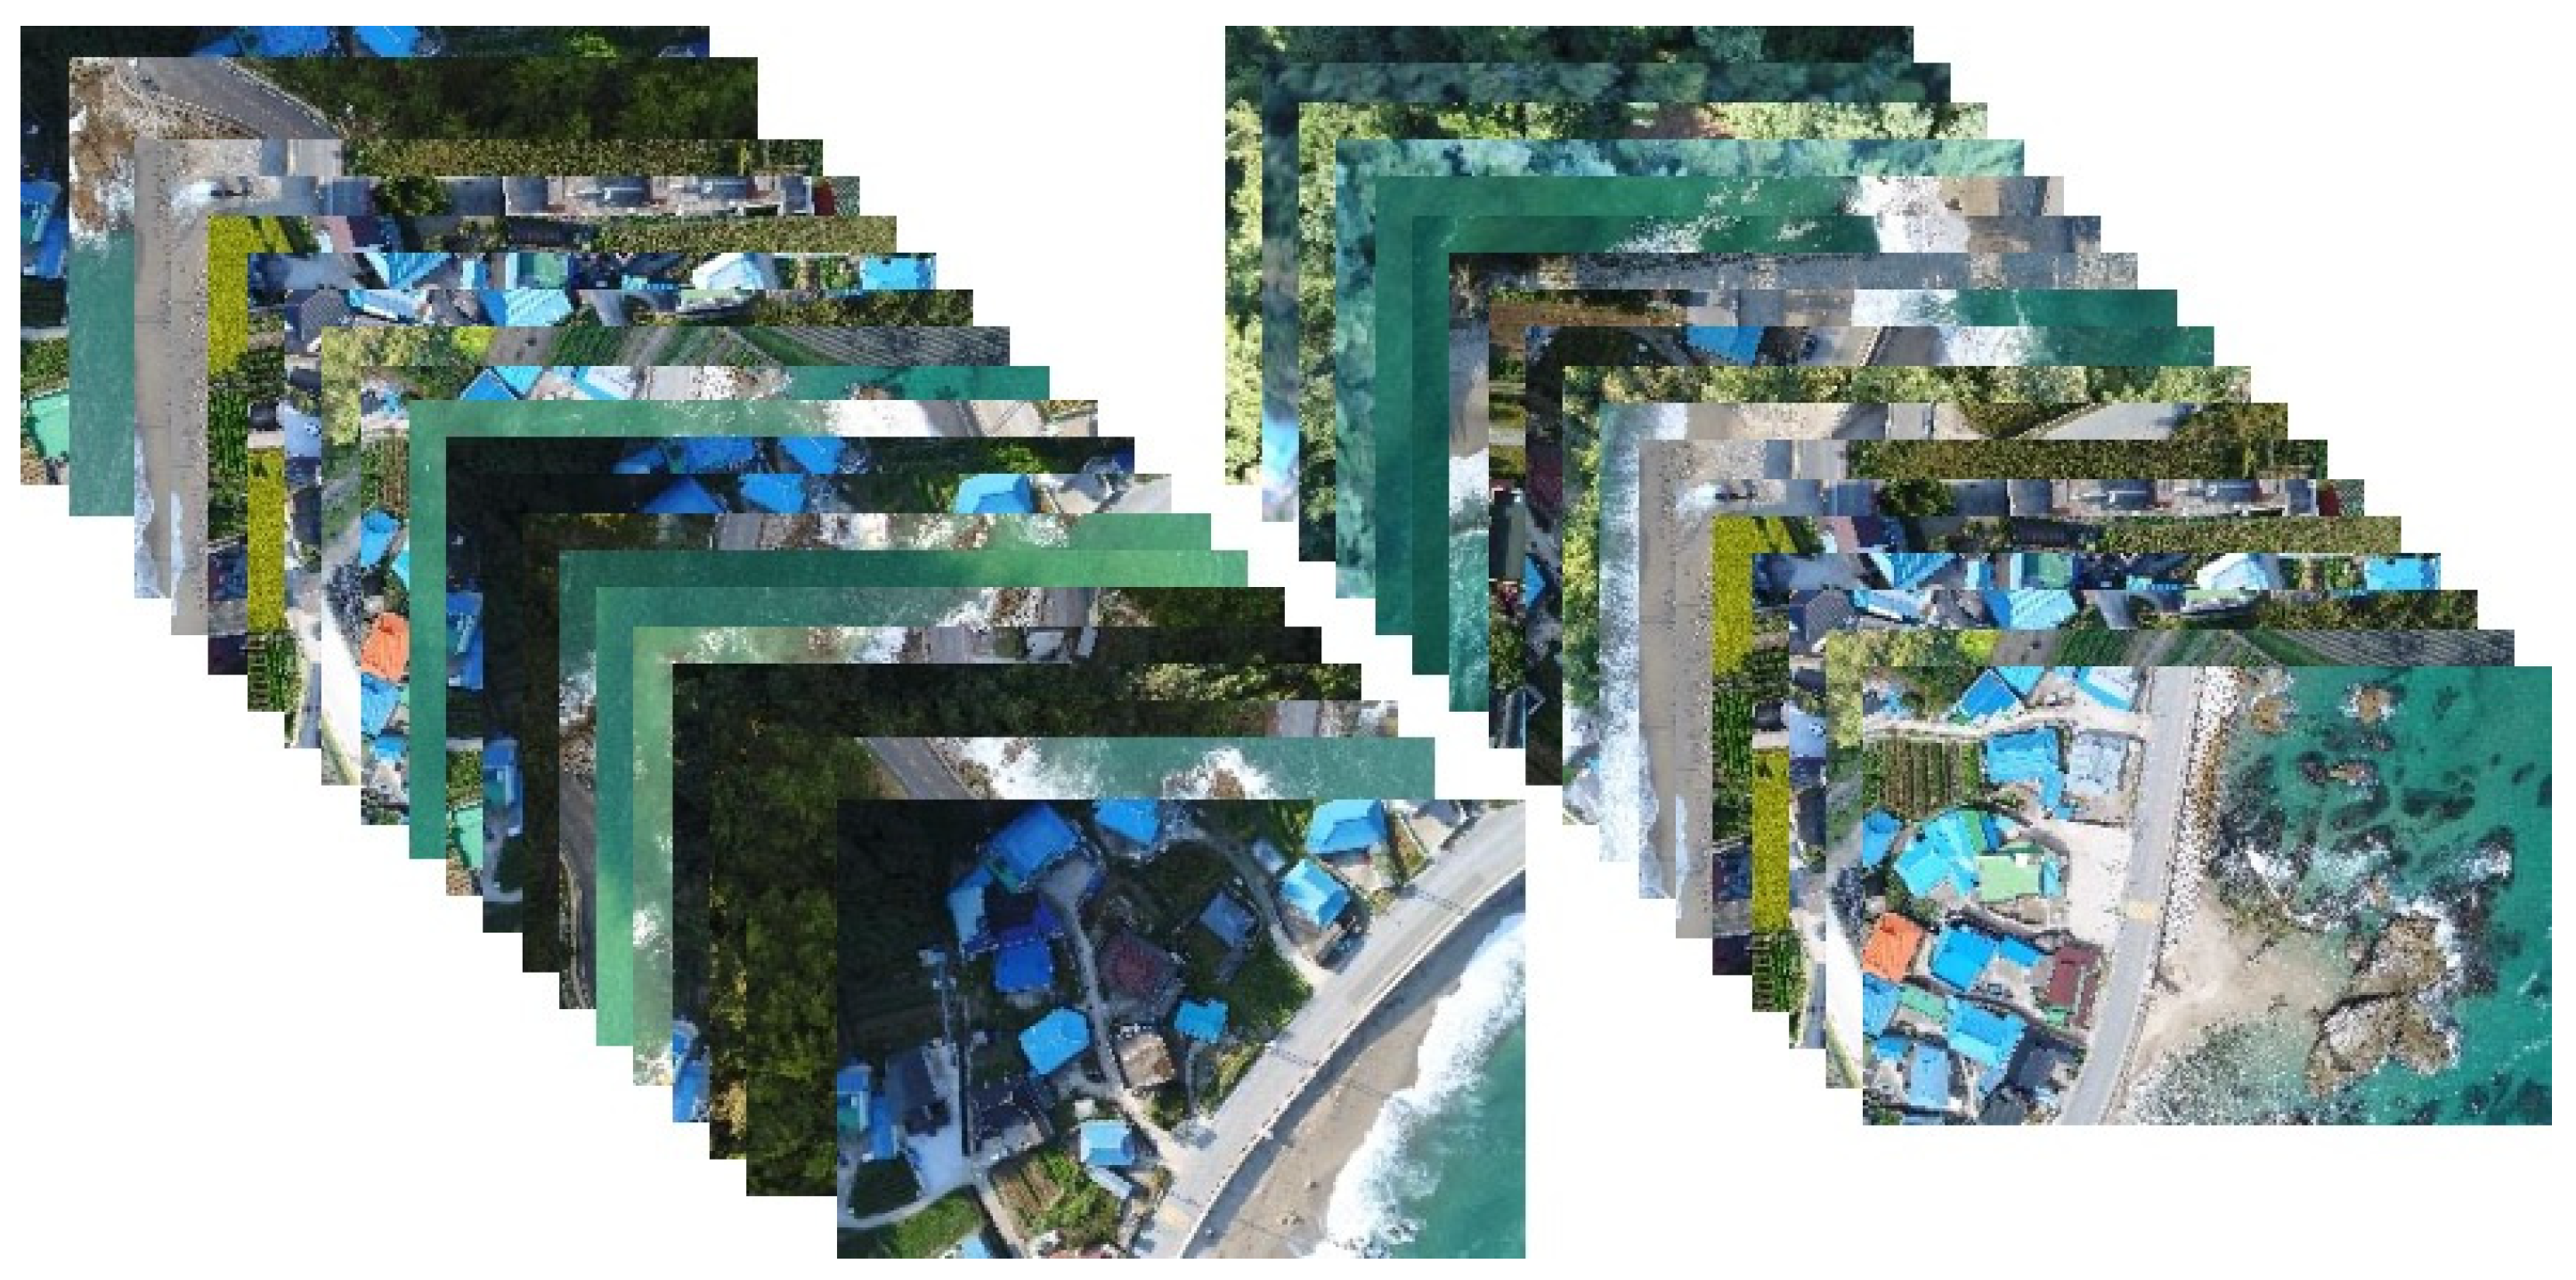
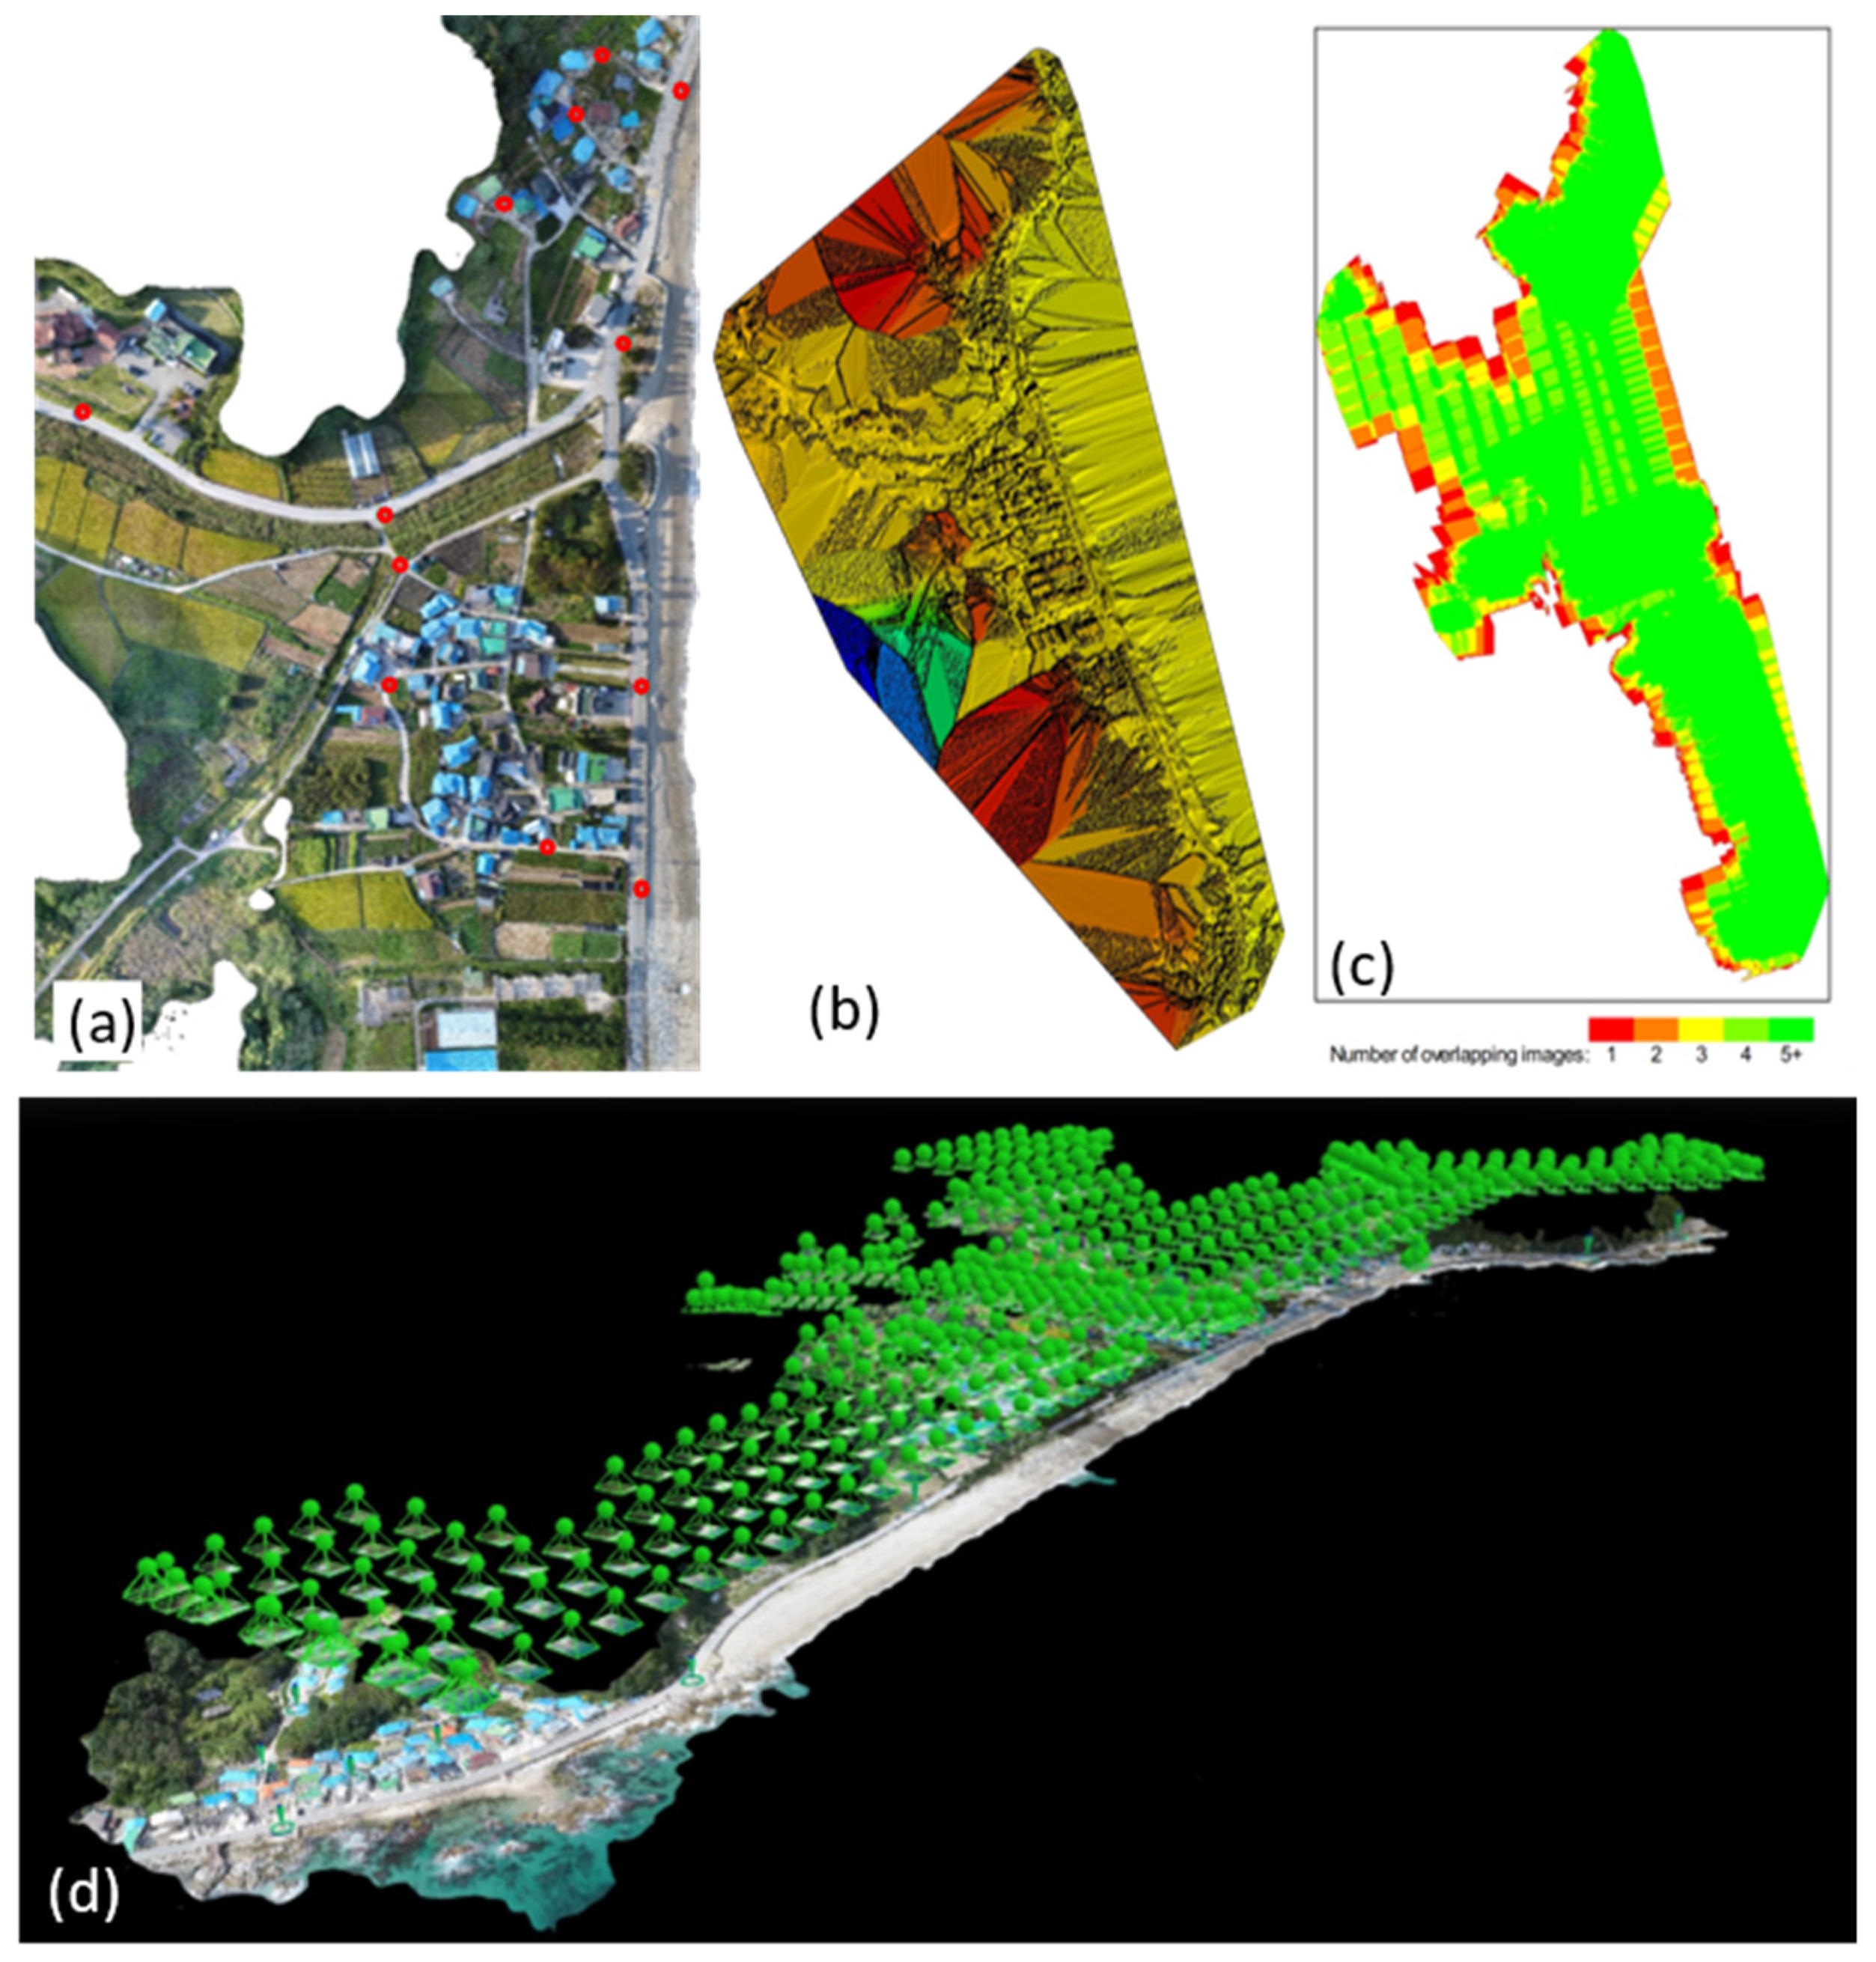
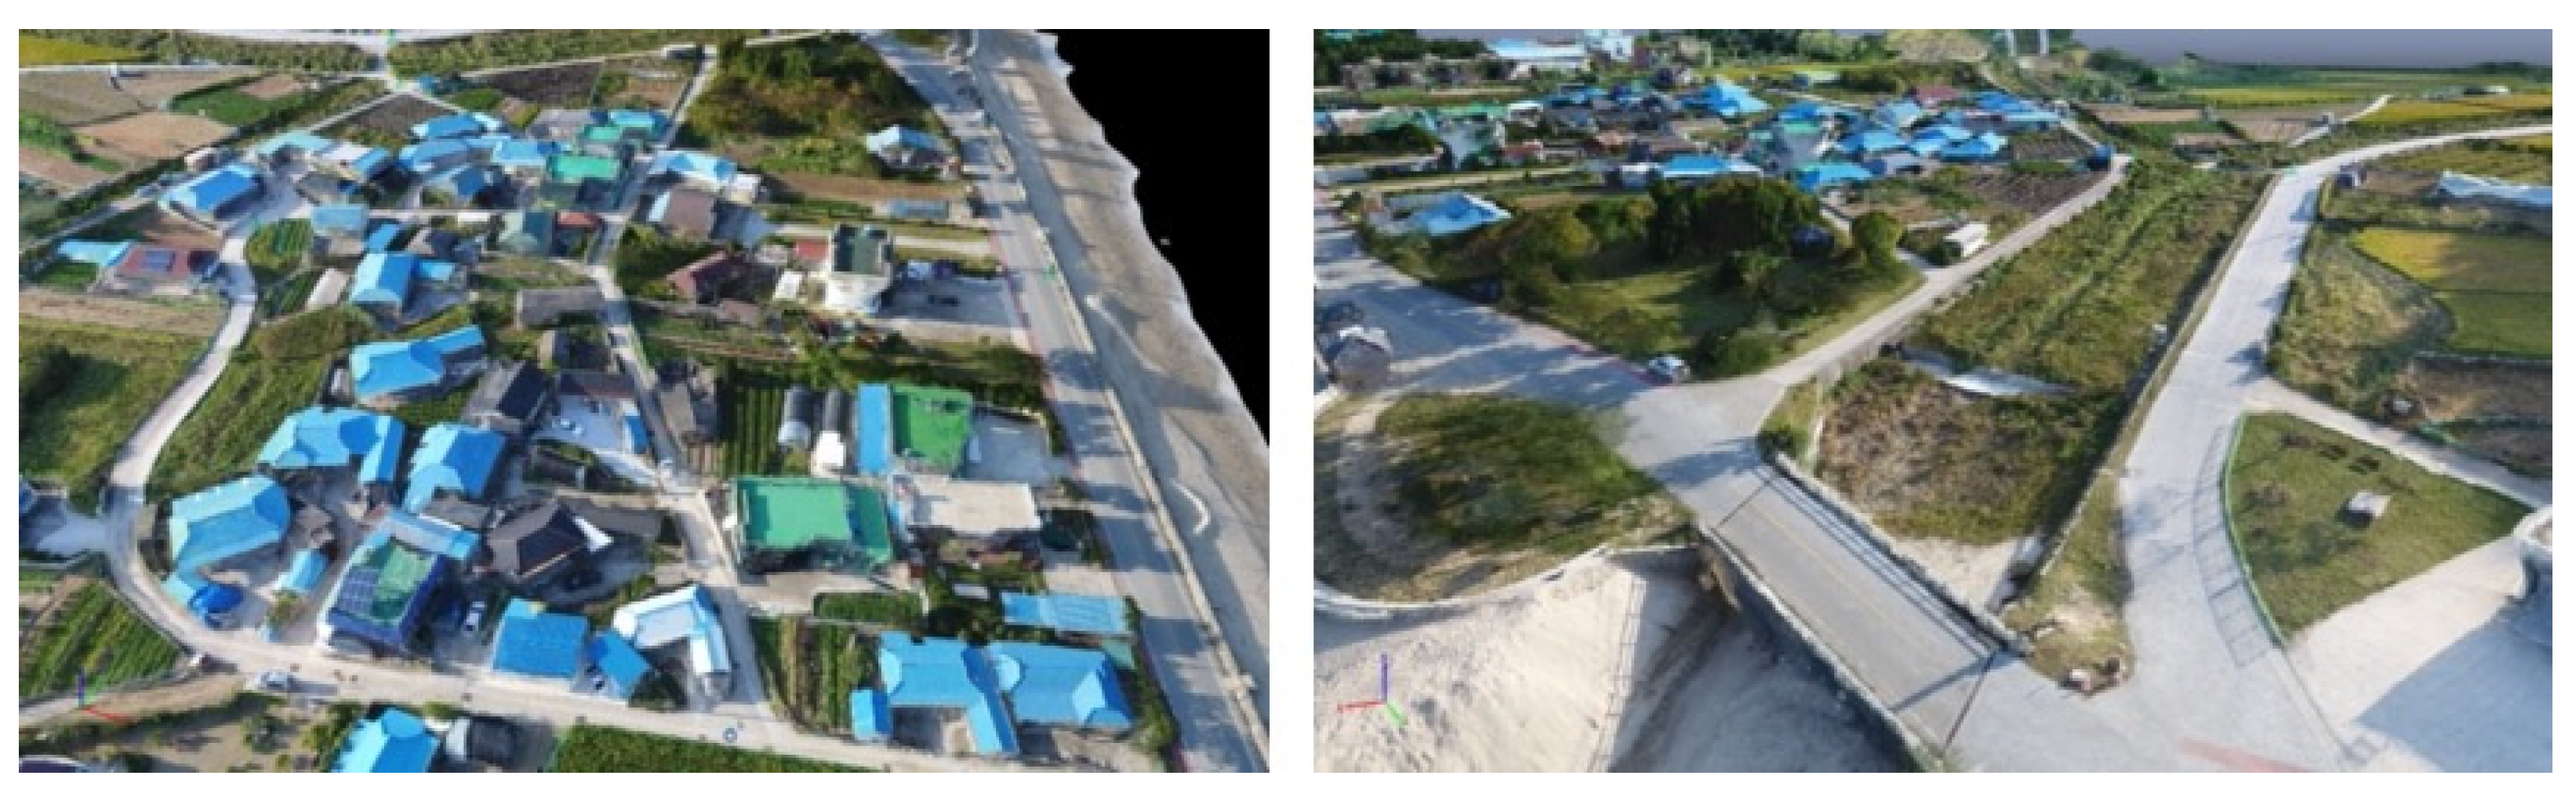
2.2.1. UAV Photogrammetric Data Processing

Photogrammetric data processing is required to produce georeferenced 3D point cloud data from UAV-captured photographs. Exchangeable image format (Exif) metadata are generated from each captured airborne image to generate 3D point cloud data. Detailed reviews are provided by Lowe [37] and Snavely [38] for the generation of 3D point cloud data from captured photographs. Several algorithms are available to produce georeferenced 3D point cloud data using multiples mathematical and computational techniques [39,40]. There are several commercial software programs available to convert georeferenced photographs into 3D point cloud data. Adequate overlap of adjacent photographs consisting of the same features and precise insertion of GCP is mandatory to improve the absolute accuracy of 3D point cloud data [38] (Figure 4). Image processing consist of four main steps: (1) alignment of photographs, (2) construction of geometry, (3) texture building, (4) exporting to colored point cloud/digital terrain model/orthophoto. Table 1 shows the details about the UAV photogrammetric data processing for the generation of georeferenced 3D point cloud data. RMSE value adjustment of GCPs is also provided in Table 1.

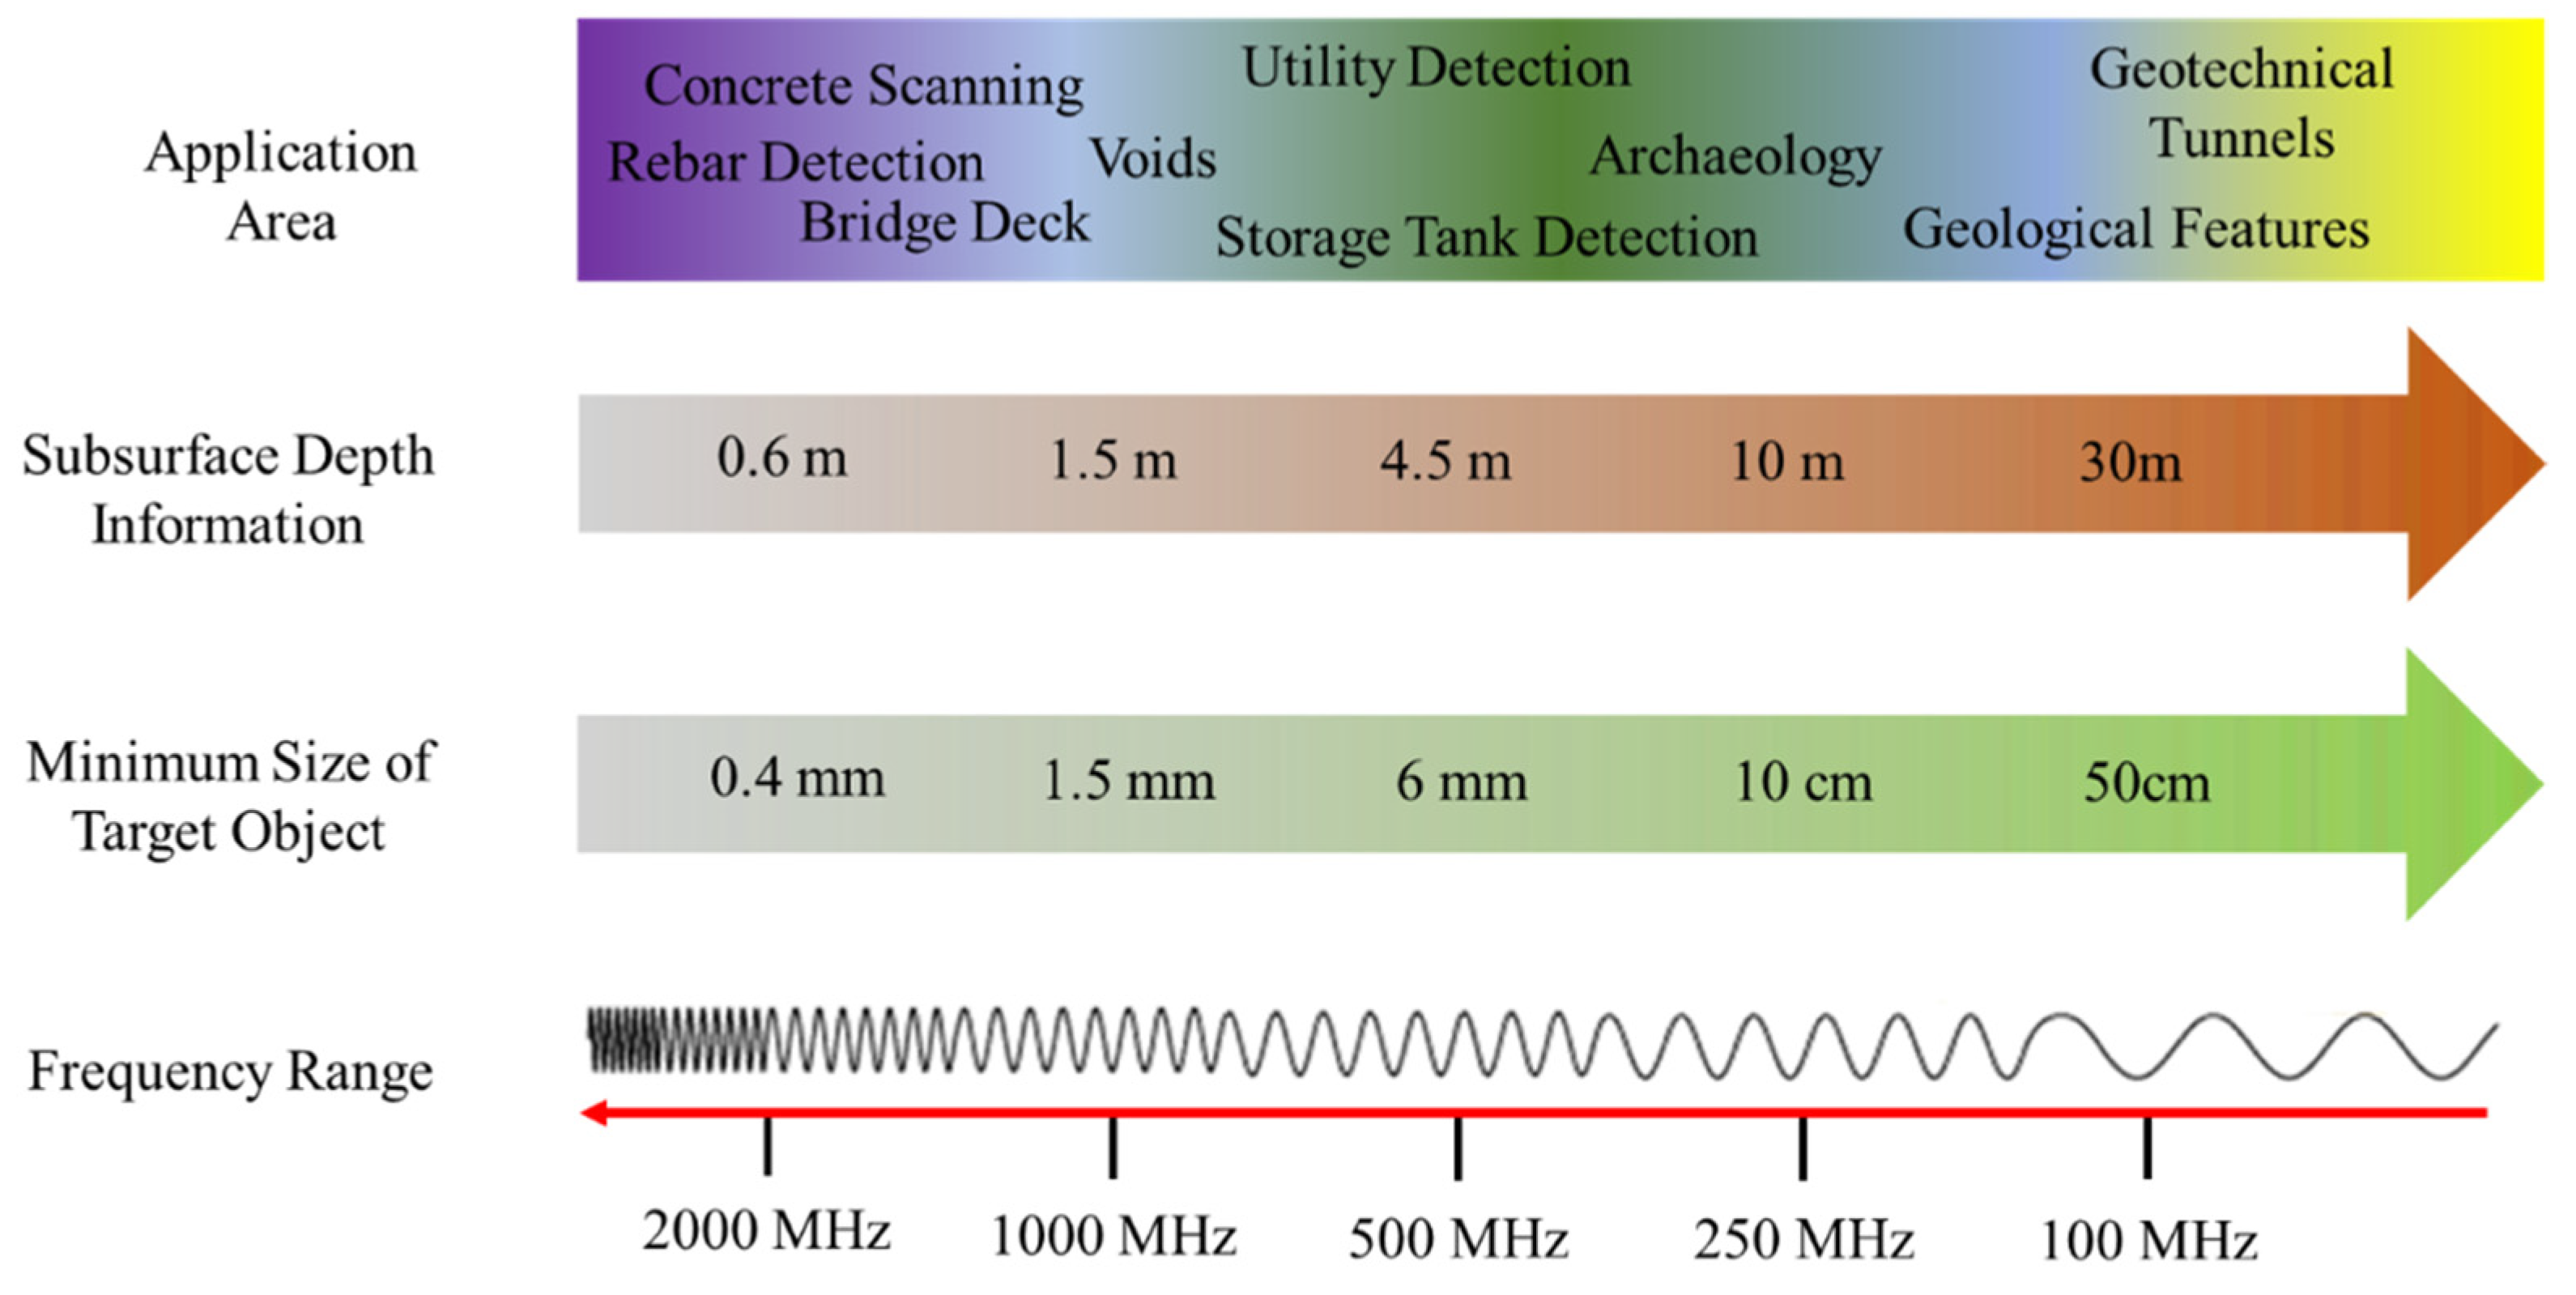
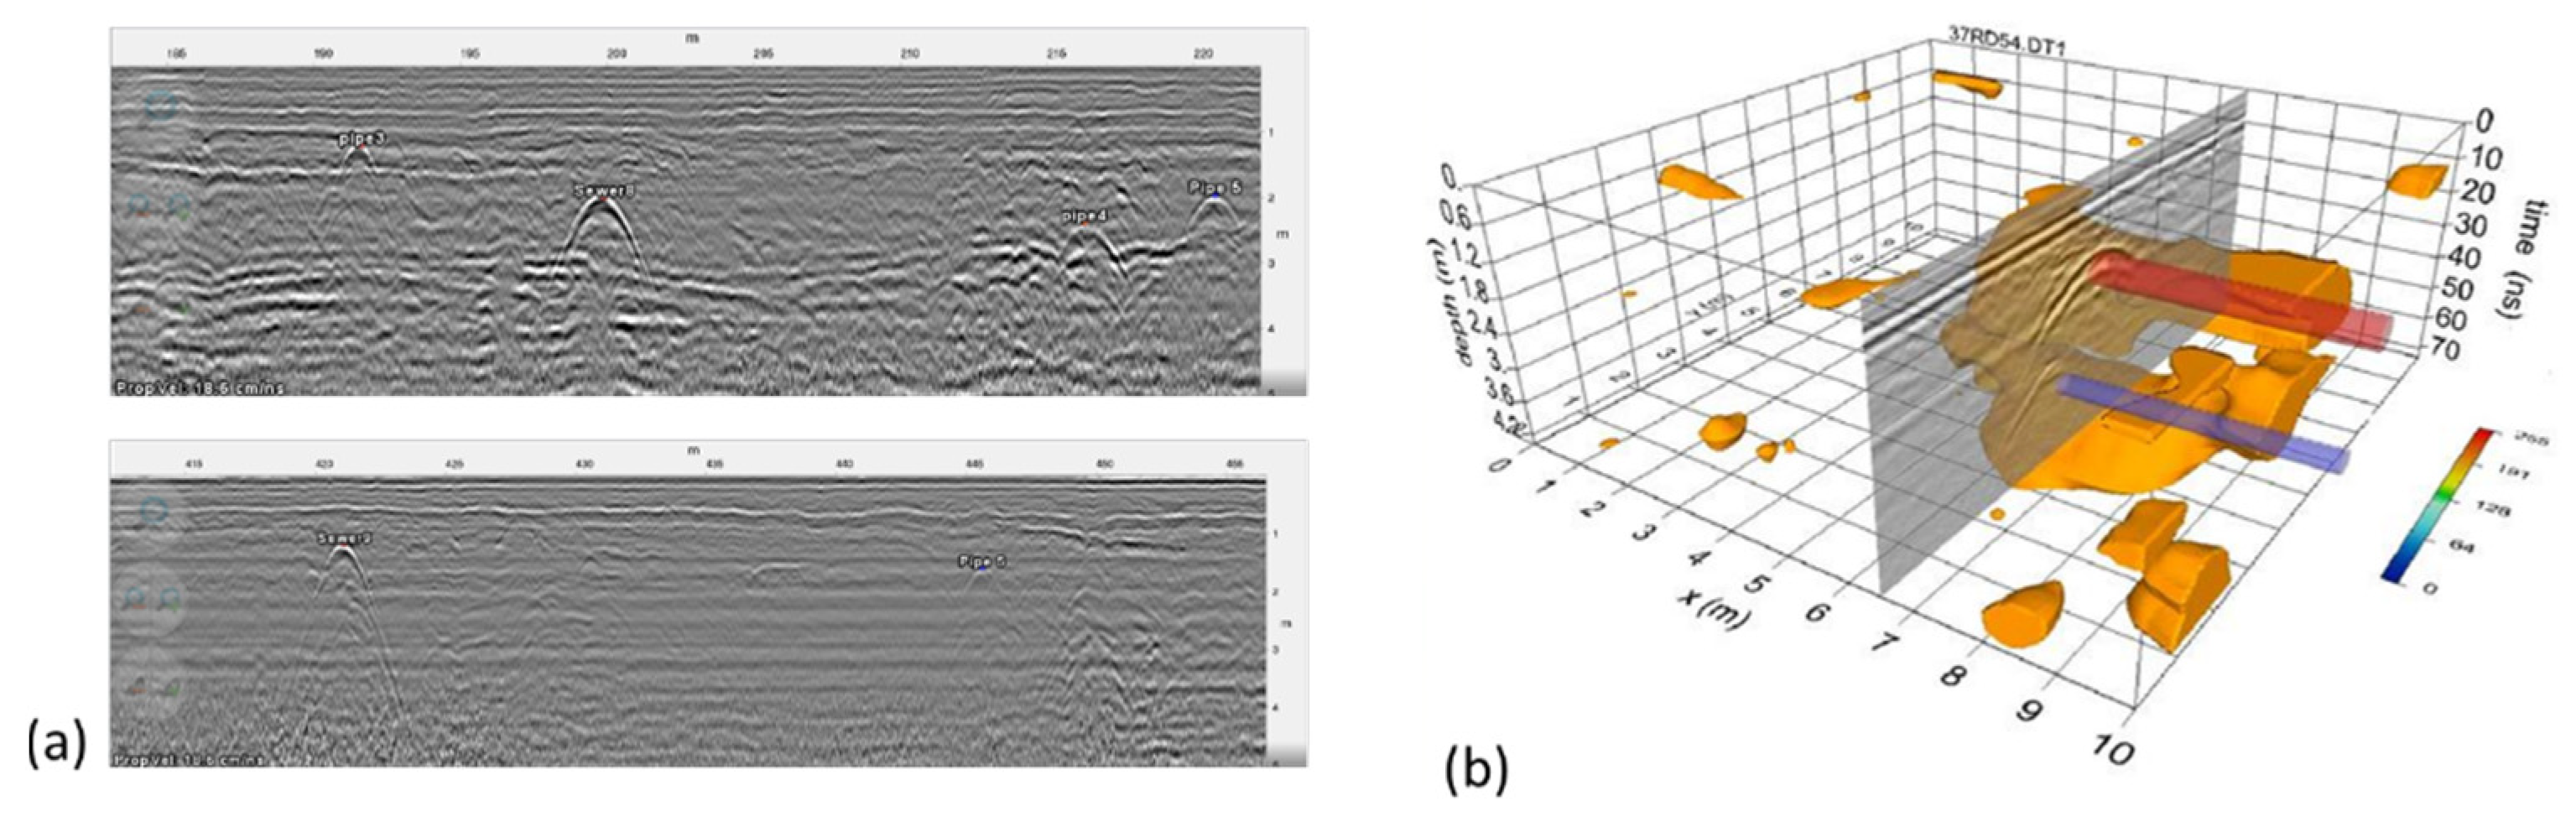
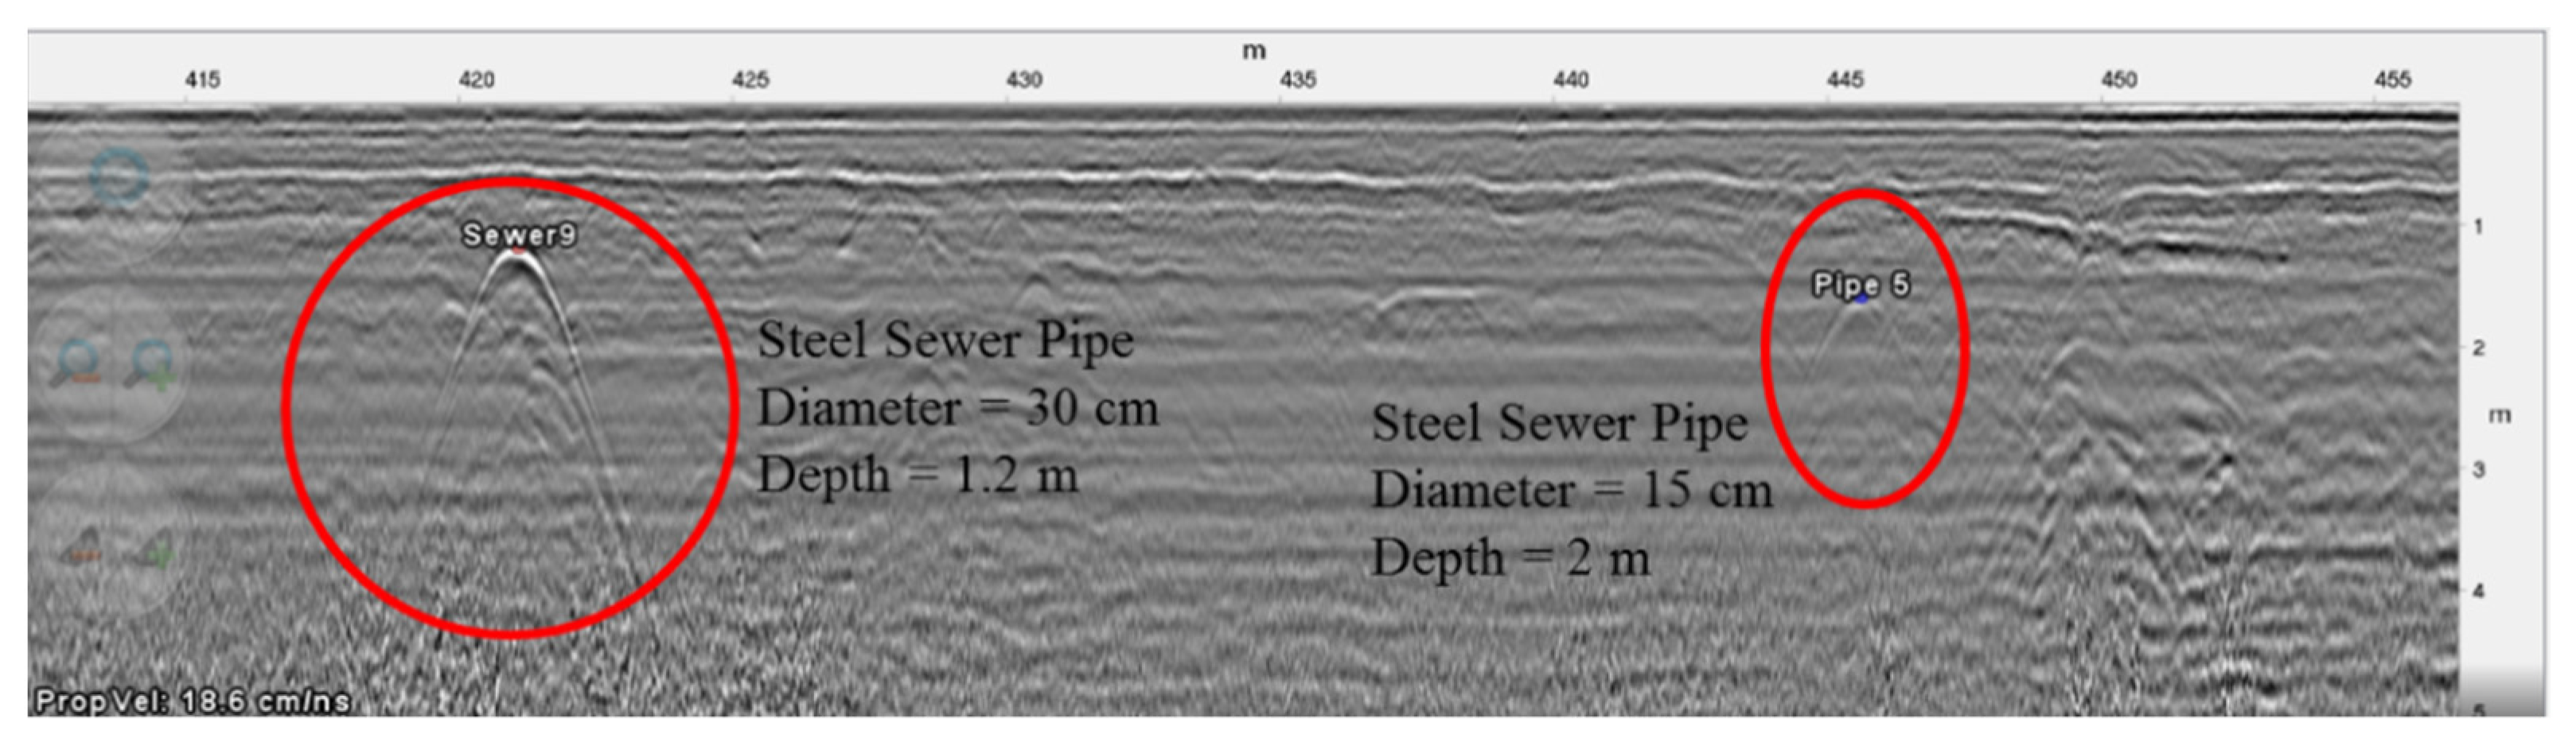
2.2.2. GPR Electromagnetic Data Processing

2D electromagnetic scans recorded in the GPR survey require digital processing of recorded data to accurately determine the location, depth, size, and type of object or utility. Several state-of-the-art data-processing techniques have been developed over the years, such as deconvolution, attribute analysis, and noise suppression [41]. The basic purpose of data processing is to enhance electromagnetic signals and reduce noise, expunge system-recorded data irregularities, and correct geometrical error irregularities (Figure 5a). In this research, GPR data processing is based on four basic GPR data processing steps: (1) data editing, in which error related to field data acquisition is treated to remove the data redundancy; (2) primary editing, in which low-frequency components are ignored—normally referred to as “dewowing the data”; (3) advance data processing, in which well-known seismic operations are applied to enhance the visible weaker signals and add artifacts that can lead to misleading results; (4) visual interpretation processing, in which, on the basis of expert knowledge, the location, depth, size, and type of object or utility is determined (Figure 5b).

2.3. Integrated BIM-GIS Platform Layer
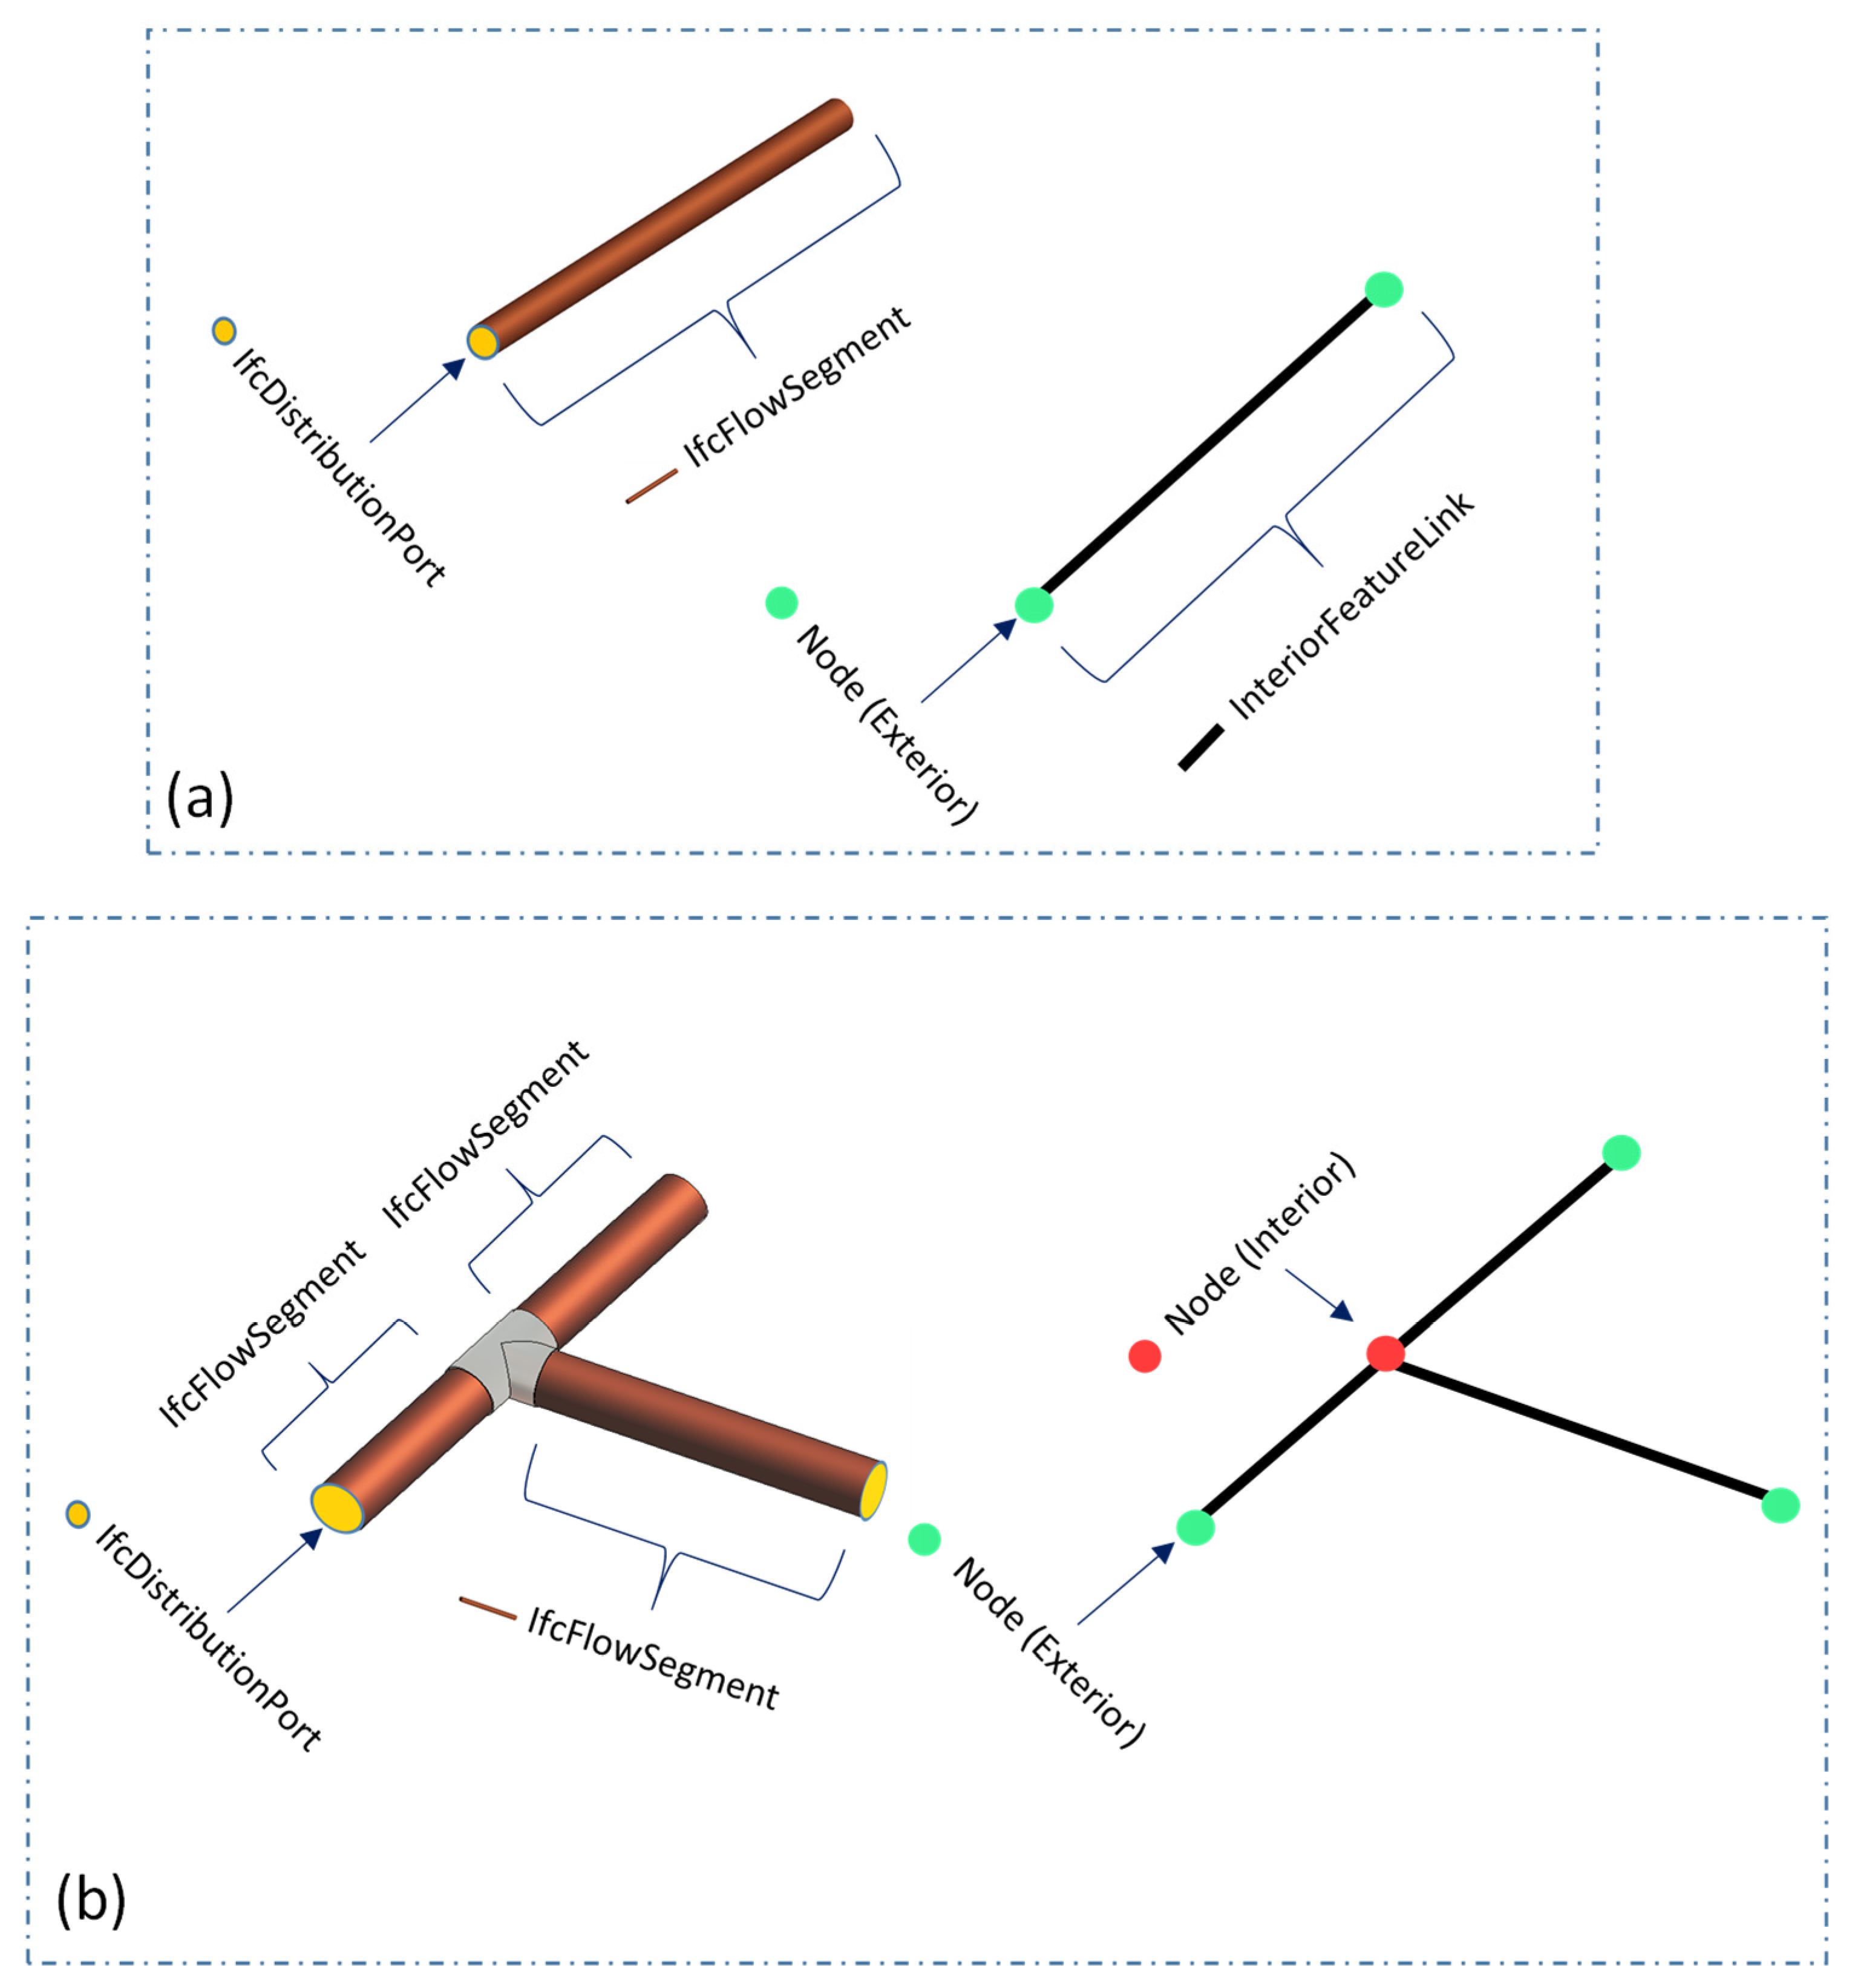
BIM has more capability and advantages in model creation, management, and editing at the object level, while GIS can store, manage, and visualize large-scale models. The proposed framework integrates the utility BIM model into the GIS through the mapping of IFC to CityGML. IFC is considered as the data format for BIM, while CityGML is chosen for GIS as they are the widely used and accepted neutral data schemas [42].

2.3.1. IFC Schema

The IFC is an open standard data model used for the integration and exchange of BIM data. It was introduced by buildingSMART international in 1994, which is a widely recognized schema for representing the BIM model and is supported by many BIM applications and tools [43]. It follows an object-oriented hierarchy, having objects with predefined attributes such as geometry, name, and materials that are inherited by relationships.
The latest IFC version (IFC 4) defines IfcDistributionFlowElement, the subtype of IfcDistributionElement, providing all the elements of a distribution system such as a utility infrastructure system facilitating the distribution of energy or matters. Examples of these distribution matters can be air, water, or power, and the flow element can be pipes, ducts, wires, equipment, and fittings. The subtype of IfcDistributionFlowElement defines the pipes and related component types, properties, and relationships. This subtype includes (1) IfcFlowController, regulating flow over the distribution system such as valves and flow meters; (2) IfcFlowFitting, which defines the junctions and transition in a distribution system such as elbows and junctions; (3) IfcFLowMovingDevice, which is circulating the flow of liquid or gas in the utility pipe system such as pumps, fans, and compressors; (4) IfcFlowSegment, defines the pipes and cables segment; and (5) IfcDistributionPort provides the connection of pipes in a system. Each of the entities in the system has its defined attributes, and the pipes are connected with the nodes using IfcRelConnectsPortToElement.

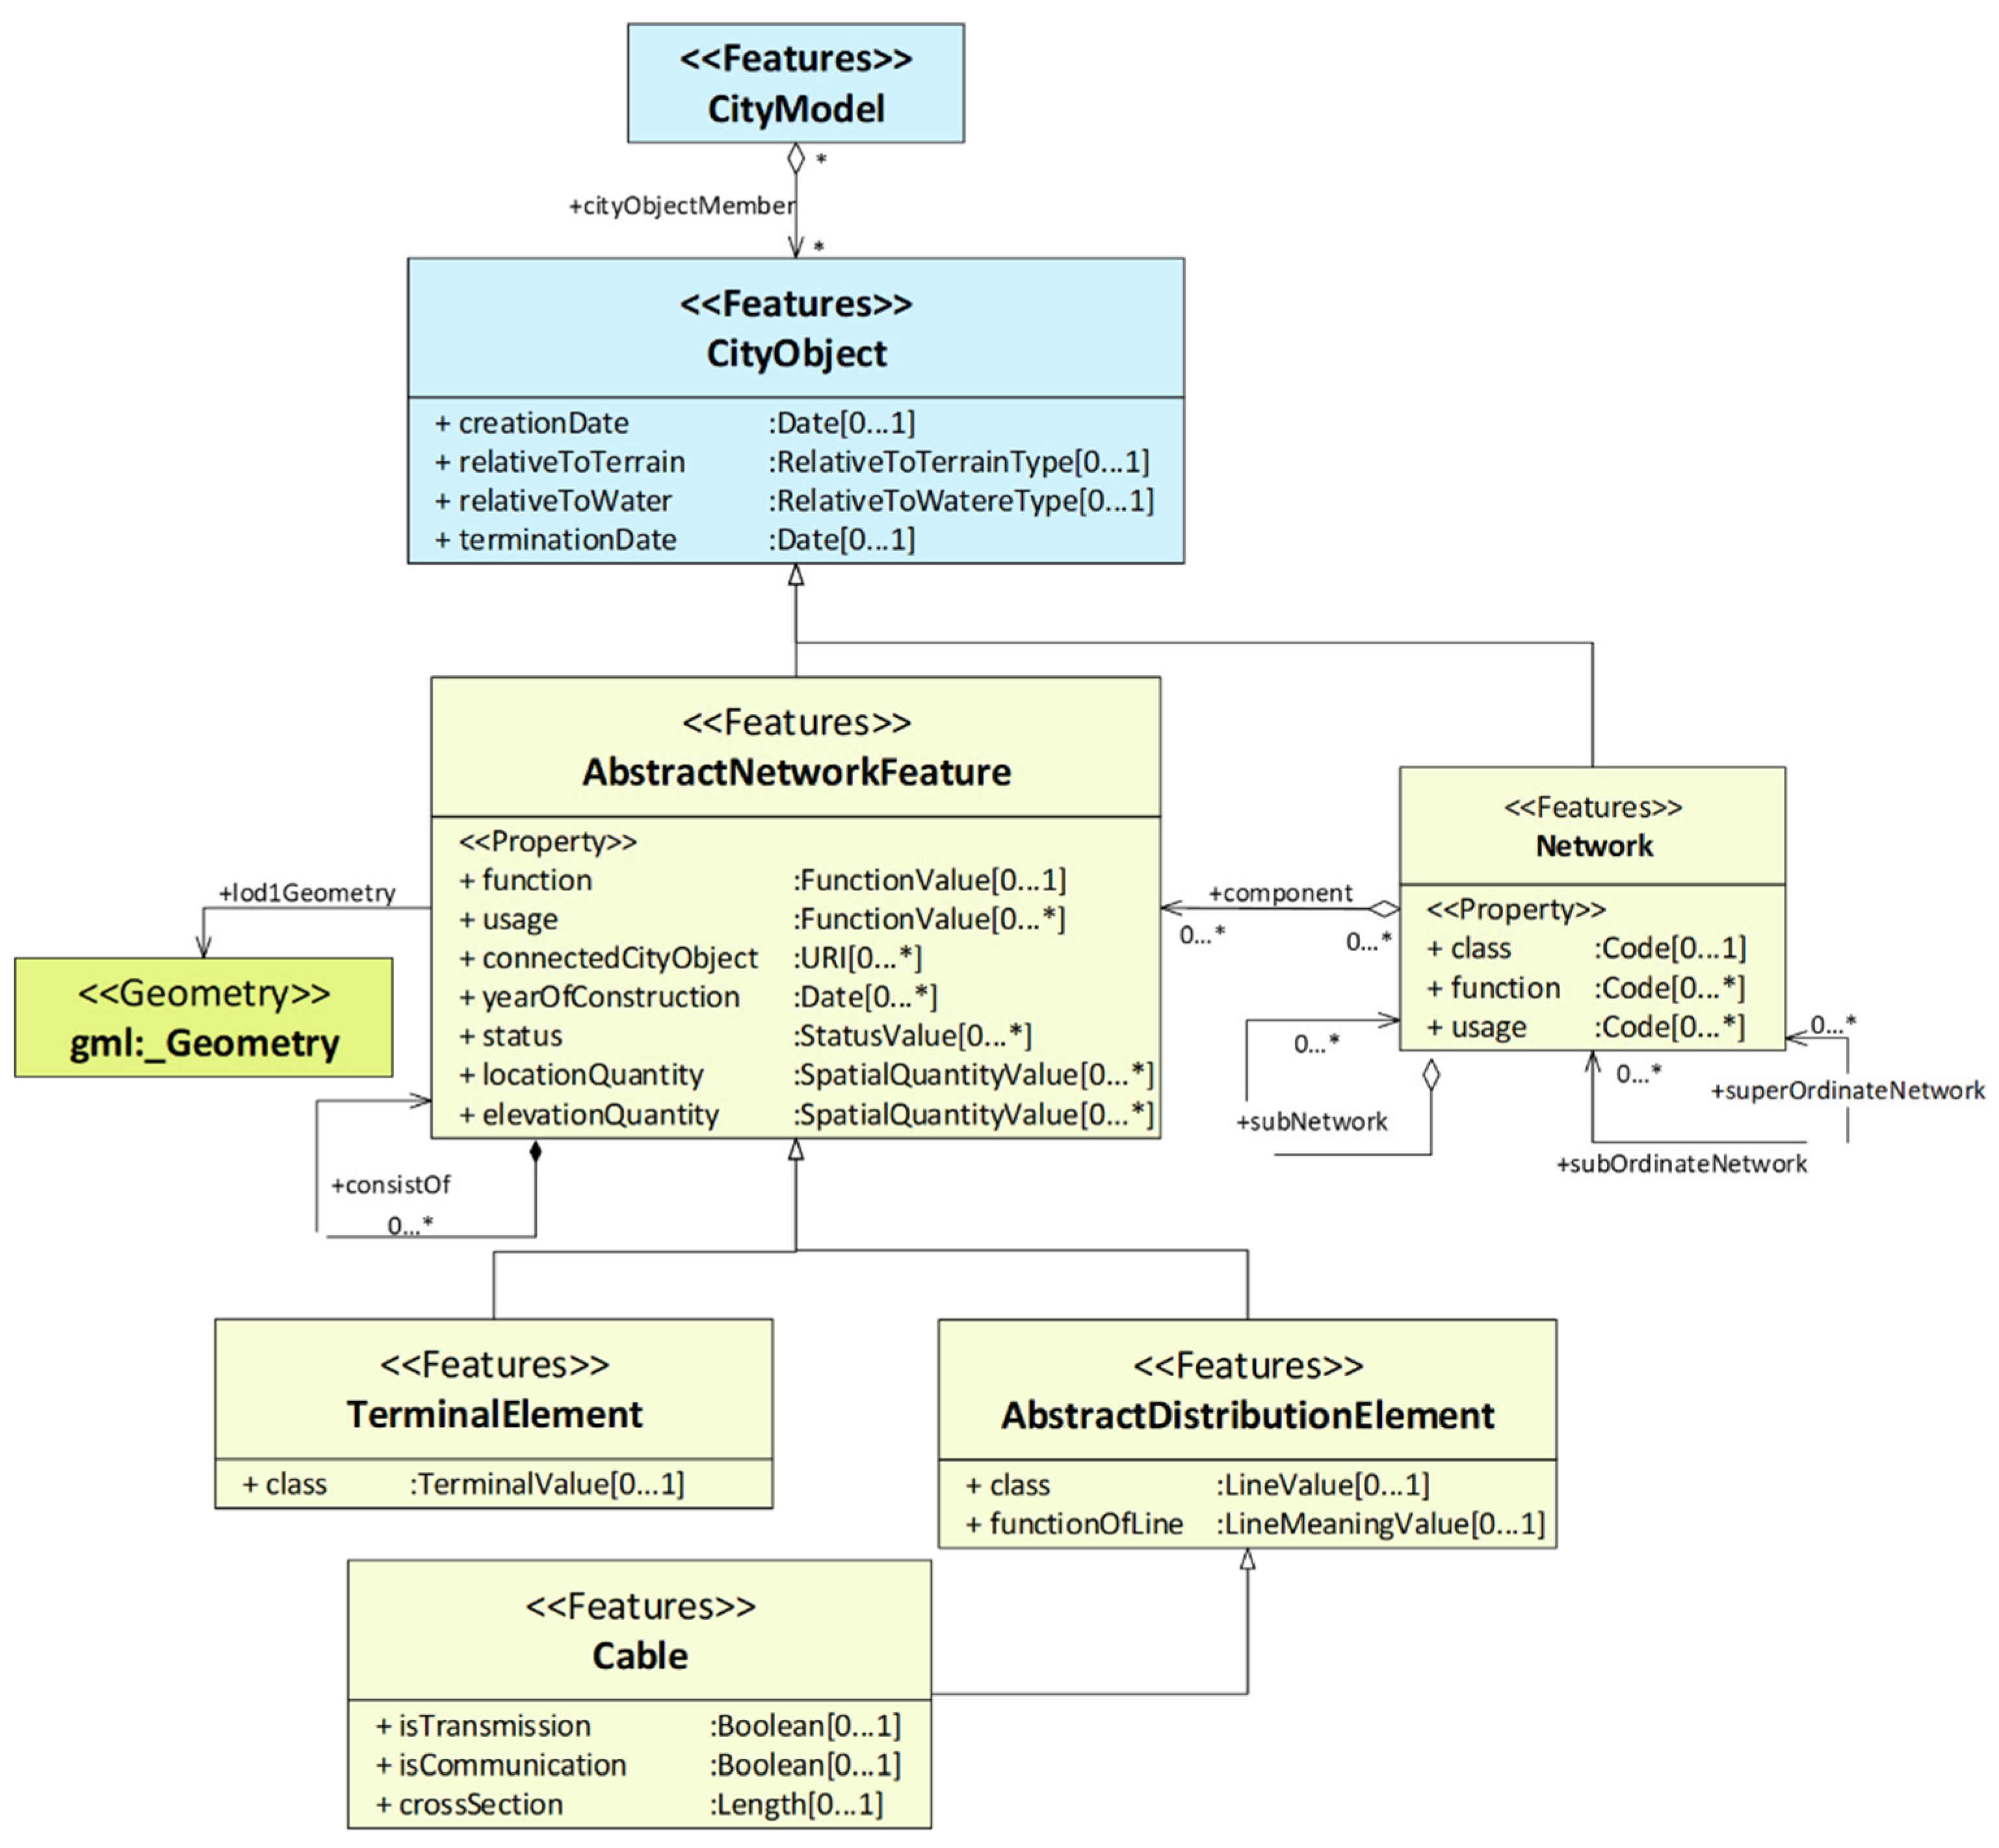
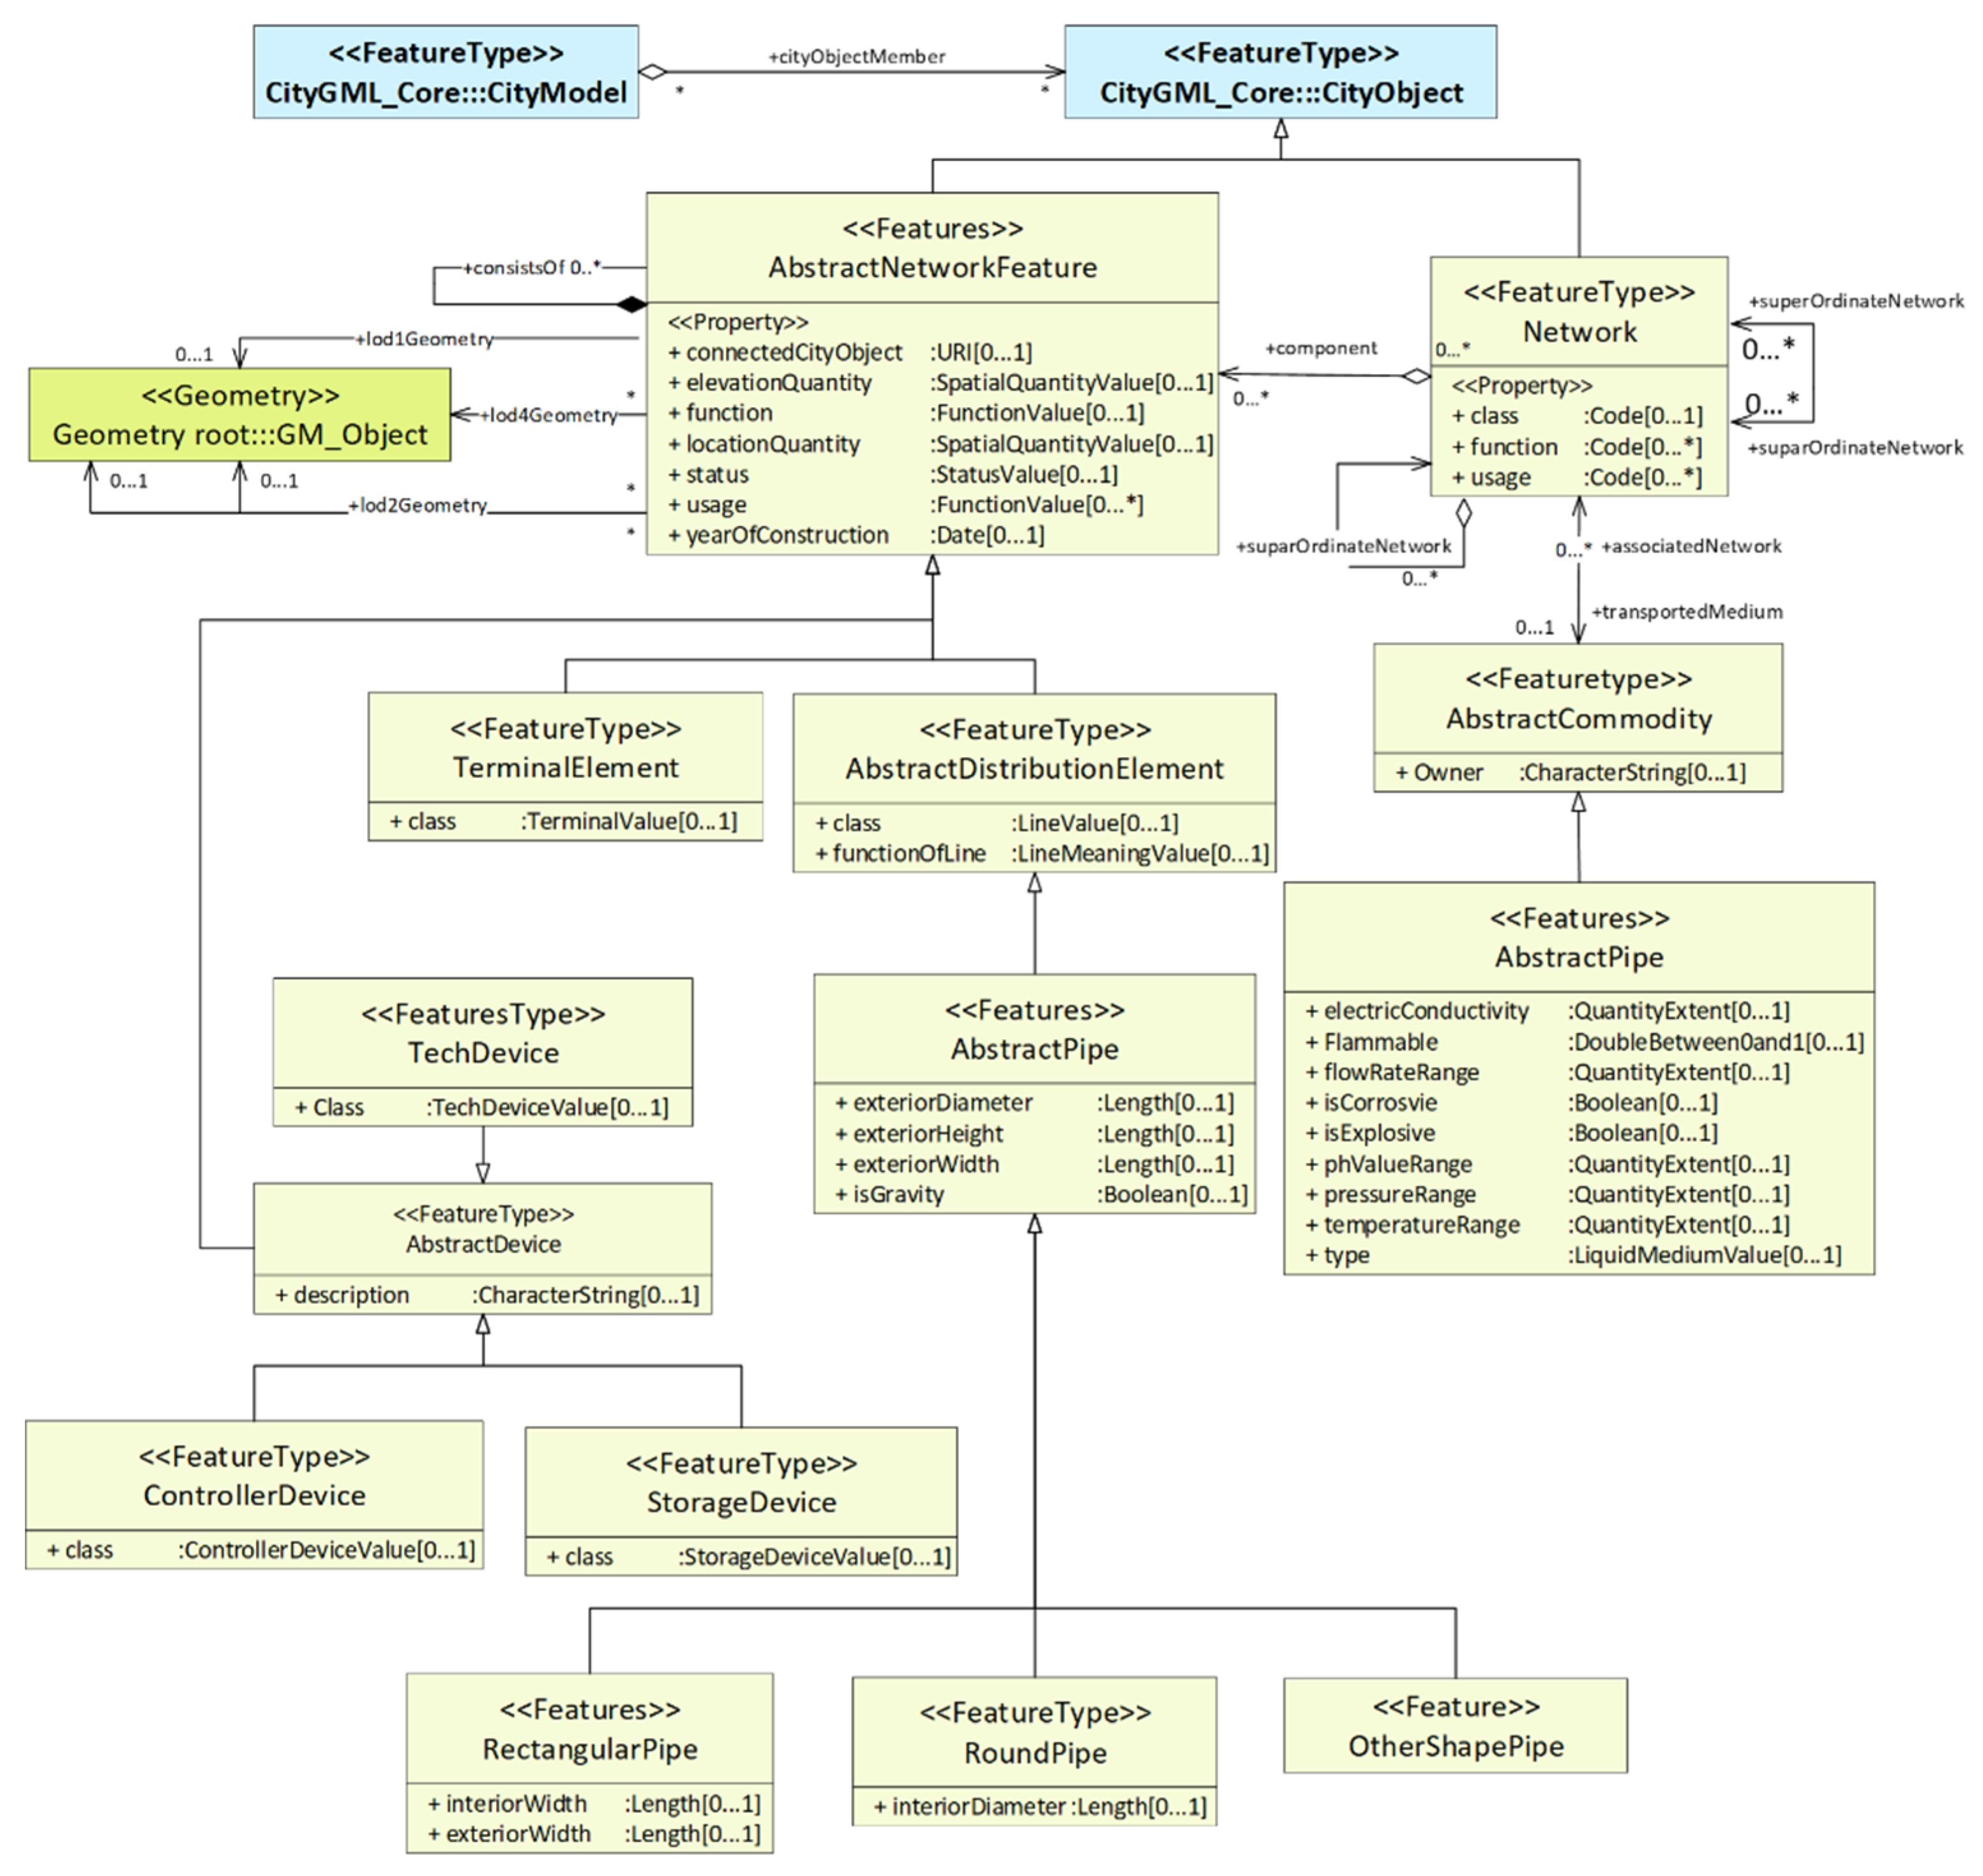
2.3.2. CityGML Schema

CityGML is a neutral open and XML-based format to store, represent, and exchange the virtual 3D city model in the GIS domains. It is not limited to the shape and graphical presentation but also contains the object semantics. It has been developed by Open Geospatial Consortium (OGC) to support the spatial data exchange and provide a common neutral data format definition to the 3D city data models and features [44]. It includes the geometric and thematic definition of a city object or feature. All objects have a base class and inheritance from _CityObject. The model geometric definition in the CityGML represents the shape and topology, while the thematic definition provides geometric model’s application in different contexts such as buildings, sites, tunnels, and roads. Many objects have been modeled in the CityGML, whereas models that are not defined can be represented using generic models and attributes [45]. Furthermore, the model definition is extendible in the CityGML using the concept of application domain extension (ADE).
This study uses the CityGML utility network ADE, which provides a promising representation of the utility network due to the following characteristics: (1) it represents simultaneously all types of networks such as sewer, electrical, and telecommunication; (2) it provides topologic and topographic representations in 3D of the underground utilities; (3) it represents the utility model at the feature and network levels in a hierarchical manner; (4) it shows the relationship between utility network and other city models; (5) it has applicability to all types of areas and is not limited to only urban areas; and (6) it provides a neutral, open data model where utility data can be integrated and shared seamlessly among stakeholders.
The research employs the core module of the CityGML utility network for electricity, sewer, and water supply networks. Figure 6 shows the employment of the CityGML utility network core module for the electricity network. As cables are used to transport electric current, cable class is utilized to represent the electricity network. The cable class has an inheritance relationship with the superclasses AbstractNetworkFeature and AbstractDistributionElement, which shows that the cable class contains all the properties of these superclasses. Different kind of cables can be represented with the same class as it contains the feature class description. The attribute of the classes is used to distinguish between different types, such as attribute status representing the state of the electricity cable whether it is in use or not. Furthermore, the connectedCityObject attribute is used to connect the below-ground objects with the above-ground, and yearOfConstruction represents the construction date of the utility, which is very useful during the inspection and maintenance stages as it describes the lifecycle.
Figure 7 represents a UML class diagram that shows the mapping of the sewer and water supply network classes to the core module of CityGML utility network ADE. The AbstractPipe class is used to show the sewer and water supply network with feature class descriptions that distinguish among different types. Moreover, it has an inheritance relationship with the superclass AbstractNetworkFeature and AbstractDistributionElement. The network pipes can have different shapes, and therefore AbstractPipe was assigned subclasses of RectangularPipe, RoundPipe, and OtherShapePipe. The attributes in these classes provide extra features to the class, as isGravity attribute has a Boolean data type that shows either the network is flowing under gravity or not. In the case of cross-sectional shape representation, the interiorDiameter is used in the case of round pipe, while interiorWidth and interiorHeight are used for the rectangular pipes.

2.3.3. Mapping from IFC to CityGML Schema

The IFC and CityGML information mapping exist when considering the above discussion on both standards for the utility infrastructure as IFC containing IfcDistributionFlowElement with subclasses, and CityGML provides utility network ADE having Network and AbstractNetworkFeature classes. The core component in the CityGML is the Network class. AbstractNetworkFeature class has an aggregation relation with the network class, which can provide subclasses for the utility infrastructure objects and elements accordingly.
In this study, the IFC elements were mapped to CityGML. The entity IfcDistributionFlowElement can be mapped to the AbstractNetworkFeature class. The subtypes of IfcDistributionFlowElement, such as IfcFlowSegment, IfcFlowFitting, and IfcFlowController, can be utilized to make the utility network in the CityGML. Furthermore, the IFC’s unique ID provided by IfcGUID can be used to link each of the utility BIM components and their attributes to the same feature in the CityGML. The pipe is connected to the utility infrastructure in two ways: physically and logically. IFC uses IfcRelConnectsToElements and IfcRelConnectsPorts for the connectivity between pipes and representing the topological relationship. The same connectivity can be adopted in the CityGML using NetworkGraph. The utility network objects can be represented with graph representation. It includes a node or group of nodes for the joints and ends (connections), while edges for the pipe segments. Moreover, other objects such as pumps and reservoirs can be represented with the use of _NetworkFeature. Figure 8 shows some of the possible scenarios in graph representation. Thus, the proposed method can successfully integrate BIM and GIS for the utility network by mapping IFC into CityGML using the above-discussed classes.

2.4. Application Layer

The developed BIM-GIS framework contains all the information about the utility infrastructure used for many purposes during the planning, construction, and operation stages. The application in the context of this paper is the visualization, use of 3D BIM model in machine guidance, facility management, and clash detection.

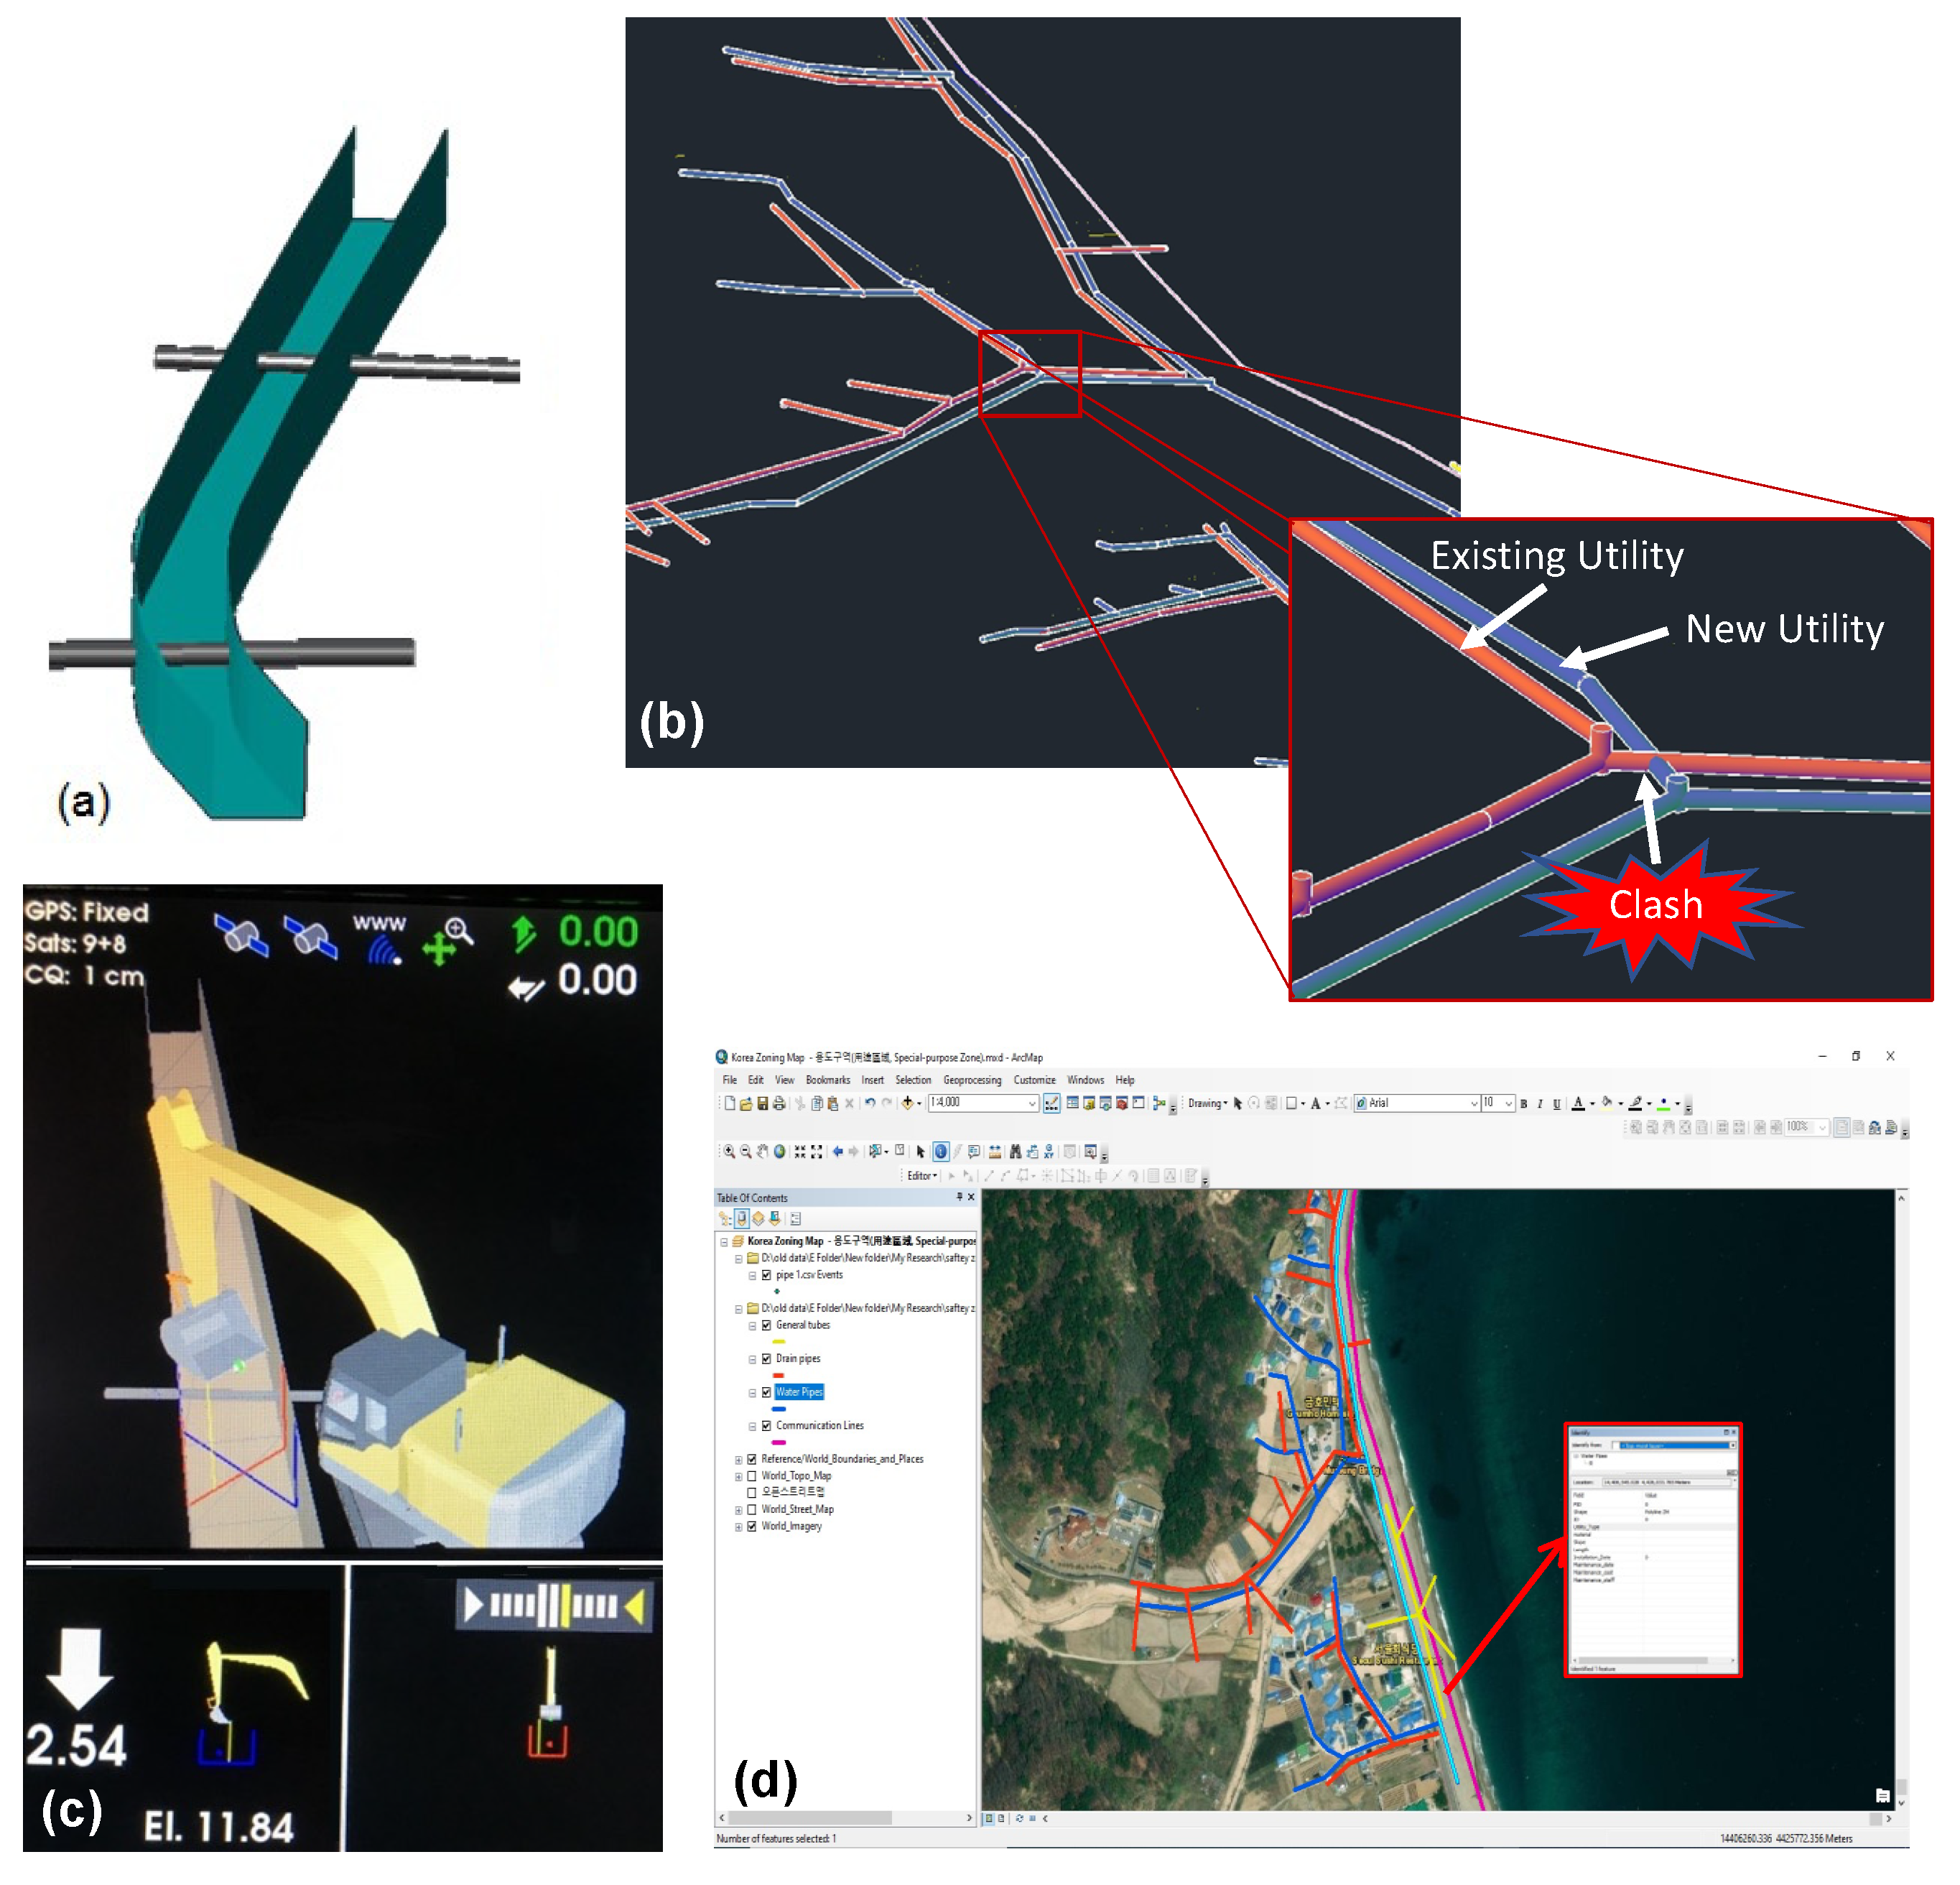
2.4.1. Visualization

Once the utility infrastructure has been modeled in the BIM-GIS platform, each network component and whole network will contain geometric information and semantic information. The BIM model of the underground pipe network provides geometric visualization in 3D of each part and detailed semantic information. Clear and better visualization of the project design facilitates the project participants in the construction planning and execution [46]. The geometric and semantic visualization and the other urban data layers such as geographic terrain, details on the terrain, surrounding facilities, and other ground and underground infrastructures can be realized in the GIS environment. Furthermore, the status condition and type of each utility can be differentiated by various colors that provide a clear and better understanding of the whole network to the stakeholders.

2.4.2. Machine Guidance

The use and implementation of machine guidance (MG) system in the construction equipment is the base of intelligent construction technology for earthwork projects that increases efficiency and site productivity. The MG system provides a target/design model and equipment position to the equipment operator. It uses a 3D surface model to represent the design model that helps the equipment operators safely excavate strikes [47]. The developed system provides a ready-to-use 3D model of utility and design surface for implementing the machine guidance system. The use of a developed system provides an opportunity for construction managers to conduct safe excavation during construction.

2.4.3. Facility Management

The inspection and maintenance work are required either due to the failure of the utility system or according to the routine schedule such as weekly or monthly. However, during the inspection or maintenance, information about the utility is not readily available, making the system ineffective and causing time delays and cost overruns. On the basis of the proposed framework, the BIM-GIS integrated model provides ready-to-use information about the underground utilities in 3D that can be used by the inspection and maintenance team to depict the location, type, and material of each pipe segment. Furthermore, each pipe is attributed to the semantic information needed for the inspection.

2.4.4. Clash Detection

During the operation stages, repairs and rehabilitation activities are common. Traditionally, the utility information is either unavailable or is present in 2D CAD drawings. Using 2D CAD drawings for underground repair works is time-consuming, costly, and not reliable. In addition, it is very difficult to retrieve the depth, type, and material of the underground utility from 2D drawings that cause a potential collision between utility lines. With the proposed framework, the 3D models can be utilized to check the automatic design and constructability. Many BIM tools such as Civil 3D and Naviswork and GIS tools such as ArcGIS provide capabilities to detect collisions between 3D utility models. It is supposed that new utilities will be developed in the future or old systems will be extended. In this case, the developed framework can be used to obtain the 3D model and the semantic information about the type, material, etc. that will help in further actions.

3. Implementation of the Proposed BIM-GIS Utility Infrastructure Framework

The proposed methodology was practically implemented in a case study of an earthwork project location on South Korea’s eastern coast near Uljin City. The project consisted of installing a new sewer line to collect daily wastewater from households living in several communities near the coastal area (Figure 9). It sends its water treatment plant to clean it before throwing it back to the sea. This project was designed to improve the water quality of the coastal environment and marine life, as well as providing better sanitation for the residents. The contractor’s problem was to install approximately 10km of a new proposed sewer line; however, there were already existing utility lines for sewer, communication, and drainage. There was very limited information available on the existing utility lines. The contractor can face serious financial consequences if any of the existing utilities were damaged, as they belong to different service providers. The proposed system facilitated the constructor to perform the earthwork operation without any utility strike successfully.

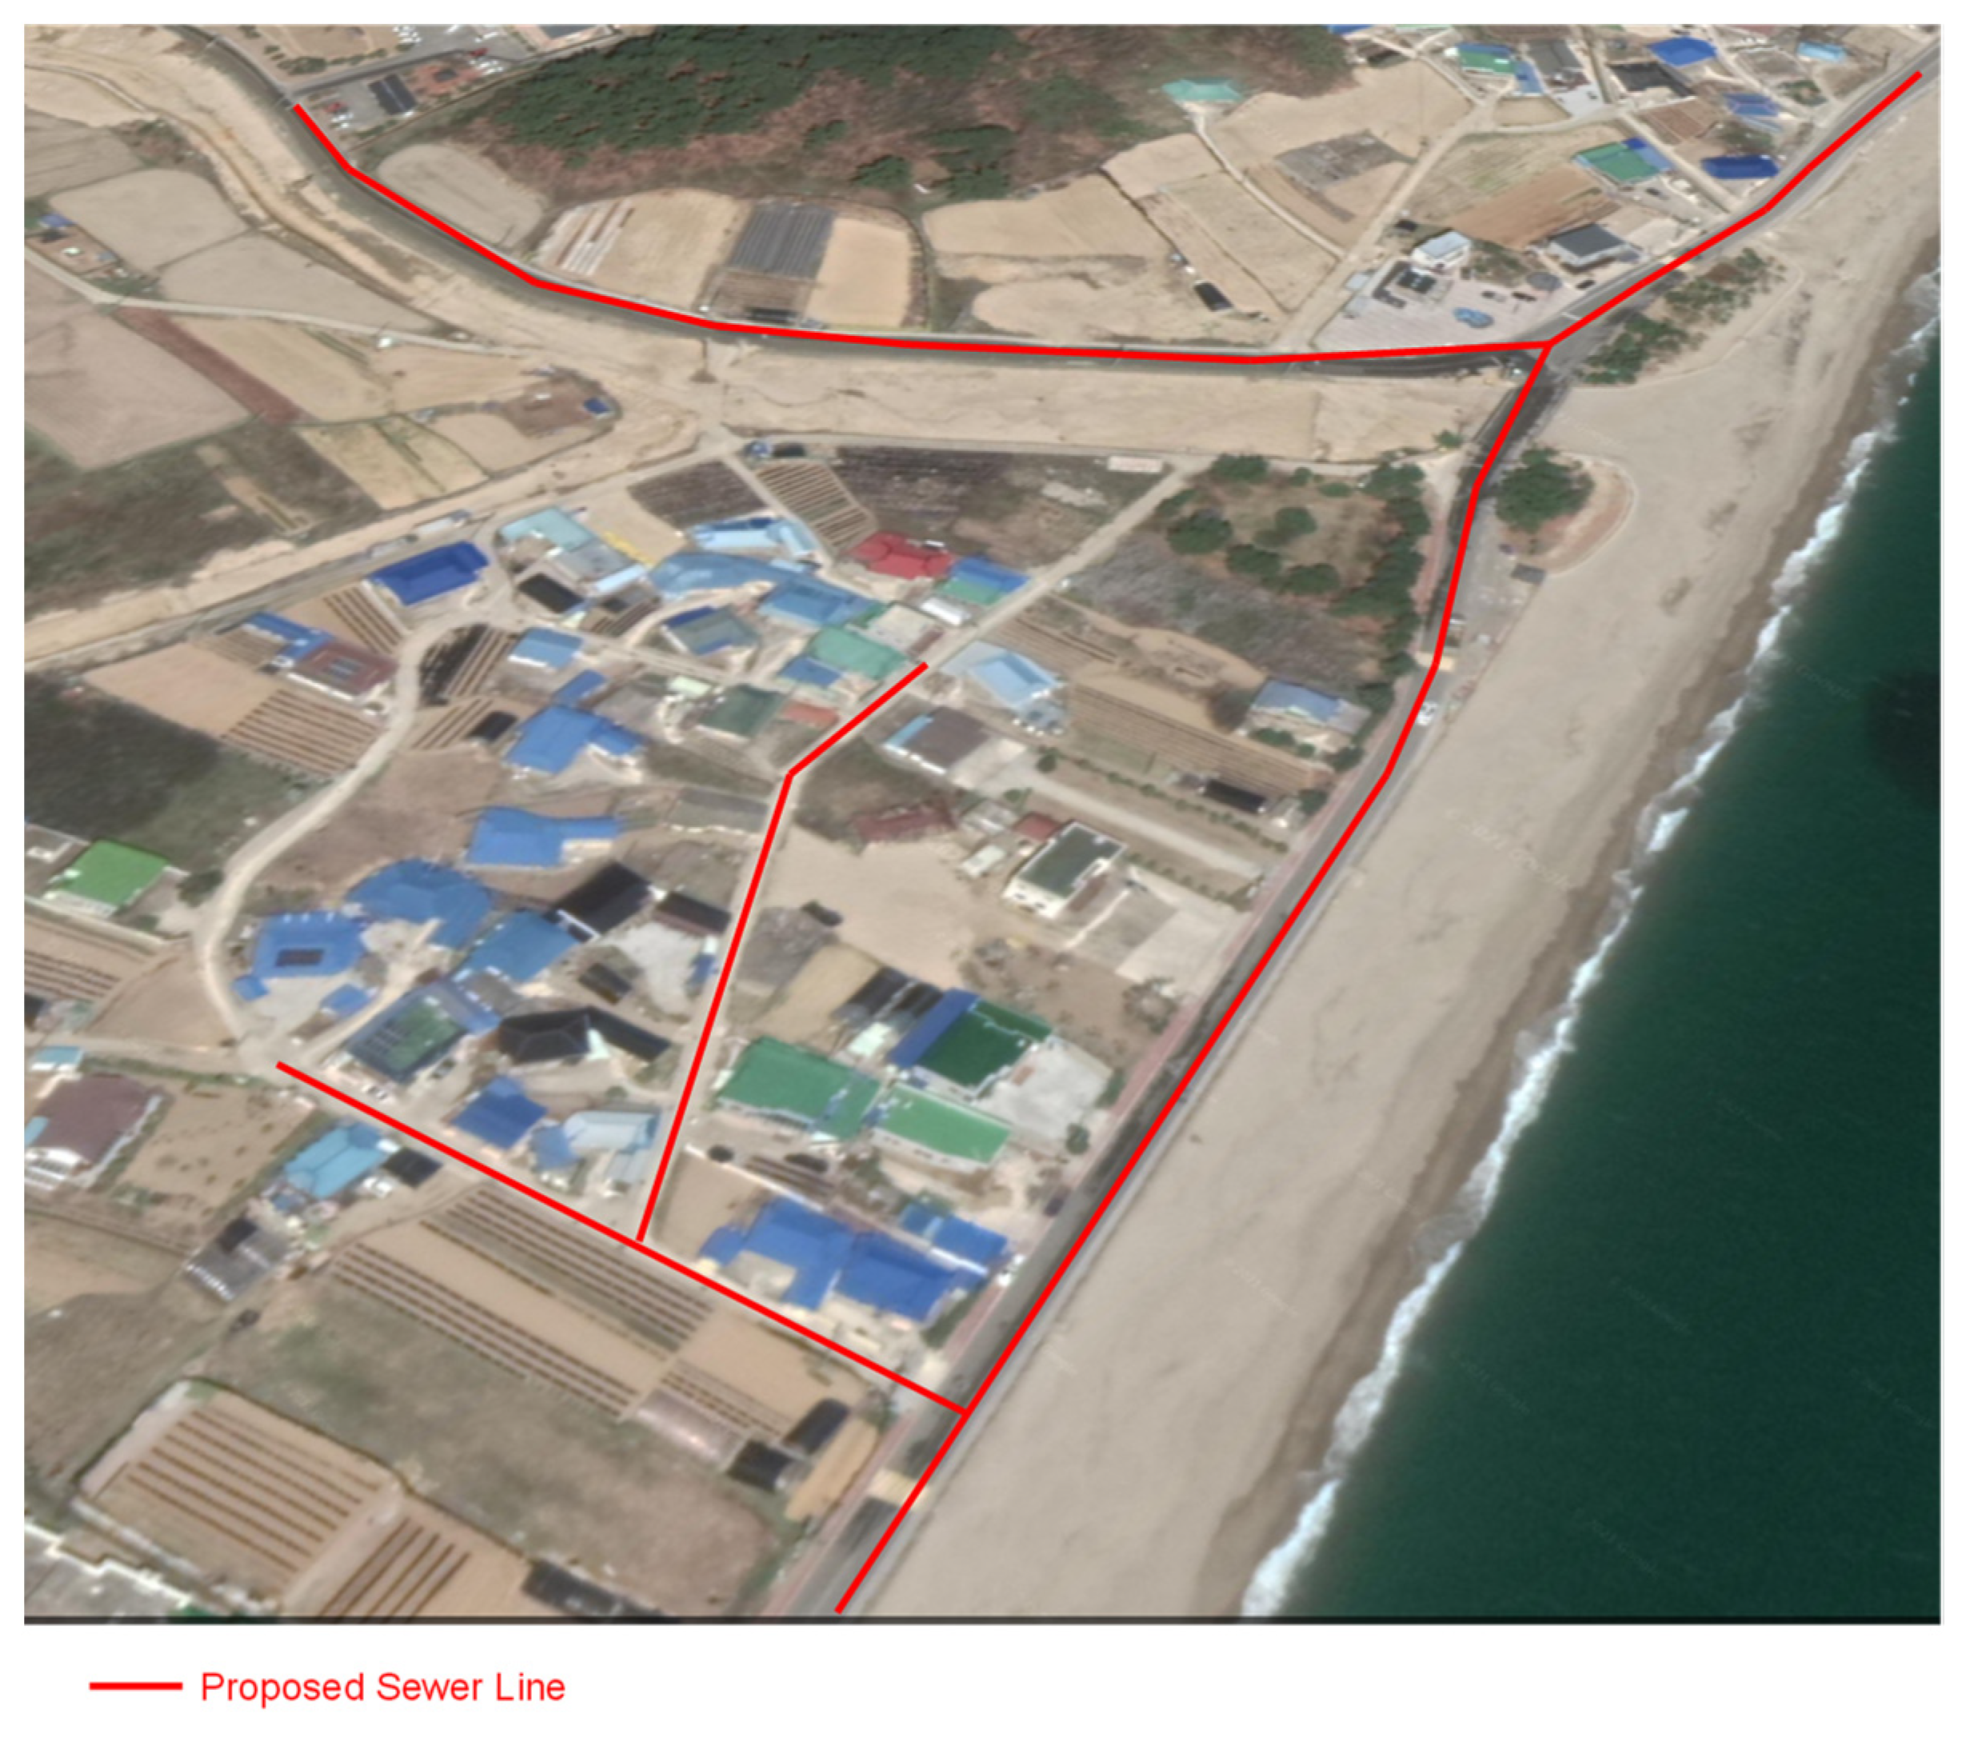
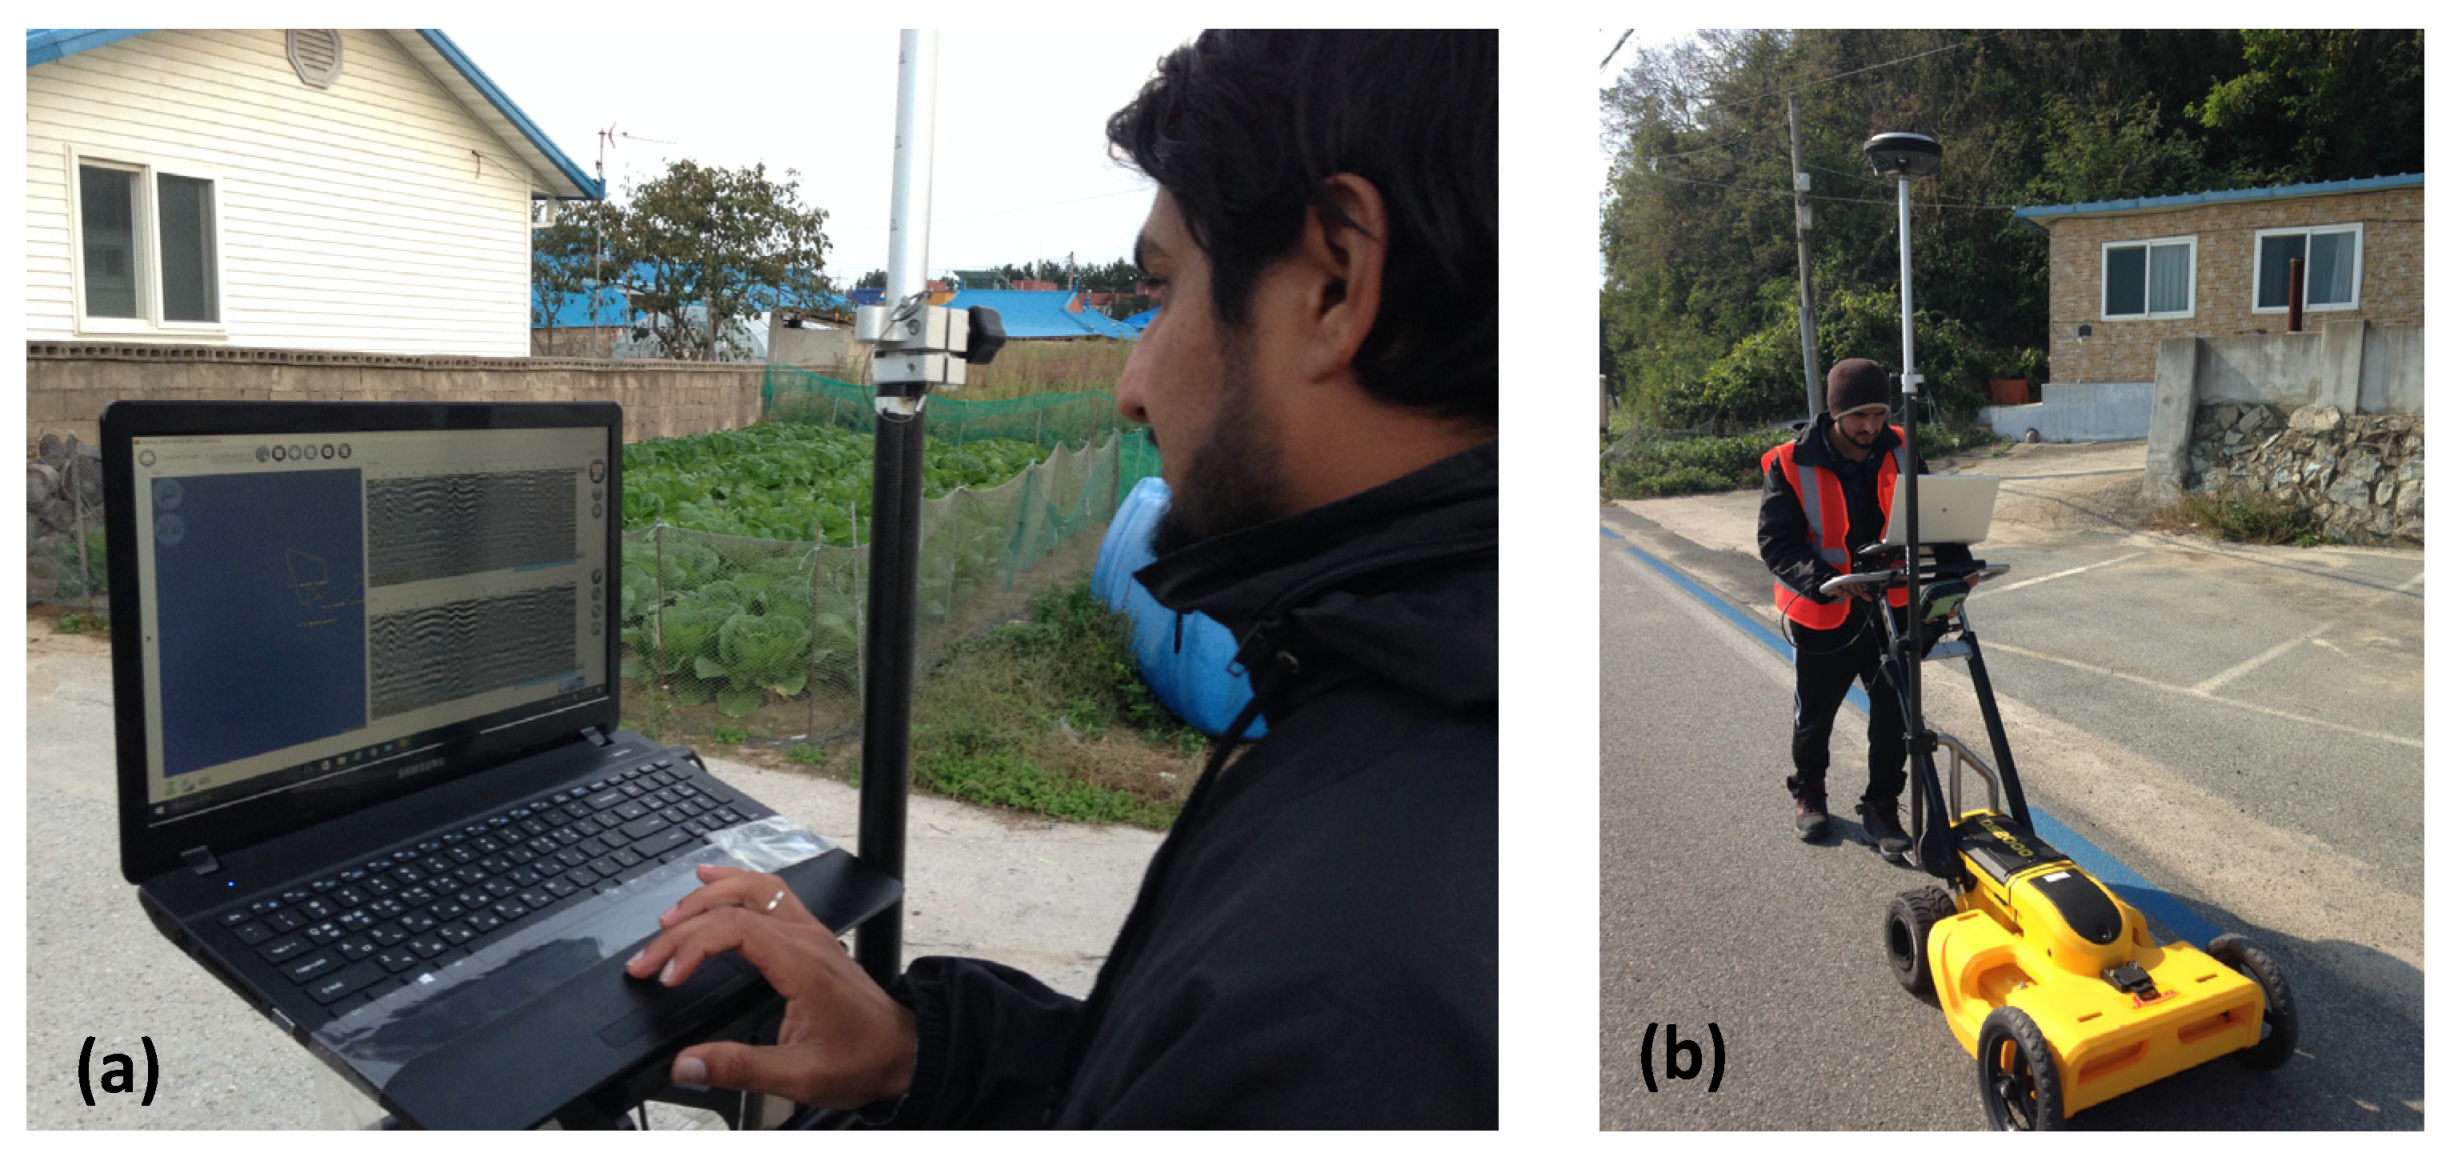
3.1. Data Collection

To collect the existing terrain information, DJI inspires 2 to fly speed up to 54 km/h equipped with the Zenmuse Z15, having a three-axis gimbal with 360° rotation angle, with speed control being used. A total of 775 images were collected in the research area to develop the existing terrain surface model. Several GCPs (ground control points) were established with RTK GPS’s help before the UAV flight.
The first existing utility drawings from the local government and service providers were obtained to collect underground utility information. Then, a Leica DS 2000 GPR equipped with RTK-GPS was used to provide the detected underground’s exact location (Figure 10). A combination of GPR and GPS is highly recommended to obtain the underground 3D information of utilities [48,49]. GPS projects the XY coordinates on the surface terrain information with depth information as vertical reference position from datum surface. Electromagnetic scans of a 2.5 km road network with a width of approximately 5 m were recorded with hybrid GRP/GPS using overture software to determine underground utility information.

3.2. Data Processing

For this research, the commercial software Pix4D mapper was used to develop a georeferenced 3D point cloud model from captured 775 airborne images and 10 GCP, as shown in Figure 11. It used machine learning technology to distinguish and classify the color point cloud into five groups: ground, road surfaces (covered with asphalt), high vegetation, buildings, and human-made objects. All the captured 775 airborne photographs were transferred to the computer. For the processing of electromagnetic scans to interpret the underground utility information, we analyzed recorded GPR in overture software on the basis of patterns (Figure 12).

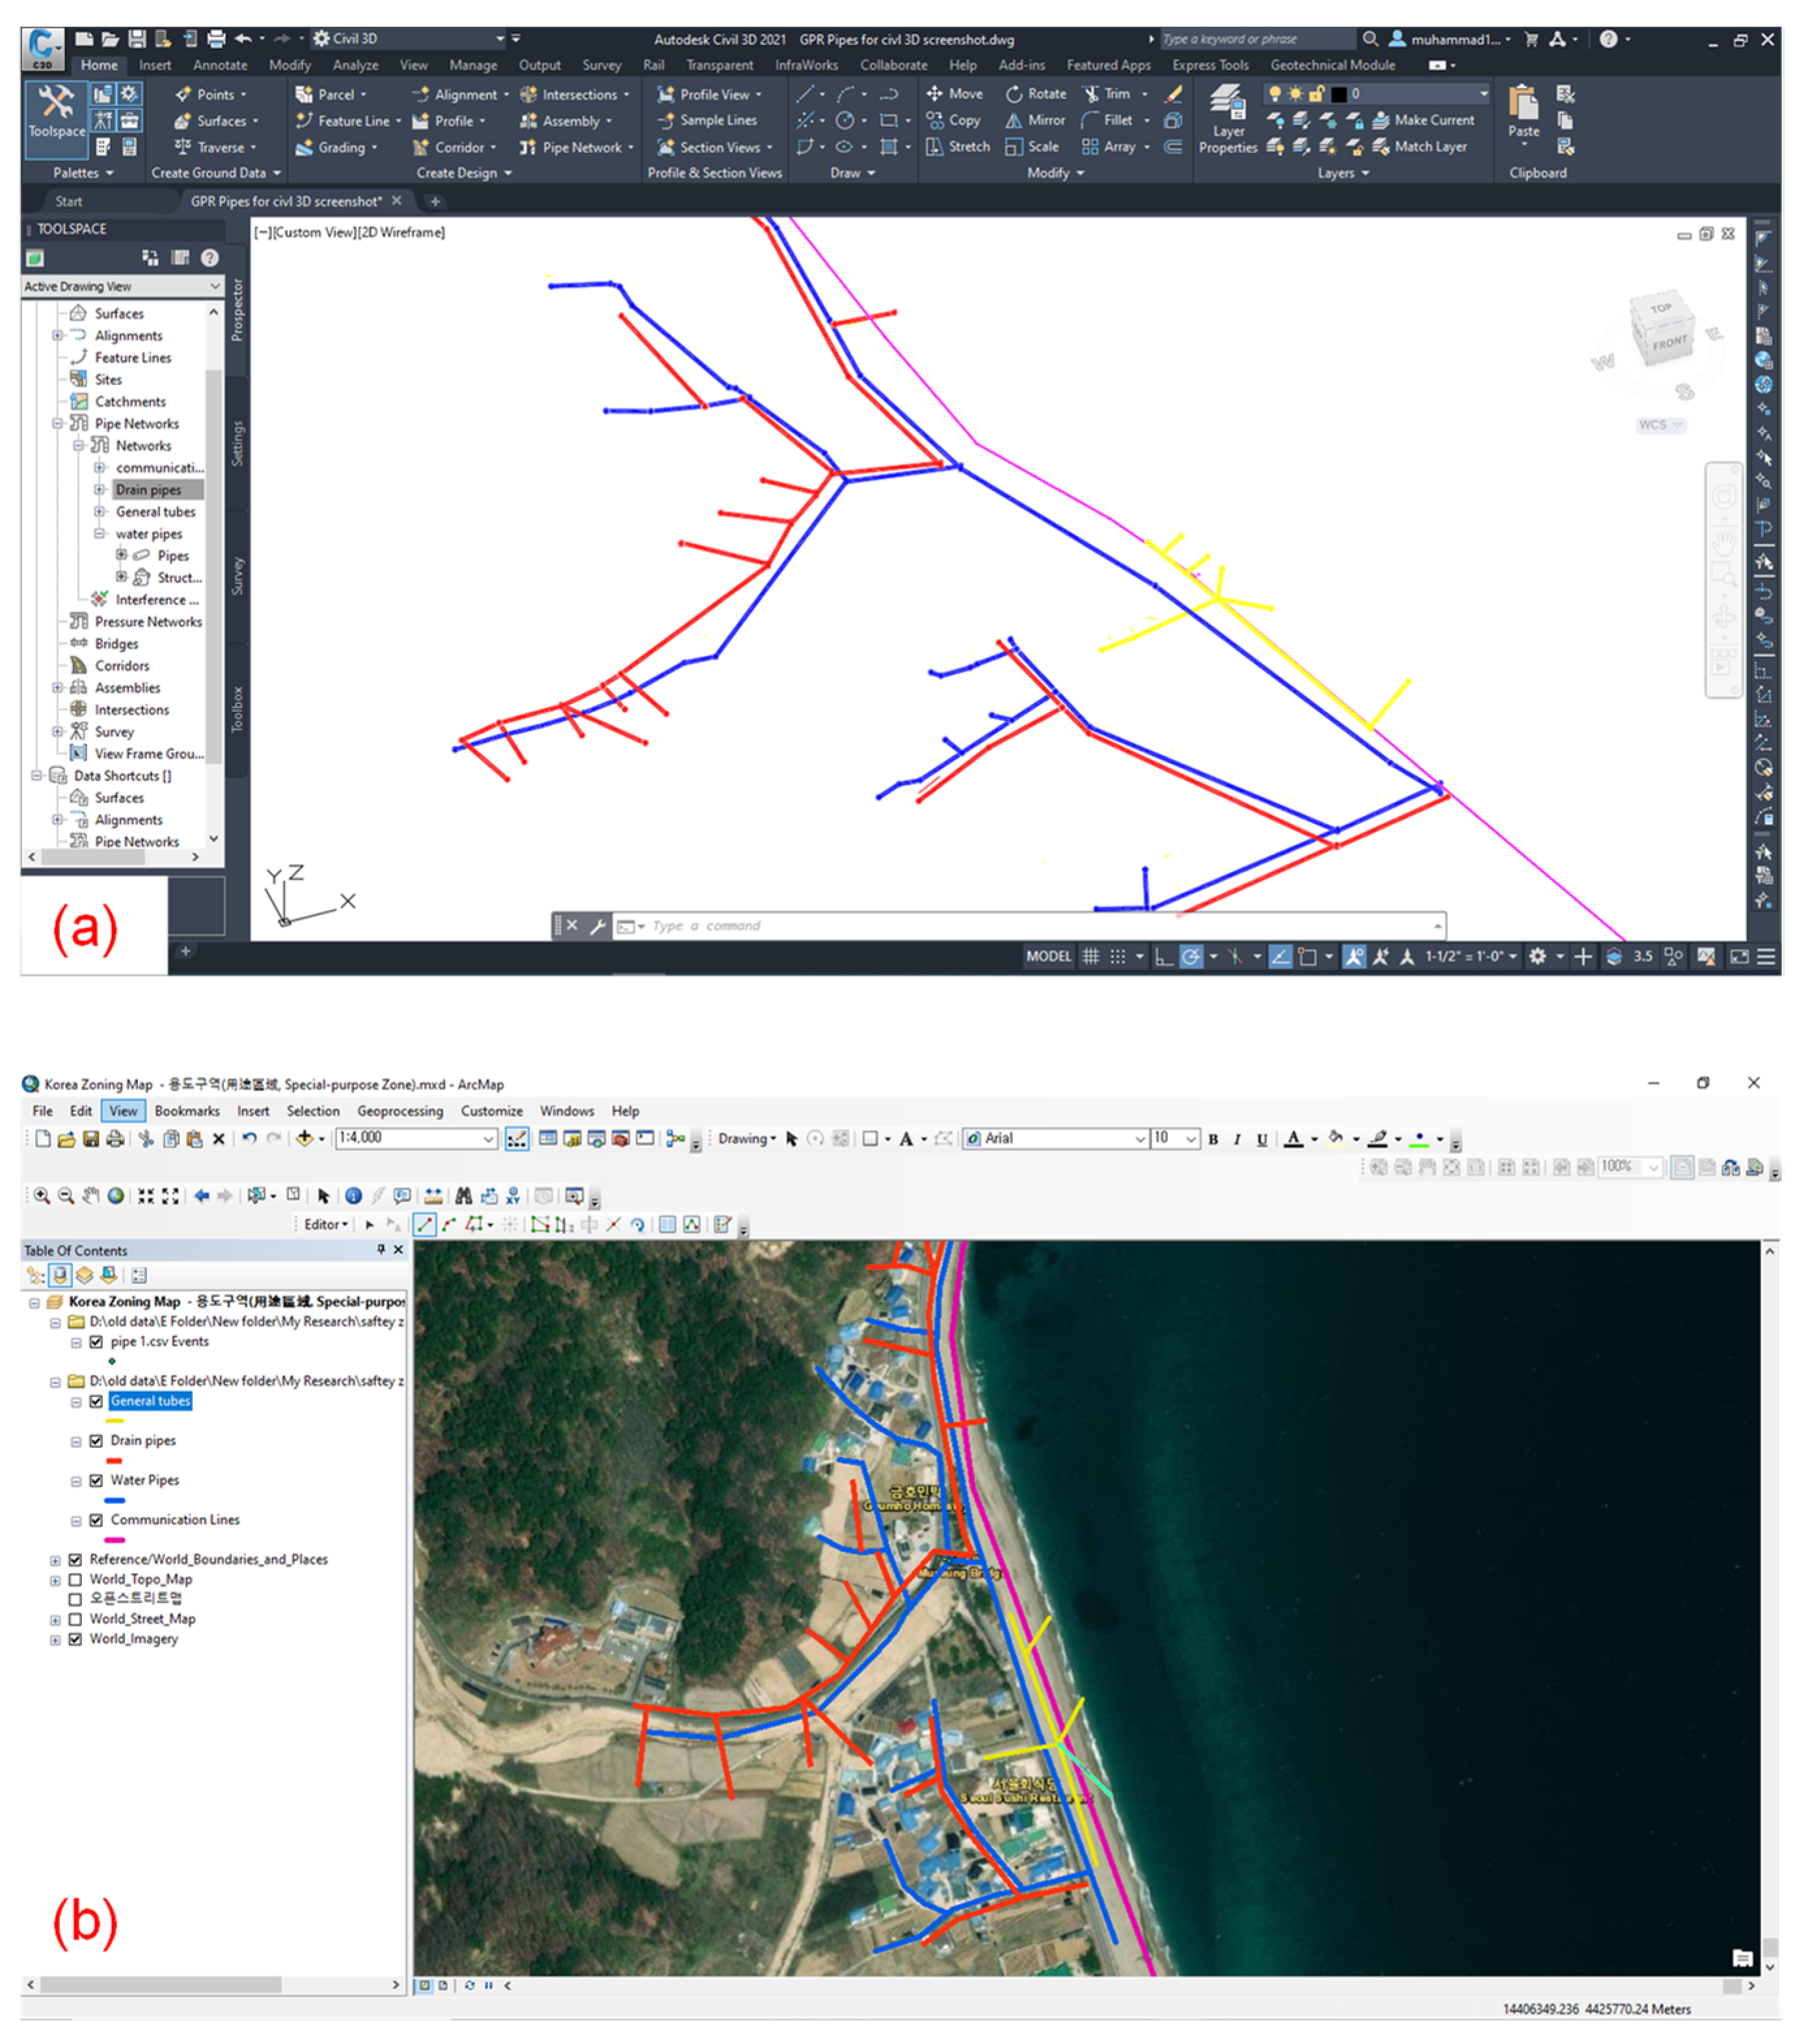
3.3. Integrated BIM-GIS Modeling

The UAV-collected information is available in point clouds depicting the surface information in a high resolution with great details. The depth, diameter, material, and type of underground pipes were collected from the GPR survey and converted into a spreadsheet with all the information in fields. The steps involved in the development of the integrated BIM-GIS model are illustrated in Figure 13. The case study site model can be represented using a surface representation that provides all the details, including ridges and valleys. The triangulated irregular network (TIN) surface was used to model the topography information. A BIM tool, civil 3D, was utilized to convert the point cloud model into a surface model. The modeling of utility pipe networks included the existing pipe modeling and the newly designed utility system. The processed information from the GPR survey and information collected from the local authorities were used for the underground utility models. The utility pipes were modeled in civil 3D using the available information. A 3D BIM model was generated, appending the utility system’s semantic information of utility pipes. The benefit of appending extra information to the pipe section is that it can be utilized during the later stages for operation and maintenance stages. The added information was stored in the IFC schema. On the basis of the integration process of IFC and CityGML explained in the previous section, we integrated the 3D BIM model of the utility network into ArcGIS, utilizing the utility network GIS extension. The different types of utilities were stored in different layers. The models of utility network are presented in Figure 14a,b. The different colors characterize the utility types with different semantic properties that facilitate the stakeholders at different stages.

3.4. Application

The BIM-GIS model provided all the necessary information about the location, size, material, utility type, owner, installation date, and inspection and repair data that provides useful information from planning to the execution phase of any excavation project. The developed platform provided the 3D design drawings, excavation volume, cost, and schedule at the design stage. During the construction phase, it provided the real-time 3D visualization of the underground utilities and 3D design model location to the excavator operator during excavation. Excavation work was successfully carried out without any utility strike.
Using the integrated BIM-GIS model, we were able to represent the utility models with great detail, having geometrical and semantic information that facilitates utility management. Each type of utility is represented with different colors that enhance the visualization. During the construction of new sewer pipes, the developed integrated models were used in the machine guidance. It shows the existing information to the excavator operators in a graphical display, thereby increasing the model’s visualization during excavation in real time. The use of the utility model helped the stakeholders to identify the clashes between existing and new designs. Figure 15a presents the model with utility pipes for the representation in machine guidance during excavation, while Figure 15b shows the utility clashes identified during this process. On the basis of the identified clashes, we changed the new utility sewer line design to different coordinates. The new design and existing utility design were displayed in the machine guidance to facilitate the excavator’s operator in real time. Figure 15c shows the visualization of utility models in the machine guidance during excavation.
The integrated model contains the necessary information in a database about each utility, such as utility name, utility type, unique ID, material, slope, and length that can be extracted. Furthermore, the maintenance data can also be obtained, such as installation date, maintenance date, maintenance staff, latest maintenance date, and maintenance cost. The final integrated model is such that all the related information is displayed when a utility component is selected. The integrated system stores the information associated with each utility component in a geodatabase. Figure 15d shows the information displayed on the user interface for a utility component. The proposed integrated BIM-GIS platform supports the visualization, simulation, and management of underground utility infrastructure that improves the efficiency of the traditional technique adopted by practitioners and facilitates them during the design, construction, and maintenance stage.

3.5. Evaluation

There are several diverse methodologies based on project benefits for evaluating BIM- and GIS-based systems. To evaluate the developed BIM-GIS-based integrated framework for an underground utility management system for earthwork operations, we adopted quantitative and qualitative approaches [50,51]. A practical case study evaluation of a 1.5 km section of installing a new underground utility was evaluated. The qualitative evaluation metrics were based on this developed framework’s goals and advantages (Table 2). Considering the proposed framework’s objectives, we compared this system’s qualitative superiority with traditional underground utility earthwork operations. The quantitative evaluation metrics were based on the actual implementation of this developed system during the case study project (Table 3). The evaluation metrics identified the importance, applicability, and superiority of a developed BIM-GIS-based underground utility management system.
The errors and uncertainty of the actual utility location were measured during the trial excavation by determining the actual utility location using a Leica Robotic Total Station and compared with the location of utility in BIM model. It was found that the error was within the range of ±100 mm (horizontal) and ±250 mm (vertical) with respect to actual utility locations.

4. Discussion and Conclusions

The visualization and management of underground utility infrastructure are very important, considering the traditional techniques during the design, construction, and maintenance stages. For example, the construction managers who use 2D drawings during the excavation face severe challenges such as utility strikes and lack of updated information system. Inefficient underground utility management causes direct damage to infrastructure, loss of life, and injuries, as well as a wider impact on the disruption of utility services to the consumers, project delays, and financial and legal consequences. 2D drawings are not capable of presenting enough information to facilitate construction managers in making effective decisions during the life cycle of the project. Furthermore, in the later stages, the information about existing utilities remains unknown because of a lack of inconsistent data records and a unified database. Therefore, an integrated framework is needed that is based on advanced technologies such as BIM and GIS. All the geometric and semantic information can be stored, managed, accessed, retrieved, and updated in a standard method at different project stages.
This paper proposes an integrated BIM-GIS-based underground utility management, facilitating stakeholders throughout the life cycle of the projects. The proposed framework is composed of the following layers: (i) data source layer, (ii) data processing layer, (iii) integrated BIM-GIS platform, and (iv) application layer. The proposed framework is based on data collection using advanced surveying techniques for surface and subsurface information. The collected and processed data provide accurate information to develop a BIM model. BIM models were developed using the information from data source layer, which provides surface terrain model from UAV photographs, underground utility information through GPR survey, and other necessary information from local authorities such as 2D CAD drawings, reports, and attribute information. RTK GPS was integrated with UAV and GPR data to improve the accuracy of the model. The BIM model was integrated with GIS using IFC to CityGML mapping. The integrated BIM-GIS model contains all the necessary information such as geometric and semantic information required during different stages in the utility design and maintenance.
The proposed BIM-GIS integration framework was successfully implemented on the real utility infrastructure project during the design, construction, and maintenance. The developed integrated BIM-GIS model facilitates the designers and construction managers to detect and prevent clashes between existing and new utilities during excavation design. It helped the construction managers and excavator operators during the excavation planning and execution phase by providing an accurate integrated model in the machine guidance system. Furthermore, it provided a database where all the necessary semantic information is stored and managed. The sharing and exchange of utility information will facilitate the stakeholders in the operation and maintenance stage or any future earthwork project in the area.

Author Contributions

A.S., M.S.K., W.P. and J.S. conceived the study and were responsible for the data analysis design and development. M.S.K., A.S., K.L., and W.A.T. were responsible for data collection and analysis. M.S.K., A.S., W.P. and K.L. were responsible for data modelling and analysis interpretation. J.S. was in charge of funding acquisition, concept development, and reviewing the article. All authors have read and agreed to the published version of the manuscript.

Funding

This research was funded by the Ministry of Land, Infrastructure and Transport (National Research for Smart Construction Technology, grant 20SMIP-A158708-01) and a National Research Foundation of Korea (NRF) grant funded by the Korean government (MSIT) (no. NRF-2019R1A2C2006577).

Institutional Review Board Statement

Not applicable.

Informed Consent Statement

Not applicable.

Data Availability Statement

Not applicable.

Acknowledgments

This work was supported by a Korea Agency for Infrastructure Technology Advancement (KAIA) grant funded by the Ministry of Land, Infrastructure and Transport (National Research for Smart Construction Technology: grant 20SMIP-A158708-01) and a National Research Foundation of Korea (NRF) grant funded by the Korean government (MSIT) (no. NRF-2019R1A2C2006577). Abubakar Sharafat is thankful to National University of Science and Technology (NUST), Pakistan, for providing the research facility. Kamran Latif is extremely thankful to the Higher Education Commission of Pakistan for a Human Resource Development Initiative–Universities of Engineering Science and Technology scholarship.

Conflicts of Interest

The authors declare no conflict of interest.

References

  1. Metje, N.; Crossland, S.M.; Ahmad, B. Causes, impacts and costs of strikes on buried utility assets. Proc. ICE Munic. Eng. 2015, 168, 165–174. [Google Scholar] [CrossRef] [Green Version]
  2. Sharafat, A.; Latif, K.; Seo, J. Risk analysis of TBM tunneling projects based on generic bow-tie risk analysis approach in difficult ground conditions. Tunn. Undergr. Sp. Technol. 2021, 111, 103860. [Google Scholar] [CrossRef]
  3. Kolera, B.T.; Bernold, L.E. Intelligent Utility Locating Tool for Excavators. J. Constr. Eng. Manag. 2006, 132, 919–927. [Google Scholar] [CrossRef]
  4. Su, X.; Talmaki, S.; Cai, H.; Kamat, V.R. Uncertainty-aware visualization and proximity monitoring in urban excavation: A geospatial augmented reality approach. Vis. Eng. 2013, 1, 1–13. [Google Scholar] [CrossRef] [Green Version]
  5. Guerrero, J.; Zlatanova, S.; Meijers, M. 3D visualisation of underground pipelines: Best strategy for 3D scene creation. ISPRS Ann. Photogramm. Remote. Sens. Spat. Inf. Sci. 2013, 2, 139–145. [Google Scholar] [CrossRef] [Green Version]
  6. Tanoli, W.A.; Seo, J.W.; Sharafat, A.; Lee, S.S. 3D Design Modeling Application in Machine Guidance System for Earthwork Operations. KSCE J. Civ. Eng. 2018, 22, 4779–4790. [Google Scholar] [CrossRef]
  7. Khan, M.S.; Khan, A.; Adil, M.; Khalil, F. Role of Building Information Modelling (BIM) in Building Design Industry. In Proceedings of the INUMDC 2018: Iqra National University Multi-Disciplinary conference, Islamabad, Pakistan, 7–8 November 2018; Volume 9, pp. 119–123. [Google Scholar]
  8. Du, Y.; Zlatanova, S. An Approach for 3D Visualization of Pipelines. Innov. 3D Geo Inf. Syst. 2006, Volume 1, 501–517. [Google Scholar] [CrossRef] [Green Version]
  9. Moon, S.; Seo, J. Virtual graphic representation of construction equipment for developing a 3D earthwork BIM. J. Civ. Eng. Manag. 2017, 23, 977–984. [Google Scholar] [CrossRef]
  10. Azhar, S. Building Information Modeling (BIM): Trends, Benefits, Risks, and Challenges for the AEC Industry. Leadersh. Manag. Eng. 2011, 11, 241–252. [Google Scholar] [CrossRef]
  11. Liu, X.; Wang, X.; Wright, G.; Cheng, J.C.P.; Li, X.; Liu, R. A state-of-the-art review on the integration of Building Information Modeling (BIM) and Geographic Information System (GIS). ISPRS Int. J. Geo-Inf. 2017, 6, 1–21. [Google Scholar] [CrossRef] [Green Version]
  12. Volk, R.; Stengel, J.; Schultmann, F. Building Information Modeling (BIM) for existing buildings—Literature Building Information Modeling ( BIM ) for existing buildings–literature review and future needs. Autom. Constr. 2014, 38, 109–127. [Google Scholar] [CrossRef] [Green Version]
  13. Tsilimantou, E.; Delegou, E.T.; Nikitakos, I.A.; Ioannidis, C.; Moropoulou, A. GIS and BIM as integrated digital environments for modeling and monitoring of historic buildings. Appl. Sci. 2020, 10, 1078. [Google Scholar] [CrossRef] [Green Version]
  14. Colucci, E.; de Ruvo, V.; Lingua, A.; Matrone, F.; Rizzo, G. HBIM-GIS integration: From IFC to cityGML standard for damaged cultural heritage in a multiscale 3D GIS. Appl. Sci. 2020, 10, 1356. [Google Scholar] [CrossRef] [Green Version]
  15. Irizarry, J.; Karan, E.P.; Jalaei, F. Integrating BIM and GIS to improve the visual monitoring of construction supply chain management. Autom. Constr. 2013, 31, 241–254. [Google Scholar] [CrossRef]
  16. Chen, Q.; Chen, J.; Huang, W. Method for generation of indoor GIS models based on BIM models to support adjacent analysis of indoor spaces. ISPRS Int. J. Geo-Inf. 2020, 9, 508. [Google Scholar] [CrossRef]
  17. Teo, T.A.; Cho, K.H. BIM-oriented indoor network model for indoor and outdoor combined route planning. Adv. Eng. Inform. 2016, 30, 268–282. [Google Scholar] [CrossRef]
  18. Costa, G.; Lilis, G.N.; Rovas, D.V.; Izkara, J. A comprehensive ontologies-based framework to support the retrofitting design of energy-efficient districts. In eWork and eBusiness in Architecture, Engineering and Construction, Proceedings of the 11th European Conference on Product and Process Modelling, Limassol, Cyprus, 7–9 September 2016; CRC Press: Boca Raton, Florida, USA; pp. 673–681.
  19. Thiis, T.; Hjelseth, E. Use of BIM and GIS to enable climatic adaptations of buildings. In Proceedings of the eWork and eBusiness in Architecture, Engineering and Construction, Nice, France, 1 September 2008; pp. 409–417. [Google Scholar]
  20. Song, Y.; Wang, X.; Tan, Y.; Wu, P.; Sutrisna, M.; Cheng, J.C.P.; Hampson, K. Trends and opportunities of BIM-GIS integration in the architecture, engineering and construction industry: A review from a spatio-temporal statistical perspective. ISPRS Int. J. Geo-Inf. 2017, 6, 1–32. [Google Scholar] [CrossRef] [Green Version]
  21. Benner, J.; Geiger, A.; Leinemann, K.; Karlsruhe, F.; Informatik, A.; Benner, J.; Geiger, A.; Leinemann, K. Flexible Generation of Semantic 3D Building Models. In Proceedings of the Workshop on Next Generation 3D City Models, Bonn, Germany, 21–22 June 2005; Volume 49, pp. 17–22. [Google Scholar]
  22. Isikdag, U.; Underwood, J.; Aouad, G. An investigation into the applicability of building information models in geospatial environment in support of site selection and fire response management processes. Adv. Eng. Inform. 2008, 22, 504–519. [Google Scholar] [CrossRef]
  23. Kim, J.I.; Koo, B.; Suh, S.; Suh, W. Integration of BIM and GIS for formal representation of walkability for safe routes to school programs. KSCE J. Civ. Eng. 2016, 20, 1669–1675. [Google Scholar] [CrossRef]
  24. Tashakkori, H.; Rajabifard, A.; Kalantari, M. A new 3D indoor/outdoor spatial model for indoor emergency response facilitation. Build. Environ. 2015, 89, 170–182. [Google Scholar] [CrossRef]
  25. Zhao, L.; Liu, Z.; Mbachu, J. An Integrated BIM–GIS Method for Planning of Water Distribution System. ISPRS Int. J. Geo-Inf. 2019, 8, 331. [Google Scholar] [CrossRef] [Green Version]
  26. Wang, M.; Deng, Y.; Won, J.; Cheng, J.C.P. An integrated underground utility management and decision support based on BIM and GIS. Autom. Constr. 2019, 107, 102931. [Google Scholar] [CrossRef]
  27. de Laat, R.; van Berlo, L. Integration of BIM and GIS: The Development of the CityGML GeoBIM Extension. In Advances in 3D Geo-Information Sciences; Kolbe, T.H., König, G., Nagel, C., Eds.; Springer: Berlin/Heidelberg, Germany, 2011; pp. 211–225. ISBN 978-3-642-12670-3. [Google Scholar]
  28. Del Giudice, M.; Osello, A.; Patti, E. BIM and GIS for district modeling. In eWork and eBusiness in Architecture, Engineering and Construction, Proceedings of the 10th European Conference on Product and Process Modelling, Vienna, Austria, 17–19 Sepetember 2014; TU Wein: Vienna, Austria, 2015; pp. 851–854. [Google Scholar]
  29. Khan, M.S.; Park, J.; Seo, J. Geotechnical Property Modeling and Construction Safety Zoning Based on GIS and BIM Integration. Appl. Sci. 2021, 11, 4004. [Google Scholar] [CrossRef]
  30. Park, T.; Kang, T.; Lee, Y.; Seo, K. Project cost estimation of national road in preliminary feasibility stage using BIM/GIS platform. In Computing in Civil and Building Engineering, Proceedings of the International Conference on Computing in Civil and Building Engineering, 2014, 23-25 June 2014; American Society of Civil Engineers: Reston, VA, USA; pp. 423–430.
  31. Kang, T.W.; Hong, C.H. A study on software architecture for effective BIM/GIS-based facility management data integration. Autom. Constr. 2015, 54, 25–38. [Google Scholar] [CrossRef]
  32. Bansal, V.K. Application of geographic information systems in construction safety planning. Int. J. Proj. Manag. 2011, 29, 66–77. [Google Scholar] [CrossRef]
  33. Siebert, S.; Teizer, J. Mobile 3D mapping for surveying earthwork projects using an Unmanned Aerial Vehicle (UAV) system. Autom. Constr. 2014, 41, 1–14. [Google Scholar] [CrossRef]
  34. Springer Transactions in Civil and Environmental Engineering. Civil Engineering Applications of Ground Penetrating Radar; Benedetto, A., Pajewski, L., Eds.; Springer International Publishing: Cham, Germany, 2015; ISBN 978-3-319-04812-3. [Google Scholar]
  35. Manacorda, G.; Persico, R.; Scott, H.F. Design of Advanced GPR Equipment for Civil Engineering Applications. In Civil Engineering Applications of Ground Penetrating Radar; Springer International Publishing: Cham, Germany, 2015; pp. 3–39. [Google Scholar]
  36. USRadarInc. Surface Imaging System. Available online: https://usradar.com/faq-items/gpr-recommendations/ (accessed on 31 May 2021).
  37. Lowe, D.G. Distinctive Image Features from Scale-Invariant Keypoints. Int. J. Comput. Vis. 2004, 60, 91–110. [Google Scholar] [CrossRef]
  38. Snavely, N.; Seitz, S.M.; Szeliski, R. Modeling the World from Internet Photo Collections. Int. J. Comput. Vis. 2008, 80, 189–210. [Google Scholar] [CrossRef] [Green Version]
  39. Furukawa, Y.; Curless, B.; Seitz, S.M.; Szeliski, R. Towards Internet-scale multi-view stereo. In Proceedings of the 2010 IEEE Computer Society Conference on Computer Vision and Pattern Recognition, San Francisco, CA, USA, 13–18 June 2010; pp. 1434–1441. [Google Scholar]
  40. Furukawa, Y.; Ponce, J. Accurate, Dense, and Robust Multiview Stereopsis. IEEE Trans. Pattern Anal. Mach. Intell. 2010, 32, 1362–1376. [Google Scholar] [CrossRef] [PubMed]
  41. Economou, N.; Vafidis, A.; Benedetto, F.; Alani, A.M. GPR Data Processing Techniques. In Civil Engineering Applications of Ground Penetrating Radar; Springer International Publishing: Cham, Germany, 2015; pp. 281–297. [Google Scholar]
  42. Deng, Y.; Cheng, J.C.P.; Anumba, C. A framework for 3D traffic noise mapping using data from BIM and GIS integration. Struct. Infrastruct. Eng. 2016, 12, 1267–1280. [Google Scholar] [CrossRef]
  43. Sharafat, A.; Khan, M.S.; Latif, K.; Seo, J. BIM-Based Tunnel Information Modeling Framework for Visualization, Management, and Simulation of Drill-and-Blast Tunneling Projects. J. Comput. Civ. Eng. 2021, 35, 04020068. [Google Scholar] [CrossRef]
  44. Gröger, G.; Kolbe, T.H.; Nagel, C.; Häfele, K.-H. OpenGIS City Geography Markup Language (CityGML) Encoding Standard, Version 2.0.0. Open Geospatial Consortium: Wayland, MA, USA, 2012. [Google Scholar]
  45. Tsai, C.F.; Xiao, Y.T.; Chen, H.S.; Ye, Y.X.; Wang, C.H.; Liang, T.W. Integration of BIM & GIS to query management on pipeline of building-A case study of dormitory. In Proceedings of the 2017 IEEE International Conference on Applied System Innovation, Sapporo, Japan, 13–17 May 2017; pp. 944–947. [Google Scholar] [CrossRef]
  46. Khan, M. Assessment Of Structural Design Capability Of Building Information Modeling (BIM) Tools In Building Industry Of Pakistan. J. Mech. Contin. Math. Sci. 2019, 14, 385–401. [Google Scholar] [CrossRef]
  47. Tanoli, W.A.; Sharafat, A.; Park, J.; Seo, J.W. Damage Prevention for underground utilities using machine guidance. Autom. Constr. 2019, 107, 102893. [Google Scholar] [CrossRef]
  48. DiBenedetto, S.P.; Mochny, H.R.; Hanson, D.R. Pipeline Case Histories with 2D and 3D Underground Imaging. In Proceedings of the Pipelines 2010, Reston, VA, USA, 28 August–1 September 2010; pp. 1038–1047. [Google Scholar]
  49. Li, S.; Cai, H.; Abraham, D.M.; Mao, P. Estimating Features of Underground Utilities: Hybrid GPR/GPS Approach. J. Comput. Civ. Eng. 2016, 30, 04014108. [Google Scholar] [CrossRef]
  50. Barlish, K.; Sullivan, K. How to measure the benefits of BIM-A case study approach. Autom. Constr. 2012, 24, 149–159. [Google Scholar] [CrossRef] [Green Version]
  51. Won, J.; Lee, G. How to tell if a BIM project is successful: A goal-driven approach. Autom. Constr. 2016, 69, 34–43. [Google Scholar] [CrossRef]
Figure 1. Concept overview.
Applsci 11 05721 g001
Figure 2. Images collected during the flight of the UAV equipped with a high-resolution camera.
Applsci 11 05721 g002
Figure 3. The typical range of frequencies for the application of GPR [36].
Applsci 11 05721 g003
Figure 4. (a) Orthomosaic, the corresponding sparse with marked GCPs (ground control points) and their distribution. (b) Digital surface model (DSM) before densification. (c) Image overlapping density for accurate point cloud generation. (d) High-density, full-colored 3D point cloud with camera ray points.
Applsci 11 05721 g004
Figure 5. (a) 2D electromagnetic scan processing; (b) 3D visual processing and interpretation.
Applsci 11 05721 g005
Figure 6. UML class diagram showing employment of the CityGML utility network core module for the electricity network. Note: "*" UML notation used to representation the cardinal relationship among CityGML classes that shows the number of occurrence or possibilities.
Applsci 11 05721 g006
Figure 7. UML class diagram showing employment of the CityGML utility network core module for the sewer and water supply network. Note: "*" UML notation used to representation the cardinal relationship among CityGML classes that shows the number of occurrence or possibilities.
Applsci 11 05721 g007
Figure 8. Representation of the IfcFlowSegment with two IfcDistributionPorts (a) scenario 1 and (b) scenario 2, showing the end connections of the utility infrastructure.
Applsci 11 05721 g008
Figure 9. Project overview with proposed new design line.
Applsci 11 05721 g009
Figure 10. (a) Picture of electromagnetic radargram recording using overture software; (b) picture of conducting of the GPR survey using Leica GPR DS 2000.
Applsci 11 05721 g010
Figure 11. Georeferenced 3D point cloud model showing different views with ground control points (GCPs).
Applsci 11 05721 g011
Figure 12. GPR electromagnetic scan with interpretation after data processing.
Applsci 11 05721 g012
Figure 13. The process of developing surface and subsurface utility infrastructure model.
Applsci 11 05721 g013
Figure 14. 3D modeling of utility network categorized with different layers: (a) utility network models in BIM environment and (b) visualization of utility infrastructure system in GIS environment.
Applsci 11 05721 g014
Figure 15. Application of developed BIM-GIS platform: (a) 3D excavation design drawing with existing underground utilities, (b) clash detection during design, (c) screenshot of machine guidance operator screen during excavation, (d) information retrieval from GIS database linked with a utility component.
Applsci 11 05721 g015
Table 1. Details of UAV photogrammetric data processing for the generation of georeferenced 3D point cloud data.
ParametersDetails
Average ground samplingDistance (GSD)2.36 cm
Area covered0.7305 km2
ImagesMedian of 52,717 key points per image
Dataset775 out of 775 images geolocated (100%)529 out of 775 images calibrated (68%)
Camera optimization0.41% relative difference between initial and optimized internal camera parameters
MatchingMedian of 7579.05 matches per calibrated image
Georeferencing22 GCPs (22 3D), mean RMS error = 0.074 m
Mean reprojection error (pixels)0.194
Number of 3D densified points52,790,183
Average density (per m3)113.36
Table 2. Qualitative evaluation of BIM-GIS-based underground utility management system.
Qualitative MetricesTraditional Underground Utility Earthwork OperationsBIM-GIS-Based Integrated Framework
2D visualizationYesYes
3D visualizationNoYes
Quantity takeoffManualAutomated
Material informationBasicDetailed
Data sharingManualAutomated
Excavator operator visualizationNoYes
Utility clash analysisManual (hard)Automated (easy)
Design changeManualAutomated
Facility managementNoYes
Table 3. Quantitative evaluation of BIM-GIS-based underground utility management system.
Quantitative MetricesBIM-GIS-Based Integrated Framework Qualitative Performance
Total utilities excavated47
Utility strikes0
Safety accidents0
Utility clash identified7
Reworks2
Additional utility identification5
Missed utility identification0
Publisher’s Note: MDPI stays neutral with regard to jurisdictional claims in published maps and institutional affiliations.

