Review

Hydrogen Production from Offshore Wind Parks: Current Situation and Future Perspectives

1
Instituto Superior Técnico, University of Lisbon, 1049-001 Lisboa, Portugal
2
INESC-ID/IST, University of Lisbon, 1000-029 Lisboa, Portugal
*
Author to whom correspondence should be addressed.
Appl. Sci. 2021, 11(12), 5561; https://doi.org/10.3390/app11125561
Submission received: 13 May 2021 / Revised: 1 June 2021 / Accepted: 15 June 2021 / Published: 16 June 2021

Abstract

:
With the increase in renewable energy connected to the grid, new challenges arise due to its variable supply of power. Therefore, it is crucial to develop new methods of storing energy. Hydrogen can fulfil the role of energy storage and even act as an energy carrier, since it has a much higher energetic density than batteries and can be easily stored. Considering that the offshore wind sector is facing significant growth and technical advances, hydrogen has the potential to be combined with offshore wind energy to aid in overcoming disadvantages such as the high installation cost of electrical transmission systems and transmission losses. This paper aims to outline and discuss the main features of the integration of hydrogen solutions in offshore wind power and to offer a literature review of the current state of hydrogen production from offshore wind. The paper provides a summary of the technologies involved in hydrogen production along with an analysis of two possible hydrogen producing systems from offshore wind energy. The analysis covers the system components, including hydrogen storage, the system configuration (i.e., offshore vs. onshore electrolyzer), and the potential uses of hydrogen, e.g., Power to Mobility, Power to Power, and Power to Gas.

1. Introduction

Hydrogen is a gas that can be easily produced using electrolysis and that has several potential applications, ranging from an energy source for transportation to being mixed into the natural gas grid, along with current applications in fuel refining and fertilizer production. Historically, hydrogen production is based on fossil fuels and emits a large amount of CO2; however, in the last decades, significant advances have been made in electrolysis and renewable energy production, making possible the production of green hydrogen at a reasonable price point.
Furthermore, with governments pushing the reduction of carbon emissions and lowering the dependence on fossil fuels, the demand for green hydrogen has risen quickly and is expected to rise substantially in the coming years. With the help of incentives and policies, green hydrogen is undergoing significant investigation around the world, with the objective of producing hydrogen without carbon emissions that, with a small incentive, can compete with traditional hydrogen production methods.
Fuel cells are devices that use hydrogen to produce electricity, with the only by-products being water and heat. In recent years, fuel cells have also experienced significant advancements; they are starting to be used in commercial applications like passenger cars, trucks, buses, and grid-connected dispatchable power plants. One of the reasons electrical grids are still dependent on fossil fuels is due to their ability to regulate power production. Since typical renewable energy sources like wind and solar energy are intermittent, their power output can’t be regulated (hydroelectric dams with reservoirs provide some flexibility but ultimately are dependent on rainfall upstream). Hydrogen can serve as an energy storage solution, where dispatchable fuel cells that run on green hydrogen can produce power when needed without any carbon emissions.
Wind power produces roughly 5% of the world’s electricity [1], with most installations onshore. However, higher wind speeds and more consistent wind can be found offshore, which leads to higher energy production per turbine installed; the disadvantages are higher cost and technical challenges due to the rough sea conditions to which the equipment is subjected. One of the challenges is transporting the electricity back to shore, since traditional AC power cables have higher capacitance and thus higher losses than overhead lines, and more recent High Voltage Direct Current (HVDC) systems are expensive due to the converter stations necessary at each end of the transmission line. Considering that the transportation of gas in a pipeline suffers much smaller losses (<0.1%) [2,3] than electricity passing through an offshore cable, a case can be made for the production of hydrogen offshore, with pipelines to transport it to shore. From an economic perspective, the cost per unit length of an offshore pipeline is higher than an offshore cable. However, the pipeline’s energy transmission capacity is greater than the cable, resulting in lower normalized pipeline capital costs compared to an equivalent offshore electrical cable to transmit the same energy [3].
Two system configurations can be found: the first consists of an offshore wind farm, offshore electrolyzer, and onshore hydrogen storage, while in the second system the electrolyzer is located onshore. A fuel cell can be added in both systems to provide electricity in high-demand periods and act as frequency control for the grid. For the first system, the electricity generated by the wind turbines travels a short distance to the electrolyzer platform, where hydrogen is produced, compressed, and transported to shore in a pipeline. On the other hand, for the second system, the electricity is transmitted to shore by a traditional cable, where a choice can be made: sell the electricity directly to the grid or produce hydrogen. This is known as a hybrid system, where the operator can control the amount of power being sold to the grid or fed into the electrolyzer, even being able to buy electricity from the grid to produce hydrogen during periods of extremely low electricity prices, which provides load flexibility to the grid operator as well. Since the source of the electricity powering the electrolyzer is wind farms, no carbon is emitted during the production of hydrogen.
This paper is concerned with hydrogen production using electricity coming from offshore wind farms, i.e., green hydrogen production. The paper offers an overview of the current situation on the subject by highlighting the main features of the technologies used by the different components of the hydrogen production system as well as an outline of the system configuration options (offshore vs. onshore electrolyzer location) and potential uses of hydrogen. Moreover, the paper reviews the main recent research topics related to the subject through a thorough literature review, including state-of-the-art reports and journal papers. The aim is to point out directions of future developments in green hydrogen production from wind power and other renewables.
The remainder of the paper is organized as follows. In Section 2, a discussion of the system components used for hydrogen production from offshore wind power is offered. The system configurations, i.e., the option between the offshore and onshore location of the electrolyzer, are discussed in Section 3. A summary of the main hydrogen uses is presented in Section 4. Section 5 contains a literature review of the main subject areas being investigated, including a comparison regarding the Levelized Cost of Hydrogen (LCOH) produced from different renewable energy sources. Finally, in the last section, the main conclusions of the work performed are drawn.

2. System Components

The hydrogen production system is composed of the offshore wind farm, for electricity production, the electrolyzer, for hydrogen production, and the hydrogen storage system.

2.1. Offshore Wind

When analysing fixed bottom wind turbines or floating turbines the main differences are cost and the locations where each technology can be implemented. The fixed bottom is the most used technology by a significant margin, with 24,952 MW installed in Europe, compared to only 62 MW of floating wind installed in Europe at the end of 2020 [4]; thus, it is the most cost-effective solution in offshore wind farms. However, floating wind prices are expected to lower rapidly in the next few years and allow access to much deeper waters; this will be useful in countries that do not have shallow water far from shore. The water depth around Europe is assessed in [5]; only the North Sea, Irish Sea, and a few other areas have a somewhat shallow depth where fixed bottom foundations can be installed. On the other hand, the water around the Iberian Peninsula and southern Europe can get be much deeper not too distant from the shore.
The report in [6] shows a projection of the Levelized Cost Of Energy (LCOE) of both bottom fixed and floating wind until 2050. The report indicates a current LCOE of 175 €/MWh for floating and 90 €/MWh for fixed bottom technologies. In 2050, these two figures are estimated to converge to 35 €/MWh.
The installation of fixed bottom wind turbines involves the use of a specialized boat capable of burying the foundations deep in the seabed, along with a crane to assemble the tower, nacelle, and individual blades. Comparing with floating wind, this newer approach can be fully assembled on land or dry dock and afterward be towed by a regular tugboat to the project’s location. This much simpler installation can be another factor in lowering the costs; when more floating substructures are built, economies of scale have their effect. Europe is the leader in offshore wind power, and most of the installed power is in the North Sea (79%, according to WindEurope [4]), a location with high wind speed [5] and relatively shallow water and thus a good candidate for fixed bottom installations.
Around 80% of offshore wind resources are located in waters deeper than 60 m (where fixed bottom installations are not feasible), and average wind speeds increase further from shore [7]. To access this potential, floating wind currently represents the best approach; with the number of installations planned in the coming years, the future of floating wind is looking bright.
The first floating wind farm ever built on a commercial level is Hywind Scotland [8,9], composed of 5 turbines of 6 MW each, supported by a spar buoy. It has been producing energy since 2017. The buoys are 78 m in length and are attached to the seabed by 3 mooring lines. Although this is a simple design, added installation problems can arise from the dimensions of the buoy, such as the inability to be assembled on a simple port. More specifically, for hydrogen production, the individual electrolyzer approach is not as straightforward due to the cylindrical shape of a spar buoy, which limits the amount of space available to install an electrolyzer and the remaining infrastructure. Consequently, this structure requires more substantial modifications when compared to a semi-submersible platform, making the latter the most cost-competitive floating platform for an individual electrolyzer project [10].
One of the first wind farms deployed on a commercial level using a semi-submersible platform is WindFloat Atlantic in Viana do Castelo, Portugal. It was commissioned in 2020 [4] and is composed of 3 turbines of 8.4 MW each, supported by a semi-submersible structure made of 3 cylindrical buoys 30 m high and 50 m apart. Some advantages of this design are the simple assembly of the wind turbine on the structure in port and, due to hydrogen production by individual electrolyzers, the unobstructed area of 1082 m2, with some modifications. Several other projects using similar platform designs are planned in the coming years [4].

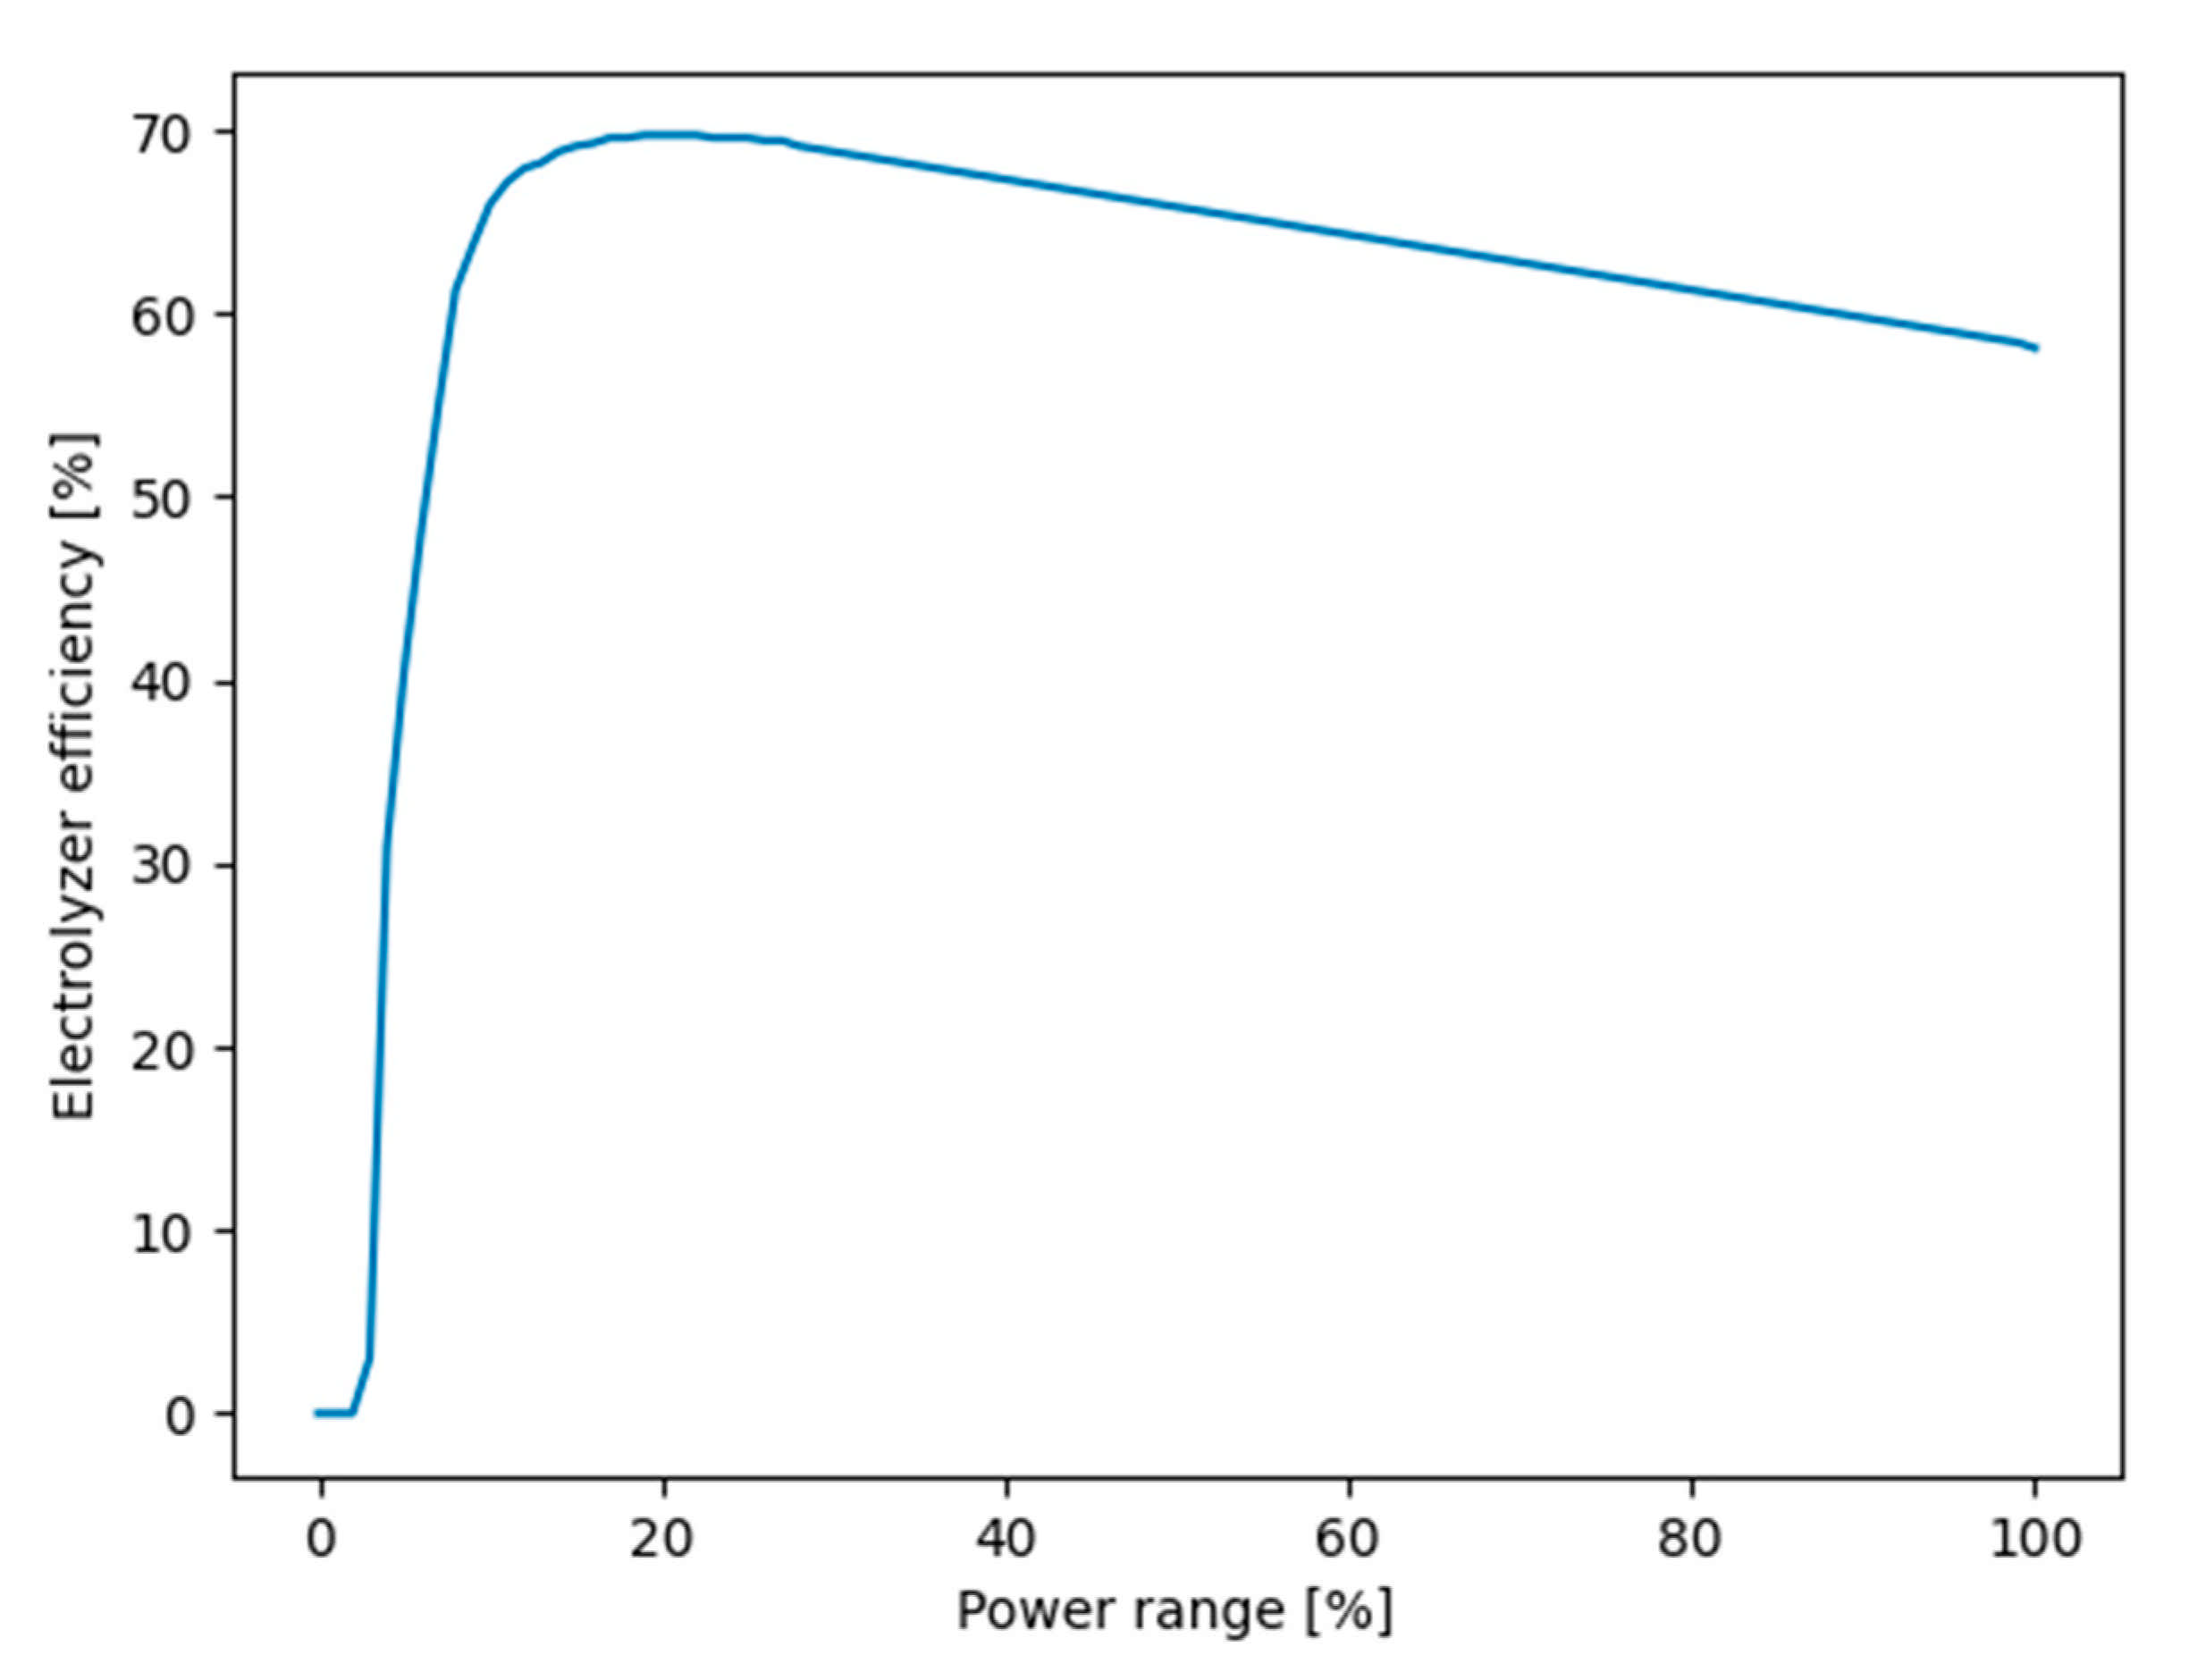
2.2. Electrolyzer Technologies

An electrolyzer is a device that receives DC electricity and demineralized water and separates the hydrogen and oxygen atoms from the water molecule through a chemical reaction, generating high purity oxygen and hydrogen. While different technologies for electrolyzers operate in slightly different ways, all have an anode and cathode that are separated by an electrolyte.
Currently, there are two technologies used in commercial applications for the production of hydrogen: Alkaline Electrolyzer (AEL) and Proton Exchange Membrane Electrolyzer (PEMEL) [11,12]. Another technology undergoing intense research and development is Solid Oxide Electrolyzer (SOE), which promises high efficiencies and flexibility, but at the cost of both high operating temperatures (700 to 900 °C) and durability [11,12].

2.2.1. Alkaline Electrolyzers

AELs are currently the cheapest technology and have the longest lifetime, due in part to being the oldest of the technologies mentioned above [11,12]. This type of electrolyzer has been used in the industry for roughly 100 years; thus, while further progress is expected, both PEMEL and SOE development will surely be faster [11]. However, they cannot react as fast to changes in production, require complex maintenance of the alkaline fluid, cannot operate below a certain threshold for safety reasons, take longer to start, and present a rather low current density when compared to PEMEL, around 5 times lower [13]. In addition, the output pressure of the hydrogen produced is lower, which requires higher compression for transport and storage, reducing the advantage the lower CAPEX provided initially.
Historically, this type of electrolyzer has been operated at almost constant power while connected to the grid and recently has seen improvements in the ability to change hydrogen production rate without relevant efficiency losses. One of the highest-powered electrolyzers is a 4 MW module [14], which is claimed to have a dynamic response fast enough to follow the production of a renewable power plant. Furthermore, it is also said that the current density is double compared to the previous generation, that the output pressure is 30 bar, and that it has increased longevity compared to newer technologies [15].

2.2.2. Proton Exchange Membrane Electrolyzers

PEMELs are more recent than AELs and come with several advantages, such as much faster start-up times, higher current densities which lead to smaller electrolyzer footprints, higher hydrogen purity (>99.8%), operation beyond nominal power, and higher output pressure [11,12,13].
The report in [11] offers a comparison between the main features of PEMEL and AEL in 2017 and projected to 2025. With regard to the AEL (PEMEL figures in brackets) efficiency, an increase from the current 65% (57%) to 68% (64%) in 2025 is expected. At the same time, a decrease in the AEL (PEMEL) CAPEX from the current 750 €/kW (1200 €/kW) to 480 €/kW (700 €/kW) is foreseen by 2025. As far as the electrical consumption is concerned, some improvements are also to be expected. Currently, an AEL (PEMEL) consumes about 51 kWh (58 kWh) of electricity to produce 1 kg of hydrogen. The figure is foreseen to drop to 49 kWh/kg (52 kWh/kg) by 2025.
When combined with a renewable power source, the ability to easily adjust the power to suit the conditions and a quick start-up time are two great features that allow this technology to extract the most out of intermittent power sources. During periods of shutdown, low amounts of energy are required to maintain system operation [11,12]; this is an important fact to consider if the electrolyzer is to be kept offshore or if it will not be grid-connected. Furthermore, a backup power source must be provided if coupled with a renewable power source, since the intermittent nature of this type of power does not guarantee the necessary energy during shutdown periods.
Despite PEMELs having made significant progress in recent years in efficiency, output pressure, ramp up and ramp down times, and CAPEX, they are still considerably more expensive than AEL and do not have the same longevity [12]. The main reason for the high price is the significant amount of platinum needed to build the stack of the electrolyzer. The efficiency curve in Figure 1 is a typical efficiency curve of a generic electrolyzer. It is based on the average of efficiency curves of several commercial electrolyzers as taken from [11].

2.2.3. Solid Oxide Electrolyzer

The SOE is the newest of the three technologies and currently is rarely used in commercial applications due to the high operating temperatures (usually in the range of 700–900 °C) and lower longevity. This type of electrolyzer promises better efficiency than all other technologies and unlike PEMEL does not require any precious metals, which makes it possible to reach a lower CAPEX once the technology matures [12]. While the high operating temperature is a disadvantage, especially for intermittent power sources, it does not present as big an obstacle when coupled with nuclear or combined cycle power plants. In the case of renewable energy, Concentrated Solar Power (CSP) accompanied with an SOE is an option under study, since the waste heat from CSP can be used for heating the SOE [11].

2.3. Hydrogen Storage

Storage of hydrogen is similar to natural gas, with a few key differences: mainly, when some metals come in contact with hydrogen they can suffer hydrogen embrittlement, which leads to increased degradation and chance of material failure [15]. Another difference to consider is increased leakage, especially in underground natural structures such as aquifers, but also in links between pipeline sections or links in valves, due to the small size of the hydrogen molecule [15]. The bacterial reaction also constitutes a problem, since some bacteria decompose hydrogen, leading to what can be considered losses, as the purity of stored hydrogen decreases [2]. The main approaches in storing hydrogen are gaseous storage and liquid storage; other approaches like chemical storage exist, but only on a much smaller scale, so they won’t be considered.
Gaseous storage can be divided into two methods: fabricated tanks (usually metal) and storage in natural underground structures like aquifers and salt caverns. Hydrogen density has a nearly linear relation with pressure [16], so a greater storage pressure leads to a smaller volume needed to store a certain amount of hydrogen gas. However, due to material properties and operational costs, hydrogen is not stored at pressures higher than 100 bar [15], which corresponds to a density of roughly 7.8 kg/m3 [15].
A simple model can be developed to compute the rough dimensions of the storage facilities needed.
The flow rate of a typical 25 MW electrolyzer is Q n = 5000   Nm 3 / h [17]. To convert the hydrogen flow rate ( Q n ) from Nm3/h to mass ( M ) in ton/day, Equation (1) is used.
M = 24 Q n 11.1 × 10 3
In Equation (1), the factor 24 converts hours into days, the factor 11.1 comes from knowing that 1 kg of hydrogen equals 11.1 Nm3 of hydrogen (Normal conditions are 0 °C temperature and 1 atm pressure), and the factor 10 3 is to convert kg to ton.
The corresponding hydrogen volume V in m3/day is
V = M 7.8 × 10 3
where 7.8 × 10 3   ton / m 3 is the hydrogen density for a pressure of 100 bar at a temperature of 20 °C.
A linear variation of the hydrogen flow rate with the electrolyzer power was considered. This allowed us to obtain the flow rates for the electrolyzer power ranging from 25 MW to 1000 MW. Table 1 contains the electrolyzer power, flow rate, mass (Equation (1)) and volume (Equation (2)) of hydrogen produced per day if the electrolyzers are run at full power.
The linear approximation used was based on a similar commercial 17.5 MW PEMEL that produces 340 kg/h [18]. When linearly scaled to 25 MW, a production rate of 11.6 tons/day is achieved, a similar value to the one presented in Table 1 (which is 10.8 tons/day).
To estimate the dimensions of the cylindrical storage tanks, the equation for a cylinder’s volume (Equation (3)) was used, where V is the storage tank volume, h is the height, and r is the radius.
V = h π r 2
Table 2 contains the possible approximate radius and height for cylindrical tanks to be able to store all the hydrogen produced during 24 h with the electrolyzers at full power.
Table 2 shows that even for large electrolyzer projects (1000 MW, for instance) the required storage facilities are feasible, and the corresponding dimensions are reasonable and therefore practicable.
The most cost-effective and practical way of storing large quantities of hydrogen as a gas is using underground natural structures. Aquifers are not as well sealed as salt caverns, which leads to increased leakage [15,19]. While some leakage might be reasonable when storing natural gas, due to the small size of the hydrogen molecule the leakage rate increases significantly; for this reason, aquifers are not adequate to store hydrogen. Salt caverns are the best underground storage structures for several reasons, including low construction costs, low leakage rates, fast withdrawal and injection rates, and a harsh environment for bacteria, which decreases unwanted bacterial activity [2,15,19]. Initial research shows no significant difference between storing hydrogen compared to natural gas in these structures, and pure hydrogen is already stored using this approach in Teeside, the UK, and Texas, USA [2,19].
The second approach consists of storing liquid hydrogen in metal tanks, a process similar to what is widely used for Liquified Natural Gas (LNG). The main advantage is the high density in the liquid state of 70 kg/m3 [15], which is almost 10 times the density of hydrogen in a gas state at a pressure of 100 bar. However, the liquefaction of hydrogen is a very energy-intensive process, with anywhere from 6 to 10 kWh of electricity needed to liquefy 1 kg [15,20] of hydrogen. The current installed liquefaction capacity is around 355 tons per day [15], below the necessary capacity needed for a 1 GW plant. The main reasons for the low liquefaction capacity are the high initial investment associated with liquefaction plants and the high energy consumption to liquefy the hydrogen.

3. System Configurations

There are two possible options for the system configuration related to the location of the electrolyzer: it can be placed offshore, near the wind farm, or onshore, near the existing grid coupling point.

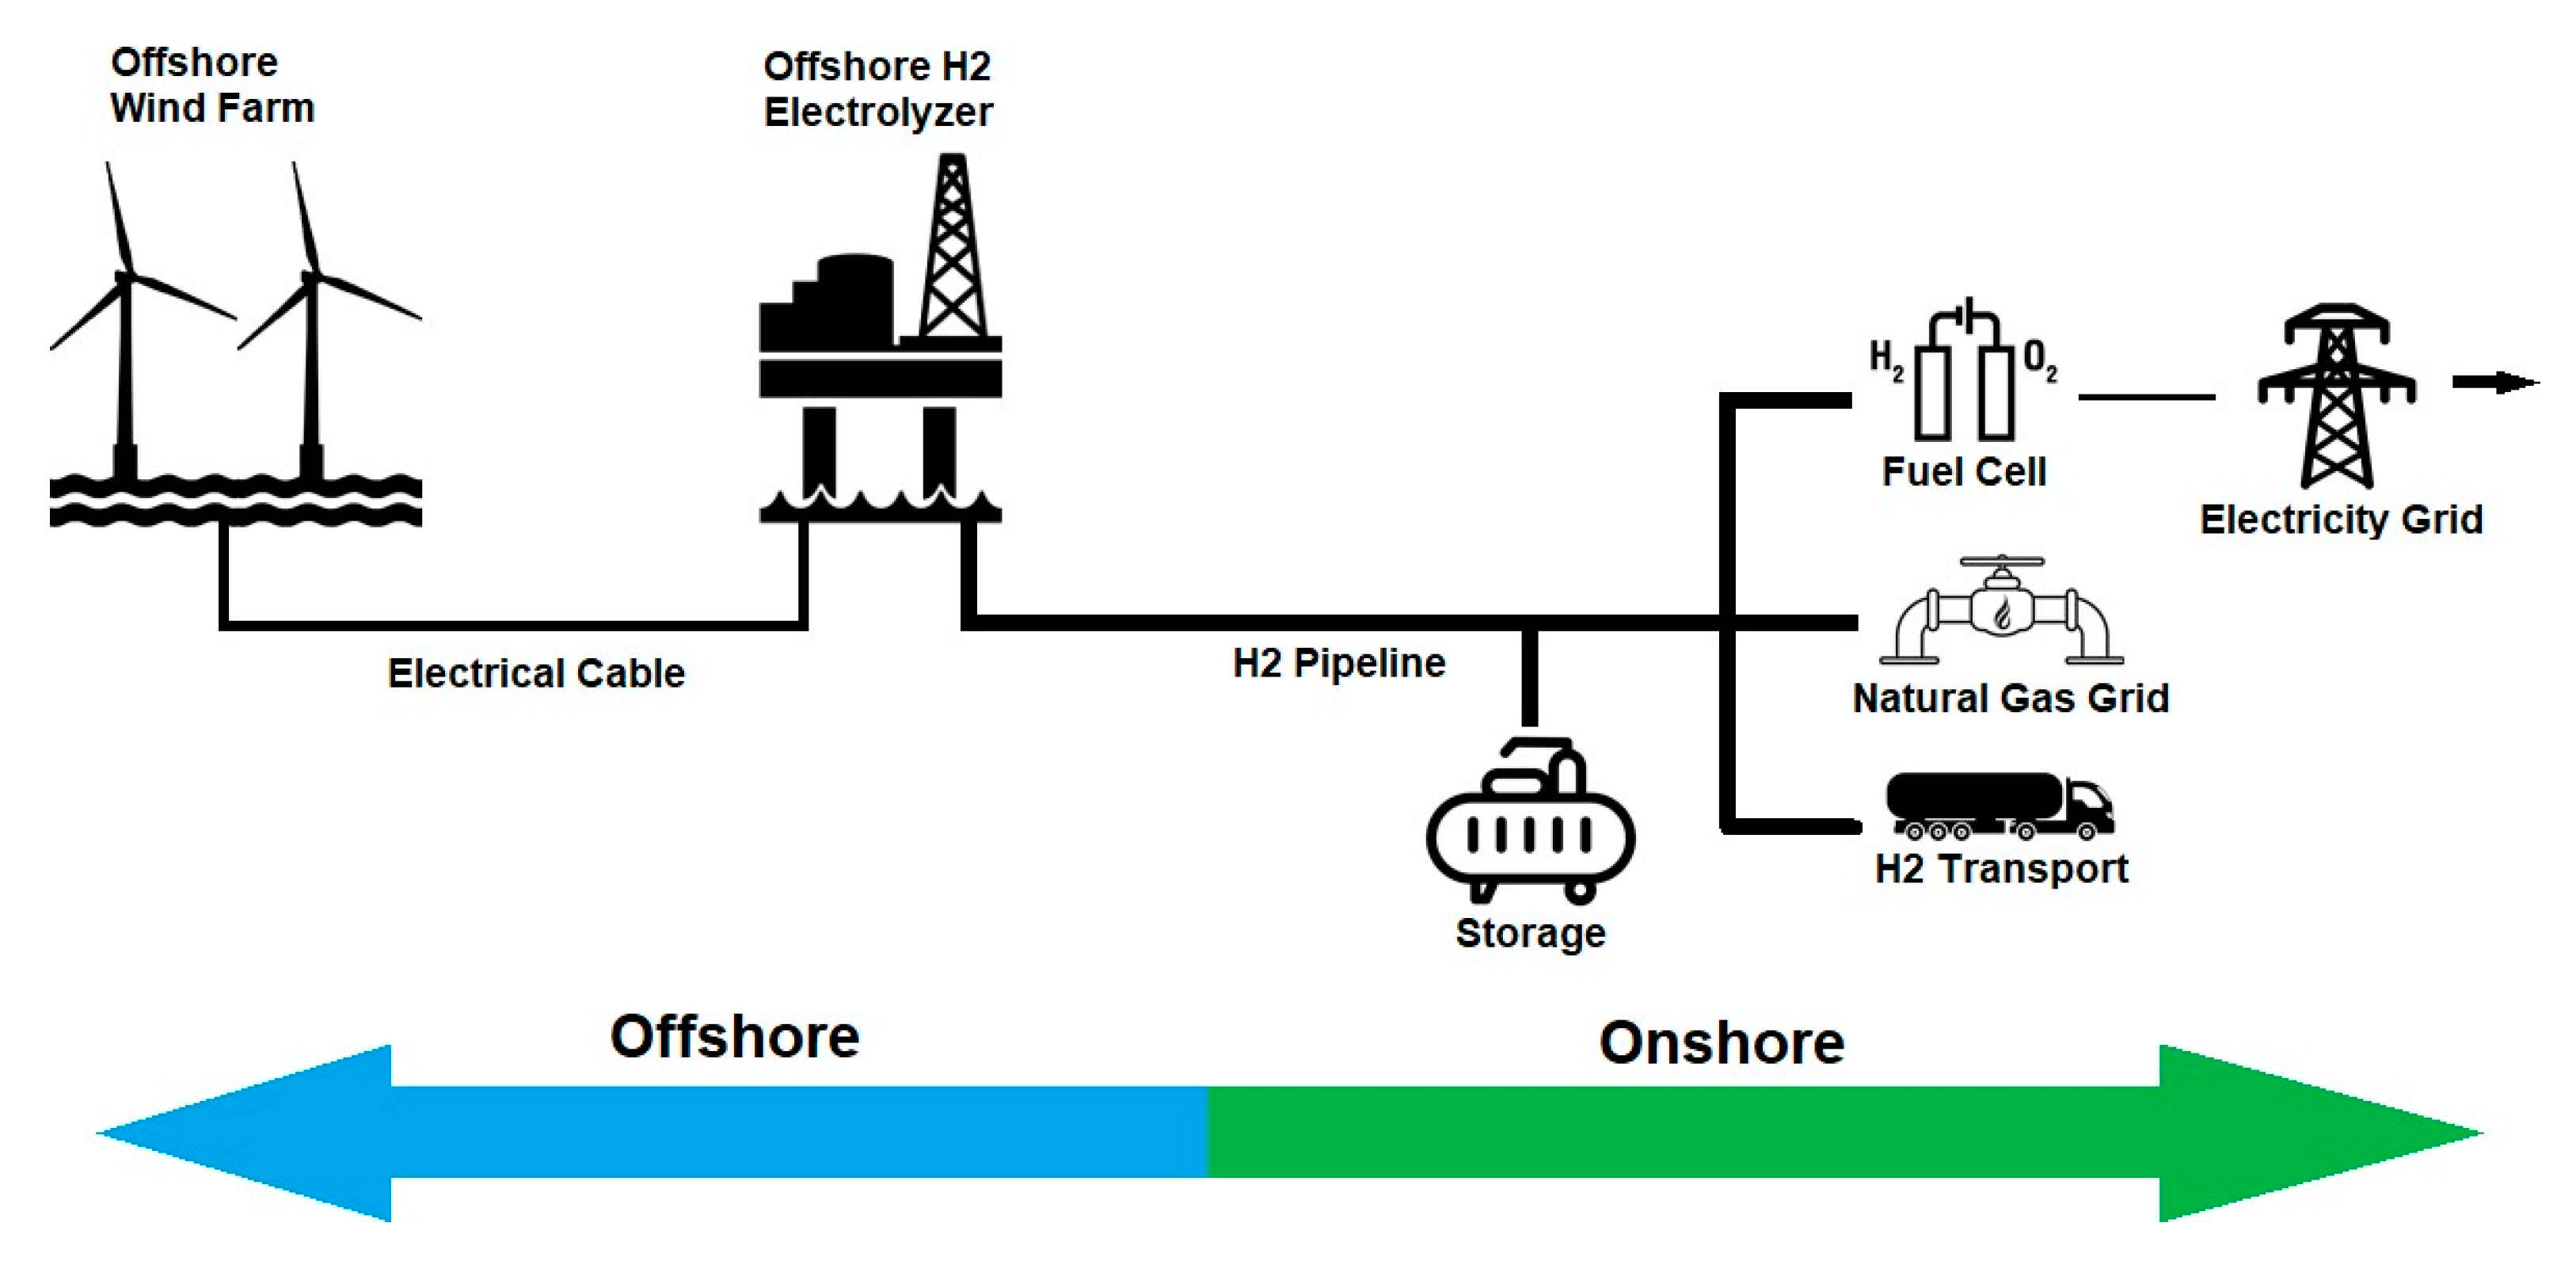
3.1. Offshore Electrolyzer Scenario

One of the significant costs in an offshore wind farm is the equipment to bring the electricity to shore, namely the cables, transformers, and power electronics. Considering a High Voltage Alternating Current (HVAC) transmission system, losses are around 1% to 5% for wind farms with nominal power from 500 to 1000 MW and located 50–100 km from shore [21,22]. For a HVDC system, losses range from 2% to 4%, depending on nominal power and distance [21,22]. However, hydrogen travelling through a pipeline has considerably lower losses, under 0.1% [2,3], along with reduced initial costs for an underwater pipeline compared to underwater electrical cables and the power electronics needed. Figure 2 contains an overview of the centralized offshore electrolyzer system.
PEMELs represent the best choice for this system due to the smaller footprint and easier maintenance [11], which in an offshore scenario means the platform can be smaller and the maintenance trips can be further apart.
Since the output pressure of a PEMEL is around 30 bar [11,17], additional compression is required to export the hydrogen to shore. The hydrogen compressor and export pipeline must be sized according to the distance to shore, operating pressure of the electrolyzer, flow of hydrogen, and pressure drop along the pipeline. A study done by North Sea Energy [23] estimated the required pipeline diameter and pressure, assuming an output pressure of 68 bar and 20 m/s maximum travel speed. The results show that for a 1 to 2 GW wind farm located 50 to 200 km from shore, the minimum diameter of the pipeline ranges from 0.25 to 0.41 m, while the minimum input pressure ranges from 83 to 100 bar.
To size the PEMEL, the nominal power does not need to be equal to the wind farm’s nominal power, since the wind farm might not spend large periods of time at nominal power. From an economic point of view, the most interesting approach might be to slightly undersize the electrolyzer, since the revenue lost when the wind farm is at nominal power could be lower than the additional cost of a more powerful electrolyzer [6]. Furthermore, the energy used in purifying the water and compressing the hydrogen for transmission, along with the wake and array losses, lowers the actual available power for the electrolyzer [24].
A backup power source must be provided for the electrolyzer during periods of shutdown, when the electrolyzer must consume a small amount of power to remain in stand-by mode [11]. Periods of shutdown are not common and do not last long, due to the PEMEL capability of being able to start operating at 1% nominal power, although with low efficiency.
Two electrolyzer configurations are possible: a unique centralized electrolyzer fed by the whole wind park or individual electrolyzers, one per wind turbine. The details of each configuration are given below. The main components for the centralized electrolyzer system are the same as for the individual electrolyzer system, since the operating principle is similar. The components are
  • PEMEL and the supporting electronics
  • AC-DC rectifiers (possibly already included in electrolyzer)
  • Desalination unit and reservoir for desalinated water
  • Seawater pumps
  • Export pipeline
  • Backup power source
  • Communication equipment

3.1.1. Centralized Electrolyzer

In a centralized electrolyzer system, the individual installation of the wind turbines is the same as a typical offshore wind farm, with turbines in strategic places to minimize losses by the wake effect. The power produced by each individual turbine is transmitted to a central platform through regular underwater cables; while voltages can differ, newer and higher power turbines, such as the Haliade-X 13 MW [25], operate at 66 kV.
Once the electrical power reaches the central platform, most of it can be rectified to DC; the other part is used to power the seawater pumps and hydrogen compressor in AC. The DC power is used mainly to produce hydrogen but also to power the backup power source and the supporting systems. The produced hydrogen exits the electrolyzer at high purity and with a pressure of 30 bar, so the next step is compressing it to the desired pipeline input pressure. After being compressed, the hydrogen is fed into the export pipeline, where it is transmitted to the shore.

3.1.2. Individual Electrolyzers

When sufficient wind is present, most of the electricity is fed into the rectifiers to power the electrolyzers and possibly refill the backup power source. The remaining power is used to power the seawater pumps, which need AC electricity. In the case of no offshore compression, the produced hydrogen exits the electrolyzer and is exported by a small dimension pipeline to a subsea collection manifold, which receives the hydrogen produced by each turbine-electrolyzer system and exports it to shore using a bigger diameter pipeline. However, if offshore compression is needed, the hydrogen exits the electrolyzer and is exported by a small dimension pipeline to a collection manifold in a platform, compressed to a desired pressure, and exported to shore by a pipeline.
This approach becomes more viable as the nominal power of a turbine keeps increasing, since more powerful electrolyzers can be installed individually, and economies of scale can play their part [23]. In [23], it is projected that the price per MW of a PEMEL will decrease from the current (2020) 0.75 M€/MW to 0.2 M€/MW by 2050. It is also projected that at around 10 MW, the cost per MW of hydrogen production power starts decreasing at a much slower rate, especially after the year 2030.
Since bottom fixed and some floating options, such as a spar buoy, require significant modifications to be able to support the extra infrastructure, the semi-submersible platform like the one used in WindFloat Atlantic is the best choice for the individual electrolyzer approach [10]. To make the platform suitable for all the equipment, modifications need to take place, such as creating a floor on which to put the equipment that is shielded from waves and possible water splashing, as well as modifying the buoys and ballast to accommodate the additional weight.

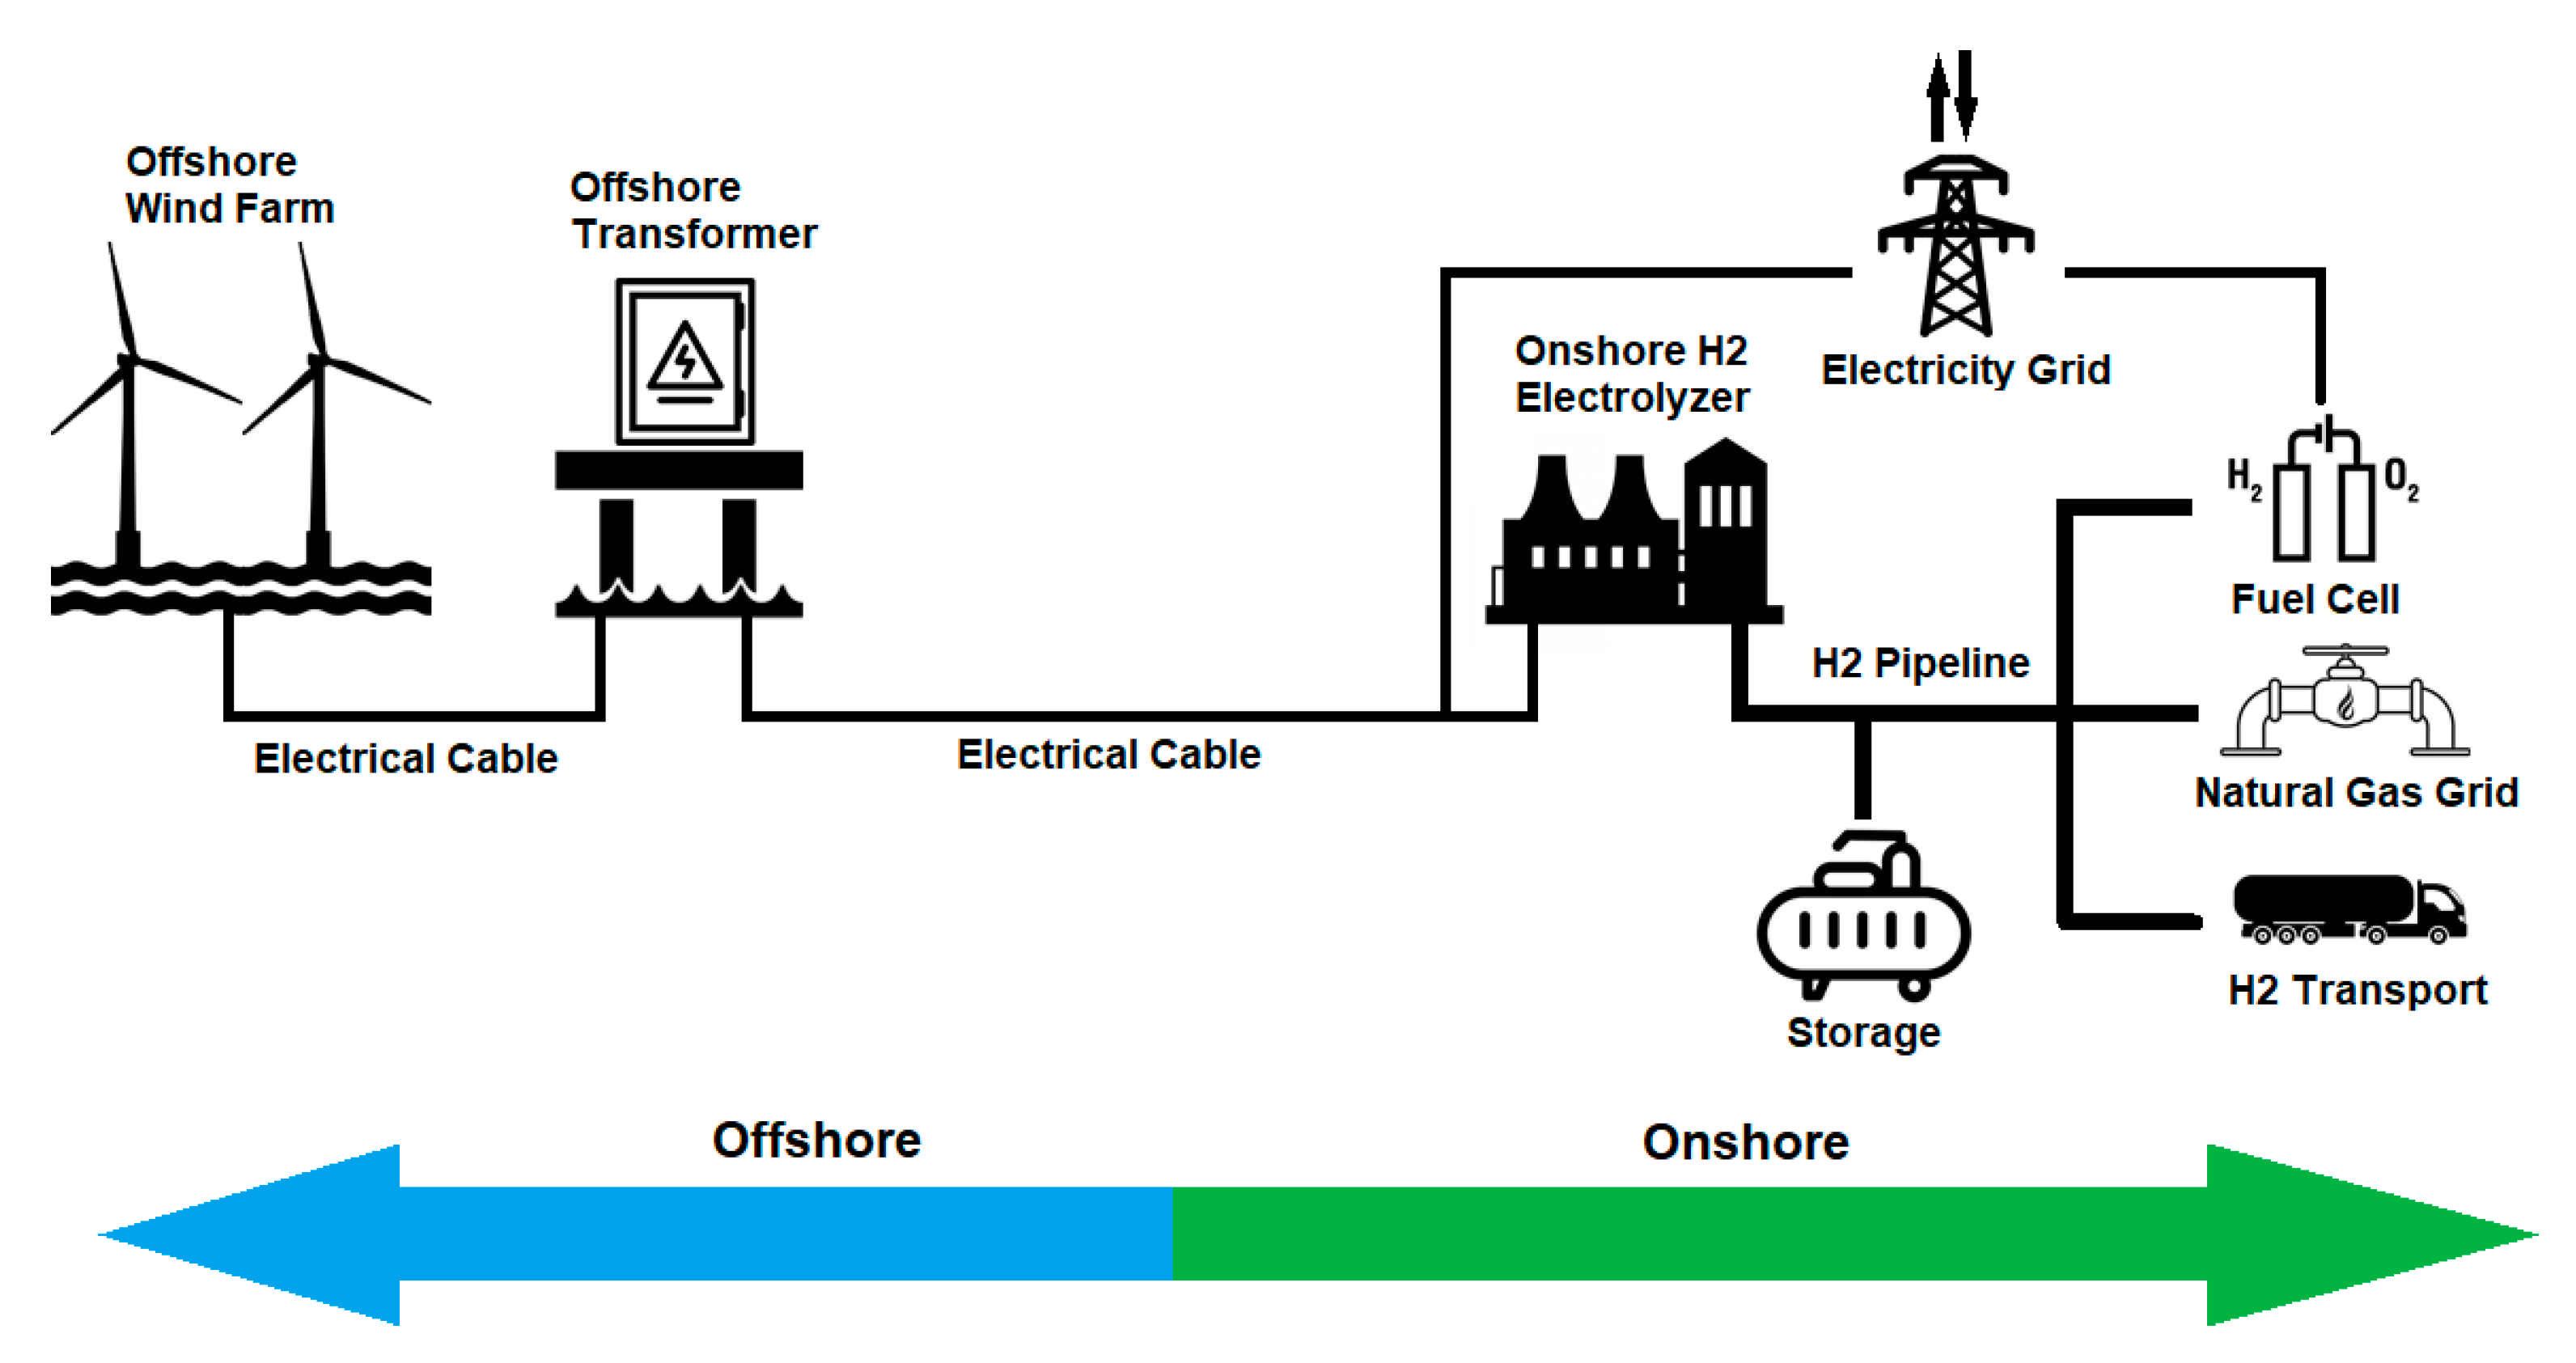
3.2. Onshore Electrolyzer Scenario

This approach is also known as a hybrid system, where the energy produced is transmitted to shore as electricity in conventional cables; once onshore, the energy can be sold directly to the grid or used to produce hydrogen. The main advantage of this system is flexibility: when the market price for electricity is high, the investor can sell electricity directly to the grid; when the market price is low or grid level curtailment must occur, the energy can be redirected to an electrolyzer to produce hydrogen. Curtailment occurs when the production of electricity is greater than the consumption, which leads to a need to reduce the production. Figure 3 contains an overview of the onshore electrolyzer system.
Since in this approach the electrolyzer will be onshore, it is possible to place the electrolyzer and all other sensitive equipment inside a building, where they can be sheltered from the elements; this also provides a better work environment for the personnel responsible for the operation and maintenance. Furthermore, since access to the electrolyzer is much simpler than if it was offshore, the increased maintenance requirements and decreased power density of an AEL do not present as big an obstacle, so the reduced CAPEX of this technology means both AEL and PEMEL are viable when the electrolyzer is installed on land.
HVDC is a more expensive technology that only becomes interesting when wind farms are located far from shore and/or have high nominal powers [26]. In the case of HVAC, longer lines imply more powerful line-reactive compensators to account for the capacitive losses, which in turn increases the cost. Since HVDC transmission does not show capacitive losses—only ohmic losses occur—the transmission losses and costs are significantly lower for HVDC. To summarize, transmission losses and costs are lower in the case of HVDC, and even though the initial investment for HVDC transmission (stations and equipment) is higher than HVAC, the difference in cost diminishes when the transmission distance increases. The break-even distance for which HVDC becomes preferable is around 50–100 km for underground and underwater cables [26].
Regarding the source of water, the two possible options are connecting the electrolyzer to the freshwater grid, an option that might not be viable due to environmental concerns in areas with recurring droughts, like southern Europe, or installation of a desalination unit next to the electrolyzer. Even though the water produced by a desalination unit is clean, and the water in freshwater grids has been previously treated, further treatment such as deionizing the water is still required for both options before being used in electrolysis [27].

4. Hydrogen Utilization

One of the properties of hydrogen that makes it so interesting is the wide array of utilization cases. Historically, hydrogen production was based on fossil fuels, so there wasn’t an incentive to adopt hydrogen as an energy source since it had a carbon footprint. However, recent studies project significant cost reductions in electrolyzers in the coming years [11,20,27], with the possibility of green hydrogen becoming competitive with hydrogen produced from fossil fuels. Hydrogen electrolysis can also be a great way of reducing emissions, be it by working as energy storage to help when renewable resources are scarce or by reducing emissions caused by other polluting ways of producing hydrogen. The use cases for hydrogen can be divided into three main areas: generating electricity, Power to Gas (P2G), and hydrogen as the end product.

4.1. Generating Electricity

Hydrogen currently represents the best non-fossil fuel for some heavy vehicles that require large energy storage and fast recharge rates, such as long-haul trucks, buses, hybrid trains designed to operate on both electrified and non-electrified train tracks, and even for a common car, since refilling the hydrogen tank takes a few minutes and gives around 600 km of range [28]. This application is denominated as Power to Mobility (P2M).
For grid applications, the fast response time of some fuel cells makes them adequate as dispatchable power plants for peak demand or for frequency control. This application is denominated as Power to Power (P2P). Furthermore, some solid oxide systems can operate with high efficiencies in both electrolyzer and fuel cell modes; however, it should be noted this technology has not reached the commercial level yet [12,29].
The main fuel cell technologies are Polymer Electrolyte Membrane, also known as Proton Exchange Membrane (PEMFC), Alkaline (AFC), Phosphoric Acid (PAFC), Molten Carbonate (MCFC), and Solid Oxide (SOFC) [30]. The first two are considered low-temperature fuel cells, and the remaining are high-temperature fuel cells. As far as the efficiencies are concerned, they range from 40% (PAFC) to 60% (PEM, AFC, SOFC), with MCFC in between (50%).
Both AFC and PEMFC have quick start-up times; however, PEMFC presents greater power density, so it is the primary choice to equip hydrogen-based vehicles. Due to this emerging market, intensive research and development of PEMFC is being performed by car and bus manufacturers; consequently, cost reductions and increased durability are expected in the coming years.
Most stationary installations of fuel cells are at high operating temperature [31], with one example being the 50 MW Daesan Hydrogen-Fuel-Cell Power Generation that started operating in South Korea in 2020. The plant is composed of 114 PAFC fuel cells and will produce around 400,000 MWh of energy annually [32,33].
In the past few years, PAFC and MCFC have presented the highest growth rate, though this is expected to change due to several companies offering PEMFC in the order of >1 MW [31], some of them stackable modules.

4.2. Power to Gas

Hydrogen is a highly flammable gas, so it is possible to inject some hydrogen into the natural gas grid without significant modifications to the grid or the systems that use natural gas. This application is denominated as P2G. Some pilot projects already in operation blend up to 20% hydrogen in localized natural gas grids such as small communities or universities [34]. Several studies support the idea that a low concentration of hydrogen (up to 15–20%) in the natural gas grid does not significantly increase the risk associated with utilization of the gas [35,36].
Another approach is being studied at several locations, including Central do Ribatejo in Portugal by EDP [37], where a 1 MW electrolyzer produces hydrogen during ramp down periods and stores it at 300 bar (storage capacity of 400 kg, which is around 13 MWh). The project plans to study the injection of hydrogen in the natural gas grid and the co-combustion of hydrogen and natural gas in a regular gas turbine. This installation is part of an international project named FLEXnCONFU, which aims to integrate hydrogen and ammonia in the electrical grid [38].

4.3. Hydrogen as the End Product

Arguably the best industry to sell green hydrogen is the already existing industry for hydrogen, predominantly used in refineries and for ammonia production. The estimated demand in 2018 was above 80 million tons [27]. Since this industry is already in place, the source of hydrogen can simply be gradually replaced by green hydrogen, especially as the LCOH of green hydrogen continues to decrease.
While ammonia can be the end product, it can also act as a carrier of hydrogen in order to facilitate transport with an equivalent hydrogen density of 122.4 kg/m3 at a temperature of around 25 °C and a pressure of 10 to 20 bar. When compared to liquid hydrogen, the density is roughly 75% higher, and it can be transported at ambient temperatures and low pressures. The main disadvantage is the increased cost and complexity of producing the ammonia and afterwards decomposing it to recoup the hydrogen [20].

5. State-of-the-Art Review

The annual production of hydrogen in the EU is roughly 9.75Mt; this is currently being produced using carbon-intensive methods, which would require 290 TWh of electricity if the hydrogen was produced solely from electrolysis, around 10% of current production in the EU. In 2020, G. Kakoulaki et al. [39] concluded that the EU has enough renewable energy resources spread throughout member countries to satisfy the hydrogen demand solely using green hydrogen, thus allowing for decarbonization of the sector.
Electrolyzers can play a role in adding flexibility to an electricity grid. A technical analysis was conducted by D. Gusain et al. [40] to study the use of electrolyzers as flexibility service providers. A model for large-scale PEMEL was developed, along with the simulation of different use cases, to assess frequency regulation, flexibility provision, and long-term impact analysis of a PEMEL connected to the CIGRE MV grid [41]. For the first use case, the electrolyzer’s response was adequate, and even though the test had a 40 min duration, no cell degradation took place. For the second case, the electrolyzer was used to correct the difference between the expected power injection and the real power injected at a certain bus. The bus had a wind farm attached, so a forecast was made of the expected power produced throughout the day. The results showed the electrolyzer ensured that the real power was equal to the forecast power, which means an electrolyzer can be used to provide flexibility to the grid operator. In the final case, the electrolyzer was run at a constant current for a year; a drop in efficiency of 0.8% was calculated. Over a duration of five years, the efficiency drop increased to 3.5%. The impact derived from these efficiency drops must be taken into account in long-term strategies, so that the flexibility provided by the electrolyzer is always correctly assessed.
The sizing of electrolyzers must weigh numerous factors, namely the power produced by the wind farm and if there is a grid connection to provide power to the electrolyzer during low wind periods. The main advantage of the grid connection is a more consistent hydrogen production rate, and the main disadvantage is not being able to guarantee 100% carbon-free hydrogen due to consuming power from the grid. José G. García Clúa et al. [42] state that the ratio between the wind turbine’s nominal wind speed ( v N ) and the mean wind speed ( v m ) of the installation site and the shape coefficient of a Weibull probability function k are the main influences in sizing the nominal powers of the electrolyzer and the wind turbine. The paper concludes that for v N / v m lower than 1.67, the electrolyzer makes good use of the available turbine power; however, the wind potential of the site is not fully exploited. On the other hand, for v N / v m greater than 1.77, the opposite happens. The recommended operation point is v N / v m in the range of 1.67 to 1.77, since in this range a balance between making good use of the available turbine power and exploiting the wind potential of the location is struck.
A techno-economic analysis of grid-connected hydrogen production was performed by T. Nguyen et al. [43], in which several electricity pricing schemes and hydrogen storage solutions were analyzed. The pricing schemes considered were flat rates in five Canadian provinces and real-time pricing in Germany, California, and Ontario. The study concludes that a real-time pricing scheme yields lower LCOH, since the electrolyzer can reduce consumption during periods of high energy prices, and that including storage is a good alternative to increase flexibility, especially when underground storage can be implemented. A capacity factor ranging between 0.9 and 1 was found to be optimal, since this minimizes consumption during peak hours but ensures a high utilization of the CAPEX. The lowest LCOH obtained was 2.49–2.74 €/kg for AEL (2.26–3.01 €/kg for PEMEL) with underground storage in a real-time pricing scheme in Ontario; this is competitive with hydrogen produced using Steam Methane Reform (SMR) with carbon capture, which is around 2.51–3.45 €/kg.
A similar study on offshore hydrogen production with underground storage was developed by Van Nguyen Dinh et al. [24], where the CAPEX and OPEX used were consistent with the forecast for offshore wind power and electrolyzers in the year 2030. The results show that for a 101.3 MW wind farm 15 km off the coast of Arklow, Ireland, at a selling price of 5 €/kg, the Discounted Payback Period (DPB), considering storage for 2, 7, 21, and 45 days of average hydrogen production, is 7.8, 8.6, 11.1, and 16.2 years, respectively.
The wind potential in Patagonia is enormous, being anywhere from 4100 to 5200 full-load hours on average, which leads to an LCOE of electricity as low as 25.6 €/MWh. In 2018, Philipp-Matthias Heuser et al. [44] analyzed a link between Japan and Patagonia, where hydrogen is produced and liquefied in Patagonia and shipped to Japan. The analysis estimated that the LCOH is 2.16 €/kg at the output of the electrolyzer, with an increase of 0.57 €/kg after transport to the shipping port and a further 0.58 €/kg to liquefy the hydrogen and store it in liquid form, which brings the final LCOH to 3.31 €/kg. The cost of transport to Japan is 1.13 €/kg, so the cost of hydrogen upon arrival in Japan is 4.44 €/kg.
With the increasing presence of renewable energy in the grid, higher levels of curtailment in renewable power plants will take place. Considering this reasoning, a study was conducted to compare three scenarios using an offshore wind farm [45]: sell all electricity to the grid (scenario 1), convert all electricity to hydrogen (scenario 2), or a hybrid system where electricity is sold to the grid when prices are high and converted to hydrogen when curtailment occurs or electricity prices are low (scenario 3). A model was developed for a 504 MW wind farm located 14.5 km off the coast of Arklow, Ireland, and all three scenarios were simulated. The results obtained were an LCOE in scenario 1 of 38.1 €/MWh for 0% curtailment and 47.6 €/MWh for 20% curtailment, while the LCOH for scenario 2 was 3.77 €/kg. For scenario 3, if the hydrogen price was 4 €/kg, only at curtailment levels higher than 17% could adding hydrogen generation provide an equal or higher Net Present Value (NPV). If the hydrogen price was 4.25 €/kg, then the level of curtailment for which hydrogen generation becomes profitable is 10%.
Another article comparing the three scenarios described above was written by Pengfei Xiao et al. [46] in 2020, where the model was developed for a wind farm in Denmark. Here, the electricity price for the first and third scenarios varied from 80 €/MWh to 160 €/MWh, depending on the time of day, with the hydrogen price fixed at 6.27 €/kg in the scenarios where hydrogen was produced. The article concluded that the hybrid approach yields greater economic interest compared to the other scenarios, with most of the hydrogen being produced at night when the electricity price is lower.
A slightly different approach was taken by Peng Hou et al. [47], where a 72 MW offshore wind farm was considered for the production of hydrogen, with two possible operating scenarios. In the first scenario, all of the energy was converted to hydrogen in an electrolyzer, stored, and then converted back to electricity in a fuel cell to sell to the grid during peak hours. In the second scenario, the electricity generated by the wind turbines could be sold to the grid or fed into an electrolyzer, with the possibility of buying energy from the grid when prices are extremely low. The electricity prices considered were the electricity prices for Denmark in 2015. The study concluded that the first scenario was not economically viable due to the low round-trip efficiency of the electrolyzer and fuel cell. However, for the second scenario, considering a 50% capacity factor for the electrolyzer, the DPB was 24.4, 5.5, and 2.6 years and the nominal power of the electrolyzer was 5.5, 13.5, and 23.4 MW for a hydrogen price of 2, 5, and 9 €/kg, respectively.
A model to determine the most suitable electrolyzer technology and to compare solar and wind as the energy sources of a green hydrogen production system was developed by Christian Schnuelle et al. [48]. Several scenarios were included in the article, such as onshore and offshore wind as well as nominal powers of the electrolyzer of 40%, 60%, or 80% of the respective power plant’s nominal power. All the renewable energy generation profiles considered were measured in northwest Germany in 2017. Considering a fixed electricity price, dependent on the installation chosen and typical annual load duration curves, the authors state that AEL proved the most economically viable option, mainly due to higher efficiencies and improved stack life, which reduces the investment in replacing stacks and the lower initial investment. The lowest LCOH achieved was 4.33 €/kg. Despite being more expensive, PEMEL offers an advantage regarding energy utilization, since it can operate at lower power and better harness the renewable resources available.
To compare the subject of this paper to other green hydrogen applications, two articles regarding hydrogen production using solar energy were analyzed. The first considers various locations in Morocco [49], with different types of Photovoltaic (PV) panel installations, from fixed to two-axis tracking, and a CSP installation. Even though fixed PV panels produced the lowest LCOH of 4.74 €/kg, a better balance was achieved using one-axis tracking, which produced 30% more hydrogen and a small LCOH increase to 4.88 €/kg.
The second article analyzed not only green hydrogen production using PV or CSP to harness the solar energy in the Atacama Desert, Chile, but also the existing technologies to transport hydrogen in a higher energy density—liquefied hydrogen and ammonia carrier [20]. The lowest LCOH in 2018, 1.82 €/kg, was obtained using PV, a power purchase agreement, and converting the electricity to hydrogen in an AEL. In 2025, LCOH reductions are expected to be around 20% to 34%, higher in PEMEL than AEL, to a minimum value of 1.39 €/kg. The cost of liquefying hydrogen (1.28 €/kg) is lower than the cost to convert to and from ammonia (total 2.04 €/kg), but due to the higher energy density and ease of transport, a case can be made for ammonia as a means of transporting hydrogen.
Both of the articles agree that despite CSP with thermal storage allowing for a much higher capacity factor, which reduces the nominal power of the electrolyzer, the reduction in CAPEX in the electrolyzer is smaller than the increase in CAPEX by using CSP instead of PV.
Regarding the applications of hydrogen, Rodica Loisel et al. [50] developed a model with an offshore wind farm off the coast of Saint Nazaire, France. The paper simulated the economic viability of each application individually, then combined the two applications (for example, P2P and P2G), and presented a final scenario where all applications considered were implemented. In all scenarios, the electrolyzer’s nominal power was considerably lower than the wind farm nominal power; consequently, most of the energy produced was sold directly to the electricity grid at wholesale prices, with the remaining energy being reserved for secondary and tertiary reserves. The study concluded that the most economically viable approach was P2G, with a hydrogen price of 4.2 €/kg. However, even the most profitable approach presents a negative NPV. It should be noted that combining many applications led to a higher investment cost and ultimately reduced the project’s profit.
Focusing on P2P, where fuel cells can play a role as long-term energy storage and fast-acting dispatchable power plants, a review of the main fuel cell technologies was conducted in 2018 [51]. After analyzing each technology, the authors concluded that since fuel cells do not have great electrical efficiencies (40% to 55%), the best way to harvest their potential is to utilize the heat generated, either for heating in the case of low-temperature fuel cells (PEMFC and AFC) or Combined Heat and Power (CHP) in the case of high-temperature fuel cells (AFC, MCFC, and SOFC). Integrating CHP yields an increase of 10% to 30% in efficiency. In addition, micro gas turbines can be used to provide further heat to the combined cycle, which might also lead to an increase in efficiency.
A challenge associated with a high percentage of renewable power in electricity grids is frequency containment, usually ensured by big synchronous generators in traditional power plants due to their high inertia. PEMFC presents high current density and fast response times; consequently, it might be an option to help maintain the grid frequency. To assess the role this technology can play in frequency containment, F.A. Alshehri et al. [52] developed a dynamic model to simulate PEMFC, validated that the model’s response resembled the response shown in the existing literature, and compared the Frequency Containment Reserve (FCR) of PEMFC and synchronous generators. The scenarios consisted of a 50 MW disturbance for different system inertia with values 100%, 50%, and 25%, for both synchronous generators and PEMFC as FCR. For all scenarios, PEMFC provided the best nadir (lowest frequency recorded) and a faster rate of frequency stabilization, while the values representing Rate-of-Change-of-Frequency remained the same for both scenarios.
Continuing with the analysis for the viability of grid-connected fuel cells, an assessment was conducted in 2013 [53]. The authors of the assessment concluded that the start-up time of the fuel cell must be taken into account (around 10 min). Furthermore, the dynamic loading on the system severely influences the longevity of the fuel cells; a load ranging from 0–100% presented a much lower power output after 100 operating hours than a load ranging from 40–100% after 400 operating hours. As long as some requirements and the operating conditions mentioned above are respected, grid-connected fuel cells are viable.
In the past, green hydrogen production has not been able to compete with other methods of producing hydrogen due to the increased cost. However, costs are rapidly decreasing, and affordable green hydrogen can become a reality by the year 2030, as is pointed out in several articles analyzed in this section. Both solar and wind have the potential to be the renewable energy source used in the production of hydrogen, with researchers on all continents studying different approaches. With the prospect of clean hydrogen, innovative uses are also being studied, from P2G to grid-connected fuel cells and electrolyzers to aid in grid stability and energy storage. In order to transport large quantities of hydrogen, liquified hydrogen and ammonia carrier are technologies that are currently being developed and that show potential to further lower the cost of implementing green hydrogen solutions.
Table 3 contains a summary of the LCOH observed throughout the literature review. LCOH is calculated by adding all the expenses of the project (CAPEX and OPEX correctly adjusted according to the rate of return) and dividing by the amount of hydrogen produced by the electrolyzer in kg. The cost of hydrogen is influenced mainly by the electricity cost and the cost of the required infrastructure, which means AEL typically has a lower LCOH than PEMEL due to the lower cost. The same applies to the electricity source: the lower LCOH values are observed in locations with low electricity prices, such as the electricity grid in Ontario [43], solar PV in Chile [20], or onshore wind in Patagonia [44].
The more economically viable electricity sources for producing green hydrogen are solar PV and onshore wind, mainly because the LCOE of these two energy sources is considerably lower than solar CSP and offshore wind. The LCOE is the factor that influences the LCOH the most [20,45]; therefore, technologies with the lowest LCOE are the best suited to being the electricity source in green hydrogen projects. More specifically, the lowest LCOH for solar PV was found in the Atacama Desert in Chile [20], and the lowest LCOH for onshore wind was found in Patagonia [44], two locations with abundant availability of their respective renewable resources.

6. Conclusions

Hydrogen has several applications, including being mixed with natural gas in P2G, powering vehicles in P2M, and providing energy storage and grid balancing services in P2P. In the last decades, hydrogen has had carbon emissions associated with its production, and for this reason its potential has not been fully explored. However, due to recent advancements in electrolyzers and renewable energy, the cost competitiveness of green hydrogen is quickly rising and is expected to match fossil-fuel-based hydrogen in the coming years.
Compared to wind energy on land, offshore wind has higher wind speeds and is more consistent, making it a more attractive resource to generate electricity. The main drawbacks have been the higher cost and technical challenges associated with transmitting the electricity to shore, though this has improved in the past years. Offshore wind farms are increasing in size and are built further and further away from shore; nonetheless, they have been experiencing LCOE reductions, almost reaching competitive values. Furthermore, with the development of floating wind platforms, wind farms can be placed in deeper waters, allowing more locations to be accessible for electricity generation.
Two hydrogen production systems based on offshore wind energy are currently proposed, in which not only are electricity and hydrogen produced but grid balancing services are provided, such as frequency control. The first system utilizes an offshore electrolyzer; hydrogen is produced, compressed, and transported in a pipeline to shore. The main advantages are the reduced cost of a submarine pipeline compared to a submarine electrical cable and supporting power electronics, along with the reduction in transmission losses of gas in a pipeline (0.1%) in comparison to conventional wind farms (up to 5%). In the second system, the electrolyzer is located on land, so the electricity generated offshore is transmitted through an electrical cable to land. Once the electricity reaches the shore, it can be sold directly as electricity when the price is high during peak periods or can be fed into an electrolyzer to produce hydrogen when the electricity prices are low or curtailment must occur. The advantage is the increased flexibility provided to the operator, with the option of selling electricity or producing hydrogen, depending on the most economically viable choice.
The literature shows the decreasing costs for green hydrogen production, both for wind and solar energy, along with the forecast of how the technology is expected to evolve: less expensive, longer lasting, and more efficient electrolyzers. Furthermore, the integration of fuel cells and electrolyzers at a grid level can aid in overcoming some of the challenges of generating electricity from renewable energy sources, like frequency control and energy storage.

Author Contributions

Conceptualization, G.C. and R.C.; methodology, G.C. and R.C.; software, G.C.; validation, G.C. and R.C.; formal analysis, G.C. and R.C.; investigation, G.C.; resources, G.C.; data curation, G.C.; writing—original draft preparation, G.C.; writing—review and editing, R.C.; visualization, G.C. and R.C.; supervision, R.C.; project administration, R.C.; funding acquisition, R.C. All authors have read and agreed to the published version of the manuscript.

Funding

This research was funded by Fundação para a Ciência e a Tecnologia (FCT), grant number UIDB/50021/2020.

Institutional Review Board Statement

Not applicable.

Informed Consent Statement

Not applicable.

Data Availability Statement

Not applicable.

Acknowledgments

EDP-NEW is deeply acknowledged for providing the adequate conditions for carrying out this work.

Conflicts of Interest

The authors declare no conflict of interest. The funders had no role in the design of the study; in the collection, analyses, or interpretation of data; in the writing of the manuscript, or in the decision to publish the results.

Nomenclature

AELAlkaline Electrolyzer
AFCAlkaline Fuel Cell
CHPCombined Heat and Power
CSPConcentrated Solar Power
DPBDiscounted Payback Period
FCRFrequency Containment Reserve
HVACHigh Voltage Alternating Current
HVDCHigh Voltage Direct Current
LCOELevelized Cost Of Energy
LCOHLevelized Cost Of Hydrogen
LNGLiquified Natural Gas
MCFCMolten Carbonate Fuel Cell
NPVNet Present Value
P2GPower to Gas
P2MPower to Mobility
P2PPower to Power
PAFCPhosphoric Acid Fuel Cell
PEMELProton Exchange Membrane Electrolyzer
PEMFCProton Exchange Membrane Fuel Cell
PVPhotovoltaic
SDGsUnited Nations Sustainable Development Goals
SMRSteam Methane Reform
SOESolid Oxide Electrolyzer
SOFCSolid Oxide Fuel Cell

References

  1. IEA. Key World Energy Statistics; IEA: Paris, France, 2020; Available online: https://www.iea.org/reports/key-world-energy-statistics-2020 (accessed on 7 April 2021).
  2. Panfilov, M. 4—Underground and pipeline hydrogen storage. In Compendium of Hydrogen Energy, Woodhead Publishing Series in Energy; Gupta, R.B., Basile, A., Veziroglu, T.N., Eds.; Woodhead Publishing: Sawston, UK, 2016; pp. 91–115. [Google Scholar] [CrossRef]
  3. Miao, B.; Giordano, L.; Chan, S.H. Long-distance renewable hydrogen transmission via cables and pipelines. Int. J. Hydrogen Energy 2021, in press. [Google Scholar] [CrossRef]
  4. WindEurope. Offshore Wind in Europe: Key Trends and Statistics 2020. 2021. Available online: https://windeurope.org/intelligence-platform/product/offshore-wind-in-europe-key-trends-and-statistics-2020/ (accessed on 7 April 2021).
  5. The European Marine Observation and Data Network (EMODnet). Available online: https://portal.emodnet-bathymetry.eu/ (accessed on 7 April 2021).
  6. Offshore Renewable Energy (ORE) Catapult. Offshore Wind and Hydrogen: Solving the Integration Challenge. 2020. Available online: https://ore.catapult.org.uk/?orecatapultreports=offshore-wind-and-hydrogen-solving-the-integration-challenge (accessed on 7 April 2021).
  7. Airborne WindEurope. High-altitude Wind Energy Map Published. Available online: https://airbornewindeurope.org/resources/high-altitude-wind-energy-map-published-2/ (accessed on 7 April 2021).
  8. Equinor. Hywind Scotland. Available online: https://www.equinor.com/en/what-we-do/floating-wind/hywind-scotland.html (accessed on 7 April 2021).
  9. WindEurope. Offshore Wind in Europe: Key Trends and Statistics 2017. 2018. Available online: https://windeurope.org/intelligence-platform/product/the-european-offshore-wind-industry-key-trends-and-statistics-2017/ (accessed on 7 April 2021).
  10. ERM. Dolphyn Hydrogen Phase 1—Final Report. October 2019. Available online: https://assets.publishing.service.gov.uk/government/uploads/system/uploads/attachment_data/file/866375/Phase_1_-_ERM_-_Dolphyn.pdf (accessed on 26 April 2021).
  11. IRENA. Hydrogen from Renewable Power: Technology Outlook for the Energy Transition. 2018. Available online: https://irena.org/publications/2018/Sep/Hydrogen-from-renewable-power (accessed on 7 April 2021).
  12. Buttler, A.; Spliethoff, H. Current status of water electrolysis for energy storage, grid balancing and sector coupling via power-to-gas and power-to-liquids: A review. Renew. Sustain. Energy Rev. 2018, 82, 2440–2454. [Google Scholar] [CrossRef]
  13. Guo, Y.; Li, G.; Zhou, J.; Liu, Y. Comparison between hydrogen production by alkaline water electrolysis and hydrogen production by PEM electrolysis. IOP Conf. Ser. Earth Environ. Sci. 2019, 371, 042022. [Google Scholar] [CrossRef]
  14. McPhy. Augmented McLyzer. Available online: https://mcphy.com/en/equipment-services/electrolyzers/augmented/ (accessed on 7 April 2021).
  15. Andersson, J.; Grönkvist, S. Large-scale storage of hydrogen. Int. J. Hydrogen Energy 2019, 44, 11901–11919. [Google Scholar] [CrossRef]
  16. Dagdougui, H.; Sacile, R.; Bersani, C.; Ouammi, A. Chapter 4—hydrogen storage and distribution: Implementation scenarios. In Hydrogen Infrastructure for Energy Applications; Dagdougui, H., Sacile, R., Bersani, C., Ouammi, A., Eds.; Academic Press: Cambridge, MA, USA, 2018; pp. 37–52. [Google Scholar] [CrossRef]
  17. Hydrogenics. Large Scale PEM Electrolysis: Technology Status and Upscaling Strategies. Available online: https://www.google.com/url?sa=t&rct=j&q=&esrc=s&source=web&cd=&ved=2ahUKEwjz7KHVme3vAhVECxoKHSUdCCkQFjACegQIAxAD&url=http%3A%2F%2Fhybalance.eu%2Fwp-content%2Fuploads%2F2019%2F10%2FLarge-scale-PEM-electrolysis.pdf&usg=AOvVaw1YjdSYyby88zmNHVsqeAsz (accessed on 7 April 2021).
  18. Siemens. Decarbonizing Energy with Green Hydrogen: Technology Available and Proven in Production Today. Available online: https://assets.new.siemens.com/siemens/assets/api/uuid:390d0f48-499e-4451-a3c2-faa30c5bafe7/version:1598442587/power-to-x-technical-paper-siemens-short.pdf (accessed on 29 May 2021).
  19. Kruck, O.; Crotogino, F.; Prelicz, R.; Rudolph, T. Overview on all known underground storage technologies for hydrogen. In Project HyUnder–Assessment of the Potential, the Actors and Relevant Business Cases for Large Scale and Seasonal Storage of Renewable Electricity by Hydrogen Underground Storage in Europe. Report D. 2013, Volume 3. Available online: http://hyunder.eu/wp-content/uploads/2016/01/D3.1_Overview-of-all-known-underground-storage-technologies.pdf (accessed on 26 April 2021).
  20. Gallardo, F.I.; Ferrario, A.M.; Lamagna, M.; Bocci, E.; Garcia, D.A.; Baeza-Jeria, T.E. A techno-economic analysis of solar hydrogen production by electrolysis in the north of Chile and the case of exportation from Atacama desert to Japan. Int. J. Hydrogen Energy 2021, 46, 13709–13728. [Google Scholar] [CrossRef]
  21. Negra, N.B.; Todorovic, J.; Ackermann, T. Loss evaluation of HVAC and HVDC transmission solutions for large offshore wind farms. Electr. Power Syst. Res. 2006, 76, 916–927. [Google Scholar] [CrossRef]
  22. Papadopoulos, A.; Rodrigues, S.; Kontos, E.; Todorcevic, T.; Bauer, P.; Pinto, R.T. Collection and transmission losses of offshore wind farms for optimization purposes. In Proceedings of the 2015 IEEE Energy Conversion Congress and Exposition (ECCE), Montreal, QC, Canada, 20–24 September 2015; pp. 6724–6732. [Google Scholar] [CrossRef]
  23. North Sea Energy. A Vision on Hydrogen Potential from the North Sea. 2019. Available online: https://north-sea-energy.eu/static/29bef9235ee0548a2425dea4356a2f1e/NSE3-D1.6-D1.7-D1.8-Offshore-Hydrogen-Roadmap-linked-to-national-hydrogen-grid.pdf (accessed on 7 April 2021).
  24. Dinh, V.N.; Leahy, P.; McKeogh, E.; Murphy, J.; Cummins, V. Development of a viability assessment model for hydrogen production from dedicated offshore wind farms. Int. J. Hydrogen Energy 2020, in press. [Google Scholar] [CrossRef]
  25. General Electric. Switch It Up: This Tech Helps Take the World’s Largest Offshore Wind Turbine to a New Level. 2018. Available online: https://www.ge.com/news/reports/switch-tech-helps-take-worlds-largest-offshore-wind-turbine-new-level (accessed on 7 April 2021).
  26. Alassi, A.; Bañales, S.; Ellabban, O.; Adam, G.; MacIver, C. HVDC transmission: Technology review, market trends and future outlook. Renew. Sustain. Energy Rev. 2019, 112, 530–554. [Google Scholar] [CrossRef]
  27. IRENA. Green Hydrogen Cost Reduction: Scaling Up Electrolyzers to Meet the 1.5 °C Climate Goal. 2020. Available online: https://www.irena.org/publications/2020/Dec/Green-hydrogen-cost-reduction (accessed on 7 April 2021).
  28. Toyota. 2021 Toyota Mirai. Available online: https://www.toyota.com/mirai/ (accessed on 29 May 2021).
  29. Wood, A.; He, H.; Joia, T.; Brown, C.C. Reversible solid oxide fuel cell development at versa power systems. ECS Trans. 2015, 66, 23. [Google Scholar] [CrossRef]
  30. US. Department of Energy. Comparison of Fuel Cell Technologies. 2016. Available online: https://www.energy.gov/eere/fuelcells/comparison-fuel-cell-technologies (accessed on 7 April 2021).
  31. Weidner, E.; Ortiz Cebolla, R.; Davies, J. Global Deployment of Large Capacity Stationary Fuel Cells–Drivers of, and Barriers to, Stationary Fuel Cell Deployment; JRC115923; EUR 29693 EN; Publications Office of the European Union: Luxembourg, 2019; ISBN 978-92-76-00841-5. [Google Scholar] [CrossRef]
  32. Doosan starts installation of hydrogen-fueled 50 MW fuel cell power plant in South Korea. Fuel Cells Bull. 2018, 2018, 1. [CrossRef]
  33. Fuel Cells Works. Daesan Hydrogen Fuel Cell Power Plant Completed with Help of Doosan Fuel Cells. Available online: https://fuelcellsworks.com/news/daesan-hydrogen-fuel-cell-power-plant-completed-with-help-of-doosan-fuel-cells/ (accessed on 26 April 2021).
  34. HyDeploy. Available online: https://hydeploy.co.uk/ (accessed on 7 April 2021).
  35. Melaina, M.W.; Antonia, O.; Penev, M. Blending hydrogen into natural gas pipeline networks: A review of key issues. Tech. Rep. 2013. [Google Scholar] [CrossRef] [Green Version]
  36. Quarton, C.J.; Samsatli, S. Power-to-gas for injection into the gas grid: What can we learn from real-life projects, economic assessments and systems modelling? Renew. Sustain. Energy Rev. 2018, 98, 302–316. [Google Scholar] [CrossRef]
  37. EDP. FLEXnCONFU: Power-to-X to Increase the Flexibility of Thermal Plants. Available online: https://www.edp.com/en/innovation/flexnconfu-power-to-increase-the-flexibility-of-thermal-plants (accessed on 26 April 2021).
  38. FLEXnCONFU. Available online: https://flexnconfu.eu/demonstration/ (accessed on 29 May 2021).
  39. Kakoulaki, G.; Kougias, I.; Taylor, N.; Dolci, F.; Moya, J.; Jager-Waldau, A. Green hydrogen in Europe—a regional assessment: Substituting existing production with electrolysis powered by renewables. Energy Convers. Manag. 2021, 228, 113649. [Google Scholar] [CrossRef]
  40. Gusain, D.; Cvetković, M.; Bentvelsen, R.; Palensky, P. Technical assessment of large-scale PEM electrolyzers as flexibility service providers. In Proceedings of the 2020 IEEE 29th International Symposium on Industrial Electronics (ISIE), Delft, The Netherlands, 24 September 2020; pp. 1074–1078. [Google Scholar] [CrossRef]
  41. CIGRE. Available online: https://www.cigre.org/ (accessed on 26 April 2021).
  42. Clúa, J.G.G.; Mantz, R.J.; de Battista, H. Optimal sizing of a grid-assisted wind-hydrogen system. Energy Convers. Manag. 2018, 166, 402–408. [Google Scholar] [CrossRef]
  43. Nguyen, T.; Abdin, Z.; Holm, T.; Me´rida, W. Grid-connected hydrogen production via large-scale water electrolysis. Energy Convers. Manag. 2019, 200, 112108. [Google Scholar] [CrossRef]
  44. Heuser, P.-M.; Ryberg, D.S.; Grube, T.; Robinius, M.; Stolten, D. Techno-economic analysis of a potential energy trading link between Patagonia and Japan based on CO2 free hydrogen. Int. J. Hydrogen Energy 2019, 44, 12733–12747. [Google Scholar] [CrossRef]
  45. McDonagh, S.; Ahmed, S.; Desmond, C.; Murphy, J.D. Hydrogen from offshore wind: Investor perspective on the profitability of a hybrid system including for curtailment. Appl. Energy 2020, 265, 114732. [Google Scholar] [CrossRef]
  46. Xiao, P.; Hu, W.; Xu, X.; Liu, W.; Huang, Q.; Chen, Z. Optimal operation of a wind-electrolytic hydrogen storage system in the electricity/hydrogen markets. Int. J. Hydrogen Energy 2020, 45, 24412–24423. [Google Scholar] [CrossRef]
  47. Hou, P.; Enevoldsen, P.; Eichman, J.; Hu, W.; Jacobson, M.Z.; Chen, Z. Optimizing investments in coupled offshore wind -electrolytic hydrogen storage systems in Denmark. J. Power Sources 2017, 359, 186–197. Available online: http://dx.doi.org/10.1016/j.jpowsour.2017.05.048 (accessed on 26 April 2021). [CrossRef]
  48. Schnuelle, C.; Wassermann, T.; Fuhrlaender, D.; Zondervan, E. Dynamic hydrogen production from PV & wind direct electricity supply—modeling and techno-economic assessment. Int. J. Hydrogen Energy 2020, 45, 29938–29952. [Google Scholar] [CrossRef]
  49. Touili, S.; Merrouni, A.A.; El Hassouani, Y.; Amrani, A.i.; Rachidi, S. Analysis of the yield and production cost of large-scale electrolytic hydrogen from different solar technologies and under several Moroccan climate zones. Int. J. Hydrogen Energy 2020, 45, 26785–26799. [Google Scholar] [CrossRef]
  50. Loisel, R.; Baranger, L.; Chemouri, N.; Spinu, S.; Pardo, S. Economic evaluation of hybrid off-shore wind power and hydrogen storage system. Int. J. Hydrogen Energy 2015, 40, 6727–6739. [Google Scholar] [CrossRef]
  51. Guaitolini, S.V.M.; Yahyaoui, I.; Fardin, J.F.; Encarnac¸ao, L.F.; Tadeo, F. A review of fuel cell and energy cogeneration technologies. In Proceedings of the 2018 9th International Renewable Energy Congress (IREC), Hammamet, Tunisia, 20–22 March 2018; pp. 1–6. [Google Scholar] [CrossRef]
  52. Alshehri, F.; Torres, J.R.; Perilla, A.; Tuinema, B.; van der Meijden, M.; Palensky, P.; Gonzalez-Longatt, F. Generic model of PEM fuel cells and performance analysis in frequency containment period in systems with decreased inertia. In Proceedings of the 2019 IEEE 28th International Symposium on Industrial Electronics (ISIE), Vancouver, BC, Canada, 12–14 June 2019; pp. 1810–1815. [Google Scholar] [CrossRef] [Green Version]
  53. Bernstein, P.A.; Heuer, M.; Wenske, M. Fuel cell system as a part of the smart grid. In Proceedings of the 2013 IEEE Grenoble Conference, Grenoble, France, 16–20 June 2013; pp. 1–4. [Google Scholar] [CrossRef]
Figure 1. Efficiency curve of a PEMEL. Adapted from IRENA [11].
Applsci 11 05561 g001
Figure 2. Offshore electrolyzer system.
Applsci 11 05561 g002
Figure 3. Onshore electrolyzer system.
Applsci 11 05561 g003
Table 1. Electrolyzer power, flow rate, and mass and volume of hydrogen produced.
Power (MW)Flow Rate (Nm3/h)Hydrogen Mass (ton/day)Hydrogen Volume (m3/day)
25500010.81386
10020,00043.25544
500100,00021627,720
1000200,00043255,440
Table 2. Possible approximate dimensions for gaseous storage facilities.
Power (MW)Hydrogen Volume (m3/day)Cylinder Radius (m)Cylinder Height (m)
25138696
10055441311
50027,7202515
100055,4403020
Table 3. Summary of LCOH.
Electricity SourceAEL (€/kg)PEMEL (€/kg)
Grid2.49–2.74 [43]2.26–3.01 [43]
Solar PV2.04–5.00 [20,48]2.71–7.98 [20,48,49]
Solar CSP3.03 [20]3.79–8.5 [20,49]
Onshore Wind4.33 [48]2.73–6.61 [44,48]
Offshore Wind9.17 [48]3.77–11.75 [24,45,48,50]
Publisher’s Note: MDPI stays neutral with regard to jurisdictional claims in published maps and institutional affiliations.

