1. Introduction
Polyurethane (PU) stands out as one of the most demanded polymers, and an exponential growth of its market is expected, which could reach USD 105.2 billion by 2025 [
1]. This growth is based on the constant development of enhanced PUs by the improvement of their properties for covering new applications. PU properties can be modified by varying the amount and type of polyols and isocyanates and the rest of the additives employed in their synthesis, which also allows for classifying them into two main groups: foams (flexible or rigid) and coatings, adhesives, sealants and elastomers (CASEs) [
2]. Among PUs, elastomers can be also classified as cast elastomers, thermoplastic polyurethane elastomers, millable polyurethane gums and microcellular elastomers [
3].
Thermoplastic polyurethane elastomers are one of the PUs with the fastest growth, since they are extremely adaptable to a high number of applications such as sports footwear, athletics tracks, auto body side molding, automotive lumbar supports and electronic products [
3,
4]. In most of these applications, the mechanical and thermal properties are essential to achieve proper human comfort and electronic device performance and durability. As for the rest of the PUs, the enhancement of the elastomers’ quality and characteristics is related to the amount and type of their main constituents and additives [
5]. The main constituents are polyester or polyether polyols (soft segments) and a diisocyanate whose chain is extended with a low molecular weight diol (hard segment) [
5].
Regarding the additives, there has been an increased tendency to synthesize and characterize various clay-containing polymer nanocomposites (CPNs) for improved CASE applications for the last 10–15 years [
6,
7]. By focusing on elastomer polymers improved by additives, Mondal et al. [
6] reported the employment of poly(ethylene-co-octene)-poly(ethylene-co-vinyl acetate) as a hybrid polymer additive for poly(ethylene-co-octene)elastomers (POEs). The addition of only 0.5 wt.% of this additive into the POE improved the tensile strength, modulus, elongation at break, stress relaxation and hysteresis with respect to the virgin POE. Furthermore, they added organically modified montmorillonite (OMt) to the POE (0.5–1.0 wt.%), resulting in a remarkable improvement in appearance compared with the virgin POE.
The addition of cellulose nanocrystals (CNCs) into a styrene–butadiene rubber (SBR) elastomer was assayed by Annamalai et al. [
8], improving the tensile storage moduli (E′). Banerjee et al. studied the addition of CaSO
4 as filler into an epoxidized natural rubber (ENR) matrix, observing a significant improvement in the mechanical properties, reaching a 100% increase in the dynamic modulus and the thermal stability.
Han et al. [
9] introduced a novel reactive rubber composite made by compounding magnesium oxide (MgO) powder with hydrogenated nitrile butadiene rubber (HNBR) using different MgO concentrations of 0, 14, 28 and 40%
v/
v. The elastic modulus value tripled, reaching 80 MPa, while doubling in volume for the rubber filled with 40% MgO by volume.
Regarding the thermal properties, the enrichment of the thermoregulating capacity of elastomers to enhance the thermal comfort of the end users is garnering important attention. The thermoregulating capacity of PU foams applied in the footwear and mattress industries or automobile and construction sectors has been improved by the incorporation of microcapsules containing phase change materials (PCMs) [
10,
11]. PCMs can absorb or release the energy equivalent with their latent heat when the temperature undergoes or overpasses their melting points. Most PCM applications require their previous encapsulation or PCM stabilization before the inclusion in the final system to avoid leakage during the melting process [
12]. In the case of microcapsules, their shell type, size and amount of used microencapsulated PCMs determine their final distribution into the polyurethane matrix [
13].
Recently, some authors have incorporated PCMs into elastomers. The most relevant examples found are related to the addition of PCMs into the polymeric matrix. Armstrong et al. [
14] introduced form-stable PCMs from fatty acids in elastomer copolyesters called phase-change elastomer gels (PCEGs). They explored the thermal characteristics of PCEG films, wherein the copolyester grade, gel composition and the fatty acid concentration from 30 to 70 wt.% obtained latent heats within 10–100 J/g and without hysteretic thermal cycling.
On the other hand, Juarez et al. [
15] added microencapsulated PCMs (melting temperature of 52 °C) using concentrations from 1 to 10 wt.% on an elastomeric matrix of styrene–ethylene/butylene–styrene (SEBS) material with a remarkable effect on the thermal regulation of SEBS while keeping good resistant and ductile properties for PCM concentrations of 1–5 wt.%.
Chriaa et al. [
16] investigated the SEBS elastomer using shape-stabilized phase change material by absorbing hexadecane into the network of the SEBS and coating it with a low-density polyethylene (LDPE). They studied four mass fractions of hexadecane/SEBS (80/5, 75/10, 65/20, 55/30,
w/
w %), employing 15% LDPE with respect to the melt-mixing method. They found that the thermal properties of the elastomers improved with the PCM content, varying from 106.15 kJ/kg to 179.76 kJ/kg for the composite containing 80% PCM and maintaining good properties despite the huge PCM content.
Considering the feasibility of LDPE for producing elastomer materials, in this work, thermoregulating microcapsules containing the paraffin wax Rubitherm
® RT27 with a shell from LDPE and ethyl-vinyl acetate (EVA) with an average particle size of 10 μm (mSD-(LDPE·EVA-RT27)) were selected [
13]. On the other hand, for first time, a polyurethane elastomeric matrix was chosen for the microencapsulated PCMs’ incorporation, since it is one of the most versatile polymers. mSD-(LDPE·EVA-RT27) contents from 0.0 to 20.0 wt.% were incorporated, also varying the main constituent proportion, isocyanate and polyol for [NCO]/[OH] molar ratio values of 1.05 and 1.1. The effect of these variables on the structural, mechanical and thermal properties was evaluated, looking for the elastomer with the best thermal energy storage capacity that maintained good values for the mechanical properties.
2. Materials and Methods
Poly(tetramethylene ether)glycol (PTMG 2000) from Sigma-Aldrich was used as the polyol. Diphenylmethane-4,4′-diisocyanate (MDI) was purchased from Interchemol, and 1,4-diazabicyclo[2.2.2]octane (DABCO) from Sigma-Aldrich and 1,4-butanediol (BD) from Brenntag were used as the catalyst and chain extender, respectively. Spherical thermoregulating microcapsules containing Rubitherm® RT27 with a shell from LDPE and EVA produced by the spray drying technique (mSD-(LDPE·EVA-RT27)) with an average particle size of 10 mm and a latent heat of 86.47 J/g were used as fillers.
2.1. Elastomer Synthesis
Elastomeric composites were manufactured by using two different molar ratios between the isocyanate and hydroxyl groups ([NCO]/[OH]) with values of 1.05 and 1.1. The synthesis was realized by a two-step method. Before being used, the PTMG was vacuum dried for 1.5 h at 90 °C. In the first step, a prepolymer was produced through the reaction between PTMG and MDI (molar ratio polyol:diisocyanate = 1:4). The reaction was carried out at 85 °C for 1.5 h. In the second step, the prepolymer chains were extended by using the corresponding 1,4-butanediol to ensure the desired [NCO]/[OH] molar ratio with 0.3 wt.% 1,4-diazabicyclo[2.2.2]octane and five different microcapsule values (0.0, 5.0, 10.0, 15.0 and 20.0 wt.%). Finally, the prepared elastomers and their composites were cured at 100 °C for 24 h.
2.2. Characterization Techniques
2.2.1. Fourier Transform Infrared Spectroscopy (FTIR)
The chemical structures of the elastomers were studied by using a Varian 640-FT-IR spectrometer in the range from 600 to 4000 cm−1, at a spectral resolution of 8 cm−1 and with 16 scans.
2.2.2. Scanning Electron Microscopy (SEM)
The elastomers’ morphologies and filler distributions were depicted by means of scanning electron microscopy (SEM) with a FEI QUANTA 250, working between 5 and 30 kV.
2.2.3. Density and Porosity
The density and porosity of the elastomers were determined with a helium pycnometer (EI Accupyc II 1334) by the gas displacement method and according to ASTM D6226.
2.2.4. Thermogravimetric Analyses (TGAs)
The thermal stability of the paraffin, mSD-(LDPE·EVA-RT27) and the composites were evaluated by thermogravimetric analysis with TA Instruments equipment model SDT Q600. The used conditions for the analyses were a heating rate of 10 °C/min from room temperature to 700 °C under a nitrogen atmosphere.
2.2.5. Differential Scanning Calorimetry (DSC)
This technique allowed us to obtain the elastomers’ latent heat and the homogeneity of the mSD-(LDPE·EVA-RT27) distribution by taking three samples from different elastomers zones. DSC analyses were performed by using TA Instruments equipment model DSC Q100 in the range from −40 °C to 45 °C at a heating rate of 10 °C/min.
2.2.6. Mechanical Tests
The tensile mechanical properties of the developed elastomer composites were analyzed by means of an MTS Criterion Model 43 equipped with a 1 kN load cell. The used samples had a dog bone shape (type 1) with a thickness between 2 and 3 mm, a length of 115 mm and a width in the narrower section of 6.2 ± 0.2 mm. The tensile tests were carried out at a crosshead speed of 50 mm/min until the sample broke, according to standard ISO 37:2013. The resilience tests were carried out by performing four tensile test cycles from zero load to a deformation of 14% and returning to zero load.
The Shore A hardness of the elastomers was measured with a Sauter HDA100-1 tester.
All the thermal and mechanical characterization tests were performed three times.
3. Results and Discussion
3.1. Elastomer Synthesis
A total of 10 different elastomers were produced as result of varying the [NCO]/[OH] molar ratio and the mSD-(LDPE·EVA-RT27) content.
The composites were synthesized with [NCO]/[OH] molar ratios of 1.05 and 1.1 while varying the mSD-(LDPE·EVA-RT27) content within 0.0–20.0 wt.%. The composite names include all this information by putting after the letter E (corresponding to elastomer) the [NCO]/[OH] molar ratio and the mSD-(LDPE·EVA-RT27) content, separated by dashes. The names and values of both variables for the different synthesized elastomers are gathered in
Table 1.
All the formulations allowed successful synthesis of the elastomers, as can be seen in
Figure 1.
At a simple view, the elastomers reagents successfully reacted. However, in order to confirm the formation of the characteristics of the elastomers’ structures, FTIR analyses of the composites with different mSD-(LDPE·EVA-RT27) contents and [NCO]/[OH] molar ratios were carried out (
Figure 2).
The presence of urethane groups in the synthesized elastomers can be clearly identified in
Figure 2 by the stretching vibrations of the -NH bonds around 3360 cm
−1 [
17]. Aside from that, the characteristic signals of the carbonyl groups (-C=O), hydrogen bonds, -NH bending vibrations and -CN stretching vibrations appeared at 1727, 1700, 1527 and 1306 cm
−1, respectively [
18]. The -NH groups could join the -C=O by the hydrogen bonds in the hard segments and with the -C-O-C of the soft segments. The peaks at 2935 cm
−1 and 2837 cm
−1 correspond to the symmetric and asymmetric stretching vibrations of -CH
2 group, respectively, while at 1373 cm
−1 and 1456 cm
−1, bending stretching in the polyol chain appeared [
19]. In addition, the lack of significant stretching vibrations of the isocyanate group (N=C=O) of MDI at 2300 cm
−1 confirmed the success of the reaction for the case of a [NCO]/[OH] molar ratio of 1.05 [
20]. On the contrary, that signal appeared for the case of a [NCO]/[OH] molar ratio of 1.1, indicating the excess of isocyanate groups for the case of this formulation. On the other hand, the existence of a peak at 1594 cm
−1 indicated the presence of aromatic groups coming from MDI [
18]. Finally, the peaks that appeared at 1165, 1138 and at 1078 cm
−1 corresponded to the stretching and bending vibrations of C-O-C present in the ether, urethane and ester groups of the elastomers, respectively [
18].
3.2. Elastomer Structure and Filler Distribution
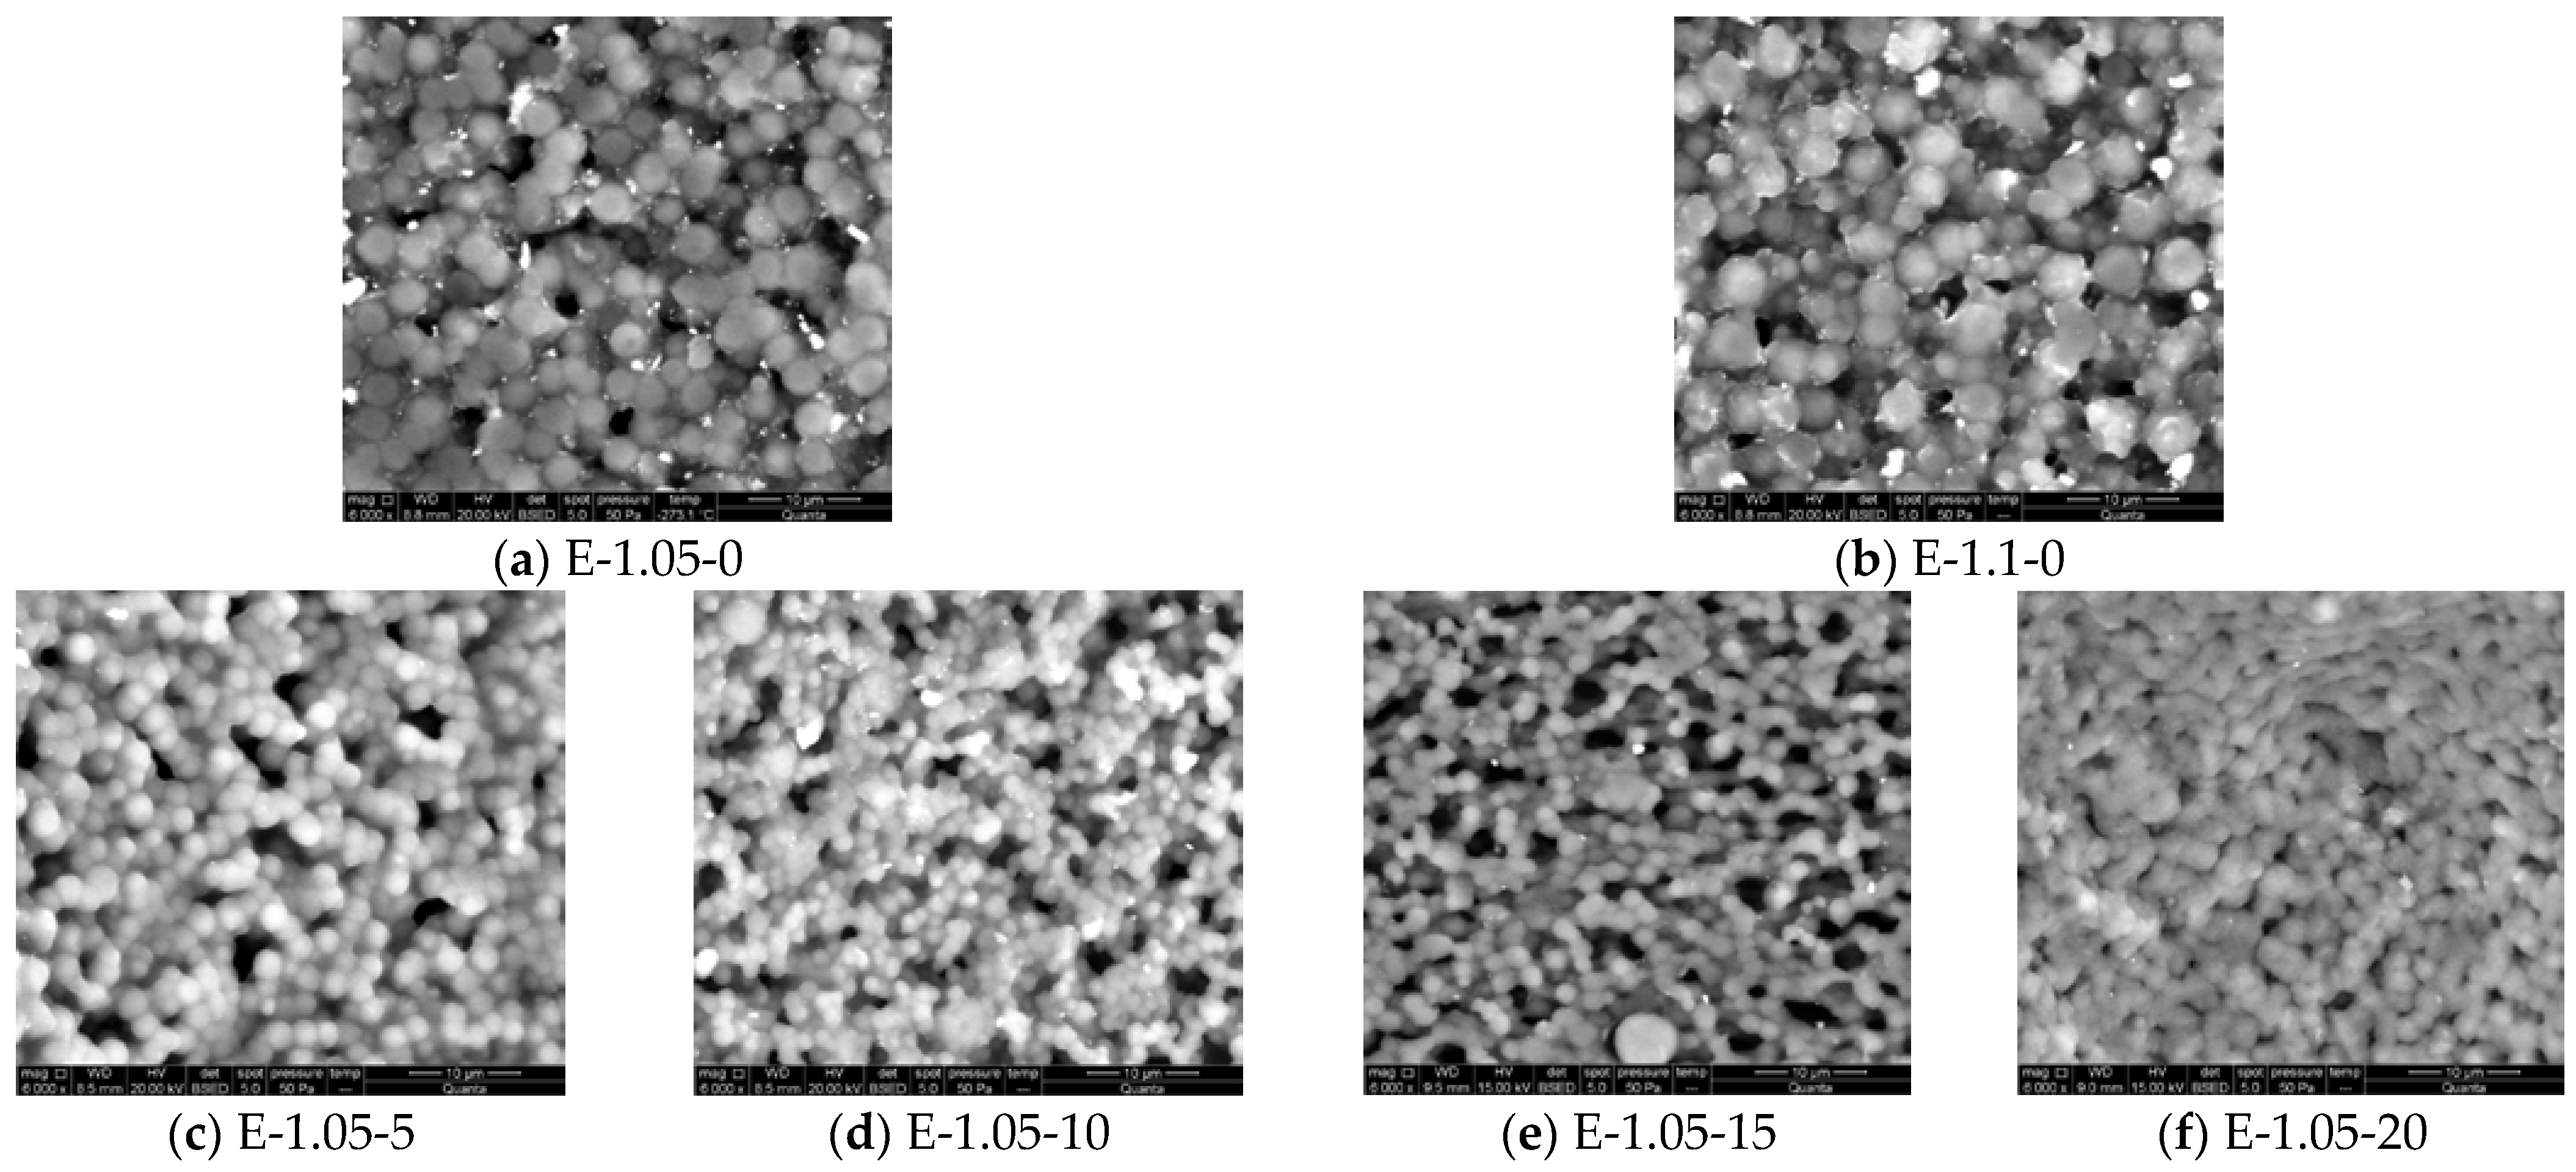
Once the proper chemical structures of the synthesized elastomers were confirmed, their morphologies were observed by SEM for further understanding of their physical and mechanical properties.
Figure 3 shows two examples of the typical filler distribution in matrix that were very similar in the rest of the samples, and
Figure 4 shows the SEM pictures of the different synthesized elastomer matrices.
The filler distribution in the polymer matrix was not totally homogeneous, as can be seen in
Figure 3. Many of the microcapsules were well distributed, as shown in
Figure 3b, and some others were agglomerated, as can be seen in
Figure 3a. The rest of the synthesized elastomers also presented mSD-(LDPE·EVA-RT27) distributed for the whole polymer matrix with some agglomeration points.
As can be seen in
Figure 4, the elastomers presented a structure of polyurethanes derived from aromatic diisocyanates consisting of a net of spherical microparticles [
21,
22]. Aside from that, most particles presented a homogeneous size, except for some bigger particles. The most accurate study of the influence of the mSD-(LDPE·EVA-RT27) content and of the [NCO]/[OH] molar ratio on the particle size was carried out by using Motic Plus software (see
Table 2).
According to the results, the addition of mSD-(LDPE·EVA-RT27) reduced the particle size of the polymeric matrix and improved the sample structure homogeneity, since lower standard deviations were obtained. The particle size of the polymeric matrix structure was at a minimum for E-1.05-15 and E-1.1-10. Thus, the presence of MC increased the nucleation point during polymer formation, reducing the particle size of the polymeric matrix up to 10–15 wt.%. Nevertheless, from this point, the effect of the agglomeration due to the increase of the sample viscosity stabilized or even increased the particle size of the polymeric matrix [
23].
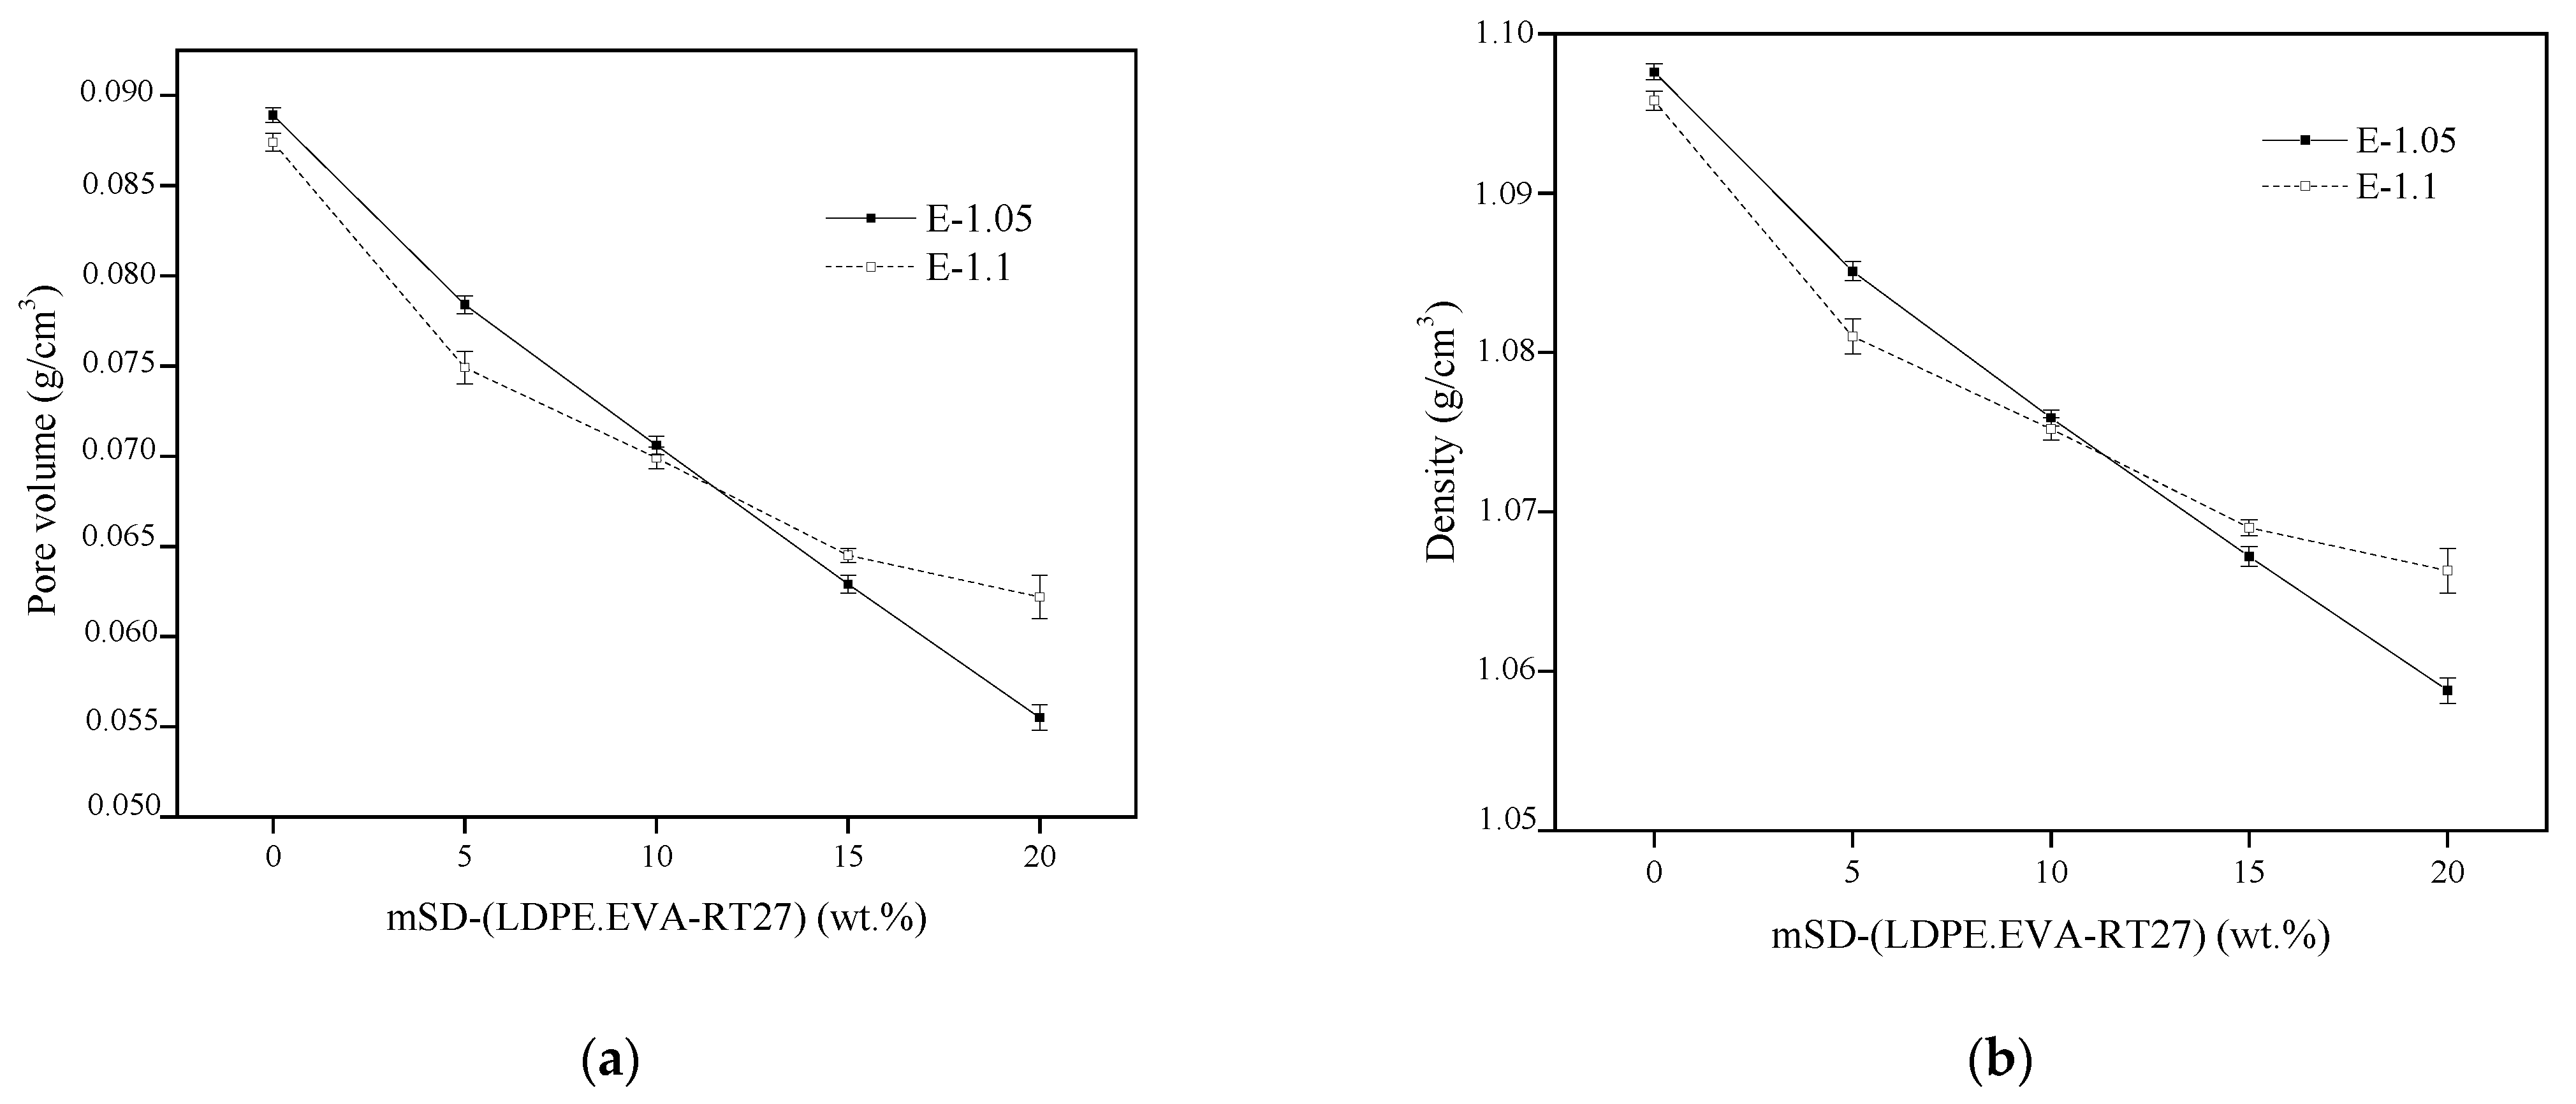
On the other hand, the effect of the elastomer structure on the porosity and density was also analyzed, and both effects are shown in
Figure 5.
As can be seen, the higher the MC content, the lower the sample porosity, probably due to the reduction of the particle size of the polymeric matrix, the presence of the MC in the structure and the increase of the reactive mixture viscosity. On the other hand, despite the porosity decrease, the density also decreased, since the mSD-(LDPE·EVA-RT27) density was 0.866 g/cm
3 [
24], 26.7% lower than the net elastomer density. In the case of elastomer E-1.05, the density decrease was almost linearly dependent on the mSD-(LDPE·EVA-RT27) content. A similar tendency was observed up to an MC content of 10 wt.% for the elastomer E-1.1. Nevertheless, from that point, higher densities than those obtained for the composites from a [NCO]/[OH] molar ratio of 1.05 were observed, possibly due to the excess of isocyanate.
3.3. Thermal Stability
The thermal stability of PU elastomers depends on multiple factors, such as the proportion between soft and hard segments, the chain extensor type and the [NCO]/[OH] molar ratio [
18,
20,
25].
Figure 6 shows the thermogravimetric results of the mSD-(LDPE·EVA-RT27) and pure paraffin (Rubitherm
®RT27) used in the microcapsules’ synthesis and all the synthesized elastomers.
As can be seen in
Figure 6, the pure paraffin and the paraffin from mSD-(LDPE·EVA-RT27) were completely evaporated at 210 °C, whereas the shell material of the microcapsules was degraded at 480 °C. On the other hand, the thermal degradation of the polyurethane elastomers was a complex process with three different thermal degradation steps. The first degradation step corresponding with urethane bond decomposition from the hard segments (peak I of the DTG elastomer curves) occurred between 300 and 380 °C. The second degradation step appeared between 380 and 500 °C, and this can be attributed to the soft segment degradation (peak II). Finally, there was a third small step from 550 °C, which was due to the presence of reticulated segments of a high molecular weight. It is worth pointing out that all the elastomers were stable up to 280 °C, and therefore, the paraffin evaporation was delayed, probably evaporating while the urethane bond degradation took place. This could be due to the immersion of the microcapsules in the polymer matrix acting as a protected barrier, forming a form-stable material. Aside from that, it can be noticed that for the [NCO]/[OH] molar ratio of 1.05, there was a residue with a maximum value of 10 wt.% for the case without PCMs. On the contrary, elastomers from the [NCO]/[OH] molar ratio of 1.1 presented a fourth degradation peak and absence of residue, probably because of the excess of -NCO reacting with the urethane groups at high temperatures and forming allophanates that decomposed around 600 °C [
26].
From the TGA results, the experimental weight loss corresponding to the soft and hard segments of the elastomers (SS and HS, respectively) and the mSD-(LDPE·EVA-RT27) shell for each one of the synthesized elastomers was determined and compared to the theoretical expected values.
Figure 7 shows the experimental and theoretical weight loss for the SS, HS and mSD-(LDPE·EVA-RT27) shells, depending on the microcapsules content and the [NCO]/[OH] molar ratio. The theoretical values were estimated from the mass contents of the microcapsules, their compositions and the mass of polyurethane components added in the elastomer synthesis recipe.
It can be observed in
Figure 7 that the HS proportion in the elastomers increased with the microcapsule content up to the case of 15 wt.% mSD-(LDPE·EVA-RT27), probably due to the fact that paraffin degradation also occurred at this degradation step, as was mentioned before. However, for the case of 20 wt.% mSD-(LDPE·EVA-RT27), the elastomers presented a HS percentage value similar to that of the pure elastomers. This can be attributed to poor homogenous elastomers, in which the particles would tend to form agglomerates. Aside from that, the HS experimental contents were higher than the theoretical ones. Again, this was partially due to the paraffin degradation in that step. On the contrary, the SS weight loss values were lower than expected. Therefore, the variation in both segments’ contents could be due to a partial overlap between the degradation steps that hampered the quantification of the segment contents considering part of the SS in the HS. On the other hand, in the case of the SS weight loss, it remained nearly constant independent of the MC content, and it was lower for the case of a [NCO]/[OH] value of 1.1. The lower values with the increase of the NCO content could be due to the formation of higher molecular weight structures that degraded at higher temperatures [
27,
28]. This is in agreement with the appearance of a fourth degradation step from 550 °C for the case of a [NCO]/[OH] value of 1.1.
As expected, the higher the MC content, the higher the weight loss corresponding to the shell. The deviation between the experimental and theoretical values of the shell weight loss also increased with the microcapsule content, being especially significant (46%) for the case of a 20 wt.% content. Again, the elastomer with a 20 wt.% content presented different behavior, probably due to the MC agglomeration and subsequent heterogeneity of the polymer matrix.
3.4. Latent Heat
The final aim of the mSD-(LDPE·EVA-RT27) incorporation was to increase the thermal energy storage capacity of the PU elastomers. Thus, the latent heat at different points of the different synthesized elastomers was determined via DSC. The average latent heat (ΔH
m), the theoretical latent heat (ΔH
t), the standard deviation and the thermal yield are gathered in
Table 3.
The net elastomers did not show any peak related to a melting or solidifying point, contrary to that observed for those containing mSD-(LDPE·EVA-RT27). As expected, the higher the mSD-(LDPE·EVA-RT27) content, the higher the latent heat of the elastomers. It can be also observed that the standard deviations were lower for the case of elastomer E-1.05, indicating a better distribution of the microcapsules into the elastomers and exhibiting a large yield, except for the 20 wt.% microcapsules. Taking into account the yield and the standard deviation, the elastomeric matrix from a [NCO]/[OH] molar ratio of 1.05 was not able to stabilize the total amount of MC, attending to the lower porosity exhibited when the 20 wt.% microcapsules case was used. Hence, although composites from the [NCO]/[OH] molar ratios of 1.1 up to 15 wt.% microcapsules presented lower latent heats than those corresponding materials with a [NCO]/[OH] molar ratio of 1.05, the elastomer with the highest thermoregulating capacity was E-1.1-20, exhibiting a latent heat of 8.7 J/g. This value was 15.69% higher than the corresponding E-1.05-20 elastomer. Hence, although it was observed in the structural and stability tests that the higher content of NCO groups, the higher the reticulation and hampering of good microcapsule distribution up to 15 wt.% microcapsules, the porosity and the thermoregulating properties of the E-1.1-20 elastomer were higher than the corresponding properties of the E-1.05-20. These better properties could be attributed to the lower average particle size of this elastomer matrix (1.734 mm) with respect to that of E-1.05-20 (1.896 mm), which also led to a large density (rE-1.1-20 > rE-1.05-20; 1.07 > 1.06 g/cm3). Finally, there was a slight increase in the melting points for all composites as result of the porosity and density diminution of the microcapsule contents, causing a reduction of the global thermal conductivity of these form-stable materials. On the other hand, the crystallization temperature was practically equal to the melting point for microcapsule contents lower than 15 wt.%, indicating that these form-stable materials did not exhibit any hysteresis. Nevertheless, for microcapsule contents within 15–20 wt.%, the crystallization temperature tended toward that of the original microcapsules, indicating that they worked as the key thermal material instead of the matrix elastomer.
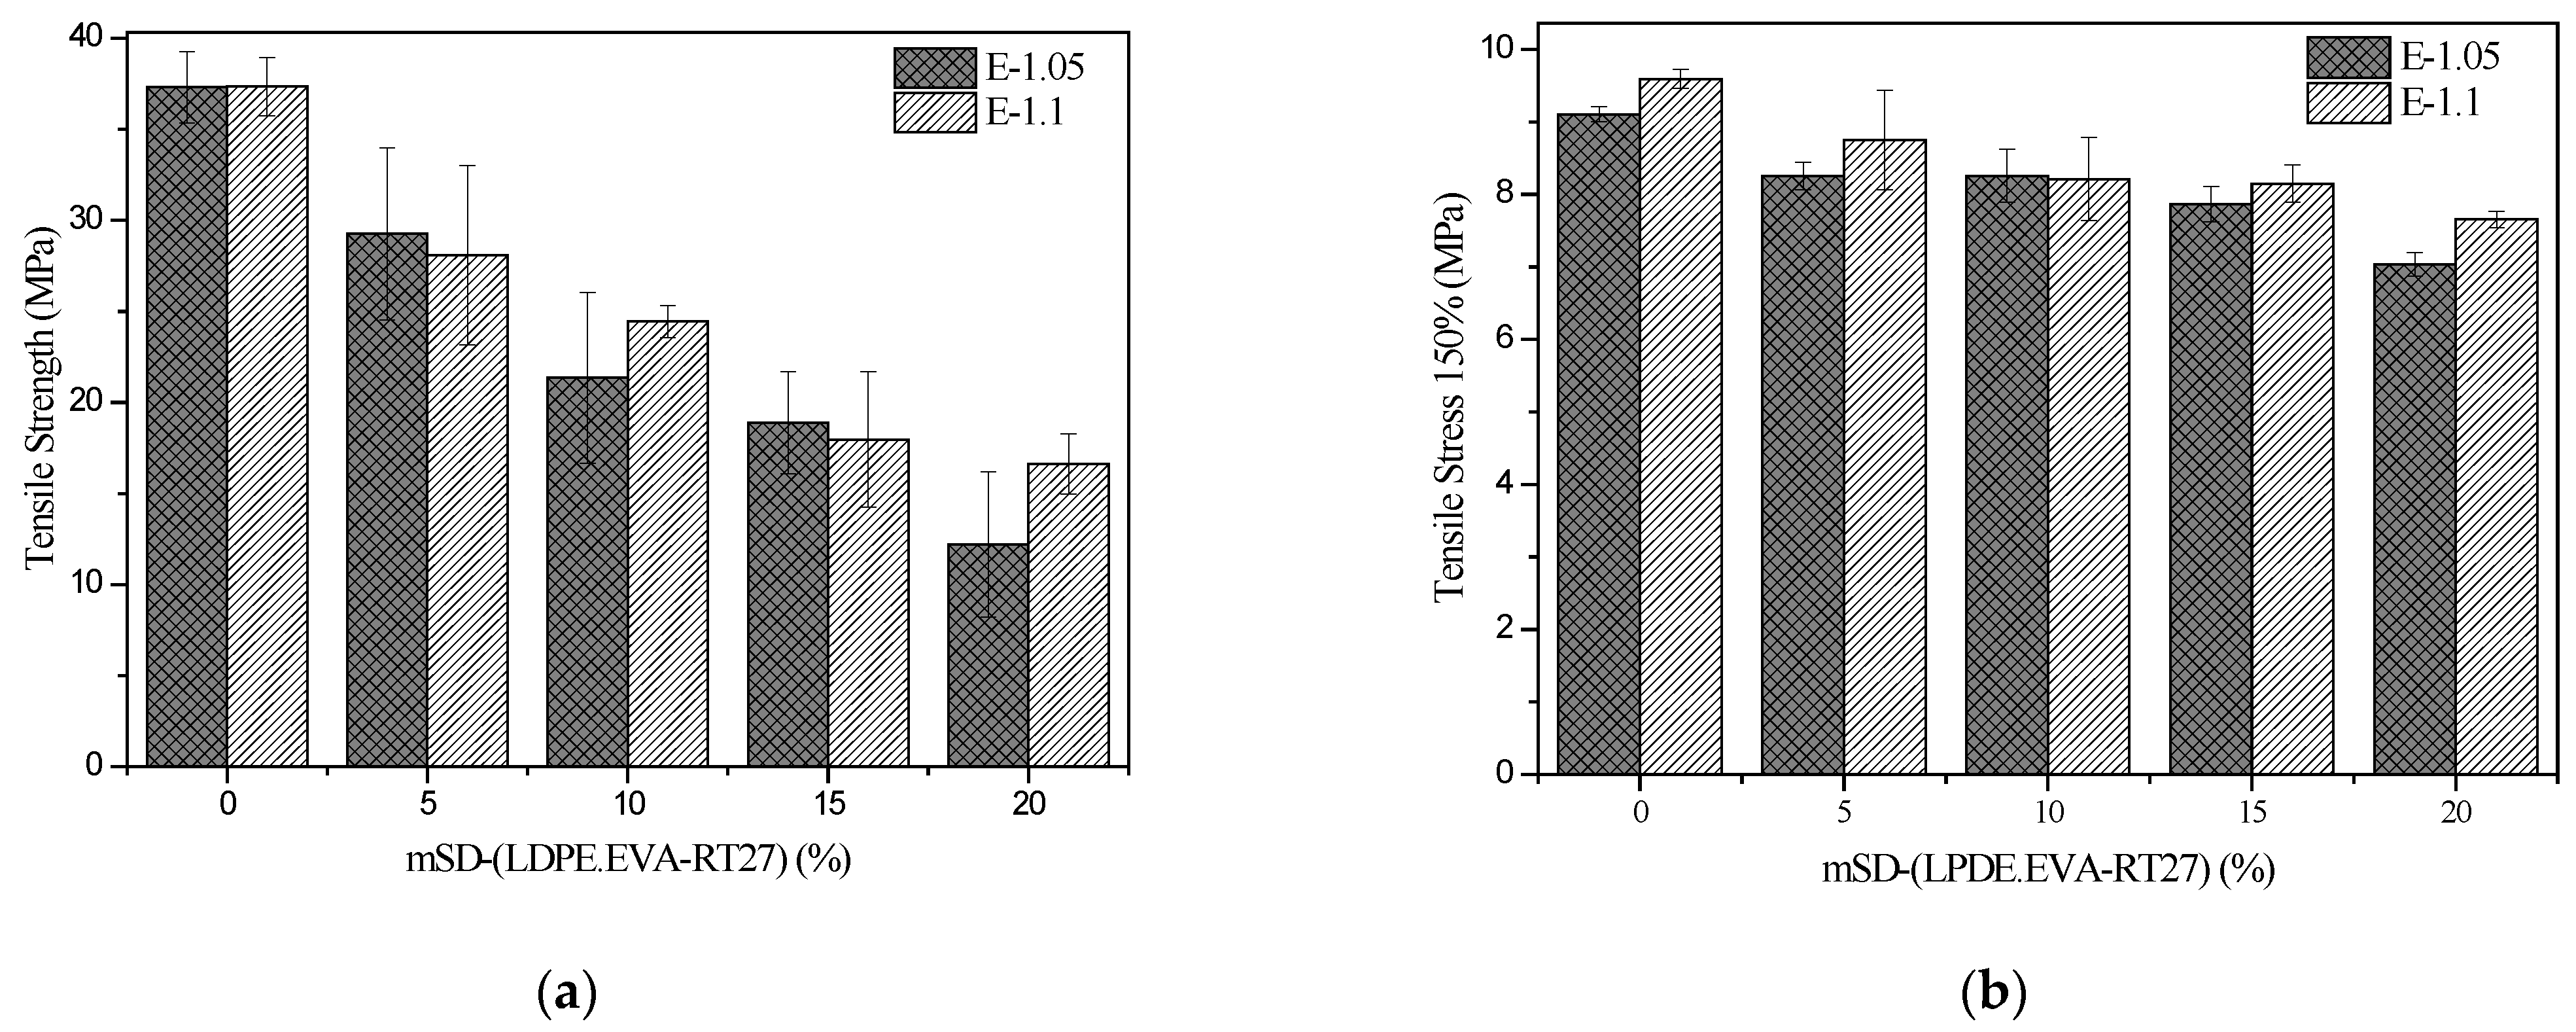
3.5. Mechanical Properties
As was commented on in the characterization techniques section, the tensile stress–strain properties were determined following the standard UNE-ISO 37:2013. The tensile strength at break and at a deformation of 150% are important properties for elastomers. The values obtained for the different synthesized materials are shown in
Figure 8.
A reduction of both properties when the mSD-(LDPE·EVA-RT27) microcapsules were added can be observed, especially for E-1.05-20. This decrease could be caused by the elastomer heterogeneity promoted by worse microcapsule distribution, which favors the fractured appearance. On the other hand, elastomer E-1.1 presented better results than E-1.05 in the case of tensile stress at a deformation of 150%, suggesting greater rigidity of E-1.1, while the tensile strength results were very similar.
Another important mechanical property is the resilience, since it gives an idea of the deformation energy per volume unit that can be recovered after the material’s deformation. This refers to the polymer’s capacity for recovering after a deformation. The resilience of the synthesized elastomers is shown in
Figure 9a.
According to the experimental results, the presence of the microcapsules improved the resilience of the elastomers, especially for the case of E-1.05. Nevertheless, the resilience of elastomer E-1.1 was always better than that observed for elastomer E-1.05. It is worth mentioning that the maximum resilience was found independently of the [NCO]/[OH] molar ratio for an mSD-(LDPE·EVA-RT27) content of 5 wt.%.
The hardness of the elastomers was tested with a Shore A durometer, and the values are shown in
Figure 9b. It can be observed that the hardness was not influenced by the [NCO]/[OH] molar ratio, as the results were very similar for composites E-1.05 and E-1.1. Aside from that, the addition of microcapsules did not change the hardness of the elastomers significantly, with a maximum decrease of 2.98% observed for elastomers containing 20 wt.% MC.
4. Conclusions
Elastomeric materials with thermoregulating properties due to incorporating mSD-(LDPE·EVA-RT27) within 0–20 wt.% and isocyanates/hydroxyl [NCO]/[OH] molar ratios of 1.05 and 1.1 were produced.
The presence of urethane and isocyanate groups was clearly identified by FT-IR analyses, allowing the confirmation of an excess of isocyanate groups for the formulated [NCO]/[OH] molar ratio 1.1.
All the synthesized elastomers were formed by a net of spherical microparticles with an average particle size within 2.640–1.617 mm.
Thermogravimetric analyses allowed for distinguish between weight losses attributed to paraffin, the microcapsule shells and the hard segments and soft segments. Nevertheless, the weight loss of paraffin in the elastomers was overlayed with the hard segment, indicating that the elastomers were able to build form-stable materials, enlarging the paraffin thermal stability since its vaporization was delayed.
In general, the density and mechanical properties decreased with the microcapsule content as result of the lower density of the microcapsules and their worse distribution into the elastomeric matrix. Elastomer E-1.05 exhibited the better structural and stability properties for MC contents up to 15 wt.%, whereas the E-1.1 elastomer containing 20 wt.% MC revealed mechanical and thermal synergy effects, demonstrating good structural stability and the largest latent heat (8.7 J/g).


 ,
, 


