Article

Force–Time Characteristics of Dynamic and Isometric Muscle Actions: Association with Muscle Architecture in Female Athletes

Sports Performance Laboratory, School of Physical Education and Sport Science, National and Kapodistrian University of Athens, 17237 Athens, Greece
*
Author to whom correspondence should be addressed.
Appl. Sci. 2021, 11(11), 5272; https://doi.org/10.3390/app11115272
Submission received: 24 April 2021 / Revised: 29 May 2021 / Accepted: 3 June 2021 / Published: 6 June 2021

Abstract

:
The association between force–time characteristics of isometric leg press (ILP) and countermovement jump (CMJ) with vastus lateralis (VL) muscle architecture, was examined in 19 female athletes (aged 23.2 ± 5.4 years). Peak force (PF), average rate of force development (ARFD) and rate of force development (RFD) at different time epochs were calculated from the force–time curve, as well as CMJ jump height and power. Significant correlations were found between ILP-PF and CMJ power (r = 0.658, p < 0.01), while both variables were correlated with VL thickness and fascicle length (r = 0.471 to 0.648, p < 0.05). Significant correlations were also observed between ILP-RFD epochs and VL fascicle length (r = 0.565 to 0.646, p < 0.05) and between CMJ height with VL thickness (r = 0.523, p < 0.05). Furthermore, positive correlations were found between ILP and CMJ in ARFD (r = 0.625, p < 0.01) and RFD epochs (r = 0.464 to 0.566, p < 0.05). ILP-PF and muscle thickness accounted for 52.8% (p = 0.002) of the variance in CMJ power. These results suggest that isometric force time characteristics are associated with power generation during dynamic muscle actions. Furthermore, VL muscle thickness and fascicle length are associated with rapid force production in female athletes, irrespective of the type of muscle action.

1. Introduction

Muscular strength and power are important fitness parameters for athletic performance, daily life activities, and clinical populations [1]. The evaluation of strength and explosive muscle performance may be accomplished by analyzing the force–time characteristics of isometric and dynamic muscle actions [2]. Isometric strength tests require the athlete to apply force against an immovable device and the forces generated during these tests allow for the quantification of peak force (PF), rate of force development (RFD) and impulse [3,4,5,6]. PF and RFD are essential force–time characteristics and have been investigated in relation to skeletal muscle fiber type [7], muscle architecture [8] and muscle size [9,10]. RFD has important functional significance in fast and forceful muscle contractions because it determines the force that can be generated in the early phase of muscle contraction (0–200 ms) [3]. RFD is related to performance in many power sports, where the duration of key technical movements (e.g., long jump, sprint) lasts from 80 to 170 ms [11,12].
The association between isometric and dynamic force–time characteristics (e.g., peak force, power and RFD) is still a topic of debate. Some studies suggested that force–time characteristics during isometric contractions are not associated with dynamic performance such as jumping or pulls [13,14,15,16]. For example, McGuigan et al. (2010) [16] did not detect associations between RFD assessed during isometric mid-thigh pull, and dynamic squat and bench press exercises and Young et al. (1995) [17] did not observe a relationship between PF achieved during isometric squat and countermovement jump (CMJ) height. In contrast, other studies showed significant relationships between isometric PF and CMJ or squat jump height and peak power [13,14,15,18,19]. Interestingly, significant correlations were reported between dynamic and isometric muscle actions in well-trained athletes [20] and when standardizing the joint angle during the force–time assessment protocols [21]. Thus, there is conflicting evidence about the link between isometric and dynamic performance [22].
Among the factors associated with strength and power generation, muscle architectural characteristics are considered as important determinants [23]. For example, longer fascicles increase the ability of force production during high velocity contractions—in particular RFD [24]—and allow for less sarcomere deformation at a given contraction velocity [23,25]. Greater fascicle pennation reflects a greater number of in-parallel sarcomeres, typically associated with increased physiological cross-sectional area and muscle strength [26,27]. Muscle thickness reflects muscle size and is related to the ability of force production [28,29]. However, the association between muscle architecture and force–time characteristics of isometric and dynamic muscle actions has not been explicitly studied. A better understanding of the relative contribution of muscle morphology to force generation in different types of muscle actions would help in designing interventions to improve muscle function in athletes, patients or elderly populations. As female athletes have lower power and strength [30], smaller fascicle pennation angle and longer relative fascicle lengths than men [31] it is important to investigate the association between muscle performance and architecture in women. Furthermore, evidence on the association between isometric and dynamic muscle actions is limited in female athletes and the relationship between force–time characteristics in different muscle actions and muscle architecture has not been previously examined. Thus, the purpose of this study was to investigate the relationship between muscle architecture and force–time characteristics of isometric leg press (ILP) and CMJ in female athletes.

2. Materials and Methods

2.1. Experimental Design

A correlational study design was used, in which female athletes were assessed for vastus lateralis (VL) muscle architecture and force–time characteristics of ILP and CMJ. Athletes performed one familiarization and two main testing sessions. During the familiarization session, participants’ anthropometric characteristics (height, body mass and femur length) were measured, and they were familiarized with ILP and CMJ on the force platform.
One week after the familiarization session, two main testing sessions were conducted 3–4 days apart. The study protocol is shown in Figure 1. On the first main session participants’ muscle architecture parameters of the VL muscle were measured at rest. Following ultrasonography, participants performed two single repetitions of ILP, with 3 min rest. In the third main session, three CMJ were performed interspersed with 2 min rest. Before dynamic or isometric testing, participants performed a standardized warm-up, consisting of 5 min of light cycling against a standard load (60 W) and 5 min of dynamic stretching. Participants were asked to avoid any strenuous activity for 48 h before testing, and all testing was performed in the morning hours.

2.2. Subjects

Nineteen healthy female club and national level athletes from weight bearing sports (5 rhythmic and 2 artistic gymnasts, 2 basketball players, 4 volleyball players, and 6 track and field athletes) (age: 23.2 ± 5.4 years, training experience: 13.4 ± 5.4 years, body mass: 58.1 ± 4.3 kg, height: 165 ± 3.8 cm, ΒΜΙ 21.3 ± 1.7 kg/m2) participated in this study. All participants were training for at least three times per week (~60 min per training session) and had no injuries of the lower limbs for the past 6 months. Participants gave information on their menstruation and testing was conducted during the early follicular phase (±3 days). Before entering in the study, participants were informed about the risks and experimental procedures of the study and then gave their informed consent. All procedures were performed in accordance with the principles outlined in the Declaration of Helsinki and were approved by the local ethics committee (registration number: 1201/10-06-2020).

2.3. Procedures

2.3.1. Anthropometry

Height was measured using a stadiometer (Seca 208, Hamburg, Germany) and body mass was measured with a calibrated digital scale (Seca 710, Hamburg, Germany). Femur length was measured as the distance between the lateral condyle of the femur and greater trochanter.

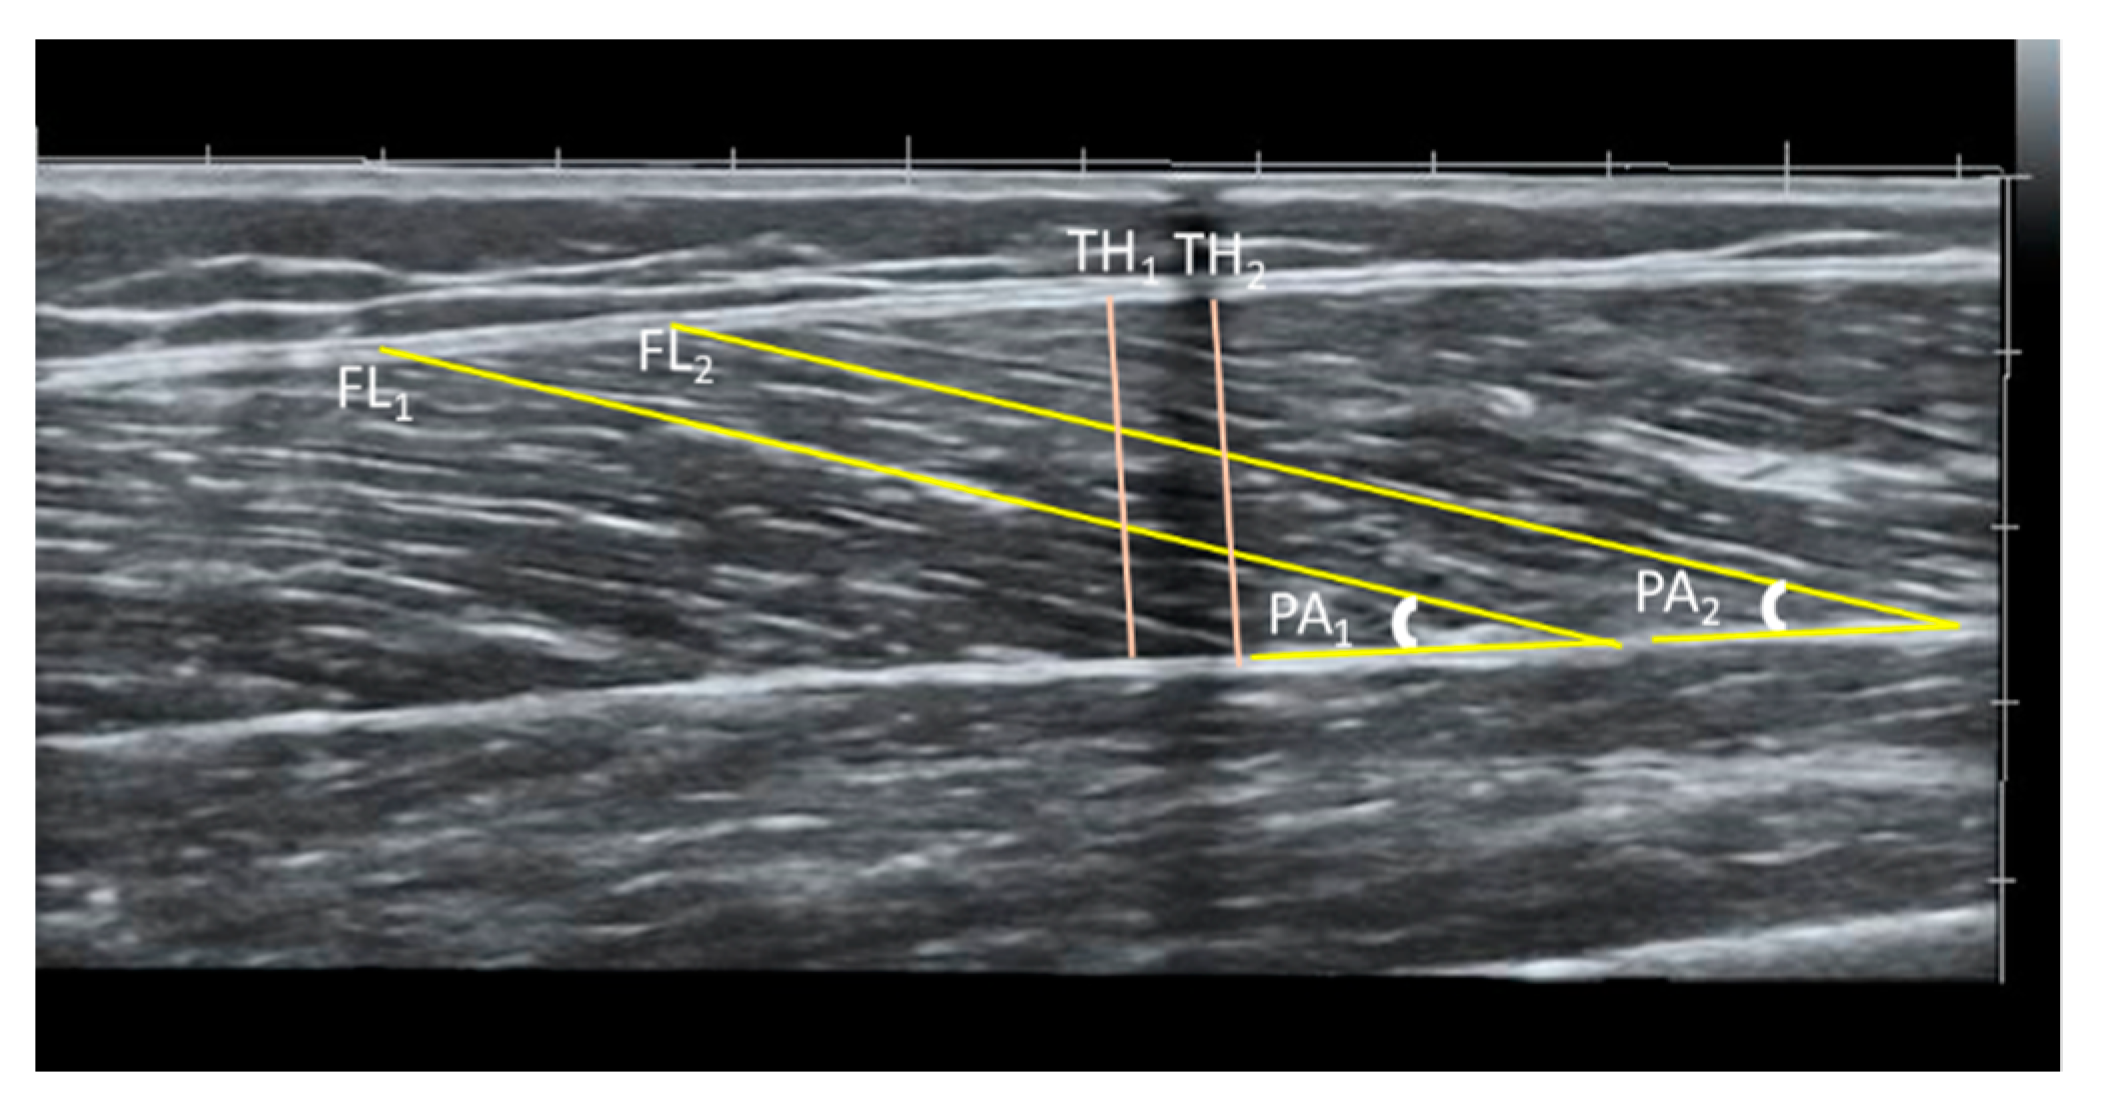
2.3.2. Muscle Architecture and Ultrasound

Ultrasound images were obtained in the morning hours, 48 h after the last training session. Participants remained in a supine position on a physiotherapy bed, for 20 min with their muscles relaxed, their hips positioned in 180° and their knees extended (~170°). VL muscle architecture (fascicle length, pennation angle and muscle thickness) of the right leg was measured at the middle part of the muscle, 50% of the distance from the central palpable point of the greater trochanter to the lateral condyle of the femur [32]. Panoramic B-mode ultrasound images from VL were obtained with a 10 MHz linear probe (38 mm) via extended field-of-view mode (Product model Z5, Shenzhen, Mindray Bio-Medical Electronics Co., Ltd., Shenzhen, China). The acoustic contact between the probe and the skin was provided via an Aquasonic clear ultrasound transmission gel (Parker laboratories, Inc., New Fairfield, NJ, USA). The transducer was placed longitudinal at femur, oriented in parallel to the muscle fascicles and perpendicular to the skin. The field of view was determined as the distance between two probe lengths, one before and one after the 50% marker of muscle length. By using a permanent pen, a dashed line (~10 cm) was marked on the right and the left of the point of 50% and a probe path was drawn on the skin [33]. Image analysis was obtained with software (Motic Images Plus, 2.0, Motic, Hong Kong, China). For each participant, two different fascicle lengths and their respective pennation angles were assessed (Figure 2). Muscle thickness was determined as the perpendicular distance from the deep aponeurosis to the superficial aponeurosis and was evaluated by two separate measurements (Figure 2). Average values were used for further analysis. Test–retest reliability was determined on 11 participants, on two separate days. Intraclass correlation coefficient (ICC) for muscle thickness was 0.970 (90% CI: 0.913–0.990, standard error of measurement; SEM = 1.7%), for pennation angle ICC was 0.942 (90% CI: 0.836–0.980; SEM = 2.2%) and for fascicle length ICC was 0.948 (90% CI: 0.854–0.982; SEM = 2.1%).

2.3.3. Isometric Leg Press Performance

After ultrasound measurement, and following the standardized 10 min warm-up, participants were seated on a custom-made steel leg press chair and with both feet on the force platform (Applied Measurements Ltd. Co. 249 UK, Berkshire, UK, WP800, 80 × 80 cm), interfaced with a computer (sampling frequency 1000 Hz, Kyowa sensor interface PCD-320A, Kyowa Electronic Instruments CO., LTD, Tokyo, Japan) which was positioned on a concrete laboratory wall. Knee angle was set at 120°, hip angle at 100° (180° = full extension), and ankle angle at 90° [19]. They were instructed to keep a low steady baseline force at the start (~128 ± 24 Ν) [34] and to apply their force as fast and as hard as possible and continue their maximum effort until peak force (3–5 s) during each repetition. For each attempt, visual feedback of the force was provided via a computer monitor placed above the force platform. Variables calculated from the ascending portion of the force–time curve [35] were the maximum isometric force (ILP-PF), average rate of force development from steady baseline force to maximal force (ILP-ARFD) and RFD at time intervals of 0–50, 0–100, 0–150, 0–200 and 0–250 ms according to the following equation: RFD (N × s−1) = ΔForce × ΔTime−1 [3]. The force–time curve with the highest peak force—provided that the RFD of this trial was not compromised—was used for statistical analysis. Raw data were used to calculate force parameters [36]. The onset of force application was set at 3% of the respective peak force value. The ICC for ILP-PF was 0.88 (90% CI: 0.670–0.956; SEM = 9.9%).

2.3.4. Countermovement Jump Performance

After a short warm-up of 5 min on a stationary cycle ergometer and 5 min of dynamic stretching, participants performed 3 maximal CMJ with 2 min of rest between jumps on the force platform with arms akimbo. The ascending portion of the force–time curve of the highest jump was used for further analysis. Peak force (CMJ-PF), flight time, minimum force (CMJ-Fmin) and force at time intervals of 50, 100, 150 ms (CMJ-Fmin) from minimum to maximal force in the ascending part of the curve, were obtained. Jumping height was calculated from take-off velocity, according to the following equation: jumping height = (take off velocity)2/(2 × g) [37] and power according to the following equation: power = (51.9 × jumping height) + (48.9 × body mass) − 2007 [38]. Average rate of force development (CMJ-ARFD) from minimum to maximum force and RFD at time intervals of 0–50, 0–100, 0–150 ms from minimum force (CMJ-Fmin) were calculated according to the following equation: RFD (N × s−1) = ΔForce × ΔTime−1. The ICC for CMJ height and power output were 0.936 (90% CI: 0.821–0.978; SEM = 2.9%) and 0.984 (90% CI: 0.953–0.992; SEM = 1.6%), respectively.

2.4. Statistical Analysis

Means ± standard deviations (SD) were calculated for each tested variable. Data were examined for normality using Shapiro–Wilk test, with no notable violations. Pearson product moment correlation (r) was used to examine linear associations between muscle architecture, CMJ and ILP force–time parameters. Pearson correlation coefficients [39] were considered as: trivial r < 0.10, small r = 0.10–0.29, moderate r = 0.30–0.49, r = 0.50–0.69 large, r = 0.70–0.89 very large and r ≥ 0.90 almost perfect. Stepwise regression analysis (backward elimination) was used to investigate the effects of force–time and muscle architecture characteristics on CMJ power. Multicollinearity was examined using variance inflation factor. Intraclass correlation coefficients (ICCs) (two-way mixed effects) were used to assess test–retest reliability. Additionally, the standard error of measurement (SEM) was calculated. Statistical significance was set at p < 0.05. All statistical analyses were performed with SPSS (IBM SPSS Statistics Version 25).

3. Results

Means and standard deviations of the examined variables are presented in Table 1.

3.1. Correlations between Jumping and Isometric Force–Time Parameters

Significant correlations were found between CMJ and ILP in ARFD and several RFD time intervals (p < 0.05). Results are presented in Table 2.

3.2. Correlations between Muscle Architecture and Jumping Parameters

Significant correlations were found between jumping height and VL muscle thickness (p < 0.05) (Table 3) and CMJ power and VL muscle thickness and fascicle length (p < 0.01) (Figure 3). No correlations were found between CMJ-PF and muscle architecture as well as between CMJ-ARFD and RFD epochs (0–50, 0–100, 0–150 ms) and muscle architecture (p > 0.05) (Table 3).

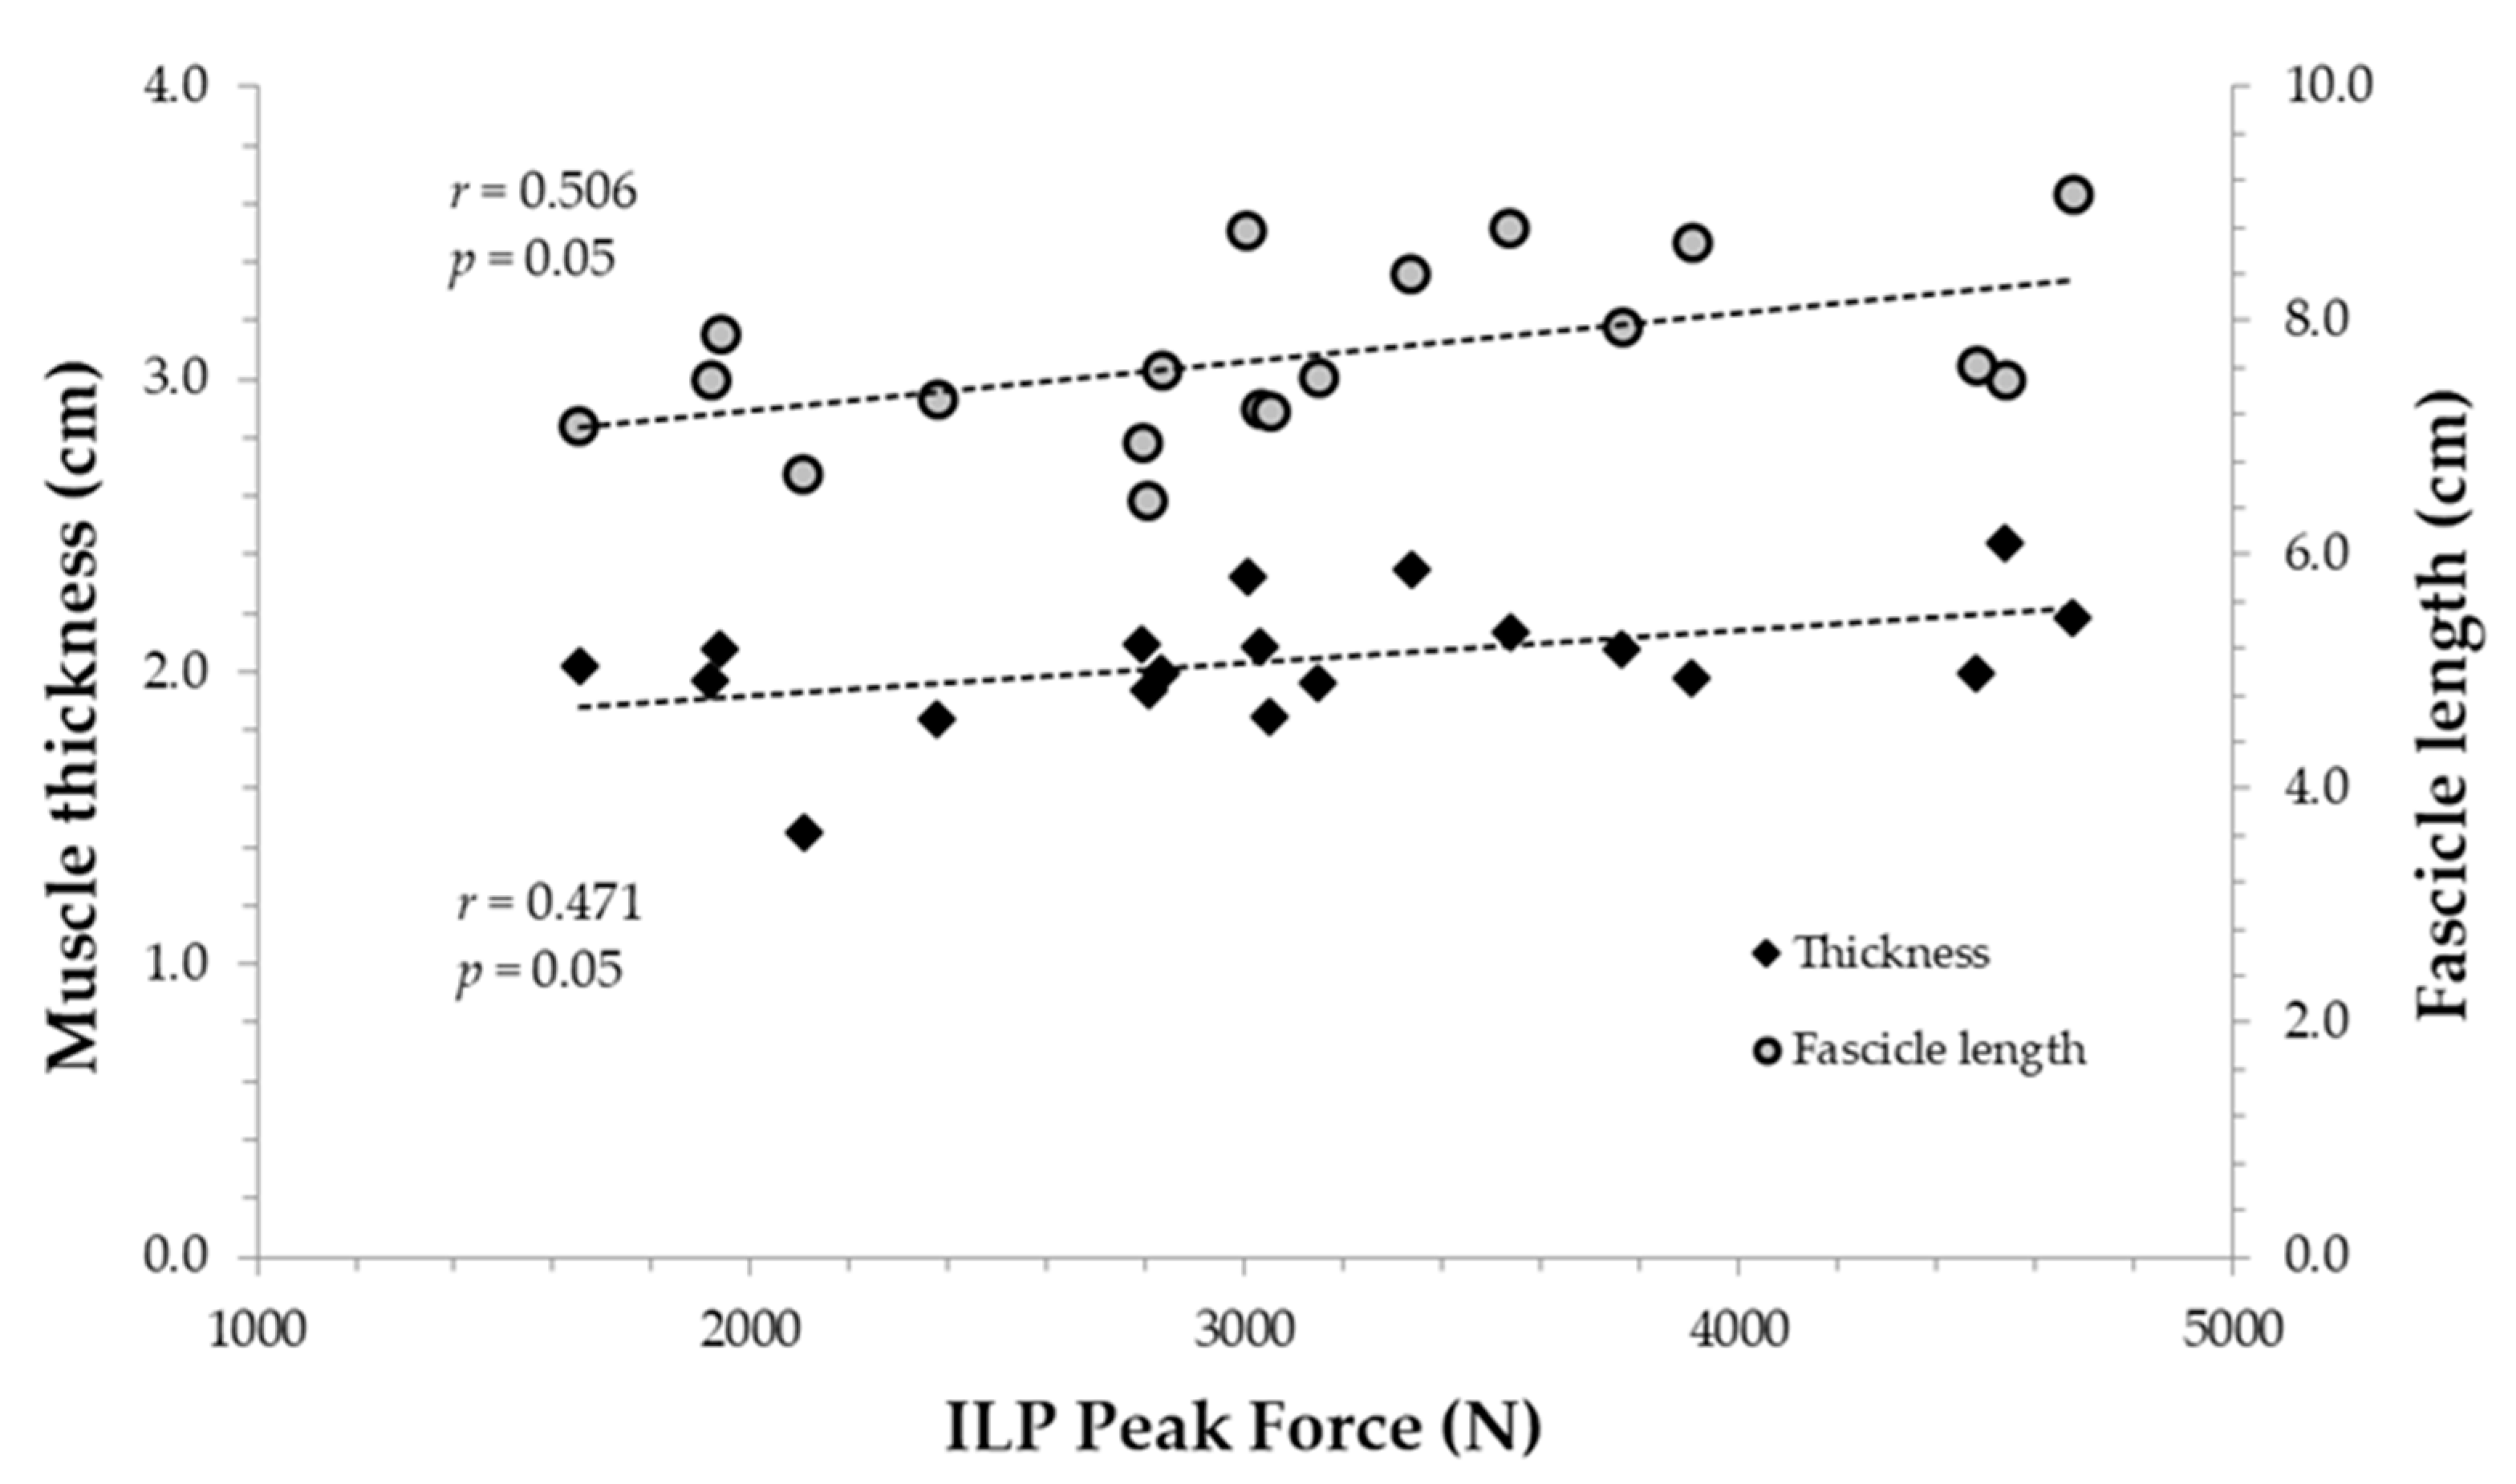
3.3. Correlations between Muscle Architecture and Isometric Parameters

Correlations between VL muscle architecture and isometric force–time parameters are presented in Table 4 and Figure 4. Significant correlations were found between ILP-RFD50 ms to ILP-RFD200 ms and VL fascicle length (p < 0.05) (Table 4). Additionally, significant correlations were found between ILP-PF and VL fascicle length and thickness (p < 0.05) (Figure 4). No correlations were found between VL pennation angle and ILP force–time parameters (p > 0.05).

3.4. Stepwise Regression Analysis for Countermovement Jump Power

No value in variance inflation factor exceeded 2.5. Stepwise regression analysis showed that ILP-PF and VL muscle thickness accounted for a large part (52.8%) of the variance of CMJ power (Adjusted R2 = 0.528, F = 7.701, p = 0.002) (Table 5).

4. Discussion

Τhe aim of this study was to investigate the association between VL muscle architecture and force–time characteristics of ILP and CMJ, in female athletes. To the author’s knowledge, evidence is limited on the association between muscle architecture and force–time characteristics during isometric and dynamic conditions, in female athletes. The main findings of this study were that ILP-PF and CMJ power significantly correlated, and both variables also showed strong correlations with VL muscle thickness and fascicle length. In addition, ILP-PF and muscle thickness were important predictors of CMJ power. Significant correlations were also observed between fascicle length with ILP-RFD epochs and between jumping height and muscle thickness. Furthermore, positive correlations were found between ILP and CMJ for ARFD and RFD, despite the different types of muscle actions included in these movements.
The result of this study indicated strong correlations between ILP-PF and CMJ power. Nuzzo et al. (2008) [40] also reported that the absolute ILP-PF during isometric squat significantly correlated with CMJ peak power and Kawamori et al. (2006) [18] found that PF in isometric mid-thigh pull significantly correlated with CMJ power, in male athletes. Although, evidence on the association between isometric PF and force–time characteristics achieved during jumping tasks is controversial [41], the results of this study highlighted that the female athletes with greater maximal lower limb strength, as evaluated with ILP, were capable of generating higher levels of power during a jumping test. Interestingly, ILP-PF and CMJ power were both associated with VL muscle thickness, and fascicle length. Larger thickness of the VL muscle may indicate greater hypertrophy [42] of the knee extensors and allows for a greater production of force [28]. Secomb et al. (2015) [43] and McMahon et al. (2015) [44] also reported a positive correlation between VL thickness and maximal isometric force in mid-thigh pull, in male athletes. Furthermore, an association between VL muscle thickness and CMJ power was observed in elite weightlifters [45] and similar results were reported from Mangine et al. (2014) [46] and Alegre et al. (2009) in male and female participants [47].
Longer fascicles in VL may reflect a greater number of in series sarcomeres, and indicate a higher peak shortening velocity [23]. The significant correlations between VL fascicle length and ILP-PF found in this study are in line with Bartolomei et al. (2017) [48] who also observed correlations between VL fascicle length and PF during mid-shin pull. VL fascicle length was also positively correlated with CMJ power in female athletes. Methenitis et al. (2016) reported that type II fiber percentage and fascicular length were the most significant determinants of power performance in experienced power-trained young men [49] and Zaras et al. (2020) [45] and Mangine et al. (2014) [46] also found significant correlations between fascicle lengths and CMJ power in male and female athletes, respectively. Collectively, ILP-PF and CMJ power were positively associated with VL muscle thickness and fascicle length, thus highlighting the importance of muscle hypertrophy (in series and parallel) for force and power generation. Thus, it appears, that the significant correlation between ILP-PF and jumping power may be moderated by VL muscle thickness and fascicle length in female athletes. Along this line, it was also found that ILP-PF and muscle thickness were important predictors of CMJ power in female athletes.
The results of this study also indicated that VL muscle thickness was associated with CMJ height. In line with this result, Secomb et al. (2015) also identified strong associations between VL thickness and jump height in elite male surfers [43] and Alegre et al. (2009) reported significant correlations between VL thickness and CMJ height in males and females [47]. Although, some previous studies failed to detect associations between VL muscle morphology and jumping height [50,51], the results of this study are in line with the findings of a recent meta-analysis on the association between CMJ height and VL muscle thickness [52].
Fascicle length was significantly associated with all the ILP-RFD epochs (0–50, 0–100, 0–150, 0–200 and 0–250 ms), in the absence of associations with VL pennation angle and thickness. Although performance of rapid contractions is determined by neural and muscular factors [34] the relative contribution of muscle structure in the early or late RFD is poorly understood. In agreement with the results of the present study, Corratela et al. (2020) reported a significant association between VL fascicle length and RFD epochs (100–250 ms) in knee extension (90°) in males [8]. The correlations between VL fascicle length and RFD epochs found in this study may be associated with the intention of the individuals to produce force rapidly. Such a focus may increase the rate of muscle activation by the central nervous system, thus, leading to faster muscular force production for which fascicle length is an important determinant [25]. This association between fascicle length and RFD epochs may have direct relevance to sport activities in female athletes. Interestingly, the association between VL muscle thickness and fascicle length and isometric RFD has also been confirmed in previous studies in youth physically active and clinical population [53]. However, no correlation was observed between fascicle length and any of the RFD epochs in CMJ. A possible explanation of this result is that RFD during CMJ is assessed in the eccentric (braking) phase where the body drops into the squat position. During this eccentric phase a lengthening of muscles [54] is observed, and elastic energy is stored in the passive elements of the muscles involved, possibly modifying the role of contractile elements in force production [55]. In contrast, RFD in ILP is evaluated from the start of a forceful isometric contraction. Furthermore, contribution of different muscle groups may differ between jumping and ILP performance, with VL playing a more important role in force production during isometric exercise [56].
Interestingly, no association was found in this study between RFD epochs and pennation angle. It is reported that female athletes demonstrate smaller fascicular pennation and longer relative fascicle lengths [31] compared to men and thus, the relative contribution of muscle structure to RFD may differ between males and females. Nevertheless, recently Corratela et al. (2020) also did not detect associations between VL pennation angle and any of the RFD epochs in male participants [8].
Significant correlations were found between CMJ-RFD 0–100 to 0–150 ms epochs with ILP-RFD of 0–50 to 0–250 ms epochs. In addition, significant correlations (p = 0.01) were found between CMJ-ARFD and ILP-ARFD despite the fact that ILP and CMJ involve different types of muscle actions (isometric/eccentric and concentric). A number of previous studies in male participants examined the association between RFD, and in particular peak RFD in isometric and dynamic conditions [18,57] with controversial results. For example, Wilson and Murphy (1995) found no correlation between RFD in CMJ with RFD during an isometric contraction in a Smith machine (110°, 150°) and Kawamori et al. (2006) found no significant correlations between peak RFD in isometric and dynamic midthigh pull in male participants [18]. Based on that, the authors assumed that isometric and dynamic measures of force–time characteristics represent specific qualities. In contrast, the results of this study demonstrate that in female athletes, the ability to exert isometric RFD shares at least some functional and structural foundation with the ability to exert dynamic RFD. The unloading phase is the first stage of the countermovement during which kinetic energy (downward) is developed [35]. Athletes with greater eccentric fοrce production may have a greater range of braking strategies and a better storage of elastic energy that is returned during concentric initiation.
A limitation of this study that should be acknowledged is that isometric leg press and countermovement jump differ in trunk support and this imply differences in body mechanics. Furthermore, although the eccentric RFD was examined during CMJ, the concentric portion of the jump was not analyzed in the present study.

5. Conclusions

In conclusion, this study found that female athletes with higher maximal lower limb strength, as measured with ILP, were capable of producing higher levels of power during a jumping test. Both isometric PF and jump power were associated with VL muscle thickness and fascicle length. In addition, associations between ILP-RFD epochs and VL fascicle length confirm the importance of fascicular length to force development in isometric muscle contractions. Although, it is difficult to directly compare jumping performance and muscle architectural parameters obtained from a single leg muscle, the associations found between VL thickness and jumping height and power would suggest that muscle thickness is a determinant of explosive performance in female athletes. The association found between ARFD and RFD at various time epochs between ILP and CMJ, may provide useful information to coaches and practitioners on the strength characteristics that underpin dynamic performance, in female athletes.

Author Contributions

Conceptualization, V.G., I.P. and O.D.; methodology, V.G., I.P., O.D., G.C.B. and G.T.; investigation, V.G., I.P., G.G., A.D. and H.K.; data curation, V.G., I.P., G.C.B., G.G., A.D. and H.K.; writing—original draft preparation, V.G., I.P. and O.D.; writing—review and editing, G.C.B., G.T. and O.D.; supervision, O.D. All authors have read and agreed to the published version of the manuscript.

Funding

This research has received funding from Special Account for Research Grants. National & Kapodistrian University of Athens. Chr. Lada 6, 105 61 Athens.

Institutional Review Board Statement

The study was conducted according to the guidelines of the Declaration of Helsinki and approved by the Institutional Ethics Committee of School of Physical Education and Sport Science, National and Kapodistrian University of Athens (registration number: 1201/10-06-2020).

Informed Consent Statement

Informed consent was obtained from all subjects involved in the study.

Data Availability Statement

The data presented in this study are available on request from the corresponding author.

Acknowledgments

The authors would like to thank the participants for their dedicated time and collaboration.

Conflicts of Interest

The authors declare no conflict of interest.

References

  1. Suchomel, T.J.; Nimphius, S.; Stone, M.H. The importance of muscular strength in athletic performance. Sports Med. 2016, 46, 1419–1449. [Google Scholar] [CrossRef]
  2. Stone, M.H.; Sanborn, K.; O’Bryant, H.S.; Hartman, M.; Stone, M.E.; Proulx, C.; Ward, B.; Hruby, J. Maximum strength-power-performance relationships in collegiate throwers. J. Strength Cond. Res. 2003, 17, 739–745. [Google Scholar] [CrossRef]
  3. Aagaard, P.; Simonsen, E.B.; Andersen, J.L.; Magnusson, P.; Dyhre-Poulsen, P. Increased rate of force development and neural drive of human skeletal muscle following resistance training. J. Appl. Physiol. 2002, 93, 1318–1326. [Google Scholar] [CrossRef] [PubMed]
  4. Andersen, L.L.; Aagaard, P. Influence of maximal muscle strength and intrinsic muscle contractile properties on contractile rate of force development. Eur. J. Appl. Physiol. 2006, 96, 46–52. [Google Scholar] [CrossRef] [PubMed]
  5. Folland, J.P.; Buckthorpe, M.W.; Hannah, R. Human capacity for explosive force production: Neural and contractile determinants. Scand. J. Med. Sci. Sport. 2014, 24, 894–906. [Google Scholar] [CrossRef]
  6. Tillin, N.A.; Jimenez-Reyes, P.; Pain, M.T.; Folland, J.P. Neuromuscular performance of explosive power athletes versus untrained individuals. Med. Sci. Sports Exerc. 2010, 42, 781–790. [Google Scholar] [CrossRef] [Green Version]
  7. Castro, M.J.; Kent-Braun, J.A.; Ng, A.V.; Miller, R.G.; Dudley, G.A. Muscle fiber type-specific myofibrillar actomyosin Ca2+ ATPase activity in multiple sclerosis. Muscle Nerve 1998, 21, 547–549. [Google Scholar] [CrossRef]
  8. Coratella, G.; Longo, S.; Borrelli, M.; Doria, C.; Cè, E.; Esposito, F. Vastus intermedius muscle architecture predicts the late phase of the knee extension rate of force development in recreationally resistance-trained men. J. Sci. Med. Sport 2020, 23, 1100–1104. [Google Scholar] [CrossRef]
  9. Baker, D. Acute and long-term power responses to power training: Observations on the training of an elite power athlete. Strength Cond. J. 2001, 23, 47–56. [Google Scholar] [CrossRef]
  10. Thorlund, J.B.; Michalsik, L.B.; Madsen, K.; Aagaard, P. Acute fatigue-induced changes in muscle mechanical properties and neuromuscular activity in elite handball players following a handball match. Scand. J. Med. Sci. Sport. 2008, 18, 462–472. [Google Scholar] [CrossRef]
  11. Stefanyshyn, D.; Nigg, B. Contribution of the lower extremity joints to mechanical energy in running vertical jumps and running long jumps. J. Sports Sci. 1998, 16, 177–186. [Google Scholar] [CrossRef]
  12. Taylor, M.J.D.; Beneke, R. Spring Mass Characteristics of the Fastest Men on Earth. Int. J. Sports Med. 2012, 33, 667. [Google Scholar] [CrossRef] [Green Version]
  13. Markovic, G.; Jaric, S. Is vertical jump height a body size-independent measure of muscle power? J. Sports Sci. 2007, 25, 1355–1363. [Google Scholar] [CrossRef]
  14. Tillin, N.A.; Pain, M.T.G.; Folland, J. Explosive force production during isometric squats correlates with athletic performance in rugby union players. J. Sports Sci. 2013, 31, 66–76. [Google Scholar] [CrossRef] [PubMed]
  15. West, D.J.; Owen, N.J.; Jones, M.R.; Bracken, R.M.; Cook, C.J.; Cunningham, D.J.; Shearer, D.A.; Finn, C.V.; Newton, R.U.; Crewther, B.T.; et al. Relationships between force–time characteristics of the isometric midthigh pull and dynamic performance in professional rugby league players. J. Strength Cond. Res. 2011, 25, 3070–3075. [Google Scholar] [CrossRef] [PubMed] [Green Version]
  16. McGuigan, M.R.; Newton, M.J.; Winchester, J.B.; Nelson, A.G. Relationship between isometric and dynamic strength in recreationally trained men. J. Strength Cond. Res. 2010, 24, 2570–2573. [Google Scholar] [CrossRef] [PubMed]
  17. Young, W.; McLean, B.; Ardagna, J. Relationship between strength qualities and sprinting performance. J. Sports Med. Phys. Fit. 1995, 35, 13–19. [Google Scholar]
  18. Kawamori, N.; Rossi, S.J.; Justice, B.D.; Haff, E.E.; Pistilli, E.E.; O’Bryant, H.S.; Stone, M.H.; Haff, G.G. Peak force and rate of force development during isometric and dynamic mid-thigh clean pulls performed at various intensities. J. Strength Cond. Res. 2006, 20, 483–491. [Google Scholar] [CrossRef]
  19. Marcora, S.; Miller, M.K. The effect of knee angle on the external validity of isometric measures of lower body neuro-muscular function. J. Sports Sci. 2000, 18, 313–319. [Google Scholar] [CrossRef]
  20. Haff, G.G.; Carlock, J.M.; Hartman, M.J.; Kilgore, J.L. Force-time curve characteristics of dynamic and isometric muscle actions of elite women olympic weightlifters. J. Strength Cond. Res. 2005, 19, 741. [Google Scholar] [CrossRef] [Green Version]
  21. Haff, G.G.; Stone, M.H.; O’Bryant, H.S.; Harman, E.; Dinan, C.N.; Johnson, R.; Han, K.H. Force-time dependent characteristics of dynamic and isometric muscle actions. J. Strength Cond. Res. 1997, 11, 269–272. [Google Scholar]
  22. Lum, D.; Haff, G.G.; Barbosa, T.M. The relationship between isometric force-time characteristics and dynamic performance: A systematic review. Sports 2020, 8, 63. [Google Scholar] [CrossRef] [PubMed]
  23. Blazevich, A.J.; Gill, N.D.; Zhou, S. Intra-and intermuscular variation in human quadriceps femoris architecture assessed in vivo. J. Anat. 2006, 209, 289–310. [Google Scholar] [CrossRef] [PubMed]
  24. Harridge, S.D.R.; Bottinelli, R.; Canepari, M.; Pellegrino, M.A.; Reggiani, C.; Esbjörnsson, M.; Saltin, B. Whole-muscle and single-fibre contractile properties and myosin heavy chain isoforms in humans. Pflugers Arch. Eur. J. Physiol. 1996, 432, 913–920. [Google Scholar] [CrossRef]
  25. Blazevich, A.J.; Coleman, D.R.; Horne, S.; Cannavan, D. Anatomical predictors of maximum isometric and concentric knee extensor moment. Eur. J. Appl. Physiol. 2009, 105, 869–878. [Google Scholar] [CrossRef]
  26. Kawakami, Y.; Ichinose, Y.; Kubo, K.; Ito, M.; Imai, M.; Fukunaga, T. Architecture of contracting human muscles and its functional significance. J. Appl. Biomech. 2000, 16, 88–97. [Google Scholar] [CrossRef]
  27. Muhl, Z.F. Active length-tension relation and the effect of muscle pennation on fiber lengthening. J. Morphol. 1982, 173, 285–292. [Google Scholar] [CrossRef]
  28. Kawakami, Y.; Abe, T.; Fukunaga, T. Muscle-fiber pennation angles are greater in hypertrophied than in normal muscles. J. Appl. Physiol. 1993, 74, 2740–2744. [Google Scholar] [CrossRef]
  29. Seynnes, O.R.; de Boer, M.; Narici, M.V. Early skeletal muscle hypertrophy and architectural changes in response to high-intensity resistance training. J. Appl. Physiol. 2007, 102, 368–373. [Google Scholar] [CrossRef]
  30. Sandbakk, O.; Ettema, G.; Leirdal, S.; Holmberg, H.C. Gender differences in the physiological responses and kinematic behaviour of elite sprint cross-country skiers. Eur. J. Appl. Physiol. 2012, 112, 1087–1094. [Google Scholar] [CrossRef] [PubMed] [Green Version]
  31. Kubo, K.; Kanehisa, H.; Fukunaga, T. Gender differences in the viscoelastic properties of tendon structures. Eur. J. Appl. Physiol. 2003, 88, 520–526. [Google Scholar] [CrossRef]
  32. Abe, T.; DeHoyos, D.V.; Pollock, M.L.; Garzarella, L. Time course for strength and muscle thickness changes following upper and lower body resistance training in men and women. Eur. J. Appl. Physiol. 2000, 81, 174–180. [Google Scholar] [CrossRef]
  33. Panidi, I.; Bogdanis, G.C.; Gaspari, V.; Spiliopoulou, P.; Donti, A.; Terzis, G.; Donti, O. Gastrocnemius Medialis Architectural Properties in Flexibility Trained and Not Trained Child Female Athletes: A Pilot Study. Sports 2020, 8, 29. [Google Scholar] [CrossRef] [Green Version]
  34. Maffiuletti, N.A.; Aagaard, P.; Blazevich, A.J.; Folland, J.; Tillin, N.; Duchateau, J. Rate of force development: Physiological and methodological considerations. Eur. J. Appl. Physiol. 2016, 116, 1091–1116. [Google Scholar] [CrossRef] [Green Version]
  35. Barker, L.A.; Harry, J.R.; Mercer, J.A. Relationships between countermovement jump ground reaction forces and jump height, reactive strength index, and jump time. J. Strength Cond. Res. 2018, 32, 248–254. [Google Scholar] [CrossRef] [PubMed]
  36. Moir, G.L.; Getz, A.; Davis, S.E.; Marques, M.; Witmer, C.A. The Inter-Session Reliability of Isometric Force-Time Variables and the Effects of Filtering and Starting Force. J. Hum. Kinet. 2019, 66, 43–55. [Google Scholar] [CrossRef] [Green Version]
  37. Moir, G.L. Three different methods of calculating vertical jump height from force platform data in men and women. Meas. Phys. Educ. Exerc. Sci. 2008, 12, 207–218. [Google Scholar] [CrossRef]
  38. Sayers, S.; Harackiewicz, D.; Harman, E.; Fryman, P.; Rosestein, M. Cross-validation of three jump power equations. Med. Sci. Sport. Exerc. 1999, 31, 572–577. [Google Scholar] [CrossRef]
  39. Hopkins, W.G. Measures of reliability in sports medicine and science. Sports Med. 2000, 30, 1–15. [Google Scholar] [CrossRef] [PubMed] [Green Version]
  40. Nuzzo, J.L.; McBride, J.M.; Cormie, P.; McCaulley, G.O. Relationship between countermovement jump performance and multijoint isometric and dynamic tests of strength. J. Strength Cond. Res. 2008, 22, 699–707. [Google Scholar] [CrossRef] [PubMed]
  41. Young, W.; Wilson, G.; Byrne, C. Relationship between strength qualities and performance in standing and run-up vertical jumps. J. Sports Med. Phys. Fit. 1999, 39, 285. [Google Scholar]
  42. Zatsiorsky, V.M.; Kraemer, W.J. Science and Practice of Strength Training, 2nd ed.; Human Kinetics: Champaign, IL, USA, 2006; pp. 155–160. [Google Scholar]
  43. Secomb, J.L.; Lundgren, L.E.; Farley, O.R.; Tran, T.T.; Nimphius, S.; Sheppard, J.M. Relationships between lower-body muscle structure and lower-body strength, power, and muscle-tendon complex stiffness. J. Strength Cond. Res. 2015, 29, 2221–2228. [Google Scholar] [CrossRef]
  44. McMahon, J.J.; Stapley, J.T.; Suchomel, T.J.; Comfort, P. Relationships between lower body muscle structure and isometric mid-thigh pull peak force. J. Trainology 2015, 4, 43–48. [Google Scholar] [CrossRef] [Green Version]
  45. Zaras, N.; Stasinaki, A.N.; Spiliopoulou, P.; Arnaoutis, G.; Hadjicharalambous, M.; Terzis, G. Rate of Force Development, Muscle Architecture, and Performance in Elite Weightlifters. Int. J. Sports Physiol. Perform. 2020, 1, 1–8. [Google Scholar] [CrossRef]
  46. Mangine, G.T.; Fukuda, D.H.; LaMonica, M.B.; Gonzalez, A.M.; Wells, A.J.; Townsend, J.R.; Jajtner, A.R.; Fragala, M.S.; Stout, J.R.; Hoffman, J.R. Influence of gender and muscle architecture asymmetry on jump and sprint performance. J. Sport. Sci. Med. 2014, 13, 904–911. [Google Scholar]
  47. Alegre, L.M.; Lara, A.J.; Elvira, J.L.L.; Aguado, X. Muscle morphology and jump performance: Gender and intermuscular variability. J. Sports Med. Phys. Fit. 2009, 49, 320. [Google Scholar]
  48. Bartolomei, S.; Rovai, C.; Lanzoni, I.M.; di Michele, R. Relationships Between Muscle Architecture, Deadlift Performance, and Maximal Isometric Force Produced at the Midthigh and Midshin Pull in Resistance-Trained Individuals. J. Strength Cond. Res. 2019. [Google Scholar] [CrossRef]
  49. Methenitis, S.K.; Zaras, N.D.; Spengos, K.M.; Stasinaki, A.N.E.; Karampatsos, G.P.; Georgiadis, G.V.; Terzis, G.D. Role of muscle morphology in jumping, sprinting, and throwing performance in participants with different power training duration experience. J. Strength Cond. Res. 2016, 30, 807–817. [Google Scholar] [CrossRef] [PubMed]
  50. Alegre, L.M.; Aznar, D.; Delgado, T.; Jimenez, F.; Aguado, X. Architectural characteristics of vastus lateralis muscle and jump performance in young men. J. Hum. Mov. Stud. 2005, 48, 109–124. [Google Scholar]
  51. Earp, J.E.; Kraemer, W.J.; Newton, R.U.; Comstock, B.A.; Fragala, M.S.; Dunn-Lewis, C.; Solomon-Hill, G.; Penwell, Z.R.; Powell, M.D.; Volek, J.S.; et al. Lower-Body Muscle Structure and Its Role in Jump Performance During Squat, Countermovement, and Depth Drop Jumps. J. Strength Cond. Res. 2010, 24, 722–729. [Google Scholar] [CrossRef]
  52. Ruiz-Cárdenas, J.D.; Rodriguez-Juan, J.J.; Rios-Diaz, J. Relationship between jumping abilities and skeletal muscle architecture of lower limbs in humans: Systematic review and meta-analysis. Hum. Mov. Sci. 2018, 58, 10–20. [Google Scholar] [CrossRef]
  53. Moreau, N.G.; Falvo, M.J.; Damiano, D.L. Rapid force generation is impaired in cerebral palsy and is related to decreased muscle size and functional mobility. Gait Posture 2012, 35, 154–158. [Google Scholar] [CrossRef] [Green Version]
  54. Finni, T.; Ikegawa, S.; Komi, P.V. Concentric force enhancement during human movement. Acta Physiol. Scand. 2001, 173, 369–377. [Google Scholar] [CrossRef] [PubMed]
  55. Van Hooren, B.; Zolotarjova, J. The difference between countermovement and squat jump performances: A review of underlying mechanisms with practical applications. J. Strength Cond. Res. 2017, 31, 2011–2020. [Google Scholar] [CrossRef] [Green Version]
  56. Alkner, B.A.; Tesch, P.A.; Berg, H.E. Quadriceps EMG/force relationship in knee extension and leg press. Med. Sci. Sports Exerc. 2000, 32, 459–463. [Google Scholar] [CrossRef]
  57. Wilson, G.; Murphy, A. The efficacy of isokinetic, isometric and vertical jump tests in exercise science. Aust. J. Sci. Med. Sport 1995, 27, 20–24. [Google Scholar]
Figure 1. Schematic representation of the study protocol, ILP: isometric leg press, CMJ: countermovement jump.
Applsci 11 05272 g001
Figure 2. Panoramic sonographic image of VL at the middle part showing FL: fascicle length, PA: pennation angle and TH: muscle thickness.
Applsci 11 05272 g002
Figure 3. Correlations between CMJ power and VL muscle thickness and fascicle length.
Applsci 11 05272 g003
Figure 4. Correlations between ILP-PF and VL muscle thickness and fascicle length.
Applsci 11 05272 g004
Table 1. Means and standard deviations of the examined variables (n = 19).
MeanSd
Fascicle length (m)0.0770.007
Pennation angle (ο)15.5281.435
Thickness (m)0.0200.002
ILP-PF (N)3099.805871.435
ILP-Average time to PF (s)1.4380.751
ILP-RFD50 ms (N × s−1)7635.2784479.910
ILP-RFD100 ms (N × s−1)10,430.0954021.079
ILP-RFD150 ms (N × s−1)10,080.5493128.380
ILP-RFD200 ms (N × s−1)9009.9692605.143
ILP-RFD250 ms (N × s−1)7988.0252207.825
ILP-ARFD (N × s−1)2736.0562344.847
CMJ height (m)0.2320.027
CMJ power (W)2170.279271.258
CMJ-PF (N)1452.654137.890
CMJ-average time to PF (s)0.2430.056
CMJ-RFD50 ms (N × s−1)2515.4911360.157
CMJ-RFD100 ms (N × s−1)4324.6612739.108
CMJ-RFD150 ms (N × s−1)5369.3402744.600
CMJ-ARFD (N × s−1)3767.9763055.164
ILP-PF: peak force in isometric leg press, ILP-ARFD: average rate of force development in isometric leg-press, CMJ-PF: peak force in countermovement jump, ILP-RFD: rate of force development in isometric leg press, CMJ-RFD: rate of force development in countermovement jump, CMJ-ARFD: average rate of force development in countermovement jump.
Table 2. Correlation coefficients (Pearson’s r) between CMJ and ILP force–time characteristics (n = 19).
ILP-PFILP-RFD50 msILP-RFD100 msILP-RFD150 msILP-RFD200 msILP-RFD250 msILP-ARFD
CMJ height0.3380.022−0.0260.0200.0450.055−0.070
CMJ power0.658 **0.1810.1770.2950.3050.293−0.063
CMJ-PF0.1400.2970.3680.3710.3480.3280.477 *
CMJ-RFD50 ms0.0870.3840.3990.4330.4230.3970.399
CMJ-RFD100 ms0.0850.502 *0.533 *0.505 *0.499 *0.477 *0.520 *
CMJ-RFD150 ms0.0020.533 *0.561 *0.498 *0.468 *0.4250.447
CMJ-ARFD−0.1330.0740.2760.3150.3200.3430.625 **
ILP-PF: peak force in isometric leg press, CMJ-PF: peak force in countermovement jump, ILP-RFD: rate of force development in isometric leg press, CMJ-RFD: rate of force development in countermovement jump, CMJ-ARFD: average rate of force development in countermovement jump, ILP-ARFD: average rate of force development in isometric leg-press. * p < 0.05, ** p < 0.01.
Table 3. Correlation coefficients (Pearson’s r) between VL muscle architecture and CMJ force–time characteristics (n = 19).
Fascicle LengthPennation AngleThickness
CMJ height0.3070.3300.523 *
CMJ-PF0.423−0.0850.317
CMJ-RFD50 ms0.369−0.2970.072
CMJ-RFD100 ms0.365−0.1450.128
CMJ-RFD150 ms0.295−0.0970.114
CMJ-ARFD−0.0730.068−0.012
CMJ-PF: maximal force in countermovement jump, CMJ-RFD: rate of force development in countermovement jump, CMJ-ARFD: average rate of force development in countermovement jump. * p < 0.05.
Table 4. Correlation coefficients (Pearson’s r) between VL muscle architecture and ILP force–time characteristics (n = 19).
Fascicle LengthPennation AngleThickness
ILP-RFD50 ms0.584 **−0.2400.252
ILP-RFD100 ms0.606 **−0.1170.290
ILP-RFD150 ms0.646 **−0.0630.347
ILP-RFD200 ms0.612 **0.0180.375
ILP-RFD250 ms0.565 *0.0360.364
ILP-ARFD0.368−0.2340.105
ILP-RFD: rate of force development in isometric leg press, ILP-ARFD: average rate of force development in isometric leg press. * p < 0.05, ** p < 0.01.
Table 5. Results of the stepwise regression analysis using ILP-PF, fascicle length and muscle thickness as predictors of CMJ power.
95%CI
VariablesΒSEBetaTSigLowerUpper
Fascicle length76.65476.9870.2040.9960.335−87.349240.748
ILP-PF0.1210.0610.3891.9930.065−0.0080.250
Thickness460.320260.9310.3541.7640.098−95.8411016.481
ILP-PF0.1410.7740.4542.4750.0250.200.263
Thickness564.804238.8360.4342.3650.03158.4951071.112
Publisher’s Note: MDPI stays neutral with regard to jurisdictional claims in published maps and institutional affiliations.

