1. Introduction
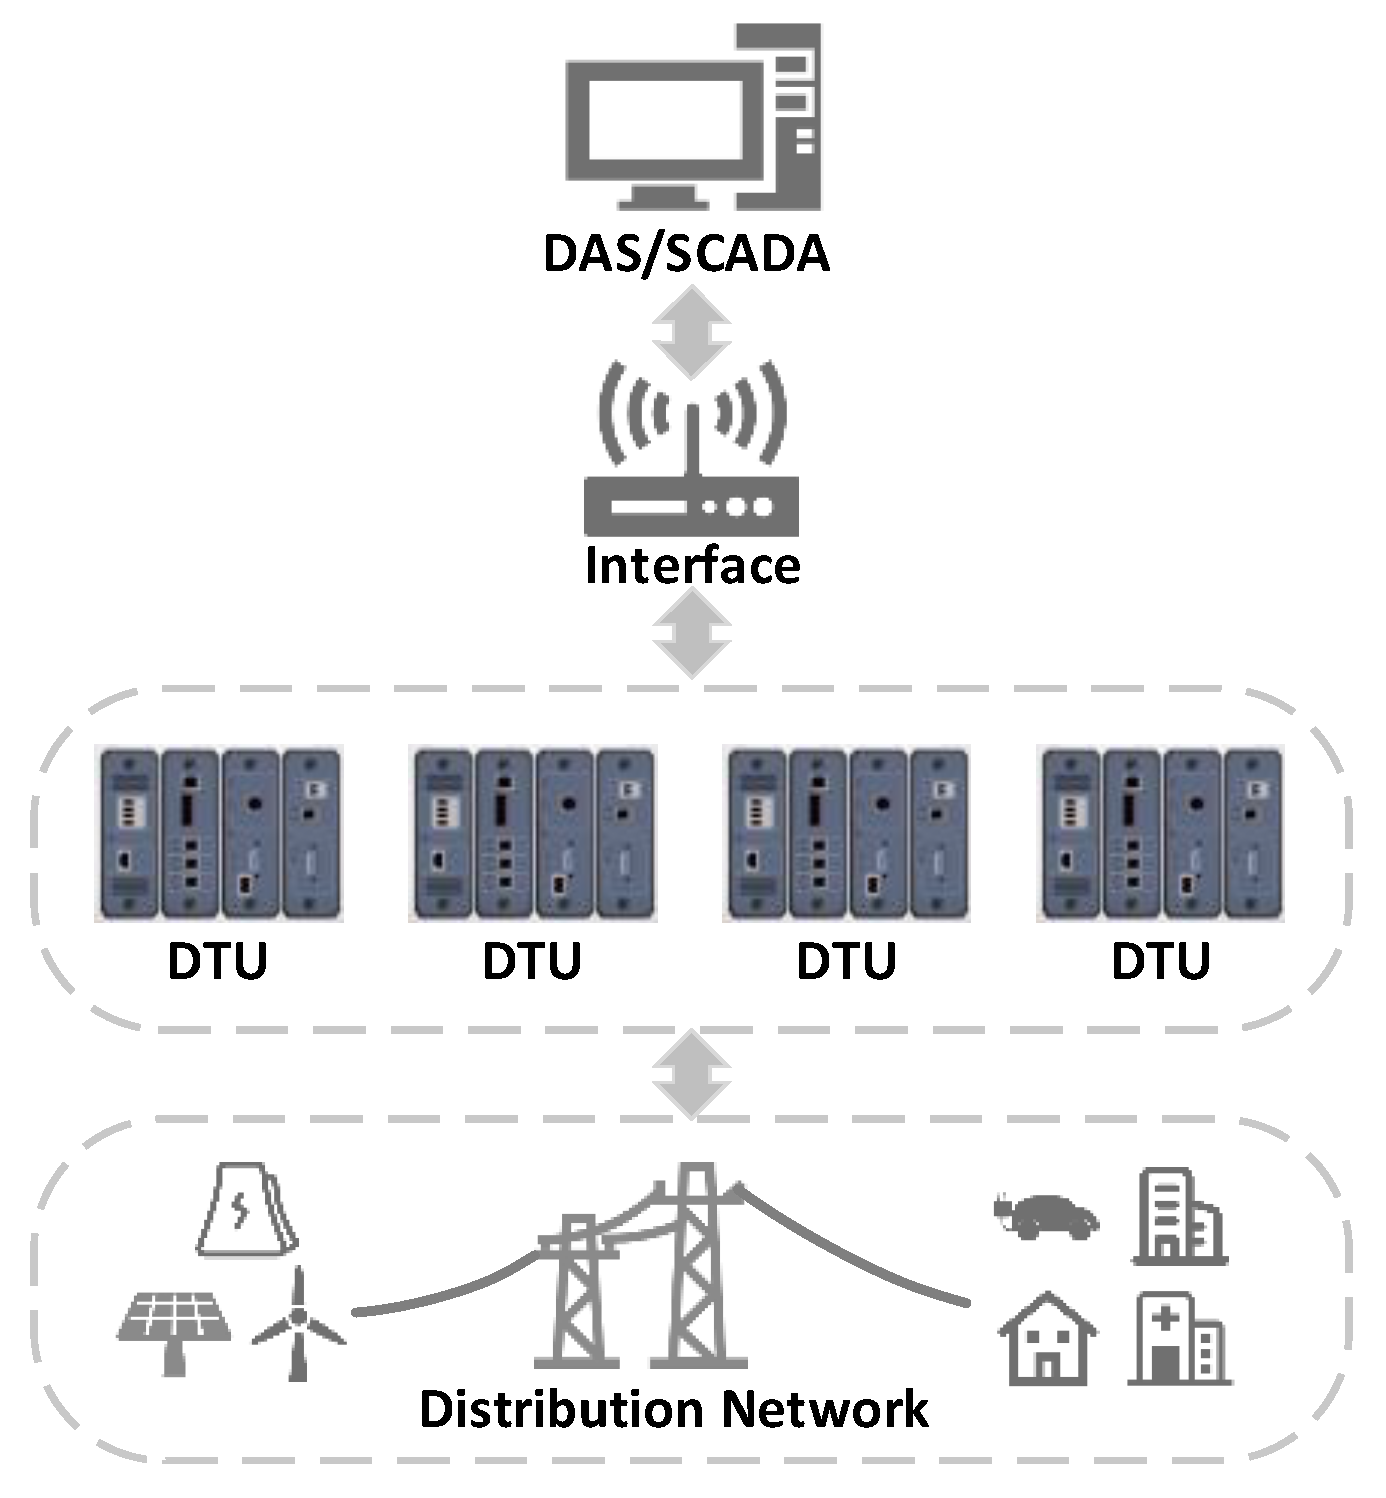
The distribution terminal unit (DTU) collects real-time operation data of distribution networks and uploads them to the distribution automation system (DAS) or the supervisory control and data acquisition (SCADA) system. With DTU devices, DAS/SCADA can monitor the operating state of distribution networks and control secondary-side devices remotely, which shortens fault elimination time and reduces the maintenance cost to some extent. Nevertheless, with the development of distribution networks, large-scale integration of DTU also imposes pressure on maintenance work. DTU faults happen frequently while the number of maintenance workers is limited [
1,
2,
3,
4,
5]. Moreover, DTU faults may lead to device failure, which would have severe impacts on the distribution network. Therefore, lowering fault incidence and the enhancing fault elimination ability are vital for guaranteeing the safe and stable operation of distribution networks and power systems. During DTU operation, significant fault data is generated and recorded which, however, is not fully utilized.
Data mining techniques are effective approaches for analyzing the fault of devices in power systems. The studied methods are mainly based on expert systems [
6,
7,
8], state estimation (e.g., the hierarchical clustering method [
9], state evaluation [
10,
11], and analytical hierarchy process [
12,
13,
14,
15]), machine learning (e.g., neural networks [
16,
17,
18,
19] and SVM [
20,
21,
22,
23]), and association rule mining algorithms [
24,
25,
26,
27,
28,
29,
30]. Methods based on expert systems and state estimation involve evaluating devices based on human experience, which is relatively subjective. Machine learning methods and association rule mining algorithms analyze faults based on realistic operation data of devices. Therefore, they are more objective compared to the former two methods. Machine learning methods are innovative and effective in detecting and identifying faults. However, they usually require large amounts of high-quality data to achieve good performance. Compared with machine learning, methods based on association rule mining algorithms are not strictly restricted to the amount of data. Many methods based on association rule mining algorithms are designed for power transformers [
24,
25,
26,
29,
30]. They are used to find relationships between transformer faults and operation data such as the gas component, voltage, and current. However, these methods are not feasible for DTU because it possesses a specific configuration that is completely different from the transformer. Studies have also utilized association rule mining algorithms to find possible factors that lead to faults of the distribution system [
27] and secondary-side devices [
28]. These approaches are relatively general rather than specific. Very few studies have analyzed the fault of DTU devices in a comprehensive and objective way. However, large-scale integration of DTU devices makes the investigation of DTU fault analysis necessary and urgent.
In order to improve the maintenance efficiency and facilitate the integration of DTU devices, a DTU fault analysis method based on an association rule mining algorithm was proposed. Firstly, the physical configuration of DTU was constructed, and factors leading to DTU fault and fault types were analyzed. Then, three different association rule mining algorithms were evaluated using DTU fault data; the Eclat algorithm, which has the best performance, was selected for this purpose. Afterwards, the DTU fault analysis method was put forward and applied to realistic DTU fault databases. Finally, application examples of this method were illustrated and recommendations for future work were suggested. The unique contributions of this paper are as follows:
This paper studied different aspects of DTU faults (i.e., factors which lead to faults, different fault types, and fault modules of devices); the proposed method can realize fault cause analysis and fault diagnosis, which analyzes DTU faults in a comprehensive way.
The proposed data-driven fault analysis method only relied on operation data of DTU devices instead of human experience. Thus, it was objective rather than subjective.
The fault analysis method was oriented towards DTU devices, which is more specific than other general methods for the whole system. To the best of our knowledge, this was the first method that investigated the fault of DTU devices.
A series of simulations and applications demonstrated that the proposed method can effectively reduce DTU fault incidence and shorten fault elimination time.
The rest of this paper is organized as follows.
Section 2 discusses the fault analysis of DTU devices.
Section 3 illustrates the Eclat algorithm and evaluates three different association rule mining algorithms.
Section 4 proposes a DTU fault analysis method based on Eclat algorithm.
Section 5 describes the implementation of this method on realistic DTU fault databases and analyzes the outcome.
Section 6 is the application of this proposed fault analysis method.
Section 7 is the conclusion.
2. DTU Fault Analysis
DTU is an indispensable device in power systems that monitors the operating state of distribution networks [
31,
32], transmits telemetry data to DAS or SCADA systems, and controls connected objects in the distribution network by utilizing signals from DAS/SCADA (
Figure 1).
2.1. Configuration of DTU
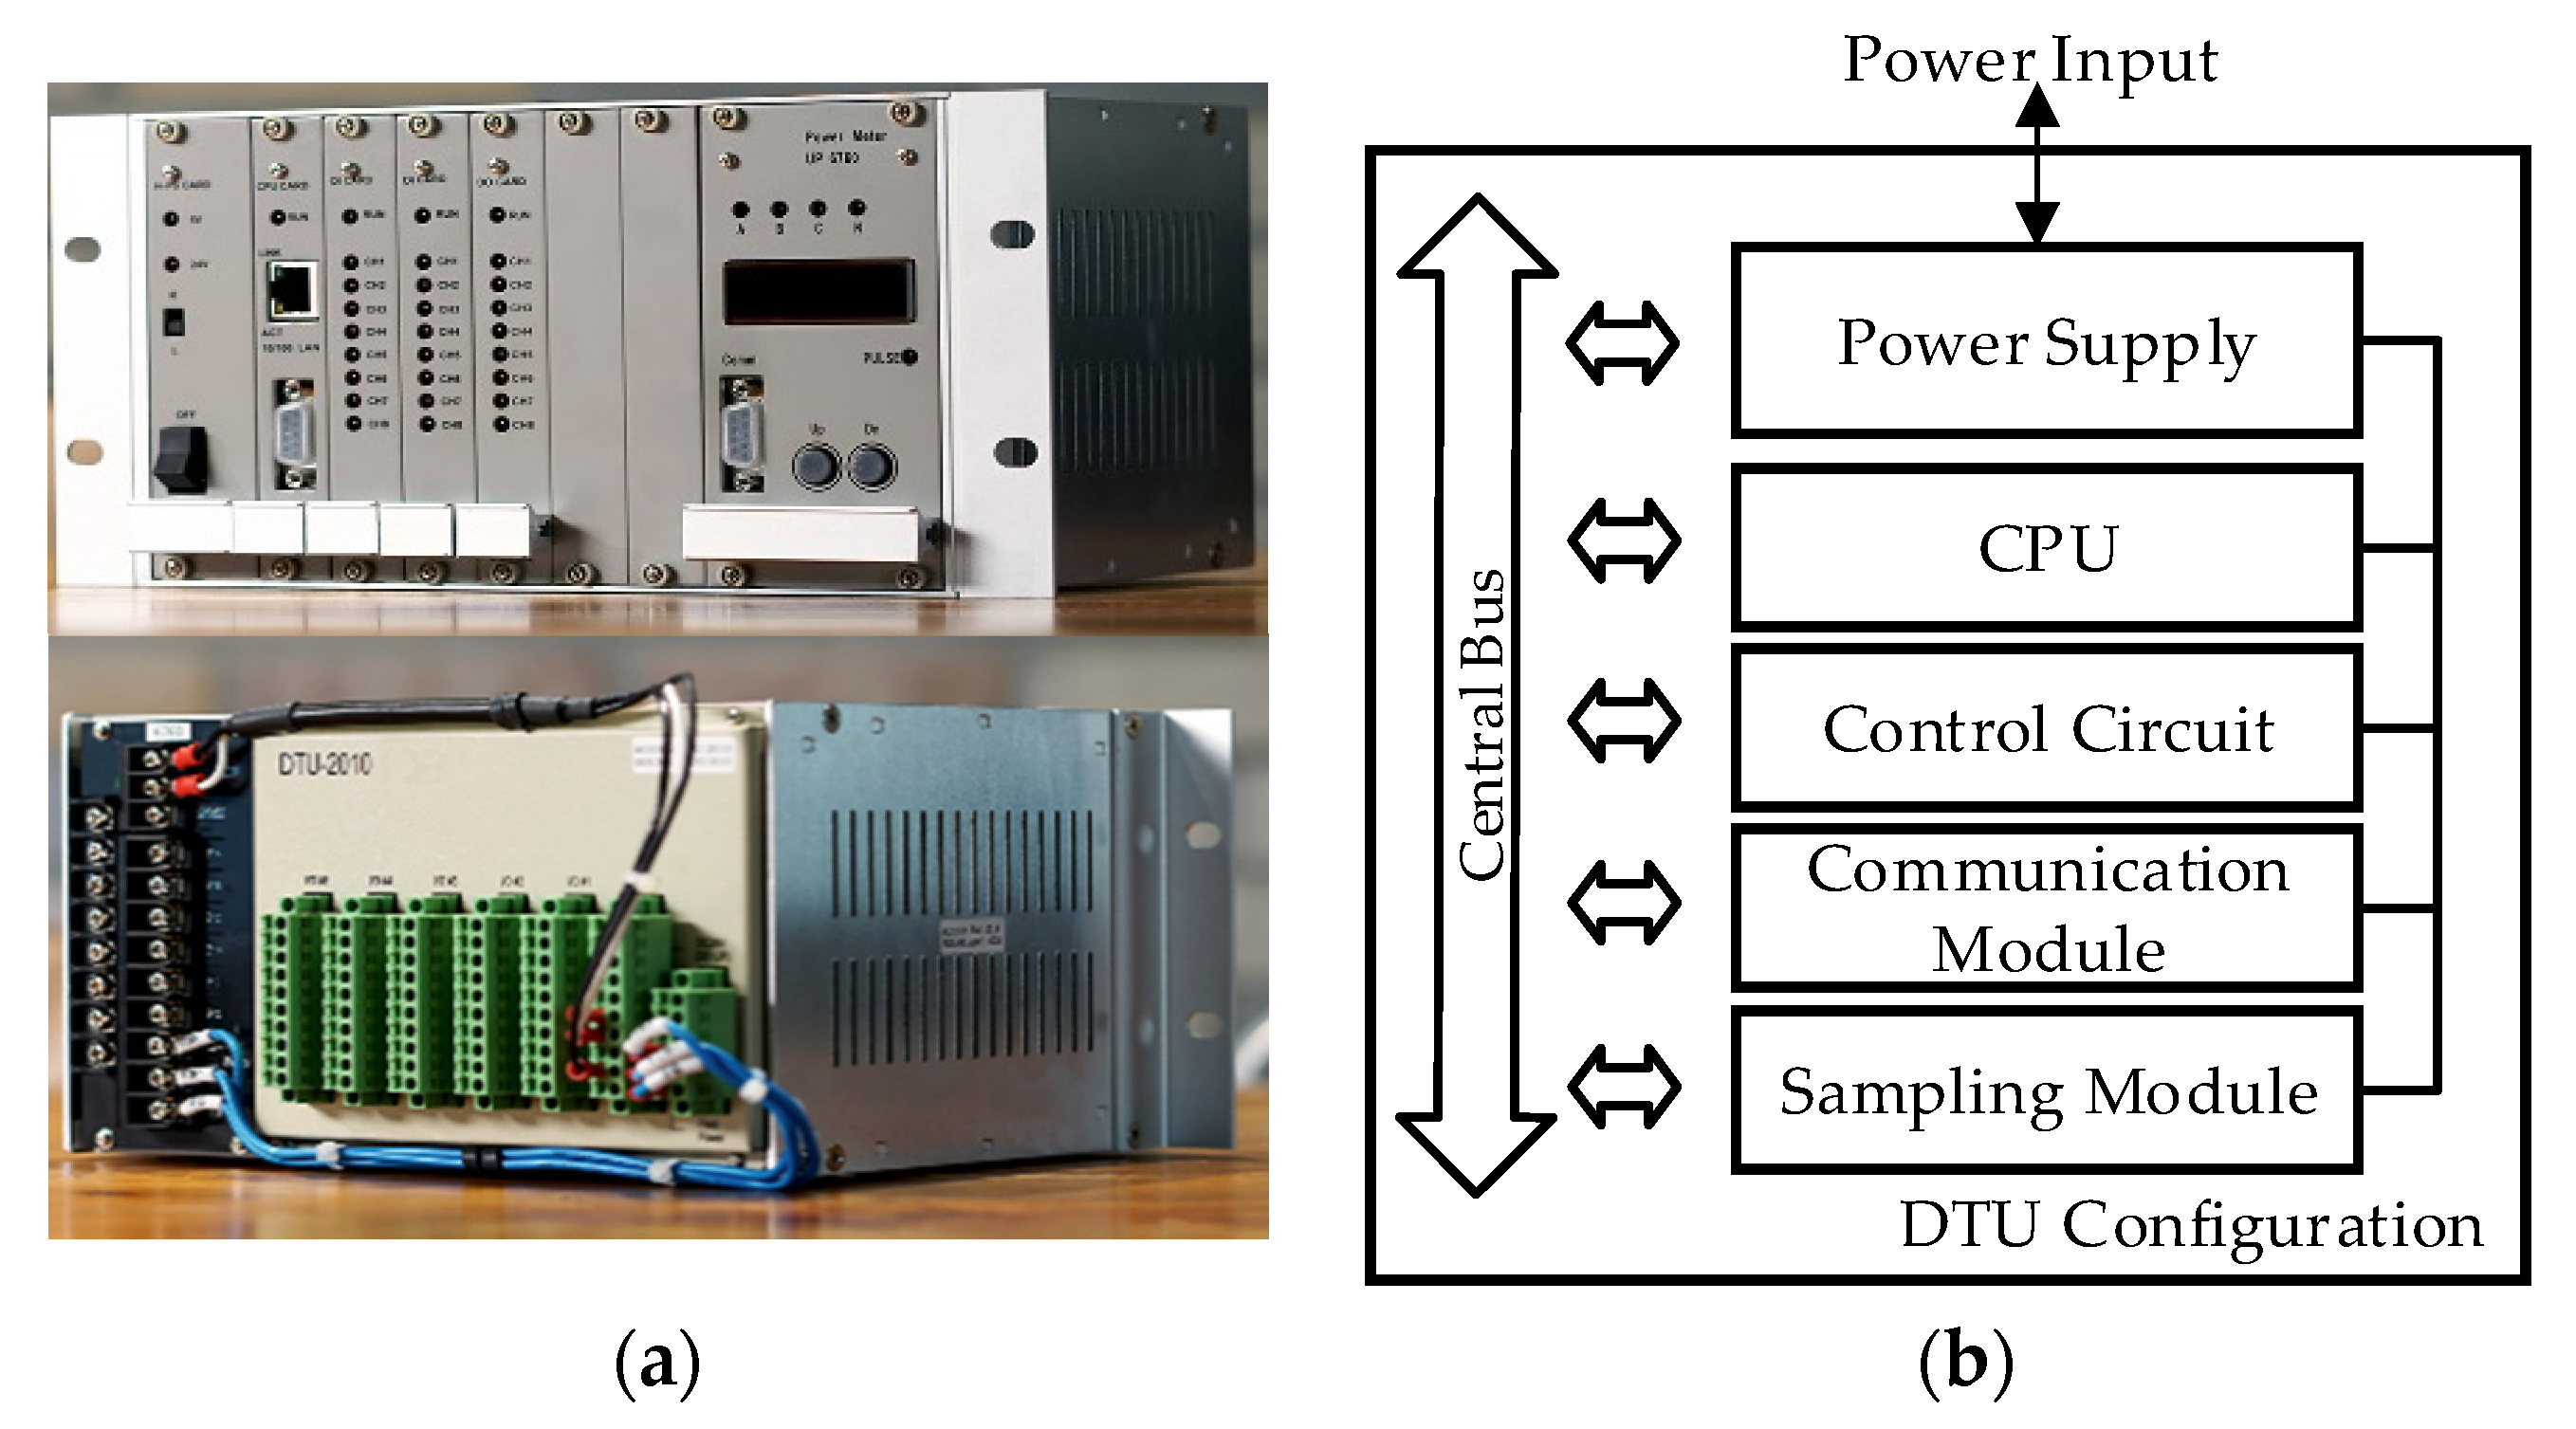
A picture and simplified configuration of a DTU are shown in
Figure 2. It comprises 5 modules which are, respectively, the CPU module, the communication module, the sampling module, the control circuit module, and the power supply module. Among these, the CPU functions as the centralized controller, the communication module controls information interaction between the DTU and the main station, the control circuit module sends signals to breakers, and the power supply module provides electricity to other modules.
2.2. DTU Fault Types
The DTU has several types of faults as summarized in
Table 1. Functional faults can be divided into telemetering faults, remote signaling faults, and remote control faults [
33]. A telemetering fault means the DTU is unable to measure the analog signals of the distribution network (e.g., voltage, current, and power). A remote signaling fault means that the DTU fails to measure signals of breakers and protection devices. A remote control fault means the DTU cannot send signals to control breakers and switches [
34]. Faults that cause the DTU to stop working are called device faults. Among them, DTU offline means that the DTU is disconnected from the main station, and frequent online-offline means that the DTU is not working in a stable state.
2.3. Factors Leading to DTU Fault
Many factors may give rise to DTU faults, which are summarized in
Table 2.
There are mainly 10 factors that can lead to DTU fault. Among external factors, humidity means that the moist environment causes fault of devices, effects of primary-side equipment refer to the malfunction of primary-side devices (e.g., breakers and transformers) [
35], and mis-operation refers to engineers’ failed operation of control devices. In terms of internal factors, operating state refers to the hardware and software operating state as well as the upgrading state of DTU devices, long service time means that device reaches or exceeds its lifespan, and family defect means that products of certain manufacturers may have certain types of faults.
2.4. Data Analysis of DTU Fault
DTU fault data usually have the same format as
Table 3.
Each data item contains the time, device ID, device brand
B, fault type
T, and fault elimination measure
F/
M. In which, fault type
T refers to six types as shown in
Table 1. Fault elimination approach contains information pertaining to the DTU fault module
M (
Figure 2) or factors
F (
Table 2). For instance, fault elimination approaches can be ‘wireless signal issues and solved by restarting the communication module’; in this case, factor
F is ‘wireless signal quality’ and the fault module is ‘communication module’.
According to DTU fault data, brand
B, fault type
T, factors
F, and fault module
M are key elements. Therefore, item set
FA containing these four elements was constructed as (1) to facilitate fault analysis:
in which, there are
p brand
B,
q types of fault
T,
i factors
F, and
j fault modules as shown in Equations (2)–(5).
3. Association Rule Mining Algorithm
Association rule mining was proposed to find the regularity of products bought by customers [
36]. As for DTU fault analysis, we studied three frequently used association rule mining algorithms, which were Eclat [
37], FP-growth [
38], and Apriori [
39]. The basic concept of the association rule, the main idea of Eclat algorithm, and the comparison of these three algorithms are illustrated in this section.
3.1. Indices of Association Rule
Taking item set as an example (in which Bb ⊆ B, Tt ⊆ T, Ff ⊆ F, Mm ⊆ M), the association rule can be expressed as Ff ⇒ Tt. This means if factor Ff happened, there is a possibility that fault Tt would also happen. Two indices used to evaluate the association rule are as follows:
3.1.1. Support
Support is a probability index for items. Taking item
Ff as an example, support of one item can be expressed as Equation (6):
where
count(
Ff) is the time that
Ff happens in the database,
count(
itemset) is the number of item sets.
Support of two or more items can be calculated through Equation (7):
where
count(
Tt ∩
Ff ∩
Mm) is the time that
Tt,
Ff, and
Mm happen in the same item set.
3.1.2. Confidence
Confidence is an index of reliability for the association rule. Taking the association rule
Ff ⇒
Tt as an example, the confidence of this rule can be calculated through Equation (8):
where
count(
Ff ∩
Tt) is the number of
Ff and
Tt happen in the same item set.
When analyzing the relationship between different item sets, the minimum support threshold and minimum confidence threshold are often set in advance. Item sets satisfying the minimum support threshold are called frequent item sets. Rules satisfying the minimum confidence threshold are called strong rules.
3.2. Eclat Algorithm
Eclat algorithm [
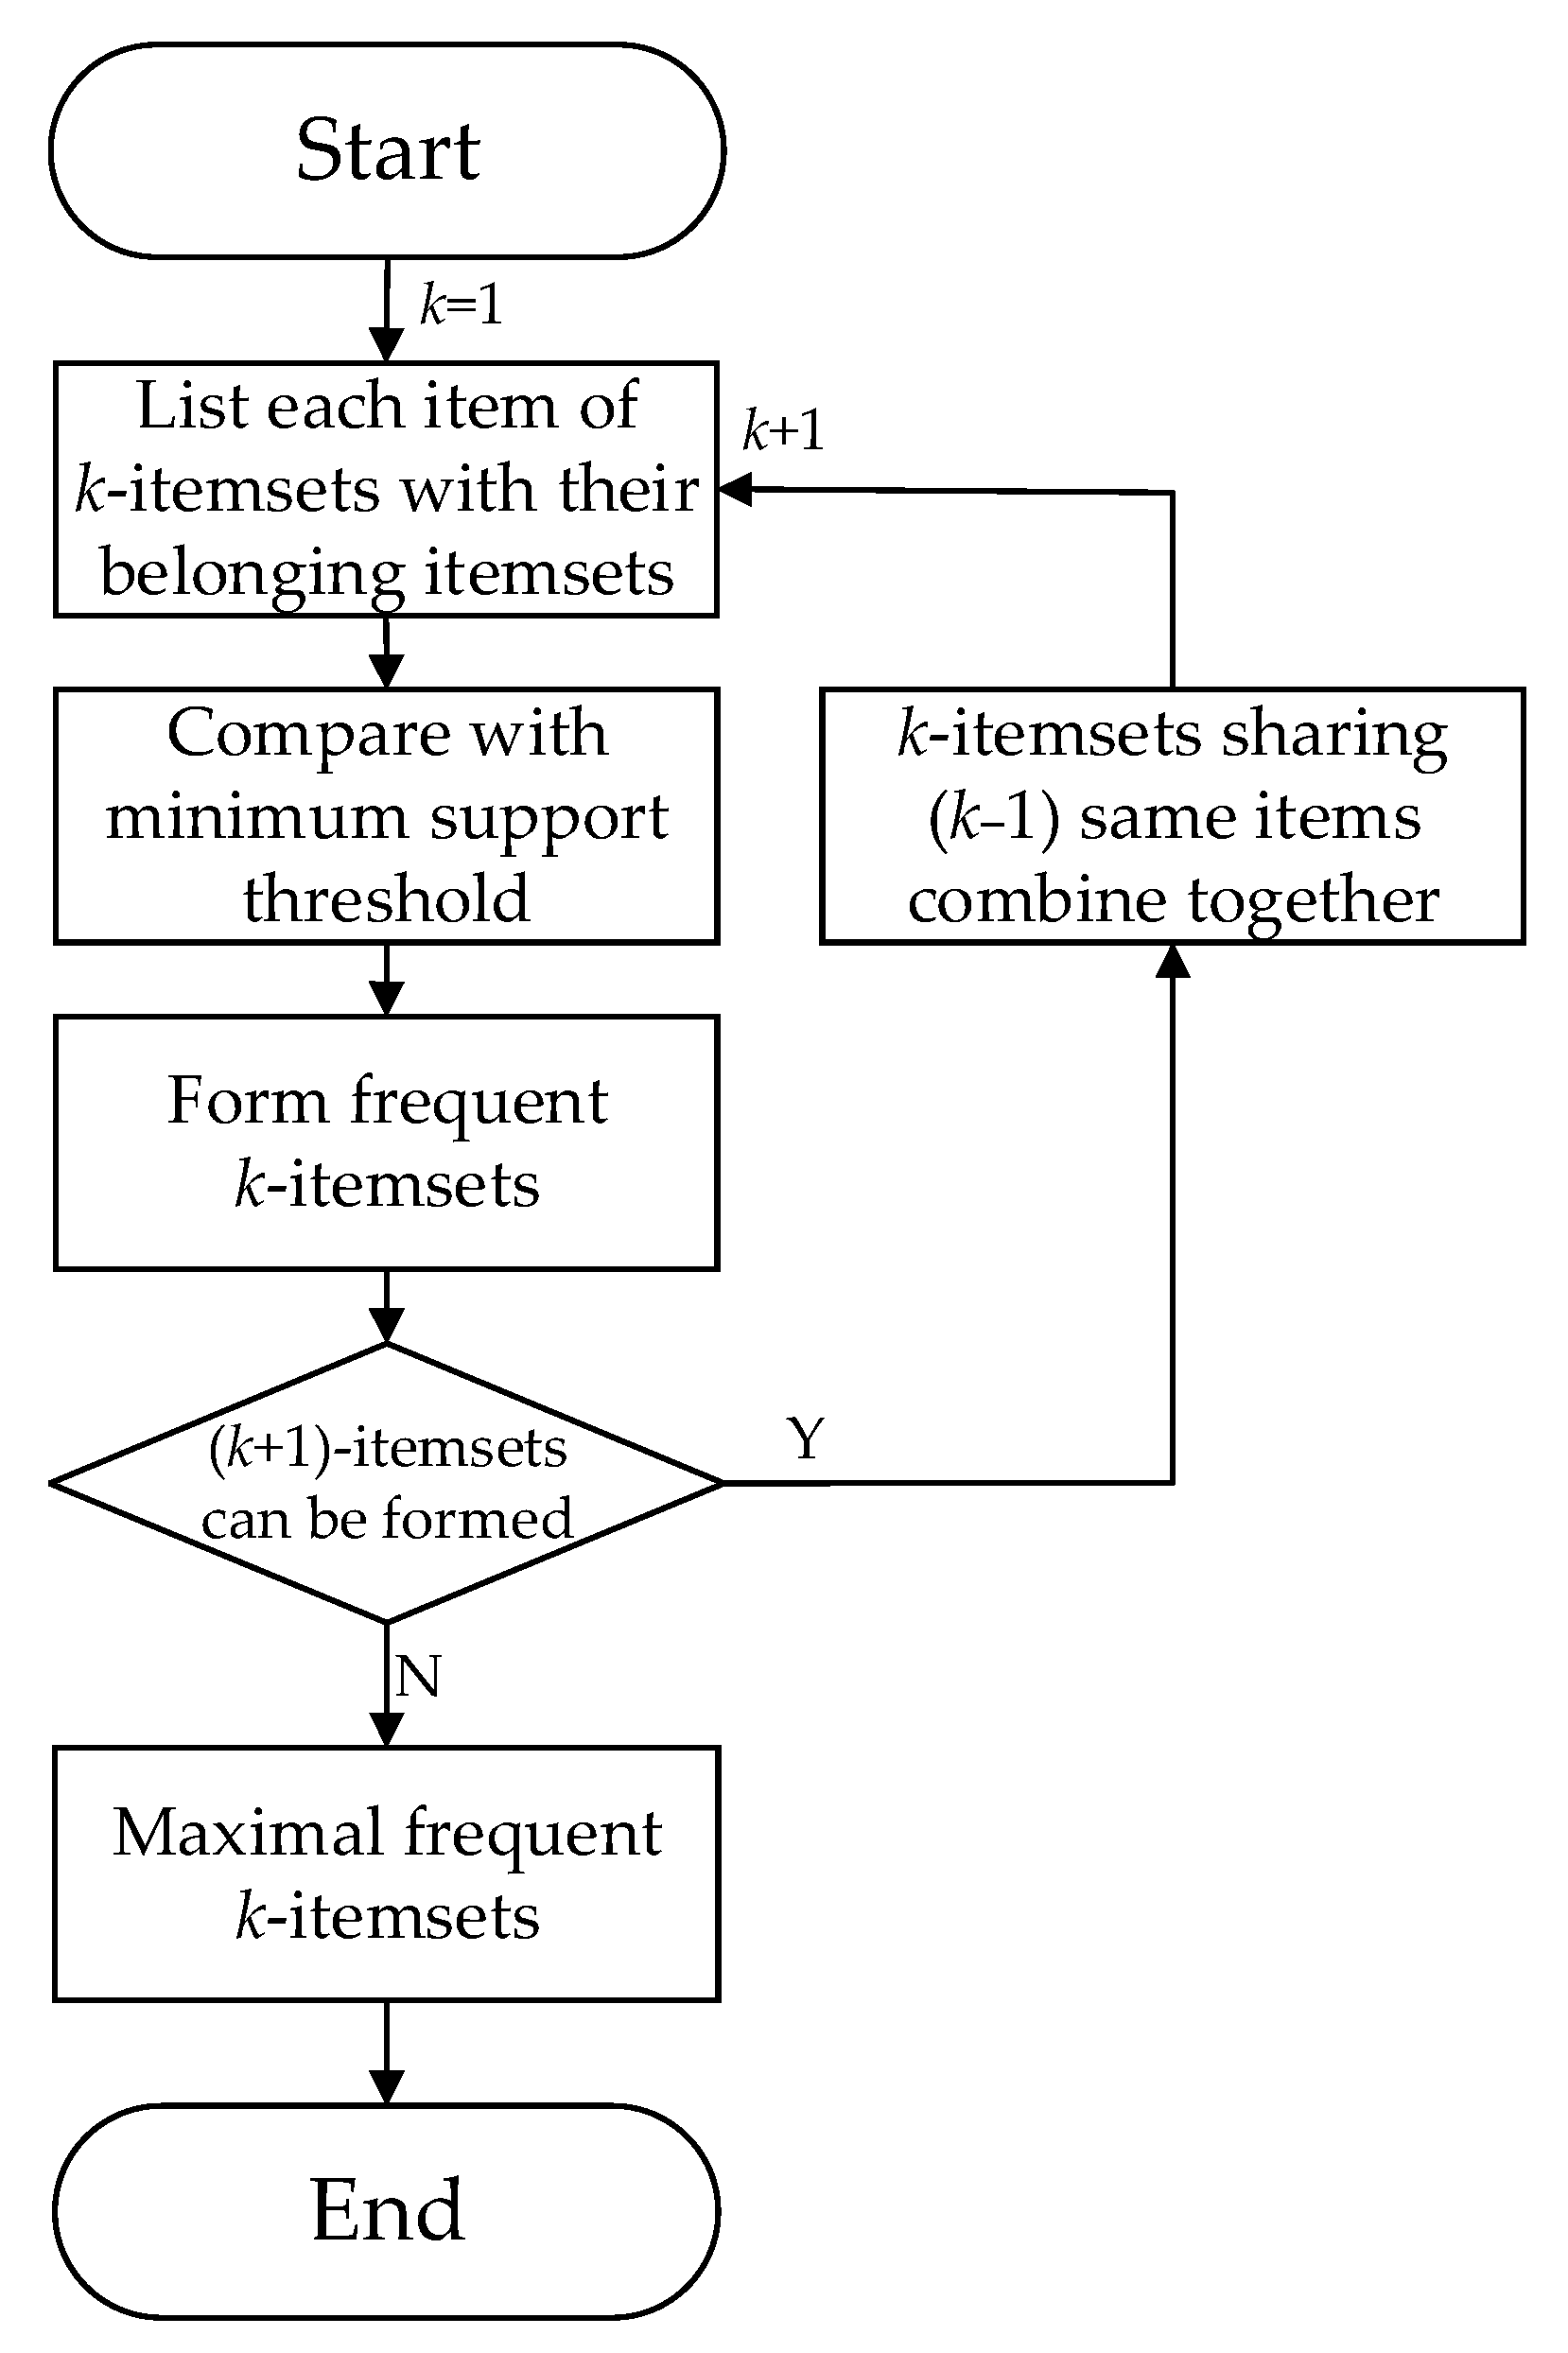
37] works in a vertical manner as shown in
Figure 3.
In the first step, the database was scanned and all single items were listed, as well as their belonging item sets. The support value of each item equaled to the number of their belonging item sets. Next, the support value of each item was compared with the threshold, and those items meeting requirement constituted frequent 1-item sets. Then, every two items paired together, the intersection of their belonging item sets was listed. Afterwards, 2-item sets sharing one item combined with each other to form 3-item sets. This recursive process was continued until no item sets could be combined. The Eclat algorithm only scanned the whole database once, in the first step.
3.3. Generation of Strong Rules
After obtaining frequent item sets by association rule mining algorithms, the next step was to find strong rules. Taking the maximal frequent item set {B1, T2, F3, M4} as an example, all candidate association rules X ⇒ Y were listed, in which X ⊆ {B1, T2, F3, M4}, Y ⊆ {B1, T2, F3, M4} − X. For instance, X = {B1, T2} and Y = {M4} or X = {B1, T2, F3} and Y = {M4}. Then, the confidence of each rule was compared with the minimum confidence threshold, and those rules meeting the requirement were considered as strong rules.
3.4. Comparison of Three Algorithms
Theoretically, Eclat is the best among all three algorithms as it only scans the whole database once. FP-growth is the second best since it scans database twice [
38], while Apriori takes the longest time since it scans the database when generating frequent item sets [
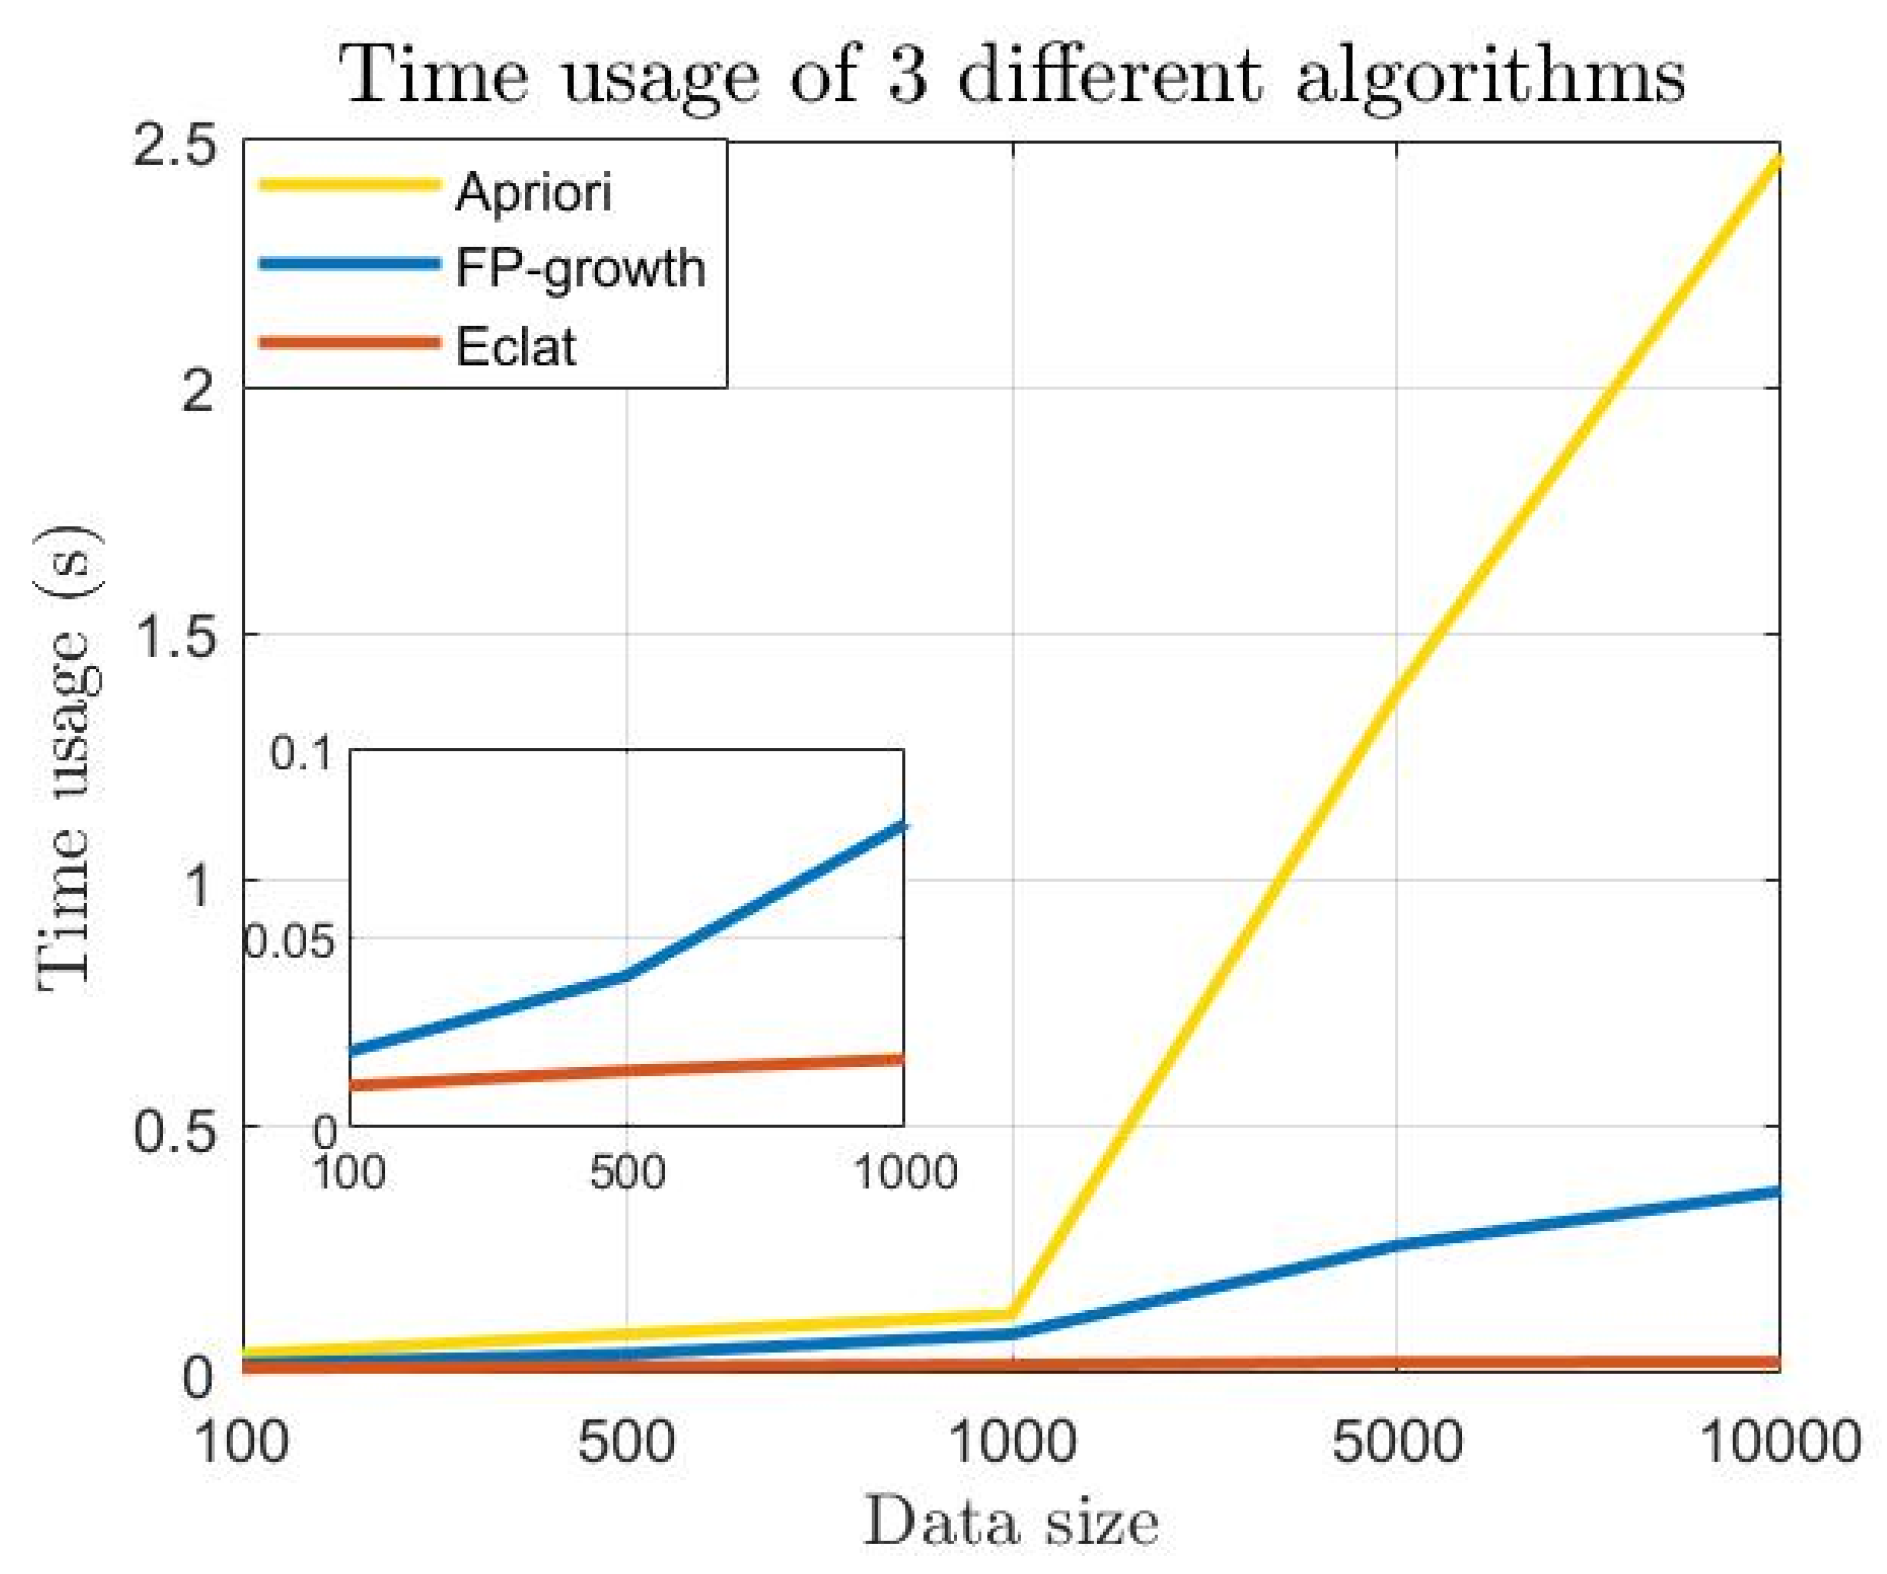
39]. To evaluate the performance of the three algorithms, five DTU fault databases of different sizes (100, 500, 1000, 5000, 10,000) were constructed, and simulation was conducted in Python 3.7 on a PC with an Intel Core i5-9400F CPU running at 2.90 GHZ and with 8.0 GB of RAM, the figure was plotted in MATLAB, version R2020b (The MathWorks, Inc., Natick, MA, USA). Time usage of three algorithms is shown in
Figure 4.
As can be seen from
Figure 4, Eclat had better performance than FP-growth and Apriori. When the number of data is lower than 1000, the time usage difference of the three algorithms was nearly negligible. However, as the data size increased, the difference became much more obvious. When the number of data reached 10,000, the time usage of FP-growth was 15 times longer than Eclat, while Apriori was 103 times longer than Eclat. This outcome conformed to the theoretical analysis of three algorithms: Eclat takes the least time as it only scans the database once, while FP-growth and Apriori take longer due to additional scanning.
The Apriori algorithm is the easiest and most direct approach to mining frequent item sets, but it needs to generate a large number of candidate item sets and repeatedly scan the database, so it is rather costly. FP-growth deals with this problem by introducing a frequent pattern tree; by this means, it only scans the database twice. However, it also has disadvantages such as complexity and large memory occupation. Compared with Apriori and FP-growth, Eclat requires less time and is thus more efficient. However, as Eclat needs to repeatedly save item sets, it needs more memory space.
Strengths and weaknesses of three different algorithms are summarized in
Table 4.
4. DTU Fault Analysis Method
DTU fault databases contain significant amounts of data; moreover, they are updated in real time. Therefore, the Eclat algorithm was utilized due to its best performance among the three algorithms.
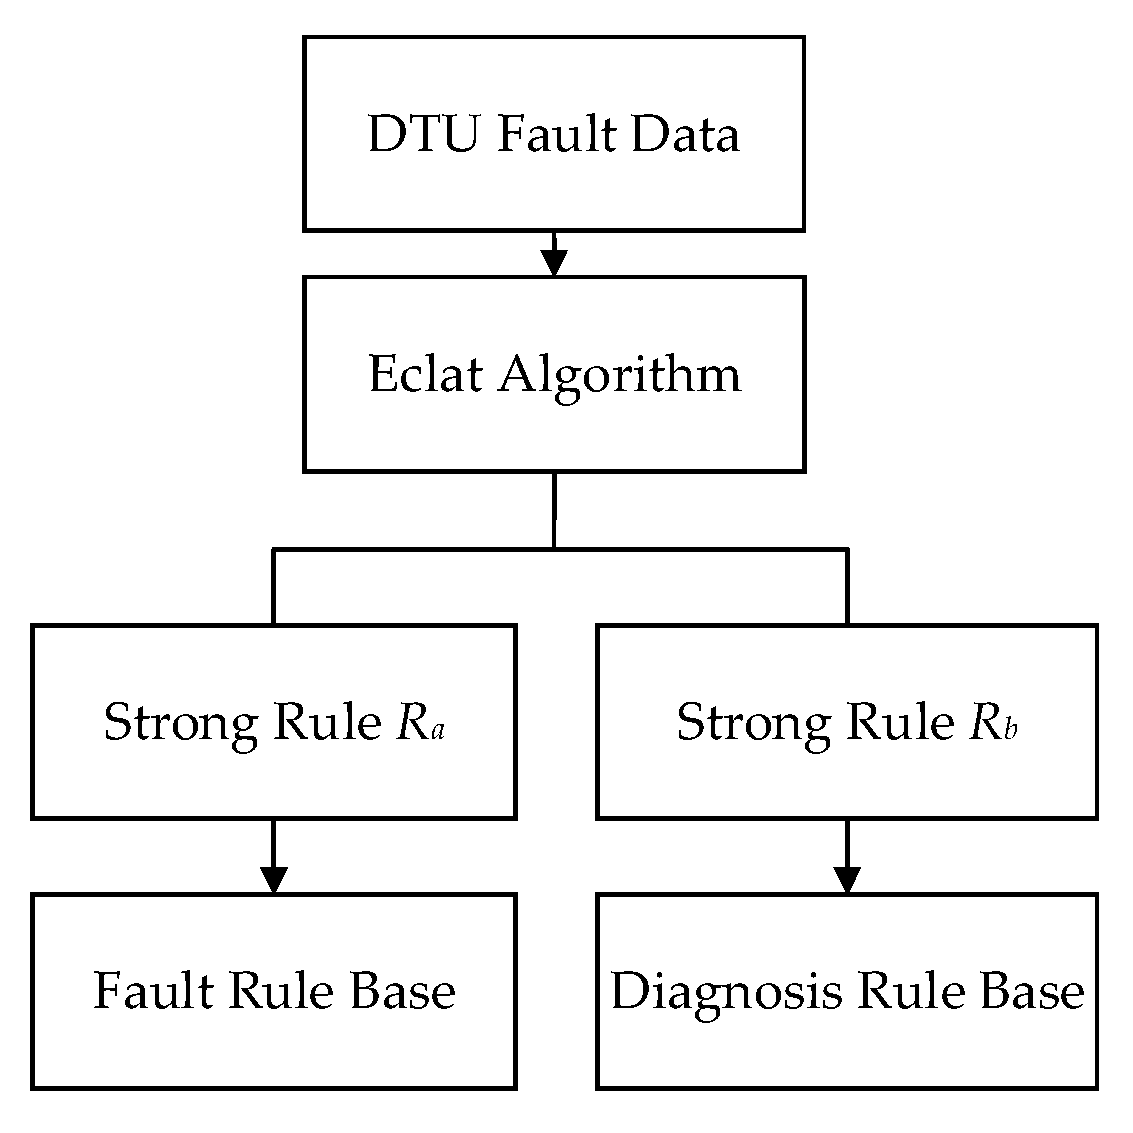
The proposed DTU fault analysis method is shown in
Figure 5.
Firstly, DTU fault data was sampled and recorded. By scanning the database, item sets
FA were constructed. Then, Based on the Eclat algorithm, two types of strong rules were obtained:
Ra represents the relationship between factor F and fault type T. It indicates that certain factor Ff may result in certain type of fault Tt, which reveals the rule of the fault. Brand Bb is one kind of factor F (family defect), but it is separated as an individual item in order to show if products of certain manufacturers Bb have a certain type of fault Tt. Rb includes fault type T and fault module M. It indicates when a certain type of fault Tt happens; there is a high probability that fault exists in corresponding module Mm. When fault Tt happens, diagnosing module Mm, before other modules, can shorten fault elimination time. Based on strong rules Ra and Rb, fault rule bases and diagnosis rule bases can be constructed. These two rule bases can be utilized to arrange planned maintenance and facilitate fault repair.
4.1. Fault Rule Base
Fault rule bases can be used to find the factors that lead to specific faults. Therefore, when one type of fault happens frequently and regularly, engineers can take measures to avoid corresponding factors in planned maintenance so as to lower DTU fault incidence. On the occasion when brand information is also included in the obtained strong rule Bb ⇒ Tt, manufacturer Bb can be informed that their products may have defects that can lead to a certain type of fault Tt. They should improve their products according to this information.
4.2. Diagnosis Rule Base
Diagnosis rule base reveals the relationship between fault types and fault modules. Higher confidence means that the rule is more reliable and is more likely to happen. Under circumstances wherein several rules exist, the rule with higher confidence should be considered before others, which means the corresponding fault module in that rule should be investigated at the first step. Other modules should be checked according to the rank of rule confidence. By these means, fault repair time can be shortened and efficiency of fault elimination can be improved.
5. Experiment and Results
The proposed fault analysis method for DTU was implemented on a realistic DTU fault database released by the State Grid Corporation of China.
5.1. Data Information
DTU fault data from Mar 2020 to Jun 2020 in one district of Nanjing, China was collected. After data preprocessing, a DTU fault database containing 12,320 item sets was obtained. By scanning the database, FA was constructed. Fault types T had five elements, which were the remote control fault, remote signaling fault, DTU offline, frequent online-offline, and other faults. Factors F have 10 kinds, including mis-operation, humidity, wireless signal quality, power failure, effects of primary-side equipment, hardware operating state, software operating state, DTU upgradation, family defects, and long-time service. Fault modules M had five elements, which were the CPU module, communication module, sampling module, power supply module, and control circuit module. Brands B had 15 elements.
5.2. Strong Rules of DTU Fault Data
Setting a reasonable support threshold and confidence threshold are of great importance. A higher support threshold may lead to fewer association rules obtained, and a lower confidence threshold may give rise to more strong rules obtained, which, however, are less reliable. Therefore, the support threshold and confidence threshold of the Eclat algorithm were set to be 0.03 and 0.8 respectively.
After applying the Eclat algorithm, 19 frequent 1-item sets, 40 frequent 2-item sets, 22 frequent 3-item sets, and 3 frequent 4-item sets were obtained. In total, 17 strong rules were mined from the database. Strong rules obtained from the DTU database are shown in
Table 5.
Ra strong rule can be used to form the fault rule base. Rb strong rule can be utilized to form the diagnosis rule base. Ra + Rb strong rule includes the relationship between fault type T, F(B), and M, and it can be used to form both the fault rule base and diagnosis rule base.
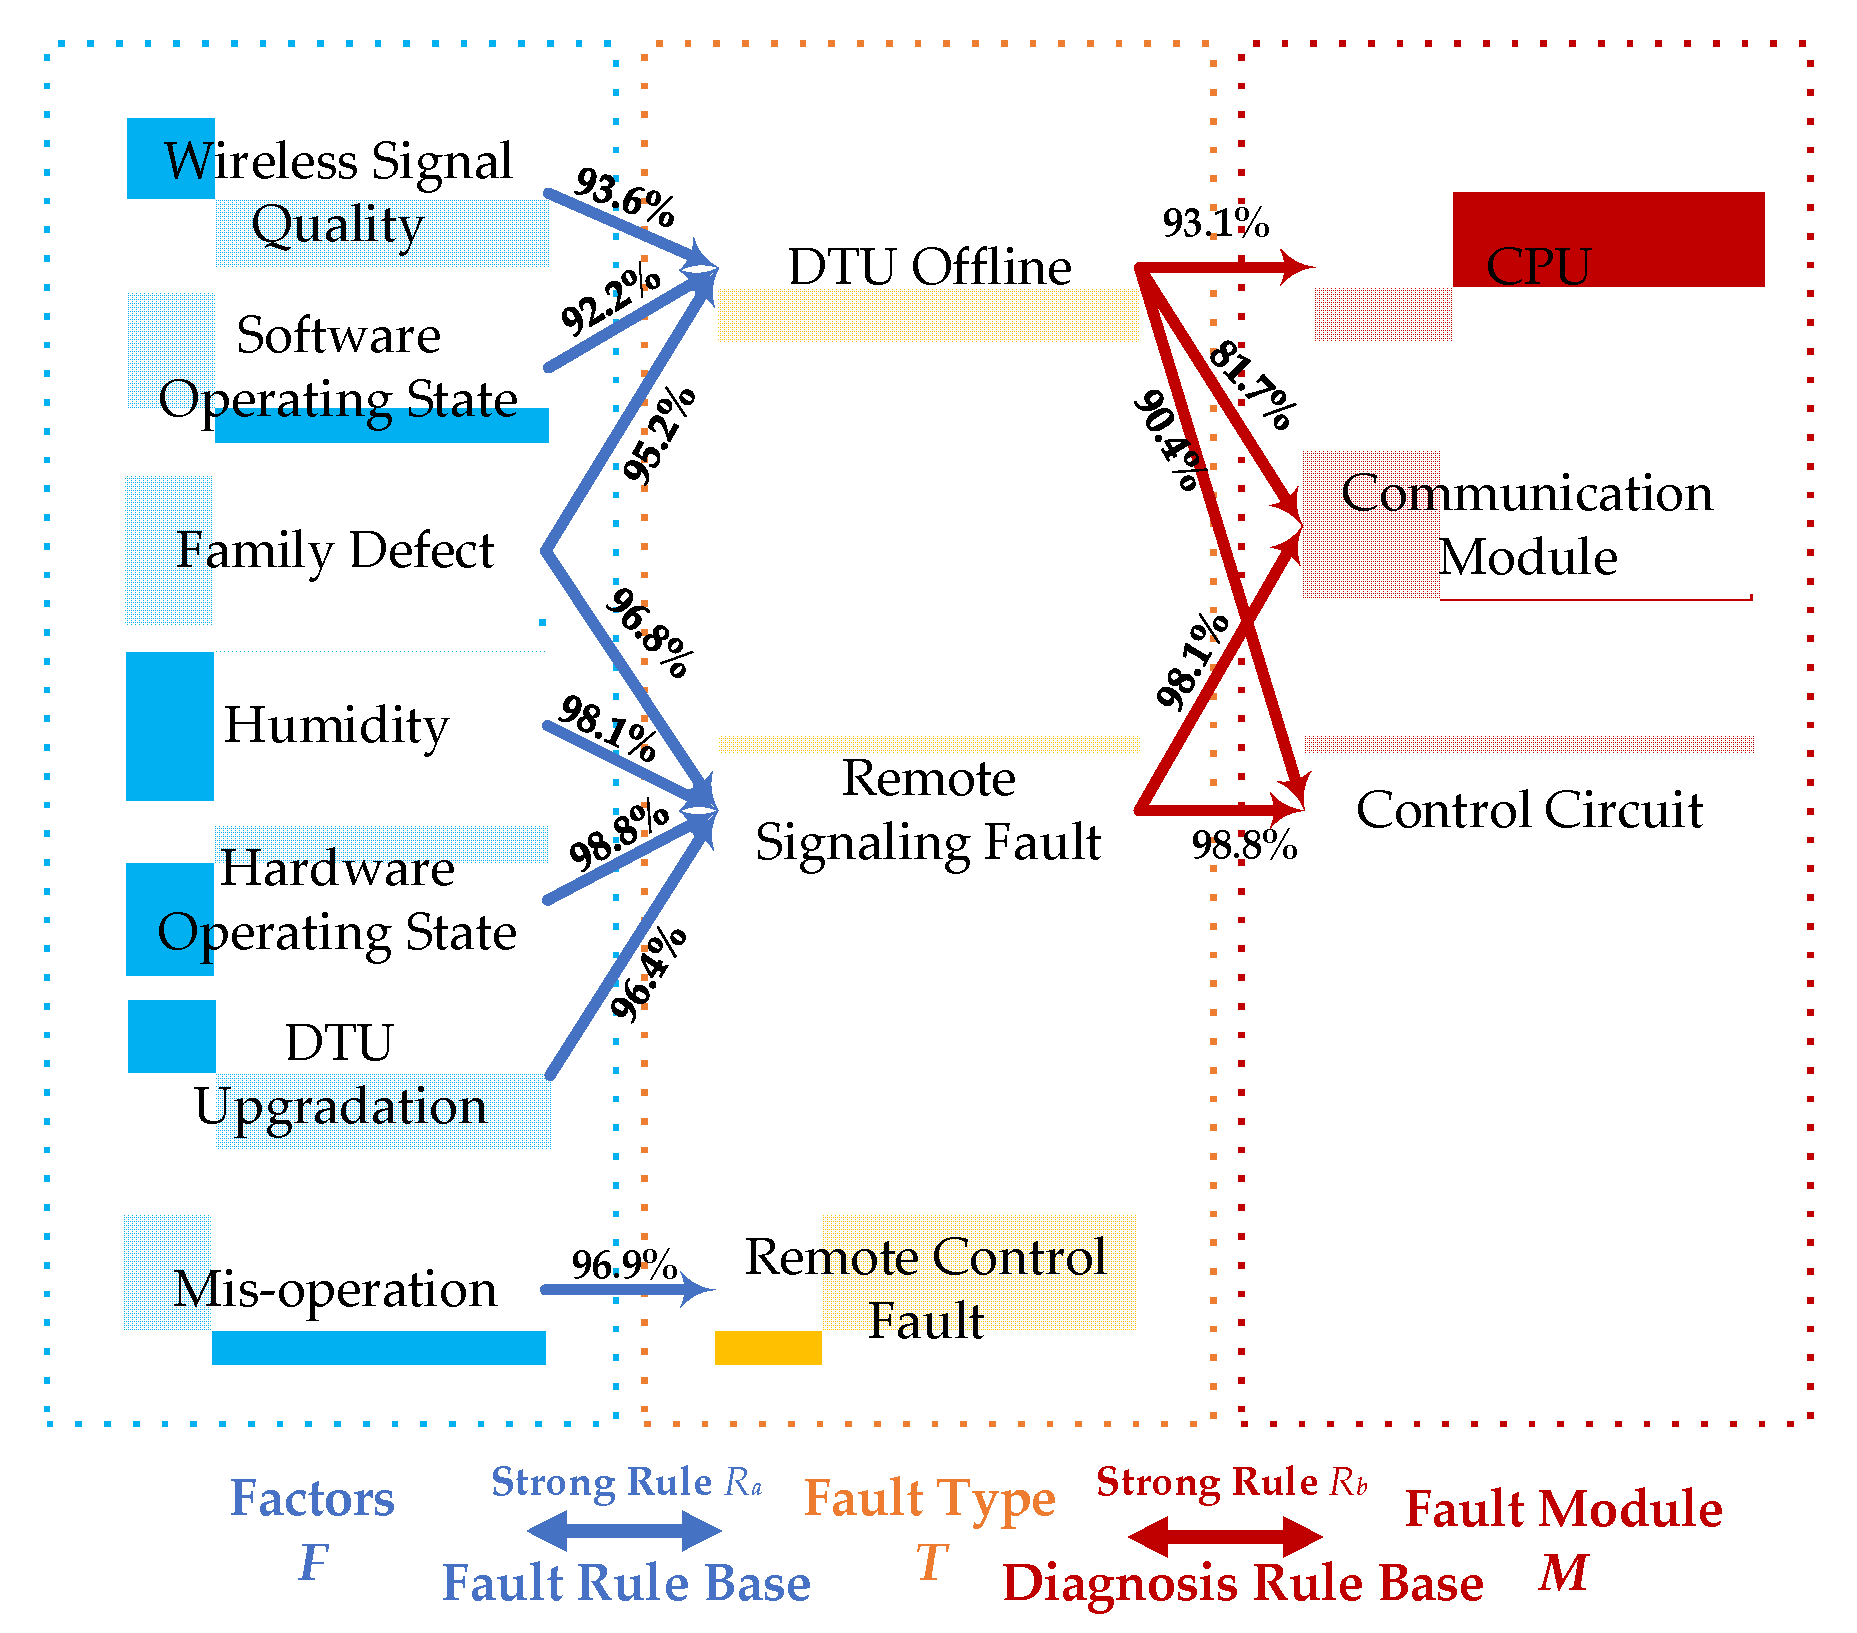
The formed two rule bases are shown in
Figure 6. The fault rule base comprised factors
F, fault type
T, and the confidence values of rules
Ra (between
F and
T). The diagnosis rule base included fault type
T, fault module
M, and the confidence values of rules
Rb.
The fault rule base and diagnosis rule base in
Figure 6 can be used to support planned maintenance and fault repairing, respectively.
5.2.1. Planned Maintenance
In some cases, wireless signal quality, software operating states, and family defects cause DTU offline. Family defects, humidity, hardware operating states, and DTU upgradation may lead to remote signaling faults. Mis-operation is likely to cause remote control faults. These eight rules form the initial fault rule base. In planned maintenance, when a certain type of fault happens, corresponding factors in the fault rule base should be of great concern. Taking measures to avoid those factors can lower DTU fault incidence in the future.
5.2.2. Fault Repairing
When DTU offline happens, a fault usually exists in the CPU module, communication module, or control circuit module. Based on the rank of rule confidence, the CPU module is investigated at first; then, the communication module and control circuit module are checked. When a remote signaling fault happens, a fault usually exists in the control circuit or communication module. These five rules form the initial diagnosis rule base. During fault repairing, modules in the diagnosis rule base should be inspected first. By these means, fault elimination time can be shortened.
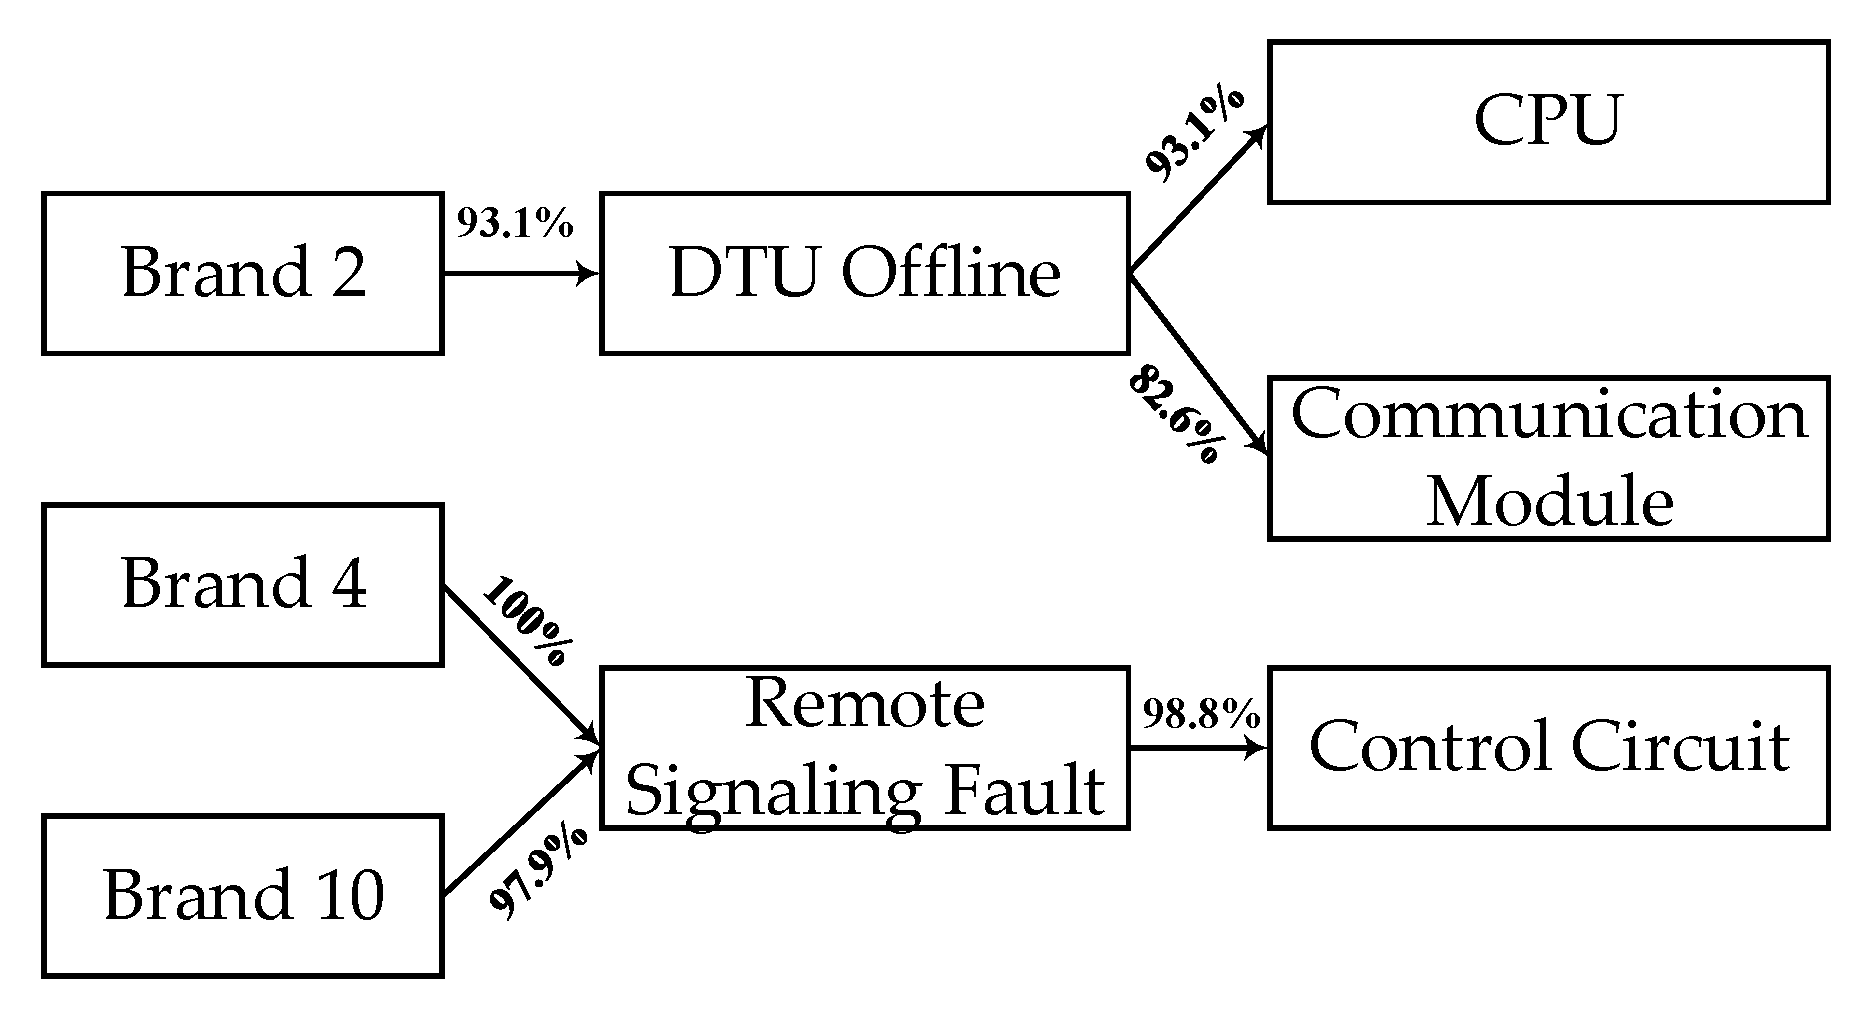
Strong rules involving brand information were not included in the above two rule bases, but they could be used to inform manufacturers about family defects of their products. These rules and their confidence values are shown in
Figure 7.
For instance, brand 2 should pay attention to the CPU and communication modules of its products as well as the DTU offline issue. Brand 4 and brand 10 should improve control circuit modules of their products and deal with remote signaling faults.
6. Application Example
A fault analysis model was constructed and inserted into a DTU device. This model was based on the proposed method. It contained rule bases obtained from a historical DTU fault database. Rule bases were updated regularly according to the newly generated DTU fault data. When a fault happened, information of the fault type was sent into this model. The outputs were the analysis results of possible factors and corresponding fault modules in the rule bases. Information of factors was used to guide planned maintenance and information of fault modules was used for fault repairing.
For comparison, this fault analysis model was incorporated into 1000 DTUs in a certain area of Nanjing in China, while the other 4600 DTUs in the same area remained unchanged. Initial rule bases were formed as depicted in
Figure 6. Based on the newly generated fault data, rule bases were updated every week. Additionally, planned maintenance was also scheduled on a weekly basis.
DTU with a fault analysis model is represented as DTU
1, the other type without the model is marked as DTU
2. From September 2020 to December 2020, fault times and fault rate are listed in
Table 6. Noted that fault times
FT (Equation (11)) are the average fault times of all devices in each group for 3 months, while fault rate
FR (Equation (12)) refers to fault times per device per hour.
where
N is the number of devices,
FTn is the fault times of
nth device throughout 3 months, and
t represents the total counted hours.
As can be seen from
Table 6, the fault times and fault rate of DTU
1 decreased to more than half of DTU
2. This was due to the prevention of risk factors in planned maintenance.
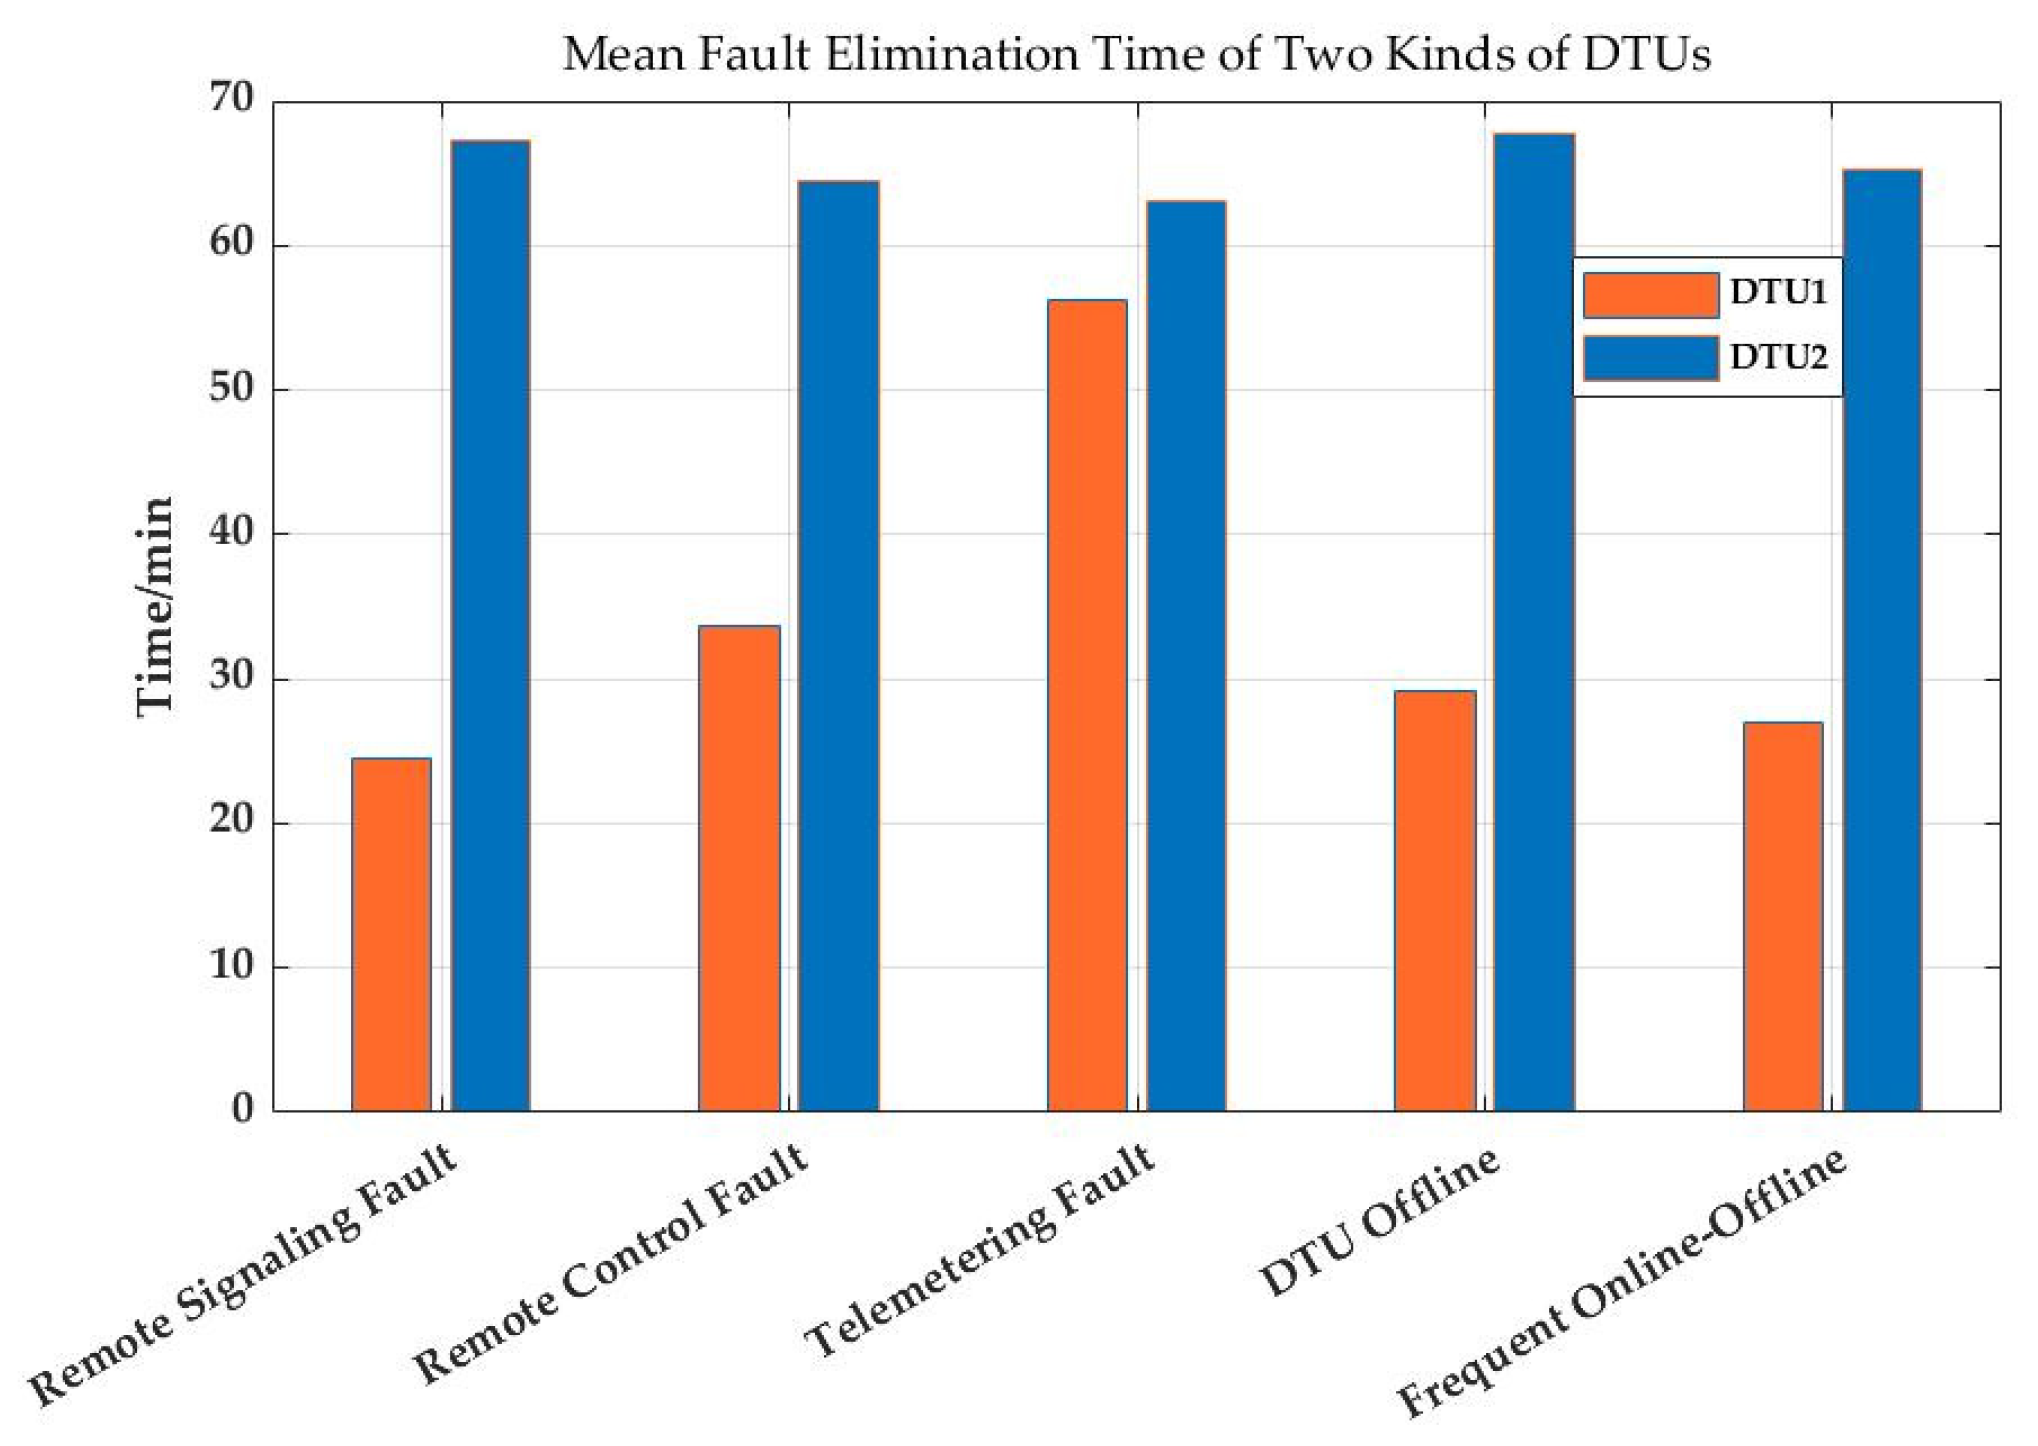
Mean fault elimination time in terms of different fault types is shown in
Figure 8. Fault elimination time is defined as the duration from the fault happening to the fault being eliminated.
As shown in
Figure 8, the mean fault elimination time of DTU
1 reduced to less than half of DTU
2 in terms of all fault types except the telemetering fault. Time reduction was due to the model’s guidance for engineers during fault repairing. In some cases, faults could be eliminated by restarting certain modules remotely; engineers no longer needed to be on the scene. This kind of saved time was also reflected in the reduction of mean fault elimination time.
As for the telemetering fault, the saved time of DTU1 was not as remarkable as other fault types. After analyzing the DTU fault database, it was found that the telemetering fault is not common in this area. The support value of the telemetering fault was 2.12%, while the support values of other common faults were 26.20% (remote control fault), 49.79% (remote signaling fault), and 21.54% (DTU offline). Therefore, the insufficient case of the telemetering fault limited the improvement of this model.
7. Discussion
The proposed method was intended for enhancing the efficiency of DTU maintenance work. Constructing a fault rule base and diagnosis rule base can support planned maintenance and fault repairing. This method showed a good performance in terms of lowering fault incidence and shortening fault elimination time. These improvements were due to the prevention of potential fault causes and guidance for fault repairing. Nonetheless, the proposed method also had some limitations:
As shown in
Figure 8, insufficient data limited the improvement of this method. It is reasonable since this is a data-driven method which required a certain amount of data to achieve satisfactory results.
- 2.
Results were not always reliable.
Since fault data was updated according to the real-time operation of DTU devices, newly generated rules were probably not in the initial rule bases and some of them might have been unreliable. Therefore, these new rules must be verified before they are incorporated into rule bases. Additionally, strong rules founded by association rule mining algorithms were sometimes redundant and repetitive; in this case, manual inspection is indispensable.
8. Conclusions and Future Work
This paper proposed a fault analysis method based on an association rule mining algorithm for DTU so as to improve the efficiency of fault elimination. The selection of algorithm for this method was proven to be reasonable through simulation, and the practicality of this method was proven by a realistic DTU fault database. This method can form fault rule bases and diagnosis rule bases, which can be used for supporting planned maintenance and fault repairing. In this way, DTU fault incidence can be reduced and fault elimination ability can be enhanced. Comparative experiment in the application example demonstrated the effectiveness of this method.
However, the performance of this method was not satisfying when not enough data were available. Moreover, since this method only relied on objective data, the results were not always reliable. A possible solution is to combine expertise to verify the generated rules as well as remove the redundant and invalid rules.
It is recommended that, with the successful application of this fault analysis and diagnosis method, more research that combines this objective data-driven method with subjective expertise should be conducted to improve the reliability of fault analysis. Additionally, machine-learning techniques can be incorporated into this method to analyze fault and estimate the state of devices so as to improve the accuracy of fault diagnosis. With the integration of more DTU devices, lifecycle management of devices should be studied to facilitate the application of this method and enhance its positive impacts. Moreover, in order to reduce maintenance pressure, future work can be conducted on eliminating manual processes and realizing intelligent maintenance.
Author Contributions
Conceptualization, X.Z and Y.T.; methodology, X.Z.; investigation, G.L.; resources, J.C.; writing—original draft preparation, X.Z.; writing—review and editing, Y.T.; supervision, Q.L.; project administration, X.N.; funding acquisition, Q.L. All authors have read and agreed to the published version of the manuscript.
Funding
This research was funded by State Grid Corporation of China. Program name: Research on automatic configuration and intelligent operation and maintenance technology of large-scale plug and play power distribution terminal. Grant number: SGJSNJ00KHJS2000556.
Institutional Review Board Statement
Not applicable.
Informed Consent Statement
Not applicable.
Data Availability Statement
Restrictions apply to the availability of these data. Data was obtained from State Grid Corporation of China. Data is available on request from the corresponding author.
Conflicts of Interest
The authors declare no conflict of interest.
References
- Gu, J.C.; Huang, Z.J.; Wang, J.M.; Hsu, L.C.; Yang, M.T. High Impedance Fault Detection in Overhead Distribution Feeders Using a DSP-Based Feeder Terminal Unit. IEEE Trans. Ind. Appl. 2021, 57, 179–186. [Google Scholar] [CrossRef]
- Xu, B.; Li, T.; Xue, Y. Smart distribution grid and distribution automation. Autom. Electr. Power Syst. 2009, 33, 38–41. [Google Scholar]
- Han, G.; Xu, B. Modeling of intelligent distribution terminal according to IEC61850. Electr. Power Autom. Equip. 2011, 31, 104–107. [Google Scholar]
- Han, G.; Xu, B.; Suonan, J.; Chen, Y. Implementation of automatic discovery technology for distribution terminal. Autom. Electr. Power Syst. 2012, 36, 82–85. [Google Scholar]
- Zhao, J.; Dong, Z.; Wen, F. Data science for energy systems: Theory, techniques and prospect. Autom. Electr. Power Syst. 2017, 41, 1–11, 19. [Google Scholar]
- Lin, C.E.; Ling, J.M.; Huang, C.L. An expert system for transformer fault diagnosis using dissolved gas analysis. IEEE Trans. Power Deliv. 1993, 8, 231–238. [Google Scholar] [CrossRef]
- Yongli, Z.; Yang, Y.H.; Hogg, B.W. An expert system for power systems fault analysis. IEEE Trans. Power Syst. 1994, 9, 503–509. [Google Scholar] [CrossRef]
- Minakawa, T.; Ichikawa, Y.; Kunugi, M. Development and implementation of a power system fault diagnosis expert system. IEEE Trans. Power Syst. 1995, 10, 932–940. [Google Scholar] [CrossRef]
- Rao, W.; Wang, F.; Ding, J. Family defect assessment of electric equipment based on improved hierarchical clustering method. Zhejiang Electr. Power 2013, 32, 9–13. [Google Scholar]
- Liu, M.; Wang, K.; Feng, S. Study of comprehensive state evaluation method for distribution terminal device. Mech. Electr. Inf. 2016, 36, 95–96. [Google Scholar]
- Zhu, J.; Leng, H.; Wang, Y. Research on state evaluation for distribution automation terminals. Distrib. Util. 2017, 34, 59–63. [Google Scholar]
- Cai, J.; Yang, C. Study on distribution automation terminal state evaluation method based on analytic hierarchy process. Guangxi Electr. Power 2018, 41, 6–9. [Google Scholar]
- Li, M.; Han, X.; Yang, M. Basic concept and theoretical study of condition-based maintenance for power transmission system. In Proceedings of the 2011 Communications in Computer and Information Science, Wuhan, China, 21 August 2011; pp. 43–52. [Google Scholar]
- Yang, Z.; Shen, Y.; Zhang, J. Online monitoring and state diagnosis method for distribution terminal battery. High. Volt. Eng. 2016, 42, 121–126. [Google Scholar]
- Zhang, P.; Su, Y.; Han, Y. Judgment on failure distribution type and estimation of failure rate for distribution terminals. Proc. CSU-EPSA. 2018, 30, 61–65. [Google Scholar]
- Bernieri, A.; Betta, G.; Pietrosanto, A. A neural network approach to instrument fault detection and isolation. In Proceedings of the 10th Anniversary IMTC/94 Advanced Technologies in I & M. 1994 IEEE Instrumentation and Measurement Technology Conference (Cat. No. 94CH3424-9), Hamamatsu, Japan, 10–12 May 1994; pp. 139–144. [Google Scholar]
- Zhang, Y.; Ding, X.; Liu, Y. An artificial neural network approach to transformer fault diagnosis. IEEE Trans. Power Deliv. 1996, 11, 1836–1841. [Google Scholar] [CrossRef]
- Meng, K.; Dong, Z.; Wang, D.H. A self-adaptive RBF neural network classifier for transformer fault analysis. IEEE Trans. Power Syst. 2010, 25, 1350–1360. [Google Scholar] [CrossRef]
- Yang, Q.; Li, J.; Le Blond, S. Artificial neural network based fault detection and fault location in the DC microgrid. Energy Procedia 2016, 103, 129–134. [Google Scholar] [CrossRef]
- Ganyun, L.V.; Haozhong, C.; Haibao, Z. Fault diagnosis of power transformer based on multi-layer SVM classifier. Electr. Power Syst. Res. 2005, 74, 1–7. [Google Scholar] [CrossRef]
- Bacha, K.; Souahlia, S.; Gossa, M. Power transformer fault diagnosis based on dissolved gas analysis by support vector machine. Electr. Power Syst. Res. 2012, 83, 73–79. [Google Scholar] [CrossRef]
- Bhattacharya, B.; Sinha, A. Intelligent fault analysis in electrical power grids. In Proceedings of the 2017 IEEE 29th International Conference on Tools with Artificial Intelligence (ICTAI), Boston, MA, USA, 6–8 November 2017; pp. 985–990. [Google Scholar]
- Chen, M.J.; Lan, S.; Chen, D.Y. Machine learning based one-terminal fault areas detection in HVDC transmission system. In Proceedings of the 2018 8th International Conference on Power and Energy Systems (ICPES), Colombo, Sri Lanka, 21–22 December 2018; pp. 278–282. [Google Scholar]
- Lee, L.; Cheng, Y.; Xie, L. An integrated method of set pair analysis and association rule for fault diagnosis of power transformers. IEEE Trans. Dielectr. Electr. Insul. 2015, 22, 2368–2378. [Google Scholar]
- Sheng, G.; Hou, H.; Jiang, X. A novel association rule mining method of big data for power transformers state parameters based on probabilistic graph model. IEEE Trans. Smart Grid 2016, 9, 695–702. [Google Scholar] [CrossRef]
- Chen, Y.; Du, X.; Zhou, L. Transformer defect correlation analysis based on apriori algorithm. In Proceedings of the 2016 IEEE International Conference on High Voltage Engineering and Application, Chengdu, China, 19 September 2016. [Google Scholar]
- Doostan, M.; Chowdhury, B.H. Power distribution system fault cause analysis by using association rule mining. Electr. Power Syst. Res. 2017, 152, 140–147. [Google Scholar] [CrossRef]
- Zhang, Y.; Hu, C.; Huang, S. Apriori algorithm based data mining and analysis method for secondary device defects. Autom. Electr. Power Syst. 2017, 41, 147–151, 163. [Google Scholar]
- Li, H.; Wang, Y.; Liang, X. Fault prediction of power transformer by association rules and markov. In Proceedings of the 2018 IEEE International Conference on High Voltage Engineering and Application (ICHVE), Athens, Greece, 10 September 2018. [Google Scholar]
- Guo, C.; Wang, B.; Wu, Z. Transformer failure diagnosis using fuzzy association rule mining combined with case-based reasoning. IET Gener. Trans. Distrib. 2020, 14, 2202–2208. [Google Scholar] [CrossRef]
- Lin, D.; Liu, Q.; Li, F. Optimal Placement of Multiple Feeder Terminal Units Using Intelligent Algorithms. Appl. Sci. 2020, 10, 299. [Google Scholar] [CrossRef]
- Sodin, D.; Rudež, U.; Mihelin, M. Advanced Edge-Cloud Computing Framework for Automated PMU-Based Fault Localization in Distribution Networks. Appl. Sci. 2021, 11, 3100. [Google Scholar] [CrossRef]
- Tao, W.; Ma, M.; Fang, C. Design and Application of a Distribution Network Phasor Data Concentrator. Appl. Sci. 2020, 10, 2942. [Google Scholar] [CrossRef]
- Orozco-Henao, C.; Suman Bretas, A.; Marín-Quintero, J. Adaptive impedance-based fault location algorithm for active distribution networks. Appl. Sci. 2018, 8, 1563. [Google Scholar] [CrossRef]
- Li, G.; Chen, Q.; Zhang, J. Novel Faulted Section Location Method for Distribution Network Based on Status Information of Fault Indicating Equipment. Appl. Sci. 2020, 10, 5910. [Google Scholar] [CrossRef]
- Agrawal, R.; Imieliński, T.; Swami, A. Mining association rules between sets of items in large databases. In Proceedings of the 1993 ACM SIGMOD International Conference on Management of Data, Washington, DC, USA, 26–28 May 1993; pp. 207–216. [Google Scholar]
- Zaki, M.J. Scalable algorithms for association mining. IEEE Trans. Knowl. Data Eng. 2000, 12, 372–390. [Google Scholar] [CrossRef]
- Han, J.; Pei, J.; Yin, Y. Mining frequent patterns without candidate generation. ACM Sigmod Rec. 2000, 29, 1–12. [Google Scholar] [CrossRef]
- Agrawal, R.; Srikant, R. Fast algorithms for mining association rules. In Proceedings of the 20th International Conference on Very Large Data Bases, Santiago, Chile, 12–15 September 1994; pp. 487–499. [Google Scholar]
| Publisher’s Note: MDPI stays neutral with regard to jurisdictional claims in published maps and institutional affiliations. |
© 2021 by the authors. Licensee MDPI, Basel, Switzerland. This article is an open access article distributed under the terms and conditions of the Creative Commons Attribution (CC BY) license (https://creativecommons.org/licenses/by/4.0/).


