Article

The Optimization Analysis for the Original and Manipulation Identification of Illegally Filmed Images

Department of Computer Science, Kyonggi University, Suwon-si 16227, Gyeonggi-do, Korea
*
Author to whom correspondence should be addressed.
Appl. Sci. 2021, 11(11), 5220; https://doi.org/10.3390/app11115220
Submission received: 19 April 2021 / Revised: 27 May 2021 / Accepted: 31 May 2021 / Published: 4 June 2021
(This article belongs to the Special Issue Security and Privacy for Software and Network)

Abstract

:
Illegally filmed images, the sharing of non-consensually filmed images over social media, and the secret recording and distribution of celebrity images are increasing. To catch distributors of illegally filmed images, many investigation techniques based on an analysis of the file attribute information of the original images have been introduced. As forensic science advances, various types of anti-forensic technologies are being produced, requiring investigators to open and analyze all videos from the suspect’s storage devices, raising the question of the invasion of privacy during the investigation. The suspect can even file a lawsuit, which makes issuing a warrant and conducting an investigation difficult. Thus, it is necessary to detect the original and manipulated images without needing to directly go through multiple videos. We propose an optimization analysis and detection method for extracting original and manipulated images from seized devices of suspects. In addition, to increase the detection rate of both original and manipulated images, we suggest a precise measurement approach for comparative thresholds. Thus, the proposed method is a new digital forensic methodology for comparing and identifying original and manipulated images accurately without the need for opening videos individually in a suspect’s mobile device.

1. Introduction

The illegal filming of videos is increasing [1,2,3]. This means that “digital sex crimes” are rampant regardless of the popularity or occupation of the victim [4,5]. According to the 2018 statistics of the Korean National Police Agency, nearly 16.2 cases of illegal filming occur each day, and the number of people arrested for illegal filming and distribution has been increasing annually. Most illegal filming cases involve the use of smartphones [6]. Illegally filmed images are distributed over social media, which support easy uploading and sharing. This indicates that digital sex crimes are more socially common than people realize. It also means that uploading and sharing illegally filmed images in SNS (Social Network Service) chat rooms without compunction is rampant within society. When images filmed illegally through smartphones are distributed over social media, victims experience a violation of their human rights and find it tough to live a normal life. To minimize these consequences, it is necessary to detect and remove distributed images as quickly as possible. Many studies have been conducted on the investigation method to detect illegal distribution of videos. However, various anti-forensic techniques have also been evolving to keep up in the competition. When a criminal suspect maliciously edits an original video or creates clip videos, the file type and hash value of the video is changed, denying the universal forensic of using hash value. In particular, if a suspect distributes illegal videos on SNS, the size of the file is limited and inevitably edited. Eventually, we find that the method of analysis by comparing hash values in edited video files has limitations in accuracy. Despite this, not much research is done on resolving this issue. The only way available for the time being is to manually watch numerous videos one by one, which causes many problems. One of them is the lack of human resource and time to watch multiple videos. In addition, considering smartphones contain volumes of personal information, it is not easy to seize and investigate such devices due to privacy invasion concerns. Victims’ secondary damage also needs to be taken into consideration. Therefore, a method for detecting original and manipulated images without opening multiple videos directly is required. This paper proposes an image extraction methodology for identifying all original and manipulated images through optimal forensics applied to the suspect’s mobile device, without the need to open the videos individually. With the proposed method, the original and manipulated images are cropped in a frame unit, and the similarity between the original and manipulated images is analyzed using a histogram. The proposed method is capable of checking whether two images are the same and detecting images optimally to cope with increased crime. The contributions of the present study are as follows:
  • First, the proposed method shortens the investigation time. The distribution of original videos is detected using hash values. However, to detect manipulated images and videos, going through massive volumes of images one by one is unavoidable. Our proposed method is capable of optimally cropping a video into the unit of an image and detecting both original and manipulated videos more quickly than the manual methods.
  • Second, it makes it possible to avoid the limitations imposed by search and seizure laws. Because smartphones may include a lot of personal information, it is difficult to obtain search and seizure warrants for them. With the proposed method, we compare the similarity of histogram information among comparison images without checking the video files identified individually during device scanning.
This paper comprises the following: Section 2 describes related studies on image similarity comparison algorithms and an optimal comparison between images. In Section 3, the overall process of this study and the proposed method are described. In Section 4, the experimental environment and scenario-based experiments and results are described. Finally, in Section 5, we provide some concluding remarks.

2. Related Work

2.1. Hash-Based Search

Searching for files using hash values is one of the most typical investigative methods in forensics. Related studies [7,8,9,10] have focused on fast file searches based on hash values. Simson et al. [7] suggested the HASH-SETS algorithm to determine whether a particular file exists and the HASH-RUNS algorithm for reassembling files through a file block hash database. Both algorithms solve the problem of non-verification blocks and provide the results for analyzers who find target data in the searched media. However, if an encrypted file system is included in the media, these algorithms need to decrypt the file system first to access unencrypted blocks. In terms of forensic identification, Joel et al. [8] and three others proposed a sector hash for target file detection, which is aimed at finding individual file blocks in disk sectors, rather than searching for individual files in a file system. By hashing the individually sampled main drive-in sector boundaries first and then comparing them with an already established database, it is possible to process raw media with no reference to a basic file system. However, this method has the limitation of selecting a proper file block size that needs to balance the file identification function. Gandeva et al. [9] conducted a post-investigation of digital crimes in the Telegram messenger of Android devices and analyzed residual data that can be used as digital evidence of cybercrimes. In particular, the researcher used SHA-1 as a hash function to analyze the content of digital crimes along with the probabilities of criminal cases and to enhance the legitimacy of digital evidence in a court of law. The author suggested using it as the query data in forensic investigations and as query data of analysis related to the residual data search of cybercrime cases. When a sector-based scan is applied to recover the remaining fragments of illegal files in digital storage, a brute-force attack requires a time-consuming approach. For this reason, to accelerate the process, Dandass [10] proposed a technique for calculating and comparing the hash-based signature of a sector. Similar to the studies on hash function-based file identification [7,8,9,10], this study also aims to identify files quickly among massive data. However, in the case of video files, if their original files are edited even slightly, their hash values are changed completely, making it difficult to identify original and manipulated criminal videos. Unlike previous papers, this paper proposes a method that identify similar videos regardless of whether the meta value of the file is encrypted or not. The study by Gandeva et al. [9] is consistent with this study in that research is conducted on the assumption that digital crime content is widely distributed over Social media. The present study, However, if the distributed video is an edited video rather than an original video, it is difficult to find all related crime videos through hash-based research. The method proposed in this paper is a study comparing histogram similarity between videos, rather than using hash value that completely changes even if only one bit is different. Therefore, if the appropriate threshold is selected, other related similar crime videos are also possible for identification, revealing the remaining crimes of the suspect. In other words, it differs from previous papers in that it is able to identify not only the original video but also manipulated video.

2.2. Similar Video Sile Comparison

Shiguo et al. [11] and Indyk et al. [12] compared similar images by setting the shot boundary of a video sequence as a feature. However, because their methods use only shot boundary frames, it is difficult to identify similar images in a short video clip. To detect illegally filmed videos through an intricate comparison of similar videos, Alongbar [13] proposed an illegal video detection method using fingerprint-based visual hashing. The proposed method involves creating the perceived hash code with a fixed length in a video segment robust to a clear distortion or attack, such as scaling, rotation, compression, frame speed change, frame drop, and contrast enhancement.
This approach is consistent with this study in that in both cases, a representative frame is set up, and feature extraction and comparison are based on the content of videos. Since crime videos most likely do not have copyright, similar images cannot be detected using the characteristic values of the copyright. This paper is a study with aim of different field, to detect crime videos without copyrights being distributed using sns. The proposed method in this paper comparatively analyzes the similarity between the original and manipulated videos to find the suspect. In movies, scene transition occurs suddenly, whereas in illegally filmed videos, videos are filmed with mobile device (i.e., smartphones), and therefore scenes are transited gradually. Therefore, the proposed method in the present study is different from the one proposed by Alongbar [13] in terms of representative frame setting and comparative analysis. In the case of illegally filmed images, various studies have been conducted on the methods used for detecting equal image files or extracting video files using hash values, a file header, and a signature, among other factors [14,15,16,17]. Such methods, however, suffer from limitations in identifying videos manipulated from illegally filmed images. Multiple studies [18,19,20] focused on the detection of similar videos but failed to consider the filming and distribution features of illegally filmed videos. Therefore, it is necessary to develop a new comparative method for identifying the original and manipulated videos in line with the filming feature. Manipulated videos are likely to be critical evidence during an investigation and should therefore be detected for crime prevention. In Section 3, we suggest a method for detecting manipulated videos.

3. Proposed Method for Comparing between Original and Manipulated Videos

When manipulated videos distributed over social media are collected, their original videos are likely to be stored in the mobile devices of the suspects. These suspects are highly likely to include the most provocative parts and edit out other parts of the original versions before distributing the manipulated video. An experiment using a histogram image comparison algorithm was conducted based on the assumption that an original video, its manipulated version, and the entire video spread over social media are similar with a change in the hash value.

3.1. Forensic Process of Videos

The video forensics process consists of three steps. Figure 1 illustrates the overall process. In the first step, video scaling, images of videos are cropped frame by frame (A), and image histograms are calculated (B) for easy comparison. These images are extracted from the videos. In the second step, an image similarity comparison, a search for equal videos within an optimal time, (C) and an image histogram-based similarity comparison algorithm (D) are applied. The third step involves interpreting the results. In this step, an appropriate threshold is selected, and based on the results, it is determined whether the videos are equal, similar, or different.

3.2. Description of Image Processing, Optimization Search Method, and Comparison Algorithm

In Section 3.2, each of the stages A, B, C, and D illustrated in Figure 1 are described. In Section 3.2.1, the method (stage B) used for calculating the image histogram is detailed. In Section 3.2.2, the method (stage A) for cropping images using the frame unit is described, and the method (stage C) for finding videos optimally by comparing a reference video with the video in a suspect’s mobile device is proposed. In Section 3.2.3, the histogram comparison algorithm (stage D) used to compare images is described.

3.2.1. Image Histogram

As the first step shown in Figure 1 (Video scale), a reference video for investigation and a video for comparison (or a comparison video) are cropped based on the frame unit, and continuous images are then generated. Figure 2 illustrates the process of normalizing cropped image frames in the histograms. Each pixel value in the image frames was converted into an HSV value (H, hue; S, saturation; V, value (brightness)). The histograms for channels H and S were calculated. The H value is within the range of zero to 180. S presents a value ranging from 0 zero 256. These histograms were normalized in values of between zero and 1.

3.2.2. Optimized Comparison Search Technique for Original and Manipulated Videos

It can take a long time to compare a reference video with the videos in a suspects’ mobile devices because the number of videos is large. Therefore, an optimized comparison search technique is proposed in this study for finding equal videos within an optimal time.
We summarize the definition of the optimization as follows.
  • Reduce the number of images: We reduce the total number of analytical images to be compared by predetermining the number of images (frames) extracted based on the runtime of the video (Table 1).
  • Reduce the search time: We reduced the search time of the representative image determined by the investigator by referring to the quicksort and quickselect method (Table 2).
  • Reduce the misuse detection rate: We quantitatively predefined the attribute information of the crime video and reduced the misuse detection rate by setting each threshold for the filming properties (Table 5).
Table 1 lists the number of frames for a video based on its running time in stage A. This paper focuses on a search technique for finding crime videos. Crime videos feature gradual, rather than rapid, scene transitions, or long static framing over time. If a crime video is filmed for the purpose of distribution or possession, scenes are not changed every second. Extracting multiple frames per second requires a long time but is meaningless. Therefore, an appropriate number of image frames reflecting the features of crime videos are extracted according to the video running time, which is based on the file size to be distributed over social media. For a video whose running time is between 1 and 5 min, three frames per second are extracted. For a video whose running time is between 5 and 8 min, two frames per second are extracted. For a video whose running time is 8 to 15 min, one frame per second is extracted. For a video whose running time is between 15 and 20 min, one frame every two seconds is extracted. Finally, for a video whose running time is over 20 min, one frame is extracted every three seconds. A segment categorized by the investigator as a crime video clip is called a query video. As shown in Table 1, the number of frames to be extracted is determined according to the running time of the query video. The frames of the comparative video were also extracted according to the running time.
In stage C of Figure 1, the query frame is compared with a comparison frame. In the case of general movies, illegally filmed videos, crime videos, and other kinds of videos, their “highlights” start from the middle or second half of the videos. To reduce the time in searching for the query frame, the proposed method searches the middle section, the beginning, and the end and repeats the process, excluding the searched frames, until the whole video is scanned. The process refers to the quicksort [21] method.
The process of comparing a query video with a comparison video is expressed in the pseudocode in Figure 3. The first to last M frames of a query video are labeled Q1, Q2, Q3, …, Qm, respectively. The first to last N frames of a comparison video are set to A1, A2, …, An, respectively. The first query frame Q1 is compared with the middle of the comparison frame, or An/2. The search is processed as many times as the continuous frame units (k frames) in Table 1. If the frames are not concluded to be similar based on the results of the search, the comparison frame is changed to A1, and k frames are compared again. From the middle frame, k frames are continuously compared, and then from the first frame, k frames are continuously compared. Thus, the search sequence is determined. The pseudocode is described in detail as follows:
Here, ⓐ is the base case, where the total number of frames of a comparison is smaller than the number of a continuous section composed of k frames. In this case, frames A1 through An are compared in order.
Next, ⓑ is a similarity comparison. If a query frame is similar to a comparison frame, both frames shift to the next frame. If not similar, the query frame remains unchanged, but the comparison frame shifts one frame, and the comparison continues.
In ⓒ, ⓓ, and ⓔ, the sequence comparison to sections of k frames is conducted from the center. The first frames and last frames of the video are then compared, which is considered a single cycle. This cycle repeats, excluding the already compared frames, until the ending conditions are met. In ⓒ, after a shift from the middle frame to k frames away from the middle, the location of the comparison frame comes back to the front. In ⓓ, after the shift from the front to the k section, the frame moves to the back. In ⓔ, after the shift from the back to the k section, a frame goes to the middle. If the compared frames are duplicates, they are removed. When the comparison of all frames finishes, the WHILE statement ends. In ⓕ, if the number of similarities is more than 10 as a result of a frame comparison, no more inspections are needed, and thus the WHILE statement ends and it is determined that “the two videos are similar.”

3.2.3. Similarity Comparison Algorithm

The histogram presents the distribution of the pixel values of an image. Similar images have a similar distribution of pixel values. In stage B of Figure 1, an image is presented as a normalized histogram. In stage D, three comparison algorithms, i.e., correlation [22], intersection [23], and Bhattacharyya distance [24], are applied to the histogram of a query video and the histogram of a comparison video to find equal videos. The reason for the application of the three algorithms is to supplement the disadvantages of each algorithm and enhance their advantages. Because the correlation-based algorithm compares the number of pixels with equal hues, the match rate is different depending on the shutter speed. The intersection-based algorithm has the highest match rate. The Bhattacharyya distance-based algorithm is slower but more accurate than intersection-based algorithms.
d ( H 1 , H 2 ) = I ( H 1 ( I ) H 1 ¯ ) ( H 2 ( I ) H 2 ¯ ) I ( H 1 ( I ) H 2 ¯ ) 2 I ( H 2 ( I ) H 2 ¯ ) 2
H k ¯ = 1 N J H K ( J )
H1, H2: histogram (query frame, comparison frame)
I: bin value of hue and saturation
N: the total bin count of hue and saturation
K: a random image frame
Equations (1) and (2) present the formulas for the correlation algorithm. In terms of a correlation-based histogram comparison, if histograms are matched completely, the result value is 1; if not matched completely, −1; and if not correlated, 0. In addition, H1 is the histogram of a query frame, and H2 is the histogram of a comparison frame. Moreover, I is the value of the X-axis of the histogram, which represents the bin value of the hue and saturation, and N is the total number of X-axis values of the histogram: The hue is 180, and the saturation is 256. Here, K indicates a frame.
d ( H 1 , H 2 ) = I min ( H 1 ( I ) , H 2 ( I ) )
Equation (3) is the formula for the intersection-based algorithm of two histograms. If normalized histograms are matched completely, the result value is zero and if not matched completely, the value is 1.
d ( H 1 , H 2 ) = 1 1 H 1 ¯ H 2 ¯ N 2 I H 1 ( I ) × H 2 ( I )
Equation (4) formulates the Bhattacharyya distance-based algorithm. If the two videos to be compared are matched completely, the Bhattacharyya distance d is 0. The lower the similarity, the closer the distance is to 1.
If two videos are similar to the results of the three algorithms applied to 1 frame, and if more than ten similarity results per frame are drawn repeatedly, 2 videos are equal or similar.

4. Experiment

4.1. Experimental Environment

Currently, the illegal filming of videos with mobile devices (i.e., smartphones) are on the rise. Considering this fact, videos filmed with a smartphone were used in this experiment. A video similarity comparison analysis code was written using Python3.7 (opencv). In the case of illegal filming and distribution of videos, the suspect is present to start the investigation. To identify not only original but also manipulated videos, this study sets the similarity threshold according to the features of illegally filmed videos. Based on the set threshold and the optimized search method introduced in Section 3, two experimental scenarios were designed.

4.2. Threshold Estimation and Scenario-Based Experimental Results

In Section 4.2.1, thresholds of correlation, intersection, and Bhattacharyya algorithms are set to detect manipulated videos in a similarity comparison. In Section 4.2.2, according to whether an investigator’s reference video is original or manipulated, a similar video is searched for under each scenario.

4.2.1. Threshold Estimation

An experiment was conducted to estimate the similarity comparison threshold. If a threshold is set to a low value, two different videos are considered to be equal. If the threshold is set too high, a manipulated video is considered to be unrelated. Because this experiment focused on the detection of all crime videos, a threshold was set, even if different videos were recognized as similar. Although the videos used during the experiment were not based on actual crime videos, they reflected the features of illegally filmed videos. As shown in Table 3, the videos were classified according to the criteria of brightness, object perspective, and shooting angle.
Table 4 shows the eight environments created through the intersection of the features. All videos were classified into eight experimental environments. Each environment had 311 frames of similar videos. Therefore, the experiment used frames with a total of 2488 frames, and the threshold for each environment was set.
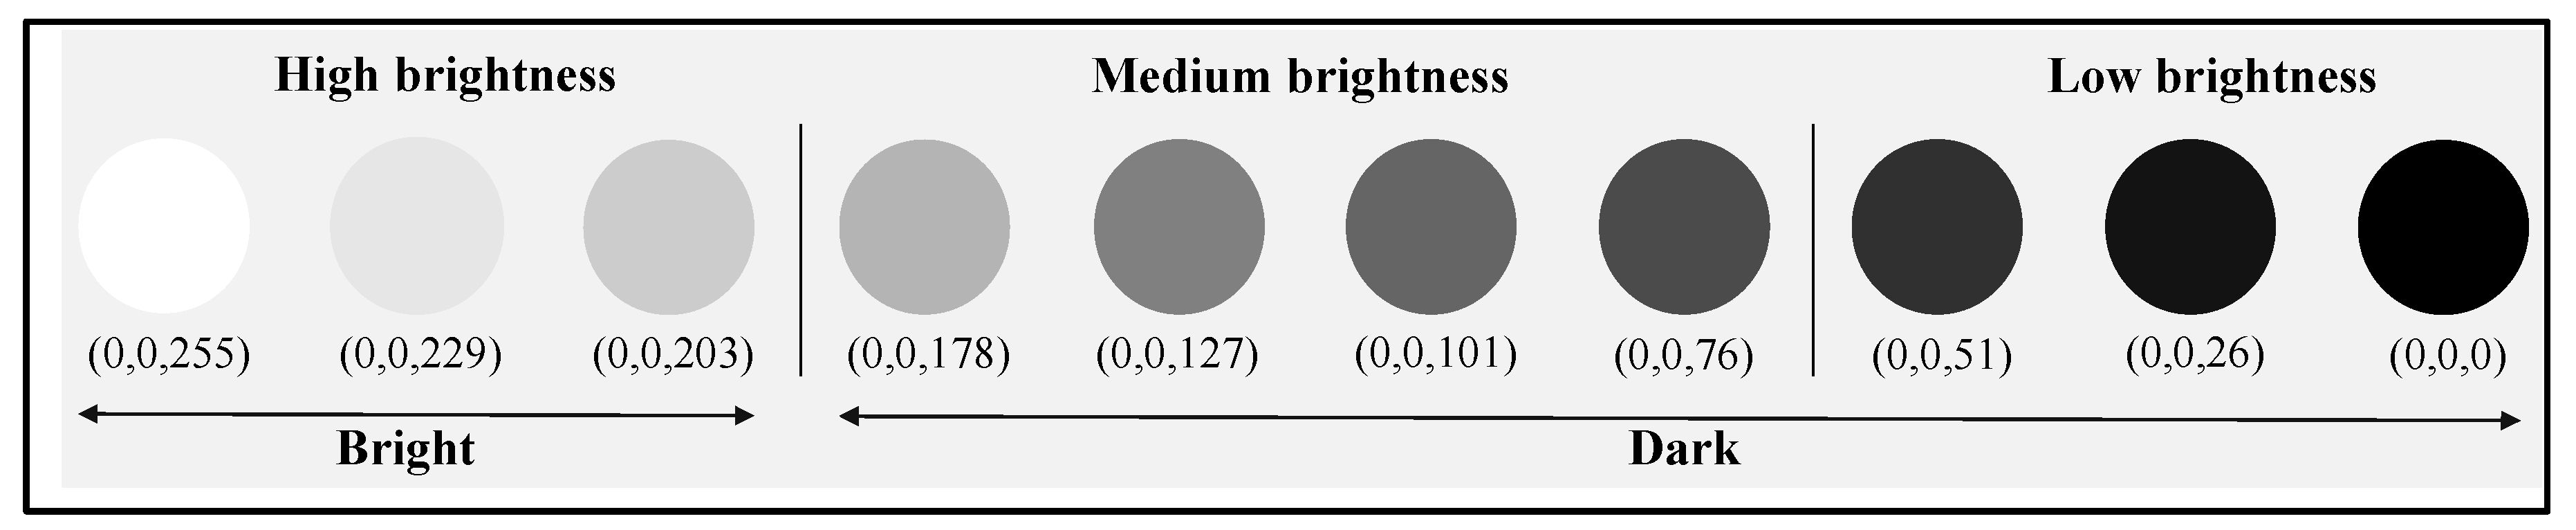
The brightness of an image is based on the value of V in the HSV, which ranges from zero to 255. As shown in Figure 4, brightness is classified as high, medium, or low. In this experiment, if a video’s V value ranged from 203 to 255, the video was considered bright; if the V value was between 0 and 202, the video was considered dark.
Figure 5 illustrates the criteria for perspective and shooting angle. The comparison in terms of perspective was based on how far or near an object is. The target object must be determined by an investigator. Because the perspective is a qualitative area, an investigator should determine how far or near an object is. During this experiment, a nearby object was shot within a 1 m distance from the camera; in addition, a distant object was shot at a distance of at least 1-m from the camera. The shooting angle is classified into a middle angle (the horizontal angle of a camera for an object) and high angle (from-top-to-bottom angle of a camera for an object). The shooting angle was also a qualitative area. Therefore, an investigator should select the shooting angle type based on judgment.
Figure 6a illustrates a graph of correlation similarities for similar videos in an BNM environment. In the correlation algorithm-based histogram comparison, the comparison is evaluated into a number with a scale of 1 to −1, with 1 being identical, −1 being a perfectly reversed image frame, and zero being uncorrelated. To find appropriate thresholds, this study selected frames with noticeable changes of objects and used them as experimental data, rather than the frames that look similar with the naked eye. As for the experimental data used in this study, exceptional situations arising in illegally filmed videos, such as shifting an object horizontally, making an object disappear temporarily, or adding a different object to its surroundings while the shooting angle remains unchanged in a single space, were taken into consideration. To find a minimum threshold, this study moved an object as much as possible in the comparative experiment. Even if two frames look totally different with the naked eye, they are sometimes considered similar in similarity comparisons. In such a case, a comparison similarity becomes an outlier. With the similarities of the frames, variance of a sample was calculated. Among 311 frames, outliers were removed, and their mean was calculated. In this way, a threshold was estimated. The threshold of the correlation algorithm was set as 0.47 or more. Figure 6b illustrates the graph of intersection similarities for similar videos in the BNM environment. In the intersection algorithm-based similarity comparison, if two frames to be compared are completely matched, the resulting value is 1, and if not matched completely, the value is zero. The selection of experimental data and the experiment process are the same as in Figure 4. As a result, the similar frame threshold determined by the intersection algorithm is 0.48 or more. Figure 6c illustrates the graph of Bhattacharyya similarities for similar videos within the BNM environment. In the Bhattacharyya distance-based comparison, if two frames to be compared are matched completely, the resulting value is zero, whereas the less similar they are, the closer the distance value is to 1. The selection of the experimental data and experiment process are the same as in Figure 6a. As a result, the similar frame threshold determined by the Bhattacharyya algorithm is 0.52 or less. Seven other environments were also implemented in the same way. Table 5 shows the thresholds in eight different environments.
In Section 4.2.2 and Section 4.2.3, scenarios based on the above thresholds are presented. In the experiments, similar videos were identified according to whether the investigator’s reference video was original or manipulated.

4.2.2. Scenario 1

In scenario 1, the investigators secured manipulated videos and detected original and manipulated videos from a suspect’s mobile device.
Table 6 shows the manipulated video secured by investigators (BNM_E) and the query video, which is the query section selected by the investigators within BNM_E. Under this scenario, the investigator set the whole BNM_E as a query section and ran the test. The video names in Table 4 show the video criteria. If a video is original, it is labeled ‘O’ (original) after the underscore (_); if manipulated, it is labeled ‘E’ (edit); and if unrelated to an original video, it is labeled ‘D’ (different).
Table 7 shows videos of a suspect’s mobile device. As shown in Figure 7, these videos were used for an optimized comparison with the query video.
The similarity comparison between videos is applied to scenario 1, and each of the following steps is applied:
Step 1.
Determine a query section in a reference video.
In scenario 1, the entire reference video is a query section.
Step 2.
Cut a video frame-by-frame based on Table 1.
Step 3.
Cut a comparison video frame-by-frame based on Table 1.
The number of frames is checked, and the unit of frame continuity is determined based on Table 2.
Step 4.
Process similarity comparison from the middle of the running time of the comparison video based on the frame continuity unit.
Step 5.
Detect a video that ends up being similar on the basis of the thresholds in Table 5, and then go to the next video. If not similar, go to the next video.
Step 6.
In the next video, repeat the process from Step 3.
Figure 8a illustrates the result from the correlation similarity comparison with the videos in a suspect’s mobile device under scenario 1. The suspect’s mobile device has five videos: three videos irrelevant to the query video (DNM_D, Dark+Near+Middle_Different videos; BNM_D, Bright+Near+Middle_Different video; and BNH_D, Brighy+Near+High_Different video), one original video of the query video (BNM_O, Bright+Near+Middle_Original video), and one manipulated video (BNM_E, Bright+Near+Middle_Edit video). Because these five videos have a different running times, their total number of extracted frames are different. A comparison was carried out in the order of videos listed in Table 7. Beginning with the middle of the total frame number for each video, a frame was compared with the query frame in accord with the pseudocode shown in Figure 3. After that, a similar video was identified based on the BNM threshold of Table 5. If all results from the three algorithms for one frame were within the range of thresholds for over 10 separate trials, the comparison process stopped and the video was identified as identical or manipulated. For the three videos irrelevant to the query video (DNM_D, BNM_D, BNH_D), the optimization search began from the middle of the video in line with the pseudocode shown in Figure 3. As a result, no frames had a similarity of 0.47 or more in terms of the threshold of the correlation algorithm under the BNM environment. For this reason, after all frames were searched, the comparison process moved to the next video. For the original video BNM_O and the manipulated video BNM_E, the comparison was processed from the middle of the total extracted frames in each of the two videos in accord with the pseudocode shown in Figure 3. Within an extremely short time, it was concluded that they were similar, and thus the search stopped.
Figure 8b illustrates the results of the intersection similarity comparison with the videos in the suspect’s mobile device under scenario 1. The intersection algorithm also searched for a similar video on the basis of the BNM threshold shown in Table 5. For three videos irrelevant to the query video (DNM_D, BNM_D, and BNH_D), the optimization search began from the middle of the video in line with the pseudocode shown in Figure 3. As a result, no frame had a similarity of 0.48 or more, which is the threshold of the intersection algorithm within the BNM environment. Therefore, after all frames were searched, the comparison process went to the next video. For the original video BNM_O and the manipulated video BNM_E, a comparison was carried out from the middle of the total extracted frames in each of the two videos in accord with the pseudocode shown in Figure 3. As with the correlation algorithm, the intersection algorithm determined within an extremely short time that they were similar, and thus the search stopped.
Figure 8c illustrates the results from the Bhattacharyya similarity comparison on the videos in the suspect’s mobile device under scenario 1. A similar video was identified based on the BNM threshold in Table 5. For the three videos irrelevant to the query video (DNM_D, BNM_D, and BNH_D), the optimization search began from the middle of the video in line with the pseudocode shown in Figure 3. As a result, no frame had a similarity of ≤0.52, which is the threshold of the Bhattacharyya algorithm in the BNM environment. Therefore, once all frames were searched, the comparison process moved to the next video. As for the original video BNM_O and the manipulated video BNM_E, the comparison was carried out from the middle of the total extracted frames in each of the two videos in accord with the pseudocode shown in Figure 3. Similar to the correlation and intersection algorithms, the Bhattacharyya algorithm determined within an extremely short time that they were similar, and thus the search stopped.
For readability, the graphs in Figure 8 do not show the parts without data after adjusting the y-axis. Using a manipulated video, a forensic investigation was applied to the suspect’s mobile device. As a result, it was possible to find not only a manipulated video but also the original video. Only 30% of the total frames of the original and manipulated videos were investigated. Nevertheless, it is possible to identify that they were similar. Once an original video is secured, if victims are shown or certain scenes in the original video are edited separately, it is possible to find all edited videos and reveal other crimes. This experiment is applicable to various real-world cases, such as the gradually increasing amount of revenge pornography, threatening acquaintances over social media, and the SNS distribution of illegally filmed videos after file size reduction.

4.2.3. Scenario 2

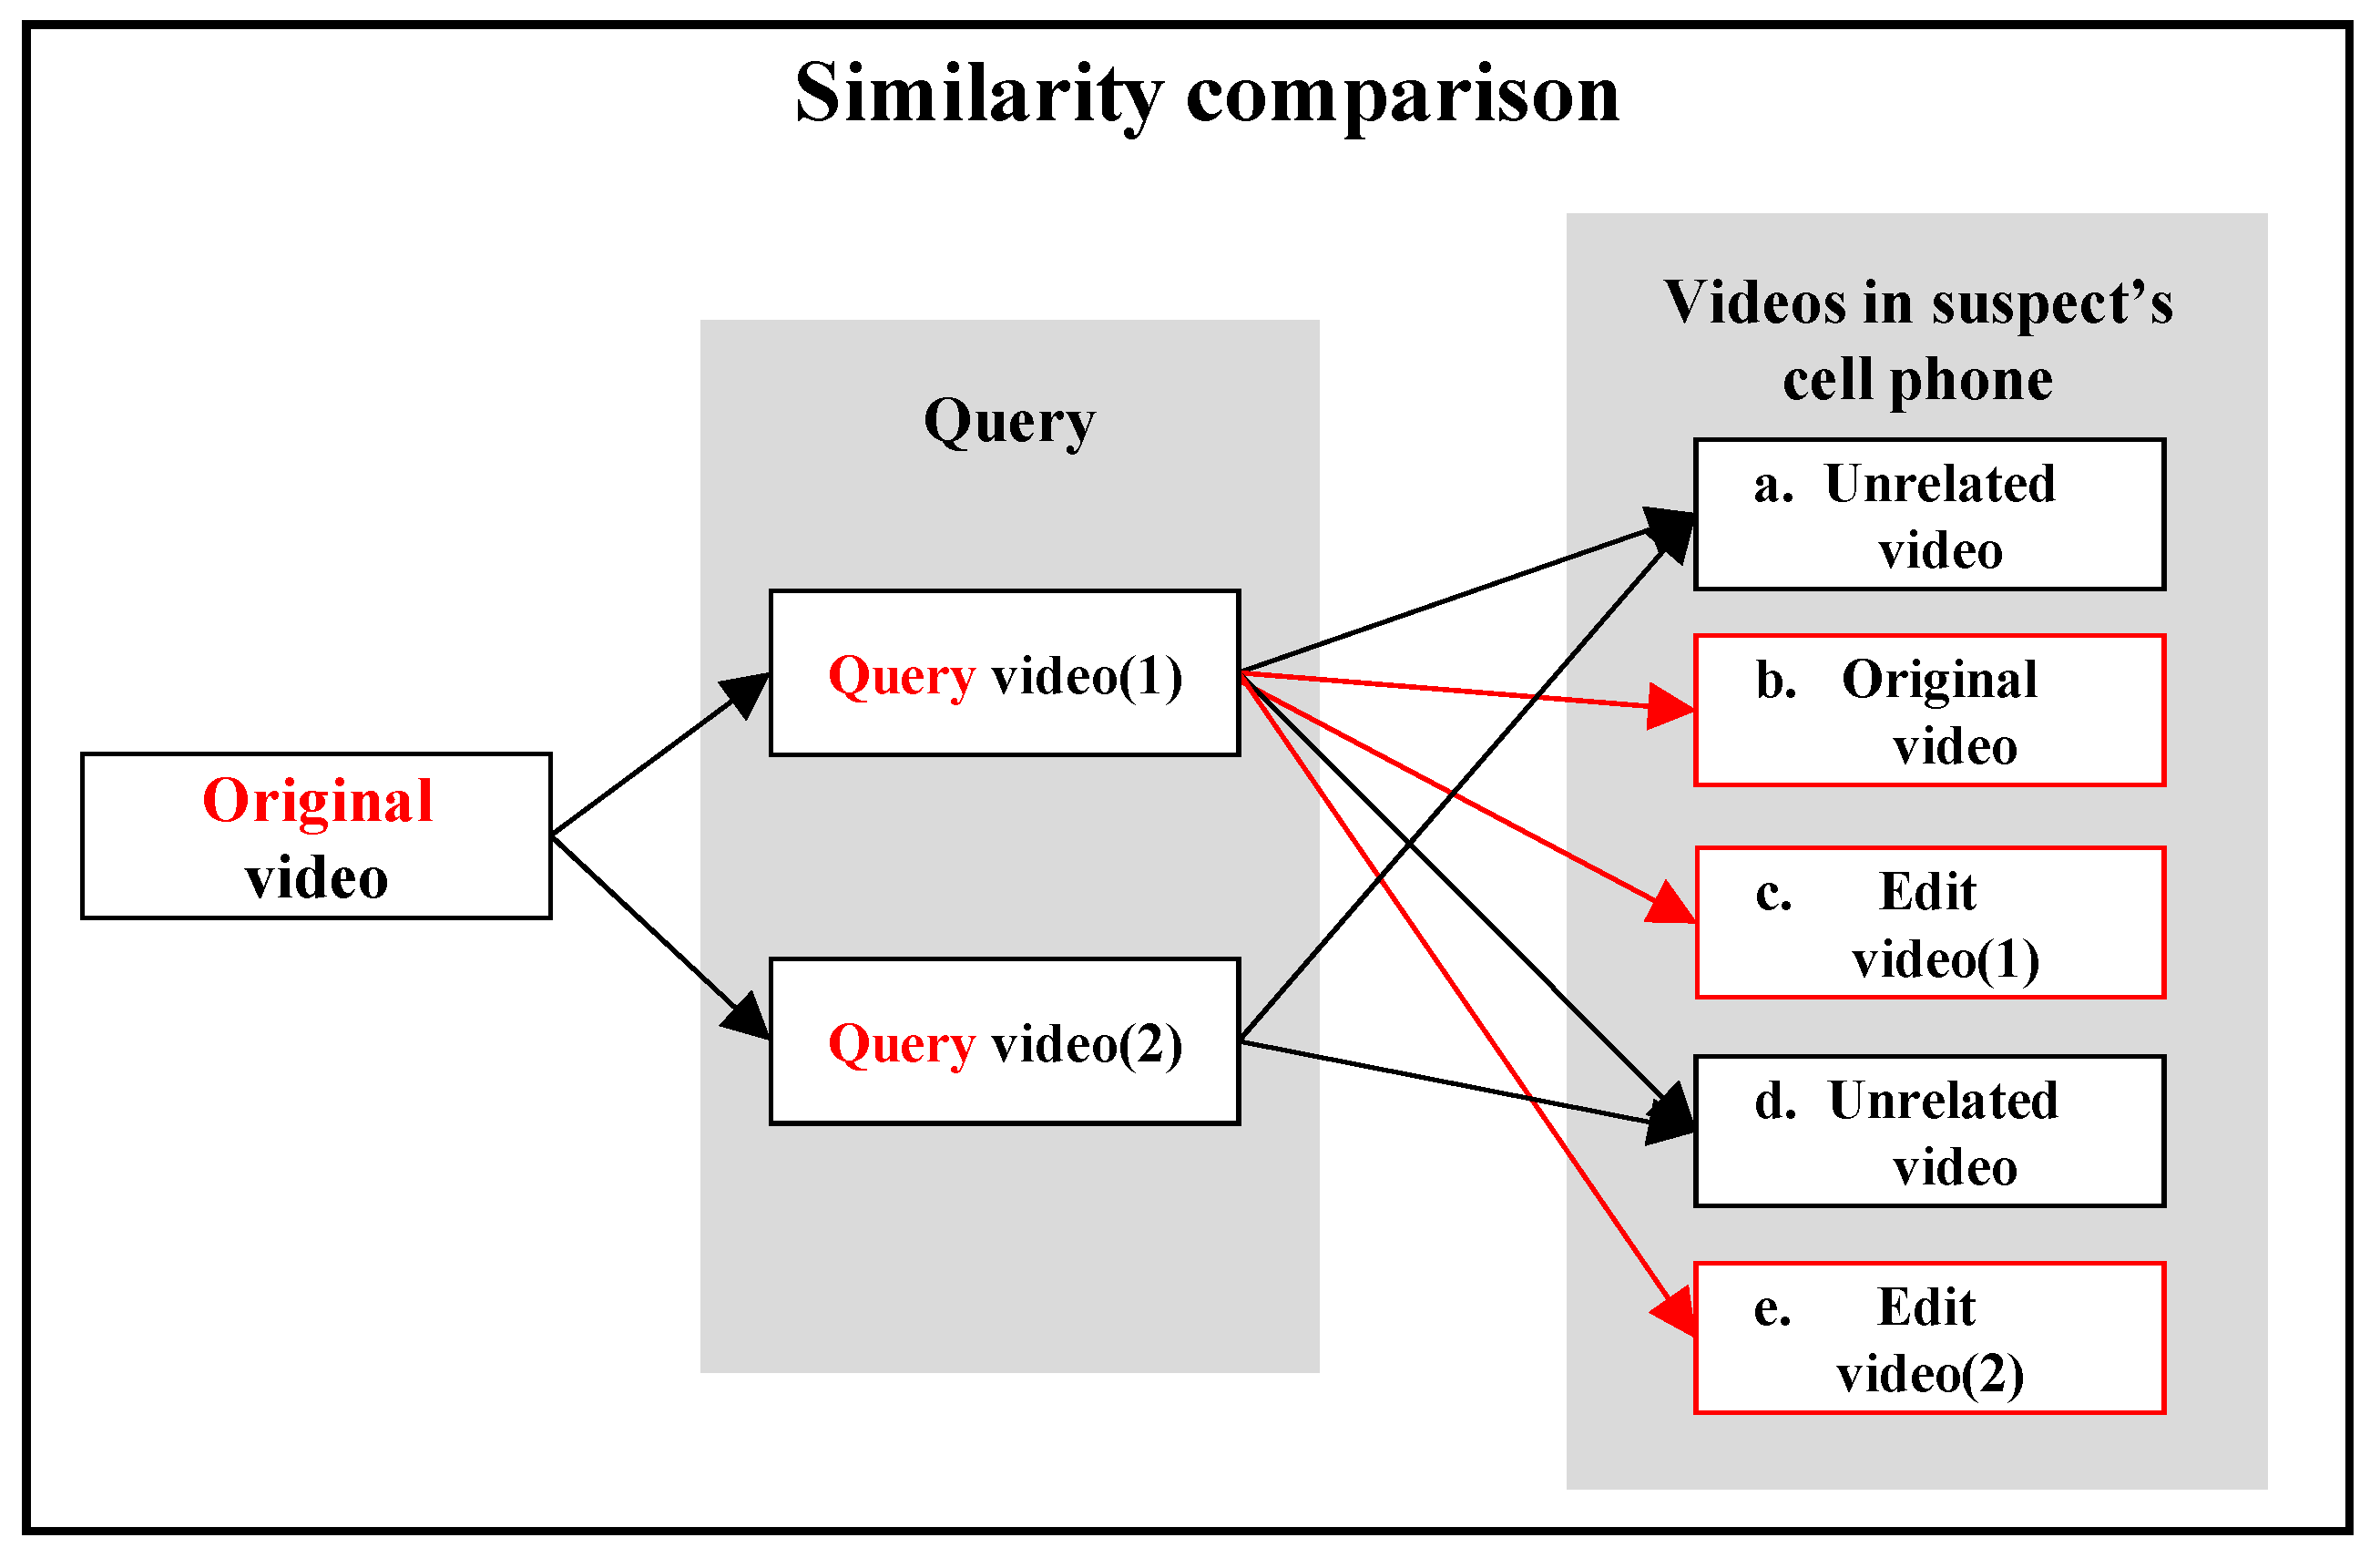
Under scenario 2, an investigator secured an original video and detected all edited and manipulated videos to be distributed in the suspect’s mobile device.
The comparison process under this scenario has the same steps as in Scenario 1. Nevertheless, when a query section is set in step 1, all parts considered to be crimes are included in the query section and are compared with a comparison video. If any of them is determined to be similar to the comparison video, the query video is identified as a manipulated video. Under scenario 2, two parts of the original video were set as a query section.
Table 8 presents the original video secured by an investigator and two query videos determined based on the query section selected by the investigator. All video names also show the criteria for the videos, as listed in Table 4. In other words, if a video is original, its name has an ‘O’ (original) after the underscore (_); if manipulated, it has an ‘E’ (edit); and if unrelated to an original video, it has a ‘D’ (different).
Table 9 shows the videos of a suspect’s mobile device. As presented in Figure 9, these videos were compared with query videos using an optimized comparison search. The suspect’s mobile device has five videos: two videos irrelevant to the query videos (DNM_D, Dark+Near+Middle_Different video; and BNH_D, Bright+Near+High_Different video), one original video of the query videos (BNM_O, Bright+Near+Middle_Original video), and two manipulated videos (BNM_E2; Bright+Near+Middle_Edit video1; and BNM_E2, Bright+Near+Middle_Edit video2).
Because these five videos have different run times, the total number of frames extracted is also different. A comparison was carried out in order of the videos listed in Table 7. From the middle of the total frames of each video, a frame was compared with the query frame in accord with the pseudocode shown in Figure 3. Subsequently, a similar video was identified based on the BNM threshold in Table 5. If all results from the three algorithms for one frame are within the range of threshold for over 10 separate trials, the comparison process stops, and the video is identified as having been manipulated or identical.
Figure 10a illustrates the result from the correlation similarity comparison between Query Video_1 and the videos in the suspect’s mobile device under scenario 2. For two videos irrelevant to the Query video_1 (DNM_D and BNH_D), the optimization search began from the middle of the video in line with the pseudocode shown in Figure 3. As a result, no frame had a similarity of 0.47 or higher, which is the threshold of the correlation algorithm in the BNM environment. Therefore, once all frames were searched, the comparison process moved to the next video. For the original video BNM_O and the manipulated videos BNM_E1 and BNM_E2, the comparison was processed from the middle frame of among all extracted frames in each of the videos in accord with the pseudocode shown in Figure 3. Within an extremely short time, it was concluded that they were similar, and thus, the search process stopped.
Figure 10b illustrates the results from the intersection similarity comparison between Query Video_1 and the videos in the suspect’s mobile device under scenario 2. The intersection algorithm also searched for a similar video on the basis of the BNM threshold in Table 5. For two videos irrelevant to the Query video_1 (DNM_D and BNH_D), the optimization search began from the middle of the video in line with the pseudocode shown in Figure 3. As a result, no frame had a similarity of 0.48 or higher, which is the threshold of the intersection algorithm in the BNM environment. Therefore, once all frames were searched, the comparison process moved to the next video. For the original video BNM_O and the manipulated videos BNM_E1 and BNM_E2, the comparison was processed from the middle frame from among all extracted frames in each of the videos in accord with the pseudocode shown in Figure 3. Within an extremely short time, it was concluded that they were similar, and thus the search process stopped.
Figure 10c illustrates the result from the Bhattacharyya similarity comparison between Query Video_1 and the videos in the suspect’s mobile device under scenario 2. The Bhattacharyya algorithm also searched for a similar video based on the BNM threshold, as shown in Table 5. For two videos irrelevant to Query video_1 (DNM_D and BNH_D), the optimization search began from the middle of the video in line with the pseudocode shown in Figure 3. As a result, no frame had a similarity of ≤0.52, which is the threshold of the Bhattacharyya algorithm in a BNM environment. Therefore, once all frames were searched, the comparison process moved to the next video. For the original video BNM_O and the manipulated videos BNM_E1 and BNM_E2, a comparison was carried out from the middle of all extracted frames for each of the videos in accord with the pseudocode shown in Figure 3. Within an extremely short time, it was concluded that they were similar, and thus the search process stopped. For readability, the graphs in Figure 10 have no parts without data after adjusting the y-axis.
The results of the experiment showed that BNM_O, BNM_E1, and BNM_E2 were similar. Except for similar videos, DNM_D was compared with BNH_D on the basis of the query video (2).
Figure 11a illustrates the correlation comparison between two videos (DNM_D and BNH_D) on the basis of Query Video_2. The optimization search began from the middle of the video in line with the pseudocode shown in Figure 3. As a result, no frame had a similarity of 0.47 or more, which is the threshold of the correlation algorithm in the BNM environment, similar to Query Video_1.
Figure 11b illustrates the intersection comparison between the two videos (DNM_D and BNH_D) based on Query Video_2. The optimization search began from the middle of the video in line with the pseudocode shown in Figure 3. As a result, no frame had a similarity of 0.48 or more, which is the threshold of the intersection algorithm in the BNM environment, similar to Query Video_1.
Figure 11c illustrates the Bhattacharyya comparison between the two videos (DNM_D and BNH_D) on the basis of Query Video_2. The optimization search began from the middle of the video in line with the pseudocode shown in Figure 3. As a result, no frame had a similarity of ≥0.52, which is the threshold of the Bhattacharyya algorithm in the BNM environment, similar to Query Video_1. In terms of Query Video_2, the results from the comparison between DNM_D and BNH_D were not within the range of the thresholds. Therefore, there were no similar videos.

5. Discussion

To determine precise thresholds for a comparative analysis of the original and manipulated videos, this study first estimated the thresholds of a similarity comparison, and then compared the videos under scenarios on the basis of the estimated thresholds, drawing insight. However, a detailed analysis of the quality and noise of illegally filmed videos remains a challenge. Additional issues to be discussed regarding this study are as follows:
-
It was difficult to secure actual crime video data for use in the present study. Under the assumption that filmed videos are generally edited before being distributed over social media, the videos were analyzed using the intuitive image information extraction method demonstrated in Table 4. Because illegally filmed videos have a diversity of variables, such as the types of devices used and states of the filmed videos, it is necessary to analyze big data samples to determine the thresholds more precisely.
-
For a realistic experiment, it is necessary to use actual crime video data. For this reason, research should be conducted continuously with the cooperation of relevant investigation agencies. In this case, an experiment should be conducted in accord with the appropriate procedures, such as the masking of personal information and sensitive meta-information.

6. Conclusions

With the increasing use of smartphones, crimes related to illegally filmed images are on the rise. “Digital sex crimes” are rampant regardless of popularity or occupation. In particular, illegally filmed images are mostly distributed by acquaintances over social media. Digital sex crimes transcend temporal and spatial spaces. For this reason, once they are distributed, the damage spreads more widely. To limit the spread of damage and quickly apprehend the suspect, it is necessary to detect all illegally filmed images. Various detection methods exist for original versions of illegally filmed images, such as hash-based detection. Smartphones and other technologies have made it easy to edit videos. When a video is edited, its hash value changes. Therefore, it is necessary to open the videos in the suspect’s mobile device individually. This study proposes a methodology for detecting all original and manipulated images within an optimal time on the basis of the images edited and distributed over social media. First, the proposed method was used to determine the number of frames extracted on the basis of a video’s run time so as to shorten the detection time, to analyze features of illegally filmed videos for a similarity comparison between videos, and to compare similarities from the second half of a video. Second, to detect both original and manipulated videos, correlation, intersection, and Bhattacharyya algorithms as histogram comparison algorithms were applied to estimate new thresholds that are used to search for manipulated videos. We also conducted an experiment centered on illegally filmed videos, wherein based on brightness, perspective, and shooting angle, eight environments were established, and thresholds were set. Finally, scenarios were designed based on the set thresholds. Under two scenarios in which crime videos were detected based on the videos secured by investigators, the videos that investigators tried to find were detected within the optimal time. Under scenario 1, the entire manipulated video was set as a query section during the experiment. A total of 390 frames were extracted from the original video, and a similarity comparison was conducted. Only after 10 out of the total frames were processed, it was found that the videos were similar. Under scenario 2, in which a query section was selected by an investigator after an original video was secured, it was possible to conclude that frames in comparison, though not completely equal, were similar within the range of thresholds. Therefore, after a similarity comparison with less than 30% of the total frames extracted from the videos under comparison, it was possible to conclude that the videos were similar.

Author Contributions

Conceptualization, S.C. and D.K.; methodology, S.C.; software, S.C.; validation, S.C. and D.K.; formal analysis, S.C. and D.K.; investigation, S.C.; resources, S.C.; data curation, S.C.; writing—original draft preparation, S.C. and D.K.; writing—review and editing, S.C. and D.K.; visualization, S.C.; supervision, D.K.; project administration, S.C. and D.K.; funding acquisition, D.K. Both authors have read and agreed to the published version of the manuscript.

Funding

This research received no external funding.

Institutional Review Board Statement

Not applicable.

Informed Consent Statement

Not applicable.

Acknowledgments

This work was supported by the GRRC program of Gyeonggi province. [GRRC KGU 2020-B03, Industry Statistics and Data Mining Research].

Conflicts of Interest

The authors declare no conflict of interest.

References

  1. Anirban, K.B. Pornography of place: Location, leaks and obscenity in the Indian MMS porn video. South Asian Pop. Cult. 2017, 15, 57–71. [Google Scholar] [CrossRef]
  2. Clare, M.; Erika, R.; Routh, H. Beyond ‘Revenge Porn’: The Continuum of Image Based Sexual Abuse. Fem. Leg. Stud. 2017, 25, 25–46. [Google Scholar] [CrossRef] [Green Version]
  3. Laura, V. Private, Hidden and Obscured: Image-Based Sexual Abuse in Singapore. Asian J. Criminol. 2020, 15, 25–43. [Google Scholar] [CrossRef]
  4. Silvia, S.; Lucia, B. The Use of Telegram for NonConsensual Dissemination of Intimate Images: Gendered Affordances and the Construction of Masculinities. Soc. Media Soc. 2020. [Google Scholar] [CrossRef]
  5. Zorloni, L. Uscite Le Minorenni. Wired. 2019. Available online: https://www.wired.it/internet/web/2019/01/23/telegram-chat-stupro-virtuale-minori-stalking-revenge-porn (accessed on 23 January 2019).
  6. Kathryn, B.; Carly, M.H.-R.; Emily, J.; Gabriela, S. Revenge Porn Victimization of College Students in the United States: An Exploratory Analysis. Int. J. Cyber Criminol. 2017, 11, 128–142. [Google Scholar] [CrossRef]
  7. Simson, L.G.; Michael, M. Hash-based carving: Searching media for complete files and file fragments with sector hashing and hashdb. Digit. Investig. 2015, 14 (Suppl. 1), S95–S105. [Google Scholar] [CrossRef] [Green Version]
  8. Joel, Y.; Kristina, F.; Simson, G.; Kevin, F. Distinct Sector Hashes for Target File Detection. Computer 2012, 45, 28–35. [Google Scholar] [CrossRef] [Green Version]
  9. Gandeva, B.S.; Philip, T.D.; Muhammad, A.N. Digital forensic analysis of Telegram Messenger on Android devices. In Proceedings of the 2016 International Conference on Information & Communication Technology and Systems (ICTS), Surabaya, Indonesia, 12 October 2016. [Google Scholar] [CrossRef]
  10. Dandass, Y.S.; Necaise, N.J.; Thomas, S.R. An Empirical Analysis of Disk Sector Hashes for Data Carving. J. Digit. Forensic Pract. 2008, 2, 95–104. [Google Scholar] [CrossRef]
  11. Shiguo, L.; Nikolaos, N.; Husrev, T.S. Content-Based Video Copy Detection—A Survey. Intell. Multimed. Anal. Secur. Appl. 2010, 282, 253–273. [Google Scholar] [CrossRef]
  12. Indyk, P.; Iyengar, G.; Shivakumar, N. Finding Pirated Video Sequences on the Internet; Technical Report; Computer Science Department, Stanford University: Stanford, CA, USA, 1999. [Google Scholar]
  13. Alongbar, W.; Arambam, N. A review on robust video copy detection. Int. J. Multimed. Inf. Retr. 2019, 8, 61–78. [Google Scholar]
  14. Patrick, M.; Christian, R.; Felix, F. Forensic source identification using JPEG image headers: The case of smartphones. Digit. Investig. 2019, 28, S68–S76. [Google Scholar] [CrossRef]
  15. Caldelli, R.; Becarelli, R.; Amerini, I. Image origin classification based on social network provenance. IEEE Trans. Inf. Forensics Secur. 2017, 12, 1299–1308. [Google Scholar] [CrossRef]
  16. Castiglione, A.; Cattaneo, G.; Alfredo, D.S. A forensic analysis of images on online social networks. In Proceedings of the 2011 Third International Conference on Intelligent Networking and Collaborative Systems, Fukuoka, Japan, 30 November–2 December 2011; pp. 679–684. [Google Scholar] [CrossRef]
  17. Eric, K.; Micah, K.J.; Hany, F. Digital image authentication from jpeg headers. IEEE Trans. Inf. Forensics Secur. 2011, 6, 1066–1075. [Google Scholar] [CrossRef]
  18. Adjeroh, D.A.; Lee, M.C.; King, I. A Distance Measure for Video Sequence Similarity Matching. In Proceedings of the International Workshop on Multi-Media Database Management Systems, Dayton, OH, USA, 5–7 August 1998. [Google Scholar] [CrossRef]
  19. Anil, K.J.; Aditya, V.; Xiong, W. Query by video clip. In Proceedings of the Fourteenth International Conference on Pattern Recognition, Multimedia Systems, Brisbane, QLD, Australia, 20 August 1998; Volume 7, pp. 369–384. [Google Scholar] [CrossRef]
  20. Gengembre, N.; Berrani, S.-A. The Orange Labs Real Time Video Copy Detection System—TrecVid 2008 Results; Orange Labs—Division R&D Technologies 4: Cesson Sévigné, France, 2008. [Google Scholar]
  21. Martinez, C.; Roura, S. Optimal Sampling Strategies in Quicksort and Quickselect. Soc. Ind. Appl. Math. J. Comput. 2001, 31, 683–705. [Google Scholar] [CrossRef]
  22. Sondos, F.; Qi, H.; Li, Q. Exposing video inter-frame forgery via histogram of oriented gradients and motion energy image. Multidimens. Syst. Signal Process. 2020, 31, 1365–1384. [Google Scholar] [CrossRef]
  23. Haiyan, C.; Ke, X.; Huan, W.; Chunxia, Z. Scene image classification using locality-constrained linear coding based on histogram intersection. Multimed. Tools Appl. 2018, 77, 4081–4092. [Google Scholar] [CrossRef]
  24. Ronald, W.K.; Albert, C.S. A novel learning-based dissimilarity metric for rigid and non-rigid medical image registration by using Bhattacharyya Distances. Pattern Recognit. 2017, 62, 161–174. [Google Scholar]
Figure 1. Overall process of video forensics.
Applsci 11 05220 g001
Figure 2. Image scaling.
Applsci 11 05220 g002
Figure 3. Pseudocode used for comparison.
Applsci 11 05220 g003
Figure 4. Criteria of brightness.
Applsci 11 05220 g004
Figure 5. Based on perspective and shooting angle.
Applsci 11 05220 g005
Figure 6. Threshold for each algorithm.
Applsci 11 05220 g006
Figure 7. Comparison for scenario 1.
Applsci 11 05220 g007
Figure 8. Algorithm similarity comparisons between query video and other videos (scenario 1).
Applsci 11 05220 g008
Figure 9. Comparison in scenario 2.
Applsci 11 05220 g009
Figure 10. Algorithm for similarity comparison between Query video_1 and other videos (scenario 2).
Applsci 11 05220 g010
Figure 11. Algorithm similarity comparison between Query video_2 and other videos (scenario 2).
Applsci 11 05220 g011
Table 1. Experimental datasets.
Run Time (min)Frames per SecondNumber of Frames to Extract
0.1~4.5933~897
5~7.692600~958
8~14.591480~899
15~19.590.5300~599
20~∞0.334400~∞
Table 2. Frame continuity unit according to the number of frames of a video in comparison.
Number of Frames ExtractedNumber of Continuous Frames (k)
0~20020
200~40050
400~600100
600~800150
800~∞200
Table 3. Video classification criteria.
BrightnessObject PerspectiveShooting Angle
Bright (B)Near (N)Middle angle (M)
Dark (D)Far (F)High angle (H)
Table 4. Criteria for classification of experimental environment.
EnvironmentQuantitativeQualitative
BNMBrightNear + middle angle
BNHBrightNear + high angle
BFMBrightFar + middle angle
BFHBrightFar + high angle
DNMDarkNear + middle angle
DNHDarkNear + high angle
DFMDarkFar + middle angle
DFHDarkFar + high angle
Table 5. Threshold of algorithms according to brightness, perspective, and shooting angle.
Comparison CriteriaCorrelationIntersectionBhattacharyya
BNM0.47 or more0.48 or more0.52 or less
BNH0.57 or more0.42 or more0.54 or less
BFM0.49 or more0.54 or more0.41 or less
BFH0.52 or more0.50 or more0.46 or less
DNM0.45 or more0.47 or more0.51 or less
DNH0.51 or more0.40 or more0.51 or less
DFM0.47 or more0.47 or more0.40 or less
DFH0.51 or more0.50 or more0.45 or less
Table 6. Video secured by investigators and query video (scenario 1).
Video NameRunning TimeFile SizeFrame (Width × Height)Frame Speed
Edit video (BNM_E)2 min 10 s49.8 MB1920 × 108829.97 frames/s
Query video2 min 10 s49.8 MB1920 × 108829.97 frames/s
Table 7. Videos in suspect’s smart phone (scenario 1).
Video NameRunning TimeFile SizeFrame (Width × Height)Frame Speed
DNM_D31 s11.9 MB1920 × 108824.00 frames/s
BNM_O9 min 14 s210 MB1920 × 108829.97 frames/s
BNM_D10 s3.9 MB1920 × 108829.98 frames/s
BNH_D9 min 14 s210 MB1920 × 108829.97 frames/s
BNM_E2 min 10 s49.8 MB1920 × 108829.97 frames/s
Table 8. Video secured by investigators and query videos (scenario 2).
Video NameRunning TimeFile SizeFrame (Width × Height)Frame Speed
Original video (BNM_O)9 min 14 s210 MB1920 × 108829.97 frames/s
Query video_11 min 46 s40.4 MB1920 × 108829.97 frames/s
Query video_22 min 5 s47.8 MB1920 × 108829.97 frames/s
Table 9. Videos in suspect’s smart phone (scenario 2).
Video NameRunning TimeFile SizeFrame (Width × Height)Frame Speed
DNM_D31 s11.9 MB1920 × 108824.00 frames/s
BNM_O9 min 14 s210 MB1920 × 108829.97 frames/s
BNM_E12 min 10 s49.8 MB1920 × 108829.98 frames/s
BNH_D9 min 14 s210 MB1920 × 108829.97 frames/s
BNM_E22 min 58 s68.0 MB1920 × 108829.97 frames/s
Publisher’s Note: MDPI stays neutral with regard to jurisdictional claims in published maps and institutional affiliations.

