
Energy Communities Design Optimization in the Italian Framework

 ,
,  and
and 
Abstract
:1. Introduction
1.1. Energy Communities and the Decentralized Energy Production Paradigm
- Local energy sources. The exploitation of local sources should consider all the externalities related to architectural and landscape modification or competition with other local activities such as tourism or agriculture.
- Local security of energy supply. EU energy dependency rate on foreign countries in 2018 was equal to 58% [3]. Because of this, it is fundamental to consider the impact on internalization of primary energy procurement.
- Shorter transport distances and reduced energy transmission losses. While distances, hence energy losses, of electricity transport decrease, distribution networks become more complex to be managed.
- Community development and cohesion. The acceptability of new infrastructure is higher when decisions (and even investments) are taken collectively. This increases the awareness of local communities about the positive impact of business initiatives on social relations and economic activities.
1.2. Energy Communities in the Italian Regulatory Framework
1.3. Motivation
2. Materials and Methods
2.1. Energy Community Model
2.2. Benefit Distribution
3. Case Study
4. Results
4.1. Optimal Design Results
4.2. Benefit Distribution Results
5. Conclusions
Author Contributions
Funding
Conflicts of Interest
References
- Directive (EU) 2018/2001 of the European Parliament and of the Council of 11 December 2018 on the Promotion of the Use of Energy from Renewable Sources. 2018. Available online: https://eur-lex.europa.eu/legal-content/EN/TXT/?uri=CELEX%3A32018L2001 (accessed on 3 June 2021). (permalink).
- Directive (EU) 2019/944 of the European Parliament and of the Council of 5 June 2019 on Common Rules for the Internal Market for Electricity and Amending Directive 2012/27/EU. 2019. Available online: https://eur-lex.europa.eu/legal-content/EN/TXT/?uri=CELEX%3A32019L0944 (accessed on 3 June 2021). (permalink).
- Eurostat. Shedding Light on Energy in the EU—A Guided Tour of Energy Statistics. 2020. Available online: https://ec.europa.eu/eurostat/cache/infographs/energy/index.html (accessed on 25 May 2021).
- Repubblica Italiana. Legge 28 febbraio 2020, n. 8. Gazzetta ufficiale della Repubblica Italiana n.51 del 29 Febbraio 2020. 2020. [Google Scholar]
- M, Pezzaglia (Gruppo Professione Energia). Renewable Collective Self-Consumption and Renewable Energy Communities. Analysis of the First Transposition of Directive (EU) 2018/2001 in Italy. 2019. Available online: www.enusyst.eu/documents/ACC-CE-Italia.pdf (accessed on 25 May 2021).
- ARERA. Deliberazione 4 Agosto 2020—318/2020/R/EEL. 2020. Available online: https://www.arera.it/it/docs/20/318-20.htm (accessed on 25 May 2021). (In Italian).
- Ministero dello sviluppo economico. Individuazione Della Tariffa Incentivante Per la Remunerazione Degli Impianti a Fonti rinnovabili Inseriti Nelle Configurazioni Sperimentali di Autoconsumo Collettivo e Comunità Energetiche Rinnovabili, in Attuazione Dell’articolo 42-bis, Comma 9, del Decreto-Legge n. 162/2019, Convertito Dalla Legge n. 8/2020. 2020. Available online: https://www.gazzettaufficiale.it/eli/gu/2020/11/16/285/sg/html (accessed on 3 June 2021). (permalink).
- Moncecchi, M.; Meneghello, S.; Merlo, M. Energy sharing in renewable energy communities: The Italian case. In Proceedings of the 2020 55th International Universities Power Engineering Conference (UPEC), Torino, Italy, 1–4 September 2020. [Google Scholar] [CrossRef]
- Zatti, M.; Gabba, M.; Freschini, M.; Martelli, E. The benefits of multi-energy systems optimization: The Efficity project, 2019. AIP Conf. Proc. 2019, 2191, 020157. [Google Scholar] [CrossRef]
- Zatti, M.; Gabba, M.; Rossi, M.; Morini, M.; Gambarotta, A.; Martelli, E. Towards the Optimal Design and Operation of Multi-Energy Systems: The ‘Efficity’ Project. Environ. Eng. Manag. J. 2018, 17, 2409–2419. [Google Scholar] [CrossRef]
- Zatti, M.; Gabba, M.; Freschini, M.; Rossi, M.; Gambarotta, A.; Morini, M.; Martelli, E. k-MILP: A novel clustering approach to select typical and extreme days for multi-energy systems design optimization. Energy 2019, 181, 1051–1063. [Google Scholar] [CrossRef]
- Zatti, M. Optimal Design of Urban Energy Districts under Uncertainty. Ph.D. Thesis, Politecnico di Milano, Milano, Italy, 6 September 2019. [Google Scholar]
- Zatti, M.; Guermandi, F.; Bovera, F. Techno-economic impact of collective self-consumption on different energy-related investments for a condominium. In Proceedings of the Strategies, Technologies and Challenges for a Fossil Free Future, Pisa, Italy, 25–30 October 2020. [Google Scholar]
- Skoplaki, E.; Palyvos, J.A. On the temperature dependence of photovoltaic module electrical performance: A review of efficiency/power correlations. Sol. Energy 2009, 83, 614–624. [Google Scholar] [CrossRef]
- Moncecchi, M.; Meneghello, S.; Merlo, M. A game theoretic approach for energy sharing in the italian renewable energy communities. Appl. Sci. 2020, 10, 8166. [Google Scholar] [CrossRef]
- Gallanti, M.; Gratteri, W.; Maggiore, S.; Marino, A. Analisi ed evoluzione negli anni delle curve di carico dei clienti domestici. Energ. Elettr. 2012, 86, 19–31. [Google Scholar]
- Consortium TABULA. Available online: https://episcope.eu/welcome/ (accessed on 25 May 2021).
- Zagarella, F. Estimating the Buildings Hourly Energy Demand for Smart Energy District Planning. PhD. Thesis, Politecnico di Milano, Milano, Italy, 2 December 2019. [Google Scholar]
- Fischer, D.; Lindberg, K.B.; Madani, H.; Wittwer, C. Impact of PV and Variable Prices on Optimal System Sizing for Heat Pumps and Thermal Storage. Energy Build. 2016. [Google Scholar] [CrossRef]
- ENEA, Ministero dello Sviluppo Economico. Studio Comparativo tra Fabbisogni Energetici Netti, Lato Edificio, sia per la Climatizzazione Estiva che per Quella Invernale di Edifici Residenziali e del Settore Terziario Situati in Climi Differenti; ENEA, Ministero dello Sviluppo Economico: Rome, Italy, 2010. [Google Scholar]
- Sandels, C.; Brodén, D.; Widén, J.; Nordström, L.; Andersson, E. Modeling office building consumer load with a combined physical and behavioral approach: Simulation and validation. Appl. Energy 2016, 162, 472–485. [Google Scholar] [CrossRef]
- GSE. Available online: https://www.gse.it/servizi-per-te/fotovoltaico/scambio-sul-posto (accessed on 25 May 2021).
- RSE—Gli schemi di Autoconsumo Collettivo e le Comunità dell’Energia. Available online: https://www.rse-web.it/notizie/DOSSIERSE----Egrave-online-il-nuovo-DossieRSE--ldquoGli-sche.page (accessed on 25 May 2021).


| REC | CSC | |
|---|---|---|
| Saving transmission | 7.61 EUR/MWh | 7.61 EUR/MWh |
| Saving distribution | 0.61 EUR/MWh | 0.61 EUR/MWh |
| Incentive | 110.00 EUR/MWh | 100.00 EUR/MWh |
| Total benefit | 118.22 EUR/MWh | 108.22 EUR/MWh (+ losses reduction) |
| Surface [m2] | Electricity [kWh] | Space Heating [kWh] | DHW [kWh] | Cooling [kWh] | |
|---|---|---|---|---|---|
| Old couple 1 | 80 | 2700 | 4744 | 1160 | 1205 |
| Old couple 2 | 80 | 2700 | 4744 | 1160 | 1205 |
| Young couple 1 | 80 | 2400 | 4744 | 1115 | 1194 |
| Young couple 2 | 80 | 2400 | 4744 | 1262 | 1194 |
| Family 1 | 120 | 3200 | 7116 | 1673 | 1801 |
| Family 2 | 120 | 3200 | 7116 | 1809 | 1801 |
| Office 1 | 120 | 2923 | 6982 | 588 | 1448 |
| Office 2 | 100 | 2338 | 6277 | 470 | 1158 |
| Office 3 | 140 | 3507 | 8379 | 705 | 1738 |
| Condominium | - | 531 | - | - | - |
| Typical Day 1 [N = 117] | Typical Day 2 [N = 124] | Typical Day 3 [N = 118] | Typical Day 4 [N = 3] | Typical Day 5 [N = 3] | ||||||
|---|---|---|---|---|---|---|---|---|---|---|
| Peak [kW] | Total [kWh] | Peak [kW] | Total [kWh] | Peak [kW] | Total [kWh] | Peak [kW] | Total [kWh] | Peak [kW] | Total [kWh] | |
| Old couple 1 | 0.65 | 8.1 | 0.57 | 7.1 | 0.55 | 7.0 | 0.65 | 8.1 | 0.55 | 7.0 |
| Old couple 2 | 0.65 | 8.1 | 0.57 | 7.1 | 0.55 | 7.0 | 0.65 | 8.1 | 0.55 | 7.0 |
| Young couple 1 | 0.92 | 7.3 | 0.82 | 6.3 | 0.78 | 6.1 | 0.92 | 7.3 | 0.78 | 6.1 |
| Young couple 2 | 0.85 | 7.3 | 0.76 | 6.3 | 0.72 | 6.1 | 0.85 | 7.3 | 0.72 | 6.1 |
| Family 1 | 1.04 | 9.5 | 0.95 | 8.7 | 0.87 | 8.2 | 1.04 | 9.5 | 0.87 | 8.2 |
| Family 2 | 0.77 | 9.4 | 0.69 | 8.7 | 0.62 | 8.2 | 0.77 | 9.4 | 0.62 | 8.2 |
| Office 1 | 0.63 | 8.2 | 0.61 | 8.0 | 0.60 | 7.8 | 0.63 | 8.2 | 0.60 | 7.8 |
| Office 2 | 0.50 | 6.6 | 0.49 | 6.4 | 0.48 | 6.3 | 0.50 | 6.6 | 0.48 | 6.3 |
| Office 3 | 0.76 | 9.8 | 0.74 | 9.6 | 0.72 | 9.4 | 0.76 | 9.8 | 0.72 | 9.4 |
| Condominium | 0.17 | 1.6 | 0.15 | 1.4 | 0.14 | 1.4 | 0.17 | 1.6 | 0.14 | 1.4 |
| Yearly total | 8872 | 8631 | 7966 | 227 | 203 | |||||
| Typical Day 1 [N = 117] | Typical Day 2 [N = 124] | Typical Day 3 [N = 118] | Typical Day 4 [N = 3] | Typical Day 5 [N = 3] | ||||||
|---|---|---|---|---|---|---|---|---|---|---|
| Peak [kW] | Total [kWh] | Peak [kW] | Total [kWh] | Peak [kW] | Total [kWh] | Peak [kW] | Total [kWh] | Peak [kW] | Total [kWh] | |
| Old couple 1 | 4.58 | 32.3 | 1.89 | 12.6 | 0.83 | 3.1 | 10.45 | 63.4 | 0.83 | 3.1 |
| Old couple 2 | 4.58 | 32.3 | 1.89 | 12.6 | 0.94 | 3.1 | 10.45 | 63.4 | 0.94 | 3.1 |
| Young couple 1 | 4.54 | 32.2 | 2.04 | 12.5 | 0.83 | 2.9 | 10.40 | 62.7 | 0.83 | 2.9 |
| Young couple 2 | 3.90 | 32.5 | 1.63 | 12.9 | 0.94 | 3.3 | 9.55 | 64.8 | 0.94 | 3.3 |
| Family 1 | 7.14 | 48.1 | 3.17 | 18.9 | 1.24 | 4.4 | 16.12 | 93.6 | 1.24 | 4.4 |
| Family 2 | 5.03 | 43.3 | 3.13 | 24.1 | 1.42 | 4.8 | 14.23 | 98.2 | 1.42 | 4.8 |
| Office 1 | 2.75 | 32.5 | 2.35 | 27.8 | 0.35 | 1.6 | 3.47 | 41.0 | 0.35 | 1.6 |
| Office 2 | 2.44 | 29.1 | 2.08 | 24.8 | 0.28 | 1.3 | 3.08 | 36.7 | 0.28 | 1.3 |
| Office 3 | 3.29 | 39.0 | 2.81 | 33.4 | 0.41 | 1.9 | 4.16 | 49.2 | 0.41 | 1.9 |
| Condominium | 0.00 | 0.0 | 0.00 | 0.0 | 0.00 | 0.0 | 0.00 | 0.0 | 0.00 | 0.0 |
| Yearly total | 37,586 | 22,282 | 3123 | 1719 | 79 | |||||
| Typical Day 1 [N = 117] | Typical Day 2 [N = 124] | Typical Day 3 [N = 118] | Typical Day 4 [N = 3] | Typical Day 5 [N = 3] | ||||||
|---|---|---|---|---|---|---|---|---|---|---|
| Peak [kW] | Total [kWh] | Peak [kW] | Total [kWh] | Peak [kW] | Peak [kW] | Total [kWh] | Peak [kW] | Total [kWh] | Peak [kW] | |
| Old couple 1 | 0.0 | 0.0 | 0.0 | 0.0 | 0.95 | 9.2 | 0.0 | 0.0 | 4.00 | 39.0 |
| Old couple 2 | 0.0 | 0.0 | 0.0 | 0.0 | 0.95 | 9.2 | 0.0 | 0.0 | 4.00 | 39.0 |
| Young couple 1 | 0.0 | 0.0 | 0.0 | 0.0 | 1.05 | 9.2 | 0.0 | 0.0 | 4.00 | 35.2 |
| Young couple 2 | 0.0 | 0.0 | 0.0 | 0.0 | 1.04 | 9.2 | 0.0 | 0.0 | 3.97 | 36.2 |
| Family 1 | 0.0 | 0.0 | 0.0 | 0.0 | 1.48 | 13.8 | 0.0 | 0.0 | 6.00 | 56.1 |
| Family 2 | 0.0 | 0.0 | 0.0 | 0.0 | 1.36 | 13.8 | 0.0 | 0.0 | 5.50 | 56.1 |
| Office 1 | 0.0 | 0.0 | 0.0 | 0.0 | 1.61 | 11.1 | 0.0 | 0.0 | 6.43 | 44.6 |
| Office 2 | 0.0 | 0.0 | 0.0 | 0.0 | 1.29 | 8.9 | 0.0 | 0.0 | 5.14 | 35.6 |
| Office 3 | 0.0 | 0.0 | 0.0 | 0.0 | 1.93 | 13.4 | 0.0 | 0.0 | 7.71 | 53.5 |
| Condominium | 0.0 | 0.0 | 0.0 | 0.0 | 0.00 | 0.0 | 0.0 | 0.0 | 0.00 | 0.0 |
| Yearly total | 0 | 0 | 11,558 | 0 | 1186 | |||||
| Case | Configurations | HP | BOILER | PV | TANK | TAC | OPEX | CAPEX | |
|---|---|---|---|---|---|---|---|---|---|
| [kWth] | [kWth] | [m2] | [kW] | [m3] | [p.u.] | [p.u.] | [p.u.] | ||
| A | SSP | n.a. | 77 | 2.50 | 0.38 | n.a. | 1 | 0.96 | 0.04 |
| EC | n.a. | 77 | 100 | 15.00 | n.a. | 0.91 | 0.78 | 0.13 | |
| EC-ideal | n.a. | 77 | 137 | 20.55 | n.a. | 0.90 | 0.74 | 0.16 | |
| B | B-SSP | 32.0 | 0 | 94.9 | 14.24 | 2.46 | 0.85 | 0.64 | 0.21 |
| B-EC | 31.7 | 0 | 100 | 15.00 | 2.50 | 0.83 | 0.62 | 0.21 | |
| EC-ideal | 28.4 | 0 | 244 | 36.60 | 3.75 | 0.80 | 0.47 | 0.34 | |
| u.m. | Ref. | A | B | ||||||
|---|---|---|---|---|---|---|---|---|---|
| SSP | EC | EC-Ideal | SSP | EC | EC-Ideal | ||||
| Gas | consumption | kSm3 | 9.74 | 0.00 | 0.00 | 0.00 | −9.74 | −9.74 | −9.74 |
| Electricity | consumption | MWh | 30.09 | 0.00 | 0.00 | 0.00 | +17.73 | +17.73 | +17.73 |
| production | MWh | 0.00 | +0.48 | +19.23 | +26.34 | +18.26 | +19.23 | +46.84 | |
| import | MWh | 30.09 | −0.20 | −13.38 | −14.89 | +11.98 | +1.14 | −7.24 | |
| export | MWh | 0.00 | +0.28 | +5.85 | +11.45 | +12.51 | +2.62 | +21.82 | |
| physical self-consumption | MWh | 0.00 | +0.20 | +0.27 | +0.27 | +5.75 | +5.07 | +9.83 | |
| % | 0.00 | 41.15% | 1.42% | 1.04% | 31.49% | 26.36% | 20.98% | ||
| collective self-consumption | MWh | 0.00 | 0.00 | +13.11 | +14.62 | 0.00 | +11.55 | +15.19 | |
| % | 0.00 | 0.00 | 68.16% | 55.50% | 0.00 | 60.04% | 32.44% | ||
| total self-consumption | MWh | 0.00 | +0.198 | +13.38 | +14.89 | +5.75 | +16.62 | +25.02 | |
| % | 0.00 | 41.15% | 69.58% | 56.53% | 31.49% | 86.40% | 53.42% | ||
| CO2 | electricity | ton | 9.93 | −0.07 | −4.42 | −4.92 | +3.95 | +0.38 | −2.39 |
| gas | ton | 19.14 | 0.00 | 0.00 | 0.00 | −19.14 | −19.14 | −19.14 | |
| TOT | ton | 29.07 | −0.07 | −4.42 | −4.92 | −15.18 | −18.76 | −21.53 | |
| Economics | electricity exchange: | ||||||||
| bill (A) | k EUR | 6.38 | −0.03 | −0.05 | −0.05 | +3.12 | +3.24 | −3.60 | |
| remuneration (B) | k EUR | 0.00 | +0.03 | +2.63 | +3.24 | +1.77 | +2.16 | +3.99 | |
| gas (C) | k EUR | 5.44 | 0.00 | 0.00 | 0.00 | −4.86 | −4.86 | −4.86 | |
| TOT (A − B + C) | k EUR | 11.81 | −0.06 | −2.68 | −3.28 | −3.51 | −3.78 | −12.45 | |
| Stakeholder | Scenario | |||
|---|---|---|---|---|
| A-EC | B-EC | |||
| Old couple 1 | EUR 60 | (9.2%) | EUR 54 | (8.3%) |
| Old couple 2 | EUR 59 | (9.1%) | EUR 54 | (8.3%) |
| Young couple 1 | EUR 31 | (5.4%) | EUR 29 | (4.9%) |
| Young couple 2 | EUR 38 | (6.4%) | EUR 34 | (5.7%) |
| Family 1 | EUR 60 | (7.9%) | EUR 55 | (7.2%) |
| Family 2 | EUR 74 | (9.6%) | EUR 67 | (8.7%) |
| Office 1 | EUR 106 | (15.1%) | EUR 96 | (13.6%) |
| Office 2 | EUR 81 | (13.8%) | EUR 73 | (12.4%) |
| Office 3 | EUR 130 | (16.0%) | EUR 118 | (14.5%) |
| Condominium | EUR 1987 | EUR 1580 | ||
| Overall | EUR 2627 | EUR 2159 | ||
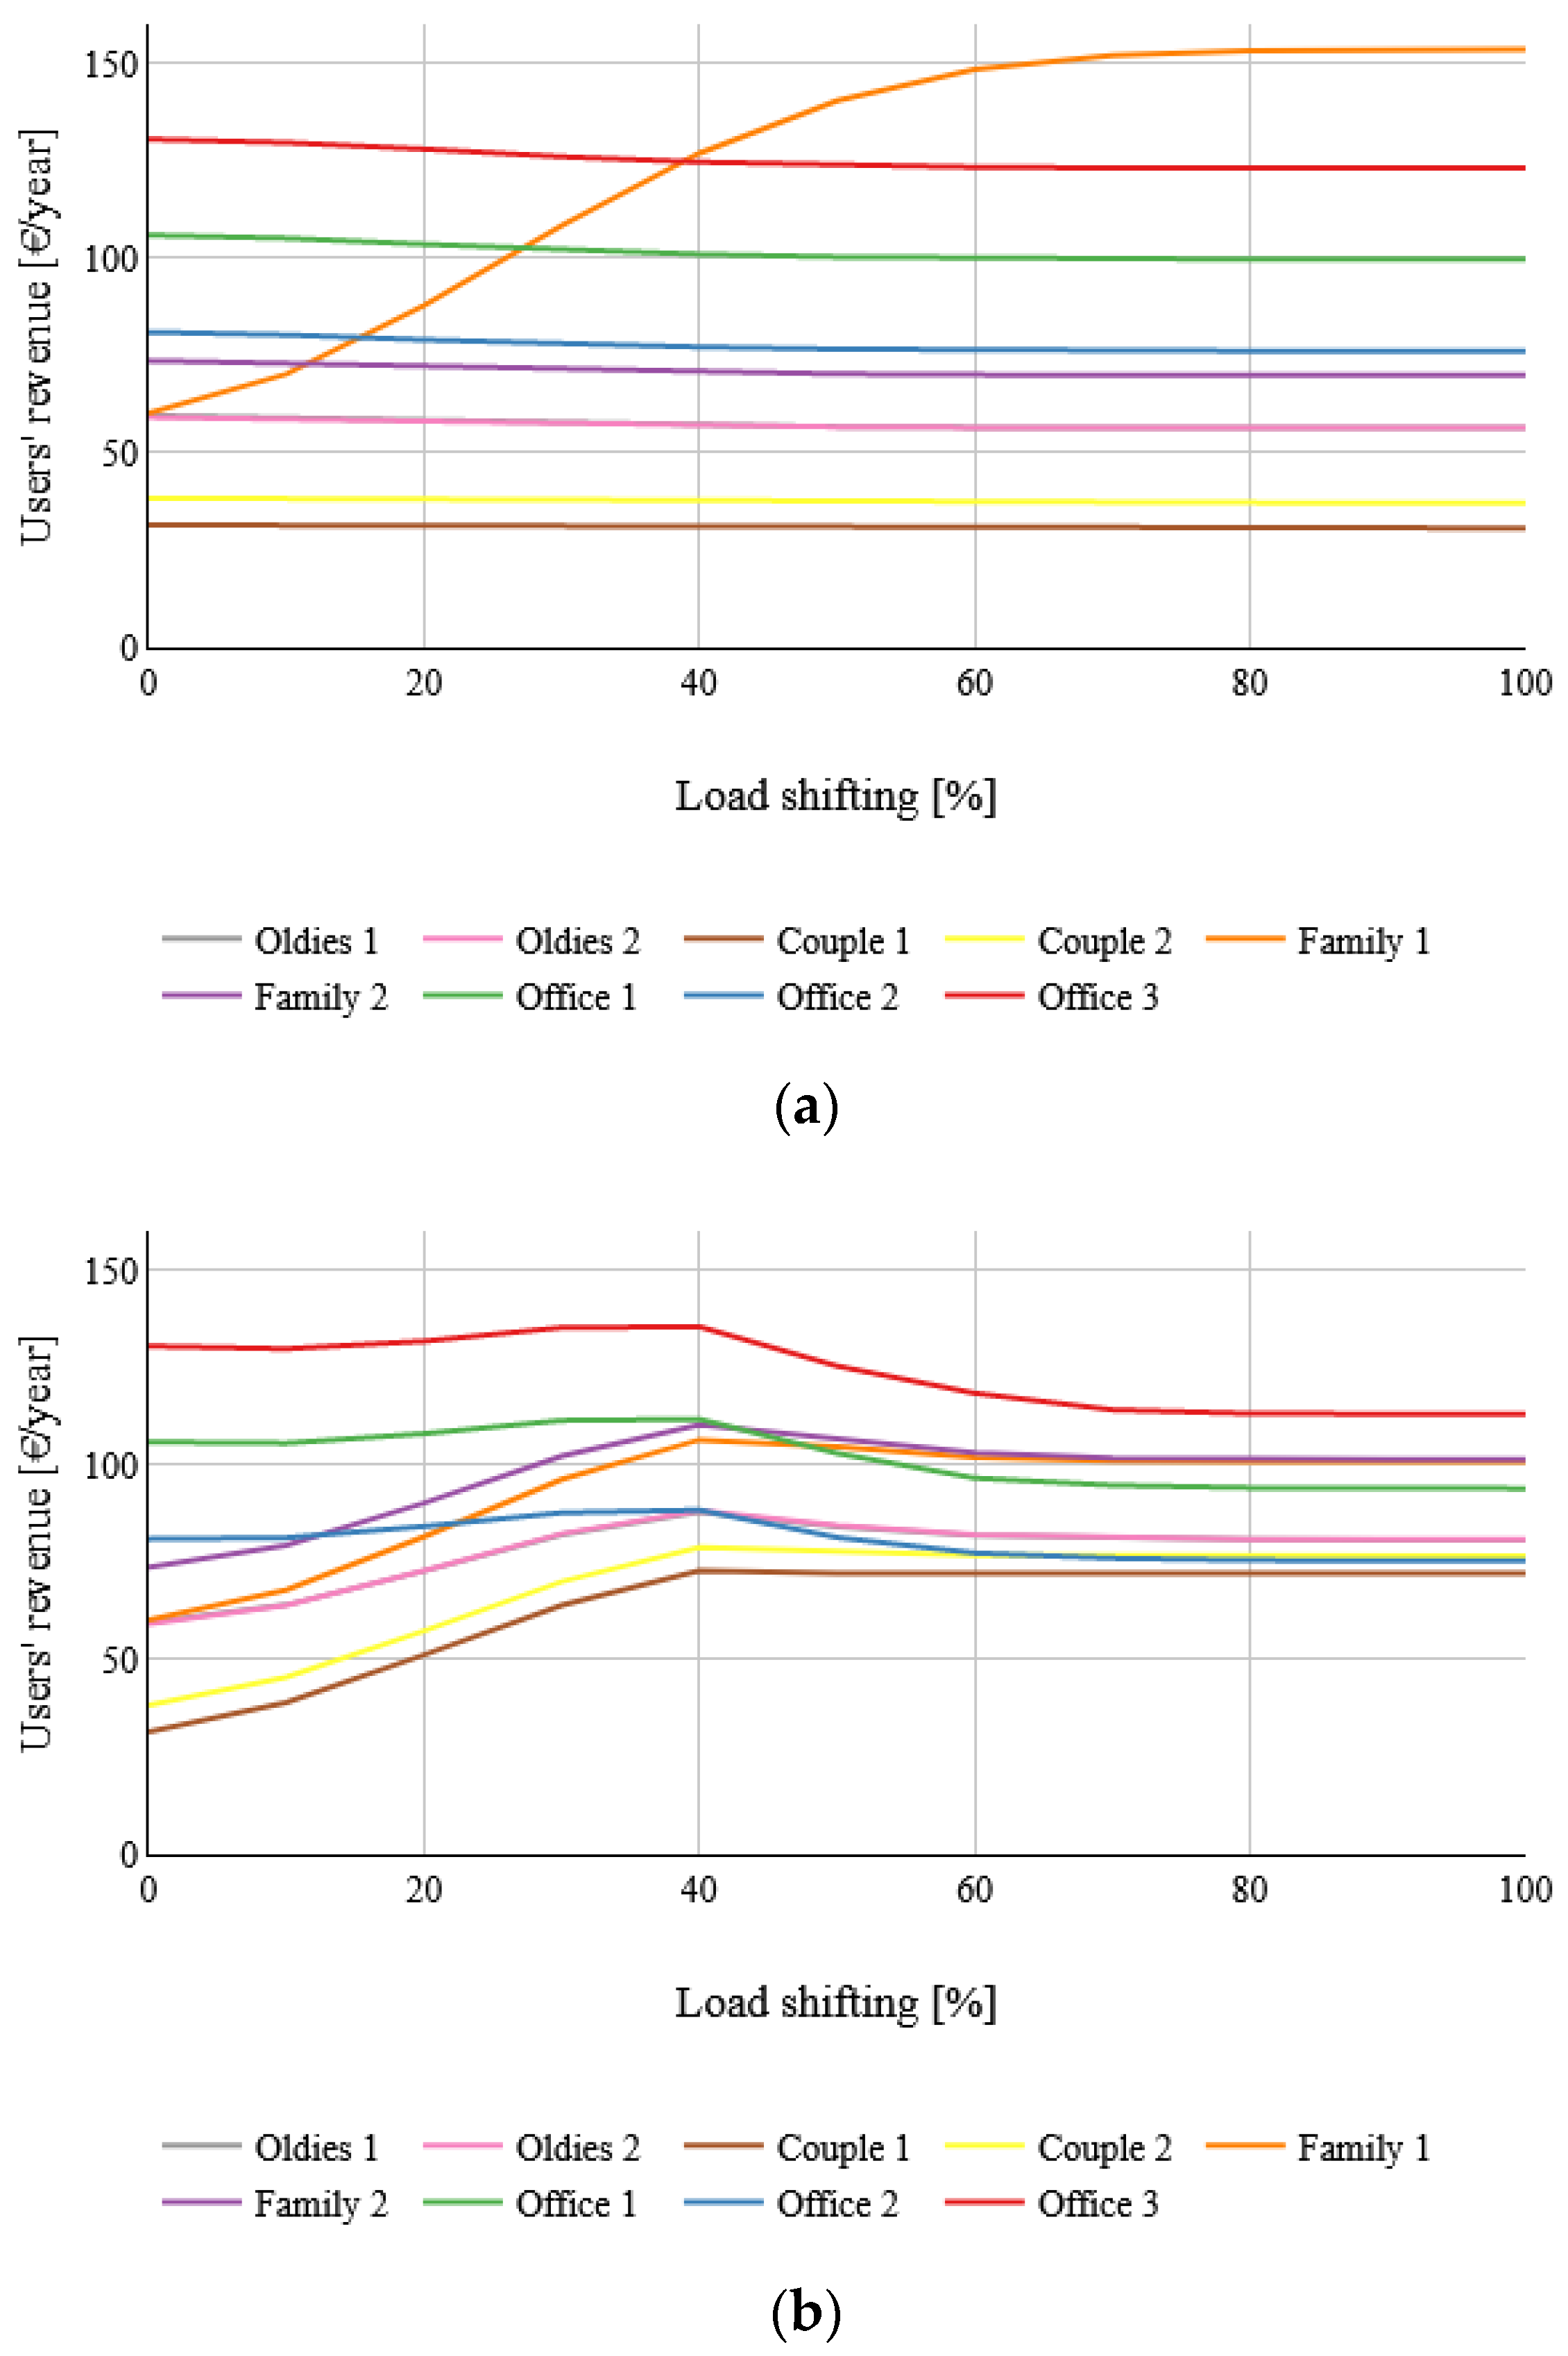
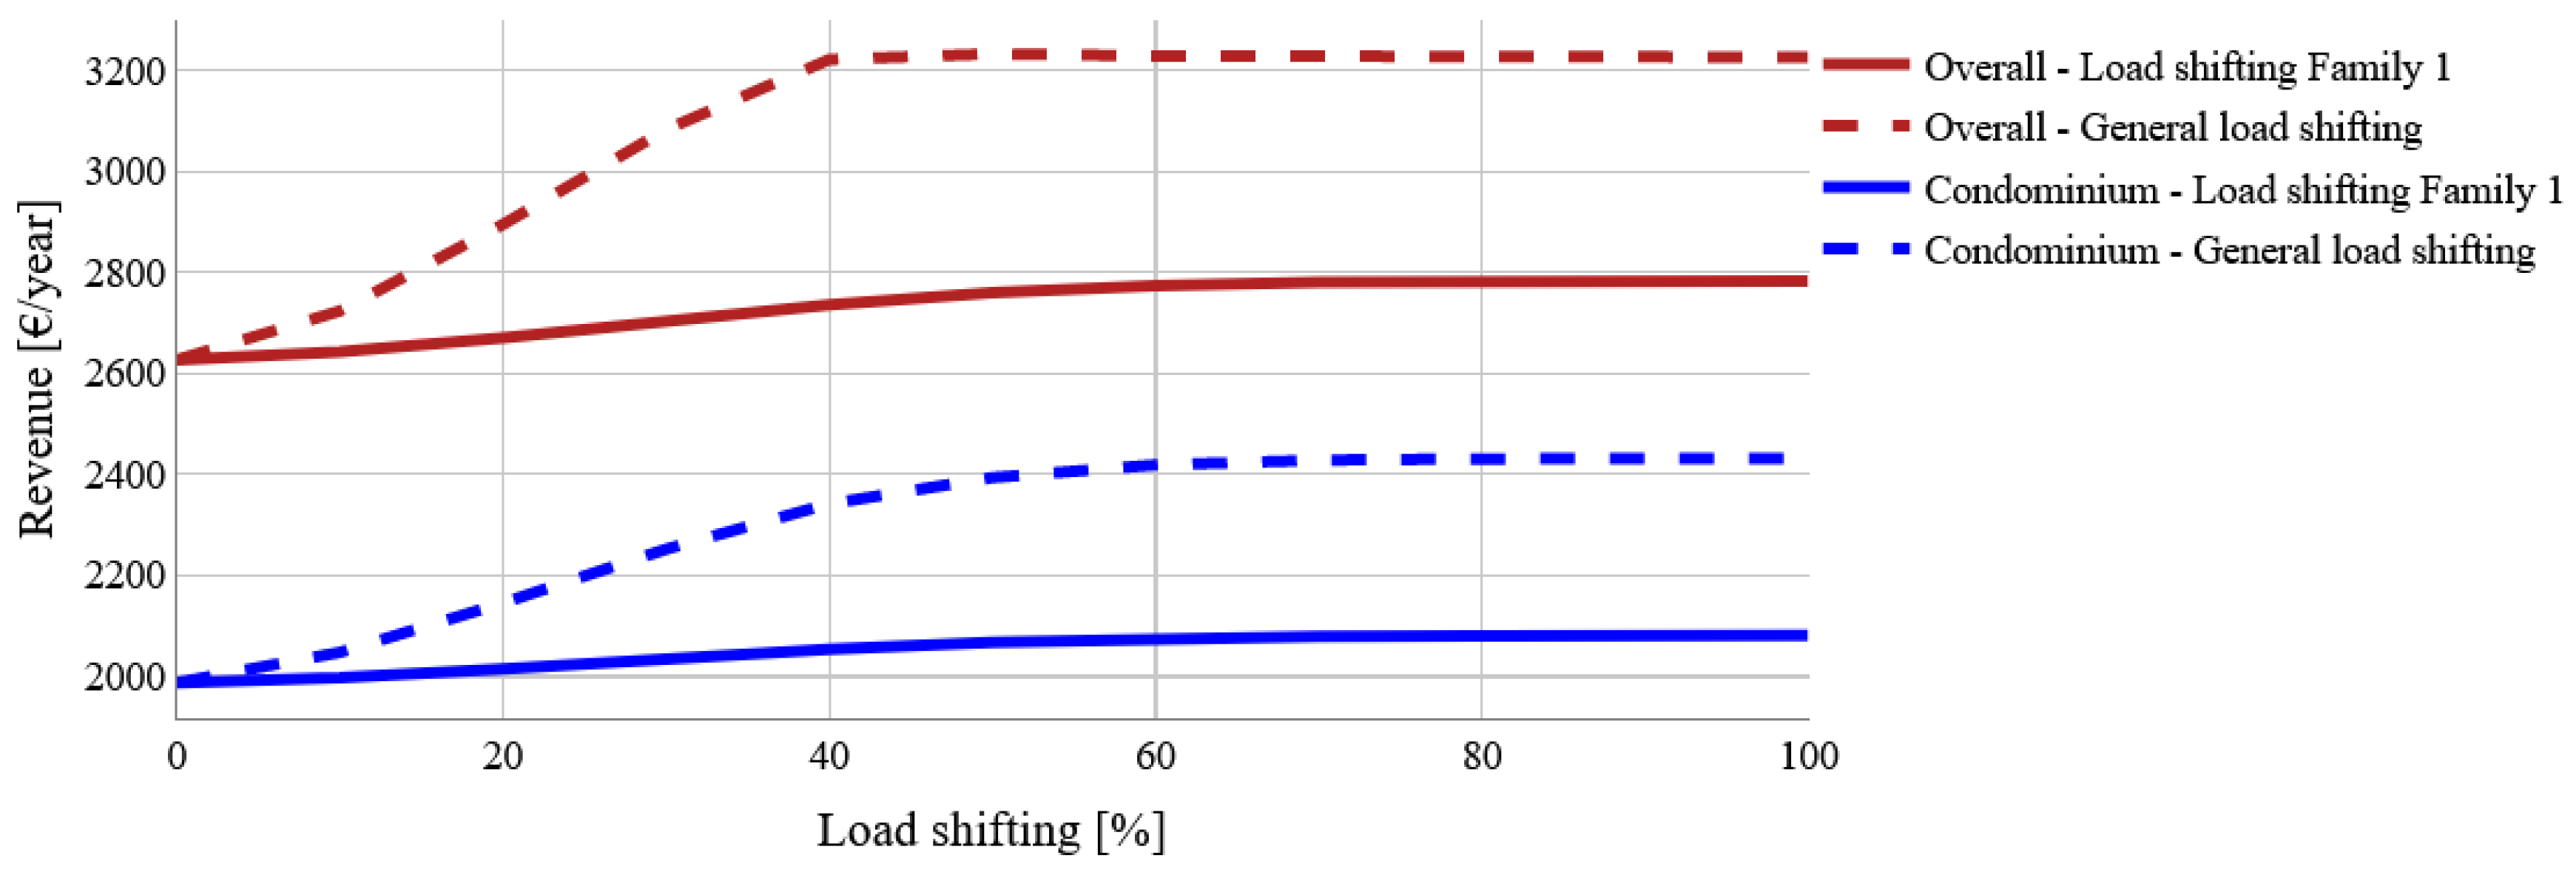
| Stakeholder | Load Shifting (Only Family 1) | ||||
|---|---|---|---|---|---|
| 0% | 25% | 50% | 75% | 100% | |
| Old couple 1 | EUR 60 | EUR 58 | EUR 57 | EUR 57 | EUR 56 |
| Old couple 2 | EUR 59 | EUR 58 | EUR 57 | EUR 57 | EUR 56 |
| Young couple 1 | EUR 31 | EUR 31 | EUR 31 | EUR 31 | EUR 31 |
| Young couple 2 | EUR 38 | EUR 38 | EUR 37 | EUR 37 | EUR 37 |
| Family 1 | EUR 60 | EUR 85 | EUR 120 | EUR 145 | EUR 154 |
| Family 2 | EUR 74 | EUR 72 | EUR 71 | EUR 70 | EUR 70 |
| Office 1 | EUR 106 | EUR 104 | EUR 101 | EUR 100 | EUR 100 |
| Office 2 | EUR 81 | EUR 79 | EUR 77 | EUR 76 | EUR 76 |
| Office 3 | EUR 130 | EUR 128 | EUR 125 | EUR 123 | EUR 123 |
| Condominium | EUR 1987 | EUR 2012 | EUR 2047 | EUR 2073 | EUR 2081 |
| Overall | EUR 2627 | EUR 2666 | EUR 2725 | EUR 2769 | EUR 2783 |
| Stakeholder | Load Shifting (All the Users) | ||||
|---|---|---|---|---|---|
| 0% | 25% | 50% | 75% | 100% | |
| Old couple 1 | EUR 60 | EUR 71 | EUR 87 | EUR 82 | EUR 81 |
| Old couple 2 | EUR 59 | EUR 71 | EUR 88 | EUR 82 | EUR 81 |
| Young couple 1 | EUR 31 | EUR 49 | EUR 71 | EUR 72 | EUR 72 |
| Young couple 2 | EUR 38 | EUR 55 | EUR 77 | EUR 77 | EUR 77 |
| Family 1 | EUR 60 | EUR 79 | EUR 104 | EUR 103 | EUR 101 |
| Family 2 | EUR 74 | EUR 88 | EUR 109 | EUR 105 | EUR 101 |
| Office 1 | EUR 106 | EUR 107 | EUR 113 | EUR 99 | EUR 94 |
| Office 2 | EUR 81 | EUR 84 | EUR 90 | EUR 78 | EUR 75 |
| Office 3 | EUR 130 | EUR 131 | EUR 137 | EUR 121 | EUR 113 |
| Condominium | EUR 1987 | EUR 2130 | EUR 2312 | EUR 2410 | EUR 2431 |
| Overall | EUR 2627 | EUR 2867 | EUR 3187 | EUR 3230 | EUR 3226 |
Publisher’s Note: MDPI stays neutral with regard to jurisdictional claims in published maps and institutional affiliations. |
© 2021 by the authors. Licensee MDPI, Basel, Switzerland. This article is an open access article distributed under the terms and conditions of the Creative Commons Attribution (CC BY) license (https://creativecommons.org/licenses/by/4.0/).
Share and Cite
Zatti, M.; Moncecchi, M.; Gabba, M.; Chiesa, A.; Bovera, F.; Merlo, M. Energy Communities Design Optimization in the Italian Framework. Appl. Sci. 2021, 11, 5218. https://doi.org/10.3390/app11115218
Zatti M, Moncecchi M, Gabba M, Chiesa A, Bovera F, Merlo M. Energy Communities Design Optimization in the Italian Framework. Applied Sciences. 2021; 11(11):5218. https://doi.org/10.3390/app11115218
Chicago/Turabian StyleZatti, Matteo, Matteo Moncecchi, Marco Gabba, Alberto Chiesa, Filippo Bovera, and Marco Merlo. 2021. "Energy Communities Design Optimization in the Italian Framework" Applied Sciences 11, no. 11: 5218. https://doi.org/10.3390/app11115218
APA StyleZatti, M., Moncecchi, M., Gabba, M., Chiesa, A., Bovera, F., & Merlo, M. (2021). Energy Communities Design Optimization in the Italian Framework. Applied Sciences, 11(11), 5218. https://doi.org/10.3390/app11115218