
COMPACT: Concurrent or Ordered Matrix-Based Packing Arrangement Computation Technique


Abstract
:
1. Introduction
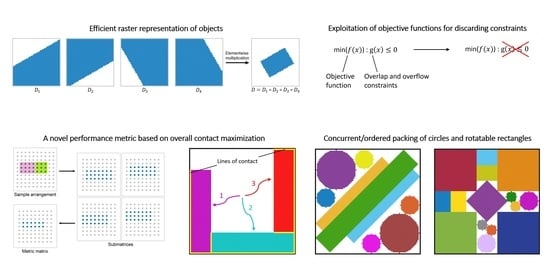
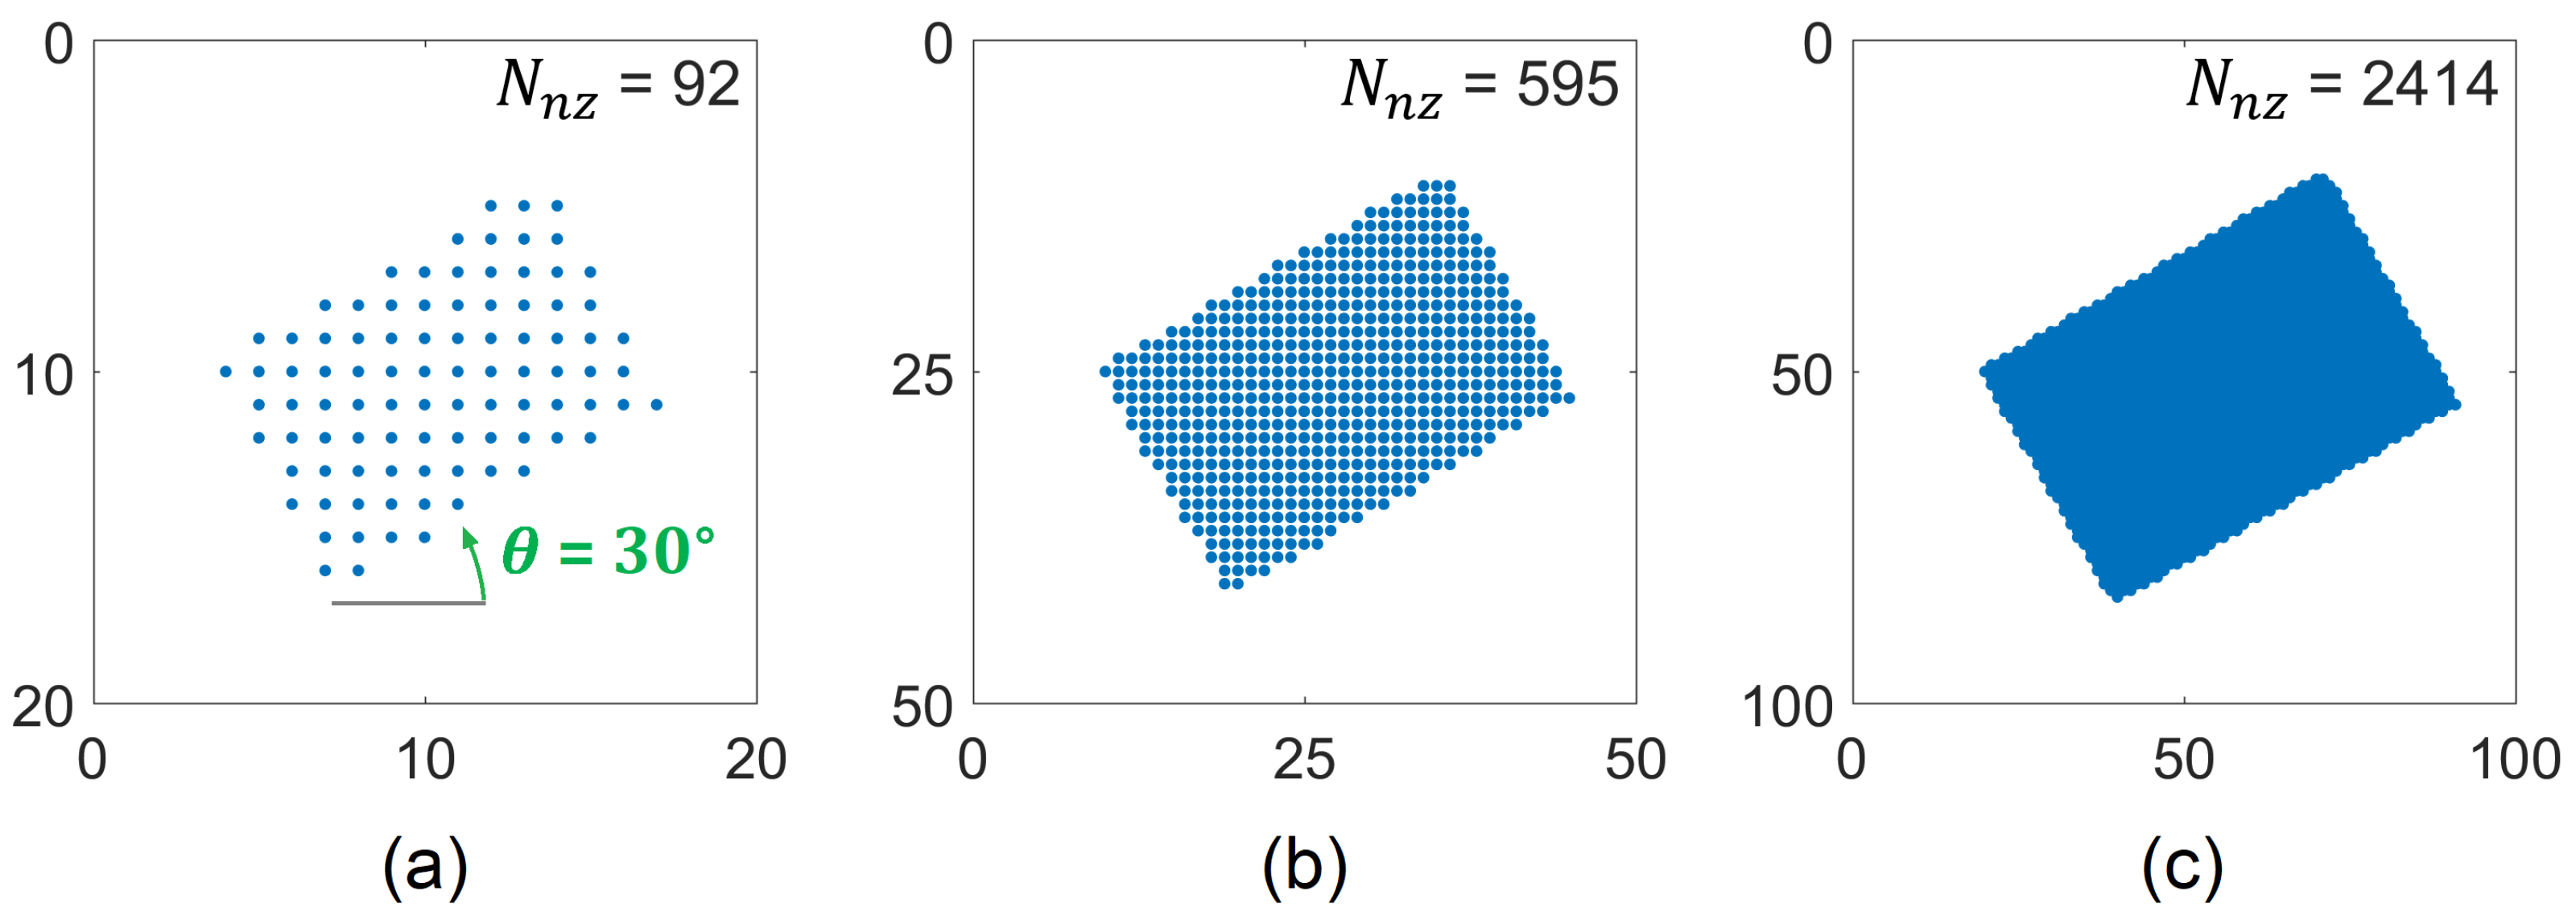
2. Matrix-Based Object Representation
3. Optimization Problem
3.1. Objective Functions
3.1.1. Total Ones (T1)
3.1.2. Distance from the Center (DC)
3.1.3. Distance to the Bottom-Left (DBL)
3.1.4. Adjacent Ones (A1)
- It outperforms other metrics in solving certain problems;
- It is versatile as it delivers satisfactory results for several different cases;
- It is applicable for both concurrent and ordered optimization strategies;
- It can be used with or without explicit constraints while performing well in many unconstrained cases.
3.2. Design Variables
3.3. Nonlinear Constraints
3.3.1. Containment Assurance
3.3.2. Overlap Avoidance
3.4. Optimizer
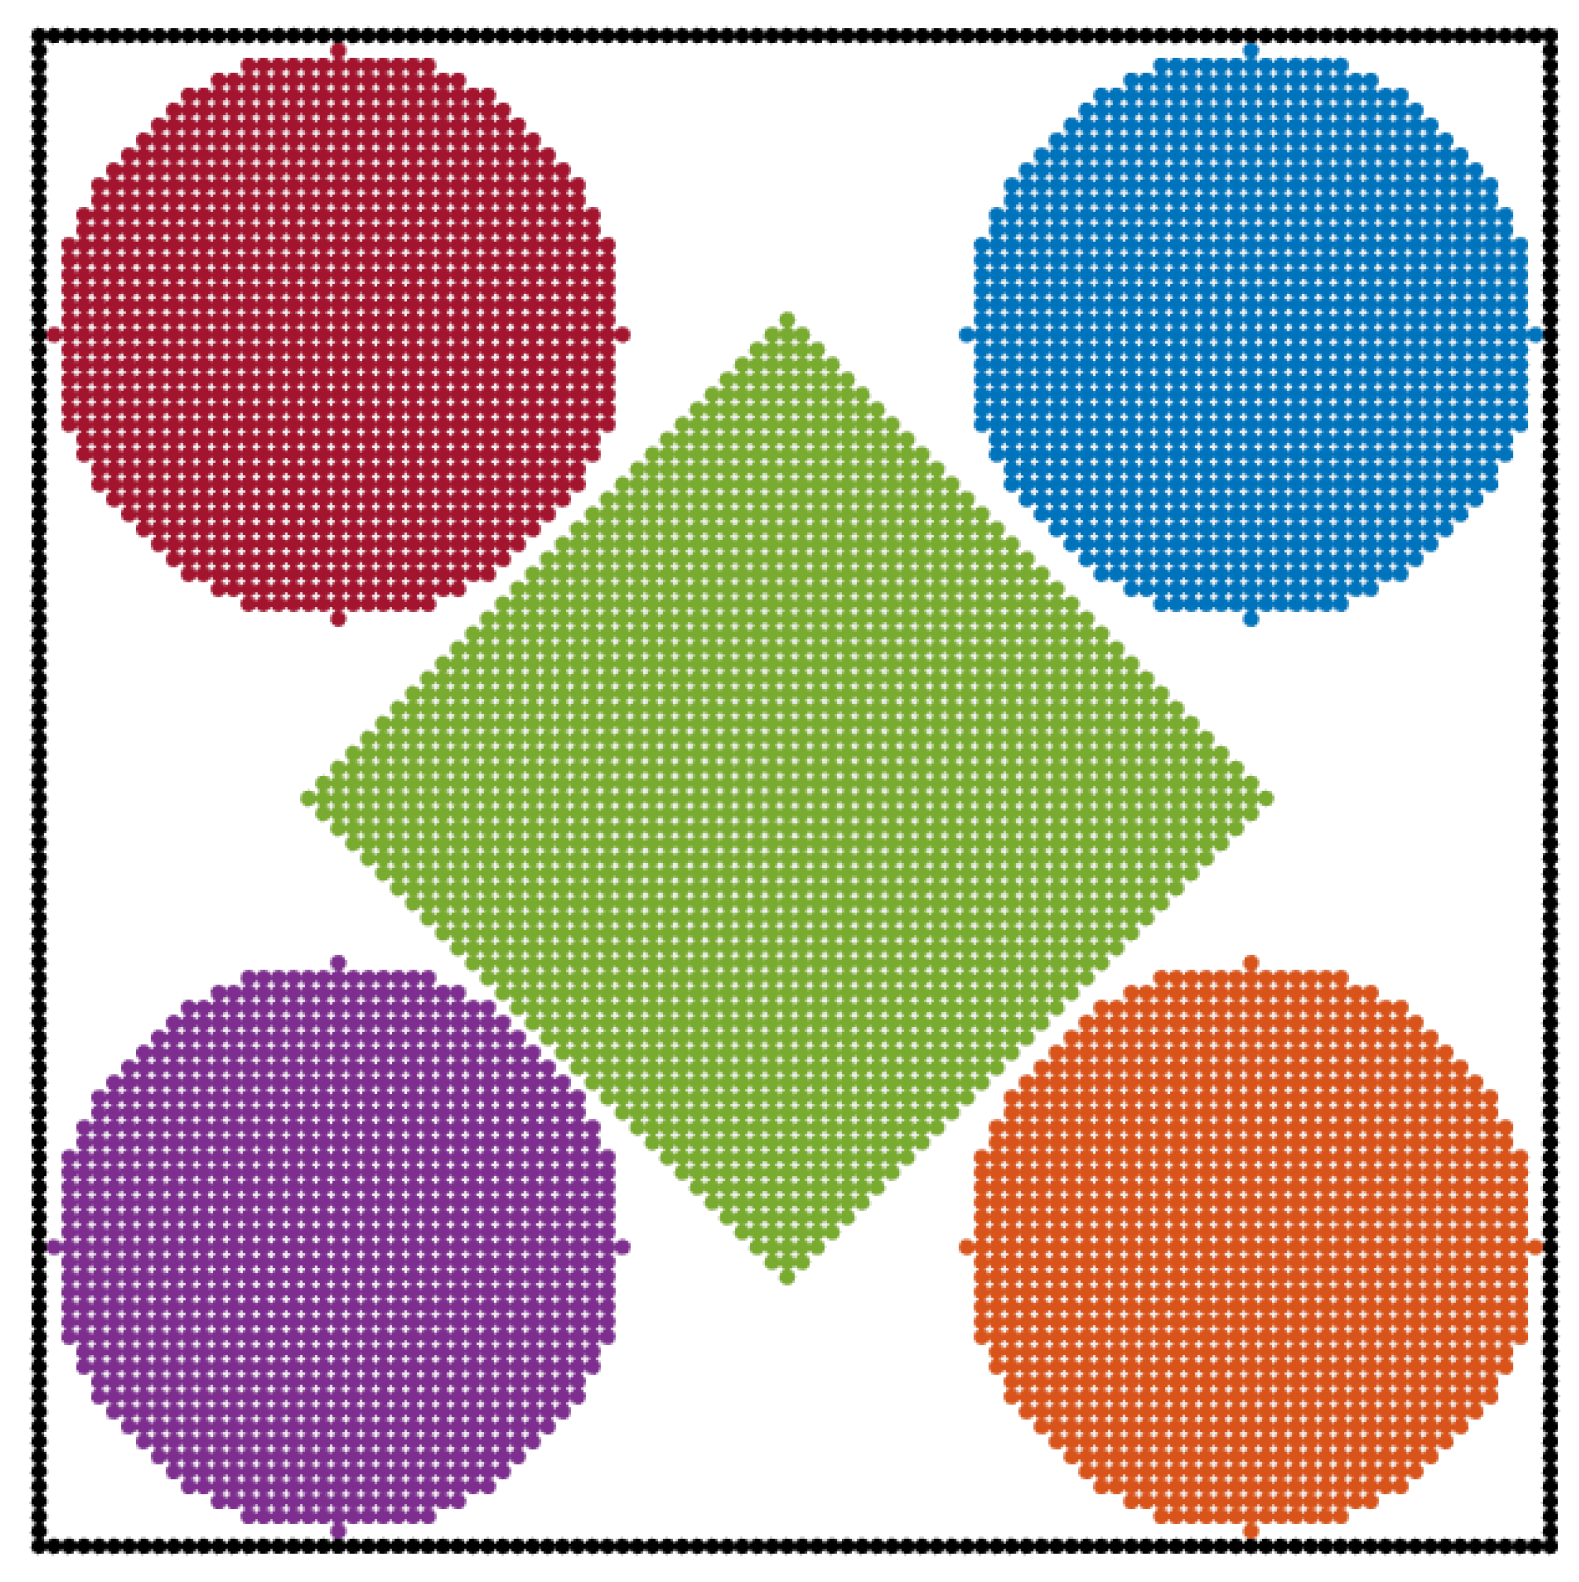
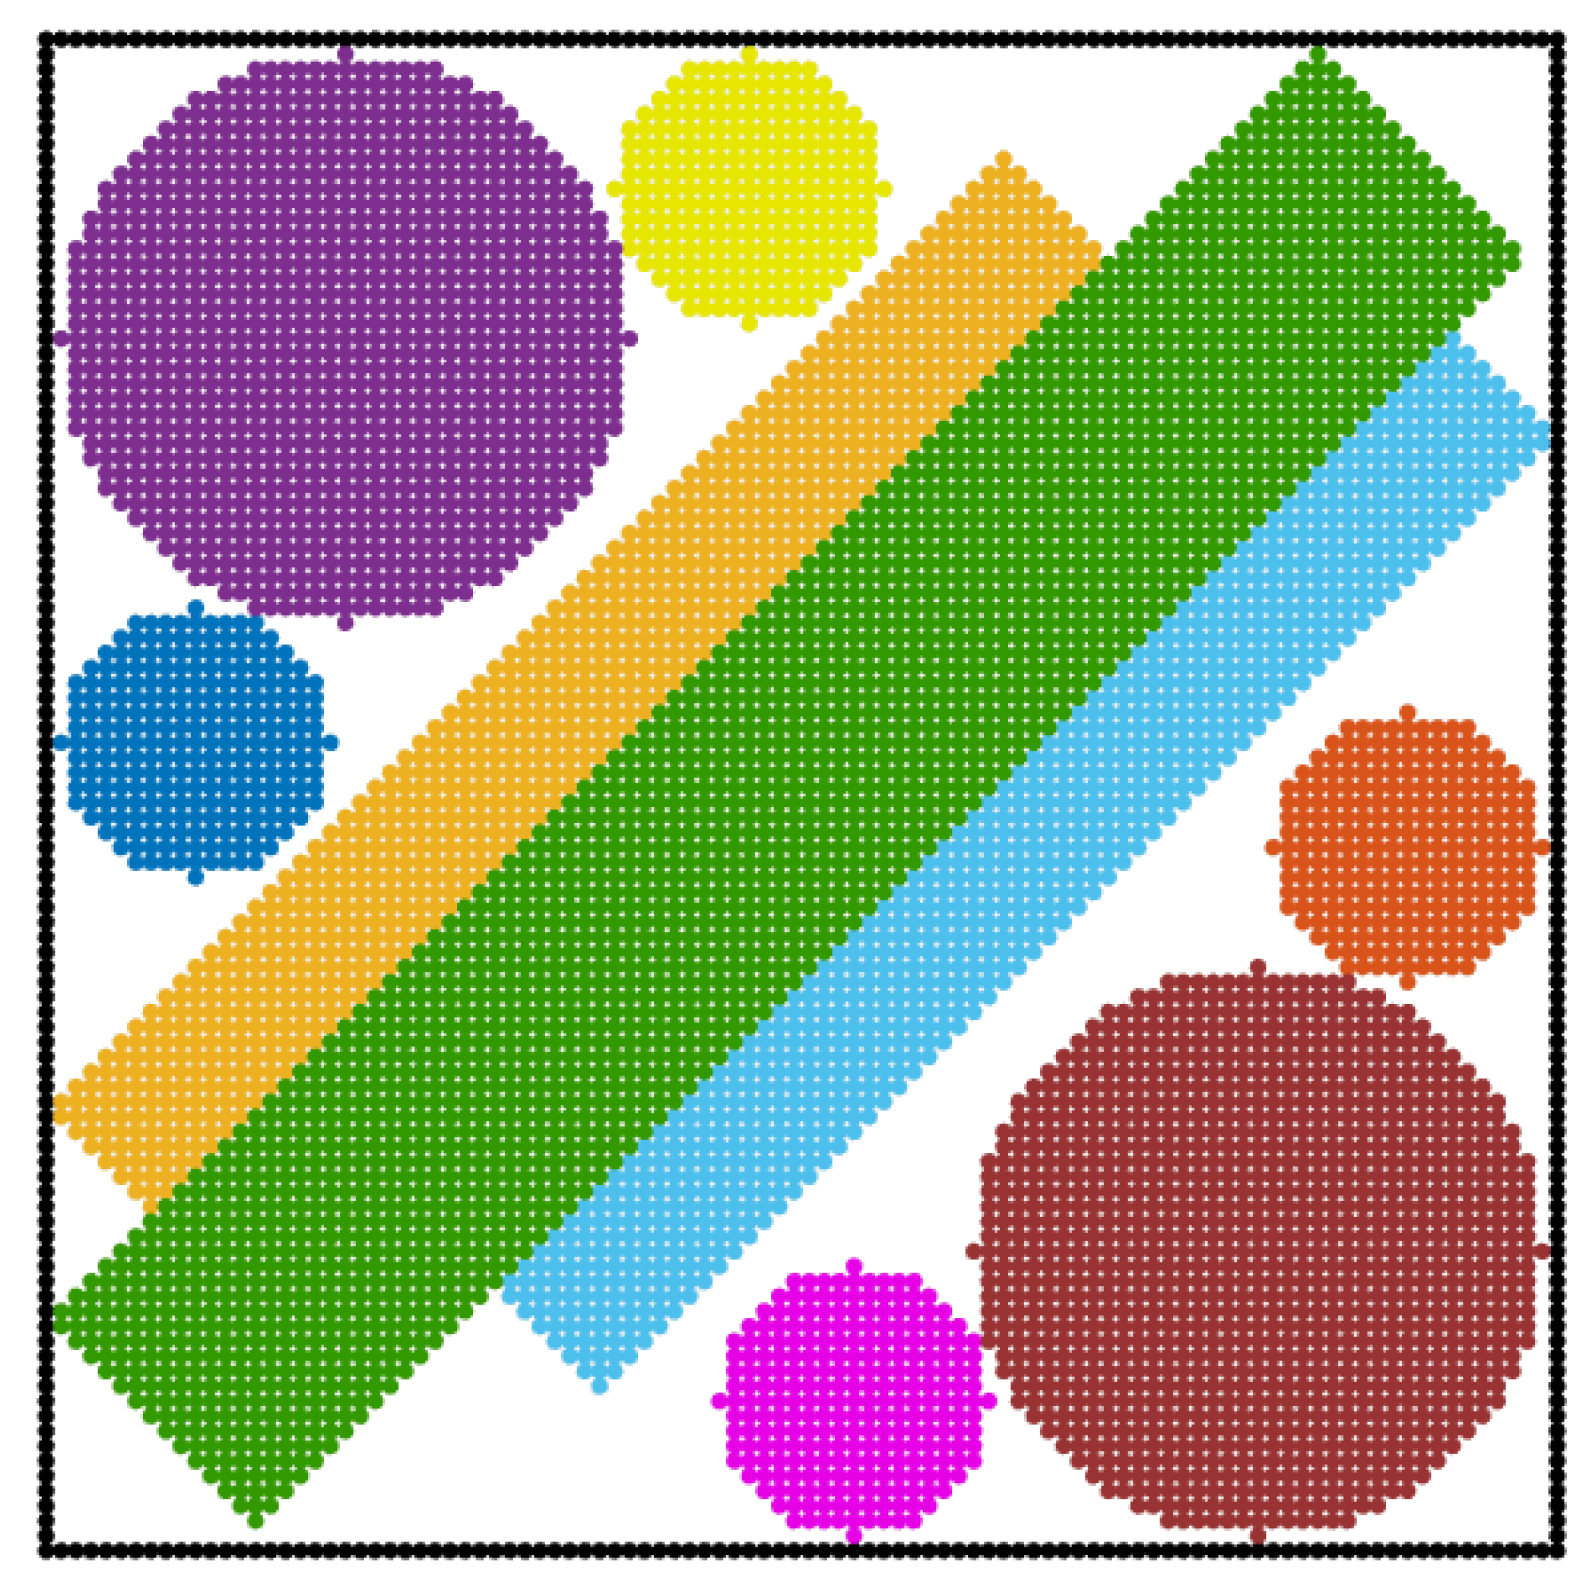
4. Case Studies
4.1. Non-Rotatable Objects
4.2. Rotatable Objects
5. Conclusions
Funding
Institutional Review Board Statement
Informed Consent Statement
Data Availability Statement
Conflicts of Interest
Abbreviations
| A1 | Adjacent ones |
| DBL | Distance to the bottom-left |
| DC | Distance from the center |
| T1 | Total ones |
References
- Chen, M.; Huang, W. A two-level search algorithm for 2D rectangular packing problem. Comput. Ind. Eng. 2007, 53, 123–136. [Google Scholar] [CrossRef]
- Leung, S.C.H.; Zhang, D.; Zhou, C.; Wu, T. A hybrid simulated annealing metaheuristic algorithm for the two-dimensional knapsack packing problem. Comput. Oper. Res. 2012, 39, 64–73. [Google Scholar] [CrossRef]
- Shiangjen, K.; Chaijaruwanich, J.; Srisujjalertwaja, W.; Unachak, P.; Somhom, S. An iterative bidirectional heuristic placement algorithm for solving the two-dimensional knapsack packing problem. Eng. Optim. 2018, 50, 347–365. [Google Scholar] [CrossRef]
- Chen, M.; Wu, C.; Tang, X.; Peng, X.; Zeng, Z.; Liu, S. An efficient deterministic heuristic algorithm for the rectangular packing problem. Comput. Ind. Eng. 2019, 137, 106097. [Google Scholar] [CrossRef]
- Li, Y.; Sang, H.; Xiong, X.; Li, Y. An Improved Adaptive Genetic Algorithm for Two-Dimensional Rectangular Packing Problem. Appl. Sci. 2021, 11, 413. [Google Scholar] [CrossRef]
- Del Valle, A.M.; de Queiroz, T.A.; Miyazawa, F.K.; Xavier, E.C. Heuristics for two-dimensional knapsack and cutting stock problems with items of irregular shape. Expert Syst. Appl. 2012, 39, 12589–12598. [Google Scholar] [CrossRef]
- Chen, M.; Tang, X.; Song, T.; Zeng, Z.; Peng, X.; Liu, S. Greedy heuristic algorithm for packing equal circles into a circular container. Comput. Ind. Eng. 2018, 119, 114–120. [Google Scholar] [CrossRef]
- Bouzid, M.C.; Salhi, S. Packing Rectangles into a Fixed Size Circular Container: Constructive and Metaheuristic Search Approaches. Eur. J. Oper. Res. 2020, 285, 865–883. [Google Scholar] [CrossRef]
- Cherri, L.H.; Mundim, L.R.; Andretta, M.; Toledo, F.M.B.; Oliveira, J.F.; Carravilla, M.A. Robust mixed-integer linear programming models for the irregular strip packing problem. Eur. J. Oper. Res. 2016, 253, 570–583. [Google Scholar] [CrossRef]
- Zhang, W.; Zhang, Q. Finite-circle method for component approximation and packing design optimization. Eng. Optim. 2009, 41, 971–987. [Google Scholar] [CrossRef]
- Martins, T.C.; Tsuzuki, M.S.G. Simulated annealing applied to the irregular rotational placement of shapes over containers with fixed dimensions. Expert Syst. Appl. 2010, 37, 1955–1972. [Google Scholar] [CrossRef]
- Martinez-Sykora, A.; Alvarez-Valdes, R.; Bennell, J.A.; Ruiz, R.; Tamarit, J.M. Matheuristics for the irregular bin packing problem with free rotations. Eur. J. Oper. Res. 2017, 258, 440–455. [Google Scholar] [CrossRef] [Green Version]
- Leao, A.A.S.; Toledo, F.M.B.; Oliveira, J.F.; Carravilla, M.A.; Alvarez-Valdés, R. Irregular packing problems: A review of mathematical models. Eur. J. Oper. Res. 2020, 282, 803–822. [Google Scholar] [CrossRef]
- Toledo, F.M.B.; Carravilla, M.A.; Ribeiro, C.; Oliveira, J.F.; Gomes, A.M. The Dotted-Board Model: A new MIP model for nesting irregular shapes. Int. J. Prod. Econ. 2013, 145, 478–487. [Google Scholar] [CrossRef] [Green Version]
- Mundim, L.R.; Andretta, M.; de Queiroz, T.A. A biased random key genetic algorithm for open dimension nesting problems using no-fit raster. Expert Syst. Appl. 2017, 15, 358–371. [Google Scholar] [CrossRef]
- Sato, A.K.; Martins, T.C.; Gomes, A.M.; Tsuzuki, M.S.G. Raster penetration map applied to the irregular packing problem. Eur. J. Oper. Res. 2019, 279, 657–671. [Google Scholar] [CrossRef]
- Hopper, E.; Turton, B. A Genetic Algorithm for a 2D Industrial Packing Problem. Comput. Ind. Eng. 1999, 37, 375–378. [Google Scholar] [CrossRef]
- Jakobs, S. Theory and Methodology On genetic algorithms for the packing of polygons. Eur. J. Oper. Res. 1996, 88, 165–181. [Google Scholar] [CrossRef]
- Hopper, E.; Turton, B.C.H. An empirical investigation of meta-heuristic and heuristic algorithms for a 2D packing problem. Eur. J. Oper. Res. 2001, 128, 34–57. [Google Scholar] [CrossRef]


| Number of Objects | (Height, Width) | ||||||||
|---|---|---|---|---|---|---|---|---|---|
| 4 | (50, 60) | (50, 40) | (30, 100) | (20, 100) | |||||
| 5 | (50, 60) | (50, 40) | (30, 70) | (30, 30) | (20, 100) | ||||
| 6 | (50, 60) | (50, 40) | (20, 70) | (10, 70) | (30, 30) | (20, 100) | |||
| 7 | (50, 60) | (50, 40) | (20, 70) | (10, 70) | (30, 20) | (30, 10) | (20, 100) | ||
| 8 | (50, 60) | (50, 40) | (20, 70) | (10, 70) | (30, 20) | (30, 10) | (15, 100) | (5, 100) | |
| 9 | (50, 60) | (50, 40) | (15, 70) | (5, 70) | (10, 70) | (30, 20) | (30, 10) | (15, 100) | (5, 100) |
| Optimization Strategy | Objective Function | Number of Objects | ||||||
|---|---|---|---|---|---|---|---|---|
| 4 | 5 | 6 | 7 | 8 | 9 | |||
| Concurrent | 100% | 84% | 51% | 42% | 23% | 5% | ||
| 100% | 78% | 42% | 46% | 27% | 9% | |||
| Ordered | Diagonal length-wise ordering | 100% | 100% | 41% | 49% | 45% | 20% | |
| 100% | 100% | 99% | 99% | 100% | 94% | |||
| 100% | 100% | 81% | 81% | 73% | 75% | |||
| Area-wise ordering | 100% | 100% | 100% | 51% | 6% | 7% | ||
| 100% | 100% | 100% | 100% | 13% | 24% | |||
| 100% | 100% | 98% | 100% | 9% | 6% | |||
| Quantity | Height | Width |
|---|---|---|
| 2 | 80 | 20 |
| 2 | 20 | 80 |
| 2 | 40 | 20 |
| 2 | 20 | 40 |
| 1 | 20 | 20 |
| Rectangle | Circle | |||
|---|---|---|---|---|
| Quantity | Height | Width | Quantity | Diameter |
| 1 | 10 | 120 | 2 | 39 |
| 2 | 10 | 90 | 4 | 19 |
| Rectangle | Circle | |||
|---|---|---|---|---|
| Quantity | Height | Width | Quantity | Diameter |
| 4 | 40 | 40 | 2 | 19 |
| 1 | 28 | 28 | 4 | 11 |
| 4 | 20 | 15 | ||
Publisher’s Note: MDPI stays neutral with regard to jurisdictional claims in published maps and institutional affiliations. |
© 2021 by the author. Licensee MDPI, Basel, Switzerland. This article is an open access article distributed under the terms and conditions of the Creative Commons Attribution (CC BY) license (https://creativecommons.org/licenses/by/4.0/).
Share and Cite
Serhat, G. COMPACT: Concurrent or Ordered Matrix-Based Packing Arrangement Computation Technique. Appl. Sci. 2021, 11, 5217. https://doi.org/10.3390/app11115217
Serhat G. COMPACT: Concurrent or Ordered Matrix-Based Packing Arrangement Computation Technique. Applied Sciences. 2021; 11(11):5217. https://doi.org/10.3390/app11115217
Chicago/Turabian StyleSerhat, Gokhan. 2021. "COMPACT: Concurrent or Ordered Matrix-Based Packing Arrangement Computation Technique" Applied Sciences 11, no. 11: 5217. https://doi.org/10.3390/app11115217
APA StyleSerhat, G. (2021). COMPACT: Concurrent or Ordered Matrix-Based Packing Arrangement Computation Technique. Applied Sciences, 11(11), 5217. https://doi.org/10.3390/app11115217