
Analysis and Mapping of Detailed Inner Information of Crystalline Grain by Wavelength-Resolved Neutron Transmission Imaging with Individual Bragg-Dip Profile-Fitting Analysis

 , ,
, ,  and
and
Abstract
1. Introduction
2. Time-of-Flight Neutron Transmission Imaging Experiment
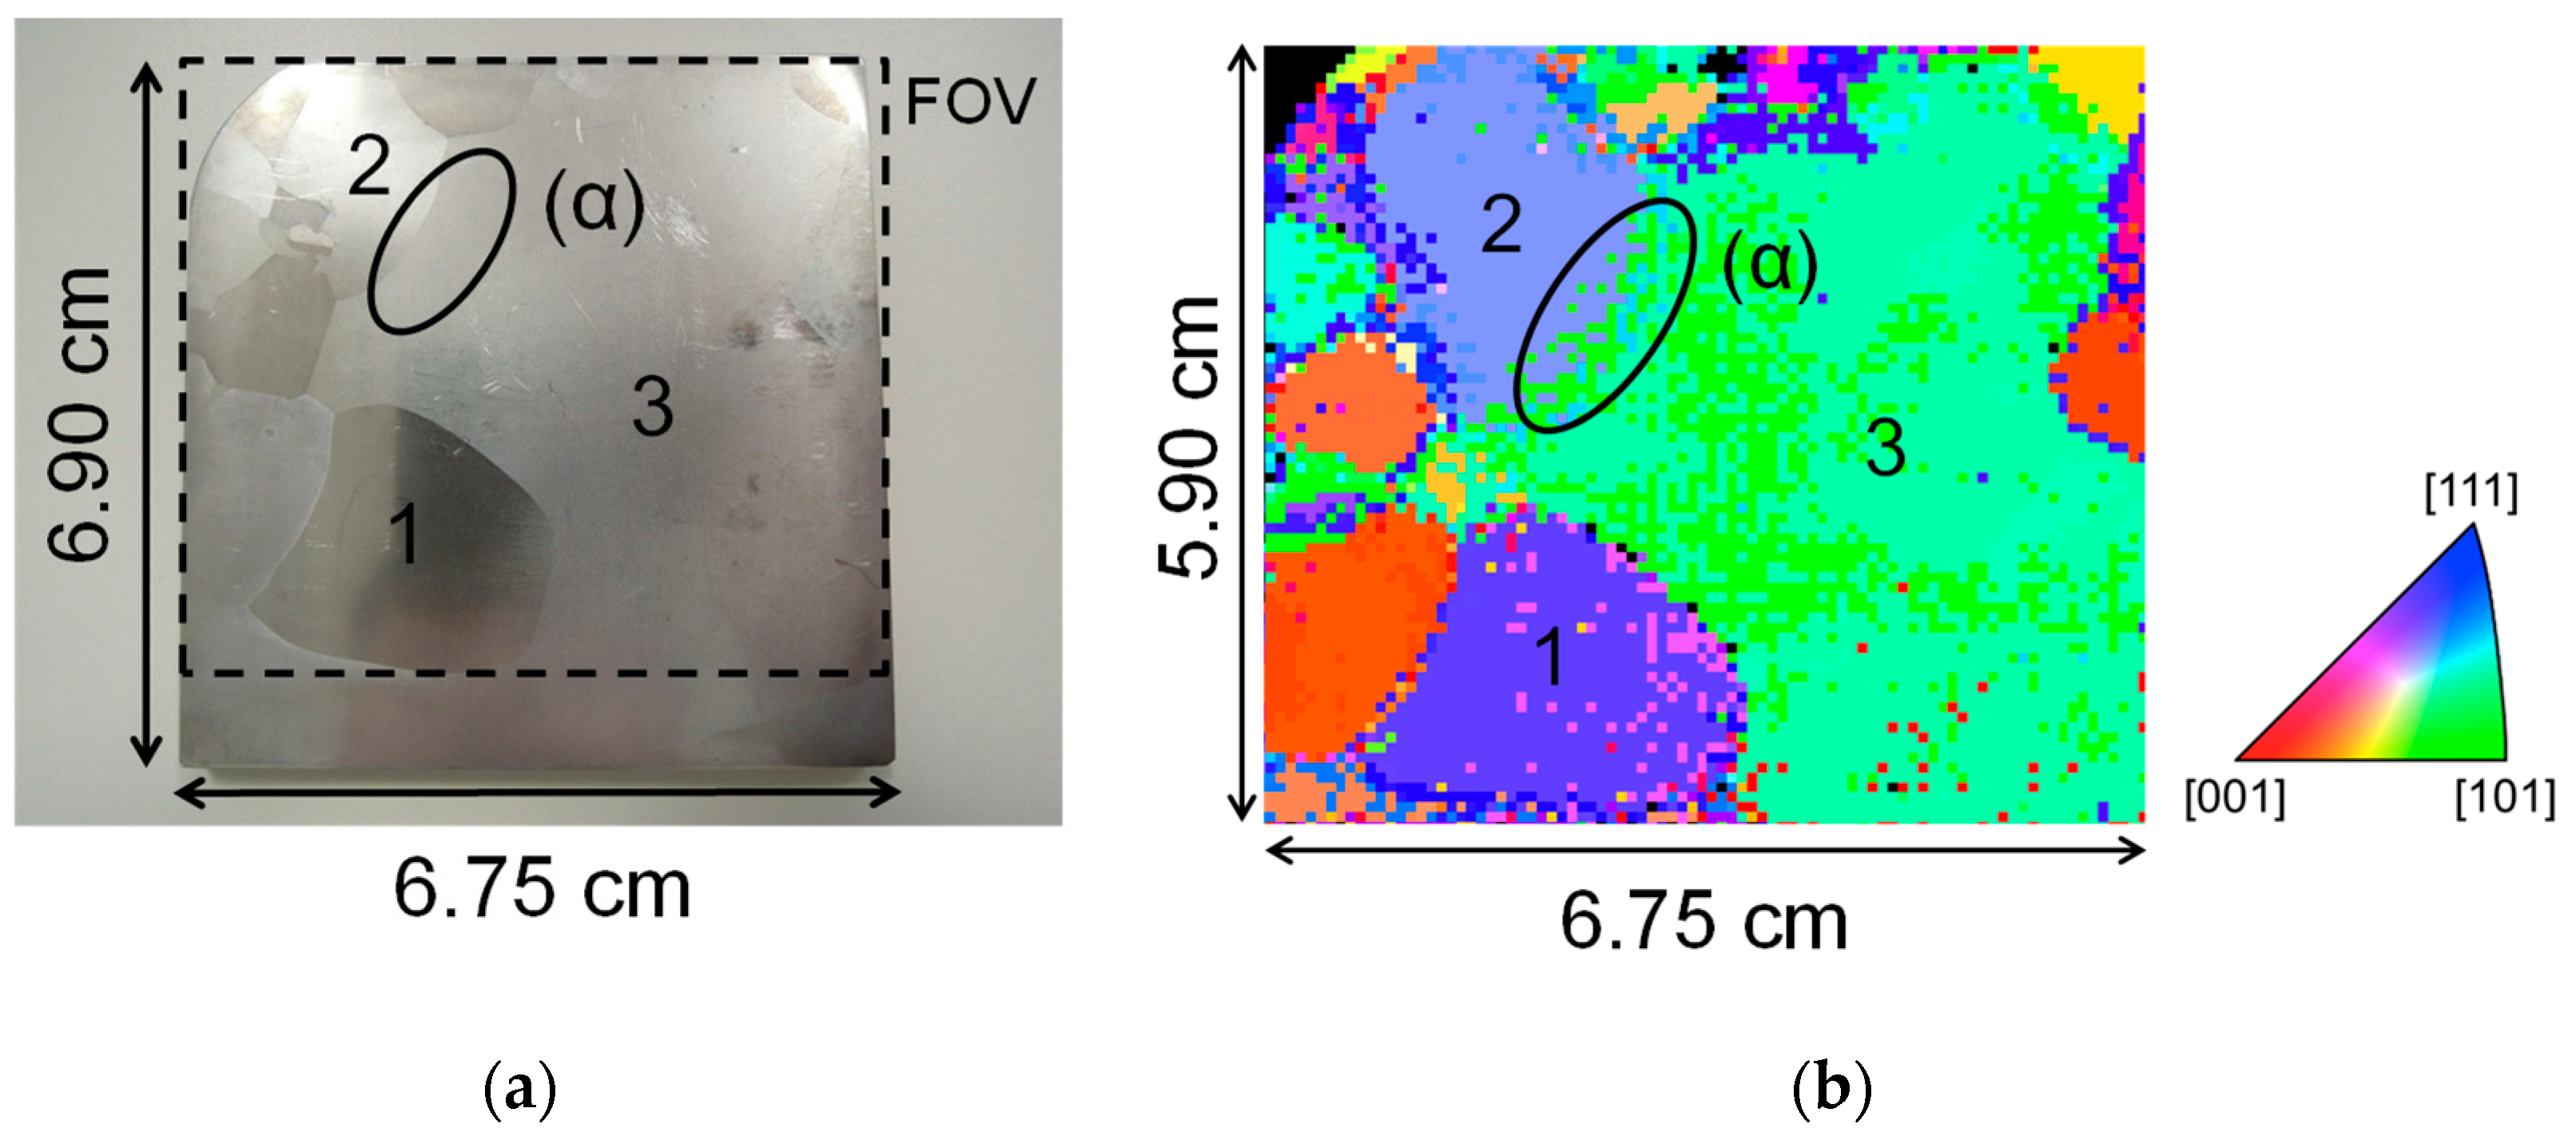
2.1. Sample
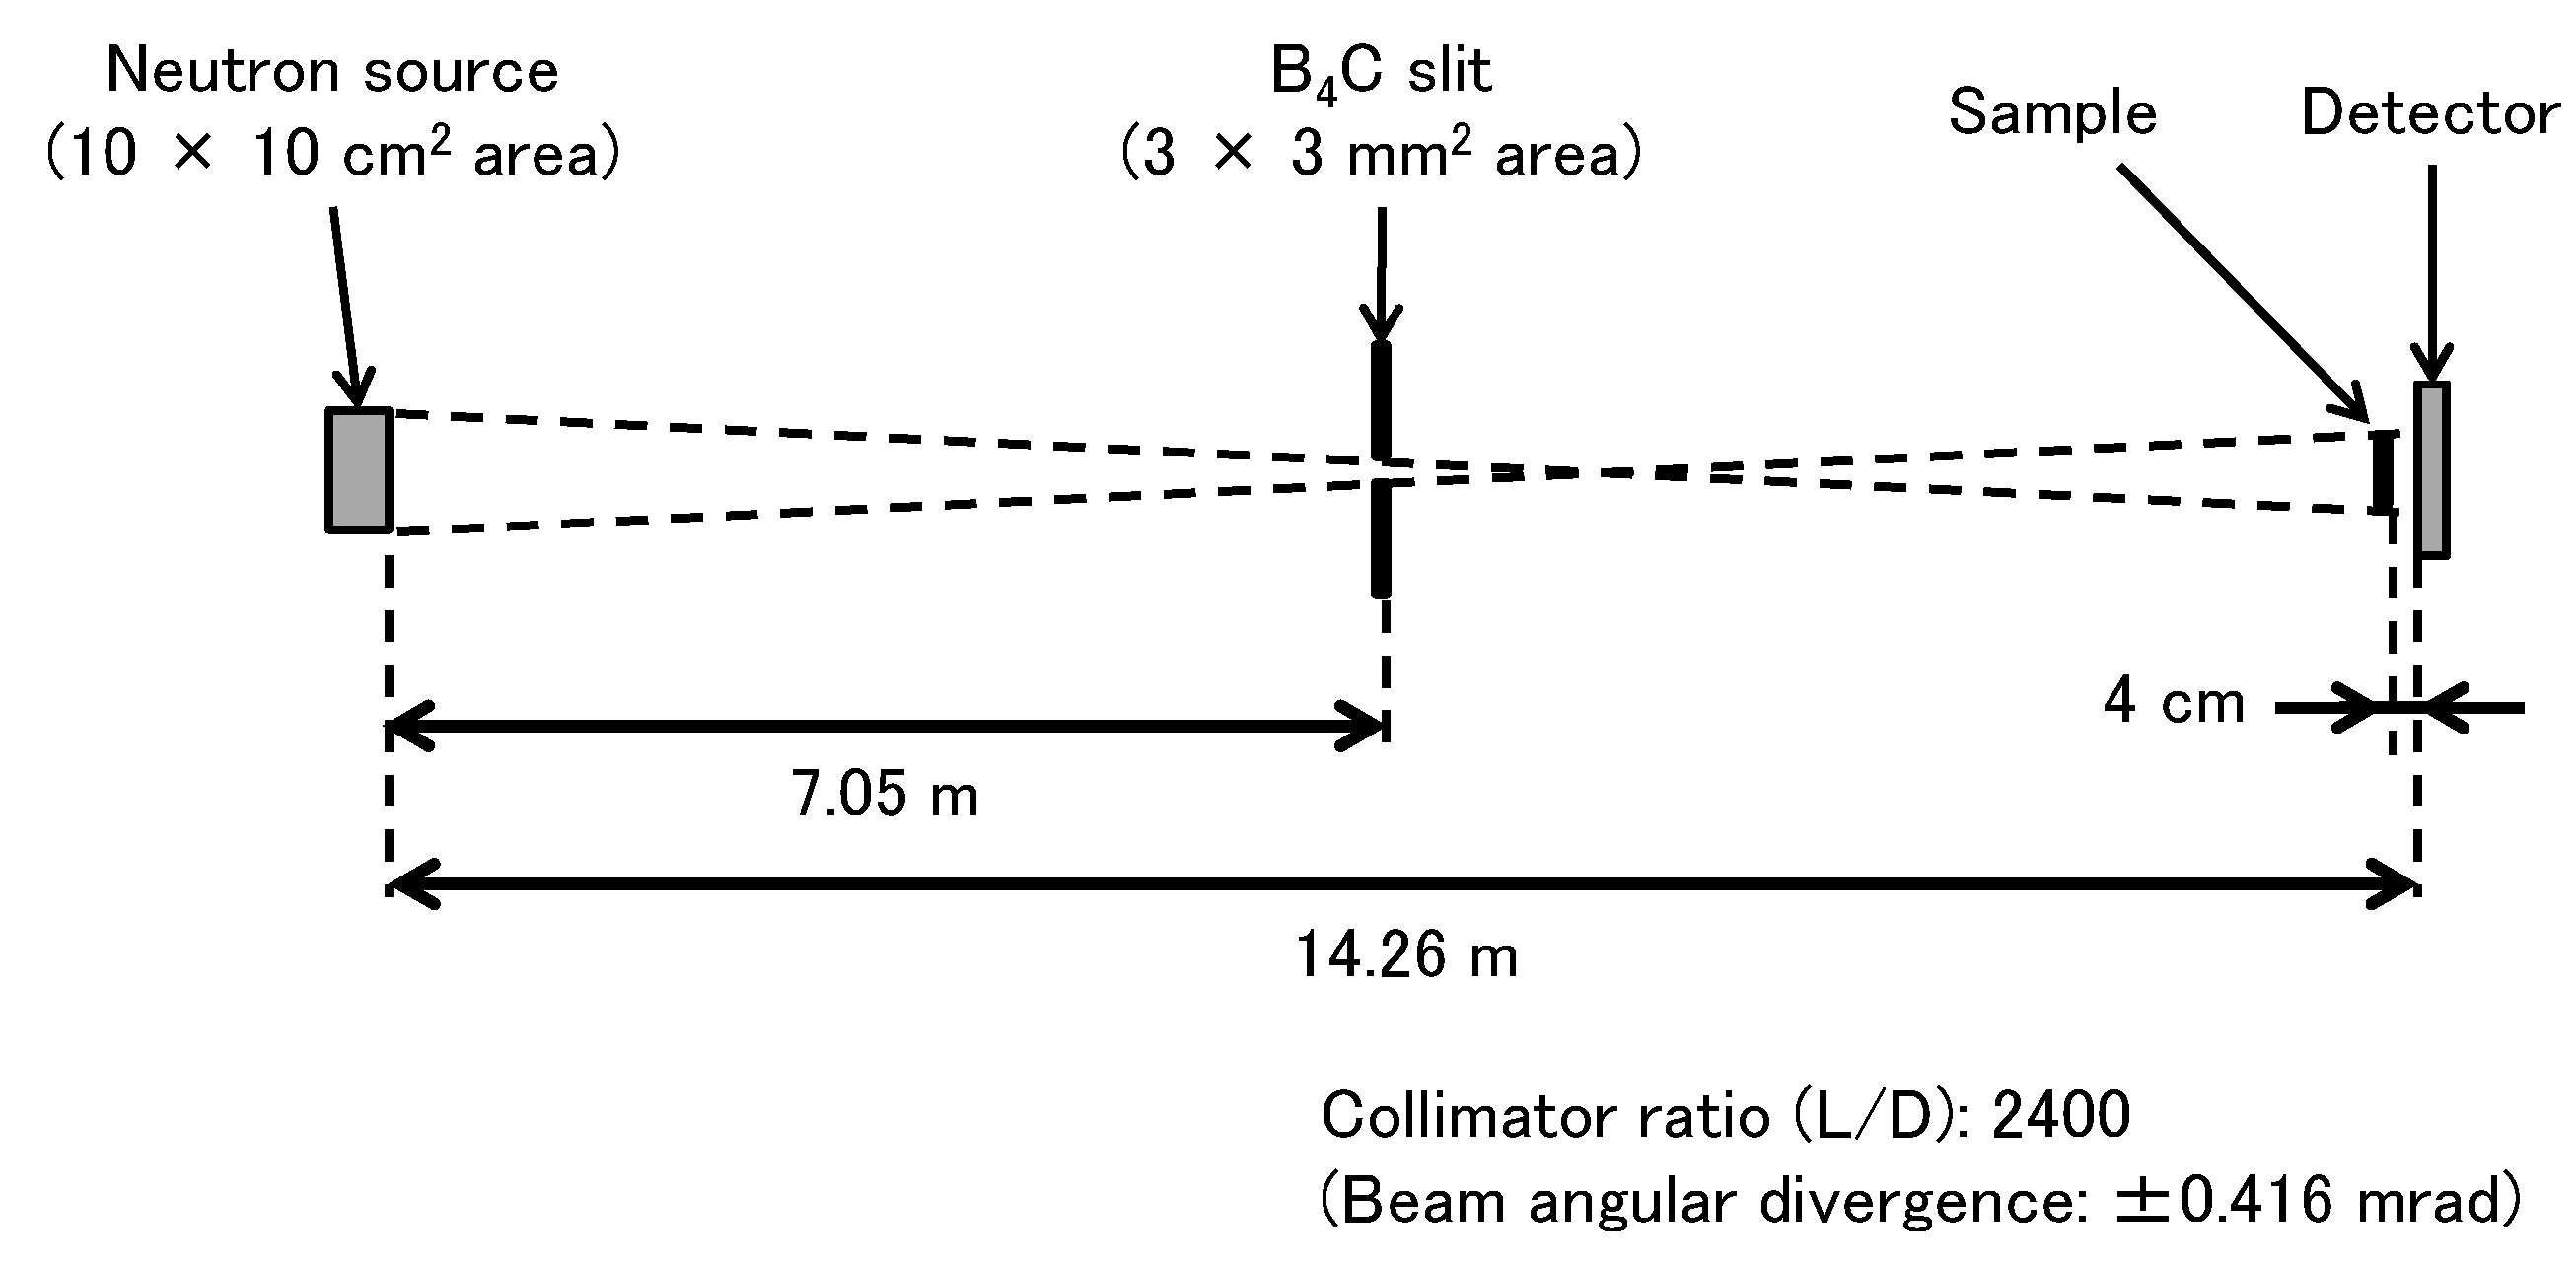
2.2. Experimental
3. Single Bragg-Dip Profile-Fitting Analysis Method
3.1. Crystallographic Information Obtained from a Bragg-Dip Profile
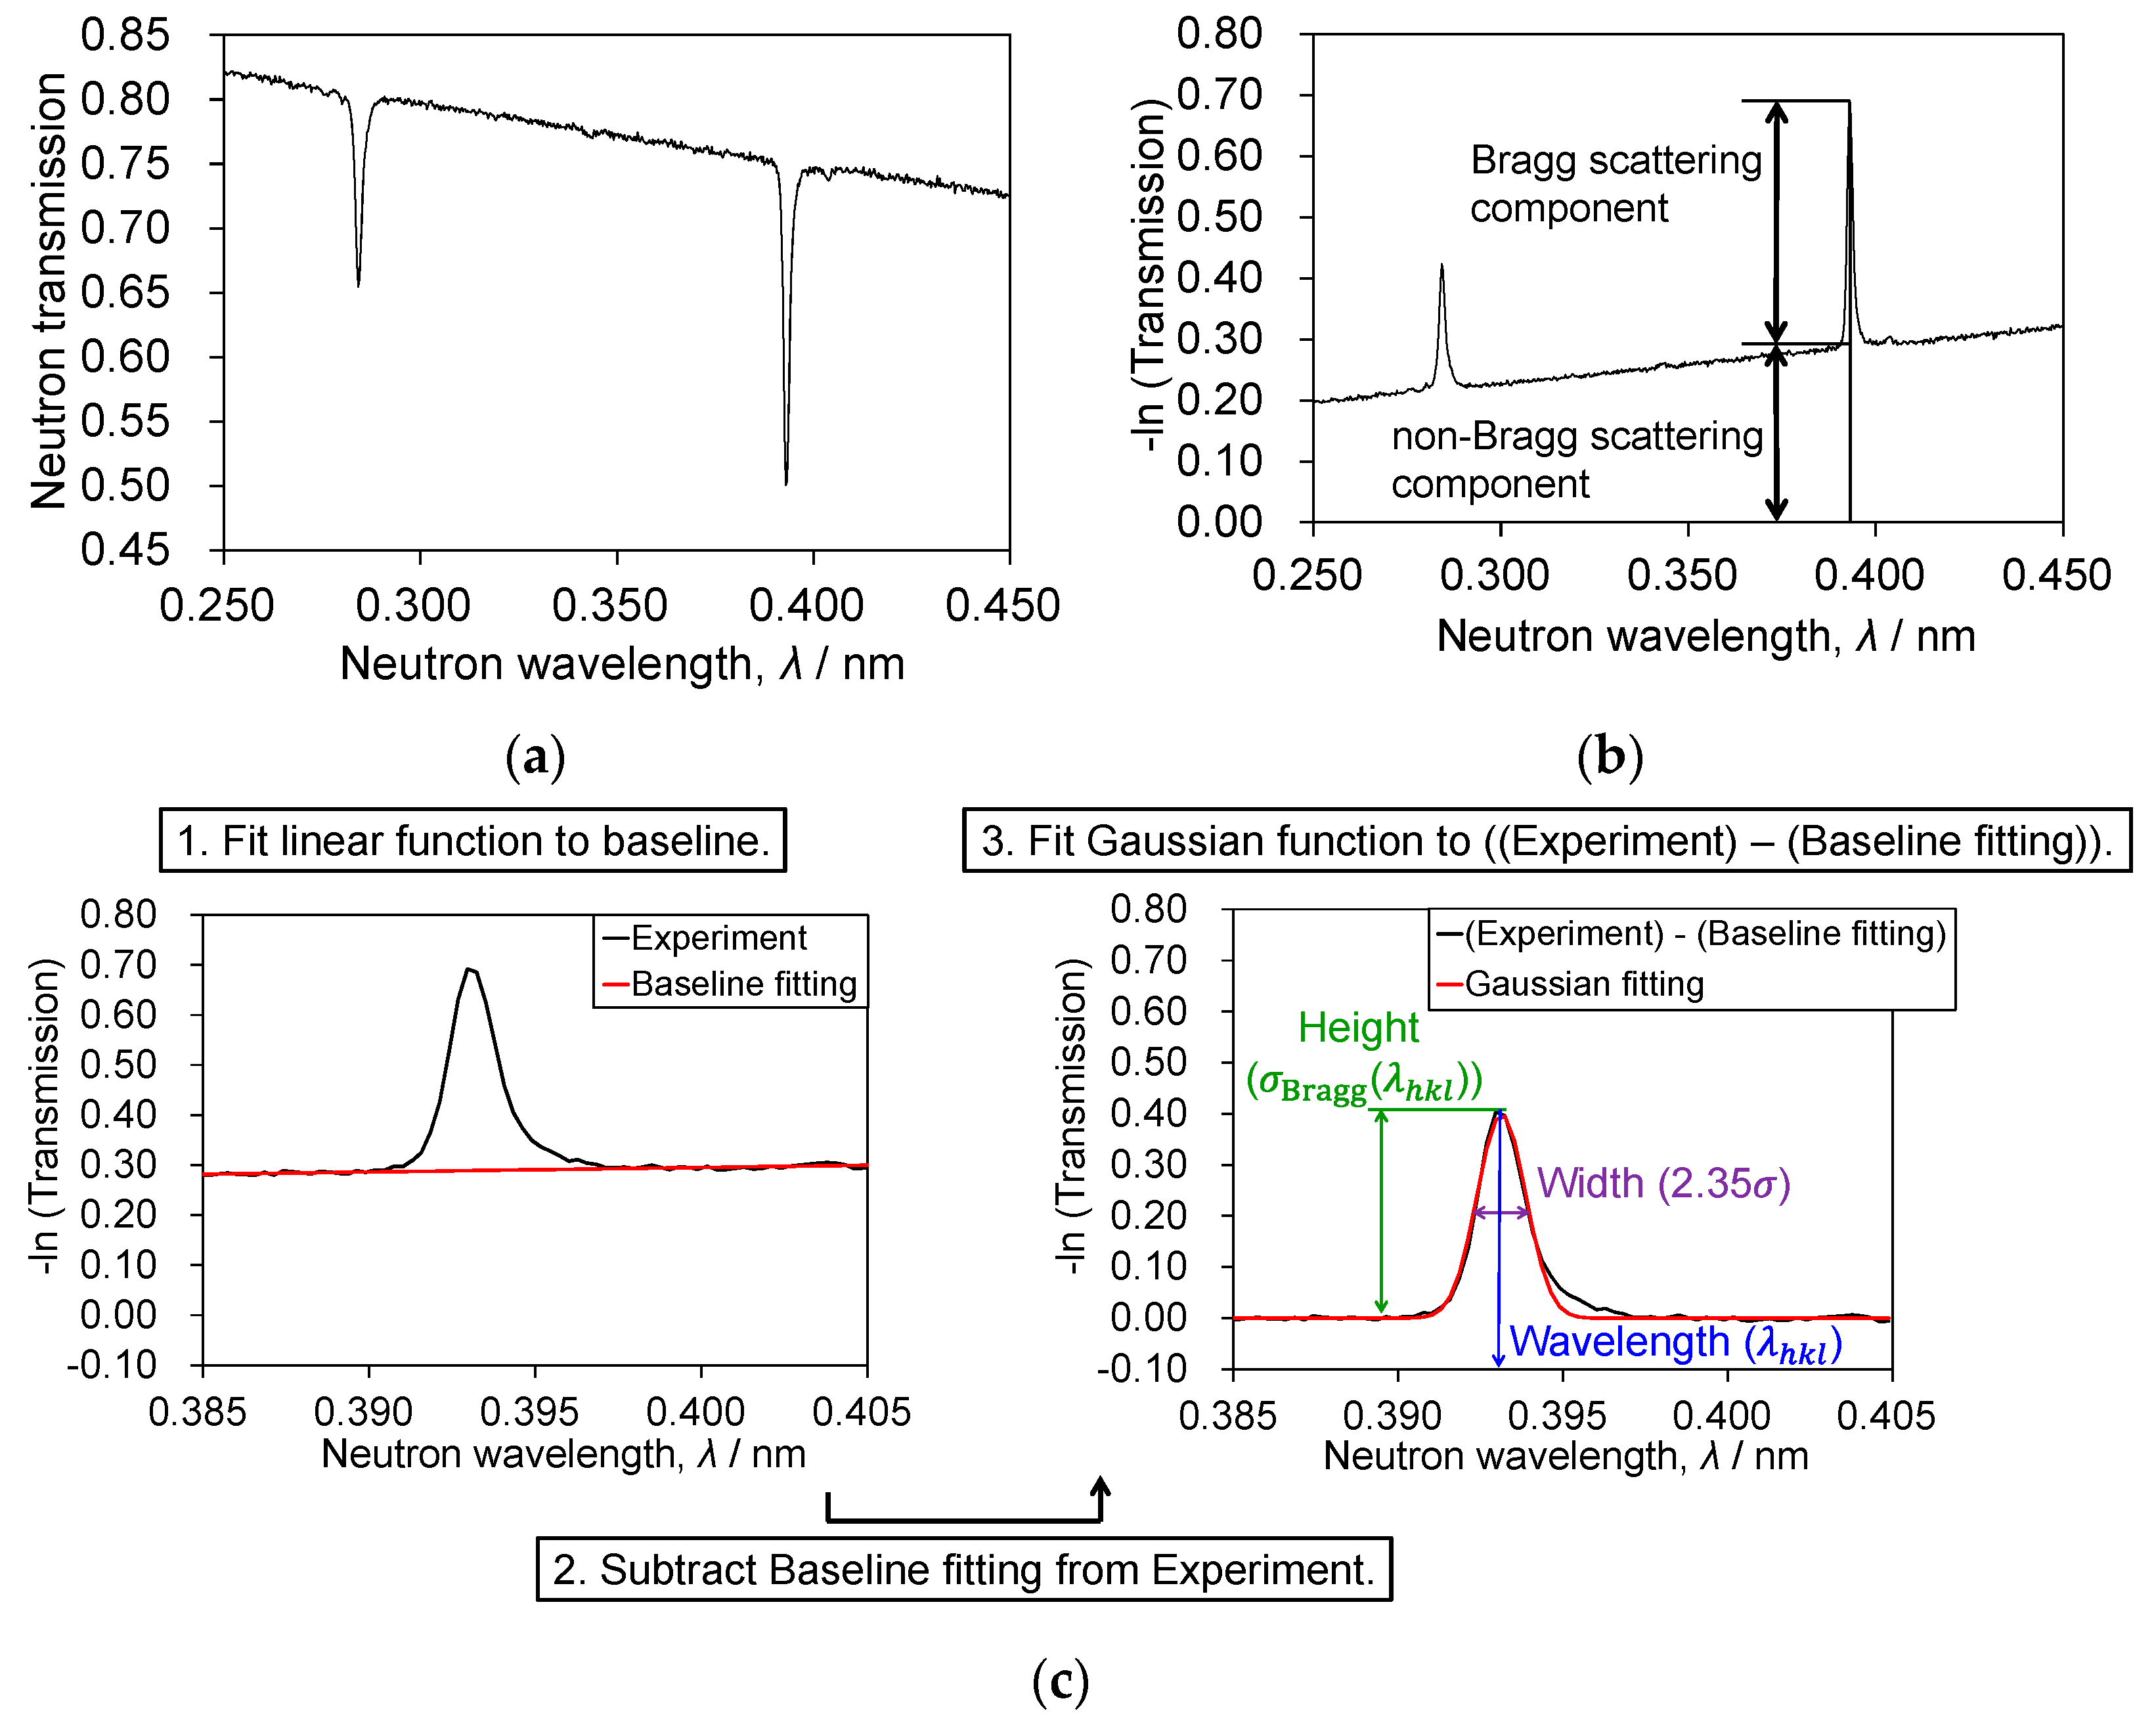
3.2. Profile-Fitting Function
3.3. Principle of Extinction Effects
4. Imaging of Bragg-Dip Profiles and Evaluation of Detailed Inner-Grain Information
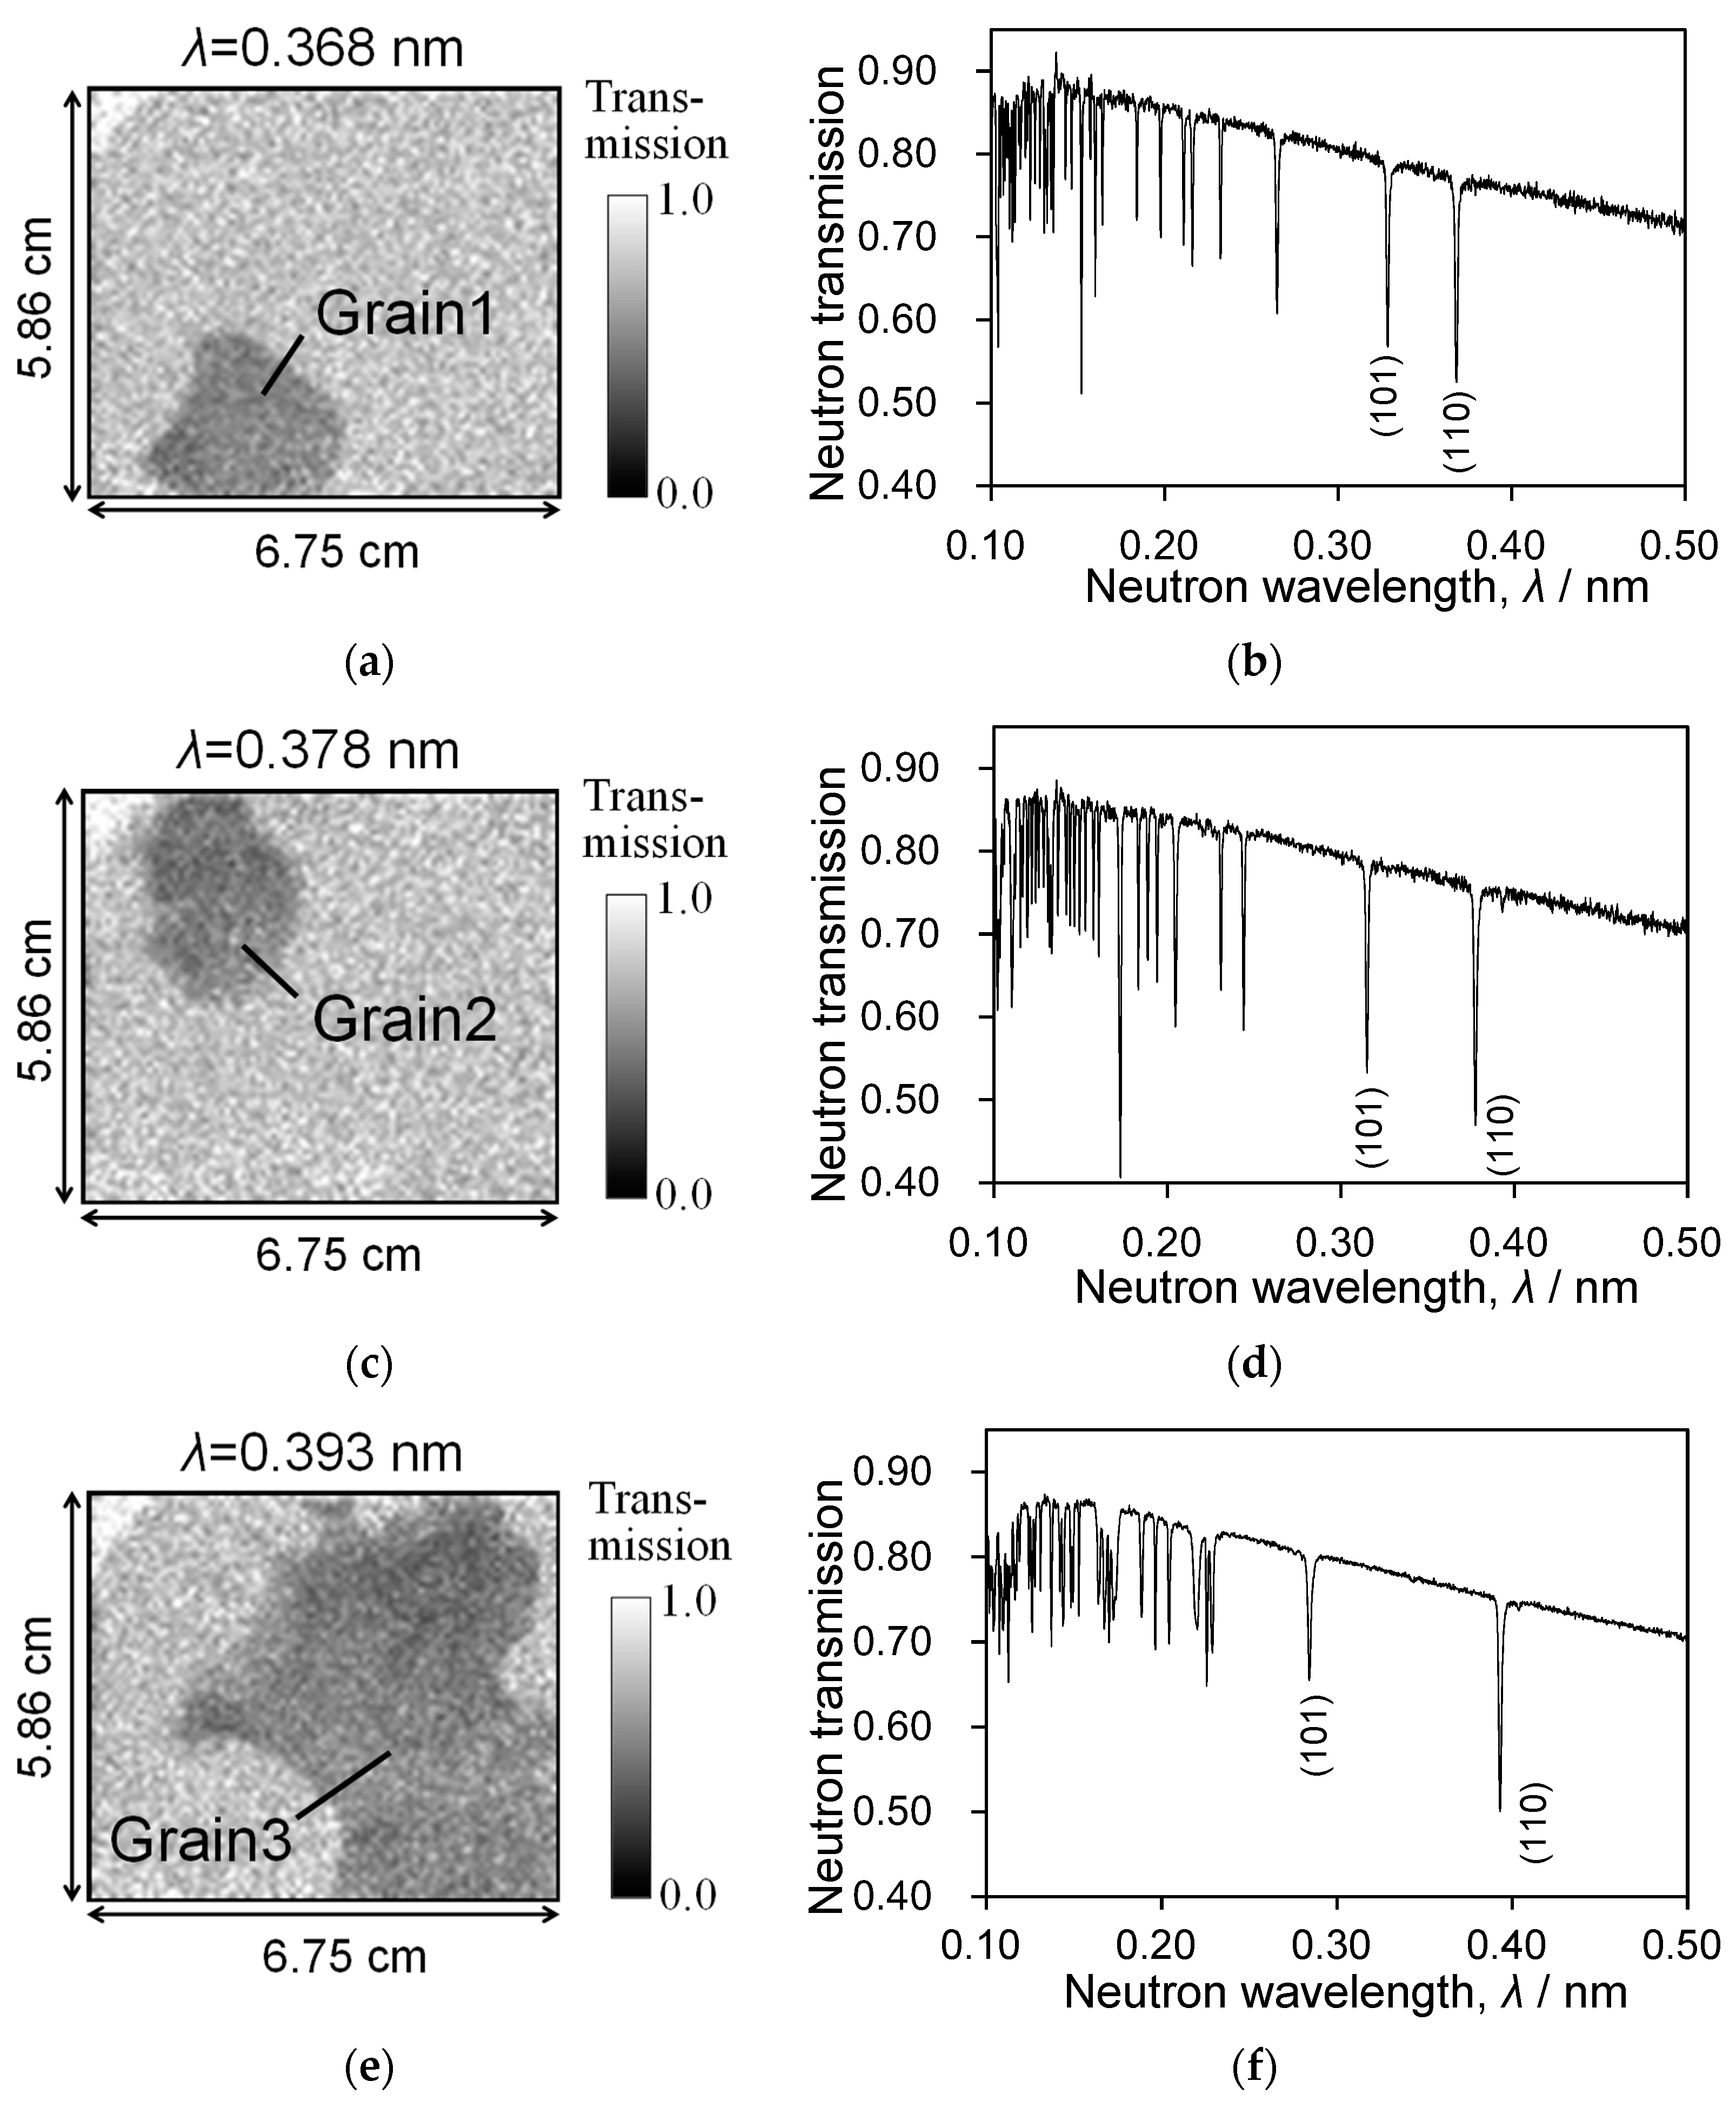
4.1. Measured Neutron Transmission Spectra of Three Evaluated Grains
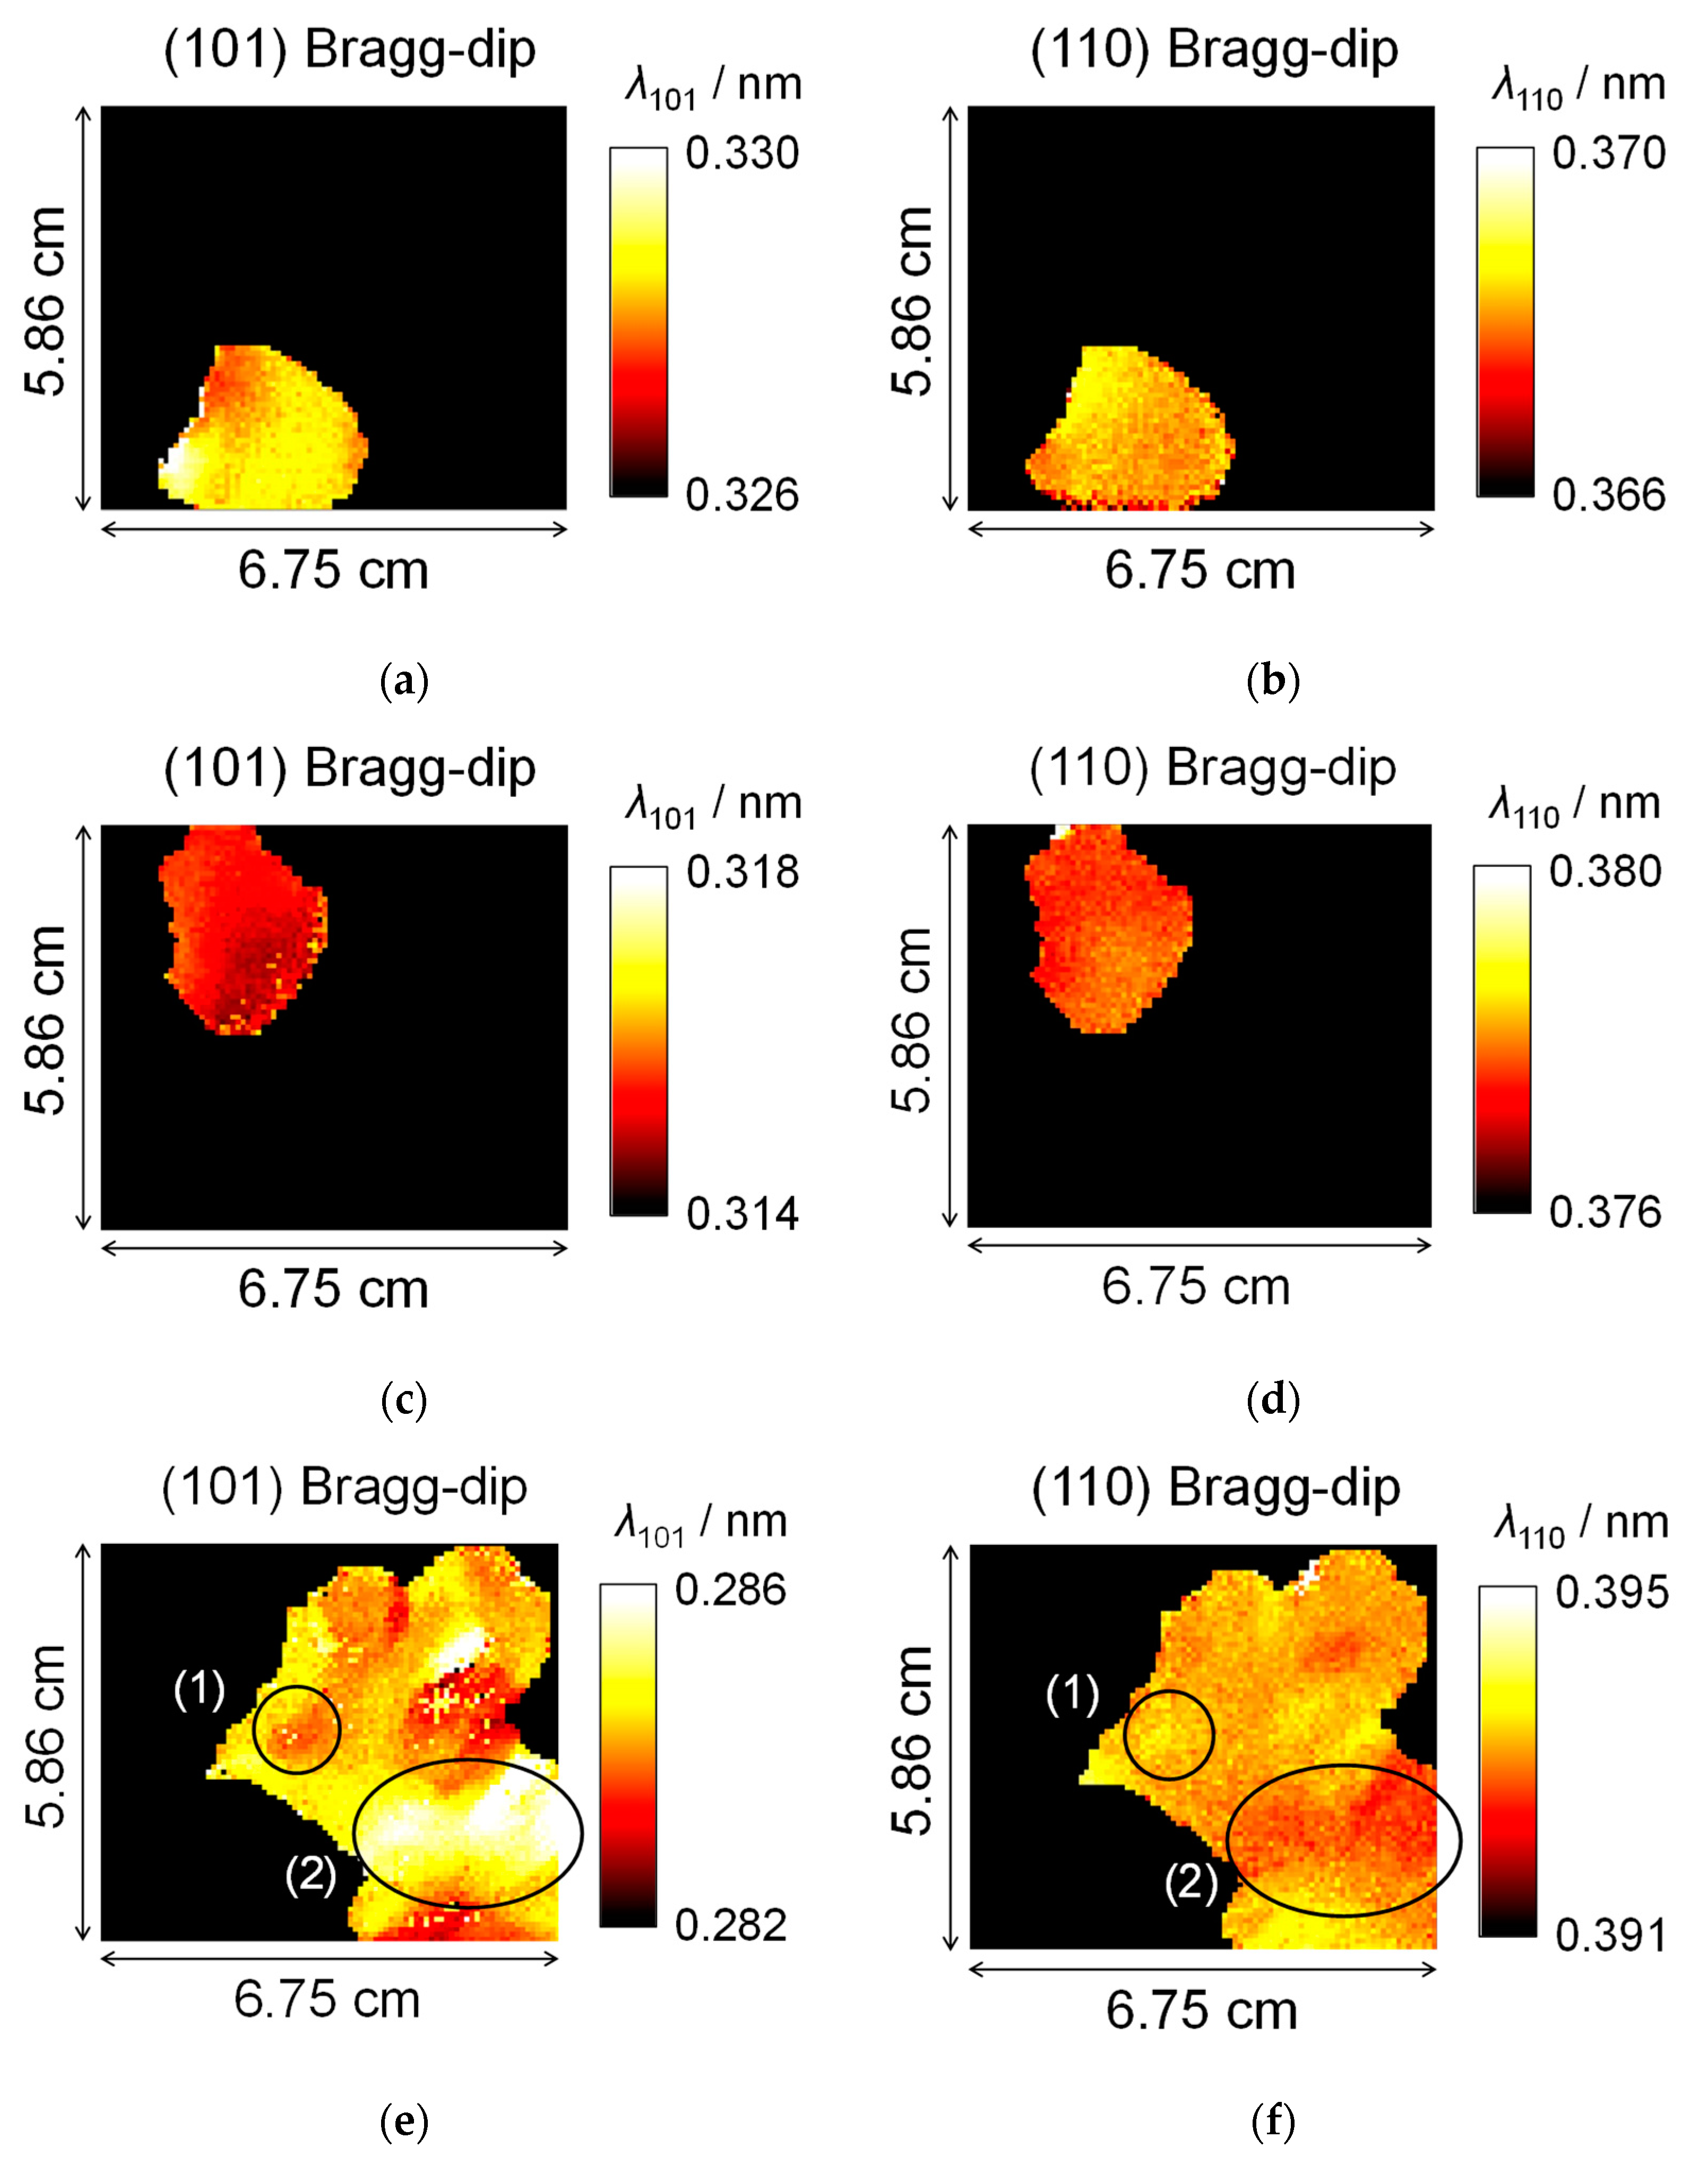
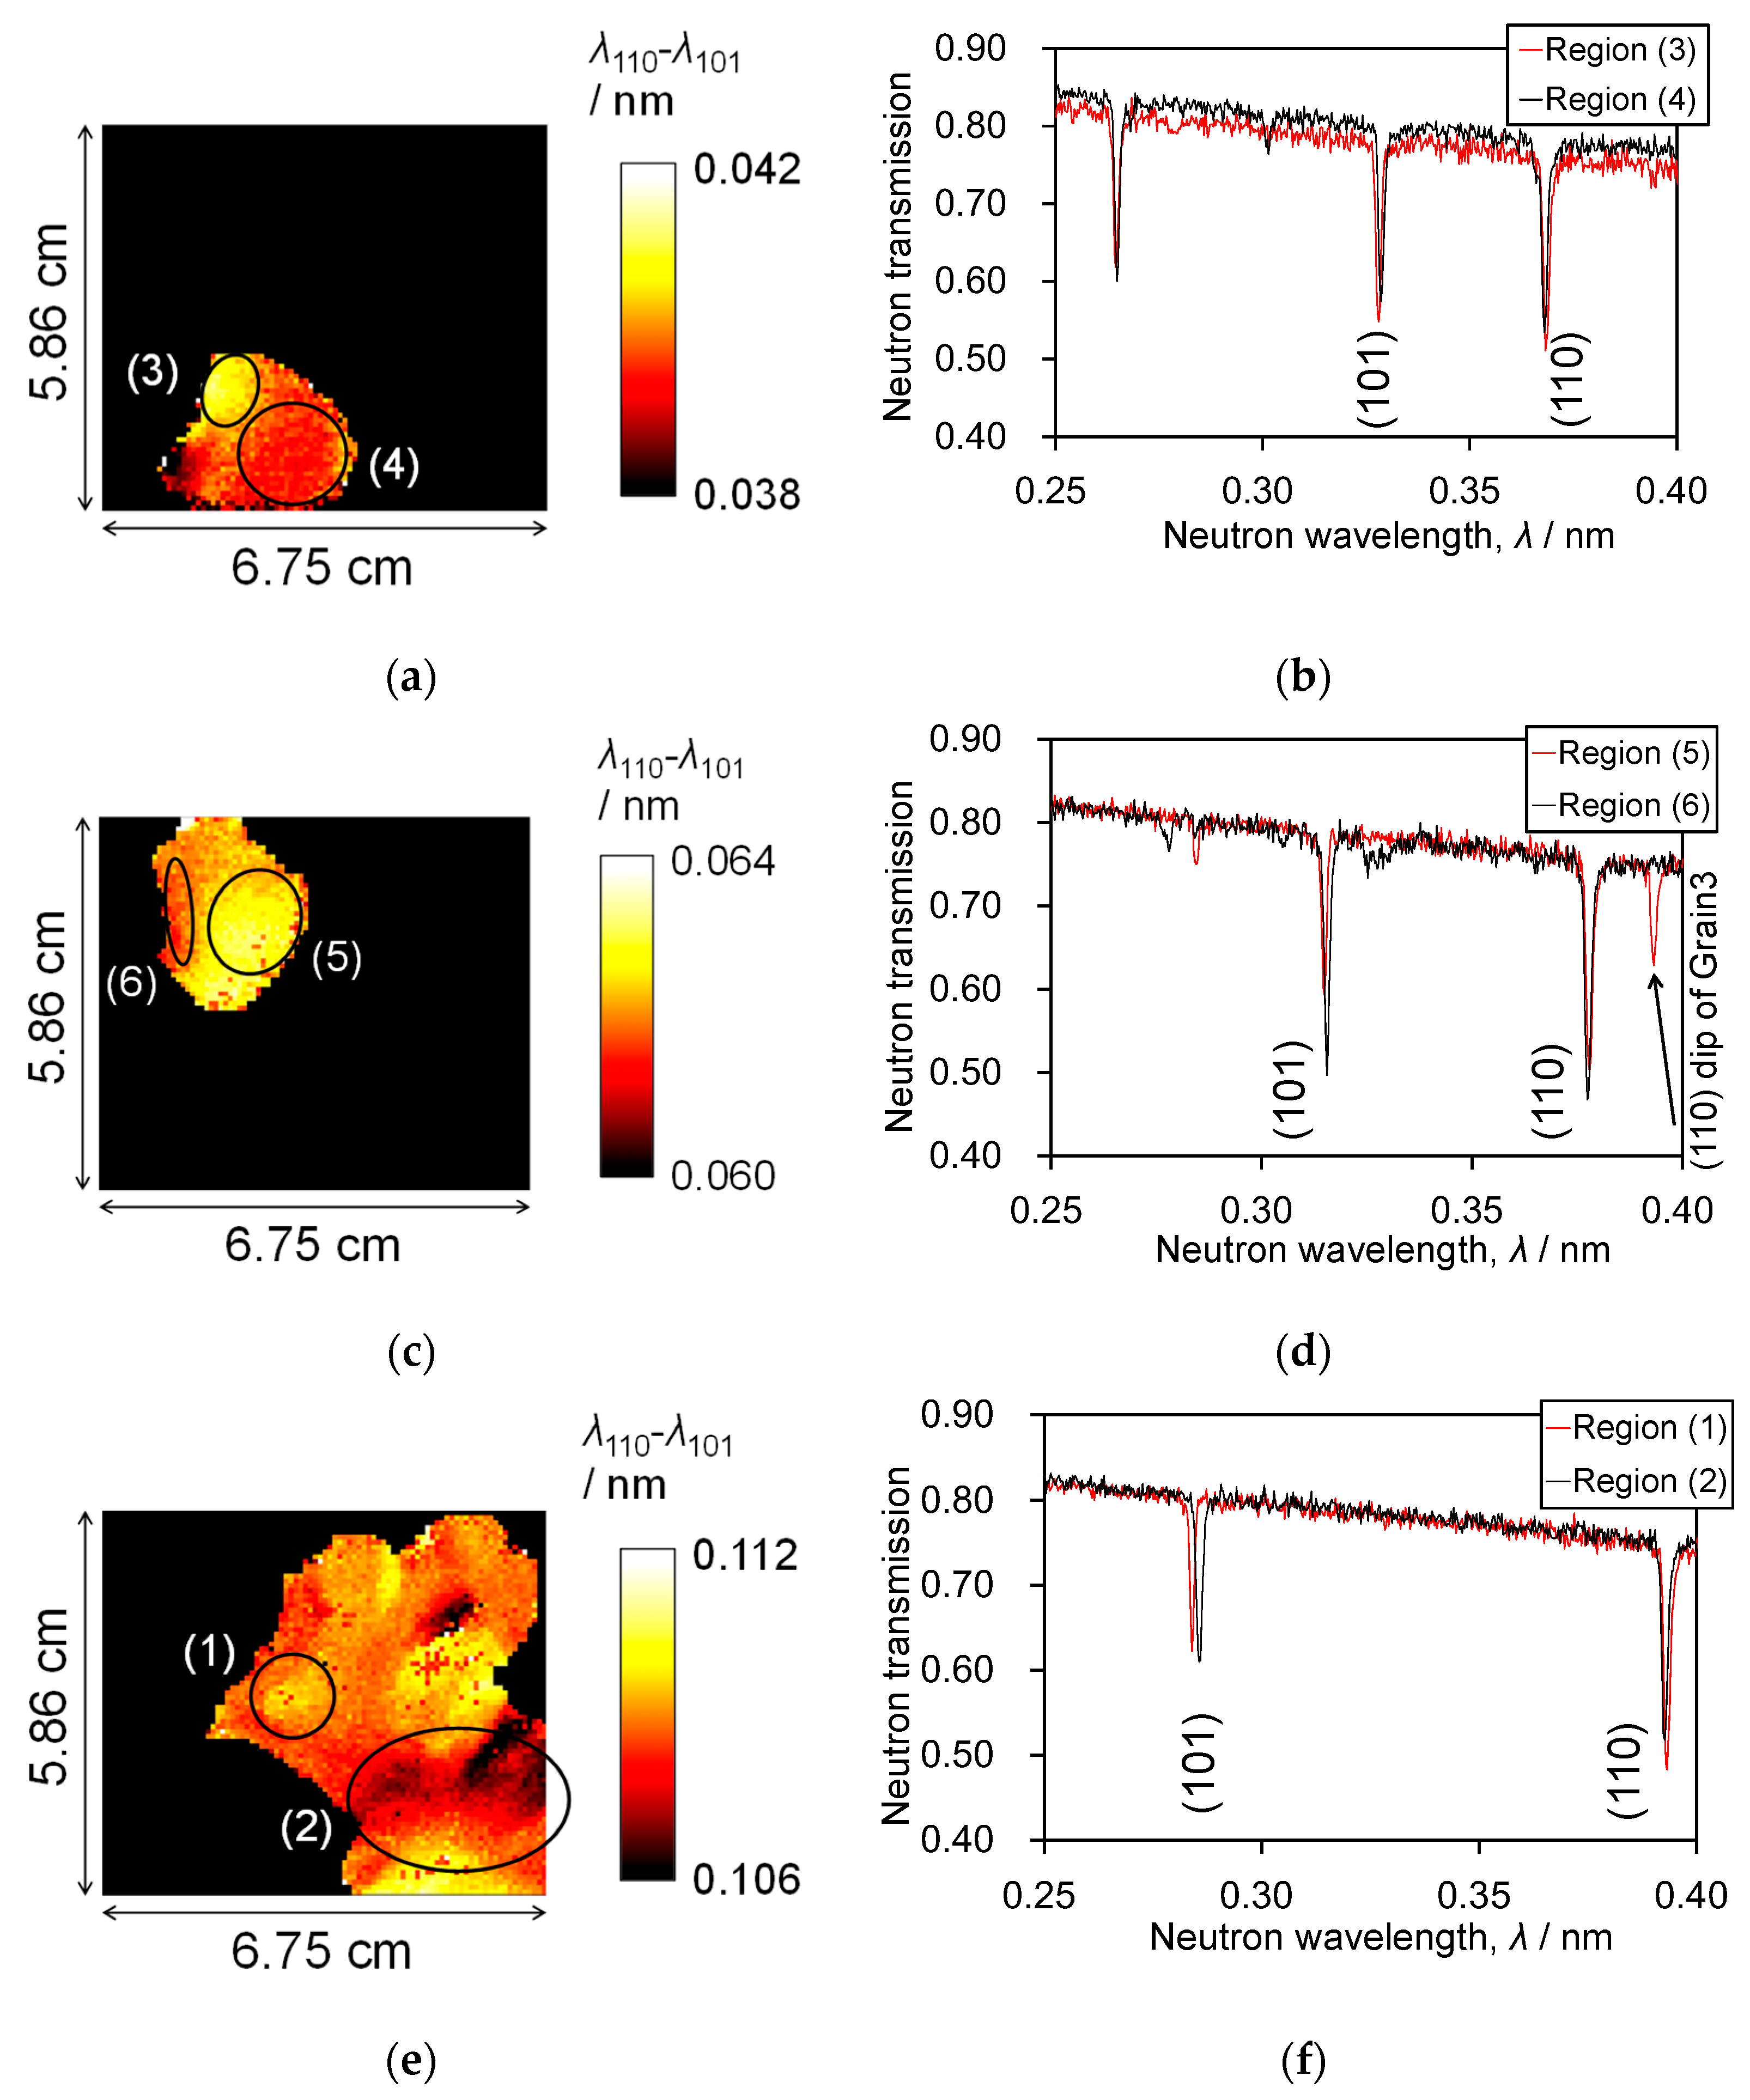
4.2. Imaging of Appearance Wavelength of Bragg-Dip and Evaluation of Small Change in Crystal Orientation in a Grain
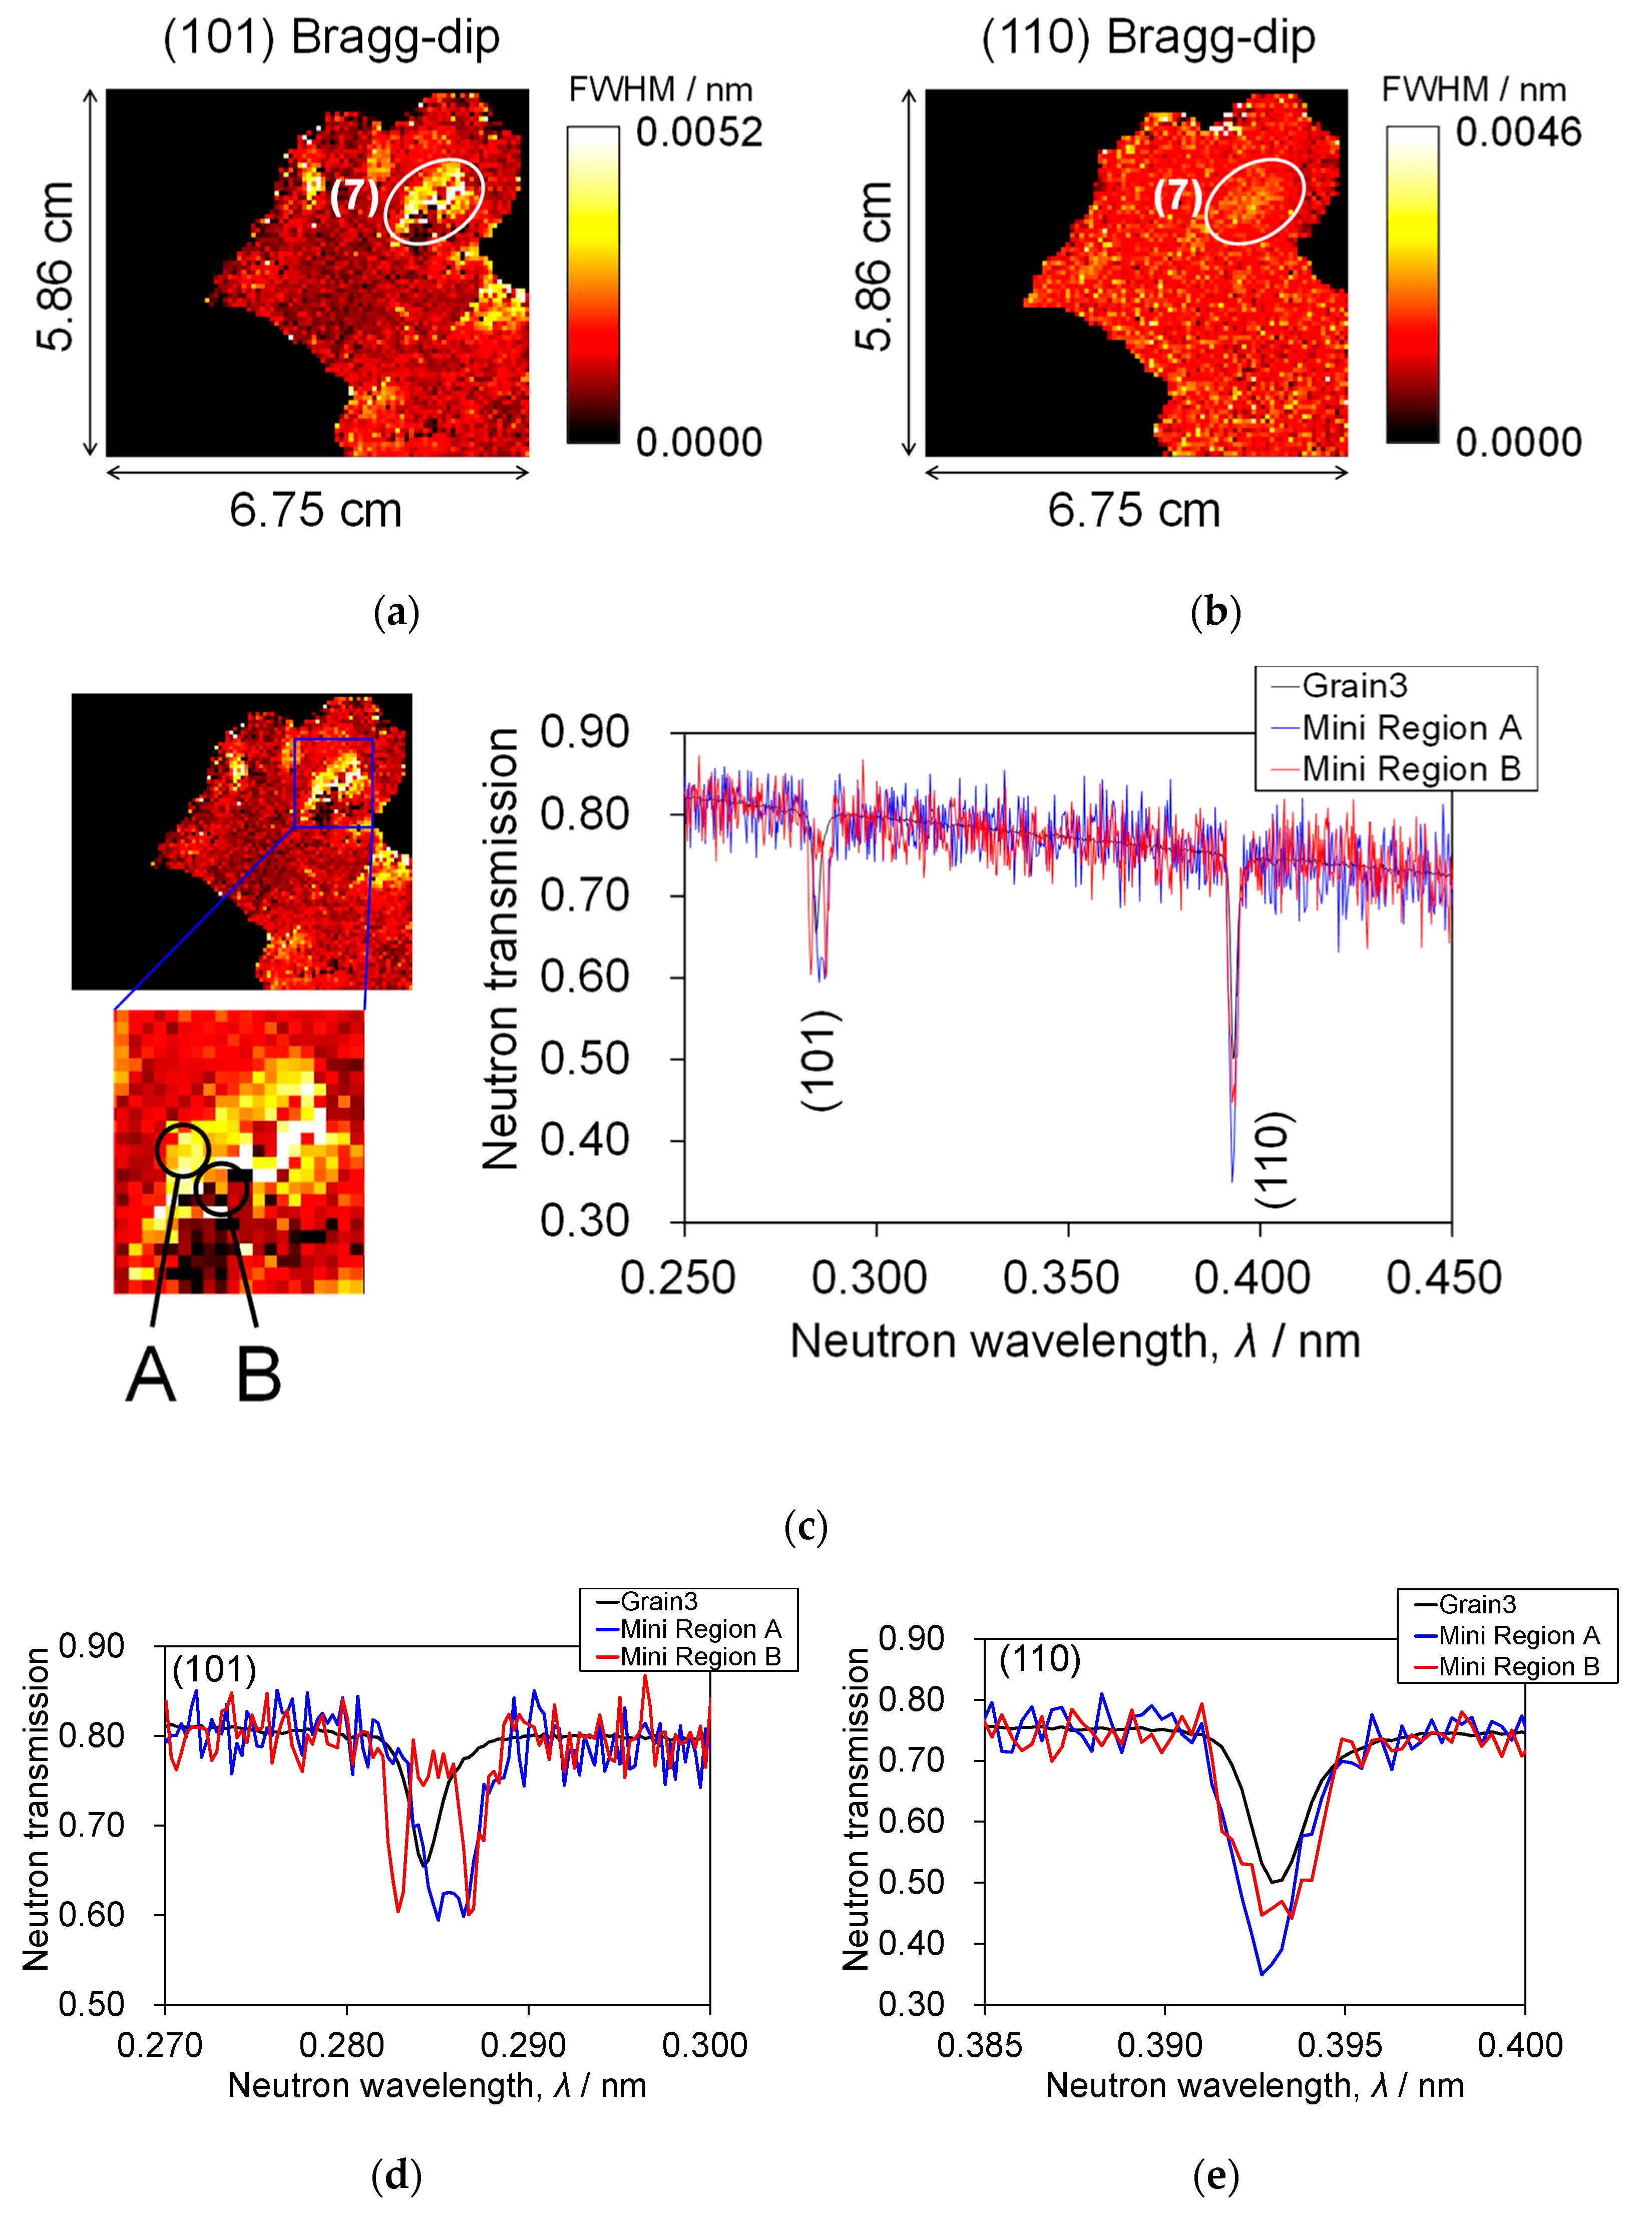
4.3. Imaging of Width (FWHM) of Bragg-Dip and Identification of Grains with Small Orientation Differences
4.3.1. Mosaic Block Detection through the Observation of Bragg-Dip Broadening
4.3.2. Different Crystalline Grain Detection through the Observation of Bragg-Dip Split
4.4. Imaging of Integrated Intensity of Bragg-Dip
4.4.1. Crystal Thickness Evaluation from the Integrated Intensity of Bragg-Dip
4.4.2. Extinction and Mosaicity Evaluation from the Integrated Intensity of Bragg-Dip
5. Conclusions
Author Contributions
Funding
Institutional Review Board Statement
Informed Consent Statement
Data Availability Statement
Acknowledgments
Conflicts of Interest
References
- Humphreys, F.J. Characterisation of fine-scale microstructures by electron backscatter diffraction (EBSD). Scr. Mater. 2004, 51, 771–776. [Google Scholar] [CrossRef]
- Groeber, M.A.; Haley, B.K.; Uchic, M.D.; Dimiduk, D.M.; Ghosh, S. 3D reconstruction and characterization of polycrystalline microstructures using a FIB–SEM system. Mater. Charact. 2006, 57, 259–273. [Google Scholar] [CrossRef]
- Delhez, R.; de Keijser, T.H.; Mittemeijer, E.J. Determination of crystallite size and lattice distortions through X-ray diffraction line profile analysis. Fresenius Z. Anal. Chem. 1982, 312, 1–16. [Google Scholar] [CrossRef]
- Vanasupa, L.; Joo, Y.C.; Besser, P.R.; Pramanick, S. Texture analysis of damascene-fabricated Cu lines by x-ray diffraction and electron backscatter diffraction and its impact on electromigration performance. J. Appl. Phys. 1999, 85, 2583. [Google Scholar] [CrossRef]
- Ludwig, W.; Schmidt, S.; Lauridsen, E.M.; Poulsen, H.F. X-ray diffraction contrast tomography: A novel technique for three-dimensional grain mapping of polycrystals. I. Direct beam case. J. Appl. Crystallogr. 2008, 41, 302–309. [Google Scholar] [CrossRef]
- Johnson, G.; King, A.; Honnicke, M.G.; Marrow, J.; Ludwig, W. X-ray diffraction contrast tomography: A novel technique for three-dimensional grain mapping of polycrystals. II. The combined case. J. Appl. Crystallogr. 2008, 41, 310–318. [Google Scholar] [CrossRef]
- Wenk, H.-R.; Lutterotti, L.; Vogel, S. Texture analysis with the new HIPPO TOF diffractometer. Nucl. Instrum. Methods Phys. Res. Sect. A 2003, 515, 575–588. [Google Scholar] [CrossRef]
- Santisteban, J.R.; Daymond, M.R.; James, J.A.; Edwards, L. ENGIN-X a third-generation neutron strain scanner. J. Appl. Crystallogr. 2006, 39, 812–825. [Google Scholar] [CrossRef]
- Gutmann, M.J.; Kockelmann, W.; Chapon, L.C.; Radaelli, P.G. Phase imaging using time-of-flight neutron diffraction. J. Appl. Crystallogr. 2006, 39, 82–89. [Google Scholar] [CrossRef]
- Peetermans, S.; King, A.; Ludwig, W.; Reischig, P.; Lehmann, H. Cold neutron diffraction contrast tomography of polycrystalline material. Analyst 2014, 139, 5765–5771. [Google Scholar] [CrossRef]
- Cereser, A.; Strobl, M.; Hall, S.A.; Steuwer, A.; Kiyanagi, R.; Tremsin, A.S.; Knudsen, E.B.; Shinohara, T.; Willendrup, P.K.; da Silva Fanta, A.B.; et al. Time-of-Flight Three Dimensional Neutron Diffraction in Transmission Mode for Mapping Crystal Grain Structures. Sci. Rep. 2017, 7, 9561. [Google Scholar] [CrossRef]
- Samothrakitis, S.; Raventós, M.; Čapek, J.; Larsen, C.B.; Grünzweig, C.; Tovar, M.; Garcia-Gonzalez, M.; Kopeček, J.; Schmidt, S.; Strobl, M. Grain morphology reconstruction of crystalline materials from Laue three-dimensional neutron diffraction tomography. Sci. Rep. 2020, 10, 3724. [Google Scholar] [CrossRef]
- Sato, H. Deriving Quantitative Crystallographic Information from the Wavelength-Resolved Neutron Transmission Analysis Performed in Imaging Mode. J. Imaging 2018, 4, 7. [Google Scholar] [CrossRef]
- Santisteban, J.R.; Edwards, L.; Fitzpatrick, M.E.; Steuwer, A.; Withers, P.J.; Daymond, M.R.; Johnson, M.W.; Rhodes, N.; Schooneveld, E.M. Strain imaging by Bragg edge neutron transmission. Nucl. Instrum. Methods Phys. Res. Sect. A 2002, 481, 765–768. [Google Scholar] [CrossRef]
- Sato, H.; Kamiyama, T.; Kiyanagi, Y. A Rietveld-Type Analysis Code for Pulsed Neutron Bragg-Edge Transmission Imaging and Quantitative Evaluation of Texture and Microstructure of a Welded α-Iron Plate. Mater. Trans. 2011, 52, 1294–1302. [Google Scholar] [CrossRef]
- Woracek, R.; Penumadu, D.; Kardjilov, N.; Hilger, A.; Boin, M.; Banhart, J.; Manke, I. 3D Mapping of Crystallographic Phase Distribution using Energy-Selective Neutron Tomography. Adv. Mater. 2014, 26, 4069–4073. [Google Scholar] [CrossRef]
- Sato, H.; Iwase, K.; Kamiyama, T.; Kiyanagi, Y. Simultaneous Broadening Analysis of Multiple Bragg Edges Observed by Wavelength-resolved Neutron Transmission Imaging of Deformed Low-carbon Ferritic Steel. ISIJ Int. 2020, 60, 1254–1263. [Google Scholar] [CrossRef]
- Malamud, F.; Santisteban, J.R. Full-pattern analysis of time-of-flight neutron transmission of mosaic crystals. J. Appl. Crystallogr. 2016, 49, 348–365. [Google Scholar] [CrossRef]
- Sato, H.; Shiota, Y.; Morooka, S.; Todaka, Y.; Adachi, N.; Sadamatsu, S.; Oikawa, K.; Harada, M.; Zhang, S.; Su, Y.; et al. Inverse pole figure mapping of bulk crystalline grains in a polycrystalline steel plate by pulsed neutron Bragg-dip transmission imaging. J. Appl. Crystallogr. 2017, 50, 1601–1610. [Google Scholar] [CrossRef]
- Strickland, J.; Tassenberg, K.; Sheppard, G.; Nenchev, B.; Perry, S.; Li, J.; Dong, H.; Burca, G.; Kelleher, J.; Irwin, S. 2D single crystal Bragg-dip mapping by time-of-flight energy-resolved neutron imaging on IMAT@ISIS. Sci. Rep. 2020, 10, 20751. [Google Scholar] [CrossRef]
- Oikawa, K.; Maekawa, F.; Harada, M.; Kai, T.; Meigo, S.; Kasugai, Y.; Ooi, M.; Sakai, K.; Teshigawara, M.; Hasegawa, S.; et al. Design and application of NOBORU—NeutrOn Beam line for Observation and Research Use at J-PARC. Nucl. Instrum. Methods Phys. Res. Sect. A 2008, 589, 310–317. [Google Scholar] [CrossRef]
- Uno, S.; Uchida, T.; Sekimoto, M.; Murakami, T.; Miyama, K.; Shoji, M.; Nakano, E.; Koike, T.; Morita, K.; Satoh, H.; et al. Two-dimensional Neutron Detector with GEM and its Applications. Phys. Procedia 2012, 26, 142–152. [Google Scholar] [CrossRef]
- Sabine, T.M. Extinction in Polycrystalline Materials. Aust. J. Phys. 1985, 38, 507–518. [Google Scholar] [CrossRef]


| Grain | [uvw] |
|---|---|
| 1 | [100 70 52] |
| 2 | [100 66 38] |
| 3 | [100 74 26] |
Publisher’s Note: MDPI stays neutral with regard to jurisdictional claims in published maps and institutional affiliations. |
© 2021 by the authors. Licensee MDPI, Basel, Switzerland. This article is an open access article distributed under the terms and conditions of the Creative Commons Attribution (CC BY) license (https://creativecommons.org/licenses/by/4.0/).
Share and Cite
Sakurai, Y.; Sato, H.; Adachi, N.; Morooka, S.; Todaka, Y.; Kamiyama, T. Analysis and Mapping of Detailed Inner Information of Crystalline Grain by Wavelength-Resolved Neutron Transmission Imaging with Individual Bragg-Dip Profile-Fitting Analysis. Appl. Sci. 2021, 11, 5219. https://doi.org/10.3390/app11115219
Sakurai Y, Sato H, Adachi N, Morooka S, Todaka Y, Kamiyama T. Analysis and Mapping of Detailed Inner Information of Crystalline Grain by Wavelength-Resolved Neutron Transmission Imaging with Individual Bragg-Dip Profile-Fitting Analysis. Applied Sciences. 2021; 11(11):5219. https://doi.org/10.3390/app11115219
Chicago/Turabian StyleSakurai, Yosuke, Hirotaka Sato, Nozomu Adachi, Satoshi Morooka, Yoshikazu Todaka, and Takashi Kamiyama. 2021. "Analysis and Mapping of Detailed Inner Information of Crystalline Grain by Wavelength-Resolved Neutron Transmission Imaging with Individual Bragg-Dip Profile-Fitting Analysis" Applied Sciences 11, no. 11: 5219. https://doi.org/10.3390/app11115219
APA StyleSakurai, Y., Sato, H., Adachi, N., Morooka, S., Todaka, Y., & Kamiyama, T. (2021). Analysis and Mapping of Detailed Inner Information of Crystalline Grain by Wavelength-Resolved Neutron Transmission Imaging with Individual Bragg-Dip Profile-Fitting Analysis. Applied Sciences, 11(11), 5219. https://doi.org/10.3390/app11115219