Abstract
During the past few decades, rapid progress in reducing the cost of photovoltaic (PV) energy has been achieved. At the megawatt (MW) to gigawatt (GW) scale, large PV systems are connected to the electricity grid to provide power during the daytime. Many PVs can be installed on sites with optimal solar radiation and other logistical considerations. However, the electricity produced by the PV power plant has to be transmitted and distributed by the grid, which leads to more power losses. With the widespread commissioning of the large-scale solar PV power plants connected to the grid, it is crucial to have an optimal energy allocation between the conventional and the PV power plants. The electricity cost represents the most significant part of the budget in the power distribution companies, which can reach in many countries billions of dollars. This optimal energy allocation is used to minimize the electricity cost from buyers’ (distribution companies) point of view rather than sellers’ (owners of power plants, i.e., investors) point of view. However, some constraints have to be considered and met, such as water demand, network limitations, and contractual issues such as minimum-take energy. This paper develops a model for the economic energy allocation of conventional and large-scale PV power plants, which considers both the operational aspects and the contractual provisions. The model can be used either in the design or operation phases to minimize the operating cost. Moreover, the proposed model can be used for budgeting tasks. The developed model is entirely generic and can be used for any country or electricity system regardless of the PV energy contribution. Furthermore, the Al-Karsaah power plant located in Qatar is discussed as a case study to validate the claimed contribution.
1. Introduction
Energy is a primary part of our life, and it provides an economic role for the nation’s development [1]. Sustainable development is defined as development that meets the present requirements without compromising the ability of future generations to meet their own needs (World Commission on Environment and Development, 1987). One sustainable development goal is to ensure affordable, reliable, sustainable, and modern energy. As a result, many countries worldwide started using this energy and developing its necessary technologies by focusing on investments and expenditure on its generation and development projects [2].
Solar energy obtained through the use of PV panels is the most flexible renewable energy source, and it can be used in approximately all power classes up to GW and in most locations around the world [3,4]. Large-scale PV power plants have been extensively investigated in the literature, particularly considering the Middle East and North Africa (MENA) region.
From technical and economic perspectives, Kazem et al. discussed the optimal configuration of 1 MW PV connected to the grid in [5] in Adam city in Oman. The authors collected data hourly for global horizontal irradiance, temperature, relative humidity, and wind speed. The PV system has a payback period of 10 years. Moreover, Shouman [6] compared electricity costs using PV panels and diesel generators in rural areas in Egypt. It was concluded that PV systems could provide a cost-effective alternative to the high-cost grid -connections in the rural areas in Egypt. Furthermore, Ma et al. [7] proposed a solar PV system model to optimize the PV generator and pumped storage system’s capacity and minimize the cost for power supply in remote areas. They considered the following variables in the optimization process: PV module number, upper reservoir size, and water pump size. Then, they applied the proposed model to a case study on an island’s renewable energy power generation system. Mellouk et al. [8] developed an optimization algorithm for micro-grids sizing and energy management problems. The objective is to meet the electricity demand with the lowest cost and maximize renewable energy penetration. Since it is a micro-grid case, they considered the storage facility.
For more extensive penetration of renewable energy sources, Lude et al. [9] developed an optimization methodology for the Shagaya renewable energy park in Kuwait with a mix of power (wind, PV, and CSP) of 2 GW on 100 km2 of land. The authors used the GenOpt software for the optimization, built on a social-techno-economic evaluation. They determined eight criteria for the optimization method: yield per area, full load hours, peak load shaving capability, levelized cost of electricity, O&M jobs, construction jobs, water consumption, and plant availability. The first phase of this mega-project is completed with a mix of 70 MW power connected to the Kuwait grid, where the expected completion time for the project is 2022. Moreover, Al-Omary et al. [10] discussed the current status of the electricity sector and the future role of renewable energy sources (PV and wind) in Jordan. They concluded that the total electricity cost would decrease with increasing the renewable energy sources penetration. This is due to the price reductions for both PV panels and windmills. In addition, Jain et al. [11] studied the feasibility of meeting 100% of India’s electricity consumption from PV by 2050. The authors developed an energetic flow model to simulate inputs and outputs of electricity from the PV system from 2016 to 2050. They found this will require considerable investment in the PV system and the associated storage infrastructure. Coester et al. [12] developed a new market design for the German electricity market. They aimed to ensure energy supply security and renewable energy expansion. They concluded that conventional power plants are still needed to ensure system stability due to the intermittent nature of renewable energy sources. Furthermore, Forough et al. [13] an optimization model for increasing the renewable energy penetration in a hybrid system. The proposed model concluded that increasing the prediction horizon length increases the renewable energy penetration and share.
Regarding the relationship between the electricity distributors and the power plants, Ma and Cui [14] proposed a novel hierarchical distributed method under the Progressive Second Price (PSP) auction mechanism. The generation provider or the retailers obtain their electricity allocation through the PSP auction method by submitting a multi-dimensional bid profile instead of telling their own cost or valuation function. The retailers economically distribute the electricity acquired in the PSP auction. Moreover, the valuation function of retailers depends on the revenues that they sell the electricity to users. The auction between generation provider and retailers is a double-sided auction in which the generation provider A0 act as a seller and all the retailers Ai (i = 1, 2, …, N) act as the buyers. A0 submits a (2-dimension) sell-bid profile a0 ≡ (α0, s0) where α0 is the per-unit sell-bid price, and s0 is the maximum quantity offered for sale. As a buyer, each retailer Ai submits a 2-dimension bid profile bi ≡ (βi, di) where βi is interpreted as the per-unit bid price, and di as the maximum quantity wanted. The retailer Ai can then directly assign electricity for the users Aij (j = 1, 2, …, Mi) in an economical way since the complete information of users is opened to their unique retailer.
In the same context, Guo et al. [15] have highlighted that large consumers could choose to purchase electricity among the following three methods:
- Spot market
- Long-term contract trade power market
- Independent power plants.
The authors studied the direct power purchase strategy for large consumers, taking electricity uncertainty in the power market into account. The purchase price is divided into annual, monthly, and online purchase prices. A direct power purchase strategy probabilistic optimization model based on a multi-state model for purchase price was proposed, and the optimization goal was minimizing the expecting purchase cost. Wang et al. [16] mentioned that power distribution companies should have proper strategies to maximize profit. One of these strategies is improving and enhancing the power marketing quality.
From the investors’ perspective, Muneer et al. in [17] have proposed an optimization model to support a prospective investor in arriving at an optimal investment plan in large-scale solar photovoltaic (PV) generation projects. The optimal set of decisions includes the location, sizing, and investment time that yields the highest profit. The mathematical model considers various relevant issues associated with PV projects such as location-specific solar radiation levels, detailed investment cost representation, and approximate representation of the transmission system. Grid-connected solar PV systems provide a quiet, low-maintenance, pollution-free, safe, reliable, and independent alternative to conventional generation sources. Generally, in decentralized power systems, private investors do not own or operate the transmission -grid. Therefore, they are—not responsible for its performance, security, and reliability. As a result, the traditional centralized planning aspects such as minimizing overall system losses and system security are not considered. Therefore, the proposed model does incorporate transmission constraints, power angle constraints, and power flow criteria.
Besides that, the authors in [17] have suggested economic criteria for solar PV investment analysis, namely the Net Present Value (NPV) analysis, as it incorporates the entire lifecycle of the projects and the time value of money. NPV is the discounted sum of the -income from selling the -total generated energy—of all costs -related to the energy delivery system. Thus, NPVs are calculated for all the proposed projects, and the project with the highest NPV is selected. The proposed optimization model is linear, and the majority of the decision variables are continuous. The investment selection variables are binary. These results in a mixed-integer linear programming (MILP) model solved in GAMS using the CPLEX solver. The objective is to maximize the NPV of the investor’s profit. Moreover, a comprehensive case study considering the investment in PV projects in Ontario, Canada, was discussed, demonstrating the practical application and importance of the proposed methodology.
The power markets’ trades and issues were discussed before. However, this study combines the technical aspects (the transmission network capacity, the power station capacity, and the water demand) and the contractual provisions (energy cost and minimum-take energy). The contracts between the power distribution companies and the power plants are confidential, making their studies rare. The main contribution of this paper is to develop a model for the economic energy allocation of conventional and large-scale PV power plants, where the model considers both the operational aspects and the contractual provisions. The developed model generally addresses any number of conventional and PV power plants. The model can be used either in the design or operation phases to minimize the operating cost. Moreover, the proposed model can be used for budgeting tasks.
2. Research Method
Low economic efficiency is one of the main arguments against renewable energy sources. Therefore, economic efficiency is a crucial aspect of renewable energy project planning. Electricity distribution companies seek to reduce the total cost and achieve the highest profit through the optimal electricity allocation between the different power plants, as shown in the following objective Function (1):
Minimize the total energy purchase cost (C),
where:
CCp: the unit cost of purchased energy from conventional plant p, p CP
ECp: purchased energy from conventional plant p, p CP
CVv: unit cost of purchased energy from PV plant v, v PV
EVv: purchased energy from PV plant p, v PV
CP: a set of conventional power plants, indexed by p
PV: a set of PV power plants, indexed by v
The unit cost is the summation of capital recovery, operation and maintenance (O & M), and gas consumption costs.
The constraints are:
- 1-
- Annual energy demand (D) has to be met by the generation from the different power plants during the whole year.
This constraint will be an input to the proposed model.
- 2-
- Transmission lines (TL) limits: Each network consists of many transmission lines to transfer the generated energy from the power plants to consumers. Sometimes, maintenance activities or tripping incidents will restrict the power flow, and not all power will be evacuated. The power transfer on the transmission lines must not exceed the transmission lines’ maximum power transfer limits.
PFl: load on the transmission line l, l TL
CPFl: maximum load the transmission line l can carry, l TL
TL: a set of transmission lines, indexed by l
Therefore, transmission lines-limit affect the power stations’ evacuation. As a result, this constraint will be used as a percentage of the power stations’ maximum capacities, as shown in (4) and (5).
where:
EP: evacuation factor: a factor that defines the maximum evacuation energy
ECPp: maximum annual energy capacity of conventional plant p, p CP
ECVv: maximum annual energy capacity of PV plant v, v PV
- 3-
- Water demand (WD): cogeneration (combined-cycle or combined heat and power) is the concept of generating electricity and heat or steam for water desalination. Conventional power plants have both turbines and water distillers. The turbines and distillers are connected in a combined cycle. In order to produce water, it is required to generate steam amount from the side of the turbine. However, due to the country’s requirements, sometimes the power companies require electricity only. In this case, there will be no water distillers. As a result, the electricity distributors attempt to meet the consumers’ water demand with the best energy allocation to the power plants. Usually, power plants need a minimum amount of energy to produce the required heat in order to meet the water demand. Therefore, this constraint will be expressed as a percentage from the power stations’ maximum capacities, as shown in (6) and (7).
WP: water factor: a factor that defines the minimum energy needed to meet water demand
The minimum amount of energy required for water production is considered a must-run generation.
- 4-
- Maximum energy generation from the conventional or PV power plants: the maximum energy generation from a power plant can be considered to run with its full capacity throughout the year, as shown in (8) and (9).
For example, if the power plant capacity is 500 MW, then the maximum energy generated is expressed as follows:
- 5-
- Minimum-take energy (MTE): the power plant investors pay much money to build and operate the plants and take many operating risks. Therefore, to ensure they can profit from these projects, they add a minimum-take energy concept to the contracts. This amount also is called a take-or-pay (TOP) amount. A take-or-pay contract is common in the energy sector, where the overhead costs are high. The buyers guarantee to take an agreed minimum portion of goods during a specific period. In this type of contract, the risk is shared between the buyers and sellers.
MTEp: take-or-pay energy amount of conventional plant p, p CP
MTEv: take-or-pay energy amount of PV plant v, v PV
Many optimization methods such as linear programming (LP), stochastic programming, genetic algorithms, and neural networks [18,19] can solve the aforementioned problem. LP is a commonly-used optimization method where the objective function is linear, and the constraints are specified using only linear equalities and inequalities [20,21].
If the electricity distributor did not reach the MTE amount through the specific period, the cost of the minimum-take energy would be paid to the power plant. As a result, it is a loss for the electricity distributor, and it has to be avoided. Figure 1 is an example to demonstrate the MTE concept for eight power plants (A to H). The blue part represents the MTE amount for each power plant as a percentage of the total generated energy. The orange bars represent the remaining amount of the total generated energy. The percentages are different based on the contracts between the power distributor and power plants.
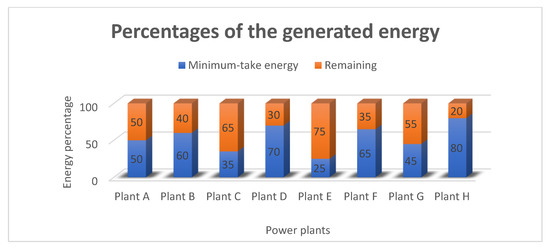
Figure 1.
Minimum-take energy concept for the power plants’ contracts.
The first four constraints will be considered hard constraints, whereas the last constraint will be considered the soft one. The decision variables are the energy amounts allocated to the conventional and PV power plants. Moreover, there are two essential parameters: unit rate and heat rate, which need to be considered. The electricity distributors purchase the energy from different power plants with different cost rates as per the contracts. As a result, the electricity distributors aim to meet their consumers’ demands at the cheapest cost. The energy rate includes capital recovery, operation and maintenance (O & M), and gas consumption costs.
In addition, heat rate is the amount of fuel required to generate one unit of electricity. It is a term commonly used in power stations to indicate power plant efficiency. The heat rate is the inverse of the efficiency, and a lower heat rate is better.
The heat rate constraint requires excessive data about the gas turbines, power plant configurations, and weather conditions. Therefore, this constraint will not be considered in the optimization problem to keep the model generic.
The proposed optimization model can be used either in the design or operation phases. During the design phase, if an investor bids to build a PV power plant with a specific energy cost ($/kWh), is it feasible and worth accepting that bid and the total cost will be reduced, or will the total energy cost be increased, and the minimum-take energy will not be well utilized? In other words, the model can be used to study the feasibility of new renewable energy project proposals.
The model will be used to allocate the energy between the different power plants to minimize the operating cost for the operation phase. The model’s inputs will be the forecasted or estimated energy, water demand requirements, evacuation limitations, energy rate, and minimum-take amounts. The outputs are the energy amounts allocated to each power plant considering the constraints. The pseudocode for the developed MATLAB model is in Appendix A. Figure 2 shows the flowchart for the developed model.
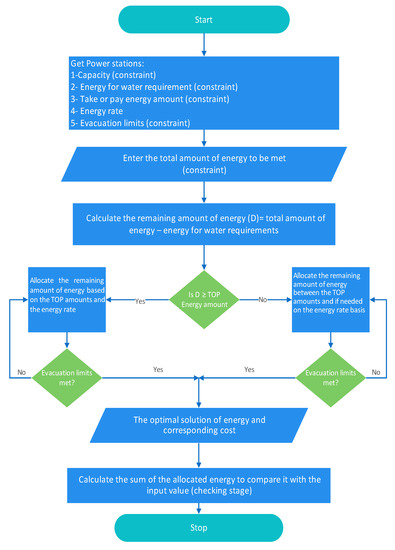
Figure 2.
Flowchart of the proposed model.
In Figure 2, the inputs for the proposed model are power stations’ capacity, the energy of water requirements, TOP energy amounts, evacuation limits, energy rate, and the total amount of energy demand. The model will be used to allocate the energy requirement considering the different constraints to get the optimal solution. The optimal solution is the energy allocation that has the lowest cost. After completing the energy allocation process, a checking step is to ensure that the energy requirement equals the total energy allocated. The power systems can be classified into two main groups according to the power source and the renewable energy share, which are:
- 1-
- Group A: number of conventional power plants ≤ number of PV or renewable power plants
- 2-
- Group B: number of conventional power plants > number of PV or renewable power plants.
The proposed model can optimize the energy cost for both groups. In conclusion, the proposed model can be used for any power system when having the required excessive power plants’ data. Table 1 is an example of group A power system.

Table 1.
An example of Group A power system data.
The assumed power system has 2 conventional power plants (A and B) and 3 PV power plants (PV1, PV2, and PV3). Using the proposed model to allocate 10,000 GWH as a demand, the result is shown in Table 2 and Figure 3.
Table 2.
Energy allocated to power plants.
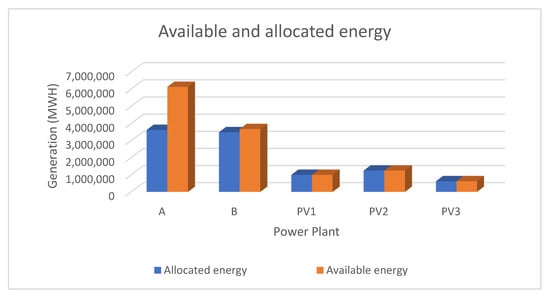
Figure 3.
Available and allocated energy for the Group A example.
In the beginning, the energy-water requirement was allocated for power plants A and B. Then, due to the low energy price of the PV power plants, the whole generation was utilized. After that, the energy price of the B power plant is cheaper than the A power plant. However, 5% of the total generation of the B power plant could not be utilized due to the evacuation limit. The remaining required energy was allocated to A power plant. Table 3 is an example of Group B power system.
Table 3.
An example of Group B power system data.
The assumed power system has 8 conventional power plants (A, B, …, H) and 4 PV power plants (PV1, …, PV4). Using the proposed model to allocate 20,000 GWH as a demand, the result is shown in Table 4 and Figure 4.
Table 4.
Energy allocated to power plants.
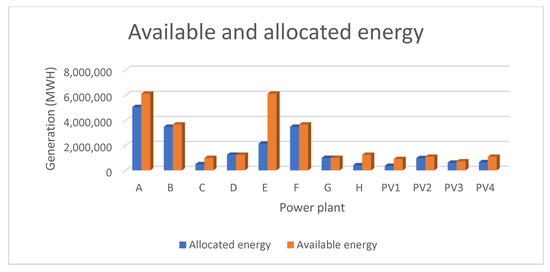
Figure 4.
Available and allocated energy for the Group B example.
It is noted that the lowest unit price is for the PV4 power plant. However, only 60% is the energy allocation due to the evacuation limit. On the other hand, the most expensive unit price is for the C power plant. However, 50% is the energy allocation due to the water requirement.
Qatar’s power system consists of 8 conventional power plants and 1 PV power plant [22]. Based on the previous classification, Qatar’s power system belongs to Group B. This case will be discussed in detail in Section 3. Two scenarios will be considered for the energy allocation before and after integrating the planned large-scale PV power plant.
3. Large Scale PV Power in Qatar
Qatar, represented by Qatar Petroleum (QP) and Qatar Electricity and Water Company (QEWC), established a joint venture company called Siraj Solar Energy to generate electricity from solar power. Siraj Power Energy will be a strategic national investor. The solar power plant’s location will be west of Doha near Al-Kharsaah area (shown in Figure 5), with 10 km2 of land.

Figure 5.
Location of Siraj solar energy power plant [23].
The estimated cost of that power plant is $467 million. It will be developed in two phases. The first phase is to generate 400 MW by February 2022, and the second phase is to reach the plant’s full capacity (800 MW) by May 2022. By that time, the PV generation will be about 7% of the total available generation, as shown in Figure 6. The installed conventional generation in Qatar is 10.576 GW.
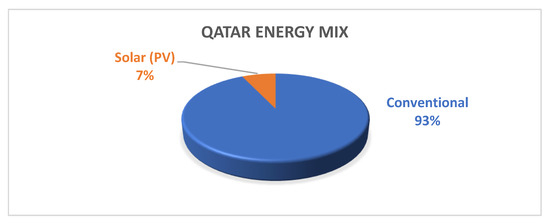
Figure 6.
Qatar energy mix.
This project’s energy rate is approximately 14.49 $/MWh, which is one of the lowest prices globally for these types of projects [22]. It is a public-private partnership project with a Build Own Operate Transfer (BOOT) contract for 25 years. Then, the ownership will be transferred to KAHRAMAA. In this project, there will be no storage facility. Although solar power plants are located in many countries worldwide, large-scale power plants are relatively new, especially in the GCC region. This is the first plant in Qatar and has a substantial capacity of 700 MW or more. Since Qatar’s maximum electricity demand is 8600 MW, the solar power plant will meet more than 8% of that demand. It is essential for Qatar, and especially KAHRAMAA as the national utility, to be prepared to accommodate this large-scale plant. Therefore, its impact on the national grid must be studied carefully, and optimal methods to forecast the output and mitigate any effects of the plant on the network need to be established.
Furthermore, Qatar produces almost all of its potable water through desalination. Although reverse osmosis (RO) plants are now being implemented, most of the desalinated water is produced using multi-stage flash or multi-effect distillation techniques, which require turbines to be running to operate. Therefore, the entry of a large-scale solar power plant into the generation dispatch will affect the “must-run units” required for water production. This is further compounded by the fact that water demand does not vary seasonally as much as electricity demand (water demand varies 10–15% between summer and winter). For example, the electricity peak demand was 4220 MW on 14 March 2021 and 8210 MW on 6 June 2021. On the other hand, the water consumption was 376.8 million imperial gallons per day (MIGD) on 14 March 2021 and 416.2 MIGD on 6 June 2021. As a result, the electricity peak demand growth is almost 95%, whereas the water consumption growth is only 10% [24,25]. In Qatar, KAHRAMAA purchases electricity from eight different generation power plants with varying contracts in terms of energy prices. After the proposed solar power station’s commissioning and without the storage facility, providing an optimal operation cost will be essential. The optimal energy allocation between the different generation plants needs to be determined daily to obtain energy from the solar power plant. Moreover, the need to shut down generating units and restart them again or run them with less generation has to be determined.
Due to the confidentiality of the power purchase agreements, the power plants’ names will be presented by letters (A, B, C, etc.). Moreover, some data will be tuned and modified. The input data for the developed model are shown in Table 5.
Table 5.
Power stations data.
The forecasted or estimated energy for Qatar’s system in 2022 is approximately 50,000 GWH. Using the developed model, the energy allocated to each power plant without and with Alkharsaah power station is shown in Table 6 and Table 7, and Figure 7 and Figure 8, respectively.
Table 6.
Energy allocated to power plants without Alkharsaah.
Table 7.
Energy allocated to power plants with Alkharsaah.
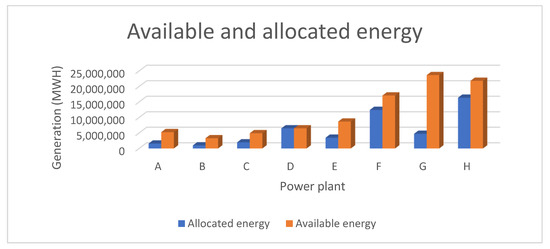
Figure 7.
Available and allocated energy to power plants without Alkharsaah.
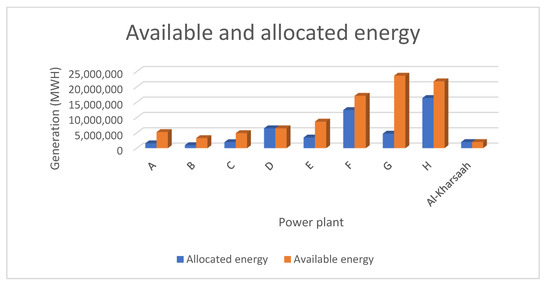
Figure 8.
Available and allocated energy to power plants with Alkharsaah.
4. Discussion
As discussed in Section 1, the proposed model considers both the technical aspects and the contractual provisions. The confidentiality of the contracts between the power distribution companies and the power plants makes the research task difficult.
For the assumed case, it is noticed that after the commissioning of Alkharsaah, the total cost was reduced by 20,800,000 $, which represents a 1.65% cost reduction as reported in Table 4 and Table 5. Even though the energy price is not the highest for F power station, the energy reduction is from F power station. This is because there is no water constraint for that power station. The cost reduction will be much higher if the water demand constraint is lesser in the different power plants. This shows the importance of producing and desalinating seawater using RO technology. Energy generation and water production are connected. There are two main technologies for seawater desalination: the conventional thermal using multi-stage flash (MSF) and reverse osmosis (RO). For the thermal technology, there is a minimum amount of energy to be generated in order to produce the required amount of water. However, for the RO technology, the minimum amount of energy to be generated to produce the same amount of water is much less. This will lead to a better energy allocation for the new power plants [26,27].
When the PV contribution is higher, the energy reduction will be more from the different power stations. Moreover, if there is a storage facility with the PV power plant, there will be less power reduction from the other power plant. However, the storage facility is significantly expensive. Therefore, there are no storage batteries for the PV mega projects (5 MW and above) in which the generating energy will be injected directly into the power grid.
Furthermore, the electricity demand pattern differs between summer and winter in Qatar. For the summer period, the peak demand period is in the afternoon period. The peak is coming during that period due to the air-conditioning load due to the extremely high temperature and humidity values. On the other hand, the winter peak demand is in the evening due to the lighting load since the weather is fine with moderate temperature values. As a result, the power from Alkharsaah PV power plant will be easily evacuated during the summer period since there is no storage facility. However, during winter, there will be no PV generation during the peak period since it is coming after the sunset. This will lead to more power reduction from the other power plants during the day in winter. However, the six gulf countries have been electrically interconnected since 2009, and the Arab countries’ interconnection is in the implementation phase [28]. Therefore, this will facilitate exchanging the power between the different countries and better utilization for Alkharsaah PV power plant and any new renewable energy projects.
As a result, additional renewable energy plants would drive down the purchase costs even further; however, optimization studies would be required to quantify the cost savings and ensure that the constraints mentioned in Section 2 do not hinder these cost savings.
It is noted that the proposed model requires excessive data for the power plants. Therefore, Qatar’s electricity system with Alkharsaah PV power plant was considered a case study due to having the required data.
5. Conclusions
Nowadays, energy is one of the leading topics for debate at all levels of society. Electricity generation patterns are changing, considering global warming. Solar energy is clean energy as it reduces carbon emissions. It is noticed that different factors affect the economic importance of PV power plants. These factors are different from one country to another. The two main factors are the cost of building the PV power plants and the difference in electricity purchase contracts. Besides, the Alkharsaah PV power plant is the first project of its kind in Qatar. Therefore, if there are studies and research on this project, it is few. Moreover, any project of this size requires thorough research and studies to show the advantages and benefits and avoid future problems.
In power distribution companies, electricity cost minimization is the main challenge. The contribution of this paper is to develop a model that minimizes the electricity cost through optimal energy allocation. This model is a tool that can be used by the power distribution companies in the design phase or the operation phase. Furthermore, the proposed model’s essential role is preparing budgets for future years or periods, especially if there are new players such as new power plants or interconnections with other countries. The model strength is elucidated in considering both the operational and the contractual aspects. Furthermore, with the higher penetration of renewable energy, electricity distribution companies focus on increasing water production from RO and reducing the minimum-take energy amounts. This leads to better utilization of renewable energy sources and decreases the total energy cost. The main limitation in model implementation is collecting the required extensive data.
Author Contributions
Conceptualization, T.Y.E.; data curation, O.J.E.-H.; investigation, A.M.M.; methodology, T.Y.E.; resources, O.J.E.-H.; software, M.B.M.K.; validation, A.M.M.; visualization, M.B.M.K.; writing—original draft, O.J.E.-H.; writing—review and editing, T.Y.E., M.B.M.K. and A.M.M. All authors have read and agreed to the published version of the manuscript.
Funding
This research received no external funding.
Institutional Review Board Statement
Not applicable.
Informed Consent Statement
Not applicable.
Data Availability Statement
Not applicable.
Acknowledgments
The authors would like to thank Qatar General Electricity and Water Corporation “KAHRAMAA” for providing valuable data used in this paper. Moreover, the authors would like to thank the reviewers for their valuable comments that enriched the paper. Open Access funding provided by the Qatar National Library.
Conflicts of Interest
The authors declare no conflict of interest.
Nomenclature
| BOOT | Build Own Operate Transfer |
| BTU | British Thermal Unit |
| CSP | Concentrating Solar Power |
| GCC | Gulf Cooperation Council |
| GW | Gigawatt |
| J | Joule |
| KAHRAMAA | Qatar General Electricity and Water Corporation |
| kWh | Kilowatt-hour |
| LP | Linear Programming |
| MTE | Minimum-take Energy |
| MW | Megawatt |
| NPV | Net Present Value |
| O & M | Operation and Maintenance |
| PV | Photovoltaic |
| QEWC | Qatar Electricity and Water Company |
| QP | Qatar Petroleum |
| QR | Qatari Riyal |
| RO | Reverse Osmosis |
| Sets and Indices | |
| cp | a set of conventional power plants, indexed by p |
| PV | a set of PV power plants, indexed by v |
| TL | a set of transmission lines, indexed by l |
| CCp | Unit cost of purchased energy from conventional plant p, ∀p ∈ CP |
| Parameters | |
| CVv | Unit cost of purchased energy from PV plant v, ∀v ∈ PV |
| D | Annual Energy demand |
| PFl | Load on the transmission line l, ∀l ∈ TL |
| CPFl | Maximum load the transmission line l can carry, ∀l ∈ TL |
| ECPp | Maximum annual energy capacity of conventional plant p, ∀p ∈ CP |
| ECVv | Maximum annual energy capacity of PV plant v, ∀v ∈ PV |
| MTEp | Take-or-pay energy amount of conventional plant p, ∀p ∈ CP |
| MTEv | Take-or-pay energy amount of PV plant v, ∀v ∈ PV |
| EP | Evacuation factor: a factor that defines the maximum evacuation energy |
| WP | Water factor: a factor that defines the minimum energy needed to meet water demand |
| Decision variables | |
| ECp | purchased energy from conventional plant p, ∀p ∈ CP |
| EVv | purchased energy from PV plant p, ∀v ∈ PV |
Appendix A. The Pseudocode for the Developed Model
| 1. START 2. READ Power_stations_capacities 3. READ Water_requirements_energy 4. READ Take_or_pay_energy 5. READ Yearly_Maximum_Energy 6. READ Evacuaction_limits 7. READ Energy_rates 8. GET Total_electricity _energy 9. Calculate D = (Total_electricity _energy)—(Water_requirements_energy) 10. IF D ≤ Take_or_pay_energy THEN 11. Allocate energy between the power plants based on Take_or_pay_energy 12. Else allocate the energy based on Take_or_pay_energy and Energy_rates concepts 13. ENDIF 14. REPEAT Steps 9,10,11 and 12 15. UNTIL Total_electricity _energy is distributed, and Evacuaction_limits are considered 16. WRITE energy allocated to each power plant “optimal solution” 17. WRITE the corresponding cost 18. DISPLAY sum = sum of energy allocated to all power plants 19. Ensure sum = Total_electricity _energy 20. STOP |
References
- Rafique, M.M.; Ahmad, G. Targeting sustainable development in Pakistan through planning of integrated energy resources for electricity generation. Electr. J. 2018, 31, 14–19. [Google Scholar] [CrossRef]
- United Nations Development Program. 2021. Available online: http://www.undp.org/content/undp/en/home/sustainable-development-goals.html (accessed on 7 August 2021).
- Quaschning, V. Understanding Renewable Energy Systems; Earthscan: London, UK, 2005. [Google Scholar]
- Moseley, P.T.; Garche, J. Electrochemical Energy Storage for Renewable Sources and Grid Balancing; Elsevier: Amsterdam, The Netherlands, 2015. [Google Scholar]
- Kazem, H.A.; Albadib, M.H.; Al-Waelic, A.H.A.; Al-Busaidid, A.H.; Chaichan, M.T. Techno-economic feasibility analysis of 1 MW photovoltaic grid connected system in Oman. Case Stud. Therm. Eng. 2017, 10, 131–141. [Google Scholar] [CrossRef]
- Shouman, E.R. International and national renewable energy for electricity with optimal cost effective for electricity in Egypt. Renew. Sustain. Energy Rev. 2017, 77, 916–923. [Google Scholar] [CrossRef]
- Ma, T.; Yang, H.; Lu, L.; Peng, J. An Optimization Sizing Model for Solar Photovoltaic Power Generation System with Pumped Storage. Energy Procedia 2014, 61, 5–8. [Google Scholar] [CrossRef] [Green Version]
- Mellouk, L.; Ghazi, M.; Aaroud, A.; Boulmalf, M.; Benhaddou, D.; Zine-Dine, K. Design and energy management optimization for hybrid renewable energy system–case study: Laayoune region. Renew. Energy 2019, 139, 621–634. [Google Scholar] [CrossRef]
- Lude, S.; Fluri, T.P.; Alhajraf, S.; Julch, V.; Kuhn, P.; Marful, A.; Contreras, J.R.S. Optimization of the technology mix for the Shagaya 2 GW renewable energy park in Kuwait. Energy Procedia 2015, 69, 1633–1642. [Google Scholar] [CrossRef]
- Al-Omary, M.; Kaltschmitt, M.; Becker, C. Electricity system in Jordan: Status & prospects. Renew. Sustain. Energy Rev. 2018, 81, 2398–2409. [Google Scholar]
- Jain, S.; Jain, N.K.; Vaughn, W.J. Challenges in meeting all of India’s electricity from solar: An energetic approach. Renew. Sustain. Energy Rev. 2018, 82, 1006–1013. [Google Scholar] [CrossRef]
- Coester, A.; Hofkes, M.W.; Papyrakis, E. An optimal mix of conventional power systems in the presence of renewable energy: A new design for the German electricity market. Energy Policy 2018, 116, 312–322. [Google Scholar] [CrossRef]
- Forough, A.B.; Roshandel, R. Lifetime optimization framework for a hybrid renewable energy system based on receding horizon optimization. Energy 2018, 150, 617–630. [Google Scholar] [CrossRef]
- Ma, Z.; Cui, Y. Optimal Hierarchical Allocation in Deregulated Electricity Market under PSP Auction Mechanism. In Proceedings of the 26th Chinese Control and Decision Conference, Changsha, China, 31 May–2 June 2014. [Google Scholar]
- Guo, L.; Wang, J.; Ma, C.; Gao, C.; Zhang, Q. Optimal Model of Power Purchase Strategy for Direct Power Purchase by Large Consumers Based on the Multi-state Model of Electricity Price. In Proceedings of the IEEE International Conference on Power and Renewable Energy, Melaka City, Malaysia, 28–29 November 2016. [Google Scholar]
- Wang, Y.; Zhang, F.; Zhang, Y.; Wang, X.; Fan, L.; Song, F.; Ma, Y.; Wang, S. Chinese power-grid financial capacity based on transmission and distribution tariff policy: A system dynamics approach. Util. Policy 2019, 60, 100941. [Google Scholar] [CrossRef]
- Muneer, W.; Bhattacharya, K.; Cañizares, C.A. Large-Scale Solar PV Investment Models, Tools, and Analysis: The Ontario Case. IEEE Trans. Power Syst. 2011, 26, 4. [Google Scholar] [CrossRef]
- Nahmias, S. Production and Operations Analysis; McGraw-Hill: Singapore, 2009. [Google Scholar]
- Taha, H.A. Operations Research; Pearson Education, Inc.: Upper Saddle River, NJ, USA, 2003. [Google Scholar]
- Winston, A.Z. Data Analysis, Optimization, and Simulation Modeling; South-Western Cengage Learning: Mason, OH, USA, 2011. [Google Scholar]
- Chang, C.M. Engineering Management Challenges in the New Millennium; Pearson Prentice Hall: Hoboken, NJ, USA, 2005. [Google Scholar]
- Qatar General Electricity and Water Corporation (KAHRAMAA). 2021. Available online: https://km.qa/MediaCenter/Pages/NewsDetails.aspx?ItemID=357 (accessed on 15 July 2021).
- Qatar Electricity and Water Company. Available online: https://www.qewc.com/qewc/en/subsidiaries/siraj-solar-energy/ (accessed on 3 June 2021).
- Qatar General Electricity and Water Corporation (KAHRAMAA) Official Twitter Account. KAHRAMAA (@kahramaa)/Twitter. Available online: https://twitter.com/kahramaa (accessed on 15 December 2021).
- Bayram, I.S.; Saffouri, F.; Koc, M. Generation, analysis, and applications of high resolution electricity load profiles in Qatar. J. Clean. Prod. 2018, 183, 527–543. [Google Scholar] [CrossRef] [Green Version]
- Kamal, A.; Sami, G.A.; Koc, M. Assessing the Impact of Water Efficiency Policies on Qatar’s Electricity and Water Sectors. Energies 2021, 14, 4348. [Google Scholar] [CrossRef]
- Wang, Z.; Zhang, Y.; Wang, T.; Zhang, B.; Ma, H. Design and Energy Consumption Analysis of Small Reverse Osmosis Seawater Desalination Equipment. Energies 2021, 14, 2275. [Google Scholar] [CrossRef]
- Gulf Cooperation Council Interconnection Authority (GCCIA). 2021. Available online: https://www.gccia.com.sa/P/introduction/75 (accessed on 12 July 2021).
Publisher’s Note: MDPI stays neutral with regard to jurisdictional claims in published maps and institutional affiliations. |
© 2022 by the authors. Licensee MDPI, Basel, Switzerland. This article is an open access article distributed under the terms and conditions of the Creative Commons Attribution (CC BY) license (https://creativecommons.org/licenses/by/4.0/).