Article

Assessment of Soil Quality under Different Soil Management Strategies: Combined Use of Statistical Approaches to Select the Most Informative Soil Physico-Chemical Indicators

by
Anna Maria Stellacci
1,
Mirko Castellini
2,*,
Mariangela Diacono
2,
Roberta Rossi
3 and
Concetta Eliana Gattullo
1
1
Department of Soil, Plant and Food Sciences, University of Bari “A. Moro”, 70126 Bari, Italy
2
Council for Agricultural Research and Economics-Agriculture and Environment Research, Center (CREA-AA), 70125 Bari, Italy
3
Council for Agricultural Research and Analysis of Agricultural Economics-Research Centre for Animal Production and Aquaculture, Bella Muro, PZ, S.S. 7, 85051 Potenza, Italy
*
Author to whom correspondence should be addressed.
Appl. Sci. 2021, 11(11), 5099; https://doi.org/10.3390/app11115099
Submission received: 22 April 2021 / Revised: 25 May 2021 / Accepted: 26 May 2021 / Published: 31 May 2021
(This article belongs to the Special Issue Sustainable Agriculture and Soil Conservation II)

Abstract

:
Assessment of soil quality under different management practices is crucial for sustainable agricultural production and natural resource use. In this study, different statistical methods (principal component analysis, PCA; stepwise discriminant analysis, SDA; partial least squares regression with VIP statistics, PLSR) were applied to identify the variables that most discriminated soil status under minimum tillage and no-tillage. Data collected in 2015 from a long-term field experiment on durum wheat (Triticum durum Desf.) were used and twenty soil indicators (chemical, physical and biological) were quantified for the upper soil layer (0–0.20 m). The long-term iteration of different management strategies affected soil quality, showing greater bulk density, relative field capacity (RFC), organic and extractable carbon contents (TOC and TEC) and exchangeable potassium under no-tillage. PCA and SDA confirmed these results and underlined also the role of available phosphorous and organic carbon fractions as variables that most discriminated the treatments investigated. PLSR, including information on plant response (grain yield and protein content), selected, as the most important variables, plant nutrients, soil physical quality indicators, pH and exchangeable cations. The research showed the effectiveness of combining variable selection methods to summarize information deriving from multivariate datasets and improving the understanding of the system investigated. The statistical approaches compared provided different results in terms of variables selected and the ranking of the selected variables. The combined use of the three methods allowed the selection of a smaller number of variables (TOC, TEC, Olsen P, water extractable nitrogen, RFC, macroporosity, air capacity), which were able to provide a clear discrimination between the treatments compared, as shown by the PCA carried out on the reduced dataset. The presence of a response variable in PLSR considerably drove the feature selection process.

1. Introduction

Soil is increasingly recognized as major provider of ecosystem services [1,2]. Food and biomass production, climate change mitigation through carbon cycling and carbon sequestration, prevention of land degradation, water purification and supply are some of the services supported, regulated and provided by soils [3,4]. In addition, soil quality has strong implications on human health, both by producing safe and nutritious food and protecting from environmental pollution, thus demonstrating its important role in both society and the environment [5,6]. These evidences have raised the awareness that soil resources must be protected from degradation, and increased the need for effective and reliable information on soil quality modifications/alterations as a consequence of its management [4].
Intensive agricultural activity and not sustainable management practices may give rise to soil degradation processes with a consequent decline of crop yield and soil quality [4,7], and an associated reduction in ecosystem functions and services [8,9]. Among land-use and soil management practices, tillage strongly affects soil physical quality since it directly modifies soil aggregation and structural stability [10], soil porosity [11,12] and hydrological properties [13] and thus the soil ability to store and transmit water and air [14,15]. In addition, tillage management plays a key role in soil organic matter turnover, microbial abundance and diversity, carbon storage and thus CO2 emissions [16,17]. Several researches described the beneficial effects of no-tillage management on soil properties [17,18,19,20]. However, significant effects on soil carbon changes and overall soil quality are often difficult to detect in the short- and medium-term period, due to the two-stage responses to change exhibited by many fundamental soil properties [17,21]. In this context, long-term field experiments may be considered ideal research tools where relatively stable conditions are likely to be observed [12,15,21,22,23].
Soil quality can be inferred by identifying and measuring the soil quality indicators, which are specific soil properties and processes sensitive to land use and management [5,24,25,26,27]. Most Authors have used single indicators to assess soil quality and its relationship with land uses [5]; however, univariate approaches do not always allow a comprehensive judgement on soil status. In addition, increasing the number of indicators may increase collinearity or provide conflicting results, making difficult the soil quality evaluation [15,28]. A selection and combination of indicators of different nature (physical, chemical and biological), through the computation of soil quality indices (SQIs), is essential to gain a “holistic image of soil quality” [28]. Generally, the assessment of a SQI comprises three main steps: (1) measurement and selection of the most relevant soil attributes; (2) normalization and scoring of the selected soil properties using appropriate scoring functions; (3) integration of the scored attributes to construct the final index [6,29,30]. The selection of the most relevant soil properties is a critical step as it is the basis of the soil quality index. Selected indicators represent the minimum dataset variables [28]. Many studies have focused on selecting soil variables, exploring a broad range of approaches from qualitative -expert opinion and literature review results- to semi-quantitative and quantitative statistically based methodologies [30,31]. There is, however, a general consensus on the need of relying on rigorous approaches based on feature selection methods to avoid biased results.
Feature selection methods result in a subset of the original features or variables [32,33], selecting “relevant” variables which capture most of the information on processes and functioning of the system investigated, while excluding “irrelevant” and/or “redundant” variables. Among feature selection approaches, principal component analysis (PCA) has mainly been used [29]. Supervised methods and regressive techniques, such as discriminant analysis and partial least squares regression, are progressively being evaluated for their effectiveness in several studies [30,34,35].
Partial least squares regression (PLSR) is a powerful tool used in chemometrics [36] and has proven to be very versatile with applications in several research fields [32]. PLSR is a supervised method, relating the variations in one (PLS1) or multiple (PLS2) response variables to the variations of several predictors; the method selects successive orthogonal factors, which maximize the covariance between predictors and response variables. PLSR is particularly useful when the number of predictors is higher than the number of observations and/or when predictors are highly correlated, as frequently happens for soil indicators. Even though PLSR is usually adopted for predictive purposes, a large number of methods for variable selection in PLSR have been proposed. Among them, filter methods (loading weight vectors, PLS regression coefficients and variable importance on projection statistics- VIP) use the output of the PLS-algorithm to identify a subset of important variables [32]. In particular, VIP statistics are able to summarize the contribution of both predictors and response variables [37].
Principal component analysis (PCA) is a widespread procedure designed to summarize large datasets of correlated variables into a reduced number of components bearing the greatest part of the original information [38]. Variable weights or loadings of the retained components are useful to identify the variables that most contribute to each selected PC and investigate their relationships. Variables correlations and stepwise and canonical discriminant analysis (SDA and CDA) have been adopted in previous studies [15,33,39]. In particular, SDA allows the selection of variables which can best differentiate treatments or classes.
In a study aimed to assess the effects of different management practices on soil physical quality (SPQ) in long-term field experiments, Castellini et al. [15] applied correlation analysis, PCA and SDA to select key soil physical quality indicators. The results highlighted the complementary and supplementary role of the three methods applied and the importance of simultaneously using different approaches to gain a complete understanding of the processes investigated. De Paul Obade et al. [35], after a preliminary comparison of different multivariate approaches, used PLSR to define a standardized soil quality index for different soil conditions, natural vegetation or woodlands and different soil management, conventional tillage and no-tillage. Soil organic carbon, bulk density, carbon-nitrogen ratio and electrical conductivity were identified as the major variables influencing soil quality status and the index provided a comprehensive evaluation of the management investigated. Shukla et al. [24] used factor analysis to identify appropriate soil quality indicators under different land use and management practices. Soil organic carbon was the most dominant measured attribute; other key soil attributes were mainly physical indicators—i.e., field water capacity, air-filled porosity, bulk density- and pH. Pulido Moncada et al. [34] applied decision trees and assessed soil quality using visual soil assessment in the field and a limited number of physical and chemical soil properties.
Regardless of the approach used, little research is available on the comparison and combined use of different statistical methods for selection of soil indicators. Therefore, the main objectives of this study were to (i) identify the most suitable variables for discriminating soil status under different soil management strategies and (ii) compare the performance of three multivariate statistical approaches to select soil indicators. Data collected in 2015 from a long-term field experiment investigating the effects of two soil management strategies on durum wheat (Triticum durum Desf.) in a Mediterranean area were used. The performance of PCA was compared to SDA and PLSR using VIP statistics (PLS-VIP) for feature selection.

2. Materials and Methods

2.1. Study Area and Long-Term Field Experiment

The study was carried out on a dataset collected from a long-term field experiment, performed at the experimental farm of the Council for Agricultural Research and Economics (CREA-AA) in Southern Italy (Foggia, 41°27′03″ N, 15°30′06″ E).
The climate of the study area is classified as “accentuated thermomediterranean” [40], with temperatures that may fall below 0 °C in winter and exceed 40 °C in summer. Rainfall is unevenly distributed throughout the year and is mostly concentrated in the winter months, with a long-term annual average of 550 mm [41]. The soil is clay of alluvial origin (42.7 and 29.6% of clay and sand, respectively), classified as fine, mesic, Typic Chromoxerert [42].
The rain-fed durum wheat monoculture tillage trial, established in 2002 and still ongoing, compares the effects of two soil management strategies (i.e., minimum tillage, MT, and no-tillage, NT) on durum wheat yield response and on soil fertility. Minimum tillage consists of a two-layer soil tillage at 40 cm depth (i.e., a chisel and rotary tiller combination) performed in autumn before durum wheat sowing. No-tillage consists of a direct sowing of durum wheat after a chemical weeding treatment. Treatments are arranged in a randomized complete block design with three replicates and unit plots of 500 m2 size. For both treatments, in September straw was chopped into 10- to 15-cm lengths and spread back onto the plot. Weeding with glyphosate was carried out in early November on NT plots. Sowing was performed for both treatments at the end of November with a seeder for direct sowing, appropriately equipped with shaped blades. All other agronomic techniques (fertilization, pest control and weed management during crop growth) were carried out uniformly for the two soil management compared. At harvesting, yield was measured at each soil location within a subarea of 1 × 1 m. Further information on plot management can be found in Castellini et al. [15].

2.2. Soil Sampling and Laboratory Measurements

Undisturbed soil cores were collected at wheat heading (April 2015) within each experimental unit of the RCBD experimental design in 4 sub-replicate locations, for a total of 24 observations. Soil samples were collected at 0–0.20 m depth. The following indicators were quantified on the soil samples:
(i) chemical indicators: total organic carbon and total nitrogen (TOC and N), alkali-extractable carbon (TEC), humic and fulvic acid carbon (HA_FA), water extractable nitrogen and organic carbon (WEN and WEOC), Olsen available phosphorus (P_Olsen), exchangeable cations (Ca2+, Mg2+, Na+, K+), pH and electrical conductivity (EC);
(ii) physical indicators: texture, dry bulk density (BD), macroporosity (PMAC), air capacity (AC) and relative field capacity (RFC);
(iii) biological indicator: microbial biomass carbon quantified with the fumigation-extraction method [43].
WEOC and WEN, which are indicators for labile organic C and N pools, were extracted from field-moist soil samples according to the protocol reported in Armenise et al. [28]. TOC, TEC, HA_FA and total N were quantified on dried and 2-mm sieved samples, following protocols reported in Ferrara et al. [17]. In detail, for TOC quantification, soil samples were ground to a fine powder (0.5 mm) using an agate ball mill. TEC was obtained by 0.1 M NaOH + 0.1 M Na4P2O7 extraction at 65 °C for 48 h. Humic and fulvic acids were fractionated by acidification to pH = 2.0 with H2SO4. The purification of FA from non-humic substances was carried out by adsorption onto polyvinylpyrrolidone columns. Total organic carbon in soil samples, as well as C fractions in alkali extracts and C and N fractions in water extracts, were quantified through dry combustion using a TOC Vario Select analyzer (Elementar, Lomazzo, Germany), which conducts a catalytic combustion of the sample at high temperatures in air environment. Total N was quantified according to the Kjeldahl procedure.
Both BD and some points of soil water retention curve, namely the relationship between volumetric soil water content (θ) and water pressure head (h), were determined using undisturbed soil cores. Specifically, stainless steel rings with sharp edges (8 cm inner diameter; 5 cm height) were used to determine soil BD and water retention curve at high pressure heads (h ≥ 120 cm). A disturbed soil sample was collected close to the undisturbed sample collection points to determine the water retention curve at low pressure heads (h ≤ 330 cm). The θ values were determined on each undisturbed soil core by a hanging water column apparatus [44] for h values ranging from −5 to −120 cm, and on repacked soil cores by pressure plate method [45] for h values ranging from −330 to −15,300 cm [46]. The soil water retention function was obtained fitting the experimental data with the van Genuchten model [47], and a set of capacitive indicators that give into account of water/air availability were estimated: macroporosity (PMAC = θs − θm) (cm3 cm−3), air capacity (AC = θs − θFC) (cm3 cm−3) and relative field capacity (RFC = θFCs) (dimensionless), where θs, θm, θFC are the volumetric water contents corresponding to a pressure head of 0, −10 and −100 cm, respectively. Evaluation of soil physical quality (SPQ) was carried out according to classifications gathered from literature [14]. In particular, the SPQ was considered optimal when 0.9 ≤ BD ≤1.2 g cm−3, PMAC ≥ 0.07 cm3 cm−3, AC ≥ 0.14 cm3 cm−3 and 0.6 ≤ RFC ≤ 0.7. Supplementary information on the described indicators can be found in Castellini et al. [15].

2.3. Data Analysis

Descriptive statistics were computed to summarize the main features of data distribution of response variables to be used in the regressive approach. In addition, variables were tested for normality, using Shapiro-Wilk and Kolmogorov-Smirnov tests, and for heteroscedasticity by soil management with Levene homogeneity of variance test. Data distribution and presence of heteroscedasticity were also examined for soil variables.
The set of twenty soil variables was first analyzed through a nested analysis of variance (ANOVA) considering replicates within plots as pseudo-replicates. Then, data were analyzed using Principal Component Analysis (PCA), Stepwise Discriminant Analysis (SDA) and Partial Least Square Regression (PLSR) with Variable Importance for Projection (VIP) statistics.
PCA was applied to the correlation matrix of the soil variables in order to obtain few new components explaining most of the variation of the original variables. The principal components (PCs) that explained cumulatively a high percentage of the total variance and had an eigenvalue greater than one (Kaiser criterion) were retained. Together with eigenvalue, percentage of variation explained by the single component was taken into account, considering the threshold of 5% suggested by Wander and Bollero [48]. Variable loadings were examined. Within each PC, only highly weighted loadings, defined as having absolute values within 10% of the highest loading [49], were considered and signs were examined to investigate relationships among selected variables.
SDA was applied to identify the variables enabling maximum discrimination among the compared classes (soil management treatments). The Wilks’ lambda statistic was used as multivariate measure of separability [50]. The use of SDA requires that a set of assumptions should be checked, among which normality of data distributions, homoscedasticity and not complete redundancy of considered variables. However, a moderate departure from such assumptions does not affect seriously analysis outcomes as shown by a large literature concerning SDA application [51,52,53]. SDA was carried out using the STEPWISE algorithm of STEPDISC procedure of SAS/STAT [54]; significance level to entry and to stay was set at 0.05.
PCA and SDA were first performed separately on the set of chemical variables (plus carbon of the microbial biomass) and physical variables, and then were carried out on the whole dataset of indicators.
PLSR was carried out on mean-centered and variance-scaled data of predictors and response variables. In this study, predictors were represented by soil chemical, physical and biological properties; response variables were grain yield and grain protein content, as integrated indicators of quantitative and qualitative crop response to different soil management conditions. The optimal number of factors to be retained in the model was based on the minimum predicted residual sum of squares statistics (PRESS) [54]. In this study, both approaches were used in running PLSR: PLS1 and PLS2 [55,56]. In PLS1, PLSR was carried out using grain yield or protein content as single response variable; in PLS2, grain yield and protein content were considered simultaneously as multiple response variables.
VIP statistics were used for variable selection [57]. Since the average of squared VIP scores equals 1 [58], only the variables with a VIP score greater than 1 are generally considered significant. However, thresholds between 0.83 and 1.21 have also been suggested [32]. A value of 0.8 is also considered by Wold [59] for retaining or deleting variables. The soil variables with the highest VIP values were selected. PLS regression was performed using PLS procedure of SAS/STAT [54].

3. Results

3.1. Preliminary Statistical Analysis

Preliminary statistical analysis carried out on grain yield and protein content, response variables in PLSR, showed close mean and median values and coefficient of skewness and kurtosis equal or lower than 0.5. These results were confirmed by normality tests indicating for both variables a not significant deviation from normal distribution (P = 0.5198 and P = 0.0970 for the Shapiro-Wilk test, for grain yield and protein content, respectively). Variances were homogeneous over management treatments for both variables according to Levene test (P = 0.4128 for grain yield and P = 0.2432 for protein content). Average values of grain yield and protein content were respectively 5.247 Mg ha−1 and 13.39 g 100 g−1.
Soil variable distributions did not significantly deviate (microbial biomass C, TOC, TEC, HA_FA, N, Olsen P, pH, K+, Mg2+, Na+, BD, AC, RFC, clay and sand) or only slightly deviated (EC, Ca2+, PMAC) from normal distribution, except for WEOC and WEN. Homoscedasticity was also observed in the larger part of the cases (except for WEN and PMAC). For this reason, data were analyzed for all the variables in the original scale.

3.2. Analysis of Variance

Different soil management strategies significantly affected both total organic and total extractable carbon (TOC and TEC), and water extractable nitrogen (WEN) concentrations, with higher TOC and TEC content observed in the upper soil layer under more conservative soil management (Table 1). In particular, an average TOC value of 21.87 g kg−1 was recorded under no-tillage (NT) in comparison to 17.45 g kg−1 under minimum tillage (MT) management. A greater significant concentration of exchangeable potassium (K+) was also observed in untilled soils (Table 1). Under minimum tillage, higher WEN concentrations were observed.
Soil management also affected physical properties with a significantly greater bulk density (BD) in untilled soils and, as a consequence, lower air capacity (AC), indicating a tendency to soil compaction (Table 2). Macroporosity (PMAC) confirmed this trend, although not significant differences were recorded. Relative field capacity (RFC), that gives an account of the balance between water capacity and air capacity of the soil (in other words, it is an index of the relative importance of meso-micropores to total porosity), was higher in NT than in MT, suggesting major potential risks of anaerobic conditions due to reduced presence of air in the soil porosity.
According to Reynolds et al. [14], optimal and intermediate values were observed under MT for bulk density (0.9–1.2 g cm−3, optimal range), air capacity (0.10–0.14 cm3 cm−3, intermediate range) and macroporosity (0.04–0.07 cm3 cm−3, intermediate range) and values slightly over than the optimal threshold for RFC (0.6–0.7, optimal range). Except for BD, values recorded under NT were all indicative of limited aeration conditions.
The long-term iteration of the different management strategies slightly affected grain yield response (P = 0.0603), with average values of 5.45 and 5.04 Mg ha−1 recorded under no-tillage and minimum tillage, respectively. No significant effect of the management compared was instead observed for grain protein content.

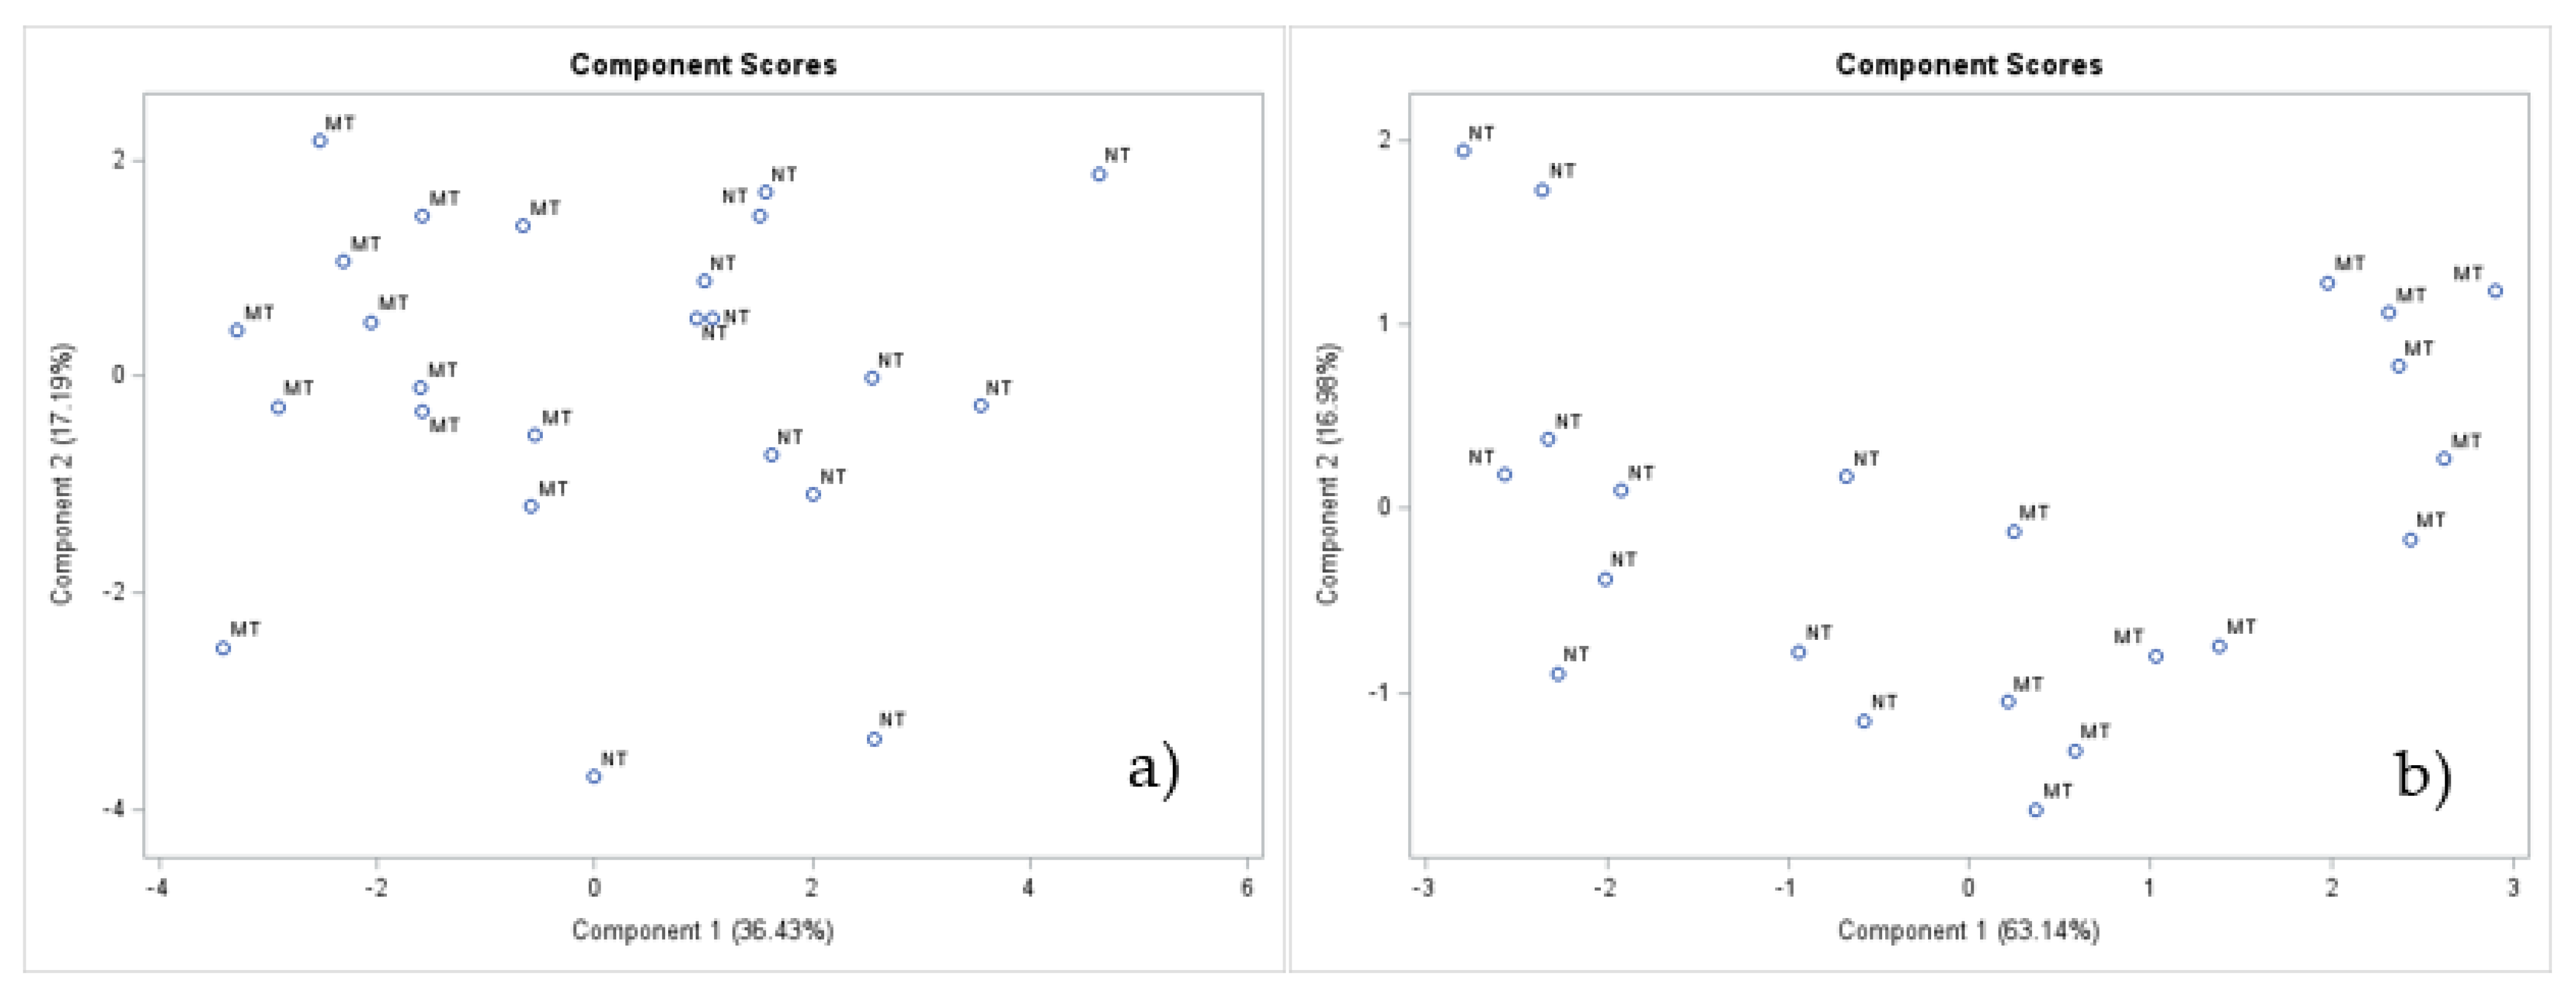
3.3. Principal Component Analysis

PCA was first performed separately on the set of chemical and physical variables, and then carried out on the whole dataset.
In the analysis of the chemical indicators, the first three components (PCs) explained about 65.16% of total variance, whereas in the analysis of the physical indicators, the first two PCs were able to explain 80.12% of total variance (Table 3).
The score plots of the first two components showed that both chemical and physical variables were able to discriminate the different soil management compared (Figure 1). The inspection of the loadings of the first PCs highlighted that no-tilled soils (NT) were characterized by a greater TOC and TEC, together with exchangeable K+ content, and by a larger bulk density and RFC, whereas a lower PMAC and AC were detected.
The analysis on the whole set of soil indicators (chemical, physical and biological) confirmed these results with an even clearer treatment discrimination and the same highly weighted variables showing the greatest loadings (Table 4 and Table 5; Figure 2).
In detail, the first four PCs explained cumulatively about 72.54% of total variance (Table 4). In the first PC (41.21% of total variance) the highly weighted variables were TOC and TEC among chemical variables, whereas RFC and AC, followed by PMAC, for the hydrological soil parameters (Table 5). Slightly under the threshold of 10% of the highest factor loading [50], there were exchangeable K+ and bulk density and, at a lower extent, WEN. In the second PC (12.61%), available P and humic and fulvic acids showed the highest loadings, with microbial biomass carbon and pH slightly under the threshold. In the third (10.65%) and fourth (8.07%) components, exchangeable Ca2+ and N were selected, respectively (Table 5). The inspection of these results showed that the first PC summarized main findings of the analysis of variance. The second component highlighted instead the role of available nutrients (P) and some carbon fractions (humic and fulvic acids C and microbial biomass C), adding, in this way, further elements to explain differences observed in the experimental conditions.

3.4. Stepwise Discriminant Analysis

SDA was first performed separately on the set of chemical and physical variables, and then carried out on the whole dataset.
Variables enabling maximum discrimination among treatments for the analysis carried out on the dataset of chemical and biological indicators were TOC (P < 0.0001) and HA_FA (P = 0.0004), followed at a lower extent by Olsen P (P = 0.0111), EC (P = 0.0258), WEOC (P = 0.0397) and TEC (P = 0.05). In the analysis carried out on the set of physical indicators, the variables selected were RFC (P < 0.0001) and clay (P = 0.037).
Finally, the analysis carried out on the whole dataset summarized the results obtained, selecting TOC (P < 0.0001), RFC (P < 0.0001) and WEOC (P = 0.003) as variables enabling maximum discrimination among treatments (Table 6).
Both PCA and SDA, as well as univariate analysis of variance, returned TOC and RFC among the most influential variables both on the set of chemical and physical data analyzed separately as well as on the whole dataset. In addition, WEOC was selected among the most discriminating variables in the SDA carried out on the whole dataset of soil indicators. These findings are in agreement with results reported by previous studies in the selection of the most relevant indicators for assessing soil quality status.

3.5. Partial Least Squares Regression and VIP Statistics

PLSR was applied to gain further information in the selection of the most informative variables to describe the effects of the two soil management practices compared. The method was applied to the whole set of soil indicators and considering grain yield and grain protein content as single response variables (PLS1) and as multiple response variables (PLS2).
When wheat grain yield was considered as single response variable, the first two factors accounted cumulatively for 47.20% of total variance in predictors and 48.17% in the response variable. VIP coefficient profiles (Figure 3a) showed that the highest values were recorded for Olsen P and PMAC, followed by TOC, TEC, pH and Mg2+ (for the chemical variables) and by clay, RFC and AC (for the physical variables).
The use of grain protein content as response variable further modified the rank of indicators selected. The first two factors accounted cumulatively for 49.54% of total variance in predictors and 23.59% in response. The greatest PLS-VIP statistics values were recorded for N and Olsen P, followed by WEN and sand, thus indicating the contribution of macro-elements, with particular regard to N (total and labile form), in affecting grain protein concentration (Figure 3b). In addition, TOC, TEC, Ca2+ and pH showed important contribution.
The inspection of both VIP profiles (Figure 3a,b) underlined the role of physical soil indicators (PMAC, AC and RFC), which were selected as important variables in both analyses.
Finally, PLSR was carried out considering simultaneously, as response variables, the grain yield and protein content (PLS2). The first two factors extracted accounted cumulatively for 48.56% of total variation in predictors and 27.16% in the response variable. From the inspection of the VIP profile (Figure 3c), the role of available nutrients (Olsen P and, secondary, WEN) and hydrological variables (PMAC, AC and RFC) in explaining plant response emerged again. These variables were followed by soil carbon contents (TOC and TEC), pH and exchangeable cations.
The inclusion of a response variable in PLSR—yield, protein content or both—significantly modified the rank of soil indicators selected, giving greater emphasis to plant macro-nutrients (available P and N), particularly when the grain protein content was used as dependent variable. These results underline the importance of using combined approaches to explore the data and interpret the behavior of the system investigated.
Finally, for a further exploratory purpose, PCA was carried out on the variables more frequently selected with the combined use of SDA, PCA and PLSR, namely TOC, TEC, Olsen P, WEN, RFC, PMAC and AC. Figure 4 shows that the seven variables were able to discriminate the treatments under investigation. Additionally, a clear improvement in the percentage of variance explained by the first two components (89.34%) was observed in comparison to the analysis performed on the whole set of soil indicators.

4. Discussion

Long-term experiments can be considered valuable research infrastructures, which enable the long-term study and monitoring of the effects of agricultural strategies or management scenarios. Among agricultural practices, soil tillage strategies are major determinants of soil status and quality. By directly acting on soil physical properties—modifying porosity (total pore space and pore size distribution), soil aggregate size and stability, hydraulic conductivity, soil tillage modifies air-water capacity relationships and thus induces changes in soil organic carbon dynamics, nutrient cycling and solute transport [60]. Significant effects can usually be observed when stable or near-stable conditions are established, after transition periods [61]. In this study, the long-term iteration (over about 13 years) of two soil management strategies—minimum tillage and no-tillage—considerably affected certain physical and chemical properties of the upper soil layer in the system investigated.
Analysis of variance showed that significantly greater bulk density (BD) and relative field capacity (RFC) values and, consequently, lower air capacity (AC), were recorded under no-tillage soil management. Since RFC is the ratio between the water content at the field capacity and that at water saturation, relatively higher RFC values highlight a reduced availability for soil air. In accordance with previous results on fine-textured soils [62], soil physical quality was thus indicative of lower aeration conditions under no-tillage.
The long-term no-tillage soil management also enhanced total organic and extractable carbon contents (TOC and TEC). The behavior observed is in agreement with several studies [19,63,64], since the reduced soil disturbance reduces the turnover of soil aggregates favoring the accumulation and stabilization of organic matter within micro- and macro-aggregates, thus leading to a net gain of soil carbon. Significantly different values of C and N of the microbial biomass, bulk density, hydraulic conductivity and average weight of soil aggregates were also observed by Sharma et al. [49] under conventional and no-tillage in a long-term field experiment. Laudicina et al. [65], comparing the effect of different cropping systems (wheat/wheat and wheat/bean) and most used tillage managements (conventional, dual layer and no-tillage), in a long-term field experiment on soil organic C pools (total and extractable organic C, microbial biomass C, basal respiration), observed that tillage management affected the soil organic C stored in the first 15 cm of soil more than cropping system. No-tillage caused a 3.6 Mg ha−1 increase of C content in a wheat/faba rotation, and an increase of 5.6 Mg ha−1 in wheat monoculture after 19 years [65]. A greater exchangeable K+ content was also observed under no-tillage. PCA and SDA confirmed and summarized results of analysis of variance but also underlined the role of organic carbon fractions -humic and fulvic acids and WEOC-, and available P as main sources of variability in describing the data (PCA), and as the variables that most discriminated the treatments compared (SDA). In a study assessing the suitability of different labile C fractions as soil quality indicators, Bongiorno et al. [66] found that WEOC (dissolved organic C) was not sensitive to soil tillage, unlike the particulate organic C; in any case, WEOC content highly depends on environmental conditions and soil sampling time [66]. In accordance with the present study, López-Fando and Pardo [67] measured higher concentrations of exchangeable K+ and available P under no tillage compared to minimum tillage, at a soil depth of 0–20 cm. Similarly, Martin-Rueda et al. [68] found greater concentrations of plant-available K and P in surface soil (0–20 cm) under no-tillage compared to minimum tillage system, but no difference was observed between the two soil management systems at higher soil depths. The accumulation of available P, K and other nutrients in surface soil layers under no-tillage is usually ascribed to the decomposition of organic matter (which is more abundant in no-tilled soils) and to the accumulation of mineral fertilizers in topsoil [69]. The tillage system also influences the relations occurring between plant roots, soil and microorganisms at the rhizosphere level. After long-term no tillage, a higher activity of alkaline phosphatase and acid phosphatase was measured by Balota et al. [70]. These two enzymes, which can be released both by plant roots and soil microorganisms, are involved in the release of labile P from the organic pools. Moreover, the organic acids exuded by plant roots and/or released through organic matter decomposition could compete with P for the binding sites on soil particles, thus enhancing P availability [69].
Finally, PLSR, by considering simultaneously soil indicators and plant response (grain yield, protein content or both), selected as important variables the mineral nutrients (available P, and both total and water extractable N), particularly when grain protein content was used as dependent variable, together with soil physical quality indicators (PMAC, AC, RFC), pH and exchangeable cations. To this regard, VIP statistics, being a weighted sum of the squares of PLS X-score coefficients for the retained components, with the weights calculated from the amount of dependent variable (Y) variance explained by each retained component [33,37], were able to summarize the contribution of both predictors and response variables. Thus, the contribution of mineral nutrients in determining plant response was also highlighted. Results of both PCA and SDA, as well as of univariate analysis of variance, returned TOC and RFC among the most influential variables both on the set of chemical and physical indicators analyzed separately as well as on the whole dataset. Previous studies highlighted the role of RFC among soil indicators in assessing soil physical quality. This variable was able to summarize part of the information given by AC and PMAC and, supported also by BD and plant available water content, showed the highest discriminating capability of the soil and crop residues management strategies compared [15]. TOC selection is important because is a necessary input for soil structural quality indicators [71]. This variable is also indicative of the soil chemical quality, being positively related with soil CEC and nutrient retention capacity. Moreover, TOC can be also indicative of the soil biological quality, due to its key role in maintaining the soil trophic relations and stimulating both the plant and soil microbial activity. Shukla et al. [24], selecting key soil indicators by means of factor analysis, concluded that TOC was the most dominant measured soil attribute as soil quality indicator for the two soil depths investigated and suggested its use for monitoring soil quality changes [24,34].
Overall, the inspection of VIP profiles, together with the results of all methods compared, underlined the role of physical soil indicators (PMAC, AC and RFC), which were selected as important variables in all the analyses performed. This reinforces the idea that such soil capacitive indicators (e.g., RFC) can be suggested for several practical applications including, for example, the estimation of optimal rate of amendments in laboratory, before use in the field.
In the assessment of soil quality modifications as effect of agronomic management, the number and type of the indicators considered are strictly related to the aim of the study and to the spatial scale investigated [72]. Our research was performed at field scale and had a methodological and exploratory aim, focused on comparing the strength and ability of different statistical approaches to extract crucial information from soil data and gain an improved understanding of the system investigated. In any case, the combined approach described in this study can be applied to the analysis of different datasets and conditions, including also different spatial scales.

5. Conclusions

This methodological study shows the effectiveness of using variable selection methods to summarize the information deriving from multivariate datasets and improving the understanding and interpretability of the system investigated. The results also highlight the importance of simultaneously using different approaches because they may provide different and complementary information. The statistical approaches compared provided different results in terms of variables selection and ranking of the selected variables. The presence of a response variable, in the regressive technique, significantly drove the feature selection process. In particular, the inclusion of yield or protein content, as response variables in PLSR, modified the rank of selected soil indicators, giving greater emphasis to plant nutrients, particularly when the grain protein content was considered. The variables more frequently selected with the combined use of the three methods (TOC, TEC, Olsen P, WEN, RFC, PMAC, AC) were able to provide a clear discrimination between the treatments compared, as shown by the PCA carried out on the reduced dataset. Results finally emphasize the role of multi-year datasets which are invaluable tools to explore benefits and limits of different methodologies and management practices.

Author Contributions

Conceptualization, A.M.S. and M.C.; methodology, A.M.S.; formal analysis, A.M.S.; investigation, M.C., R.R. and A.M.S.; data curation, A.M.S., M.C., M.D., R.R. and C.E.G.; writing—original draft preparation, A.M.S. and M.C.; writing—review and editing, A.M.S., M.C., M.D., R.R. and C.E.G. All authors have read and agreed to the published version of the manuscript.

Funding

The authors would like to thank the EU and MIUR for funding the present methodological contribution, in the frame of the collaborative international consortium DESERT financed under the ERA-NET Cofund WaterWorks2014 Call; this ERA-NET is an integral part of the 2015 Joint Activities developed by the Water Challenges for a Changing World Joint Programme Initiative (Water JPI). The work was also supported by the projects “BIOTILLAGE, Approcci innovativi per il miglioramento delle performances ambientali e produttive dei sistemi cerealicoli no-tillage”, financed by PSR-Basilicata 2007–2013 and PRIMA Fundation, call 2019-Section 1–GA n.1912 “Research-based participatory approaches for adopting Conservation Agriculture in the Mediterranean Area—CAMA” project.

Informed Consent Statement

Not applicable.

Data Availability Statement

The data presented in this study are available on request from the corresponding author.

Acknowledgments

The authors want to acknowledge Carolina Vitti, Luisa Giglio and Marcello Mastrangelo for their skillful work in laboratory analysis. In addition, they want to acknowledge Sabrina Moscelli, Vittorio Vonella and Franco Fornaro, for data collection and agronomic trial management.

Conflicts of Interest

The authors declare no conflict of interest.

Abbreviations

ACair capacity
BDdry bulk density
C_biomassmicrobial biomass carbon
HA_FAhumic and fulvic acid carbon
MTminimum tillage
NTno-tillage
Ntotal nitrogen
PCAprincipal component analysis
PLSRpartial least squares regression
PMACmacroporosity
P_OlsenOlsen available phosphorus
RFCrelative field capacity
SDAstepwise discriminant analysis
SPQsoil physical quality
SQIssoil quality indices
TECalkali-extractable carbon
TOCtotal organic carbon
VIP and PLS-VIPvariable importance for projection
WENwater extractable nitrogen
WEOCwater extractable organic carbon

References

  1. Palm, C.; Sanchez, P.; Ahamed, S.; Awiti, A. Soils: A contemporary perspective. Annu. Rev. Environ. Resour. 2007, 32, 99–129. [Google Scholar] [CrossRef] [Green Version]
  2. Lozano-Baez, S.E.; Domínguez-Haydar, Y.; Meli, P.; van Meervel, I.; Vásquez, K.V.; Castellini, M. Key Gaps in Soil Monitoring during Forest Restoration in Colombia. Restor. Ecol. 2021. Accepted Author Manuscript. [Google Scholar] [CrossRef]
  3. Lal, R. Soil carbon sequestration impacts on global climate change and food security. Science 2004, 304, 1623–1627. [Google Scholar] [CrossRef] [Green Version]
  4. Lal, R. Restoring soil quality to mitigate soil degradation. Sustainability 2015, 7, 5875–5895. [Google Scholar] [CrossRef] [Green Version]
  5. Zornoza, R.; Acosta, J.A.; Bastida, F.; Domínguez, S.G.; Toledo, D.M.; Faz, A. Identification of sensitive indicators to assess the interrelationship between soil quality, management practices and human health. Soil 2015, 1, 173–185. [Google Scholar] [CrossRef] [Green Version]
  6. Bünemann, E.K.; Bongiorno, G.; Baic, Z.; Creamerb, R.E.; De Deynb, G.; de Goedeb, R.; Fleskensd, L.; Geissend, V.; Kuyperb, T.W.; Mädera, P.; et al. Soil quality—A critical review. Soil Biol. Biochem. 2018, 120, 105–125. [Google Scholar] [CrossRef]
  7. Svoray, T.; Hassid, I.; Atkinson, P.M.; Moebius-Clune, B.N.; van Es, H.M. Mapping soil health over large agriculturally important areas. Soil Sci. Soc. Am. J. 2015, 79, 1420–1434. [Google Scholar] [CrossRef]
  8. Castellini, M.; Stellacci, A.M.; Di Prima, S.; Iovino, M.; Bagarello, V. Improved beerkan run methodology to assess water impact effects on infiltration and hydraulic properties of a loam soil under conventional- and no-tillage. Soil Sci. Soc. Am. J. 2021. Accepted Author Manuscript. [Google Scholar] [CrossRef]
  9. Castellini, M.; Stellacci, A.M.; Sisto, D.; Iovino, M. The mechanical impact of water affected the soil physical quality of a loam soil under minimum tillage and no-tillage: An assessment using Beerkan multi-height runs and BEST-procedure. Land 2021, 10, 195. [Google Scholar] [CrossRef]
  10. Nouwakpo, S.K.; Song, J.; Gonzalez, J.M. Soil structural stability assessment with the fluidized bed, aggregate stability, and rainfall simulation on long-term tillage and crop rotation systems. Soil Tillage Res. 2018, 178, 65–71. [Google Scholar] [CrossRef]
  11. Castellini, M.; Di Prima, S.; Moret-Fernández, D.; Lassabatere, L. Rapid and accurate measurement methods for determining soil hydraulic properties: A review. J. Hydrol. Hydromech. 2021, 69, 1–19. [Google Scholar] [CrossRef]
  12. Pranagal, J.; Wozniak, A. 30 years of wheat monoculture and reduced tillage and physical condition of Rendzic Phaeozem. Agric. Water Manag. 2021, 243, 106408. [Google Scholar] [CrossRef]
  13. Castellini, M.; Vonella, A.V.; Ventrella, D.; Rinaldi, M.; Baiamonte, G. Determining soil hydraulic properties using infiltrometer techniques: An assessment of temporal variability in a long-term experiment under minimum- and no-tillage soil management. Sustainability 2020, 12, 5019. [Google Scholar] [CrossRef]
  14. Reynolds, W.D.; Drury, C.F.; Tan, C.S.; Fox, C.A.; Yang, X.M. Use of indicators and pore volume-function characteristics to quantify soil physical quality. Geoderma 2009, 152, 252–263. [Google Scholar] [CrossRef]
  15. Castellini, M.; Stellacci, A.M.; Barca, E.; Iovino, M. Application of multivariate analysis techniques for selecting soil physical quality indicators: A case study in long-term field experiments in Apulia (Southern Italy). Soil Sci. Soc. Am. J. 2019, 83, 707–720. [Google Scholar] [CrossRef] [Green Version]
  16. Peigné, J.; Ball, B.C.; Roger-Estrade, J.; David, C. Is conservation tillage suitable for organic farming? A review. Soil Use Manag. 2007, 23, 129–144. [Google Scholar] [CrossRef]
  17. Ferrara, R.M.; Mazza, G.; Muschitiello, C.; Castellini, M.; Stellacci, A.M.; Navarro, A.; Lagomarsino, A.; Vitti, C.; Rossi, R.; Rana, G. Short-term effects of conversion to no-tillage on respiration and chemical-physical properties of the soil: A case study in a wheat cropping system in semi-dry environment. Ital. J. Agrometeorol. 2017, 1, 47–58. [Google Scholar]
  18. Devine, S.; Markewitz, D.; Hendrix, P.; Coleman, D. Soil aggregates and associated organic matter under conventional tillage, no-tillage, and forest succession after three decades. PLoS ONE 2014, 9, e84988. [Google Scholar] [CrossRef] [Green Version]
  19. Six, J.; Elliott, E.T.; Paustian, K. Aggregate and SOM dynamics under conventional and no tillage systems. Soil Sci. Soc. Am. J. 1999, 63, 1350–1358. [Google Scholar] [CrossRef] [Green Version]
  20. Six, J.; Elliott, E.T.; Paustian, K. Soil macroaggregate turnover and microaggregate formation: A mechanism for C sequestration. under no-tillage agriculture. Soil Biol. Biochem. 2000, 32, 2099–2103. [Google Scholar] [CrossRef]
  21. Reynolds, W.D.; Schoenau, J.J.; Drury, C.F. Scientific and practical benefits of long-term field studies. Can. J. Soil Sci. 2014, 94, 253–254. [Google Scholar] [CrossRef]
  22. Diacono, M.; Fiore, A.; Farina, R.; Canali, S.; Di Bene, C.; Testani, E.; Montemurro, F. Combined agro-ecological strategies for adaptation of organic horticultural systems to climate change in Mediterranean environment. Ital. J. Agron. 2016, 11, 85–91. [Google Scholar] [CrossRef]
  23. Diacono, M.; Persiani, A.; Canali, S.; Montemurro, F. Agronomic performance and sustainability indicators in organic tomato combining different agro-ecological practices. Nutr. Cycl. Agroecosyst. 2018, 112, 101–117. [Google Scholar] [CrossRef]
  24. Shukla, M.K.; Lal, R.; Ebinger, M. Determining soil quality indicators by factor analysis. Soil Tillage Res. 2006, 87, 194–204. [Google Scholar] [CrossRef]
  25. Cardoso, E.J.B.N.; Vasconcellos, R.L.F.; Bini, D.; Miyauchi, M.Y.H.; Santos, C.A.; Alves, P.R.L.; Paula, A.M.; Nakatani, A.S.; Pereira, J.M.; Nogueira, M.A. Soil health: Looking for suitable indicators. What should be considered to assess the effects of use and management on soil health? Sci. Agric. 2013, 70, 274–289. [Google Scholar] [CrossRef] [Green Version]
  26. Cherubin, M.R.; Karlen, D.L.; Franco, A.L.; Cerri, C.E.; Tormena, C.A.; Cerri, C.C. A Soil Management Assessment Framework (SMAF) evaluation of Brazilian sugarcane expansion on soil quality. Soil Sci. Soc. Am. J. 2016, 80, 215–226. [Google Scholar] [CrossRef]
  27. Manici, L.M.; Castellini, M.; Caputo, F. Soil-inhabiting fungi can integrate soil physical indicators in multivariate analysis of Mediterranean agroecosystem dominated by old olive groves. Ecol. Indic. 2019, 106, 105490. [Google Scholar] [CrossRef]
  28. Armenise, E.; Redmile-Gordon, M.A.; Stellacci, A.M.; Ciccarese, A.; Rubino, P. Developing a soil quality index to compare soil fitness for agricultural use under different managements in the Mediterranean environment. Soil Till. Res. 2013, 130, 91–98. [Google Scholar] [CrossRef]
  29. Andrews, S.S.; Karlen, D.L.; Cambardella, C.A. The soil management assessment framework: A quantitative soil quality evaluation method. Soil Sci. Soc. Am. J. 2004, 68, 1945–1962. [Google Scholar] [CrossRef]
  30. Rinot, O.; Levy, G.J.; Steinberger, Y.; Svoray, T.; Eshel, G. Soil health assessment: A critical review of current methodologies and a proposed new approach. Sci. Total Environ. 2019, 648, 1484–1491. [Google Scholar] [CrossRef]
  31. Yemefack, M.; Jetten, V.G.; Rossiter, D.G. Developing a minimum data set for characterizing soil dynamics under shifting cultivation systems. Soil Till. Res. 2006, 86, 84–98. [Google Scholar] [CrossRef]
  32. Mehmood, T.; Liland, K.H.; Snipen, L.; Sæbø, S. A review of variable selection methods in Partial Least Squares Regression. Chemom. Intell. Lab. Syst. 2012, 118, 62–69. [Google Scholar] [CrossRef]
  33. Stellacci, A.M.; Castrignanò, A.; Troccoli, A.; Basso, B.; Buttafuoco, G. Selecting optimal hyperspectral bands to discriminate nitrogen status in durum wheat: A comparison of statistical approaches. Environ. Monit. Assess. 2016, 188, 1–15. [Google Scholar] [CrossRef]
  34. Pulido Moncada, M.; Gabriels, D.; Cornelis, W.M. Data-driven analysis of soil quality indicators using limited data. Geoderma 2014, 235, 271–278. [Google Scholar] [CrossRef]
  35. De Paul Obade, V.; Lal, R. A standardized soil quality index for diverse field conditions. Sci. Total Environ. 2016, 541, 424–434. [Google Scholar] [CrossRef] [PubMed]
  36. Geladi, P.; Kowalski, B.R. Partial least-squares regression: A tutorial. Anal. Chim. Acta 1986, 185, 1–17. [Google Scholar] [CrossRef]
  37. Wold, S.; Sjöströma, M.; Lennart, E. PLS-regression: A basic tool of chemometrics. Chemometr. Intell. Lab. Syst. 2001, 58, 109–130. [Google Scholar] [CrossRef]
  38. Rencher, A.C. Methods of Multivariate Analysis, 2nd ed.; Brigham Young University: Provo, UT, USA; John Wiley & Sons, Inc.: New York, NY, USA, 2002. [Google Scholar]
  39. Stellacci, A.M.; Castrignanò, A.; Diacono, M.; Troccoli, A.; Ciccarese, A.; Armenise, E.; Gallo, A.; De Vita, P.; Lonigro, A.; Mastro, M.A.; et al. Combined approach based on principal component analysis and canonical discriminant analysis for investigating hyperspectral plant response. Ital. J. Agron. 2012, 7, 247–253. [Google Scholar] [CrossRef] [Green Version]
  40. UNESCO FAO. Bioclimatic Map of the Mediterranean Zone; (NS162/III, 22A); UNESCO: Paris, France; FAO: Rome, Italy, 1963; p. 60. [Google Scholar]
  41. Ventrella, D.; Stellacci, A.M.; Castrignanò, A.; Charfeddine, M.; Castellini, M. Effects of crop residue management on winter durum wheat productivity in a long term experiment in Southern Italy. Eur. J. Agron. 2016, 77, 188–198. [Google Scholar] [CrossRef]
  42. Soil Survey Staff. Soil Survey Field and Laboratory Methods Manual; Soil Survey Investigations Report No.51, Version 1.0; Burt, R., Ed.; U.S. Department of Agriculture, Natural Resources Conservation Service: Washington, DC, USA, 2009.
  43. Vance, E.D.; Brooks, P.C.; Jenkinson, D.S. An extraction method for measuring soil microbial biomass C. Soil Biol. Biochem 1987, 19, 703–707. [Google Scholar] [CrossRef]
  44. Burke, W.; Gabriels, D.; Bouma, J. Soil Structure Assessment; Balkema: Rotterdam, The Netherlands, 1986. [Google Scholar]
  45. Dane, J.H.; Hopmans, J.W. 3.3. Water Retention and Storage. In Methods of Soil Analysis, Physical Methods; Part 4; Dane, J.H., Topp, G.C., Eds.; John Wiley & Sons: New York, NY, USA, 2002; pp. 671–720. [Google Scholar]
  46. Castellini, M.; Iovino, M. Pedotransfer functions for estimating soil water retention curve of Sicilian soils. Arch. Agron. Soil Sci. 2019, 65, 1401–1416. [Google Scholar] [CrossRef]
  47. van Genuchten, M.T. A closed-form equation for predicting the hydraulic conductivity of unsaturated soils. Soil Sci. Soc. Am. J. 1980, 44, 892–898. [Google Scholar] [CrossRef] [Green Version]
  48. Wander, M.M.; Bollero, G.A. Soil quality assessment of tillage impacts in Illinois. Soil Sci. Soc. Am. J. 1999, 63, 961–971. [Google Scholar] [CrossRef]
  49. Sharma, K.L.; Mandal, U.K.; Srinivas, K.; Vittal, K.P.R.; Mandal, B.; Grace, J.K.; Ramesh, V. Long-term soil management effects on crop yields and soil quality in a dryland Alfisol. Soil Tillage Res. 2005, 83, 246–259. [Google Scholar] [CrossRef]
  50. Thenkabail, P.S.; Enclona, E.A.; Ashton, M.S.; Van Der Meer, B. Accuracy assessments of hyperspectral waveband performance for vegetation analysis applications. Remote Sens. Environ. 2004, 91, 354–376. [Google Scholar] [CrossRef]
  51. Lachenbruch, P.A. Discriminant Analysis; Hafner Publishing: New York, NY, USA, 1975. [Google Scholar]
  52. Uddin, N. Consumer Credit Customers’ Financial Distress Prediction by Using Two-Group Discriminant Analysis: A Case Study. Int. J. Econ. Financ. 2013, 5, 55–66. [Google Scholar] [CrossRef] [Green Version]
  53. Uddin, N.; Meah, M.S.; Hossain, R. Discriminant Analysis as an Aid to Human Resource Selection and Human Resource Turnover Minimization Decisions. Int. J. Bus. Manag. 2013, 8, 153–169. [Google Scholar] [CrossRef] [Green Version]
  54. SAS/STAT Software; Release 9.3; SAS Institute Inc.: Cary, NC, USA, 2012.
  55. Rosipal, R.; Kramer, N. Overview and Recent Advances in Partial Least Squares. Subspace, Latent Structure and Feature Selection: Statistical and Optimization Perspectives Workshop (SLSFS 2005); Revised Selected Papers (Lecture Notes in Computer Science 3940); Springer: Berlin, Germany, 2006; pp. 34–51. [Google Scholar]
  56. Colombo, C.; Palumbo, G.; Di Iorio, E.; Sellitto, V.M.; Comolli, R.; Stellacci, A.M.; Castrignanò, A. Soil organic carbon variation in Alpine landscape (Northern Italy) as evaluated by diffuse reflectance spectroscopy. Soil Sci. Soc. Am. J. 2014, 78, 794–804. [Google Scholar] [CrossRef]
  57. Andersen, C.M.; Bro, R. Variable selection in regression—A tutorial. J. Chemometr. 2010, 24, 728–737. [Google Scholar] [CrossRef]
  58. Chong, I.G.; Jun, C.H. Performance of some variable selection methods when multicollinearity is present. Chemometr. Intell. Lab. Syst. 2005, 78, 102–112. [Google Scholar] [CrossRef]
  59. Wold, S. PLS for Multivariate Linear Modeling, QSAR: Chemometric Metods in Molecular Design. In Methods and Principles in Medicinal Chemistry; van de Waterbeemd, H., Ed.; Verlag-Chemie: Weinheim, Germany, 1994. [Google Scholar]
  60. Castellini, M.; Stellacci, A.M.; Mastrangelo, M.; Caputo, F.; Manici, L.M. Estimating the Soil Hydraulic Functions of Some Olive Orchards: Soil Management Implications for Water Saving in Soils of Salento Peninsula (Southern Italy). Agronomy 2020, 10, 177. [Google Scholar] [CrossRef] [Green Version]
  61. Castellini, M.; Fornaro, F.; Garofalo, P.; Giglio, L.; Rinaldi, M.; Ventrella, D.; Vitti, C.; Vonella, A.V. Effects of no-tillage and conventional tillage on physical and hydraulic properties of fine textured soils under winter wheat. Water 2019, 11, 484. [Google Scholar] [CrossRef] [Green Version]
  62. Castellini, M.; Giglio, L.; Modugno, F. Sampled soil volume effect on soil physical quality determination: A case study on conventional tillage and no-tillage of the soil under winter wheat. Soil Syst. 2020, 4, 72. [Google Scholar] [CrossRef]
  63. Paustian, K.; Six, J.; Elliott, E.T.; Hunt, H.W. Management options for reducing CO2 emissions from agricultural soils. Biogeochemistry 2000, 48, 147–163. [Google Scholar] [CrossRef]
  64. Diacono, M.; Persiani, A.; Testani, E.; Montemurro, F. Sustainability of agro-ecological practices in organic horticulture: Yield, energy-use and carbon footprint. Agroecol. Sustain. Food Syst. 2020, 44, 726–746. [Google Scholar] [CrossRef]
  65. Laudicina, V.A.; Novara, A.; Gristina, L.; Badalucco, L. Soil carbon dynamics as affected by long-term contrasting cropping systems and tillages under semiarid Mediterranean climate. Appl. Soil Ecol. 2014, 73, 140–147. [Google Scholar] [CrossRef]
  66. Bongiorno, G.; Bünemann, E.K.; Oguejiofor, C.U.; Meier, J.; Gort, G.; Comans, R.; Mäder, P.; Brussaard, L.; de Goede, R. Sensitivity of labile carbon fractions to tillage and organic matter management and their potential as comprehensive soil quality indicators across pedoclimatic conditions in Europe. Ecol. Indic. 2019, 99, 38–50. [Google Scholar] [CrossRef]
  67. López-Fando, C.; Pardo, M.T. Changes in soil chemical characteristics with different tillage practices in a semi-arid environment. Soil Tillage Res. 2009, 104, 278–284. [Google Scholar] [CrossRef]
  68. Martin-Rueda, I.; Muñoz-Guerra, L.M.; Yunta, F.; Esteban, E.; Tenorio, J.L.; Lucena, J.J. Tillage and crop rotation effects on barley yield and soil nutrients on a Calciortidic Haploxeralf. Soil Tillage Res. 2007, 92, 1–9. [Google Scholar] [CrossRef]
  69. Pavinato, P.S.; Dao, T.H.; Rosolem, C.A. Tillage and phosphorus management effects on enzyme-labile bioactive phosphorus availability in Cerrado Oxisols. Geoderma 2010, 156, 207–215. [Google Scholar] [CrossRef]
  70. Balota, E.L.; Kanashiro, M.; Colozzi Filho, A.; Andrade, D.S.; Dick, R.P. Soil enzyme activities under long-term tillage and crop rotation systems in subtropical agro-ecosystems. Braz. J. Microbiol. 2004, 35, 300–306. [Google Scholar] [CrossRef]
  71. Pieri, C.J.M.G. Fertility of Soils: A Future for Farming in the West African Savannah; Springer: Berlin, Germany, 1992. [Google Scholar]
  72. Vilček, J.; Koco, Š. Integrated index of agricultural soil quality in Slovakia. J. Maps 2018, 14, 68–76. [Google Scholar] [CrossRef]
Figure 1. Score plots of the first two principal components extracted in the analysis carried out on the set of chemical (a) and physical (b) soil indicators. MT = minimum tillage; NT = no-tillage.
Applsci 11 05099 g001
Figure 2. Plots of the component loadings (a) and scores (b) of the first two principal components extracted in the analysis carried out on the whole set of soil indicators. Variance explained: PC1 = 41.21%; PC2 = 12.61%. MT = minimum tillage; NT = no-tillage. WEOC = water extractable organic carbon; WEN = water extractable nitrogen; C_biomass = microbial biomass carbon; TOC = total organic carbon; TEC = alkali-extractable carbon; HA_FA = humic and fulvic acid carbon; N = total nitrogen; P_Olsen = Olsen available phosphorus; EC = electrical conductivity; Ca2+, Mg2+, Na+, K+ = exchangeable cations. BD = dry bulk density; PMAC = macroporosity; AC = air capacity; RFC = relative field capacity.
Applsci 11 05099 g002
Figure 3. Variable importance for projection statistics (PLS-VIP) obtained using as response variable in PLSR (a) wheat grain yield, (b) grain protein content and (c) both variables. The horizontal black line indicates the threshold of 0.8 to discriminate and select significant variables according to Wold criterion.
Applsci 11 05099 g003
Figure 4. Plots of the component loadings (a) and scores (b) of the first two principal components extracted in the analysis carried out on the indicators selected from results of PCA, SDA, PLS. Variance explained: PC1 = 70.37%; PC2 = 18.97%. MT = minimum tillage; NT = no-tillage. TOC = total organic carbon; TEC = alkali-extractable carbon; WEN = water extractable nitrogen; P_Olsen = Olsen available phosphorus; PMAC = macroporosity; AC = air capacity; RFC = relative field capacity.
Applsci 11 05099 g004
Table 1. Results of nested analysis of variance carried out on soil chemical and biological parameters.
Source of VariationWEOC
mg kg−1
WEN
mg kg−1
C_biomass
mg kg−1
TOC
g kg−1
TEC
g kg−1
HA_FA
g kg−1
N
g kg−1
P_Olsen
mg kg−1
pHEC
dS m−1
Ca2+
mg kg−1
K+
mg kg−1
Mg2+
mg kg−1
Na+
mg kg−1
Soil management (mean)
Pr(>F)
49.351
0.1732
25.186
0.0273 *
491.03
0.8461
19.66
0.0325 *
12.088
0.0415 *
6.782
0.3280
1.470
0.4441
54.045
0.4609
8.10
0.1674
0.139
0.6251
6880.9
0.9698
1043.89
0.0233 *
215.84
0.1663
29.122
0.1882
No-tillage (NT)70.4410.11 b509.821.87 a13.63 a6.231.5260.728.070.146880.31120.18 a211.6527.87
Minimum tillage (MT)28.2640.26 a472.317.45 b10.54 b7.341.4247.378.140.136881.6967.60 b220.0330.37
* and ** indicate respectively differences at P ≤ 0.05 and P ≤ 0.01. Means followed by different letters are significantly different according to the SNK test (P = 0.05). Pr(> F) indicates the probability value (p-value) to determine whether to reject the null hypothesis. WEOC = water extractable organic carbon; WEN = water extractable nitrogen; C_biomass = microbial biomass carbon; TOC = total organic carbon; TEC = alkali-extractable carbon; HA_FA = humic and fulvic acid carbon; N = total nitrogen; P_Olsen = Olsen available phosphorus; EC = electrical conductivity; Ca2+, Mg2+, Na+, K+ = exchangeable cations. (n = 24).
Table 2. Results of nested analysis of variance carried out on soil physical and hydrological parameters.
Source of VariationBD
g cm−3
PMAC
cm3 cm−3
AC
cm3 cm−3
RFC
-
Clay
g 100 g−1
Sand
g 100 g−1
Soil management (mean)0.967290.033290.084730.815148.1511.03
Pr(>F)0.0316 *0.09920.0370 *0.0302 *0.18540.5042
No-tillage (NT)1.04516 a0.008900.04112 b0.90814 a45.4411.41
Minimum tillage (MT)0.90240 b0.053620.12107 a0.73764 b50.8510.65
* and ** indicate, respectively, differences at P ≤ 0.05 and P ≤ 0.01. Means followed by different letters are significantly different according to the SNK test (P = 0.05). Pr(> F) indicates the probability value (p-value) to determine whether to reject the null hypothesis. BD = dry bulk density; PMAC = macroporosity; AC = air capacity; RFC = relative field capacity. (n = 22 for BD, PMAC, AC, RFC. n = 24 for clay and sand).
Table 3. Eigenvalues and variance explained by the first five principal components (PCs) of the analysis carried out on the set of (a) chemical and biological indicators (14 variables) and (b) physical indicators (6 variables).
(a) Eigenvalues of the Correlation Matrix: Total
=14 Average = 1
(b) Eigenvalues of the Correlation Matrix: Total
=6 Average = 1
EigenvalueDifferenceProportionCumulative EigenvalueDifferenceProportionCumulative
15.10002.69320.36430.364313.78852.76980.63140.6314
22.40680.79110.17190.536221.01870.10540.16980.8012
31.61580.42370.11540.651630.91330.67570.15220.9534
41.19210.26440.08510.736840.23760.19710.03960.993
50.92780.21230.06630.80350.04040.03890.00670.9998
……….
Table 4. Eigenvalues and variance explained by the first five principal components (PCs) of the analysis carried out on the whole dataset of soil indicators (20 variables).
Eigenvalues of the Correlation Matrix: Total
=20 Average = 1
EigenvalueDifferenceProportionCumulative
18.24245.72110.41210.4121
22.52130.39110.12610.5382
32.13020.51530.10650.6447
41.61490.40590.08070.7254
51.20890.28210.06040.7859
Table 5. Variable loadings of the first four components in the analysis carried out on the whole dataset. Values are multiplied by 100 and rounded to the nearest integer. Variance explained: PC1 = 41.21%; PC2 = 12.61%; PC3 = 10.65%; PC4 = 8.07%.
Factor1 Factor2 Factor3 Factor4
WEOC54*−22 44*5
WEN−77*4 −11 6
C_biomass32 53*21 53*
TOC91*−29 12 2
TEC93*−27 6 15
HA_FA−36*−59*7 40*
N36*7 34 60*
P_Olsen33 −63*−21 26
pH−70*52*−14 −3
EC50*43*13 42*
Ca2+2 2 79*−23
K+82*−8 −36*26
Mg2+−46*−9 57*18
Na+−52*41*43*12
BD83*37*12 −12
PMAC−84*−34*16 18
AC−91*−26 8 21
RFC92*27 −6 −18
clay−43*45*−10 12
sand23 −21 58*−49*
* indicates the significance of the variable loadings. The sign of variable loadings indicates the positive or negative correlation between the variables and the principal component. WEOC = water extractable organic carbon; WEN = water extractable nitrogen; C_biomass = microbial biomass carbon; TOC = total organic carbon; TEC = alkali-extractable carbon; HA_FA = humic and fulvic acid carbon; N = total nitrogen; P_Olsen = Olsen available phosphorus; EC = electrical conductivity; Ca2+, Mg2+, Na+, K+ = exchangeable cations. BD = dry bulk density; PMAC = macroporosity; AC = air capacity; RFC = relative field capacity.
Table 6. Summary selection of STEPDISC procedure carried out on the whole dataset of chemical, physical and biological indicators.
StepNumberEnteredRemovedPartialF ValuePr > FWilks’Pr <AveragePr >
In R-Square LambdaLambdaSquaredASCC
Can Corr
11TOC 0.829797.46<0.00010.17026571<0.00010.82973429<0.0001
22RFC 0.563124.49<0.00010.07439379<0.00010.92560621<0.0001
33WEOC 0.394111.710.0030.0450772<0.00010.9549228<0.0001
Publisher’s Note: MDPI stays neutral with regard to jurisdictional claims in published maps and institutional affiliations.

