Article

Shallow vs. Deep Subsurface Structures of Central Luconia Province, Offshore Malaysia Reveal by Aeromagnetic, Airborne Gravity and Seismic Data

by
Siti Nur Fathiyah Jamaludin
1,*,
Manuel Pubellier
2 and
Benjamin Sautter
3
1
South East Asia Carbonate Research Laboratory (SEACaRL), Institute of Hydrocarbon Recovery, Universiti Teknologi PETRONAS, Seri Iskandar 32610, Malaysia
2
Laboratoire de Géologie, Ecole Normale Superieure, PSL Research University, CNRS UMR 8538, 75005 Paris, France
3
Commission for the Geological Map of the World (CMGW), 77 rue Claude-Bernard, 75005 Paris, France
*
Author to whom correspondence should be addressed.
Appl. Sci. 2021, 11(11), 5095; https://doi.org/10.3390/app11115095
Submission received: 7 April 2021 / Revised: 5 May 2021 / Accepted: 6 May 2021 / Published: 31 May 2021
(This article belongs to the Special Issue Evaluation of the Crustal Structure)

Abstract

:

Featured Application

Utilization of Air-FTG and aeromagnetic data in delineating subsurface structures with the aim to correlate with the tectonic evolution in offshore Sarawak, Malaysia.

Abstract

Across the Luconia continental shelf, the nature and structures of the crust are lacking geological understanding and precise characterization. Newly acquired, aeromagnetic, and airborne gravity data were used to assess deep and shallow sub-surface signals within the Central Luconia Province, off the coast of Sarawak, offshore Malaysia. Regional aeromagnetic anomalies appear to primarily reflect deep crustal features while depth (Z) tensors of airborne gravity anomalies evidence shallow subsurface structures. Strike directions of the interpreted structural trend on aeromagnetic and airborne gravity anomalies maps are measured and plotted into rose diagrams to distinguish the structural orientations for all datasets. Signature patterns extracted from the depth profiles were correlated with parallel seismic lines and nearest exploration wells and coincide well with the top of carbonate for Cycle IV/V and structures seen within the Cycle I and II sediments. The orientation of faults/lineaments at shallower depth is dominated by a NW-SE orientation, similar with the faults extracted from two recently published structural maps. Deeper subsurface sections yielded E-W to NWW-SEE dominant directions which were never presented in the published literature. The E-W oriented anomalies are postulated to represent the remnants of the accretion between the Luconia crustal block and southern boundary of the Palawan block. The NW-SE trend follows the same direction as prominent faults in the region. The insight into shallow and deep subsurface structures in Central Luconia Province imaged through airborne gravity and aeromagnetic data should provide guidelines and complementary information for regional structural studies for this area, particularly in combination with detailed seismic interpretation. Further evaluation on the response of Air-FTG® gravity and aeromagnetic could lead to the zonation of potential basement highs and hydrocarbon prospects in this area.

Graphical Abstract

1. Introduction

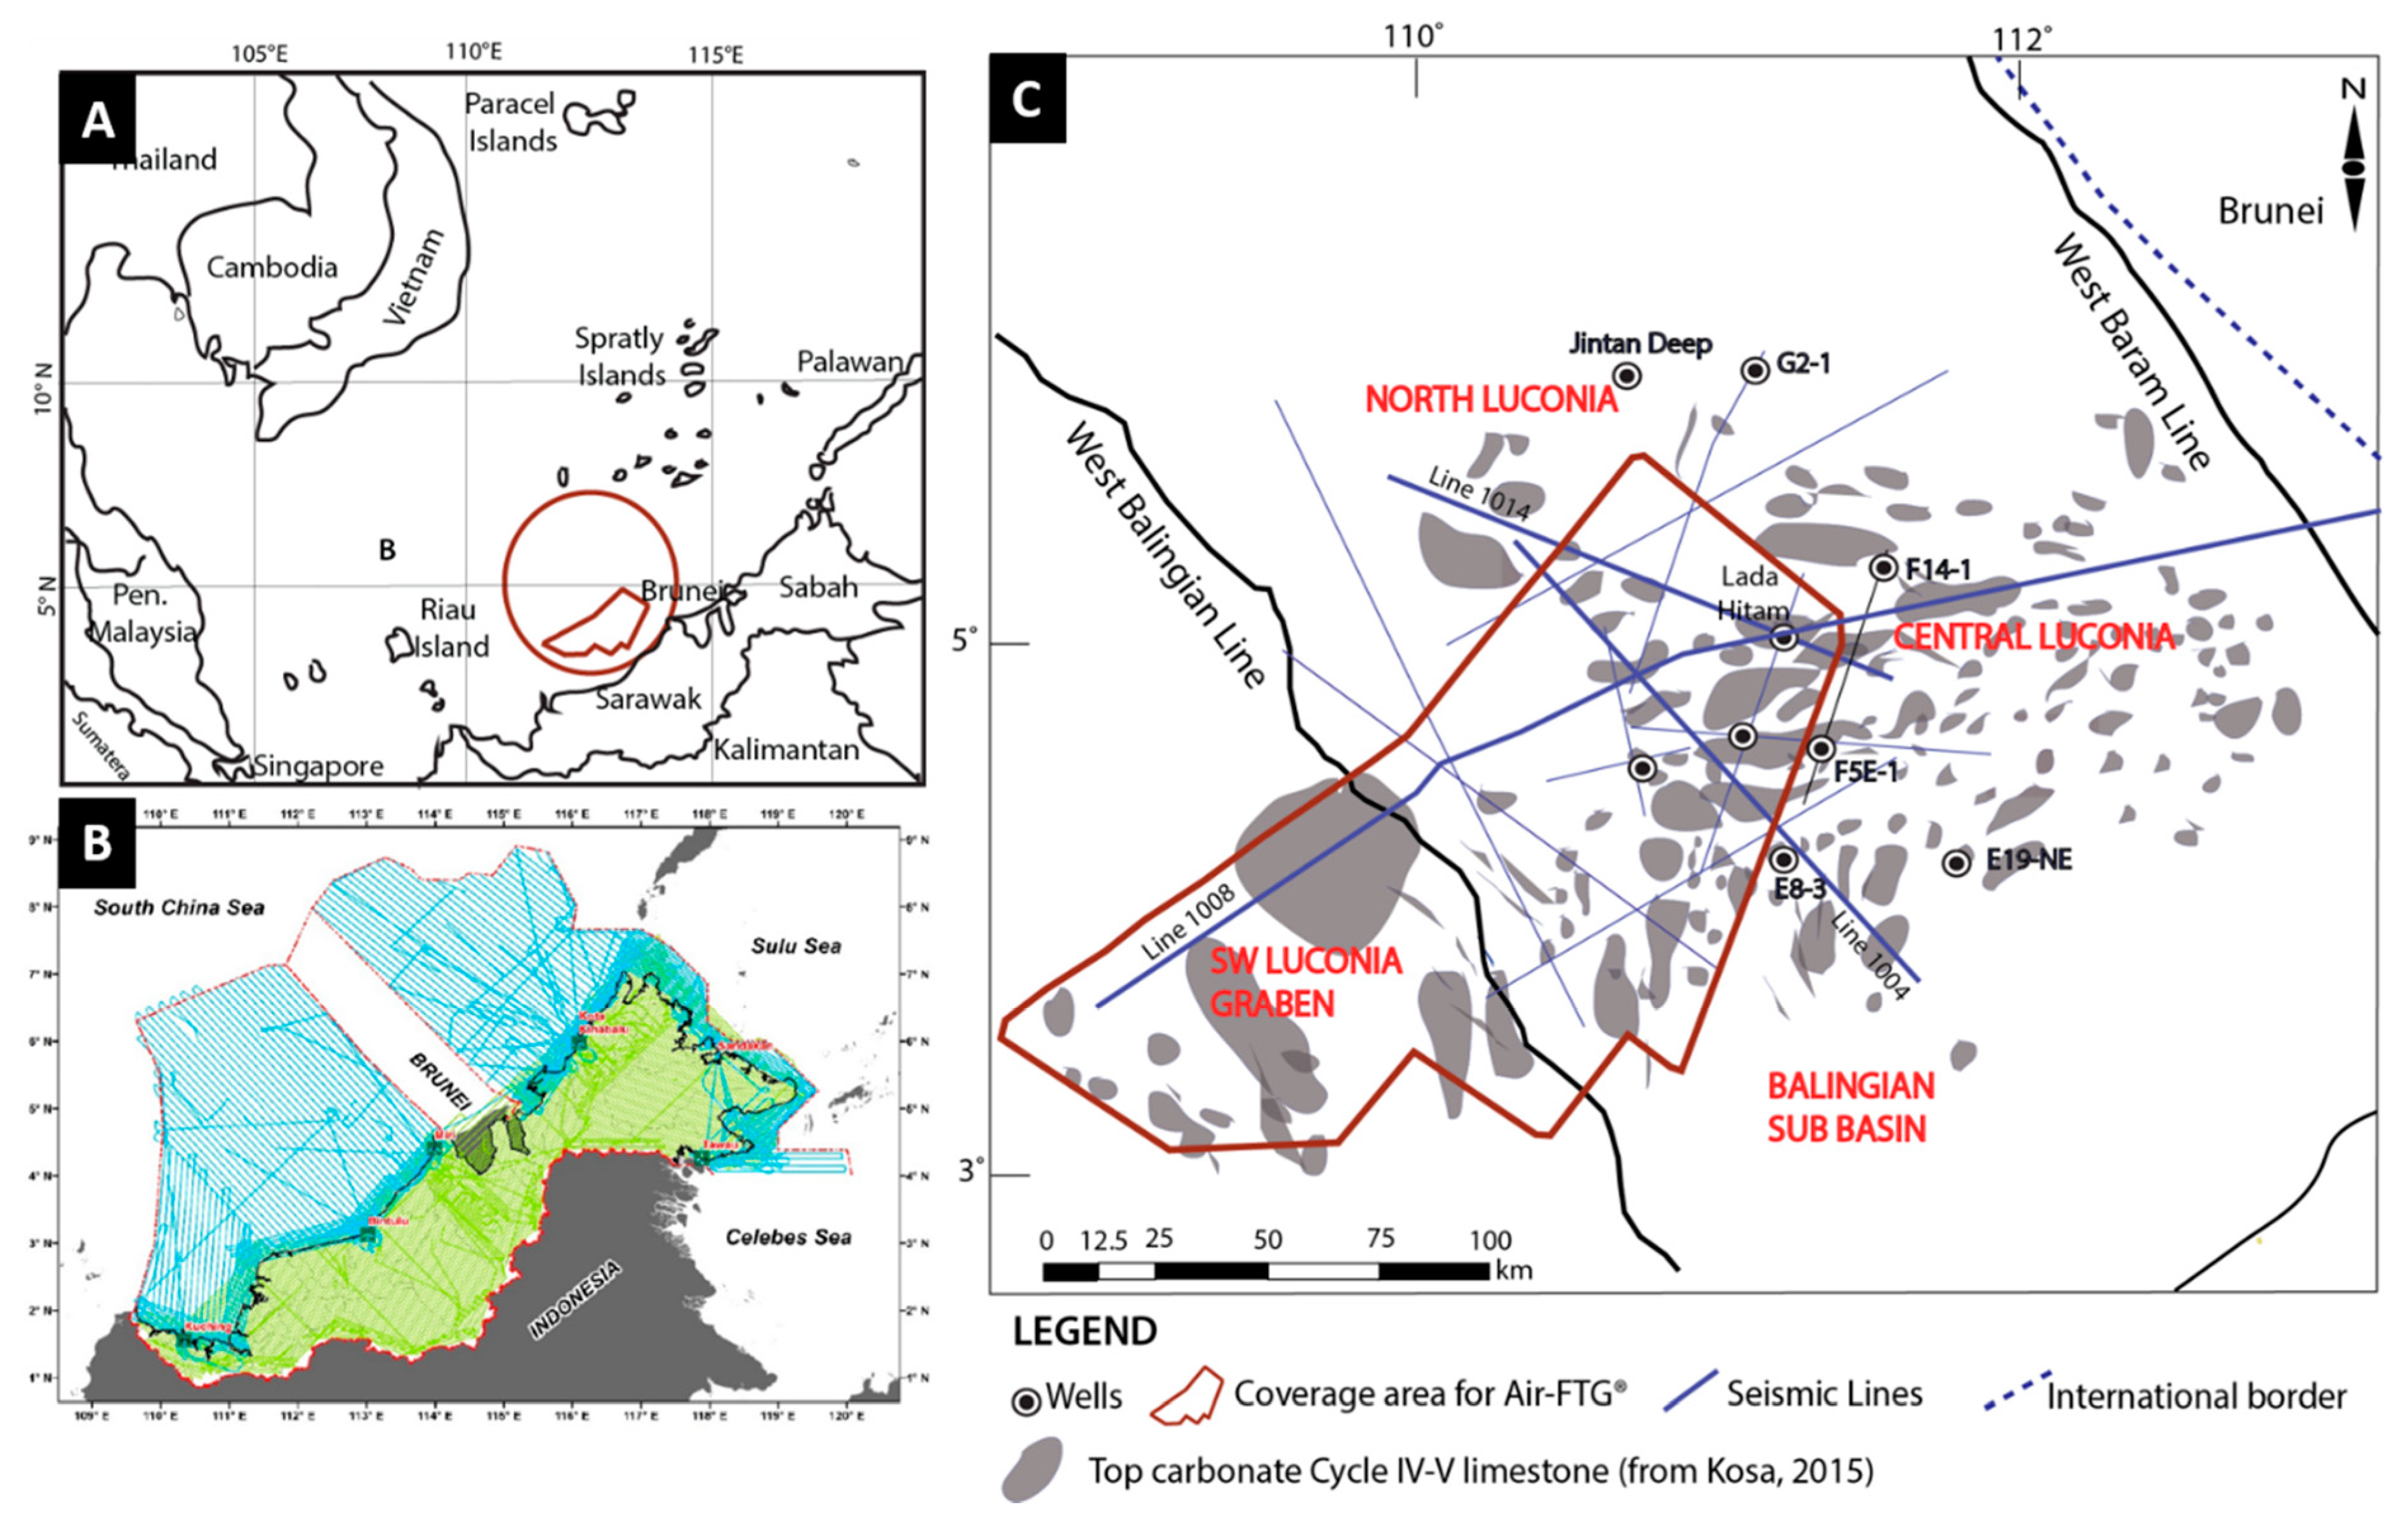
The Central Luconia Province encompasses a geological province famous for its prolific hydrocarbon exploration, located in the offshore of North Sarawak, Malaysia (Figure 1) within vicinity of the South China Sea. Central Luconia is dominated by Middle to Upper Miocene limestone reservoirs with varying thickness from several hundreds of meters to over one kilometer in places at depths ranging from 750 to 2500 m from present day sea level [1]. The orientation of the build-ups is not consistent throughout the province [2] (Figure 1C). This region is subdivided into numbers of regional lows and highs that are partitioned into localized extensional horsts and grabens trending systematically in SSW- NNE and WSW-ENE compressional structures [3]. In the southern part, the majority of the carbonate build-ups are oriented in NNE-SSW and turning to NE-SW at the transition from the southern region to the central region. The orientation of platforms in the central part is mostly in E-W direction, while the platforms in the northern part are oriented in NW-SE, with a few in NE-SW directions. The inconsistency in the limestone build-ups orientation is pre-evaluated to reflect the basement topography and structure underneath the sedimentary deposition.
The Luconia Block (crystalline basement of Central Luconia and its surrounding provinces) that host this sedimentary basin had underwent a prolong tectonic history, but the precise chronology of events or location of the main structural features remains uncertain. [4,5] suggested the suturing of Luconia-Dangerous Grounds Block/Microcontinent with South East Asia had resulted in the cessation of palaeo-Pacific subduction in Late Cretaceous. Meanwhile, [6] proposed the deformation to be resulted by the Late Cretaceous or Paleocene collision of Luconia and Sundaland, which brings palaeo-Pacific subduction east to the Mesozoic granite (basement) to a rest. However, the role of Luconia -Dangerous Grounds block in the palaeo-Pacific subduction was brought to less attention when [7,8,9] suggested that the palaeo-Pacific subduction zone retreated from South East Asia during Cretaceous as response to slab rollback, back-arc rifting and eventual Proto-South China Sea seafloor spreading. Luconia continental shelf has been envisaged as a large Cathaysia-derived continental fragment that presently occupies much of the southern margin of the South China Sea [10]. It could be drifted from the southern China Mainland, rifted, and finally collided with Sarawak mainland [10,11,12].
As such, the subsurface structure for Luconia and the surrounding provinces remain conjectural. Several geophysical studies have been conducted to interpret the shallow and deep subsurface structure and geometry of the sediments’ deposition in this area, focusing on the interpretation of seismic data [1,3,13,14,15,16,17,18,19,20,21], gravity, and magnetic data [2,22,23]. A study by [1] exposed the potential depth for the basement in Central Luconia (offshore Sarawak) to be shallower than initially perceived. The depth to the top of basement along a E-W seismic transect (location has not been revealed) was interpreted at 10,000 km to 12,000 km but free air-gravity-magnetic modelling reveal potential depth of the top basement at 5500 km to 10,500 km.
Wide wavelength ranges of gravity and magnetic data provide critical clues to both deep and shallow structural framework. This paper aims to evaluate the framework and orientations of major structural trends in Central Luconia Province. The focus of this paper is to differentiate the trends in the shallow vs. the deep subsurface and relate them to the tectonic evolution of the Luconia continental shelf.

2. Geological Setting of Central Luconia

The Central Luconia Province is bounded by two main tectonic features in this region, which are the West Baram Line in the east and West Balingian line in the west. These ancient faults are oriented in the NW-SE direction (Figure 1) and the West Baram Line is believed to represent the southern limit of the subduction of the oceanic crust of the Proto-South China Sea [24,25]. The continental shelf of Luconia-Dangerous Grounds was under thrusted beneath West Borneo [11,21,26,27] and this event induced the uplifting of the older sediments (the deep-water sediments of Rajang Group) during Eocene-Cretaceous. Shortly after that, topography denudation took place during the post-orogenic relaxation phase [2]. This was followed by crustal stretching due to the second rifting phase of the South China Sea in the Oligocene mainly within the northern Luconia [28], while the southern of Luconia underwent crustal shortening. This region was later compressed attributed to the regional subsidence during Upper Miocene and series of uplift during Pliocene [29].
The offshore Sarawak is dominated by thick sedimentary sequence comprises of clastic and carbonate rocks. The rocks are calibrated with seismic signals to correlate with seismic facies (Figure 2). Cycle I is the oldest, dating back to ~34 Ma until approximately 23.5 Ma followed by Cycle II sedimentation during Lower Miocene (23.5 Ma to 18.0 Ma). Cycle I and II sediments are comprised of deep marine sediments especially at the base of the cycles, followed by non-marine to coastal plain sediments with shallowing upwards sequence.
In the southern section of Central Luconia, patches of limestone growth within Cycle I and II are also common [2]. More marine influence in the sediments is recognized at the beginning of Upper Lower Miocene within Cycle III rocks. At this time, many limestone build-ups begin to grow in the central section of Luconia Province, however, the growth of limestone become more abundant during deposition of Cycle IV and V continues until approximately 8 Ma, before a major event overseeing the demise of Luconia limestone took place. After that, the sedimentations in offshore Sarawak including Central Luconia Province are predominated by siliciclastics sediments due to rapid uplift on the onshore Borneo [30]. The sedimentation of siliciclastic sediments from 8 Ma until the present day is grouped as Cycle VI to VIII.
Several prominent unconformities (Figure 2) are recognized in offshore Sarawak including the Central Luconia Province. The base of Cycle I and the underlying sediments (classified as Pre-Cycle I sediments in this paper) is known as Base Oligocene Unconformity (BOU) which marks the transition from isolated blocks of elevated grabens in the Eocene to a more widespread sedimentation in the Oligocene [29] resulted from the collision of Luconia continental block with Borneo mainland. Base Miocene Unconformity (BMU) differentiate the sediments deposited in Cycle I and Cycle II. BMU marks the changing in direction of the South China Sea spreading and the effect of change in the direction is reflected in the facies changes as observed within the offshore Sarawak [2]. Another profound unconformity in Central Luconia and all other basins in the southern South China Sea is Middle Miocene Unconformity (MMU). In Central Luconia context, MMU splits Cycle III and Cycle IV sediments, marking the beginning of widespread limestone deposition in Luconia. Finally, the youngest recognized regional unconformity in Central Luconia is Shallow Regional Unconformity (SRU) or has been recently renamed as Lapan Unconformity in [31] representing a rapid uplift all over Borneo.

3. Advancement of Gravity and Aeromagnetic Exploration in Offshore Sarawak, Malaysia

Gravity and magnetic surveys have been used in the exploration of natural resources in Malaysia since the 1930s [32] as tools to map sedimentary basins and develop a structural framework around them. The gravity methods have evolved with a variety of acquisitions and processing approaches to produce good quality and high-resolution subsurface images based on anomalies originating from rock density contrasts. The advent of public-domain global marine gravity database (free-air satellite gravity) with uniform coverage and measurement quality [33,34,35] allowed for the consistent mapping of regional-scale structural features over a large spatial extent [36]. Circumspection is required when interpreting gravity data from both free-air satellite and airborne gravity because both data are less reliable in water depths shallower than 20 m, mainly due to a higher variability of the sea surface, poor near-shore tidal models, and a loss of altimeter tracking caused by the interference with the onshore reflectors [37].
The government of Malaysia, under partnership between the Department of Survey and Mapping Malaysia (DSMM) and Kort & Matrikelstyrensen (KMS) from Denmark under the MyGeoid Project has carried out airborne gravity surveys over land areas of Peninsular and East Malaysia in 2002–2003 [38]. The survey was repeated in 2014–2017 for the offshore Sabah and Sarawak [39] (Figure 1B). The aim of the 2014–2017 survey was to develop a new-geoid-based vertical datum from airborne gravity data for area of out-coast of East Malaysia region. This survey marks a remarkable first attempt for the Malaysian government in attaining a systematic high-accuracy wide geoid model at nationwide scale. Through this program, the accuracy of the gravimeter geoid is estimated to be better than 5 cm across most of East Malaysia land and marine areas [40]. Although the airborne gravity database from the MyGeoid Project remains confidential, Free-air and Bouguer anomalies maps were extracted from the airborne data as final plots. The downward continuation data was part of the geoid determination output, processed from filtered airborne gravity data (Figure 1B). Collaboration project between DSMM and KMS produced an airborne gravity field that revealed many interesting regional geological features on land as well as in the marine area of Malaysia-Borneo [40].
In 2014, the Airborne Full Tensor Gradiometry (FTG) Gravity or Air-FTG® approach was successfully acquired in the vicinity of Central Luconia-Tatau Province (Figure 1C) in Sarawak by Bell Geospace Limited (BGL) with a terrain elevation covering 174 m below sea level to 24 m above sea level [41]. The penetration of airborne gravity and aeromagnetic in the subsurface is limited within shallow water depth (<2000 m), thus, the coverage of Air-FTG® in offshore Sarawak is restricted to the Central Luconia Province. The survey area (Figure 1C) covers a total of 14,330 line-kilometers with 2000 m and 1000 m inline-spacing and 10,000 m and 5000 m tie-lines spacing. The usage of airborne Air- FTG® within this limestone province is highly suitable because of the density contrasts between carbonates, siliciclastic (shale, claystone, and sandstone) and the crystalline basement underlying the basin. Therefore, the utilization of free-air satellite gravity and magnetic data along with advanced Air-FTG® gravity and aeromagnetic data is crucial in analyzing the basement structures’ geometries and relate them to the regional framework.

4. Materials and Method

4.1. Dataset

This study integrates various datasets from the Central Luconia Province such as airborne gravity, aeromagnetic, two dimensional seismic profiles, and wireline logs. The focus of interpretation and validation is restricted to the vintage airborne gravity data coverage in Central-West Luconia (Figure 1C). The airborne gravity and aeromagnetic data over Central Luconia Province were previously processed by Bell Geospace Limited with a series of techniques to obtain the final measured gravity gradient used for interpretation in this study. The raw data were acquired through survey equipment that is permanently mounted on Basler turbo BT-67 aircraft (C-FTGI) owned by Bell Geospace. The survey was recorded with geographical coordinates in the WGS84 datum and Universal Transverse Mercator (UTM) projection zone 49N.

4.1.1. Airborne Gravity Data

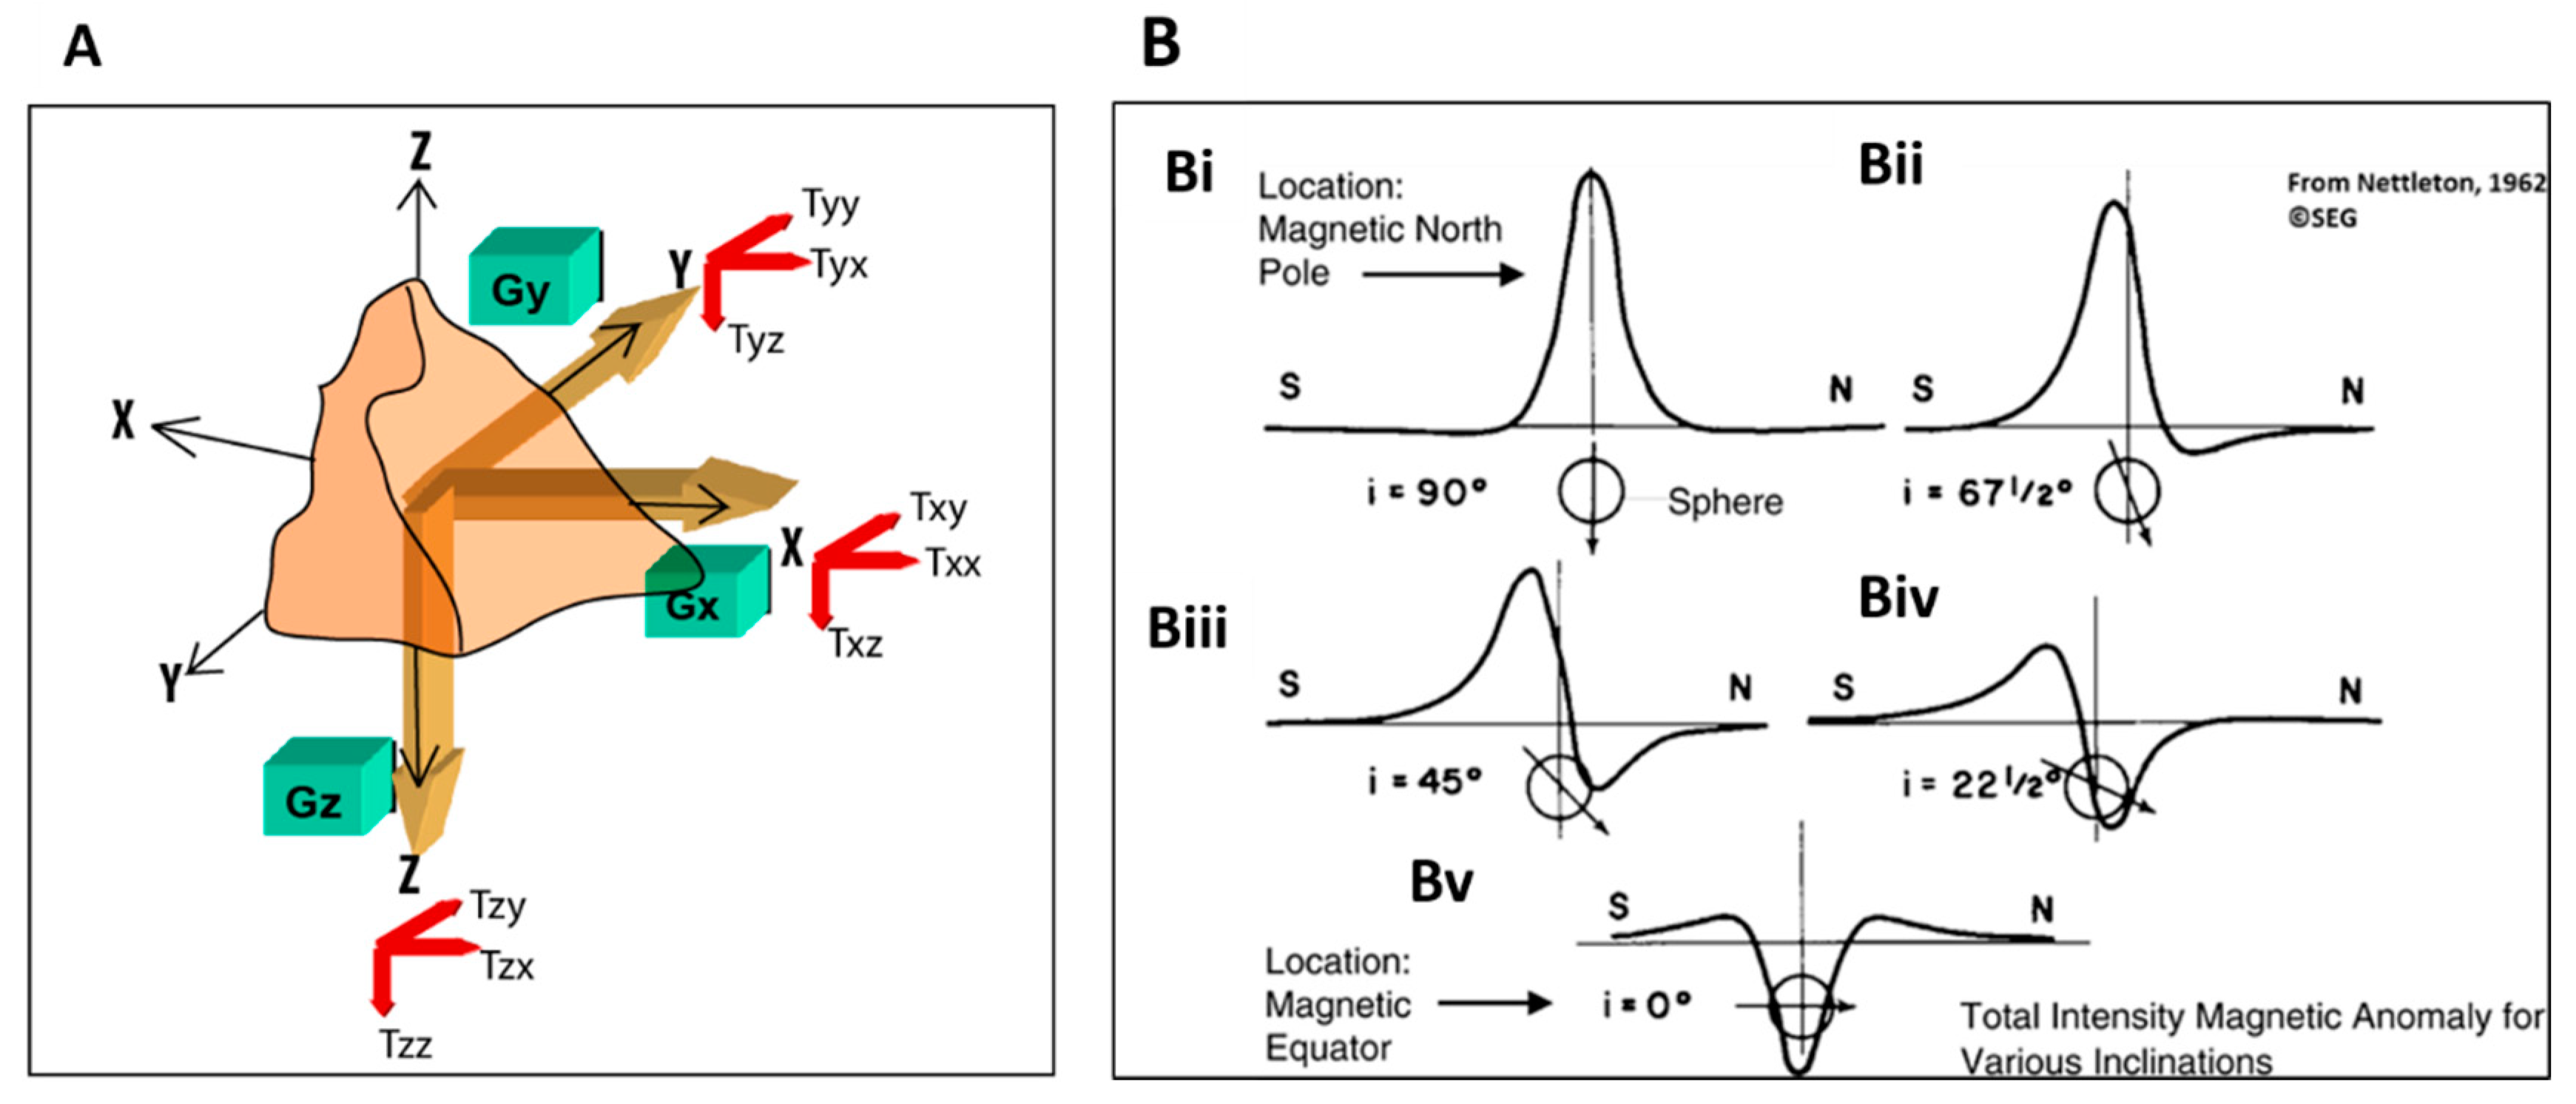
Air-FTG® is a multiple accelerometer moving platform technology that measures the accelerations in the inline and cross signals from the three Gravity Gradient Instruments (GGI) which are converted to directional gradients and provides tensor elements of Tyx, Tyy, Tyz, Txz, and Tzz tensor components [42], along with another four combination tensors (Figure 3A). The different tensor components in Air-FTG® are commonly used to recognize and classify different lineaments associated with structural and/or stratigraphic changes, based on contrasting frequency slicing, that represent different scale and target depth of the geological structures. the combinations of the individual tensor components into a single interpretation and representation had been proven to extract the most accurate signature pattern of the underlying geology [43].
Central Luconia Air-FTG® data went through High-Rate Post Mission compensation, line correction and levelling, noise reduction and contact lineament processed. Depth (Z) domain tensors including Tz, Tzz, Txz and Tyz dataset (Table 1) were selected for geological analyses and interpretation because they represent the depth in vertical and horizontal components. The vertical depth components (Tz and Tzz) closely resemble the conventional gravity in that the anomaly is shown in the correct spatial position over center of geologic mass. Both Tz and Tzz vertical component is useful in estimating depth, predict compositional information of the target geobody [43] and detection of useful contrast within structures [44]. The horizontal depth components (Txz and Tyz) are selected because both data are relevant to identify, and map trends associated with structural and determination of center of mass bodies [45]. Apart from these two data, Contact Lineament Processing (CLP) at three different wavelengths was also utilized for the gravity interpretation. CLP is a method that applies a directional filter in processing the full-tensor gradiometer data. It is a new processing tool for potential field data developed in-house by Bell Geospace [41] that helps assessing the relationship between different representations of an invariant tensor field evaluated from the measured gravity tensor.

4.1.2. Aeromagnetic Data

Aeromagnetic data over the survey area was also captured alongside Air-FTG® and the data is utilized to screen FTG anomaly patterns and quickly detect igneous, volcanic or metamorphic source from the responses in the subsurface. Magnetic data usually helps to image the main aspects of the geology across much of the Earth’s crust (including the surface) and provide a cornerstone for geological model’s construction [46]. An important caution over application of magnetic data is the strength of the Earth’s magnetic field varies across the globe, with strongest at the poles and weakest in the equatorial regions (Figure 3B).
A DAARC500 magnetometer system comprises the airborne magnetometer and a base station were mounted in a boom (stinger) of the Basler turbo BT-67 aircraft and collects compensation parameters while flying a figure of merit (FOM). Aeromagnetic data were recorded at the same time of the airborne gravity data at 10 Hz. Since the study area is close to the equator, the magnetic field lines are roughly parallel to the Earth’s surface, thus the Geometrics 882 caesium vapor sensor is only sensitive in some headings [41]. The aeromagnetic data then underwent (i) Removal of Earth’s regional magnetic field, (ii) Removal of magnetic diurnal drift, (iii) Final line levelling, and finally (iv) De-meaning [41].
The magnetic response from the Air-FTG® was analyzed based on the Total Magnetic Intensity (TMI) that had been Reduced to Equator (RTE) (Table 1) to eliminate the magnetic effect of the latitude. The TMI_RTE data must be interpreted with caution because the magnetic body will be stretched in east-west direction relative to the horizontal dimension of the body [47]. Ideally, both Reduction to Pole (RTP) and Reduction to Equator (RTE) should be interpreted together in area of low latitude. However, RTP data is not available for this survey and thus, the interpretation is supported by TMI_RTE that has been filtered with the first vertical derivative (1vd) high-pass filter (TMI_RTE_1vd) to provide a more reliable outcome that is readily interpretable in the context of magnetic rock bodies [46]. The first derivative filtering is effective in enhancing the anomaly due to shallow sources by improving the spatial and structural resolution. On the first vertical derivative, the width of magnetic bodies appears narrower, thus it is very effective to locate the source bodies accurately. Any structures’ appearance on the first vertical derivative of the aeromagnetic data was interpreted and compared with the structures seen on the TMI_RTE data to delineate high frequency features where they are shadowed by large amplitude, low frequency anomalies.
The local amplitude of the TMI_RTE data was further analyzed for residual and regional field Analytical Signal (AS). Analytical signal of TMI_RTE (Table 1) data helps in reducing the sensitivity for the inclination of the geomagnetic field than the original TMI data and thus, provides means to analyze low latitude magnetic fields [47] such that in Central Luconia Province. Analytical signal maps capture the response of all magnetic bodies whether they are reversely magnetized or not. All the shape preserved on analytical signal maps is centered to one positive body and are not subject to the instability that occurs in transformations of magnetic fields from low magnetic latitude, thus able to define source positions regardless of any remnant magnetizations in sources [48]. In this paper, we analyzed and interpret residual and regional field AS at wavelength more and less than 20 km and 50 km. Regional AS data represents deep seated magnetic bodies, with high contrast in amplitude and frequency while residual AS data shows the sudden changes in magnetic relief that accompanies shallow seated geological bodies [49].

4.1.3. 2D Seismic Profiles & Exploration Wells

Two-dimensional seismic profiles and exploration wells intercepting the survey area for the Air-FTG® were used to support and validate the interpretation. In this paper, line 1008, 1004, and 1014 and wells Lada Hitam-1, F6-6 and F19-1 (Figure 1C) are presented along with the depth profiles extracted from the Air-FTG®. The seismic profiles were acquired by several companies including Schlumberger and Shell in the late 1980s to 1990s and have been reprocessed between 2010 and 2012 with standard routine processing that involved noise removal, multiples removal, and Kirchoff Pre-stack Depth Migration (PSTM). The seismic data are interpreted in two-way-time (twt) domain with calibration of F6-6 and Lada Hitam-1 wells to control the time-depth relation. Line 1008, 1004 and 1014 acquired subsurface data up to 8000 to 10,000 ms while total depth of F6-6 and Lada Hitam -1 wells are 3353 m and 3661 m, respectively, reaching Cycle II sediments.

4.2. Interpretation of the Aeromagnetic and Airborne Gravity

The airborne gravity and aeromagnetic data are interpreted in this study with the aim to delineate the structural trends (fault/lineaments) at different depths range (Figure 4). The interpretation for both airborne gravity and aeromagnetic data are calibrated with the seismic profiles and wells that intercept the area (Figure 1C). All selected datasets (Table 1) were filtered with continuity and apparent susceptibility filters. Anomalies maps are then smoothed through kriging technique to reduce the irregularities and craggy look on the maps. These were performed in Geosoft Oasis Montaj Software.
The interpretation begins with detecting the magnetic anomalies and marking the structural trends on magnetic anomalies maps, which include the TMI_RTE, TMI_RTE_1vd, and RTE_AS_20res/50res/20reg/50reg. The geometry of the magnetic bodies was observed and recorded. Potential changes in the magnetic anomalies in the maps were marked with straight to curvy lines, following the shapes of the magnetic bodies. Similar procedures were performed on the gravity data which include the Tz, Tzz, Txz, Tyz and CLP data (CLP_short/intermediate/long wavelengths). The interpreted structural lines (lineaments) on all magnetic and gravity maps were then compared through overlay and side-to-side comparison to get the general trends from the data.
All measured strikes directions were recorded and plotted in separate rose diagrams (GeoRose by [50] to illustrate the structural trends from each anomaly map. Strikers measured on aeromagnetic data and Z-tensors were compared with the existing structural maps available for Central Luconia by [51,52].

4.3. Depth Profiles Estimation & Calibration with Seismic-Well

The next step involves the extraction of depth profiles through Adaptive Tilt Derivative (ATD) method that allows simple means to identify the locations and strike of the location of structural contact [53]. Each depth map represents an estimate of the depth to the anomalous signature pattern present in the corresponding wavelength slices. Through depth estimation technique, depth profiles of X-X’ and Y-Y’ are used to assess the variation in density across the area which may represent a large geometry in the subsurface. The signature patterns derived from the depth estimation are correlated with parallel seismic lines.
This part involves validating the interpretation of airborne gravity-aeromagnetic data with seismic-gravity-well constraint. The interpreted gravity data are tied with seismic cross-sections and available wells to analyze the geological structures, morphology, and the porosity-density response corresponding to the gravity anomalies. The vintage Air-FTG® data over Central Luconia Province intercept with wells Lada Hitam-1, F6-6 and F19-1 and few seismic lines (Figure 1C). This is done first by extracting the density and porosity values from the sonic logs followed by a comparison with the density response from the Air-FTG® data. Carbonate reservoir are usually porous rocks; hence, their density is slightly lower than the other lithologies and the density contrast and depth is favorable for direct detection with airborne gravity.
Finally, we compared an overlying of airborne gravity and aeromagnetic data, where similarity and contrast of the gravity and magnetic responses were analyzed. The interpreted structural trends on Tz, Tzz, Txz, and Tyz gravity were further compared with interpreted structural trends on aeromagnetic data of TMI_RTE, TMI_RTE_1vd, and TMI_RTE_AS data. The purpose of the comparisons between interpreted structural trends on gravity and magnetic data is to examine the structural patterns preserved in both datasets at different depths ranges; either there is an over print of patterns or obvious changes in the structural trends seen on both datasets. From the comparison, potential uplifted basement structures and outstanding basement morphology in Central Luconia are illustrated. Areas for potential new hydrocarbon prospects are proposed through superimposing with the Middle-Upper Miocene (Cycle IV-V) top carbonate map by [1] and the gravity-magnetic responses.

5. Results

5.1. Aeromagnetic & Airborne Gravity Interpretation

5.1.1. Aeromagnetic Interpretation

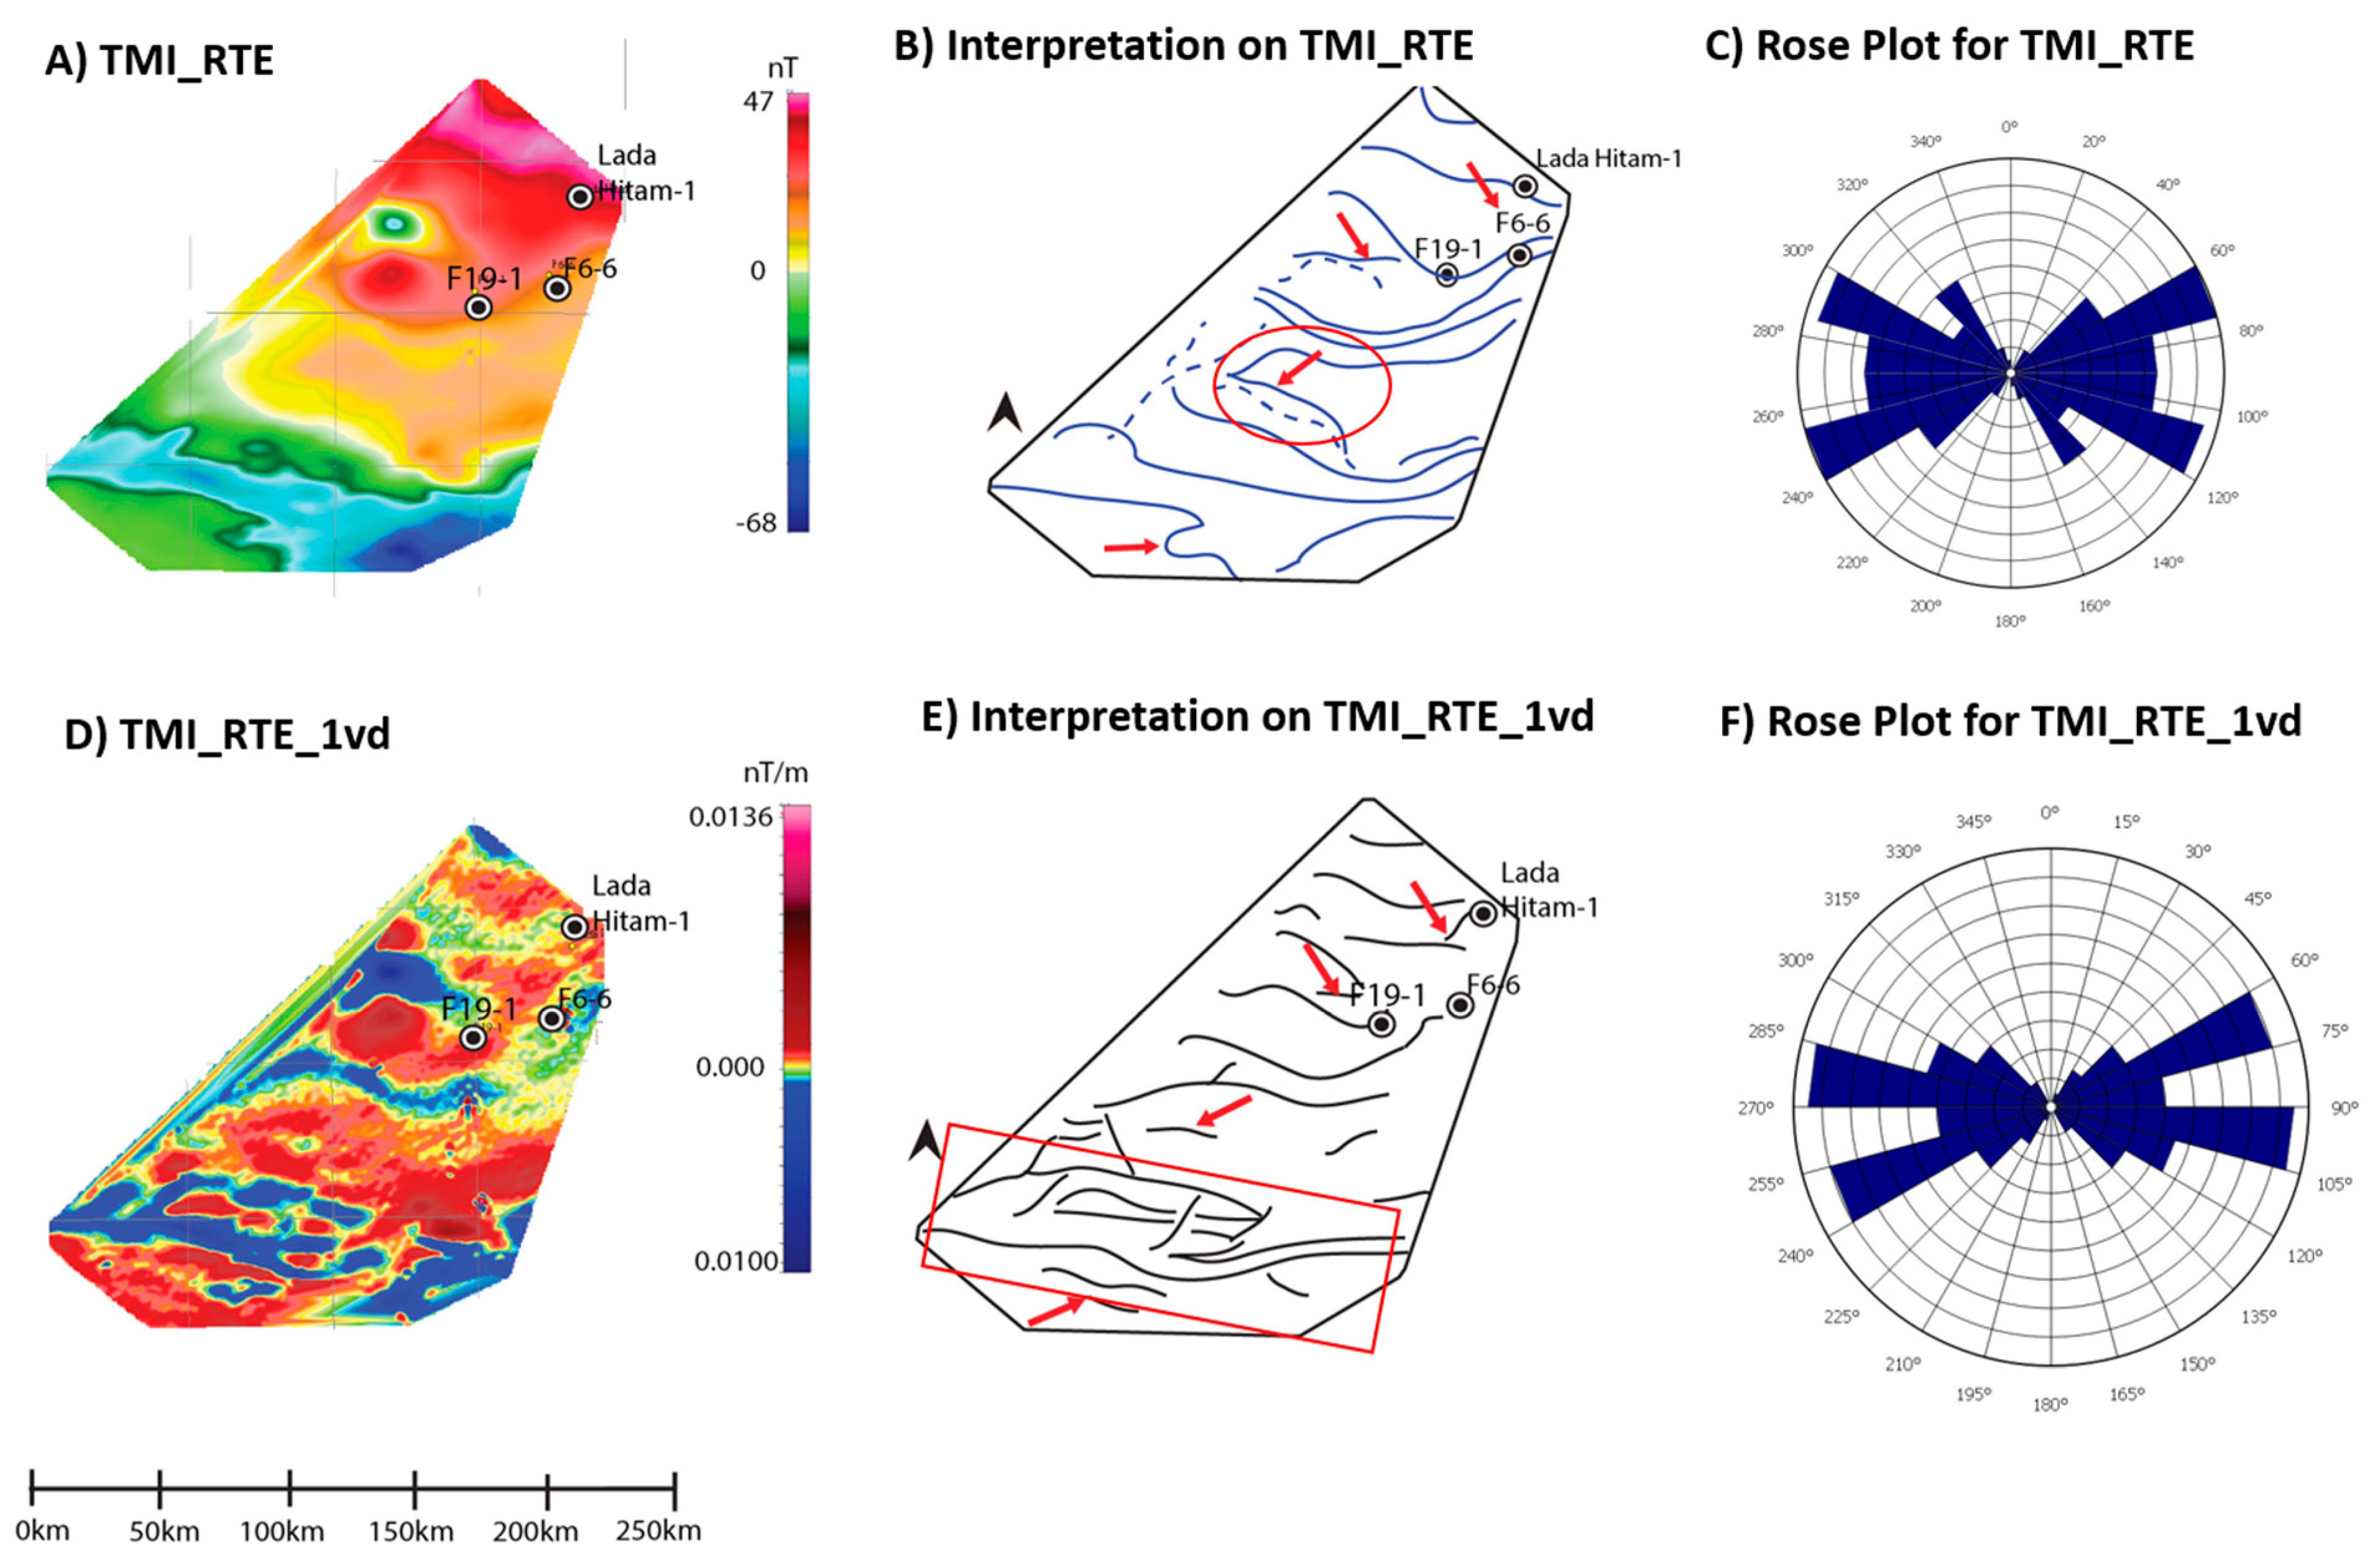
The interpretation of aeromagnetic data primarily reflects long wavelength (deep) geophysical features in the subsurface. High magnetic anomalies (>20 nT) from TMI_RTE fall in the northern-central section of the survey area while moderate magnetic anomalies (0 to 20 nT) (Figure 5A) are observed at the central section of the survey. The lowest magnetic anomaly (0 to −68 nT) is seen in the south and southeast parts of the survey area which include the West Luconia–Balingian Provinces (see location map in Figure 1). The southern part of the survey area exhibits an obvious low magnetic response (0 to −68 nT) on both TMI_RTE and TMI_RTE_1vd anomalies maps which appears elongated in the E-W direction. The first vertical derivative characterizes shallow anomalies (short wavelength) compared to its original TMI_RTE data. Thus, the low magnetic zone in the south of the survey area is occupied by small-scale, elongated high magnetic zones in the shallower section, as imaged on TMI_RTE_1vd data (Figure 5D,E).
Comparable trends of dominant NE-SW and NW-SE with auxiliary E-W are seen on both TMI_RTE and TMI_RTE_1vd datasets indicating magnetic basement structures (interpreted on TMI_RTE) imprinted on the shallower magnetic structures interpreted on the TMI_RTE_1vd map. WNW-ESE to E-W trends are interpreted on TMI_RTE_1vd. An evaluation of both TMI_RTE and its derivatives maps reveal some structural features become more outstanding either on the TMI_RTE data or TMI_RTE_1vd data (pointed out by the red arrows). This illustrates contrasting structures between the magnetic basement (seen on TMI_RTE map) and the shallower depths (TMI_RTE_1vd map). For instance, remarkable E-W trends are visible between two major elongated structures in the south of the survey area on TMI_RTE_1vd map but are not seen on the TMI_RTE map (rectangle zone in Figure 5E). Another example is highlighted in Figure 5B,E, where very curved features are seen on TMI_RTE (magnetic basement) but no longer appear on the TMI_RTE_1vd. Some other lineaments that are only seen on either the magnetic basement or shallower section are pointed by the red arrows on Figure 5B,E.
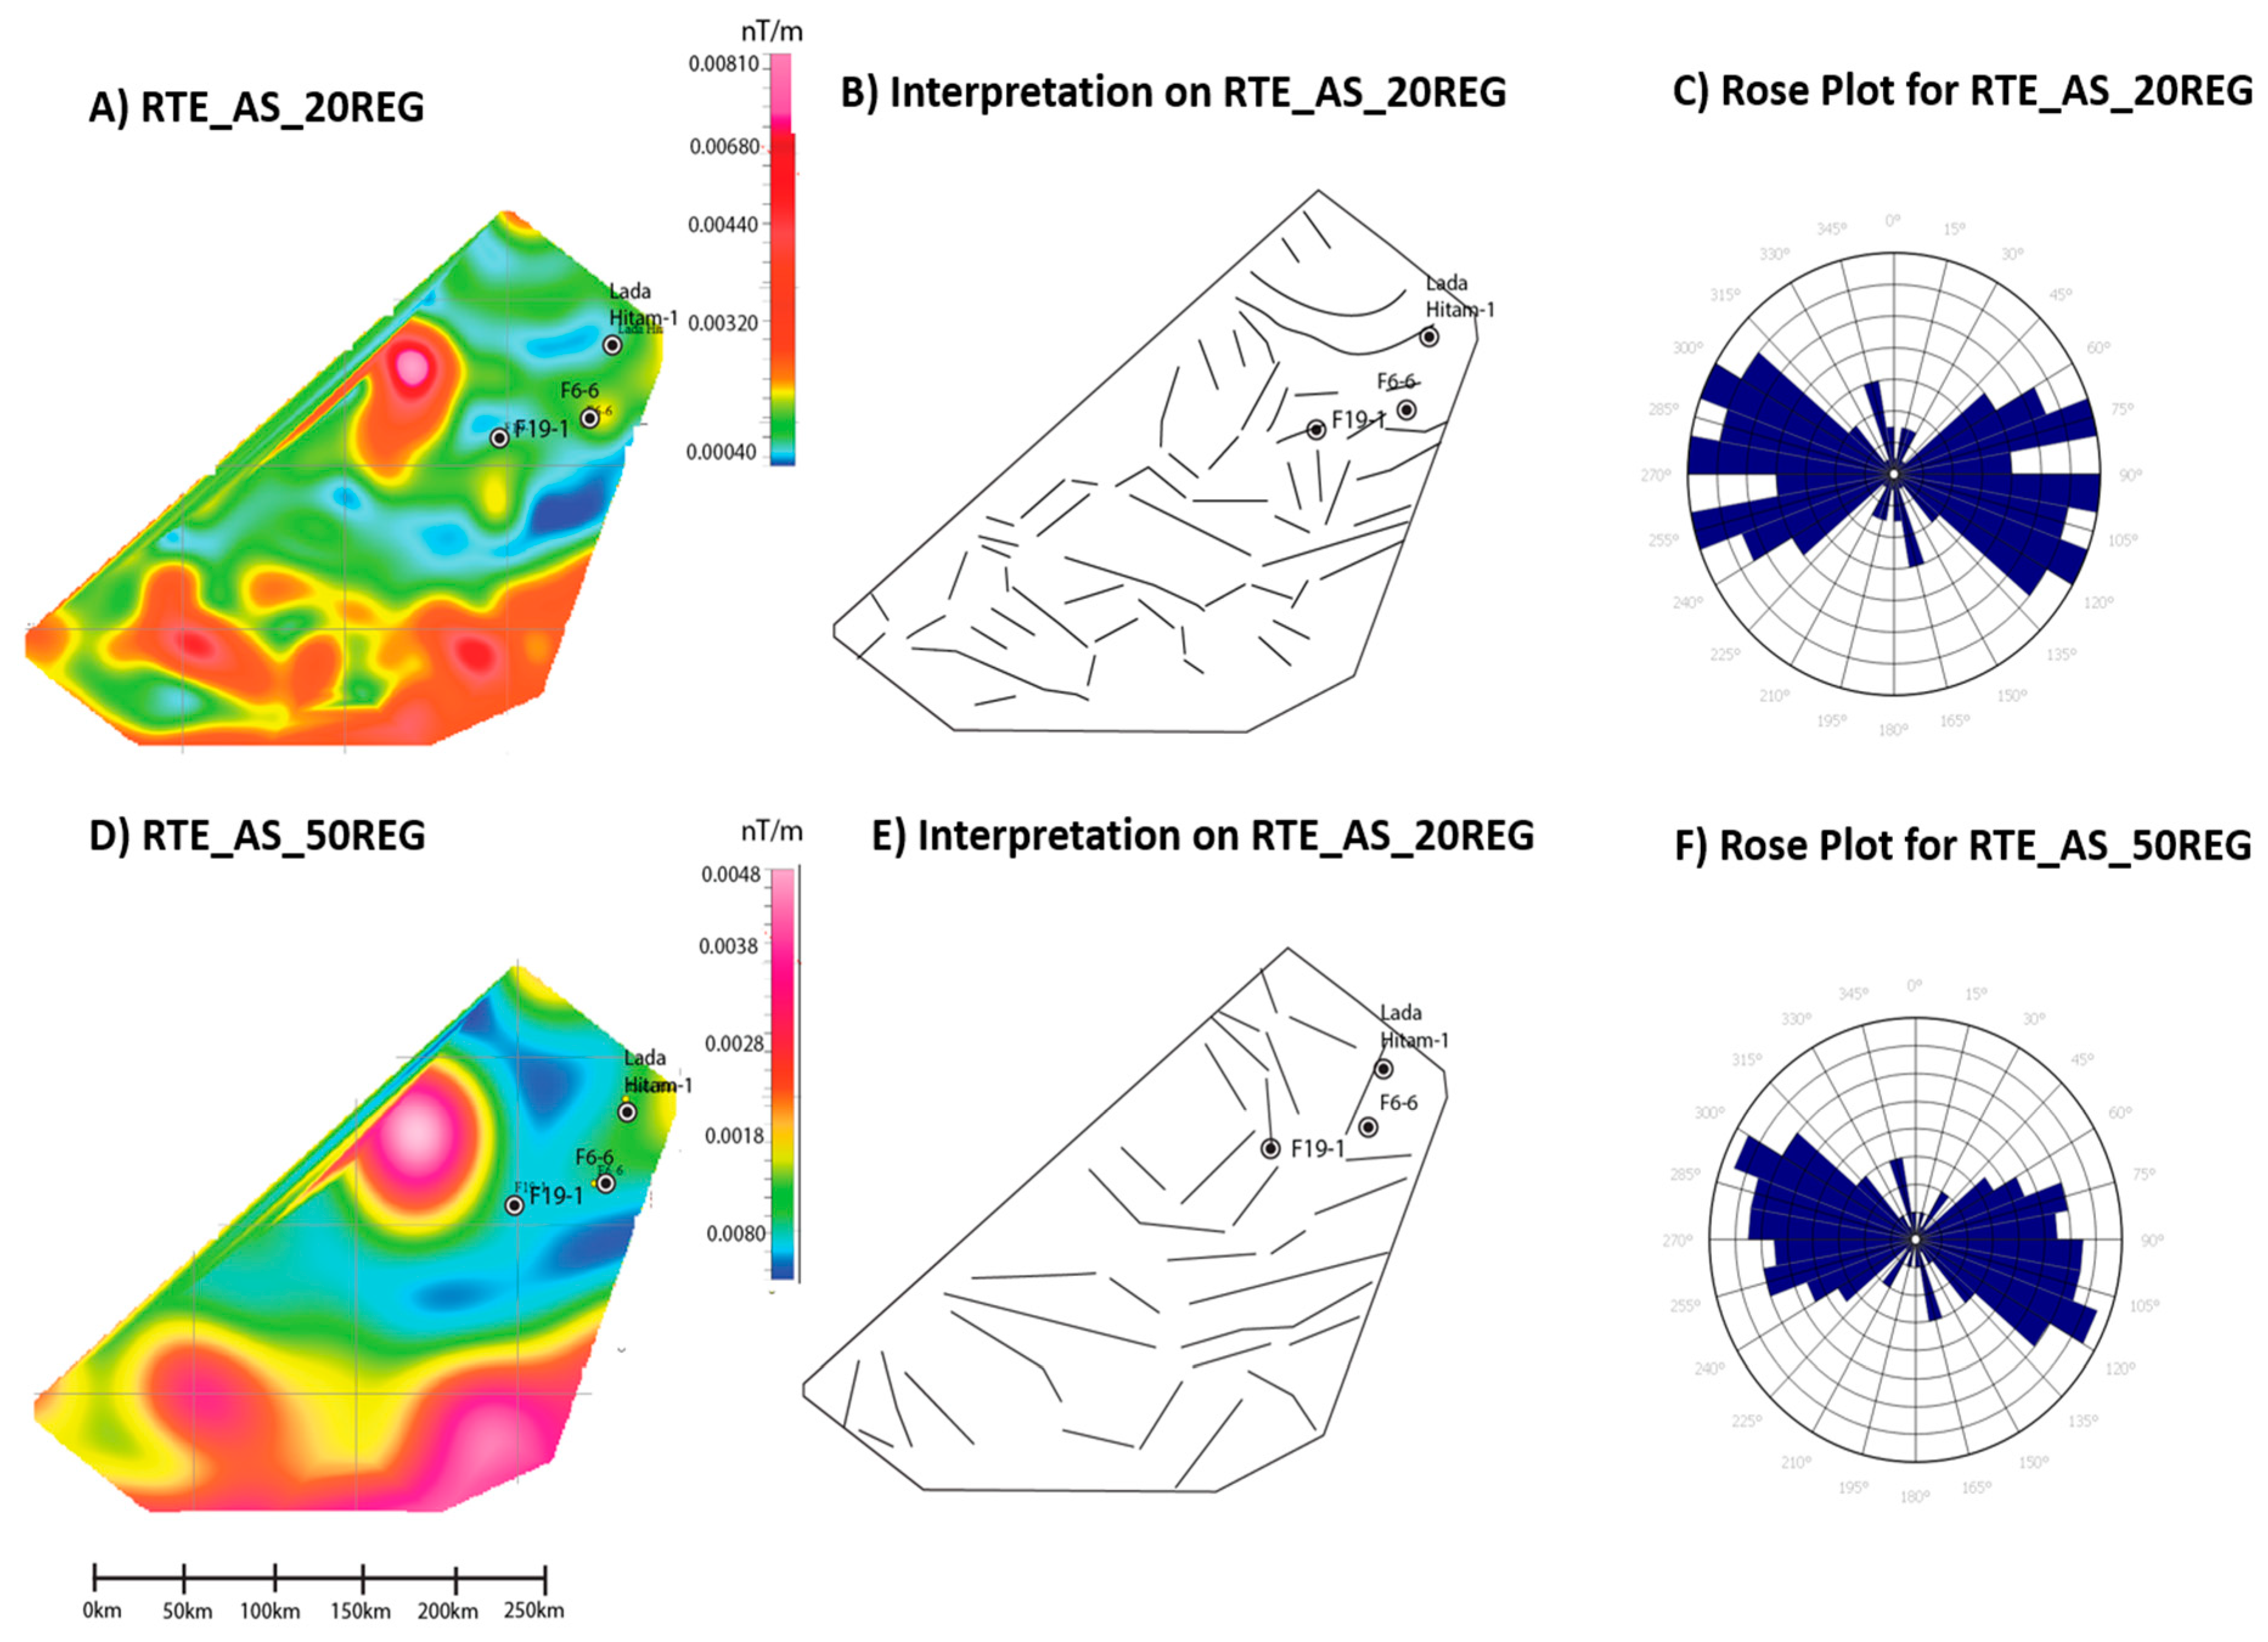
Further analyses on the analytical signal data of the aeromagnetic data are conducted to reduce the uncertainty in interpreting magnetic data at low latitude such as in Central Luconia Province. A careful examination of the regional aeromagnetic map indicates that some of the magnetic anomalies detected on original TMI_RTE map are appearing on the regional analytical signal maps (Figure 6A,D) with lower amplitude and frequencies. A similar NW-SE structural trend is preserved both in TMI_RTE and regional aeromagnetic map from the analytical signal. However, the magnetic anomalies on regional analytical signal appear in lower amplitude compared to the TMI_RTE anomalies. The regional analytical signal is characterized by a main trend striking NNW-SSE to E-W with a minor NW-SE for both less than 20 and 50 km wavelength. The residual analytical signal anomalies for these two wavelengths show clusters of elongated bodies of high magnetic response within low magnetic values in the southern part of the survey area, striking E-W.
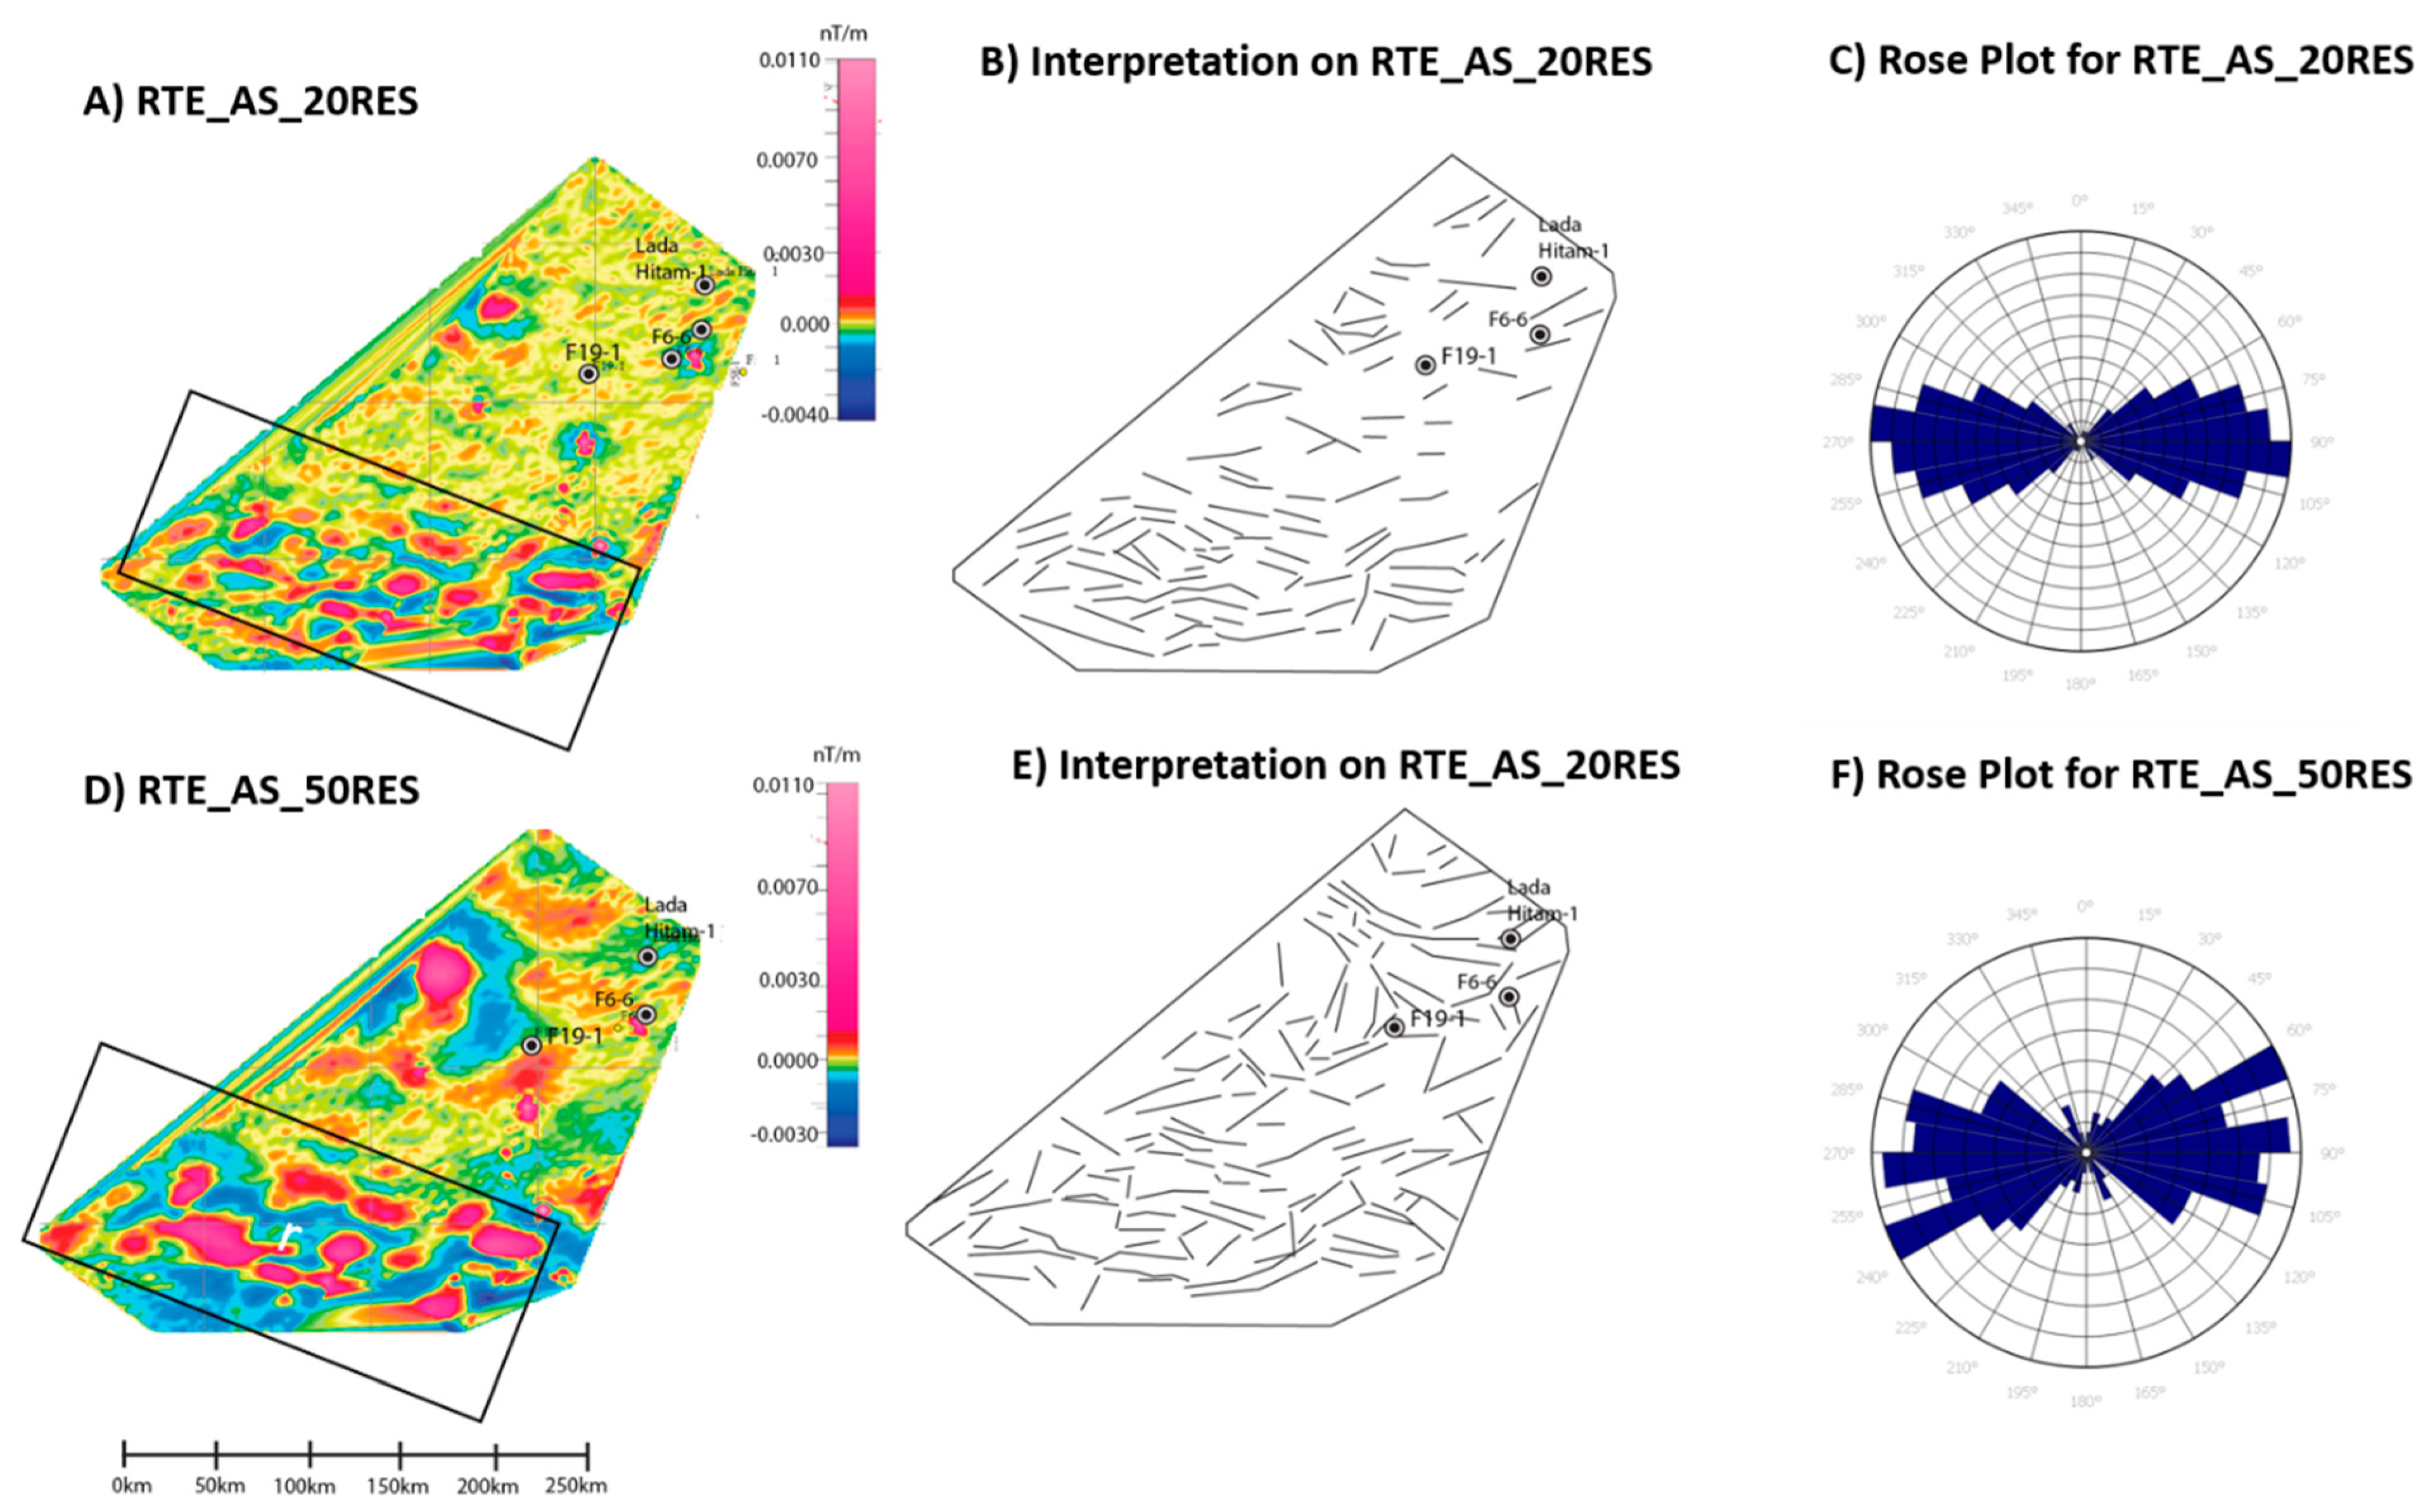
An evaluation of the Analytical Signal (AS) (Figure 7) maps confirms the presence of E-W oriented magnetic bodies in the southern section of the survey area, with local variations of elongated geological bodies with high magnetic anomalies. The residual AS magnetic map at a wavelength less than 20 km shows a distinct E-W structural trend while WNW-ESE to E-W trends are seen on the residual map for wavelength less than 50 km. Overall, the magnetic data preserve a dominant E-W trend (Figure 7) and minor features oriented in NW-SE and NE-SW (Table 2). It can be assumed that a large E-W oriented magnetic bodies may be controlling the crystalline basement of Central Luconia with the major magnetic signal caused by the differences in the composition or changes of the sources of the geological bodies.

5.1.2. Airborne Gravity Interpretation

The interpretation of airborne gravity data is centered on the depth domain (Z) tensor. This include Tz (low frequency), Tzz (high frequency), Txz and Tyz tensors for the analysis of horizontal vectors of the depth domain and Contact Lineament Processed (CLP). Tz gravity anomaly map detects larger subsurface (long wavelength) structure that usually lies deeper and is comparable with the first derivatives of TMI_RTE data that detects shallower magnetic bodies. Tzz responses are prone to the shallower section of the subsurface (short wavelength) while Txz and Tyz focuses on short to intermediate wavelengths. Positive gravity anomalies are captured at the southwest of the coverage area on both Tz and Tzz components that are interpreted as elevated structure which also appear in the shallower section (arrow in Figure 8A,D). Negative (low) gravity anomalies on low and high frequency data are seen in the northeast, central, and southeast regions of the survey area, with a higher concentration in the vicinity of Lada Hitam-1, F6-6 and F19-1 wells. An obvious circular structure within low gravity anomaly (arrow in Figure 8A,D) is recognized on Tz and Tzz data.
Anomalies maps of low (Tz) and high ((Tzz) frequency gravity anomalies represent the gravity anomalies for shallow and deep subsurface. Structural trends in the shallower section are dominated by NW-SE orientation (Figure 8C). The Tz gravity map shows a dominant NE-SW structural trend data (Figure 8F), while still preserving the NW-SE trend that seen also on the Tzz data. A minor E-W trend is also observed on the Tz data (Figure 8F). Generally, the structural trends interpreted on Tz and Tzz gravity data give a similar dominant trend NW-SE, suggesting a form of consistency in the basement fabrics at depth <5 km, whereas NE-SW and E-W structural trends appear in the deeper section (Tz).
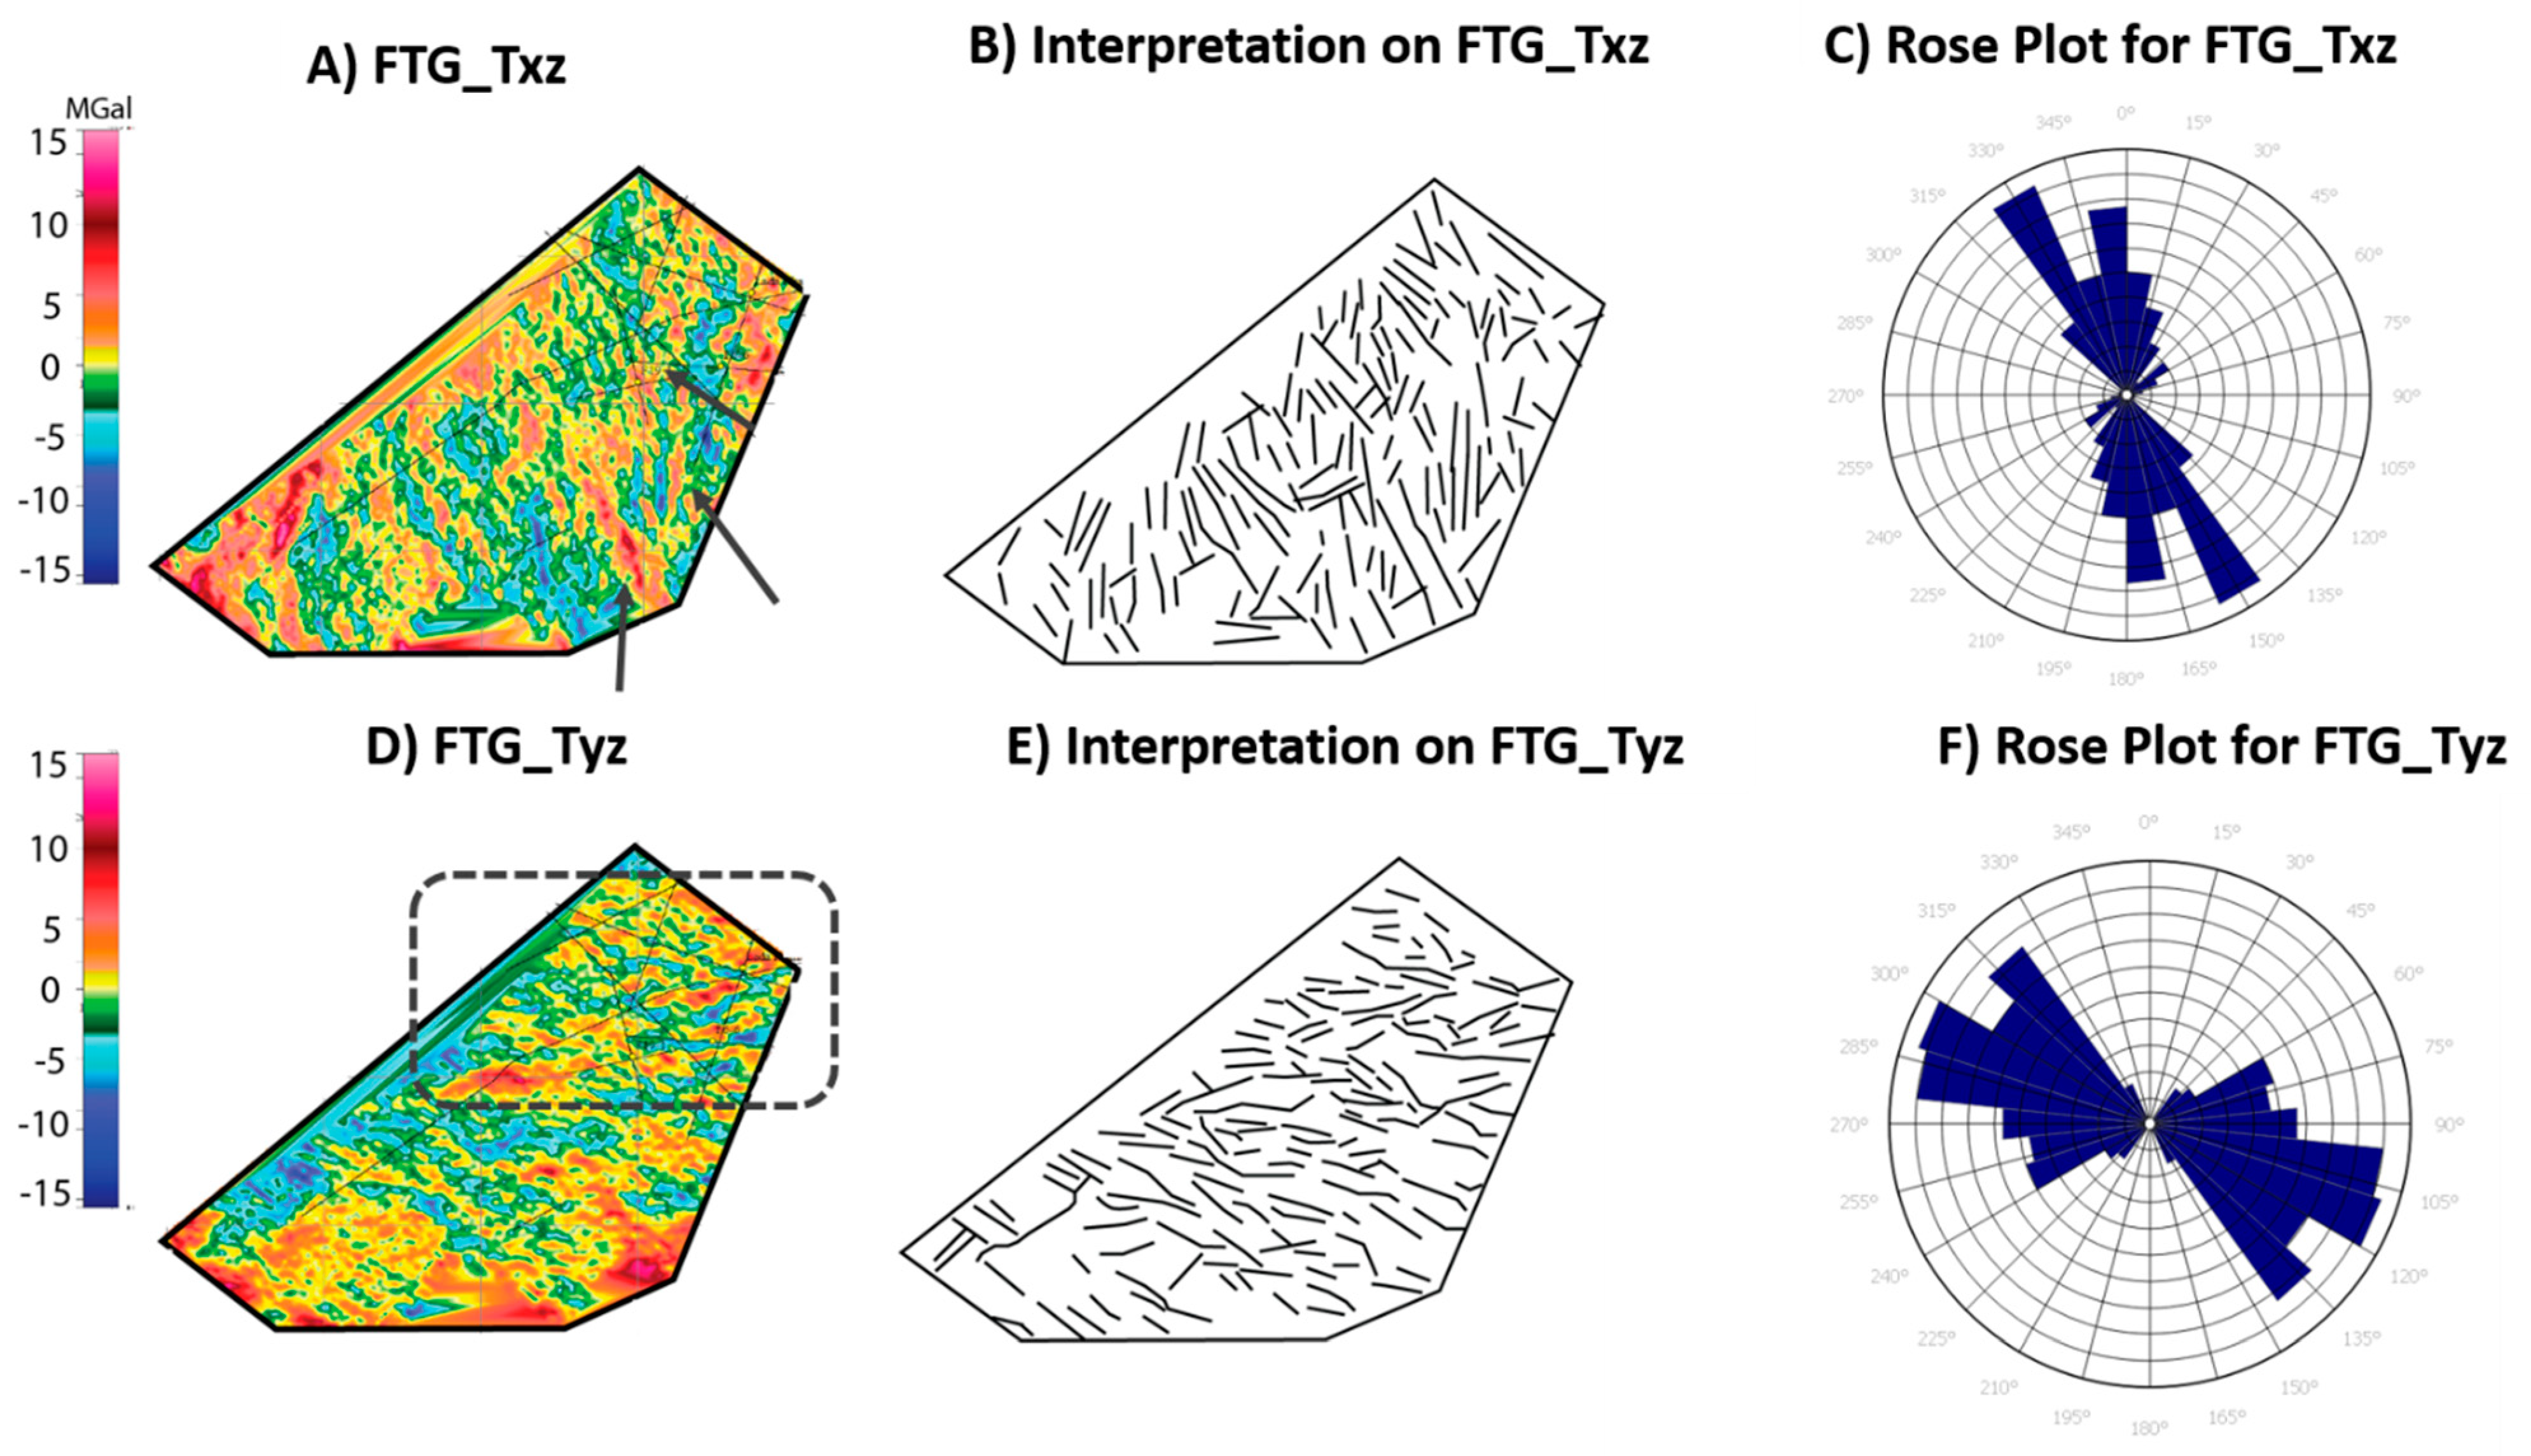
Anomaly maps generated for the horizontal components of gravity data (Txz & Tyz) are dominated by positive anomalies ranging from 0 MGal to 10 MGal. The negative gravity anomalies are scattered in between the positive gravity anomalies from 0 Mgal to −8 MGal. The Txz signal is dominated by a NW-SE orientation with a prominent NNW-SSE direction. This can be seen from the distribution of the positive and low gravity anomalies distribution on Figure 9A where the positive gravity anomalies (usually representing high relief structures) are aligned in NW-SE to NNW-SSE directions. Structural trend interpreted on Tyz map also preserved NW-SE to E-W directions (Figure 9F). From the gravity anomaly map of Tyz, the northeast side of the survey area (highlighted in dash rectangle on Figure 9D) shows majority of E-W trend while the southern part of the survey area is occupied by NW-SE trend. Both NW-SE to NNW-SSE orientations follow similar trend as interpreted on the Tzz (Figure 8C). The presence of a N-S trend on Txz and E-W trend on Tyz anomalies maps appear to represent the horizontal X and Y components.
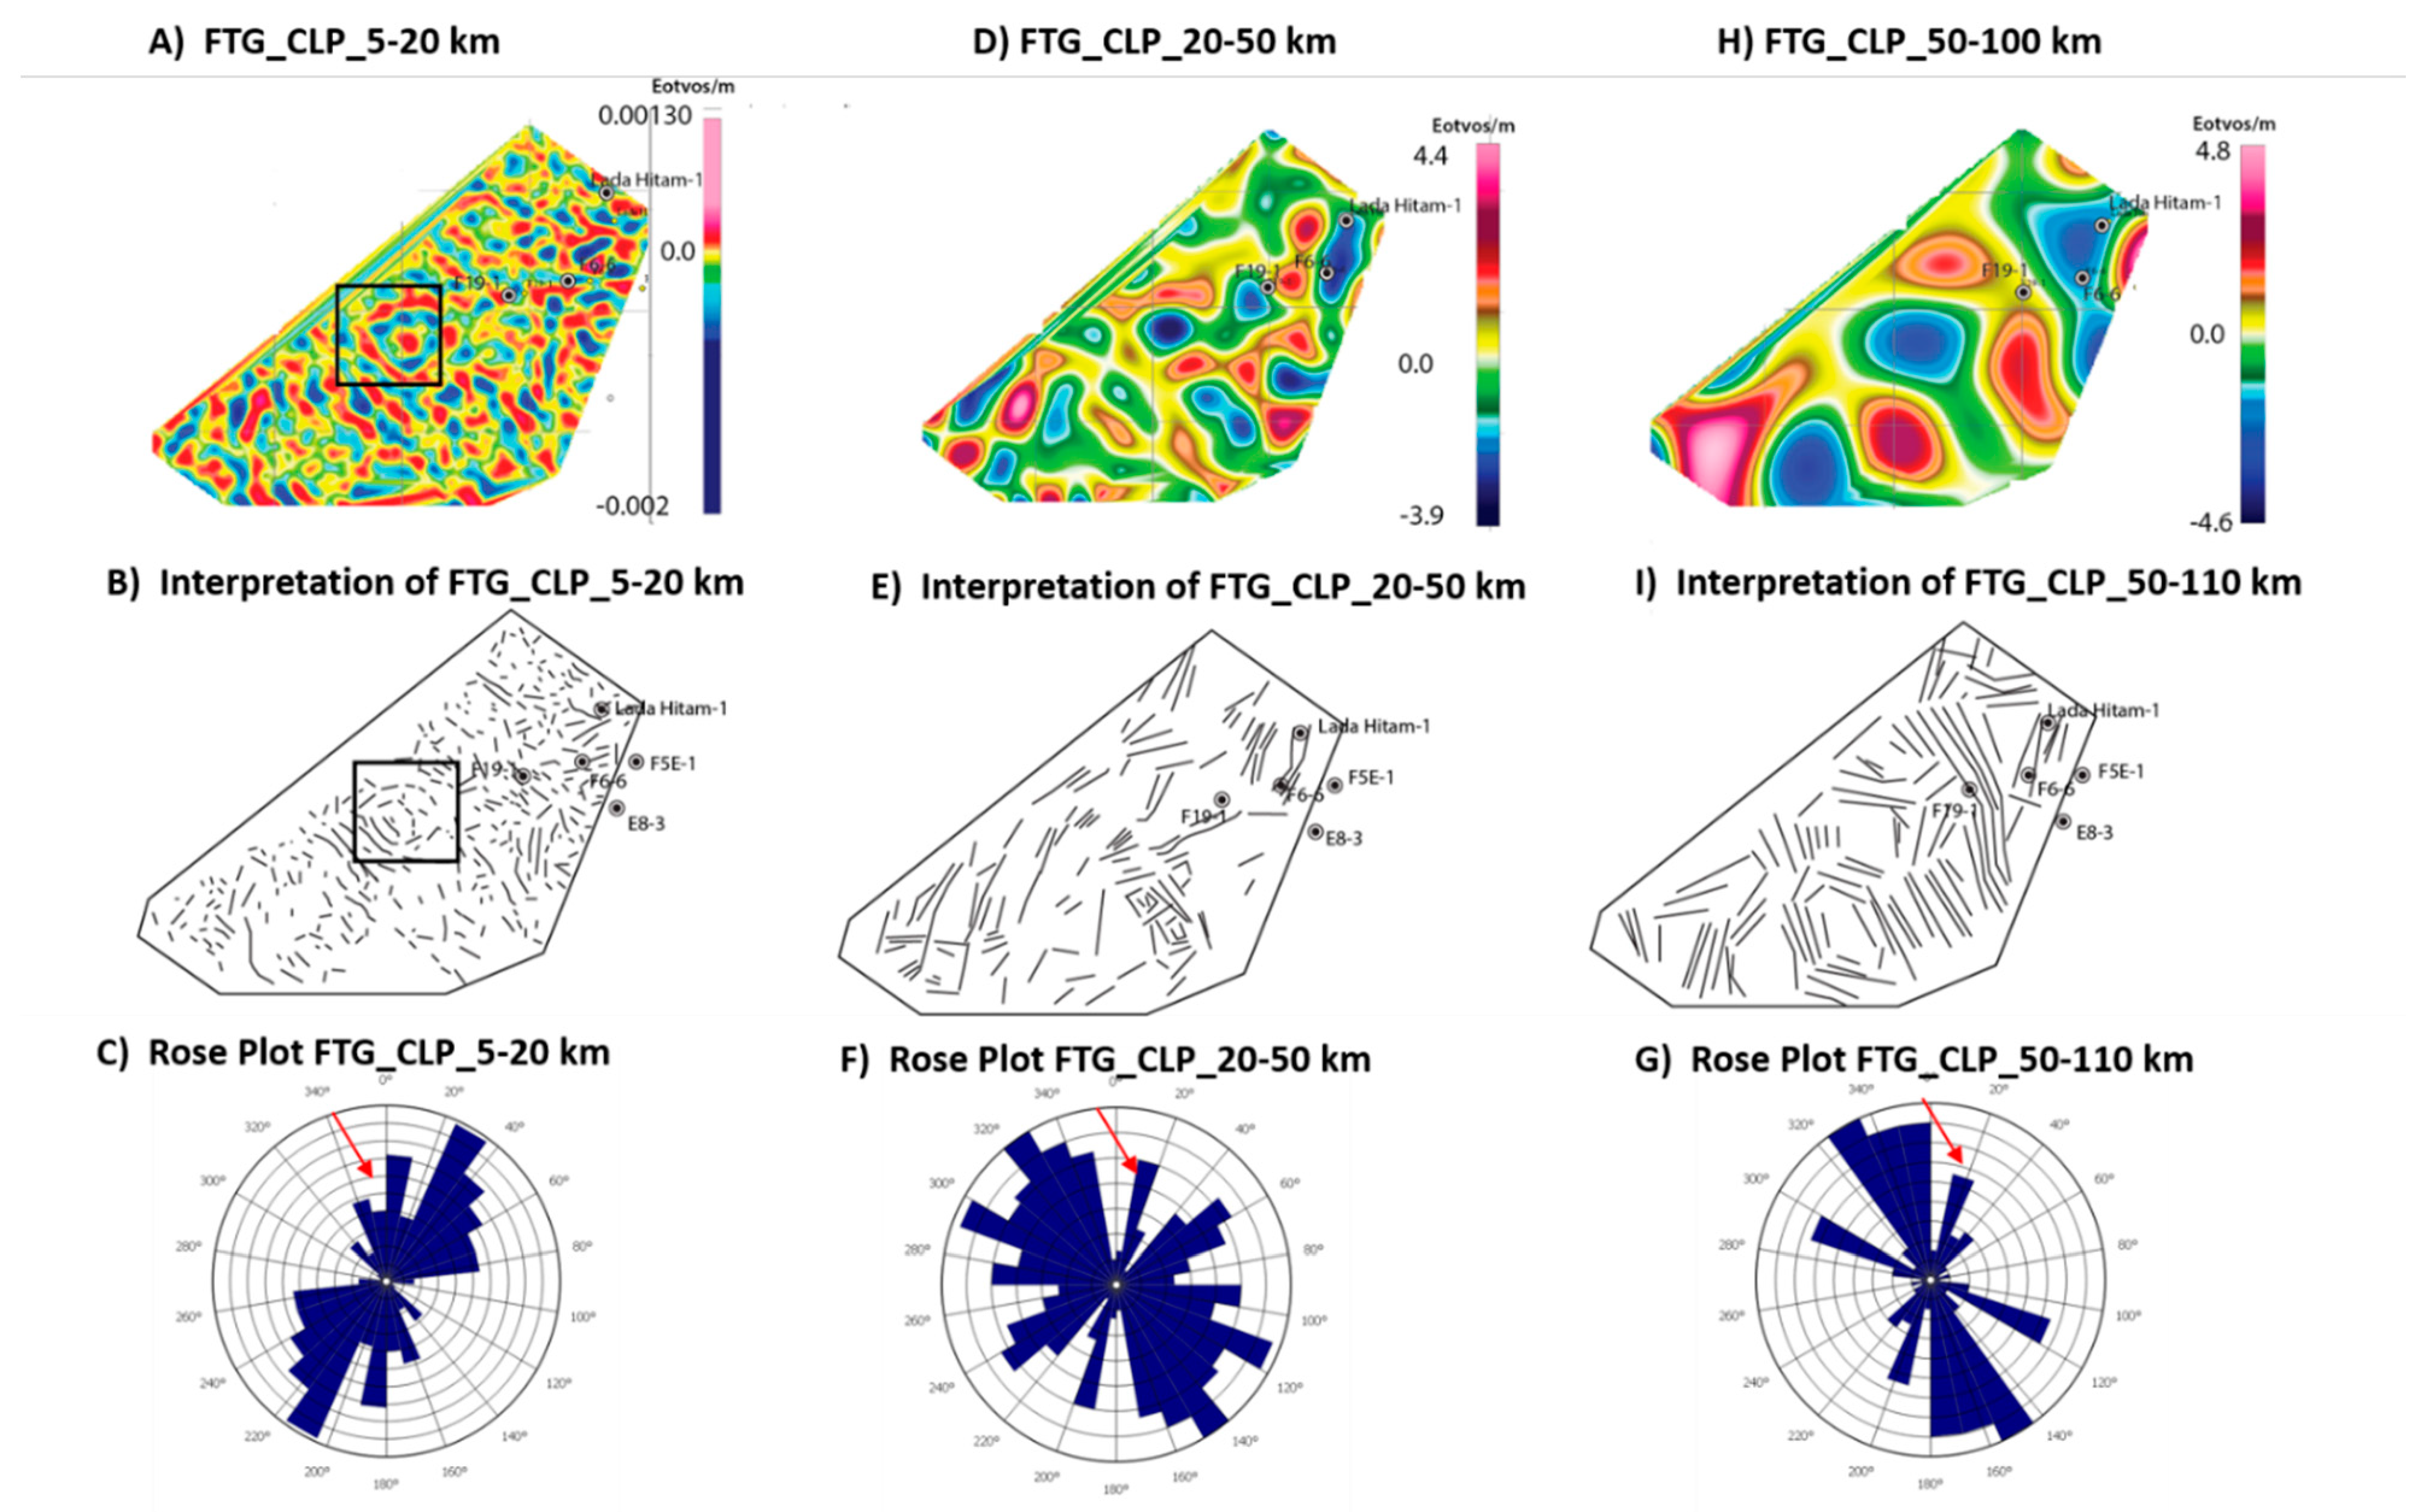
The analysis of Contact Lineament Processing (CLP) is effective to visualize geological trends at variable depths by application of frequency slicing on the Tz (low frequency, long wavelength) data. Contact lineament filter was applied on several slices based on the 3 wavelengths’ ranges, which are (i) 5 to 20 km (short), (ii) 20 to 50 km (medium) and (iii) 50–110 km (long) (Figure 10). Each wavelengths’ range is estimated to represent depth half of the wavelengths, based on the assumption of velocity of the rock’s composition at 2000 m/s, slightly higher than the water velocity at 1500 m/s. However, the estimated depth might be shallower from the predicted depth considering interbedded sediments in Central Luconia that include thick limestone layers with higher velocity reaching 3500 m/s to 4000 m/s.
The contact lineament map of 5 to 20 km wavelength (Figure 10A) is categorized as short wavelength, presenting structures at depth approximately from 2.5 to <10 km. Strikes that appears on short wavelength data give dominant NE-SW to N-S orientation (Figure 10B,C). The intermediate wavelengths CLP map (Figure 10D) captures data at depths approximately 10 to <25 km, exhibits the prominent broad NW-SE trend with auxiliary trends oriented at NE-SW to E-W (Figure 10E,F). Interpretation of lineaments on the long wavelength of CLP map (Figure 10H) exhibit NW-SE to NNW-SSE trends. The estimated depth of data captured on long wavelength is approximately between 25 to 55 km. A consistent magnitude of NE-SW trend has been interpreted on all CLP data (pointed with red arrows on all rose plot on Figure 10), regardless the wavelengths focus. This must be treated with cautious since it might represent the artefact from the edge of survey area. Contrarily to the other datasets, the Contact Lineament Processed analysis appears to record diverse structural trends that highly depend on the wavelength ranges.

5.2. Depth Estimation for Signature Patterns

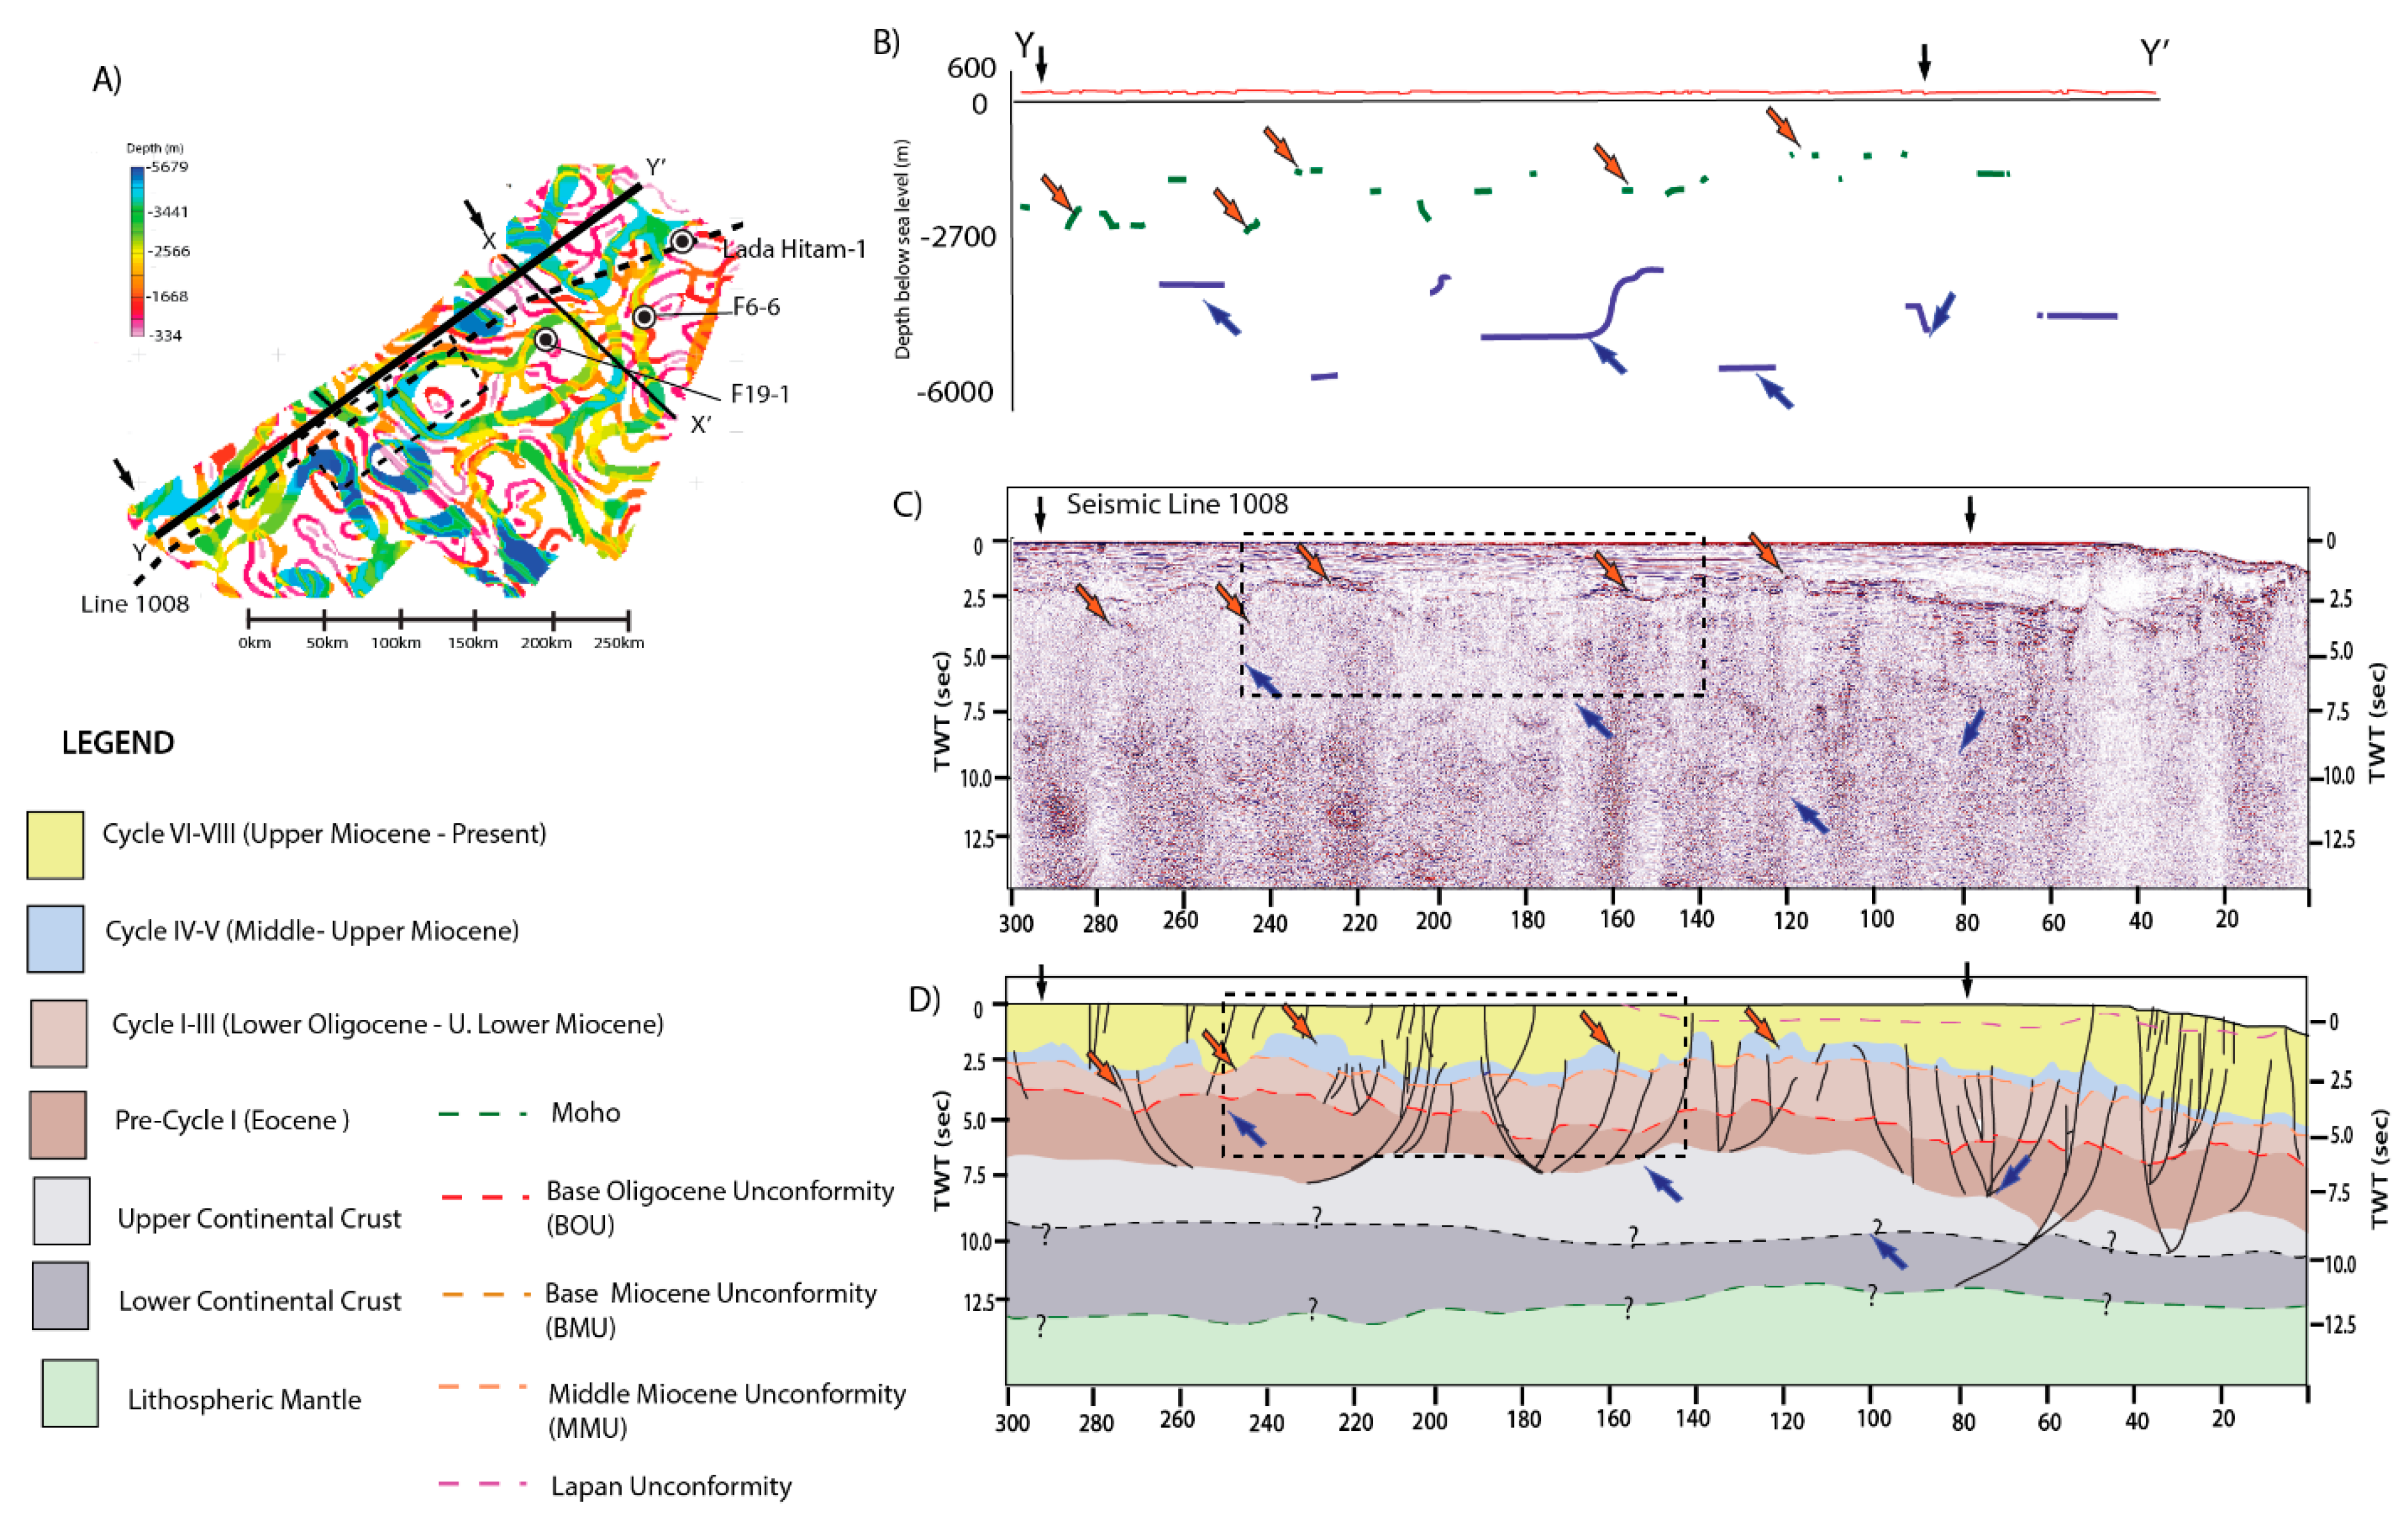
Two depths profiles oriented in NW-SE and NE-SW (Section X-X’ and Y-Y’ on Figure 11 and Figure 12) are used to estimate the depths to the source of gravity anomalies. Each depth profile plotted for 10 to 40 km wavelength focused on shallower features and 30 to 80 km wavelength, where 10 to 40 km wavelength characterizes shallower features while the 30 to 80 km wavelength targets the deeper features. Postulated structural discontinuities were interpreted from the depth estimates and plotted in depth profiles (Figure 11B and Figure 12B). The depth maps for the airborne gravity data are represented in horizontal and vertical sheets. Horizontal sheet has the potential to highlight fault blocks or any tabular shaped features, while vertical sheet map may reveal fault zones, narrow ridges and intrusive dykes. Depth profiling helps to reveal broad geometry features including the basement surface and elements of material above the basement.
Short and long wavelength responses from the FTG depth profile appear relatively consistent with similar patterns at different depth. Profile X-X’ (Figure 11B) with a broadly continuous suite of shallow anomalies with a few variations at depth that may represent a series of folded or faulted strata. The short wavelength solution for profile X-X’ matches the interpreted horizon(s) for top carbonate of Cycle IV/V (pointed with red arrows in Figure 11C–F). The longer wavelength solution appears to reflect deeper stratigraphic horizons that are deformed with abrupt changes of depth that could suggest horst and graben structures (pointed with blue arrows in Figure 11C–F).
Although depth profiling reveals what may be a broad geometry representing the top of the basement and elements of material above the basement, the anomalies detected are unconstrained and should not be taken as an accurate representation of the subsurface. Cross examination with nearest seismic lines allows for a validation of the possible geological structures represented in the depth profiles. Depth profile X-X’ in NW-SE direction is examined together with parallel seismic lines 1004 and 1014 (Figure 11C,D). Depth profile X-X’ is perpendicular to the NE-SW structural trends interpreted as minor structural trends on most aeromagnetic and airborne gravity maps (Table 2). Faults striking in NE-SW directions are marked in seismic lines 1004 and 1014 (Figure 11E,F) and are seen to offset stratigraphic layers at depth −4000 ms to −8000 ms which include sediments in Cycle I and older. Thus, the NE-SW trend is suggested to represent deep normal faults that were active during Eocene-Cretaceous and offsetting Cycle I-II and Pre-Cycle sediments.
Profile Y-Y’ (Figure 12B) exhibits undulating, yet consistent shallow anomalies and is compared with parallel seismic line 1008 (Figure 12C). The computed shallow anomalies on Y-Y’ profile are satisfactory with the morphology of the top carbonate of Cycle IV or V, but the longer wavelength solution seem to be more uncertain. The depth profiling from short and long wavelengths were indeed unconstrained at the time that the data were extracted. Thus, the depth profiles are representative of succession of horizon and not limited to one single horizon, as what usually interpreted on seismic data. Depth profile Y-Y’ is perpendicular with majority of the NW-SE structural trends interpreted on aeromagnetic and airborne gravity maps (Table 2). Majority of the faults associated with Cycle III and younger sediments on seismic line 1008 are striking in NW-SE directions (Figure 12D). Thus, the NW-SE faults interpreted by the aeromagnetic and gravity data might represent faults that affecting the Miocene sediments of Cycle III-VIII. The NW-SE trend is also parallel to the orientation of two main structural features that bounded Central Luconia Province, which are the West Baram Line and West Balingian Line (Figure 1C).
Similar features seen on both profiles with their neighboring seismic lines are pointed with arrows on Figure 11B–F and Figure 12B–D. Shallower structures captured by short wavelength (orange arrows) match very well with either the Top of Cycle IV/V limestone, including the flat-top or pinnacle shape build-ups as delineated on the seismic. Deeper structures captured by long wavelength represent structures at the Top of Cycle I or Cycle II which are interpreted as uplifted topography that are faulted, and some are compressed due to extensive faulting. These structures are observed at depth between −4000 and −6000 ms (equivalent to −2000 to −3000 m).
With good correlation between geometry of structures interpreted on depth profiles X-X’ and Y-Y’ with nearby seismic lines, the amplitude strength on the Tzz, Txz and Tyz gravity response (Figure 8 and Figure 9) are adjudged to represent the top of Cycle IV and or Cycle V limestone since amplitude strength points to the density of the carbonate fill (i.e., porosity of the carbonate rocks) as suggested by [54]. Cross examination with the sonic and density logs for Lada Hitam-1 and F6-6 well reveals average porosity of 20–22% in Cycle IV and V limestone and bulk density of 2.36 g/cm3 in the formation. The clastic sediments of Cycle VI- VII overlying the limestone have average porosity of 31.54 to 33.7% and average bulk density of 2.09 g/cm3. Variations in the density of the formations provide accurate position to map the top of limestone interpreted in the depth profiles extracted from the airborne gravity data.

6. Discussion

The results from the structural trends analysis based on different aeromagnetic and airborne gravity maps (Table 2) are evaluated and each of them reveal changes in the orientation of the structural features at different depth ranges. Short wavelength data gravity and magnetic data are reflecting a shallow subsurface structure while long wavelength gravity and magnetic data are reflecting deep subsurface structure. These structural trends are compared with two recent structural maps published by [51,52] as partly re-drawn for the study area in Figure 13B).

6.1. Shallow Subsurface Structures from Short Wavelength Data

Shallow subsurface structures for Central Luconia Province are validated from airborne gravity including Tzz, Txz, Tyz and CLP short & intermediate wavelengths data, as well as the first derivatives of aeromagnetic data (TMI_RTE_1vd). Txz, Tyz, and Tzz data represent major NW-SE structural trend, whilst the CLP_short and intermediate wavelength capture NE-SW and broad NW-SE trend. All short wavelength gravity anomalies map also preserved NE-SW structural trend. The NW-SE trend are parallel with the direction of West Baram Line and West Balingian Line, indicating imprint of these two major faults within the sediments of Central Luconia. Some limestone build-ups in Central Luconia, particularly in the central to northern section are also oriented in NW-SE directions (Figure 1C), demonstrating the growth of the build-ups on top of NW-SE oriented structural blocks. The analysis of TMI_RTE_1vd that represents magnetic bodies shallower than the magnetic basement reveals E-W to NWW-SEE orientations, and this is assumed not to be associated with any structural trends interpreted on the short wavelength airborne gravity. Instead, it might represent subsurface structure located at intermediate depth, not too shallow, and not to deep.
In the northeast section (longitudes 112° to 113°), NE-SW to NNE-SSW structural trends follow similar NE-SW trend that has been mapped in both [51,52]. The NE-SW to NNE-SSW faults that were exposed from the airborne gravity are comparable with the faults’ orientation interpreted at the base of carbonate platforms at the southern part of Central Luconia as modelled in [15]. These NE-SW faults are expected to be originated within the brittle upper crust, continues offsetting the sediments in Pre-Cycle and possibly remain active or being re-activated in the same orientation during deposition of sediments in Cycle I as interpreted in seismic line 1004 and 1014 (Figure 11E,F) as well as line 1008 (Figure 12D).
In the SW section of the airborne gravity coverage area (longitude 111° to 112°), N-S to NNE-SSW faults interpreted on Txz and Tzz gravity anomaly map appear to be similar to those mapped by [51]. These faults are marked as NE-SW orientation by [52]. Based on this study, a more precise and detailed faults orientations for the shallow subsurface structure are illustrated especially in the eastern side of the airborne gravity coverage (south of F19 well) and at the section to the west of West Balingian Line. Improvement in mapping of the faults particularly the Cenozoic faults (post-collision faults) are enhanced through interpretation of the airborne gravity maps especially in the central to SW section of the survey area. Apart from that, younger faults, most likely to be smaller scale faults induced by gravitational tectonic from the constant loading of the sediments from onshore to the offshore have been mapped in detail through CLP data for short to intermediate wavelengths (Figure 10).

6.2. Deep Subsurface Structures from Long Wavelength Data

The geology of crystalline basement underneath Luconia Province is poorly known due to limited high-resolution data that can be imaged to these depths. It is certain that the basement of Luconia Province was originated and equivalent to the continental fragments drifted off from the southern china during the creation of the South China Sea marginal basin [21]. In this context, the basement material for Luconia Province is similar to the basement of Dangerous Grounds and Reed Banks. Earlier interpretation by [21,23] estimated the depths for the crystalline basement within Central Luconia (coverage area for airborne gravity and magnetic) varies from 4 to 8 km [23]. However, the structural behavior of the crystalline basement is still undiscovered.
Through this study, the magnetic (crystalline) basement structure is revealed by the analysis of the long wavelength aeromagnetic maps. Majority of structural trends in E-W, NNW-SSE and NWW-SEE directions are interpreted on aeromagnetic maps (Table 2). These trends are not seen in structural map of [51,52] (Figure 13B). These E-W to NWW-SEE trends interpreted on the aeromagnetic data are assumed to be reflecting the magnetic basement of Central Luconia Province The faults interpreted on the aeromagnetic maps are expected to represent the tectonic events formed during Cretaceous- Paleocene, at the time Luconia continental shelf began to drift away from the continent of the Southern China. The NNW-SSE and NWW-SEE structural trends accommodate the variation of finite extension of the normal faults and expected to symbolize the transfer faults during the rifting stage.
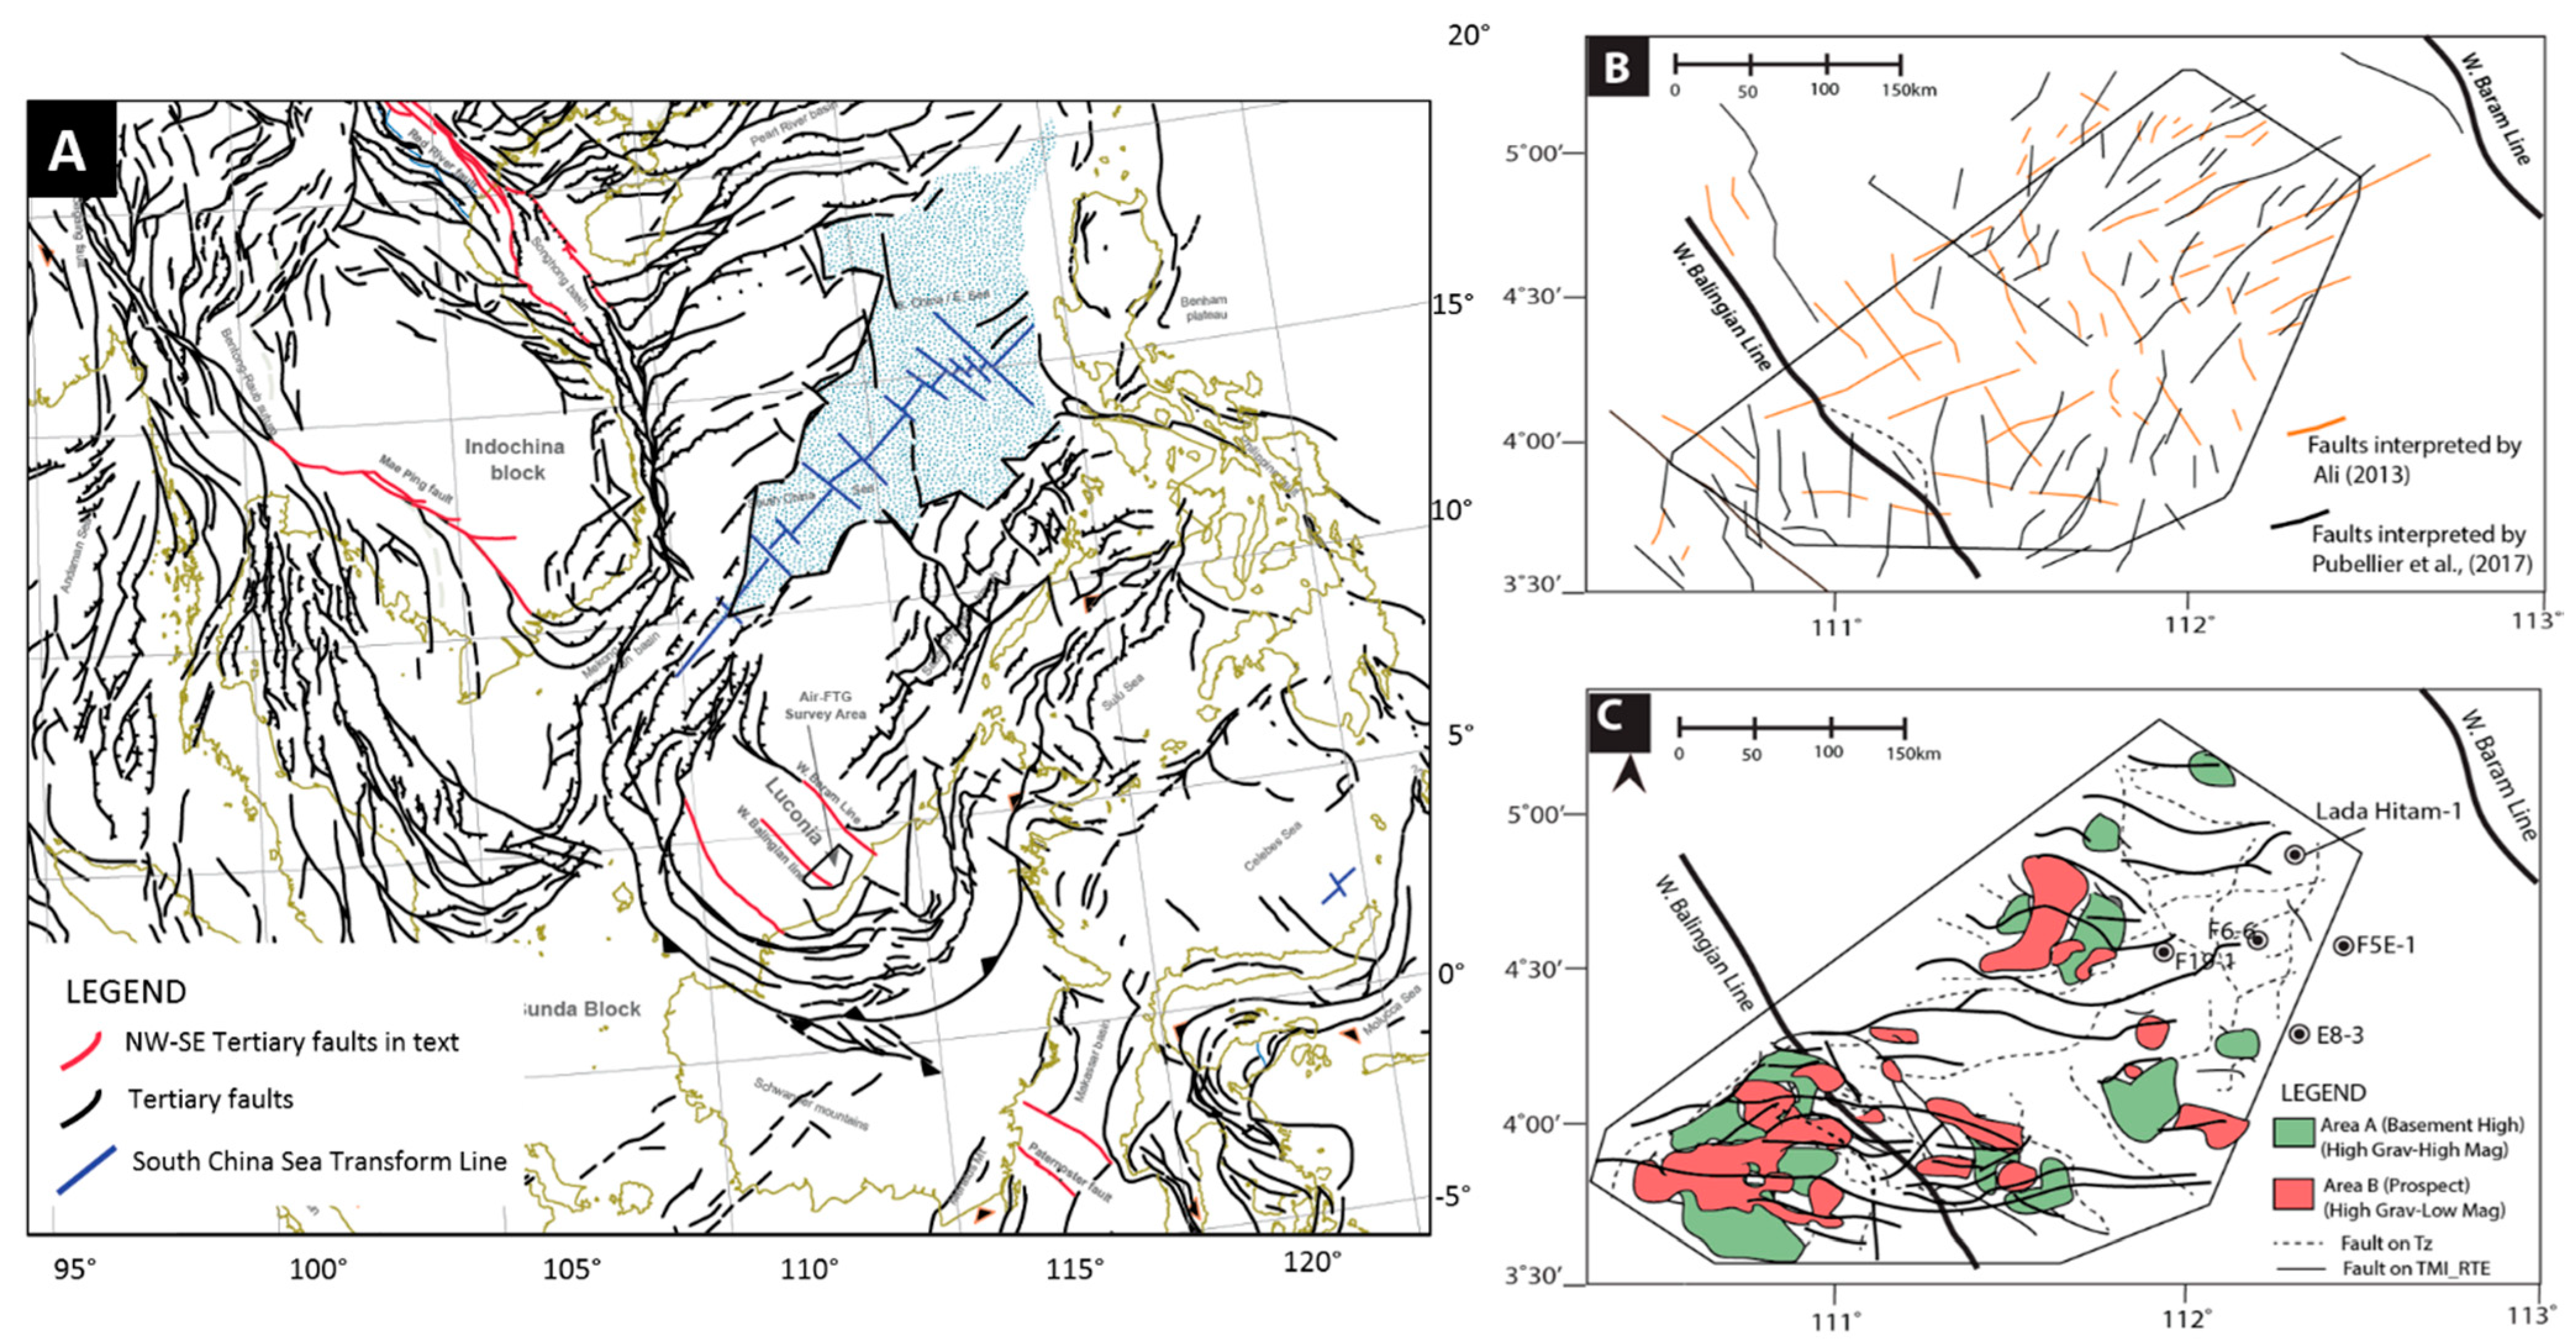
Based on similarity of the orientation, the event has high possibility to be related with the movement of older faults that oriented in NNW-SSE to NWW-SEE direction and distributed within the South East Asia (Figure 13A), either in Borneo-Sulawesi or in IndoChina Block. One of the examples is the Red River Fault (RRF) Zone which created NW and NNW striking faults interpreted on acoustic basement along Da Nang Shelf and western of Phu Khanh Basin in Vietnam [55,56,57]. The trend is also parallel to the Mae-Ping Fault (Shear Zone) in South Vietnam–Cambodia [56,58] and similarly striking in the same direction with the Adang Line–Paternoster Fault in South Kalimantan–North Makassar Strait [59,60,61]. All these faults were formed by the Eocene.
The E-W direction fault, as revealed from the first derivatives and analytical signals data (Figure 5D–F and Figure 6), is parallel to the southern variation of the Crocker and Rajang fold-and-thrust belt. A potential high angle fold in E-W direction is observed on the magnetic data (Figure 5) and it has never been imaged and mapped before. Both E-W structural trend and the E-W folded structure imaged by the magnetic data follow the postulated southern boundary of the Palawan and Luconia crustal block, which is otherwise obscured to the amount of contracted sedimentary material. Although this requires further investigation, the NNW-SSE, NWW-SEE and E-W striking faults interpreted on the aeromagnetic maps have potential to associate with the early neotectonics phase in the SW sub basin of the South China Sea. Areas with potential for uplifted magnetic basement or intrusive structures are featured with high amplitude airborne gravity response and low to intermediate amplitude in aeromagnetic response (marked as Area A in Figure 13C). Similarly, it still preserves the domal and anticlinal characters as seen on FTG data and are defined by good contact lineaments/ faults. Yet, the aeromagnetic response (on analytical signal) gives low amplitude. Most intensely magnetic anomalies are detected in the east of Central Luconia Province. Area A is possibly representing tip of up-thrust structure from the magnetic basement or intrusive magnetic bodies in a shallower section (Figure 13C) instead of representing the whole magnetic basement body.

7. Conclusions

The different tensors components from the airborne gravity and aeromagnetic anomalies maps provide options in validating the subsurface of Central Luconia Province and allow for the re-evaluation of the structural orientations at distinctive depth ranges. The aeromagnetic anomalies maps capture magnetic response from the magnetic bodies, assume as the basement of Central Luconia Province. The evaluation of the aeromagnetic maps yields E-W to NNW-SSE and NWW-SEE structural trends. The NNW-SSE is striking in the same direction of the rifting faults that stretched the continental crust and relatable with regional trend preserved in Vietnam and Kalimantan. The E-W direction imaged through the magnetic anomalies is not clearly understood but could correspond to the trace of subduction of Luconia continental shelf underneath Central Borneo and might represent the southern boundary of the Palawan/Luconia crustal block. An imprinted NW-SE fault(s) is observed in first derivative aeromagnetic data, indicating of prolong growth faults that initiated at the top of magnetic basement and continues offsetting the younger sediments. The airborne gravity anomalies maps capture density contrast within the subsurface. The distribution of gravity anomalies on different depth (Z) domain reveals dominant NW-SE structural trends with auxiliary NE-SW trends. Dominant faults/lineaments trends in NW-SE orientation and are seen to offset sediments deposited during Miocene (Cycle III and younger) as proven from the seismic lines. As such, airborne gravity yields information for the shallower section whilst the aeromagnetic data facilitate information for the deeper section, particularly the magnetic bodies including the basement.
Specialized depth profiles extracted from the airborne gravity provide rigorous correlation in between the airborne gravity and seismic interpretation. Gravity response on the gravity anomalies maps is equated to morphology of top carbonate within Cycle IV and V, represented by more than one seismic horizon. Long wavelength (Tz) gravity (deep markers) is associated with sediments deposited in Cycle I or Cycle II through resemblance of the morphology identified on the seismic sections parallel to the depth profiles. Comparison of the interpreted faults at various wavelengths (depths) with [51,52] structural maps reveal similarity on the location of faults and its’ NW-SE dominant orientation, those interpreted on gravity anomalies map. However, faults interpreted at deeper section as revealed by the aeromagnetic maps are not represented in any published structural maps for this area. This study concludes the airborne gravity typically effective in reflecting shallower lithologic layers and the structures which affect them within depth less than 10 km while, the aeromagnetic data reveals geometry of the geological objects in the deeper section (more than 10 km) such as basement structures and potential trace of deep subduction zone.
The interpretation of aeromagnetic data is undeniably helpful in improving the geological interpretation over Central Luconia Province, the identification and isolation of the anomalies, the comparison of analyzed gravity, and aeromagnetic maps with established interpretation and finally, the grouping of the anomalies into areas zonation. As suggested, Area A (Figure 13C) is suggestive for elevated structures possibly originated from the magnetic basement of Luconia Shelf, a zone that should be consider for further investigation to understand the tectonic evolution of this area. Whilst area B focus on the priority area for any follow-up drilling program, considering Central Luconia as prolific hydrocarbon resource particularly from the Miocene limestone. Overall, interpretation structural trends on airborne gravity and aeromagnetic data had provided a new insight in re-assessing the structural trends in Central Luconia Province. It should be taken into consideration in any re-drilling program in search of new hydrocarbon prospects. Further evaluation can also be performed to correlate the structural trends interpreted at numerous wavelengths with the sediment’s cycles deposited in this area.

Author Contributions

This article is contributed by S.N.F.J., M.P. and B.S. All the interpretation was done by S.N.F.J. and been reviewed together with M.P. and B.S. The idea and concept of the paper was initiated by S.N.F.J. and been discussed with M.P. and B.S.; S.N.F.J. writes the original draft preparation of the article and both M.P. and B.S. edited and corrected all sections. All authors have read and agreed to the published version of the manuscript.

Funding

This research was funded by UNVIERSITI TEKNOLOGI PETRONAS (UTP), grant number 015LC0-007 (Yayasan UTP).

Institutional Review Board Statement

Not Applicable.

Informed Consent Statement

Not Applicable.

Data Availability Statement

The dataset presented in this paper belongs to Malaysia Petroleum Management (MPM) of PETRONAS and provided to the first author as part of her PhD study at UTP. The data is confidential and any request to utilize the data for any purpose shall be directed to MPM of PETRONAS. Readers can directly contact the corresponding author for further information on the data request. All data presented in this study have been approved for publication in this journal by the UIR Team of MPM on 15 March 2021.

Acknowledgments

Special thanks to Malaysian Petroleum Management (MPM), PETRONAS for providing the dataset presented in this paper. The data is granted to the Universiti Teknologi PETRONAS for postgraduate study, conducted by the first author. The discussion in this paper is benefited from the support provided by Norizam Md. Nor, Kamal Azlan A. Gahffar and M. Khairil Azrafy Amin, Roy Kittrell and Colm Murphy from MPM and Bell Geospace Limited (Malaysia).

Conflicts of Interest

The authors declare no conflict of interest. The funders had no role in the design of the study; in the collection, analyses, or interpretation of data; in the writing of the manuscript, or in the decision to publish the results.

References

  1. Fawwaz, A.; Roger, M.; Carlos, G. Improving deep crustal structure depth interpretation by integrating 2D gravity-magnetic modelling and structural restoration: Offshore Borneo. In Proceedings of the SEG International Exposition and 89th Annual Meeting, Society of Exploration Geophysicist, San Antonio, TX, USA, 15–20 September 2019; pp. 1719–1723. [Google Scholar]
  2. Jamaludin, S.F.; Sautter, B.; Pubellier, M.; Beg, A. The Succession of Upper Eocene-Upper Miocene Limestone Growth and Corresponding Tectonic Events in Luconia Shelf, Sarawak, Malaysia; Frontiers of Earth Science: Lausanne, Switzerland, 2021; Volume 9, pp. 1–22. [Google Scholar]
  3. Koša, E. Sea-level changes, shoreline journeys, and the seismic stratigraphy of Central Luconia, Miocene-present, offshore Sarawak, NW Borneo. Mar. Pet. Geol. 2015, 59, 35–55. [Google Scholar] [CrossRef]
  4. Hall, R.; Clements, B.; Smyth, H.R. Sundaland: Basement Character, Structure and Plate Tectonic Development. In Proceedings of the 33rd Annual Convention & Exhibition of Indonesian Petroleum Association, Jakarta, Indonesia, 4–7 May 2009. [Google Scholar]
  5. Hall, R.; van Hattum, M.W.; Spakman, W. Impact of India–Asia collision on SE Asia: The record in Borneo. Tectonophysics 2008, 451, 366–389. [Google Scholar] [CrossRef]
  6. Fyhn, M.B.W.; Pedersen, S.A.S.; Boldreel, L.O.; Nielsen, H.; Green, P.F.; Phan, T.D.; Huyen, L.T.; Frei, D. Palaeocene -Early Eocene inversion of the Phuquoc Kampot Som Basin: SE Asian deformation asscociated with the suturing of Luconia. J. Geol. Soc. 2010, 167, 281–295. [Google Scholar] [CrossRef]
  7. Morley, C.K. Late Cretaceous–Early Palaeogene tectonic development of SE Asia. Earth-Sci. Rev. 2012, 115, 37–75. [Google Scholar] [CrossRef]
  8. Metcalfe, I. Tectonic evolution of Sundaland. Bull. Geol. Soc.Malays. 2017, 63, 27–60. [Google Scholar] [CrossRef] [Green Version]
  9. Metcalfe, I. Gondwana dispersion and Asian accretion: Tectonic and palaeogeographic evolution of eastern Tethys. J. Asian Earth Sci. 2013, 66, 1–33. [Google Scholar] [CrossRef]
  10. Barckhausen, U.; Engels, M.; Franke, D.; Ladage, S.; Pubellier, M. Evolution of the South China Sea: Revised ages for breakup and seafloor spreading. Mar. Pet. Geol. 2014, 58, 599–611. [Google Scholar] [CrossRef]
  11. Hutchison, C. Marginal basin evolution: The southern South China Sea. Mar. Pet. Geol. 2004, 21, 1129–1148. [Google Scholar] [CrossRef]
  12. Pubellier, M.; Morley, C.K. The basins of Sundaland (SE Asia): Evolution and boundary conditions. Mar. Pet. Geol. 2014, 58, 555–578. [Google Scholar] [CrossRef]
  13. Epting, M. Sedimentology of Miocene carbonate buildups, central Luconia, offshore Sarawak. Bull. Geol. Soc. Malays. 1980, 12, 17–30. [Google Scholar] [CrossRef]
  14. Jamaludin, S.F.; Pubellier, M.; Menier, D. Relationship between syn-depositional faulting and carbonate growth in Central Luconia Province, Malaysia. Bull. Geol. Soc. Malays. 2014, 60, 77–83. [Google Scholar] [CrossRef]
  15. Jamaludin, S.F.; Pubellier, M.; Menier, D. Structural Restoration of Carbonate Platform in the Southern Part of Central Luconia, Malaysia. J. Earth Sci. 2018, 29, 155–169. [Google Scholar] [CrossRef]
  16. Kosa, E. Wings, Mushrooms and Christmas Trees: Insights from carbonate seismic geomorphology into the evolution of Central Luconia. In Proceedings of the AAPG International Convention and Exhibition, Singapore, 16–19 September 2012. [Google Scholar]
  17. Kosa, E.; Warrlich, G.M.D.; Loftus, G. Wings, mushrooms, and Christmas trees: The carbonate seismic geomorphology of Central Luconia, Miocene–present, offshore Sarawak, northwest Borneo. AAPG Bull. 2015, 99, 2043–2075. [Google Scholar] [CrossRef]
  18. Ting, K.; Pierson, B.J.; Al-Jaadi, O.; Hague, P.F. Effects of syn-depositional tectonics on platform geometry and reservoir characters in Miocene carbonate platforms of Central Luconia, Sarawak. In Proceedings of the International Petroleum Technology Conference, Bangkok, Thailand, 7–9 February 2011. [Google Scholar]
  19. Vahrenkamp, V.C. Miocene carbonates of the Luconia province, offshore Sarawak: Implications for regional geology and reservoir properties from strontium-isotope stratigraphy. Geol. Soc. Malays. Bull. 1998, 42, 1–13. [Google Scholar] [CrossRef]
  20. Zampetti, V.; Schlager, W.; van Konijnenburg, J.-H.; Everts, A.-J. Architecture and growth history of a Miocene carbonate platform from 3D seismic reflection data; Luconia province, offshore Sarawak, Malaysia. Mar. Pet. Geol. 2004, 21, 517–534. [Google Scholar] [CrossRef]
  21. Madon, M.; Kim, C.L.; Wong, R. The structure and stratigraphy of deepwater Sarawak, Malaysia: Implications for tectonic evolution. J. Asian Earth Sci. 2013, 76, 312–333. [Google Scholar] [CrossRef]
  22. Murphy, C.A. New Plays and Concepts for Offshore Sarawak from FTG Gravity Data. In Proceedings of the Seapex Exploration Conference for the Industry by the Industry, SEAPEX, Raffles City, Singapore, 15–17 April 2015. [Google Scholar]
  23. Vijayan, V.R.; Foss, C.; Stagg, H. Crustal character and thickness over the Dangerous Grounds and beneath the Northwest Borneo Trough. J. Asian Earth Sci. 2013, 76, 389–398. [Google Scholar] [CrossRef]
  24. Cullen, A.; Reemst, P.; Henstra, G.; Gozzard, S.; Anandaroop, R. Rifting of the South China Sea: 791 new perspectives. Pet. Geosci. 2010, 16, 273–282. [Google Scholar] [CrossRef]
  25. Cullen, A.; Zechmeister, M.S.; Elmore, R.D.; Pannalal, S.J. Paleomagnetism of the Crocker 793 Formation, northwest Borneo: Implications for late Cenozoic tectonics. Geosphere 2012, 8, 1146–1169. [Google Scholar] [CrossRef] [Green Version]
  26. Hennig-Breitfeld, J.; Breitfeld, H.T.; Hall, R.; BouDagher-Fadel, M.; Thirlwall, M. A new upper 829 Paleogene to Neogene stratigraphy for Sarawak and Labuan in northwestern Borneo: Paleogeography of the 830 eastern Sundaland margin. Earth-Sci. Rev. 2019, 190, 1–32. [Google Scholar] [CrossRef]
  27. Madon, M. Chapter 19 North Luconia Province. In The Petroleum Geology of 905 Malaysia; PETRONAS: Kuala Lumpur, Malaysia, 1999. [Google Scholar]
  28. Savva, D.; Pubellier, M.; Franke, D.; Chamot-Rooke, N.; Meresse, F.; Steuer, S.; Auxietre, J.L. Different expressions of rifting on the South China Sea margins. Mar. Pet. Geol. 2014, 58, 579–598. [Google Scholar] [CrossRef]
  29. Kessler, F.; Jong, J. Paleogeography and carbonate facies evolution in NW Sarawak from the Late Eocene to the Middle Miocene. Warta Geologi 2016, 42, 1–9. [Google Scholar]
  30. Levell, B.K. The nature and significance of regional unconformities in the hydrocarbon-bearing Neogene sequence offshore West Sabbah. Bull. Persat. Geol. Malays. 1987, 21, 55–90. [Google Scholar]
  31. Lunt, P. Discussion on: A new upper Paleogene to Neogene stratigraphy for Sarawak and Labuan in northwestern Borneo: Paleogeography of the eastern Sundaland margin. Earth-Sci. Rev. 2019. [Google Scholar] [CrossRef]
  32. Madon, M. A brief review of gravity and magnetic data for Malaysia. Warta Geol. Bull. Geol. Soc. Malays. 2017, 43, 41–49. [Google Scholar]
  33. Sandwell, D.T.; Smith, W.H.F. Retracking ERS-1 altimeter waveforms for optimal gravity field recovery. Geophys. J. Int. 2005, 163, 79–89. [Google Scholar] [CrossRef] [Green Version]
  34. Sandwell, D.T.; Smith, W.H.F. Global marine gravity from retracked Geosat and ERS-1 altimetry: Ridge segmentation versus spreading rate. J. Geophys. Res. Solid Earth 2009, 114. [Google Scholar] [CrossRef] [Green Version]
  35. Sandwell, D.T.; Smith, W.H.F. Marine gravity anomaly from Geosat and ERS 1 satellite altimetry. J. Geophys. Res. Solid Earth 1997, 102, 10039–10054. [Google Scholar] [CrossRef] [Green Version]
  36. Nabighian, M.N.; Ander, M.E.; Grauch, V.J.S.; Hansen, R.O.; LaFehr, T.R.; Li, Y.; Pearson, W.C.; Peirce, J.W.; Phillips, J.D.; Ruder, M.E. Historical Development of the gravity method in exploration. Geophysics 2005, 70, 28. [Google Scholar] [CrossRef] [Green Version]
  37. Christensen, A.N.; Andersen, O.B. Comparison of Satellite Altimetric Gravity and Ship-borne Gravity-Offshore Western Australia, ASEG Extended Abstracts. In Proceedings of the ASEG-PESA-AIG 2016 25th Geophysical Conference & Exhibition, Adelaide, Australia, 21–24 August 2016. [Google Scholar]
  38. DSMM. Airborne Gravity Survey and Geoid Determination Project for Peninsular Malaysia, Sabah and Sarawak; Geodetic Division, Department of Survey and Mapping: Kuala Lumpur, Malaysia, 2003. [Google Scholar]
  39. DSMM. The Conduct of Airborne Gravity and Magnetic Survey over Selected Area Near the International Maritime Boundary Offshore Sabah and Sarawak, Phase I/II (2014–2017); Geodetic Divisiion: Kuala Lumpur, Malaysia, 2017. [Google Scholar]
  40. Jamil, H.; Kadir, M.; Forsberg, R.; Olesen, A.; Isa, M.N.; Rasidi, S.; Mohamed, A.; Chihat, Z.; Nielsen, E.; Majid, F.; et al. Airborne geoid mapping of land ans sea areas of East Malaysia. J. Geol. Sci. 2017, 7, 84–93. [Google Scholar]
  41. BellGeospace. Air-FTG® Acquisition and Processing Report Petronas Central Luconia Survey, Sarawak, Malaysia; Bell Geospace Limited: Edinburgh, UK, 2014. [Google Scholar]
  42. Murphy, C.A. The Air-FTG™ Airborne Gravity Gradiometer System. In Airborne Gravity Conference 2004-Abstracts from ASEG-PESA Airborne Gravity 2004 Workshop; Geoscience Australia: Sydney, Australian, 2004. [Google Scholar]
  43. Murphy, C.A.; Brewster, J. Target Delineation Using Full Tensor Gravity Gradiometry Data; Australian Society of Exploration Geophyscists (ASEG): Perth, WA, Australia, 2007; pp. 1–3. [Google Scholar]
  44. Buckingham, A. Magnetic & FTG Gravity Training Course (Day 3) Session 1; Fathom Geophysics: Kuala Lumpur, Malaysia, 2015; p. 42. [Google Scholar]
  45. Murphy, C.A.; Brewster, J.; Robinson, J. Evaluating Air-FTG® Survey Data: Bringing Value to the Full Picture; Australian Society of Exploration Geophysicists: Sydney, Australia, 2007; pp. 24–28, in preview. [Google Scholar]
  46. Isles, D.J.; Rankin, L.R. Geological Interpretation of Aeromagnetic Data; Krester, A.D., Writing, R., Eds.; CSIRO Publishing: Perth, Australia, 2013; p. 365. [Google Scholar]
  47. Buckingham, A. Magnetic and FTG Training Course (Day 3) Session 2; Fathom Geophysics: Kuala Lumpur, Malaysia, 2015; p. 25. [Google Scholar]
  48. Milligan, P.; Gunn, P. Enhancement and presentation of airborne geophysical data. AGSO J. Aust. Geol. Geophys. 1997, 17, 63–75. [Google Scholar]
  49. Al-Ibiari, M.G.; Ismail, A.A.; El-Khafeef, A.A.; Basheer, A.A.; El-laban, A.M.; Tarek, Y. Analysis and interpretation of aeromagnetic data for Wadi Zeidun area, Central Eastern Desert, Egypt. Egypt. J. Pet. 2018, 27, 285–293. [Google Scholar] [CrossRef]
  50. Yong Technology Inc. GeoRose; Yong Technology Inc.: Edmonton, AB, Canada, 2014. [Google Scholar]
  51. Pubellier, M.; Aurelio, M.; Sapin, F. Structural Map of the South China Sea; Commission for the Geological Map of the World: Paris, France, 2017. [Google Scholar]
  52. Ali, M.Y. An Integrated Analysis of the Depositional Control, Sedimentology and Diagenesis of Cenozoic Carbonates from the Sarawak Basin, East Malaysia; Department of Earth Science and Engineering, Imperial College of London: London, UK, 2013. [Google Scholar]
  53. Araffa, S.A.S.; El-bohoty, M.; Heleika, M.A.; MMekkawi, M.; Ismail, E.; Khalil, A.; EL-Razak, E.M.A. Implementation of magnetic and gravity methods to delineate the subsurface structural features of the basement in central Sinai area, Egypt. NRIAG J. Astron. Geophys. 2018, 7, 162–174. [Google Scholar] [CrossRef]
  54. BellGeospace. FTG Shows Sensitivity to Carbonate Composition. Available online: https://www.bellgeo.com/case-studies/malaysia-carbonates (accessed on 5 January 2021).
  55. Clift, P.; Lee, G.H.; Anh Duc, N.; Barckhausen, U.; Van Long, H.; Zhen, S. Seismic reflection evidence for a Dangerous Grounds miniplate: No extrusion origin for the South China Sea. Tectonics 2008, 27. [Google Scholar] [CrossRef]
  56. Phach, P.V.; Anh, L.D. Tectonic evolution of the southern part of Central Viet Nam and the adjacent area. Geodyn. Tectonophys. 2018, 9, 801–825. [Google Scholar] [CrossRef] [Green Version]
  57. Vu, A.T.; Wessel Fyhn, M.B.; Xuan, C.T.; Nguyen, T.T.; Hoang, D.N.; Pham, L.T.; Van, H.N. Cenozoic tectonic and stratigraphic development of the Central Vietnamese continental margin. Mar. Pet. Geol. 2017, 86, 386–401. [Google Scholar] [CrossRef]
  58. Fyhn, M.B.W.; Boldreel, L.O.; Nielsen, L.H. Geological development of the Central and South Vietnamese margin: Implications for the establishment of the South China Sea, Indochinese escape tectonics and Cenozoic volcanism. Tectonophysics 2009, 478, 184–214. [Google Scholar] [CrossRef]
  59. Baillie, P.; Darman, H.; Fraser, T.H. Deformation of Cenozoic Basins of Borneo and West Sulawesi. In Proceedings of the Deepwater and Frontier Exploration, in Asia & Australasia Symposium, Indonesian Petroleum Association, Jakarta, Indonesia, 7–8 December 2004. [Google Scholar]
  60. Nainggolan, H.B.; Argakoesoemah, R.I.; Wahyudi, I.; Hidayat, A.; Shahab, M.F. Structural Description of Adang Fault, Makssar Strait, Indonesia. In Proceedings of the Thirty-Ninth Annual Convenction & Exhibition, Indonesia: Indonesian Petroleum Association, Jakarta, Indonesia, 20–22 May 2015. [Google Scholar]
  61. Witts, D.; Davies, L.; Morley, R.J.; Anderson, L. Neogene Deformation of East Kalimantan: A regional perspective. In Proceedings of the Thirty-Ninth Annual Convention & Exhibition, Indonesia: Indonesian Petroleum Association, Jakarta, Indonesia, 20–22 May 2015. [Google Scholar]
Figure 1. (A) Locality map showing the offshore Sarawak and coverage of the Air-FTG® survey. (B) Airborne-gravity survey under MyGeoid Project by the government of Malaysia (H. Jamil et al., 2017). (C) Survey area for Air-FTG® conducted by Bell Geospace and utilized in this study. Top carbonate map for Cycle IV-V limestone is overlaid with the survey area, the seismic profiles and exploration wells. Only three regional seismic lines are presented in this paper (labelled as Line 1014, 1004 and 1008). All datasets presented in (C) are courtesy of Malaysian Petroleum Management (MPM), PETRONAS.
Applsci 11 05095 g001
Figure 2. (A) Simplified stratigraphy chart of offshore Sarawak, particularly in Central Luconia Province adapted from [2] showing major seismic facies correlated with the Cycles nomenclature. BOU is Base Oligocene Unconformity; BMU is Base Miocene Unconformity; MMU is Middle Miocene Unconformity; LU is Lapan Unconformity; (B) Seismic stratigraphy from seismic line 1008 (refer Figure 1 for line location); (C) Seismic stratigraphy from seismic line 1009 (not shown in Figure 1 as the seismic is outside the Air-FTG coverage area).
Applsci 11 05095 g002
Figure 3. (A) Five independent directions which are Tyx, Tyy, Tyz, Txz, and Tzz tensor components from Air-FTG® data (edited from [42]. (B) Profiles showing magnetic responses for a source of the same size at different latitudes in the northern hemisphere. The effect is reversed in the southern hemisphere due to a negative inclination. (A) A symmetric response is observed at the pole. (Bi-Bv) The anomalous magnetic response becoming more asymmetric away from the poles. (B) The response is to finally flatten or reverse at equatorial regions.
Applsci 11 05095 g003
Figure 4. Summary of interpretation workflow for airborne gravity and aeromagnetic data utilized in this study.
Applsci 11 05095 g004
Figure 5. (A) Total Magnetic Intensity Reduce to Equator (TMI_RTE) represents magnetic basement. (B) Lineaments/Structural trend interpretation on TMI_RTE. (C) Rose plot diagram for interpreted structural trend in (B). The eclipse on (B) is representing possible folding structures on the basement (obvious anticline closure on TMI_RTE. (D) First derivative of TMI_RTE known as TMI_RTE_1vd represents section shallower than the basement. (E) Lineaments/ Structural trend interpretation on TMI_RTE_1vd. (F) Rose plot diagram for interpreted structural trend in (E). Red arrows are pointing to the structural trends that are more prominent in either TMI_RTE data and rectangle in (E) is highlighting the complex faults within the low magnetic zone in the south of the area.
Applsci 11 05095 g005
Figure 6. This figure highlights the interpretation on regional analytical signal of original aeromagnetic data from TMI_RTE. (A) Analytical signal (Regional) for >20 km wavelength. (B) The interpretation of structural trend based on (A). (C) Rose plot diagram for interpreted structural trend in (B), showing NW-SE, E-W and NE-SW orientations. (D) Analytical signal (Regional) for >50 km wavelength. (E) The interpretation of structural trend based on (D). (F) Rose plot diagram for interpreted structural trend in (E), showing NW-SE to E-W orientations.
Applsci 11 05095 g006
Figure 7. This figure highlights the interpretation on residual analytical signal of original aeromagnetic data from TMI_RTE. (A) Analytical signal (Residual) for >20 km wavelength. (B) The interpretation of structural trend based on (A). (C) Rose plot diagram for interpreted structural trend in B, showing distinct E-W direction. (D) Analytical signal (Residual) for >50 km wavelength. (E) The interpretation of structural trend based on (D). (F) Rose plot diagram for interpreted structural trend in (E), showing NE-SW, E-W and NW-SE directions.
Applsci 11 05095 g007
Figure 8. Anomaly map for FTG Tzz (high frequency) data; (A) Anomaly map for FTG_Tz. (B) Interpretation of structural trends on FTG_Tzz. (C) Rose plot diagram for FTG_Tzz showing dominant orientation in NW-SE direction. (D) Anomaly map for FTG_Tz (low frequency) data; (E) Interpretation of structural trends on FTF_Tz; (F) Rose plot diagram for FTG_Tz showing orientations in WNW-ESE and NE-SW with minor NW-SE.
Applsci 11 05095 g008
Figure 9. (A) Anomaly map of FTG_Txz domain; (B) Interpretation of structural trend on FTG_Txz data; (C) Rose plot diagram of interpreted structural trends for FTG_Txz showing NNW-SSE orientation. (D) Anomaly map of FTG_Tyz domain; (E) Interpretation of structural trend on FTG_Txz data; (F) Rose plot diagram of interpreted structural trends for FTG_Tyz showing NW-SE to E-W orientations.
Applsci 11 05095 g009
Figure 10. Air-FTG data processed through Contact Lineament Processing (CLP) filter that allows a slicing at different frequencies and wavelengths to capture data at variable depth ranges. (A) CLP Map for wavelength 5–20 km; (B) Interpretation of structural trend on CLP map of (A); (C) Rose plot diagram representing NE-SW to N-S orientations from the interpreted structural trends in (B). (D) CLP Map for wavelengths 20–50 km; (E) Interpretation of structural trend on CLP map of (D); (F) Rose plot diagram representing many directions for the structural trends interpreted in (E), with dominant broad NW-SE trend. (H) CLP Map for wavelength 50–100 km; (I) Interpretation of structural trend on CLP map of (H). (G) Rose plot diagram representing NW-SE to NNW-SSE orientation from interpretation in (I). The rectangle is representing the circular structure discuss in text and the red arrows are highlighting the NE-SW trend that consistently appearing at all depth ranges and should be treated with cautious.
Applsci 11 05095 g010
Figure 11. (A) Location of the depth profile X-X’ and seismic lines 1004 & 1014. (B) Depth profile X-X’ oriented in NW-SE. (C,D) Uninterpreted seismic sections for line 1004 and 1014 respectively. (E,F) Interpreted seismic for line 1004 and 1014, respectively. The blue and orange arrows are highlighting similar features pointed on the depth profiles and on seismic data. The seismic lines are marginally longer than the depth profile X-X’. The interception point for the depth profiles and seismic lines are pointed by black arrow at the top of images in (BF).
Applsci 11 05095 g011
Figure 12. (A) Location of depth profile Y-Y’ and seismic line 1008. (B) Depth profile Y-Y’. (C) Uninterpreted section of seismic line 1008. (D) Interpreted section of seismic line 1008. The blue and orange arrows are pointed to similar geological features interpreted on the depth profile and the seismic data. The seismic lines are marginally longer that profile Y-Y’ and change its orientation to NE-SW direction. The intersection points where both data are comparable is marked by the black arrows. The dash-line rectangles in (C,D) is to point out the section of circular structure/depressional area in Figure 11B.
Applsci 11 05095 g012
Figure 13. (A) Regional tectonic map, highlighting major faults in Borneo and Indochina that oriented in NW-SE direction, similarly striking in the same direction with West Baram Line and West Balingian Line that bounded Luconia Province. Faults in red color are mentioned in the text. (B) Faults of Central Luconia as published in [51,52]. (C) Areas (A,B) representing zones for basement high and hydrocarbon prospect respectively. The areas are classified based on the airborne gravity-aeromagnetic response. Faults interpreted from Tz and TMI_RTE are overlay with the map to show the NW-SE faults that oriented in the same direction as other regional faults presented in Map (A) and E-W fault that has possibility to represent the southern boundary of the Palawan Through.
Applsci 11 05095 g013
Table 1. Data components derived from the Air-FTG® acquisition and their purposes in geological interpretation.
NoData TypeUnitPurposeShort Form
1Total Magnetic Intensity (Reduced to Equator) nTHighlight magnetic zonationTMI_RTE
21st vertical derivative of TMI-RTEnT/mBetter resolution of magnetic zonationTMI_RTE_1vd
3Analytical Signal of the first derivativesnT/mCaptures the response of all magnetic bodies whether they are reversely magnetised or not.RTE_AS_20res
RTE_AS_20reg
RTE_AS_50res
RTE_AS_50reg
4Computed Free Air Gravity (levelled and noise reduce) for depth (Z) tensor mGalStructural trends at depth (Txz & Tyz) and changes in density of the rocks at subsurface (Tzz)Tz, Tzz, Txz, Tyz
5Contact Lineament Processed (variable wavelengths)Eotvos/mFrequency slicing targeting structures at different depths.CLP_short/CLP_long/CLP_int
Table 2. Major and minor structural trends recorded from aeromagnetic and airborne gravity data in Central Luconia Province.
NoTensor DataDepth RangesMajor TrendMinor Trend
Aeromagnetic
1TMI_RTEMagnetic basementNW-SE and NE-SW E-W
2TMI_RTE_1vdShallower than magnetic basement E-W and NWW-SEE E-W
3RTE_AS_20regionalMagnetic basementE-W and NNW-SSE NW-SE
4RTE_AS_50regionalMagnetic basementE-W and NWW-SEE NW-SE
5RTE_AS_20residualMagnetic basementE-W
6RTE_AS_50residualMagnetic basementE-W and NWW-SEE
Airborne Gravity
7TzDeep (low frequency)NW-SE and NE-SWAll directions
8TzzShallow (high frequency)NW-SE and ENE-WSWNNE-SSW
9TxzIntermediate- ShallowNW-SE to N-SNE-SW
10TyzIntermediate- ShallowNW-SE to E-WNE-SW
11CLP_short2.5 to 10 kmNE-SW to E-WNE-SW
12CLP_intermediate10 to 25 kmBroad NW-SEAll directions
13CLP_long25 to 55 kmNW-SE to NNW-SSENE-SW
Publisher’s Note: MDPI stays neutral with regard to jurisdictional claims in published maps and institutional affiliations.