
Photovoltaic Prediction Software: Evaluation with Real Data from Northern Spain

 ,
,  ,
, 
Abstract
:Featured Application
Abstract
1. Introduction
2. Methodology
2.1. PVGIS
2.2. PVSYST
2.3. System Advisor Model (SAM)
2.4. RETSCREEN
2.5. PV*SOL
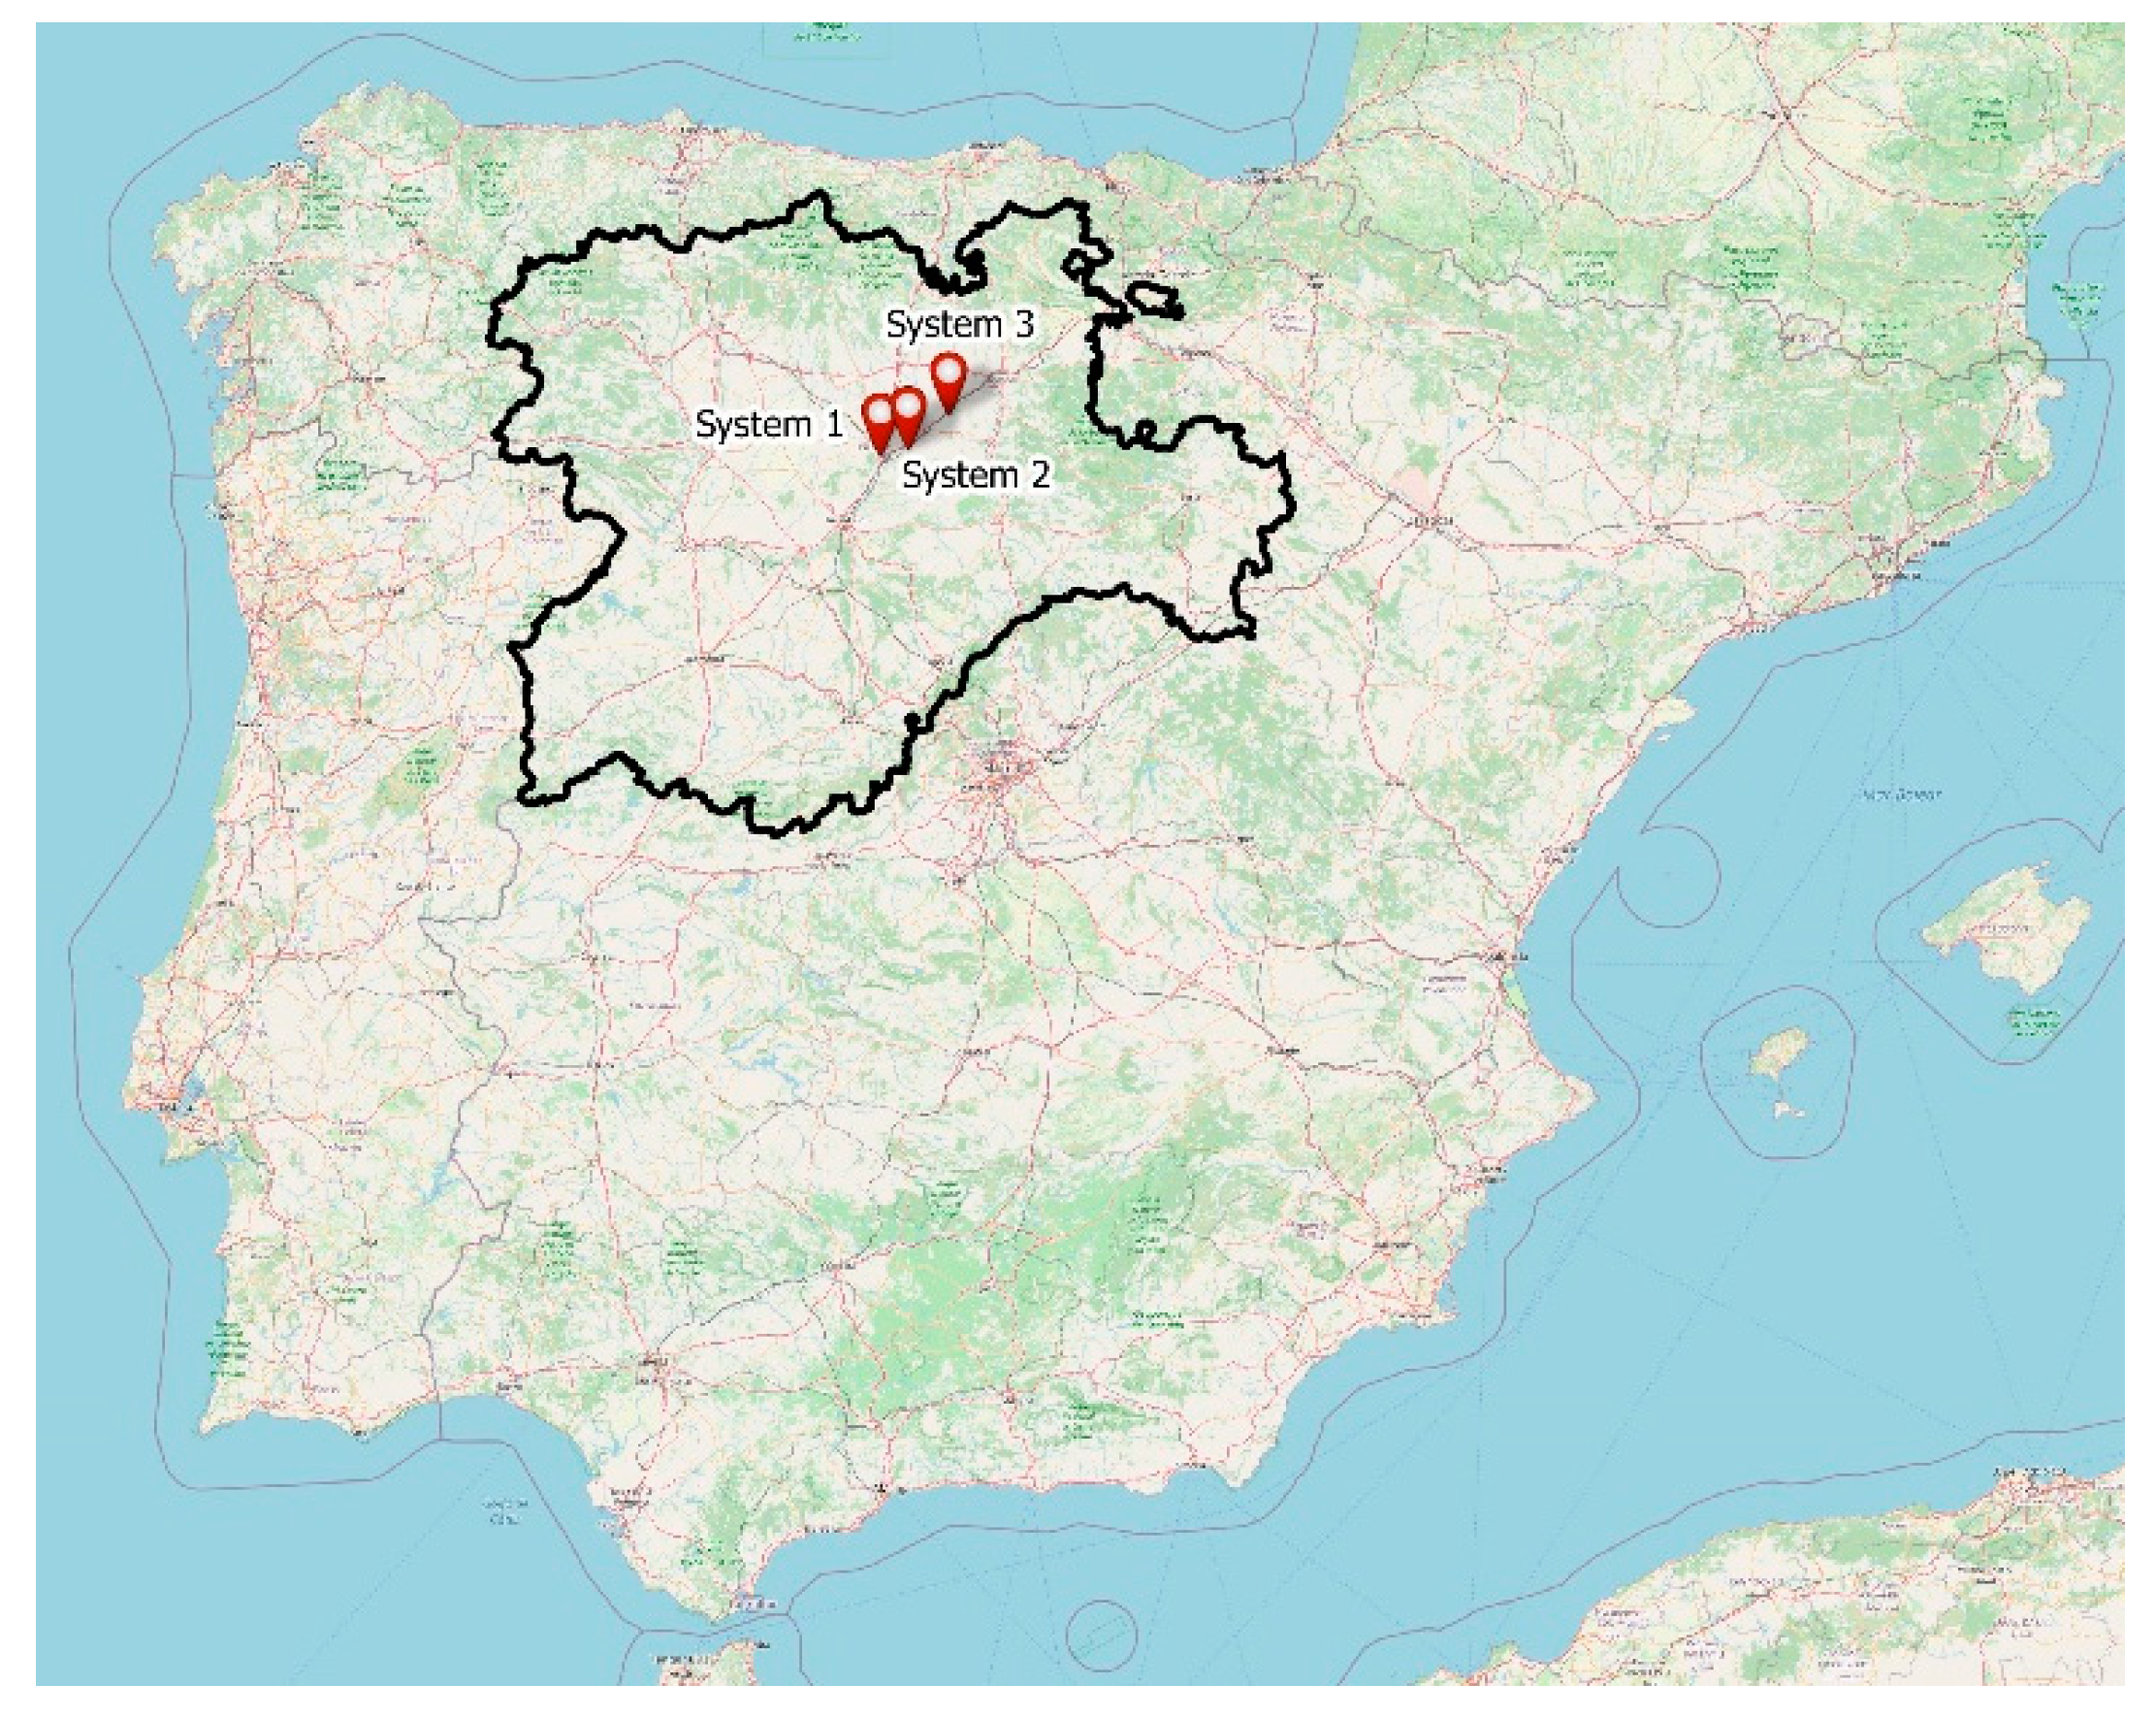
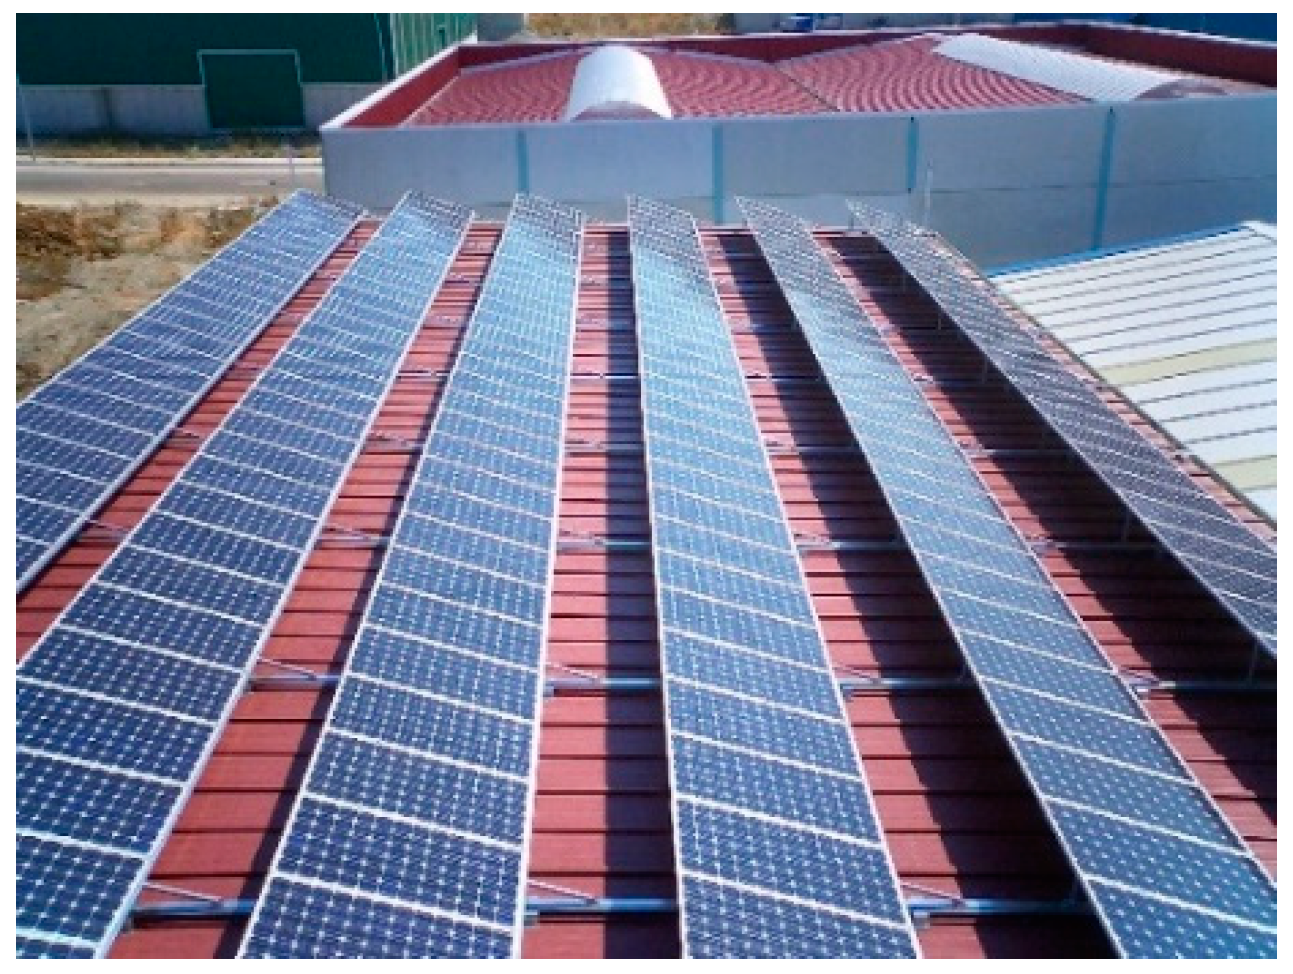
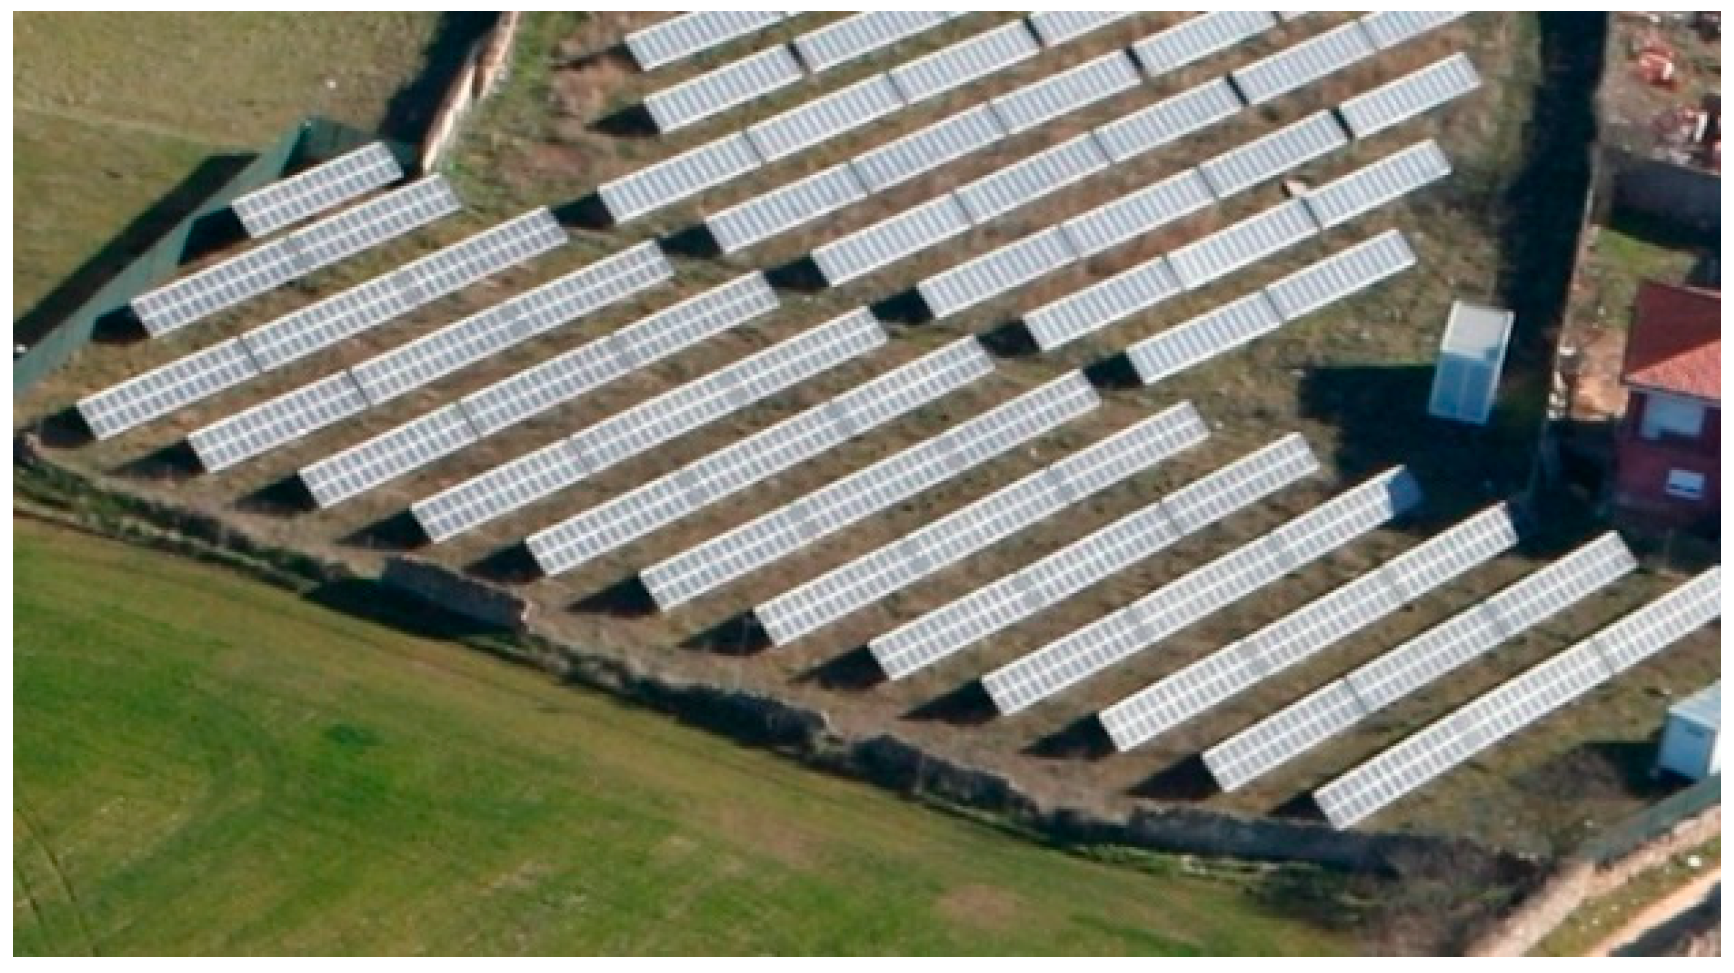
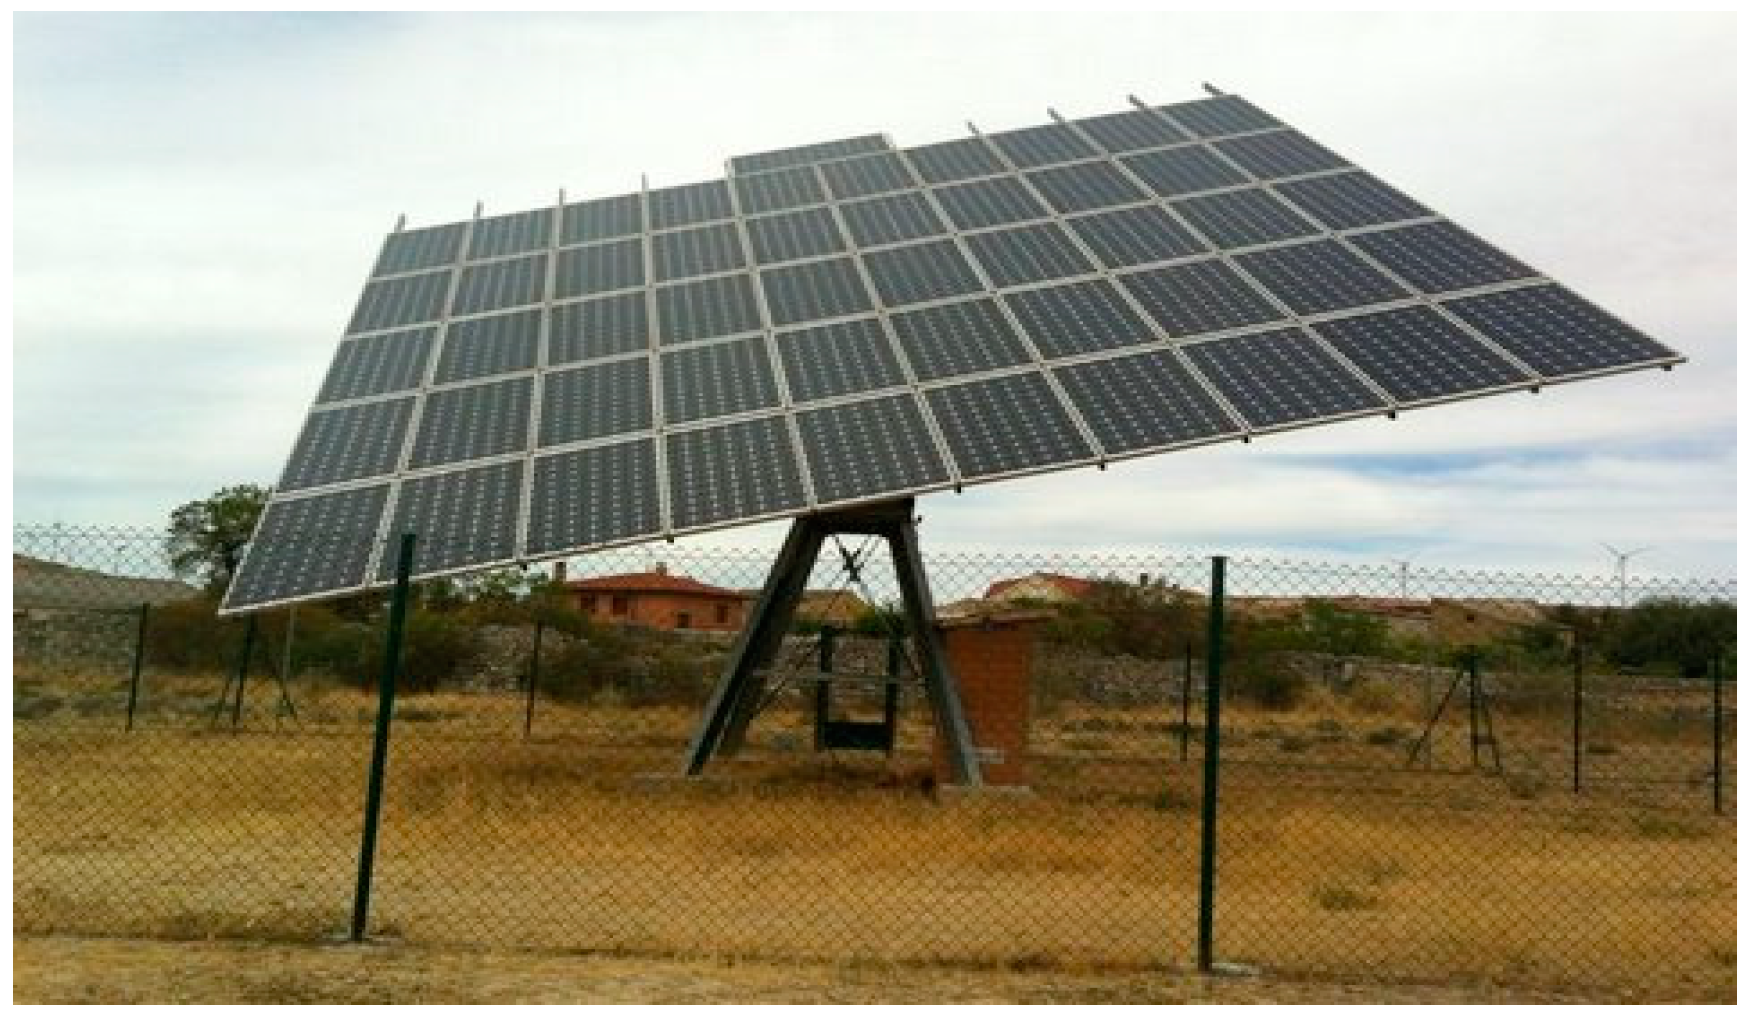
3. The Facilities
Real Exported Energy Data
4. Results and Discussion
Monthly Results
5. Conclusions
Author Contributions
Funding
Institutional Review Board Statement
Informed Consent Statement
Conflicts of Interest
References
- IEA (Internaional Energy Agency). World Energy Outlook-2017; IEA (Internaional Energy Agency): Paris, France, 2017. [Google Scholar]
- Connolly, D.; Lund, H.; Mathiesen, B.V.; Leahy, M. A review of computer tools for analysing the integration of renewable energy into various energy systems. Appl. Energy 2010, 87, 1059–1082. [Google Scholar] [CrossRef]
- Wijeratne, W.M.P.U.; Yang, R.J.; Too, E.; Wakefield, R. Design and development of distributed solar PV systems: Do the current tools work? Sustain. Cities Soc. 2019, 45, 553–578. [Google Scholar] [CrossRef]
- Lee, G.R.; Frearson, L.; Rodden, P. An Assessment of Photovoltaic Modelling Software Using Real World Performance Data. In Proceedings of the 26th European Photovoltaic Solar Energy Conference and Exhibition, Hamburg, Germany, 5–6 September 2011; pp. 4339–4343. [Google Scholar]
- Axaopoulos, P.J.; Fylladitakis, E.D.; Gkarakis, K. Accuracy analysis of software for the estimation and planning of photovoltaic installations. Int. J. Energy Environ. Eng. 2014, 5, 1. [Google Scholar] [CrossRef] [Green Version]
- Freeman, J.; Whitmore, J.; Blair, N.; Dobos, A.P. Validation of multiple tools for flat plate photovoltaic modeling against measured data. In Proceedings of the 2014 IEEE 40th Photovoltaic Specialist Conference (PVSC), Denver, CO, USA, 8–13 June 2014; pp. 1932–1937. [Google Scholar]
- Freeman, J.; Whitmore, J.; Kaffine, L.; Blair, N.; Dobos, A.P. System Advisor Model: Flat Plate Photovoltaic Performance Modeling Validation Report. NREL 2013, 129. [Google Scholar] [CrossRef] [Green Version]
- de Souza Silva, J.L.; Costa, T.S.; de Melo, K.B.; Sako, E.Y.; Moreira, H.S.; Villalva, M.G. A Comparative Performance of PV Power Simulation Software with an Installed PV Plant. In Proceedings of the 2020 IEEE International Conference on Industrial Technology (ICIT), Buenos Aires, Argentina, 26–28 February 2020; pp. 531–535. [Google Scholar]
- Photovoltaic Geographical Information System (PVGIS) | EU Science Hub. Available online: https://ec.europa.eu/jrc/en/pvgis (accessed on 9 May 2021).
- PVsyst—Logiciel Photovoltaïque. Available online: https://www.pvsyst.com/ (accessed on 9 May 2021).
- RETScreen. Available online: https://www.nrcan.gc.ca/maps-tools-and-publications/tools/modelling-tools/retscreen/7465 (accessed on 9 May 2021).
- Valentin Software PV*SOL. Available online: https://valentin-software.com/en/products/pvsol-premium/ (accessed on 9 May 2021).
- NREL System Advisor Model (SAM). Available online: https://sam.nrel.gov/ (accessed on 9 May 2021).
- Šúri, M.; Huld, T.A.; Dunlop, E.D. PV-GIS: A web-based solar radiation database for the calculation of PV potential in Europe. Int. J. Sustain. Energy 2005, 24, 55–67. [Google Scholar] [CrossRef]
- TamizhMani, G.; Ishioye, J.-P.; Voropayev, A.; Kang, Y. Photovoltaic performance models: An evaluation with actual field data. In Proceedings of the Reliability of Photovoltaic Cells, Modules, Components, and Systems SPIE, San Diego, CA, USA, 11–13 August 2008; Volume 7048, p. 70480W. [Google Scholar]
- Djurdjevic, D.Z. Perspectives and assessments of solar PV power engineering in the Republic of Serbia. Renew. Sustain. Energy Rev. 2011, 15, 2431–2446. [Google Scholar] [CrossRef]
- Hofierka, J.; Kaňuk, J. Assessment of photovoltaic potential in urban areas using open-source solar radiation tools. Renew. Energy 2009, 34, 2206–2214. [Google Scholar] [CrossRef]
- Huld, T.; Müller, R.; Gambardella, A. A new solar radiation database for estimating PV performance in Europe and Africa. Sol. Energy 2012, 86, 1803–1815. [Google Scholar] [CrossRef]
- Conceição, R.; Silva, H.G.; Fialho, L.; Lopes, F.M.; Collares-Pereira, M. PV system design with the effect of soiling on the optimum tilt angle. Renew. Energy 2019, 133, 787–796. [Google Scholar] [CrossRef]
- Ozdemir, S.; Sahin, G. Multi-criteria decision-making in the location selection for a solar PV power plant using AHP. Meas. J. Int. Meas. Confed. 2018, 129, 218–226. [Google Scholar] [CrossRef]
- Kumar, N.M.; Kumar, M.R.; Rejoice, P.R.; Mathew, M. Performance analysis of 100 kWp grid connected Si-poly photovoltaic system using PVsyst simulation tool. In Proceedings of the Energy Procedia; Elsevier Ltd.: Abingdon, UK, 2017; Volume 117, pp. 180–189. [Google Scholar]
- Afanasyeva, S.; Bogdanov, D.; Breyer, C. Relevance of PV with single-axis tracking for energy scenarios. Sol. Energy 2018, 173, 173–191. [Google Scholar] [CrossRef]
- Kumar, N.M.; Gupta, R.P.; Mathew, M.; Jayakumar, A.; Singh, N.K. Performance, energy loss, and degradation prediction of roofintegrated crystalline solar PV system installed in Northern India. Case Stud. Therm. Eng. 2019, 13, 100409. [Google Scholar] [CrossRef]
- Perez, R.; Seals, R.; Ineichen, P.; Stewart, R.; Menicucci, D. A new simplified version of the perez diffuse irradiance model for tilted surfaces. Sol. Energy 1987, 39, 221–231. [Google Scholar] [CrossRef] [Green Version]
- Hay, J.E. Calculation of monthly mean solar radiation for horizontal and inclined surfaces. Sol. Energy 1979, 23, 301–307. [Google Scholar] [CrossRef]
- Tsai, S.C.; Chen, S.C.; Huang, K.F.; Hsu, C.H.; Liu, W.C.; Yu, C.C.; Chung, Y.N.; Chen, T.R. A new development of power converter for power management. ICIC Express Lett. 2011, 5, 3273–3277. [Google Scholar]
- Praveen, R.P.; Abdul Baseer, M.; Awan, A.B.; Zubair, M. Performance Analysis and Optimization of a Parabolic Trough Solar Power Plant in the Middle East Region. Energies 2018, 11, 741. [Google Scholar] [CrossRef] [Green Version]
- Okoye, C.O.; Bahrami, A.; Atikol, U. Evaluating the solar resource potential on different tracking surfaces in Nigeria. Renew. Sustain. Energy Rev. 2018, 81, 1569–1581. [Google Scholar] [CrossRef]
- Marion, W.; Urban, K. User’s Manual for TMY2s (Typical Meteorological Years)—Derived from the 1961–1990 National Solar Radiation Data Base; National Renewable Energy Lab. (NREL): Golden, CO, USA, 1995. [Google Scholar] [CrossRef] [Green Version]
- Weather Data for Simulation | EnergyPlus. Available online: https://energyplus.net/weather/simulation (accessed on 9 May 2021).
- Perez, R.; Ineichen, P.; Seals, R.; Michalsky, J.; Stewart, R. Modeling daylight availability and irradiance components from direct and global irradiance. Sol. Energy 1990, 44, 271–289. [Google Scholar] [CrossRef] [Green Version]
- Reindl, D.T. Estimating Diffuse Radiation on Horizontal Surfaces and Total Radiation on Tilted Surfaces; University of Wisconsin: Madison, WI, USA, 1988. [Google Scholar]
- Bakos, G.C. Distributed power generation: A case study of small scale PV power plant in Greece. Appl. Energy 2009, 86, 1757–1766. [Google Scholar] [CrossRef]
- Bakos, G.C.; Soursos, M. Techno-economic assessment of a stand-alone PV/hybrid installation for low-cost electrification of a tourist resort in Greece. Appl. Energy 2002, 73, 183–193. [Google Scholar] [CrossRef]
- EL-Shimy, M. Viability analysis of PV power plants in Egypt. Renew. Energy 2009, 34, 2187–2196. [Google Scholar] [CrossRef]
- Zandi, M.; Bahrami, M.; Eslami, S.; Gavagsaz-Ghoachani, R.; Payman, A.; Phattanasak, M.; Nahid-Mobarakeh, B.; Pierfederici, S. Evaluation and comparison of economic policies to increase distributed generation capacity in the Iranian household consumption sector using photovoltaic systems and RETScreen software. Renew. Energy 2017, 107, 215–222. [Google Scholar] [CrossRef]
- Rehman, S.; Ahmed, M.A.; Mohamed, M.H.; Al-Sulaiman, F.A. Feasibility study of the grid connected 10 MW installed capacity PV power plants in Saudi Arabia. Renew. Sustain. Energy Rev. 2017, 80, 319–329. [Google Scholar] [CrossRef]
- García, I.; Torres, J.L. Temporal downscaling of test reference years: Effects on the long-term evaluation of photovoltaic systems. Renew. Energy 2018, 122, 392–405. [Google Scholar] [CrossRef]
- Reindl, D.T.; Beckman, W.A.; Duffie, J.A. Evaluation of hourly tilted surface radiation models. Sol. Energy 1990, 45, 9–17. [Google Scholar] [CrossRef]
- Klucher, T.M. Evaluation of models to predict insolation on tilted surfaces. Sol. Energy 1979, 23, 111–114. [Google Scholar] [CrossRef]
- Hay, J.E. Calculating solar radiation for inclined surfaces: Practical approaches. Renew. Energy 1993, 3, 373–380. [Google Scholar] [CrossRef]
- Liu, B.; Jordan, R. Daily insolation on surfaces tilted towards equator. ASHRAE J. 1961, 10, 5047843. [Google Scholar]
- Meteotest Meteonorm Software Worldwide Irradiation Data. Available online: https://meteonorm.com/en/ (accessed on 9 May 2021).


| PVGIS | PVSYST | SAM | PV*SOL | RETScreen | |
|---|---|---|---|---|---|
| Solar Radiation Database | Very complete for Europe, Africa and Asia. Satellite data interpolation models. | 12 databases of different locations. User expandable theoretical models. | User defined expandable online search. Theoretical models. | Meteonorm. German Weather Service (DWD). | NASA. User expandable. |
| Product library: PV module and inverter | No | Very complete and expandable | Complete | Very complete and expandable | Outdated |
| Inputs required | Very few | Many | Many | Many | Few |
| Output Results | Basic results | Many energy-related and economical results | Many energy-related and economical results | Many energy-related and economic results | Basic energy-related and economic results |
| PV facility design | Simple | Complete | Simple/Complete | Complete | Simple |
| Losses/shadows | Yes/No | Yes/Yes | Yes/Yes | Yes/Yes | Yes/No |
| Difficulty | Low | Medium | Medium/High | Medium/High | Low/Medium |
| Cost | Free | 600 CHF/year (30 Day Trial) | Free | 895 € (30 Day Trial) | 869 €/year (Demo) |
| System 1 (Palencia) | System 2 (Torquemada) | System 3 (Los Balbases) | |
|---|---|---|---|
| Sea Level (m) | 740 m | 742 m | 800 m |
| Longitude | 4°30′ W | 4°19′ W | 4°3′ W |
| Latitude | 42°0′ N | 42°2′ N | 42°12′ N |
| Panel model | Fotona 180D | BP-7185S | Sunport 72M |
| Vmax(V) | 36.8 | 36.5 | 35.89 |
| Imax (A) | 4.89 | 5.1 | 7.81 |
| WP (W) | 180 ± 1.3% | 185 ± 2.5% | 280 ± 3.0% |
| Performance (%) | 15% | 14–16% | 14% |
| Number of panels | 216 | 546 | 51 |
| Number of groups | 18 | 39 | 3 |
| Vgroup (V) | 441 | 511 | 610 |
| Facility Power (kW) | 38.88 | 101.01 | 14.28 |
| Inverter model | SMA: SMC 7000TL | Ingecom Sun 100 | SMA: Sunny Boy 4200TL HC |
| Maximum power (kW) | 7 | 100 | 4.4 |
| Number of inverters | 6 | 1 | 3 |
| Vcc (V) | 700 | 405–750 | 750 |
| Icc (A) | 22 | 286 | 22 |
| Vca (V) | 230 | 3 × 400 | 230 |
| Ica (A) | 31 | 187 | 19 |
| Performance (%) | 98 | 96.8 | 96 |
| Sun Tracking System | Fixed | 1-axis | 2-axis |
| Tilt angle or sun tracking limits | 20° | 15°/55° | −130°/130° 0°/80° |
| Orientation | South/180° | South/180° | - |
| kWh/Year | (kWh/Year)/ | |
|---|---|---|
| System 1 | 55,445 | 1426 |
| System 2 | 144,962 | 1435 |
| System 3 | 24,726 | 1732 |
| AC Energy Generated in a Year (kWh/kW) | |||||||
|---|---|---|---|---|---|---|---|
| P1 | T1 | L1 | |||||
| Actual Value | Average Year | 1426 kWh/kWp | 1435 kWh/kWp | 1732 kWh/kWp | |||
| Software | Options | kWh/ | Deviation | kWh/ | Deviation | kWh/ | Deviation |
| RETScreen | - | 1479 | 3.72% | 1547 | 7.79% | 1761 | 1.68% |
| SAM | ISOTROPIC | 1359 | −4.73% | 1435 | −0.04% | 1627 | −6.05% |
| HDKR | 1384 | −2.96% | 1485 | 3.47% | 1753 | 1.21% | |
| PEREZ | 1401 | −1.76% | 1507 | 5.01% | 1796 | 3.73% | |
| PVGIS | SARAH | 1439 | 0.93% | 1617 | 12.68% | 2073 | 19.73% |
| CMSAF | 1387 | −2.73% | 1581 | 10.15% | 1983 | 14.55% | |
| ERA5 | 1419 | −0.48% | 1586 | 10.49% | 2111 | 21.92% | |
| COSMO | 1302 | −8.70% | 1427 | −0.56% | 1752 | 1.19% | |
| PVSYST | New | 1413 | −0.95% | 1464 | 2.00% | 1953 | 12.80% |
| Classic | 1281 | −10.20% | 1321 | −7.93% | 1705 | −1.53% | |
| PV*SOL | - | 1580 | 10.80% | 1590 | 10.82% | 1855 | 7.12% |
| System 1 (FIX) [%] | |||||||||||
| Month | RETScreen | SAM | PVGIS | PVSYST | PV*SOL | ||||||
| Isotropic | HDKR | Perez | SARAH | CMSAF | ERA5 | COSMO | New | Classic | |||
| Jan | 21.1% | −5.0% | −0.2% | 1.8% | 9.8% | −3.5% | 6.6% | −3.8% | 0.6% | 1.0% | 18.1% |
| Feb | 2.2% | −12.3% | −8.7% | −7.3% | −1.3% | −10.1% | −5.1% | −12.8% | −5.4% | −16.8% | 4.7% |
| Mar | 7.6% | −9.0% | −6.6% | −5.4% | 2.1% | −2.4% | 1.3% | −6.3% | 2.6% | −1.7% | 5.4% |
| Apr | 4.0% | −6.1% | −4.7% | −3.5% | −2.2% | −7.2% | 1.3% | −8.0% | −5.0% | −9.9% | 10.7% |
| May | −1.9% | −5.1% | −4.5% | −3.3% | −4.8% | −6.3% | −3.2% | −9.4% | −7.4% | −12.6% | 8.3% |
| Jun | 6.3% | −1.1% | −1.0% | −0.1% | −2.0% | −3.4% | −3.3% | −7.2% | −0.9% | −9.3% | 10.9% |
| Jul | 1.5% | −0.6% | −0.3% | 0.7% | −1.0% | −1.6% | −2.7% | −8.1% | −0.7% | −12.9% | 12.4% |
| Ago | 0.5% | −0.7% | 0.3% | 1.3% | −0.5% | −2.0% | −1.8% | −8.6% | −1.3% | −13.2% | 13.7% |
| Sep | 0.3% | −9.6% | −7.6% | −6.7% | −1.2% | −2.7% | −2.5% | −13.0% | −0.8% | −12.6% | 6.0% |
| Oct | −6.5% | −7.9% | −4.8% | −3.8% | 0.3% | −2.1% | −1.0% | −14.7% | −1.8% | −10.3% | 9.5% |
| Nov | 16.8% | 8.4% | 13.6% | 15.3% | 15.8% | 6.8% | 7.2% | −7.0% | 10.2% | −2.5% | 31.0% |
| Dec | 18.9% | −12.6% | −7.9% | −5.3% | 28.8% | 16.1% | 17.1% | 2.6% | 16.0% | −11.1% | 9.7% |
| Average | 5.9% | −5.1% | −2.7% | −1.4% | 3.6% | −1.5% | 1.2% | −8.0% | 0.5% | −9.3% | 11.7% |
| System 2 (1 Axis) [%] | |||||||||||
| Month | RETScreen | SAM | PVGIS | PVSYST | PV*SOL | ||||||
| Isotropic | HDKR | Perez | SARAH | CMSAF | ERA5 | COSMO | New | Classic | |||
| Jan | 40.4% | 7.2% | 18.5% | 21.8% | 41.0% | 20.2% | 34.8% | 13.4% | 15.5% | 15.2% | 40.7% |
| Feb | 7.5% | −6.9% | 1.1% | 3.3% | 11.5% | 3.3% | 7.2% | −4.3% | 1.7% | −11.6% | 5.9% |
| Mar | 8.2% | −6.6% | −2.3% | −0.5% | 9.4% | 8.2% | 9.5% | −0.3% | 5.5% | 0.7% | 1.3% |
| Apr | 5.8% | −2.6% | −0.9% | 0.6% | 4.5% | 2.9% | 8.2% | −2.0% | −4.5% | −9.8% | 4.9% |
| May | −1.6% | −3.3% | −2.9% | −2.0% | 1.1% | 2.7% | 1.3% | −5.5% | −8.5% | −14.6% | 2.2% |
| Jun | 4.6% | −1.4% | −1.3% | −0.7% | 1.6% | 2.2% | −0.4% | −4.2% | −4.6% | −13.0% | 4.5% |
| Jul | 1.7% | 1.0% | 1.2% | 1.9% | 5.0% | 5.5% | 2.8% | −2.9% | −0.3% | −12.6% | 8.4% |
| Ago | 3.2% | 3.7% | 4.6% | 5.7% | 8.7% | 7.5% | 6.4% | −1.0% | 0.4% | −10.8% | 12.4% |
| Sep | 5.0% | −2.5% | 0.8% | 2.3% | 11.2% | 11.3% | 9.4% | −2.7% | 3.1% | −8.1% | 6.4% |
| Oct | −1.2% | 1.3% | 8.1% | 9.8% | 19.0% | 15.1% | 15.7% | -4.3% | 1.1% | −8.0% | 12.2% |
| Nov | 33.8% | 24.5% | 36.6% | 39.6% | 45.2% | 36.3% | 33.5% | 9.6% | 19.3% | 5.6% | 50.1% |
| Dec | 40.1% | −2.0% | 9.1% | 13.7% | 67.5% | 59.0% | 59.3% | 28.9% | 37.3% | 0.2% | 30.5% |
| Average | 12.3% | 1.0% | 6.0% | 8.0% | 18.8% | 14.5% | 15.6% | 2.1% | 5.5% | −5.6% | 14.9% |
| System 3 (2 Axis) [%] | |||||||||||
| Month | RETScreen | SAM | PVGIS | PVSYST | PV*SOL | ||||||
| Isotropic | HDKR | Perez | SARAH | CMSAF | ERA5 | COSMO | New | Classic | |||
| Jan | 13.3% | −14.6% | −4.2% | 2.4% | 36.2% | 14.8% | 48.8% | 11.6% | 21.9% | 23.0% | 22.9% |
| Feb | −4.8% | −15.9% | −6.4% | −3.5% | 27.6% | 10.2% | 26.7% | 3.5% | 17.2% | 3.3% | 2.4% |
| Mar | 3.0% | −8.0% | −0.2% | 2.2% | 23.1% | 17.7% | 26.9% | 6.8% | 21.0% | 14.4% | −1.2% |
| Apr | 3.3% | −10.7% | −4.6% | −2.5% | 15.9% | 8.9% | 24.6% | 1.4% | 8.8% | −0.6% | −7.7% |
| May | −11.8% | −14.0% | −8.8% | −6.3% | 8.2% | 6.2% | 10.9% | −3.4% | 2.1% | −9.2% | −7.2% |
| Jun | 0.3% | −1.8% | 3.8% | 5.6% | 11.5% | 10.4% | 14.4% | 0.0% | 9.3% | −4.3% | 10.4% |
| Jul | -1.4% | 1.9% | 7.9% | 10.3% | 17.1% | 17.7% | 17.2% | 2.5% | 11.9% | −7.5% | 17.0% |
| Ago | 2.4% | 3.9% | 10.8% | 11.9% | 17.2% | 16.2% | 17.0% | 0.2% | 9.7% | −9.5% | 17.0% |
| Sep | 8.6% | −6.1% | 1.1% | 3.9% | 17.9% | 15.9% | 17.5% | −2.9% | 11.8% | −4.6% | 5.8% |
| Oct | 0.6% | −8.2% | 0.6% | 3.4% | 21.9% | 17.0% | 24.3% | −4.7% | 13.1% | 0.9% | 5.1% |
| Nov | 25.2% | −2.2% | 10.0% | 13.4% | 34.9% | 19.7% | 32.5% | 0.5% | 22.9% | 9.4% | 17.8% |
| Dec | 4.1% | −15.4% | −4.3% | −0.9% | 55.3% | 36.9% | 55.0% | 14.3% | 36.7% | −1.0% | 14.2% |
| Average | 3.6% | −7.6% | 0.5% | 3.3% | 23.9% | 16.0% | 26.3% | 2.5% | 15.5% | 1.2% | 8.1% |
Publisher’s Note: MDPI stays neutral with regard to jurisdictional claims in published maps and institutional affiliations. |
© 2021 by the authors. Licensee MDPI, Basel, Switzerland. This article is an open access article distributed under the terms and conditions of the Creative Commons Attribution (CC BY) license (https://creativecommons.org/licenses/by/4.0/).
Share and Cite
González-Peña, D.; García-Ruiz, I.; Díez-Mediavilla, M.; Dieste-Velasco, M.I.; Alonso-Tristán, C. Photovoltaic Prediction Software: Evaluation with Real Data from Northern Spain. Appl. Sci. 2021, 11, 5025. https://doi.org/10.3390/app11115025
González-Peña D, García-Ruiz I, Díez-Mediavilla M, Dieste-Velasco MI, Alonso-Tristán C. Photovoltaic Prediction Software: Evaluation with Real Data from Northern Spain. Applied Sciences. 2021; 11(11):5025. https://doi.org/10.3390/app11115025
Chicago/Turabian StyleGonzález-Peña, David, Ignacio García-Ruiz, Montserrat Díez-Mediavilla, Mª. Isabel Dieste-Velasco, and Cristina Alonso-Tristán. 2021. "Photovoltaic Prediction Software: Evaluation with Real Data from Northern Spain" Applied Sciences 11, no. 11: 5025. https://doi.org/10.3390/app11115025