1. Introduction
A landslide is the movement of a mass of rock, debris or soil down a slope under the influence of gravity [
1,
2]. They are considered serious natural geological hazards in many areas of the world [
3,
4,
5]. Specifically, landslides are the second most notable geological disasters identified by the United Nations Development Program [
6]. In general, landslides are controlled by several pre-conditioning factors (e.g., morphology, lithology, structural environment, vegetation and land use) and are induced by different triggers (e.g., heavy rain, earthquakes, volcanic eruptions and marine storms) [
7,
8,
9,
10,
11]. Furthermore, as development expands into unstable hillside areas under the pressures of increasing population and urbanisation, human activity, such as deforestation or excavation of slopes for roads and construction sites, becomes an essential trigger of landslides [
12,
13,
14,
15].
As the most common natural geological hazard in mountainous areas, landslides often cause significant economic loss and human casualties [
16,
17]. For this reason, the evaluation of these phenomena has been a primary scientific duty in order to establish the zoning of the analysed territory and to identify the main objects exposed to risk [
18,
19]. These undertakings have received increasing amounts of attention from the scientific community in recent decades [
20,
21,
22]. Various qualitative, quantitative and empirical approaches have been proposed in the scientific literature to assess hazards and risks arising from landslides, rockfalls or slope instability [
23,
24,
25,
26,
27,
28].
One of the most often used methods is susceptibility mapping. The first landslide maps were prepared in the 1970s [
29,
30], and their elaboration still implies a certain degree of interpretation and correlations with various factors (e.g., topography, geomorphology, geotechnical properties and vegetation) [
31,
32,
33]. Susceptibility maps provide valuable information for disaster mitigation work and land planning strategies [
34]. This approach yields a more precise sustainability assessment that includes identifying high-vulnerability areas, risk analysis, security arrangements and stabilisation [
35,
36].
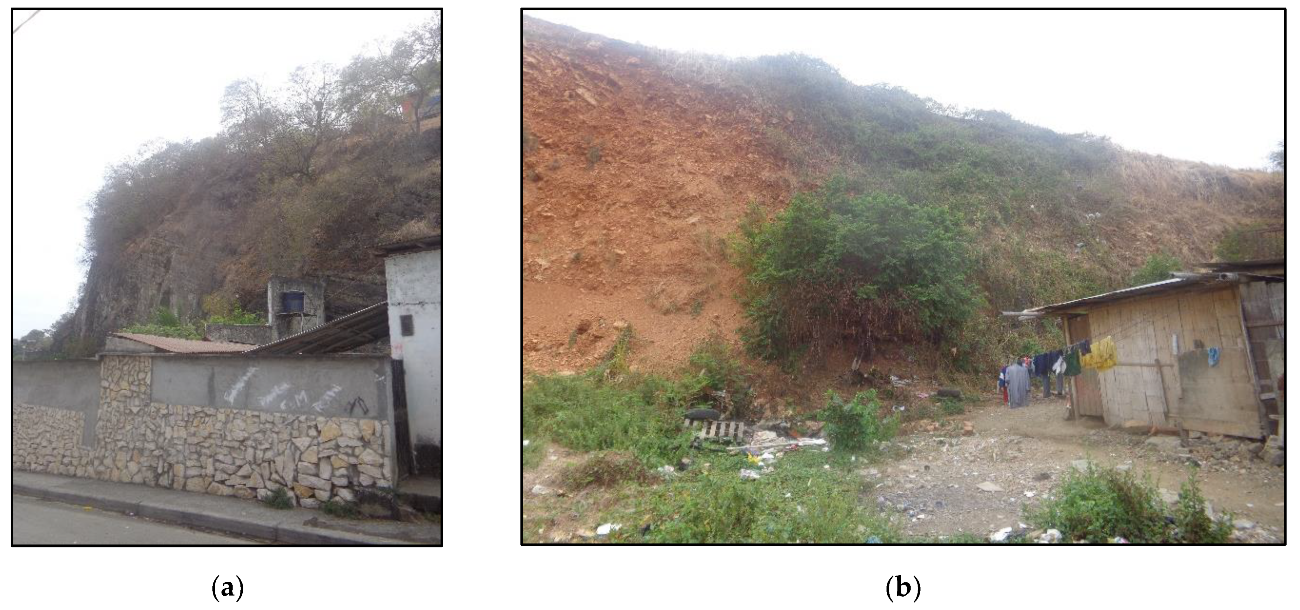
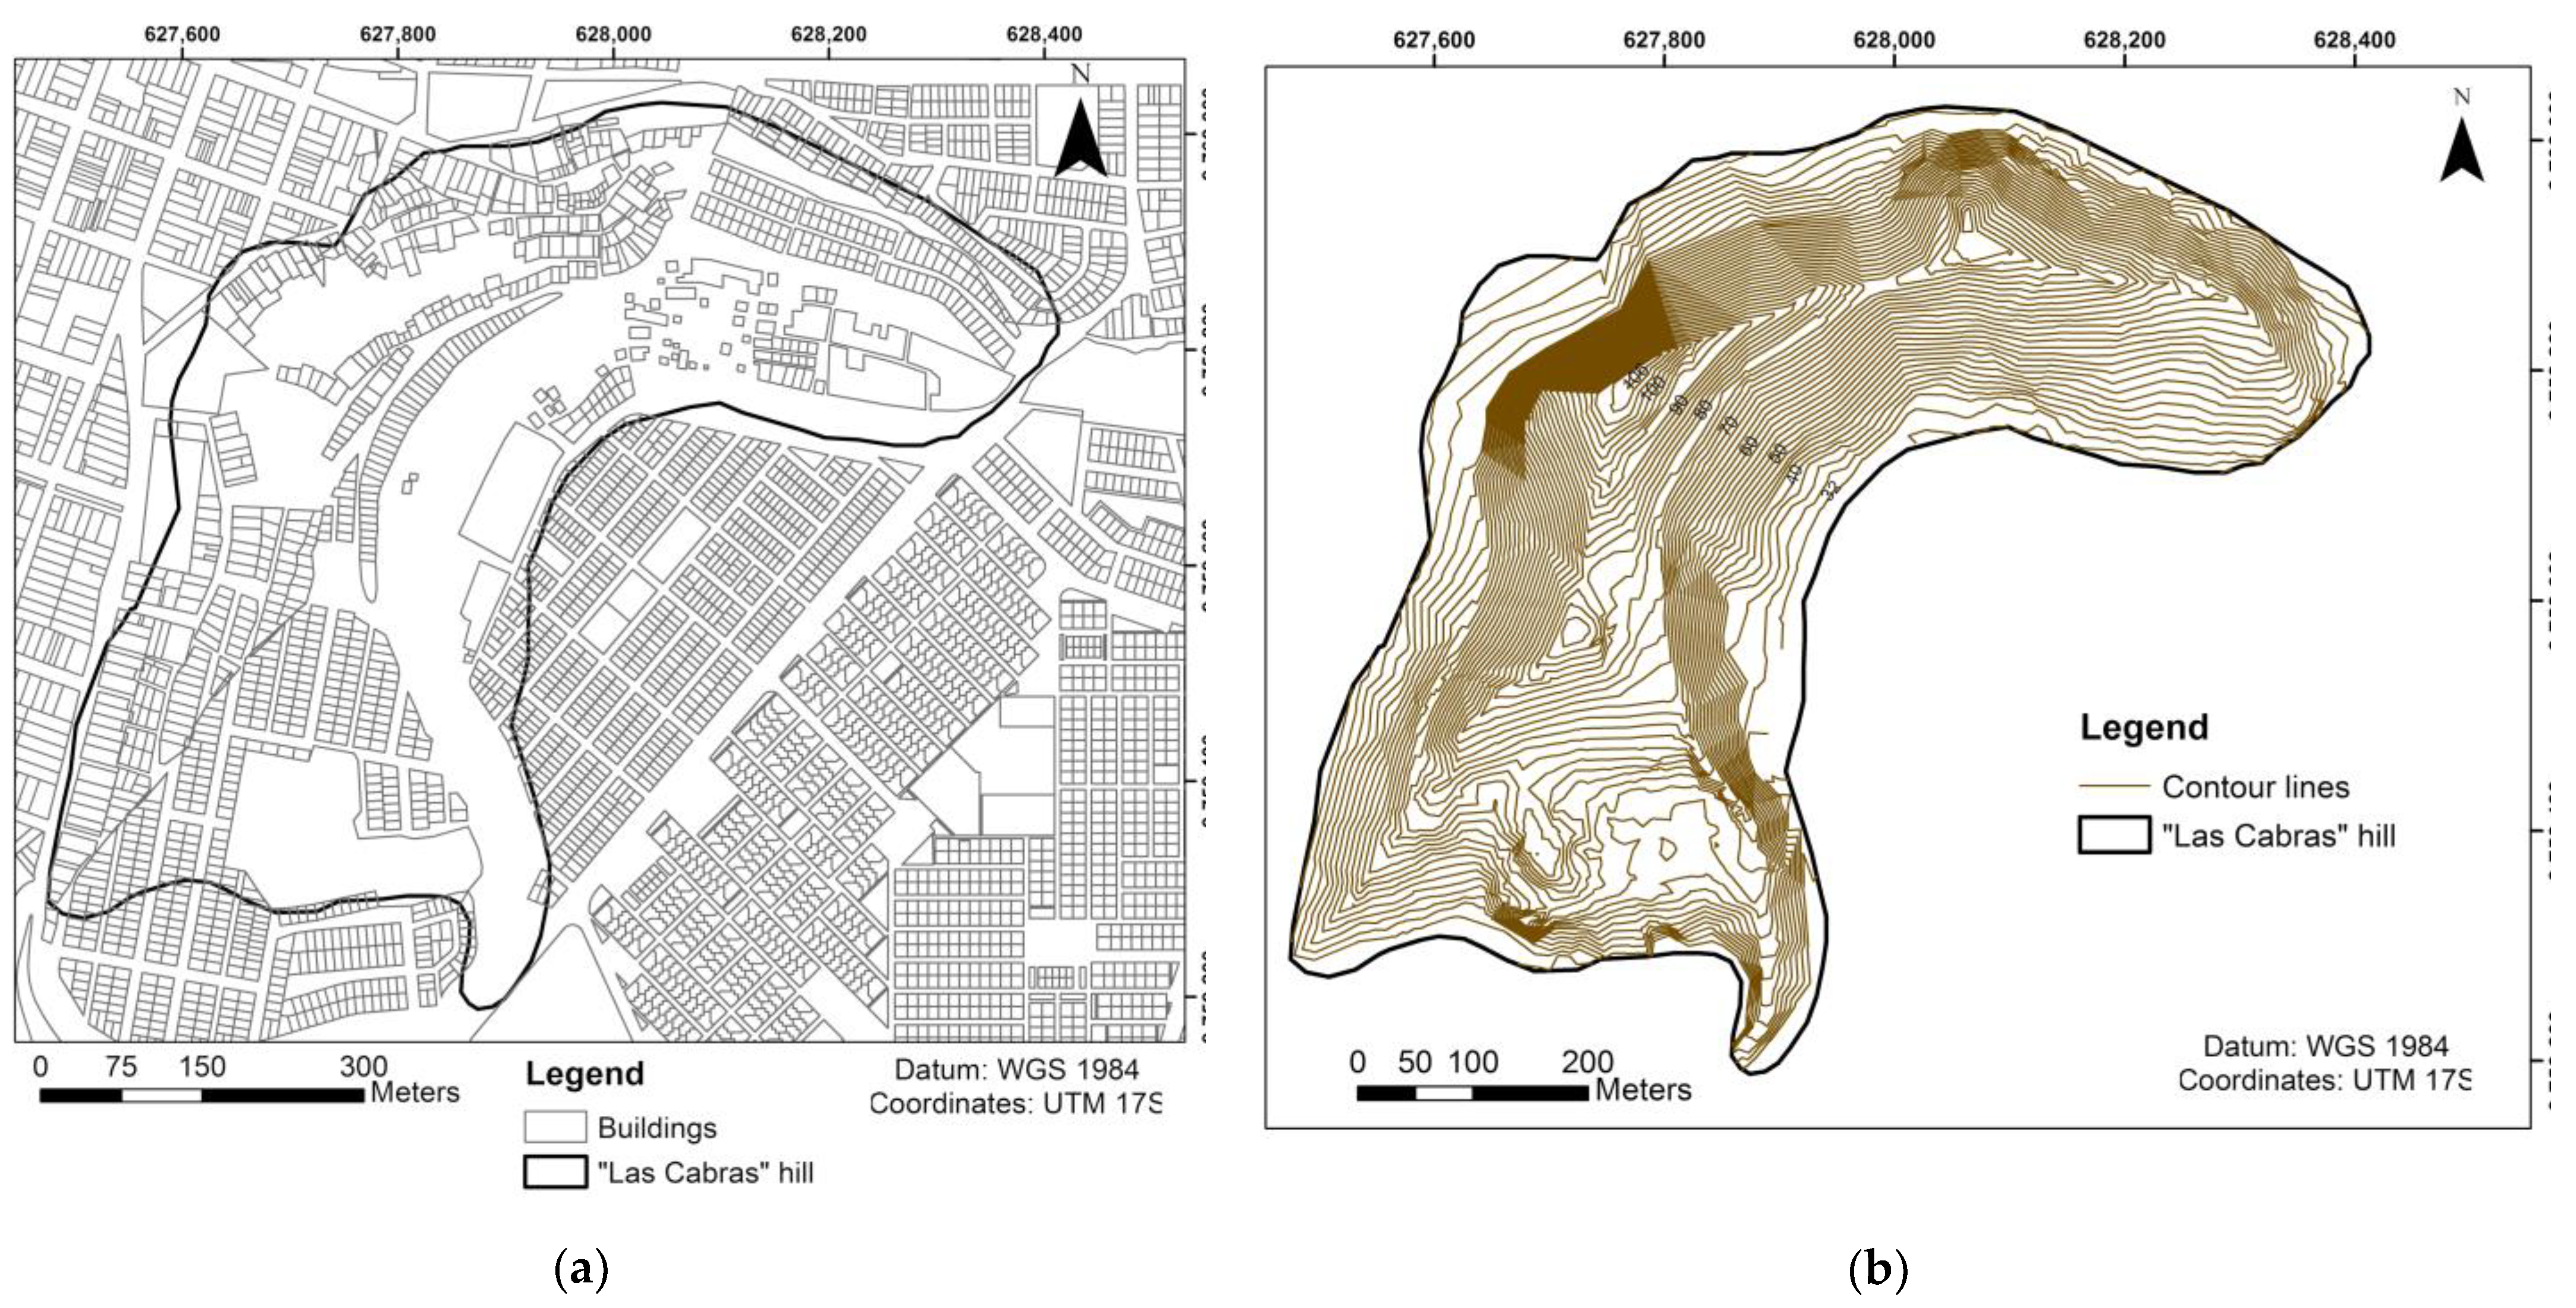
The area studied in this contribution is “Las Cabras” hill, Duran, in Southwest Ecuador. The hill has a small population with the necessary infrastructure (e.g., houses, roads and electrical network). Nowadays, there are 1540 houses, of which 88.38% (1361 houses) are inhabited. The access roads are in poor condition, making it difficult for waste collection vehicles and water tank trucks to enter. In recent years, signs of instability (e.g., deterioration, fracturing and minor wall instabilities) have been reported on the slopes of “Las Cabras” [
37,
38]. This potential instability of the terrain could cause severe mass movements over time, affecting the population.
Our work aimed to evaluate the slope stability of “Las Cabras” hill (Duran, Ecuador) through geological and geotechnical analysis and a susceptibility assessment that allowed the definition of areas potentially susceptible to landslide and detachment for land planning recommendations. A zoning map with the most unstable areas is intended to provide a basis for present and future territory planning.
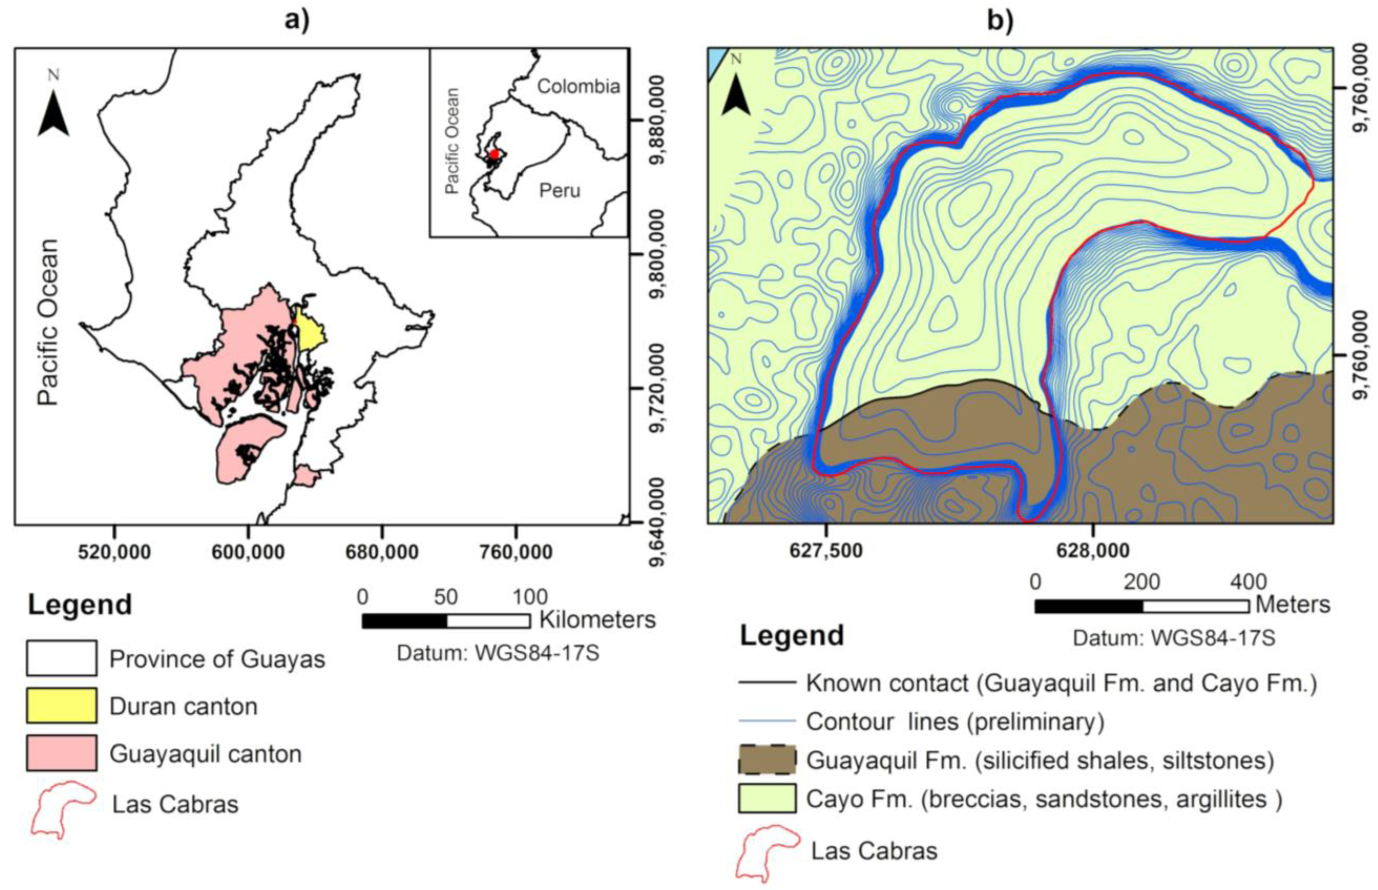
2. Setting of “Las Cabras” Hill, Duran
Duran canton consists of three parishes (Eloy Alfaro, El Recreo and Divino Niño) and has an area of 59 km
2. This canton is part of the Province of Guayas in Ecuador. Duran is located 5 km from Guayaquil. Generally, it has a flat relief with a few isolated elevations, such as that of “Las Cabras” hill [
39] (
Figure 1a). “Las Cabras” hill has an area of 0.36 km
2 and an approximate height of 80 m. According to the Population and Housing Census in Ecuador (INEC, by its acronym in Spanish) [
40], 11,868 people live in the area.
The climate is tropical (sub-humid), with temperatures ranging between 20 and 27 °C. According to the annual averages between 1985 and 2013 [
41], precipitation can be between 800 and 1000 mm/year.
Water supply is delivered three days a week through pipes. The area has a local sewer system, but there is no description of its condition. The houses have septic tanks and latrines, and there is no official control over their operation. Rainwater circulates downstream through channels deepened parallel to the stairs on the slopes of the hill. Urban planning (construction of houses or essential services) is seriously lacking in the area.
The geology of the study area (
Figure 1b) is represented mainly by the Cayo Formation (Upper Cretaceous), which consists of breccias, microbreccias, sandstones, shales even clays and argillites [
42]. In general, these lithologies alternate and form centimetre to meter-thick bodies. The geological structure dips southwards with a slope of 15 to 25 degrees [
43]. Significant colluvial soil development has taken place on top of the base rock, and some soils show signs of the current movement and instability (rotational rupture). A small part (in the southern part of the study area; see
Figure 1b) corresponds to the Guayaquil Formation. Guayaquil Fm. consists of silicified shales and flint nodules that alternate with brown tubaceous siltstones [
44] and sandstones with calcareous cement that belong to the Cayo Fm. [
45].
3. Methodology
The methodology followed in this study (
Figure 2) consisted of three phases: (i) analysis of background information about the study area; (ii) field survey and geological–geomechanical studies; and (iii) landslide susceptibility zoning.
3.1. First Phase
The first step was to compile relevant literature (articles, reports and press releases) related to the study area. Data provided by the project “Studies and proposals for the stabilisation of “Las Cabras” hill” were also collected [
33]. This phase focused on developing the detailed topography of “Las Cabras” hill using GPS Satellite GNSS S82T equipment, and a SOKKIA SET 630 total station. An inventory was completed of the constructions in the area (buildings, roads, water supply and septic tanks) to consider whether these could influence the terrain’s instabilities. Finally, the technical and social context was analysed to consider the causes and impacts of the problem (instabilities).
3.2. Second Phase
3.2.1. Geological Characterisation
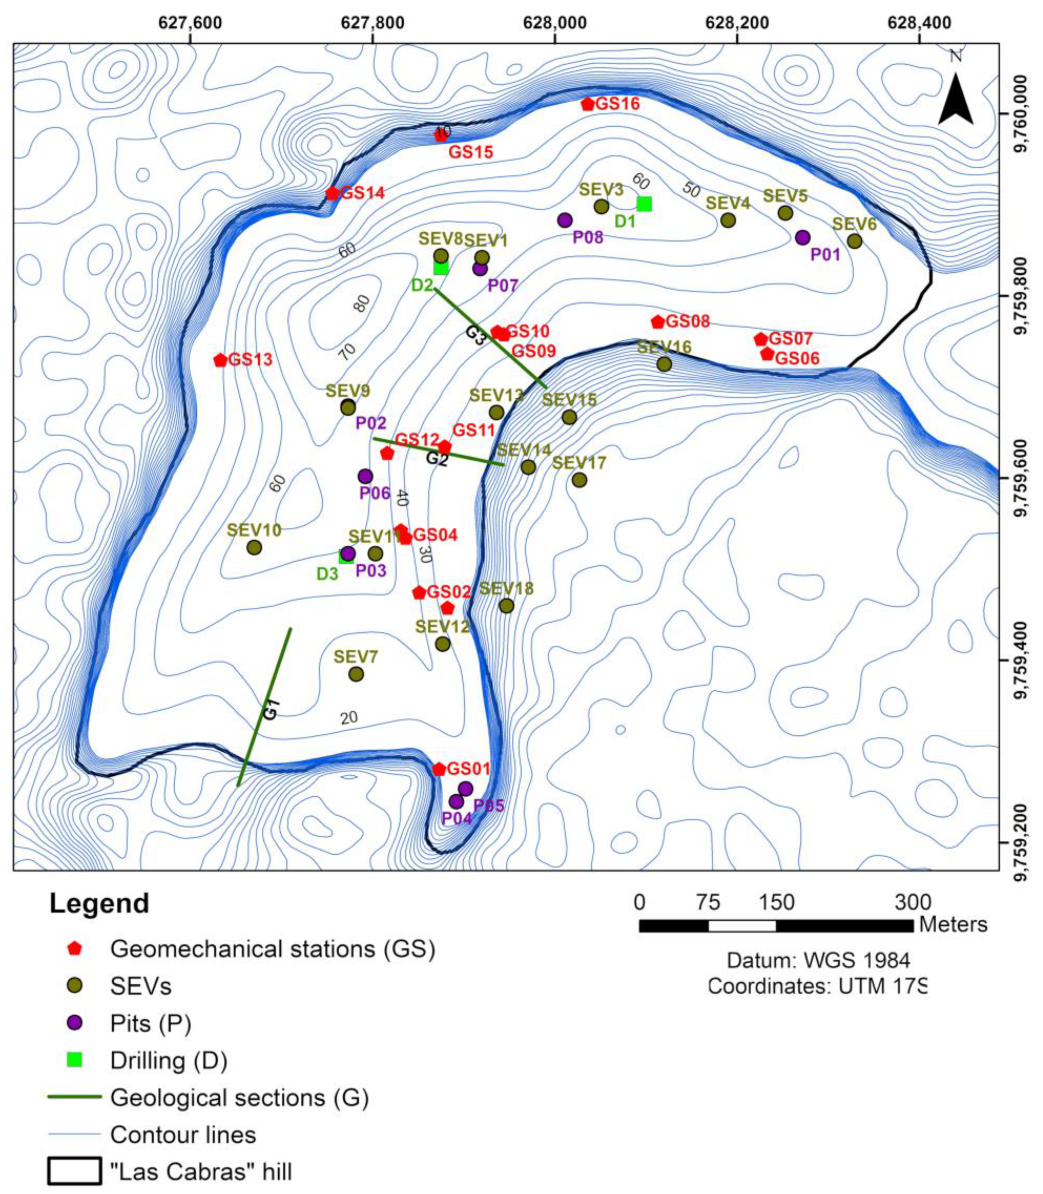
The fieldwork at “Las Cabras” hill focused on studying the terrain’s morphology and obtaining measurements of heading and dip of strata and other geological structures. Three geological sections were made in the study area, and a representative stratigraphic column.
Based on the identification of areas of geological interest, 18 vertical electrical soundings (VESs) were planned using the Schlumberger method [
46,
47]. The VESs carried out allowed estimating the thickness of the layers at depth. To verify the information obtained from the VESs, strategic points were established for drilling and pits.
Three rotational type boreholes were drilled with sample recovery. Six VESs close to the perforations were chosen to correlate them. Additionally, eight pits were made (excavations of at least one meter deep) to analyse in detail the materials (rocks and soils) present (see
Figure 3). These actions allowed an adequate geological interpretation of the study area through the correlations of geoelectric profiles, the geological field survey and the geological drilling record.
3.2.2. General Geomechanical Study
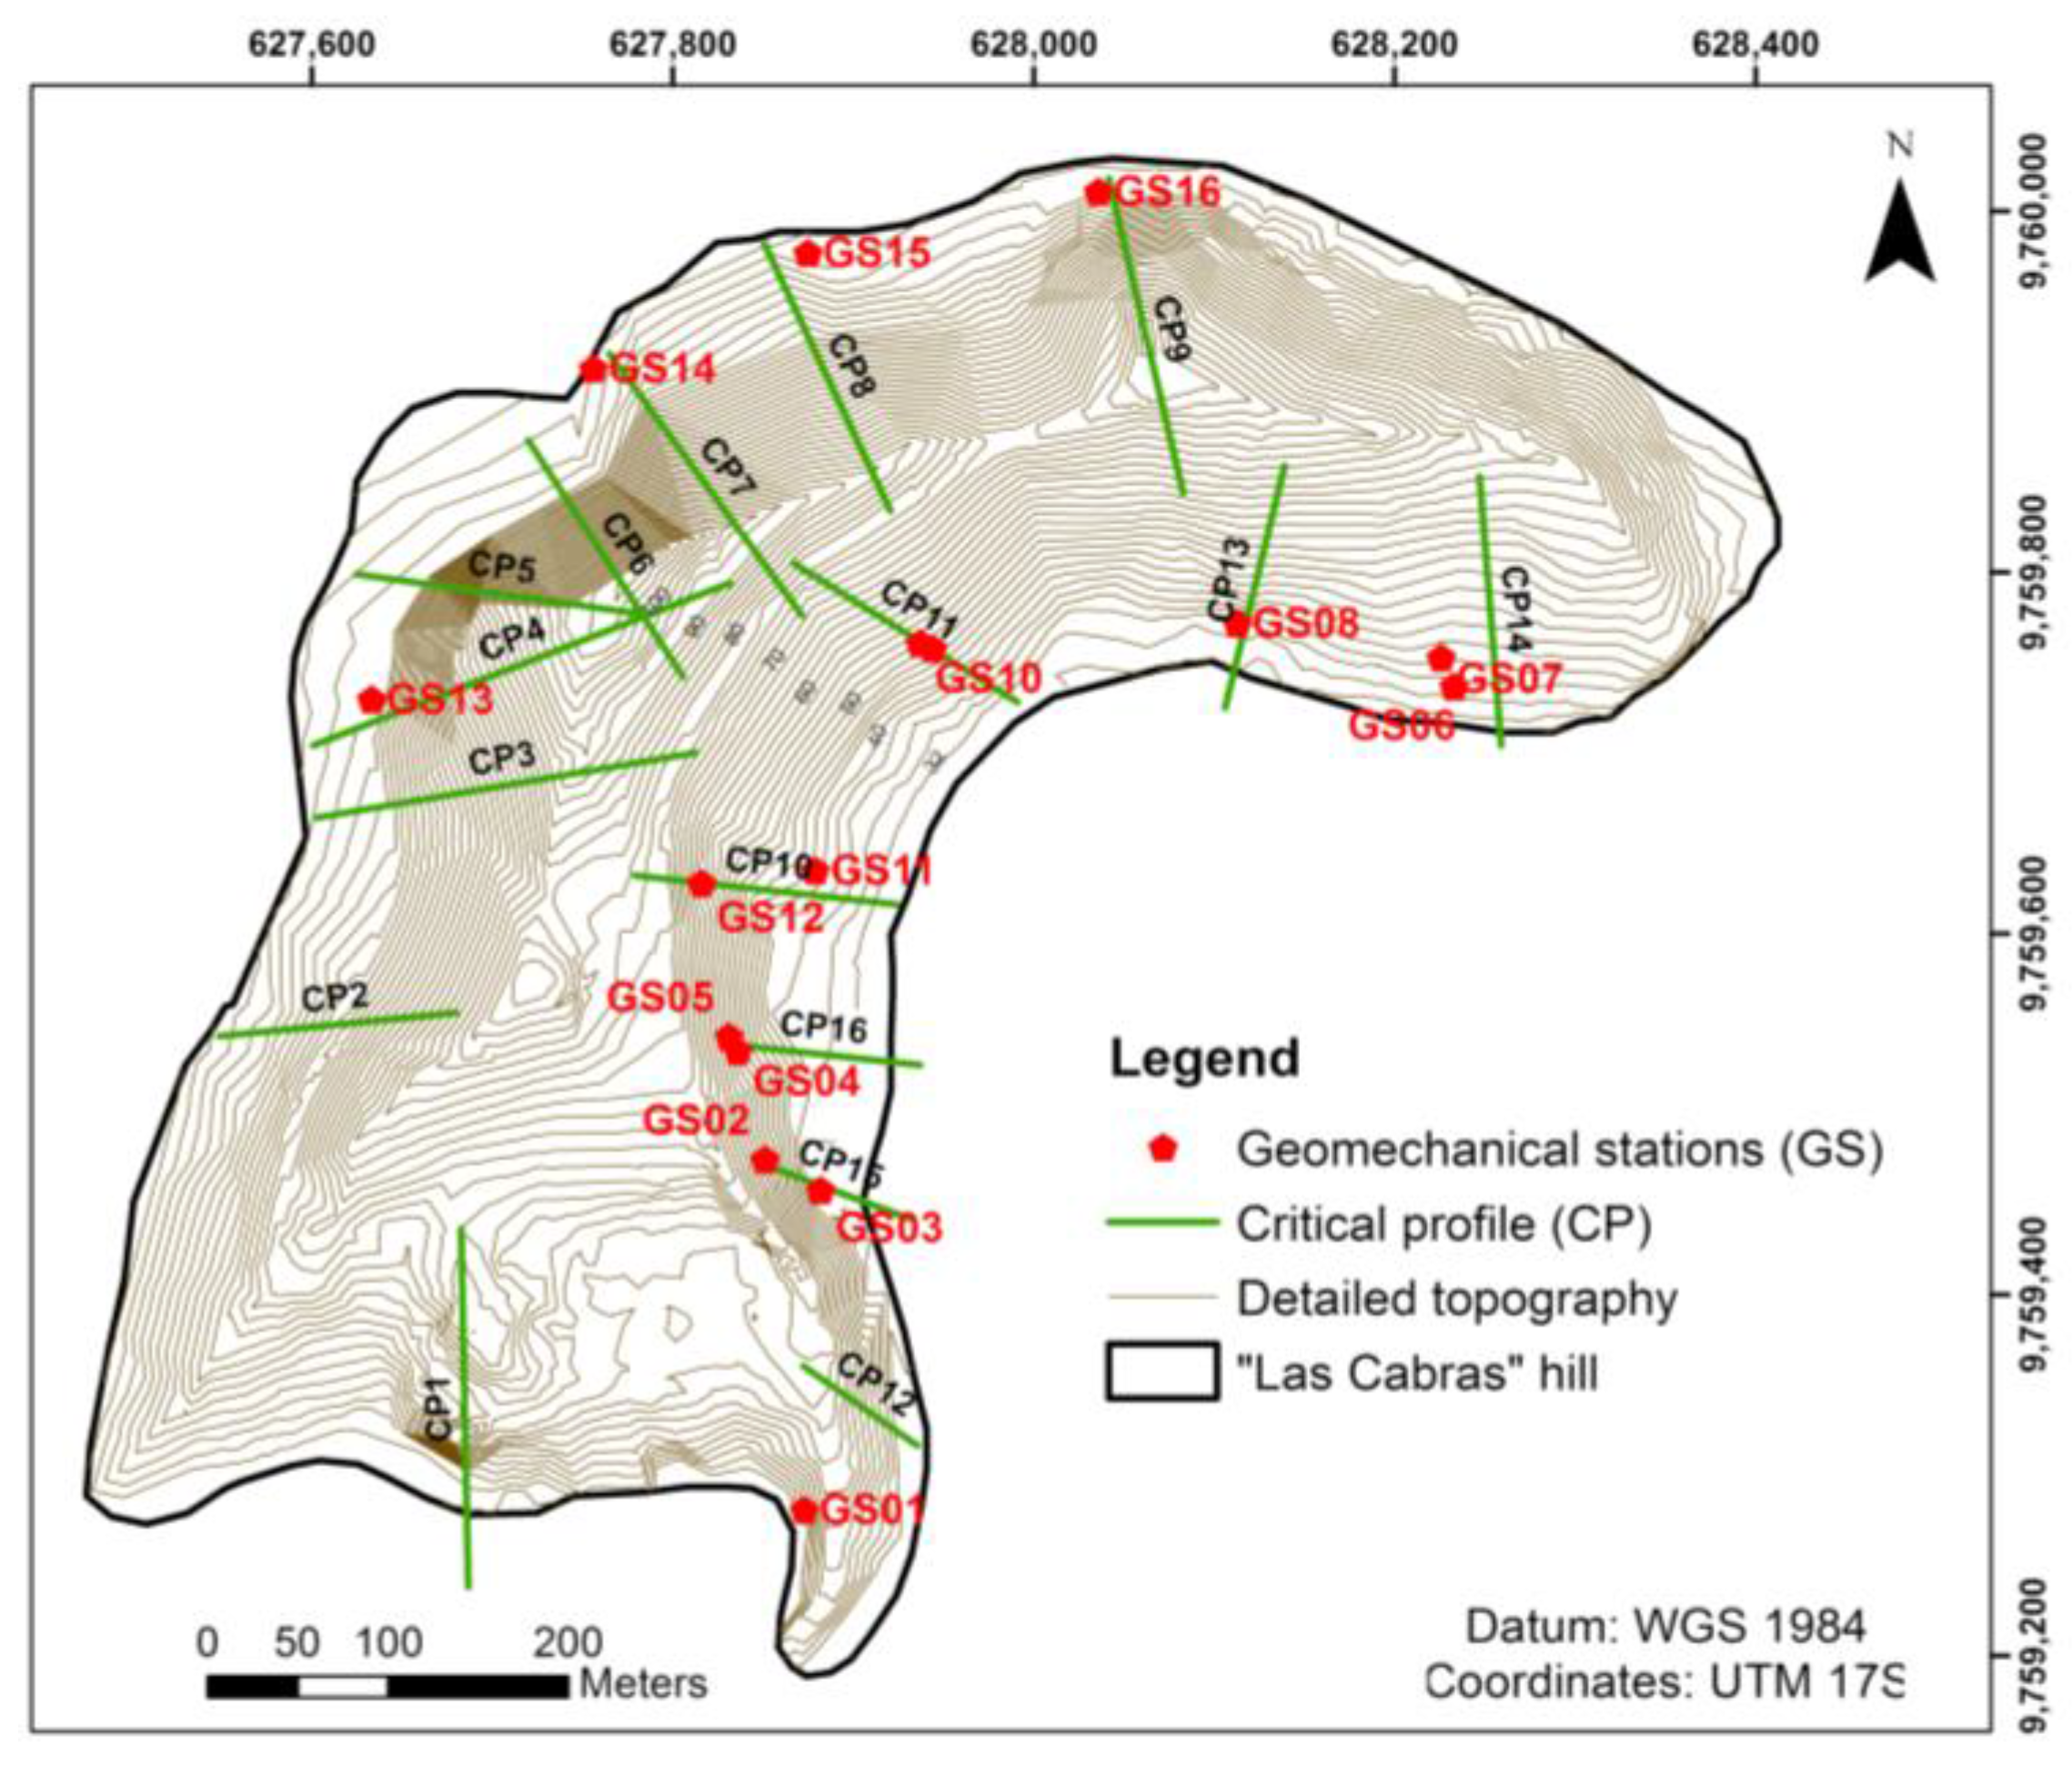
The geomechanical study addressed the characterization of 16 stations (ordered set of geomechanical observations) in the study area (
Figure 3). The number of stations and location depend on the favourable terrain conditions (existing outcrops and accessibility) and representativeness concerning their susceptibility to landslide or detachment (explained in
Section 3.3). Eight geomechanical rock stations and eight soil stations were focused on in the study (
Figure 4a,b). The number of stations studied was limited due to budget constraints, access permits and terrain.
Eight rock samples were taken using the combo and chisel or easily removable blocks. Laboratory tests were carried out on each of the collected samples to evaluate their physical–mechanical properties. Simple linear compression, resistance, density, cohesion and angle of internal friction were tested on the samples. All tests were carried out in a specialised rock mechanics laboratory.
It is important to note that the linear compressive strength was determined by the “standard” method using cores with a height/diameter ratio of 1.5. The “Brazilian test” method was used for tensile strength. According to [
48,
49], the Brazilian test is a simple indirect test method to obtain the tensile strength of brittle material such as concrete, rock or rock-like material, in which a thin circular disk is diametrically compressed to failure. Cohesion and internal friction angle values were established using Mohr–Coulomb stress circles [
50,
51] from compressive and tensile strength values. To verify the results, we used former data obtained in the same area for other projects. These physical–mechanical properties were used for the determination of the stability conditions [
21]
3.2.3. Specific Geomechanical Study
For this experimentation phase, the geomechanical rock stations, previously defined, were used for a specific analysis. A set of geomechanical parameters was used to characterise rock quality, such as the rock quality designation (RQD), the geological strength index (GSI), the degree of weathering and the lithostructural groups. These geomechanical parameters made it possible to characterise the conditions of landslide and detachment susceptibility that currently exist in “Las Cabras” hill.
Rock Quality Designation (RQD)
According to Deere [
52], the RQD is a modified core recovery percentage, in which all pieces of sound core over 100 mm (4 in.) long are summed and divided by the length of the core run. The RQD index is an index of rock quality “in that problematic rock that is highly weathered, soft, fractures, sheared and jointed is counted against the rock mass” [
52] (
Table 1).
For field observations, we applied the methodology given by Palmstrom [
51] (Equation (1) and
Table 2), where the RQD parameter is estimated using a correlation with the volumetric joint count (Jv).
where Si is the average spacing for the joint sets
Weathering Degree, Geological Resistance Index (GSI) and Lithostructural Group
The study of the weathering degree, which implies reduced resistance, altered physical state and variation of the tension state on the slope or slopes, is necessary for the engineering–geological evaluation [
54,
55,
56]. The weathering degree was determined by visual observation and by the method proposed by Suárez [
57], based on the International Society of Rock Mechanics (ISRM) reference value [
53,
58] (
Table 3).
GSI is a system for characterizing the geomechanical properties of the rock mass through easy identification by visual evaluation of geological properties in the field [
57]. The rock mass was characterised with the GSI using the table given by Hoek [
59,
60]. Finally, the different materials were classified according to the lithostructural groups established by Nicholson and Hencher [
61]: strong massive rock (I), strong discontinuous rock (II), composite rock (III), tectonically weakened rock (IV), weak granular rock (V), karst rock (VI), anisotropic rock and ground-like rock (VII).
3.3. Third Phase
3.3.1. Detachment and Landslide Susceptibility
The theoretical–practical evaluation procedure used in this phase was based on the criteria of several authors, such as Ambalagán [
62], Suárez [
57], González, [
63], Nicholson [
61] and Blanco [
33]. The geomechanical characteristics were defined (
Table 4 and
Table 5) by assigning values attained following expert criteria. The selected parameters were lithology, geological structure, morphometry, discontinuity, water presence, vegetable cover, seismic activity and weathering rank, which were evaluated from 0 to 4 (
Supplementary Table S1) based on the conditions observed in the field (see definitions of the parameters in
Supplementary Table S2).
This method allows the susceptibility levels to detachment and landslide (
Table 6 and
Table 7) to be defined. The susceptibility level is a qualitative value (I to V), and it is related to the susceptibility coefficient (SC) estimated [
21,
64]. Thus, the grade and susceptibility levels for rocks are: I for SC ≤ 5.0; II for 5.0 < SC ≤ 10.0; III for 10.0 < SC ≤ 15.0; IV for 15.0 < SC ≤ 20.0; and V for SC > 20.0. The grade or susceptibility levels for soils are: I for SC ≤ 5.0; II for 5.0 < SC ≤ 8.0; III for 8.0 < SC ≤ 12.0; IV for 12.0 < SC ≤ 16.0; and V for SC > 16.0. As a result, the susceptibility map of instability (detachment and landslide) was prepared from the geomechanical evaluations obtained using the geostatistical kriging tool that allows the values to be interpolated.
3.3.2. Safety Factor Assessment
Slope stability was assessed by the 2-dimensional stability program (SLIDE), which is based on the limit equilibrium calculation method [
65]. Profiles were drawn according to the geomechanical stations and detailed topography. These were analysed in a static analysis (considering only the geotechnical characteristics of the terrain and the topography) and a pseudostatic analysis (considering the seismic activity of the study area).
We used seismic activity values established by the Ecuadorian Construction Standard (NEC-15, by its acronym in Spanish) [
66]. According to [
61], the study area is considered a zone of high seismic intensity, with a peak ground acceleration (seismic acceleration) of 0.40 g. However, in the pseudostatic analyses, 60% of the acceleration (i.e., 0.24 g) must be considered. Simplified Bishop methods were used to calculate the safety factor (SF). The simplified Bishop method uses the method of slices to discretise the soil mass and determine the SF. This method satisfies the vertical force equilibrium for each slice and overall moment equilibrium about the centre of the circular trial surface. Since horizontal forces are not considered at each slice, the simplified Bishop method also assumes zero interslice shear forces [
67,
68]. The parameters input in the software SLIDE: the number of slices was 25 with a maximum number of iterations of 50. In this analysis, water table values were not considered.
Based on the susceptibility levels to detachment and landslide and the safety factor for rocks and soils, the obtained results were evaluated to establish the viability of the applied methodology.
4. Results
4.1. General Characterisation
Fieldwork on “Las Cabras” hill revealed inefficient development of essential services such as sanitary sewers, storm sewers, access roads and informal human settlements on surface watercourses. These could be considered instability triggers in the study area. The sanitary sewer system that fails to cover the needs of the entire population is of particular importance. Sixty percent of the houses were found to have septic tanks, and the other 40% had latrines. However, there is evidence of discharge escape towards the surface and infiltration into the ground in both cases.
The topographic work yielded a detailed, up-to-date topography of “Las Cabras” hill with UTM coordinates, which allowed us to draw the topographic plan of the study area (
Figure 5b).
4.2. Geological Characterisation
4.2.1. Stratigraphy
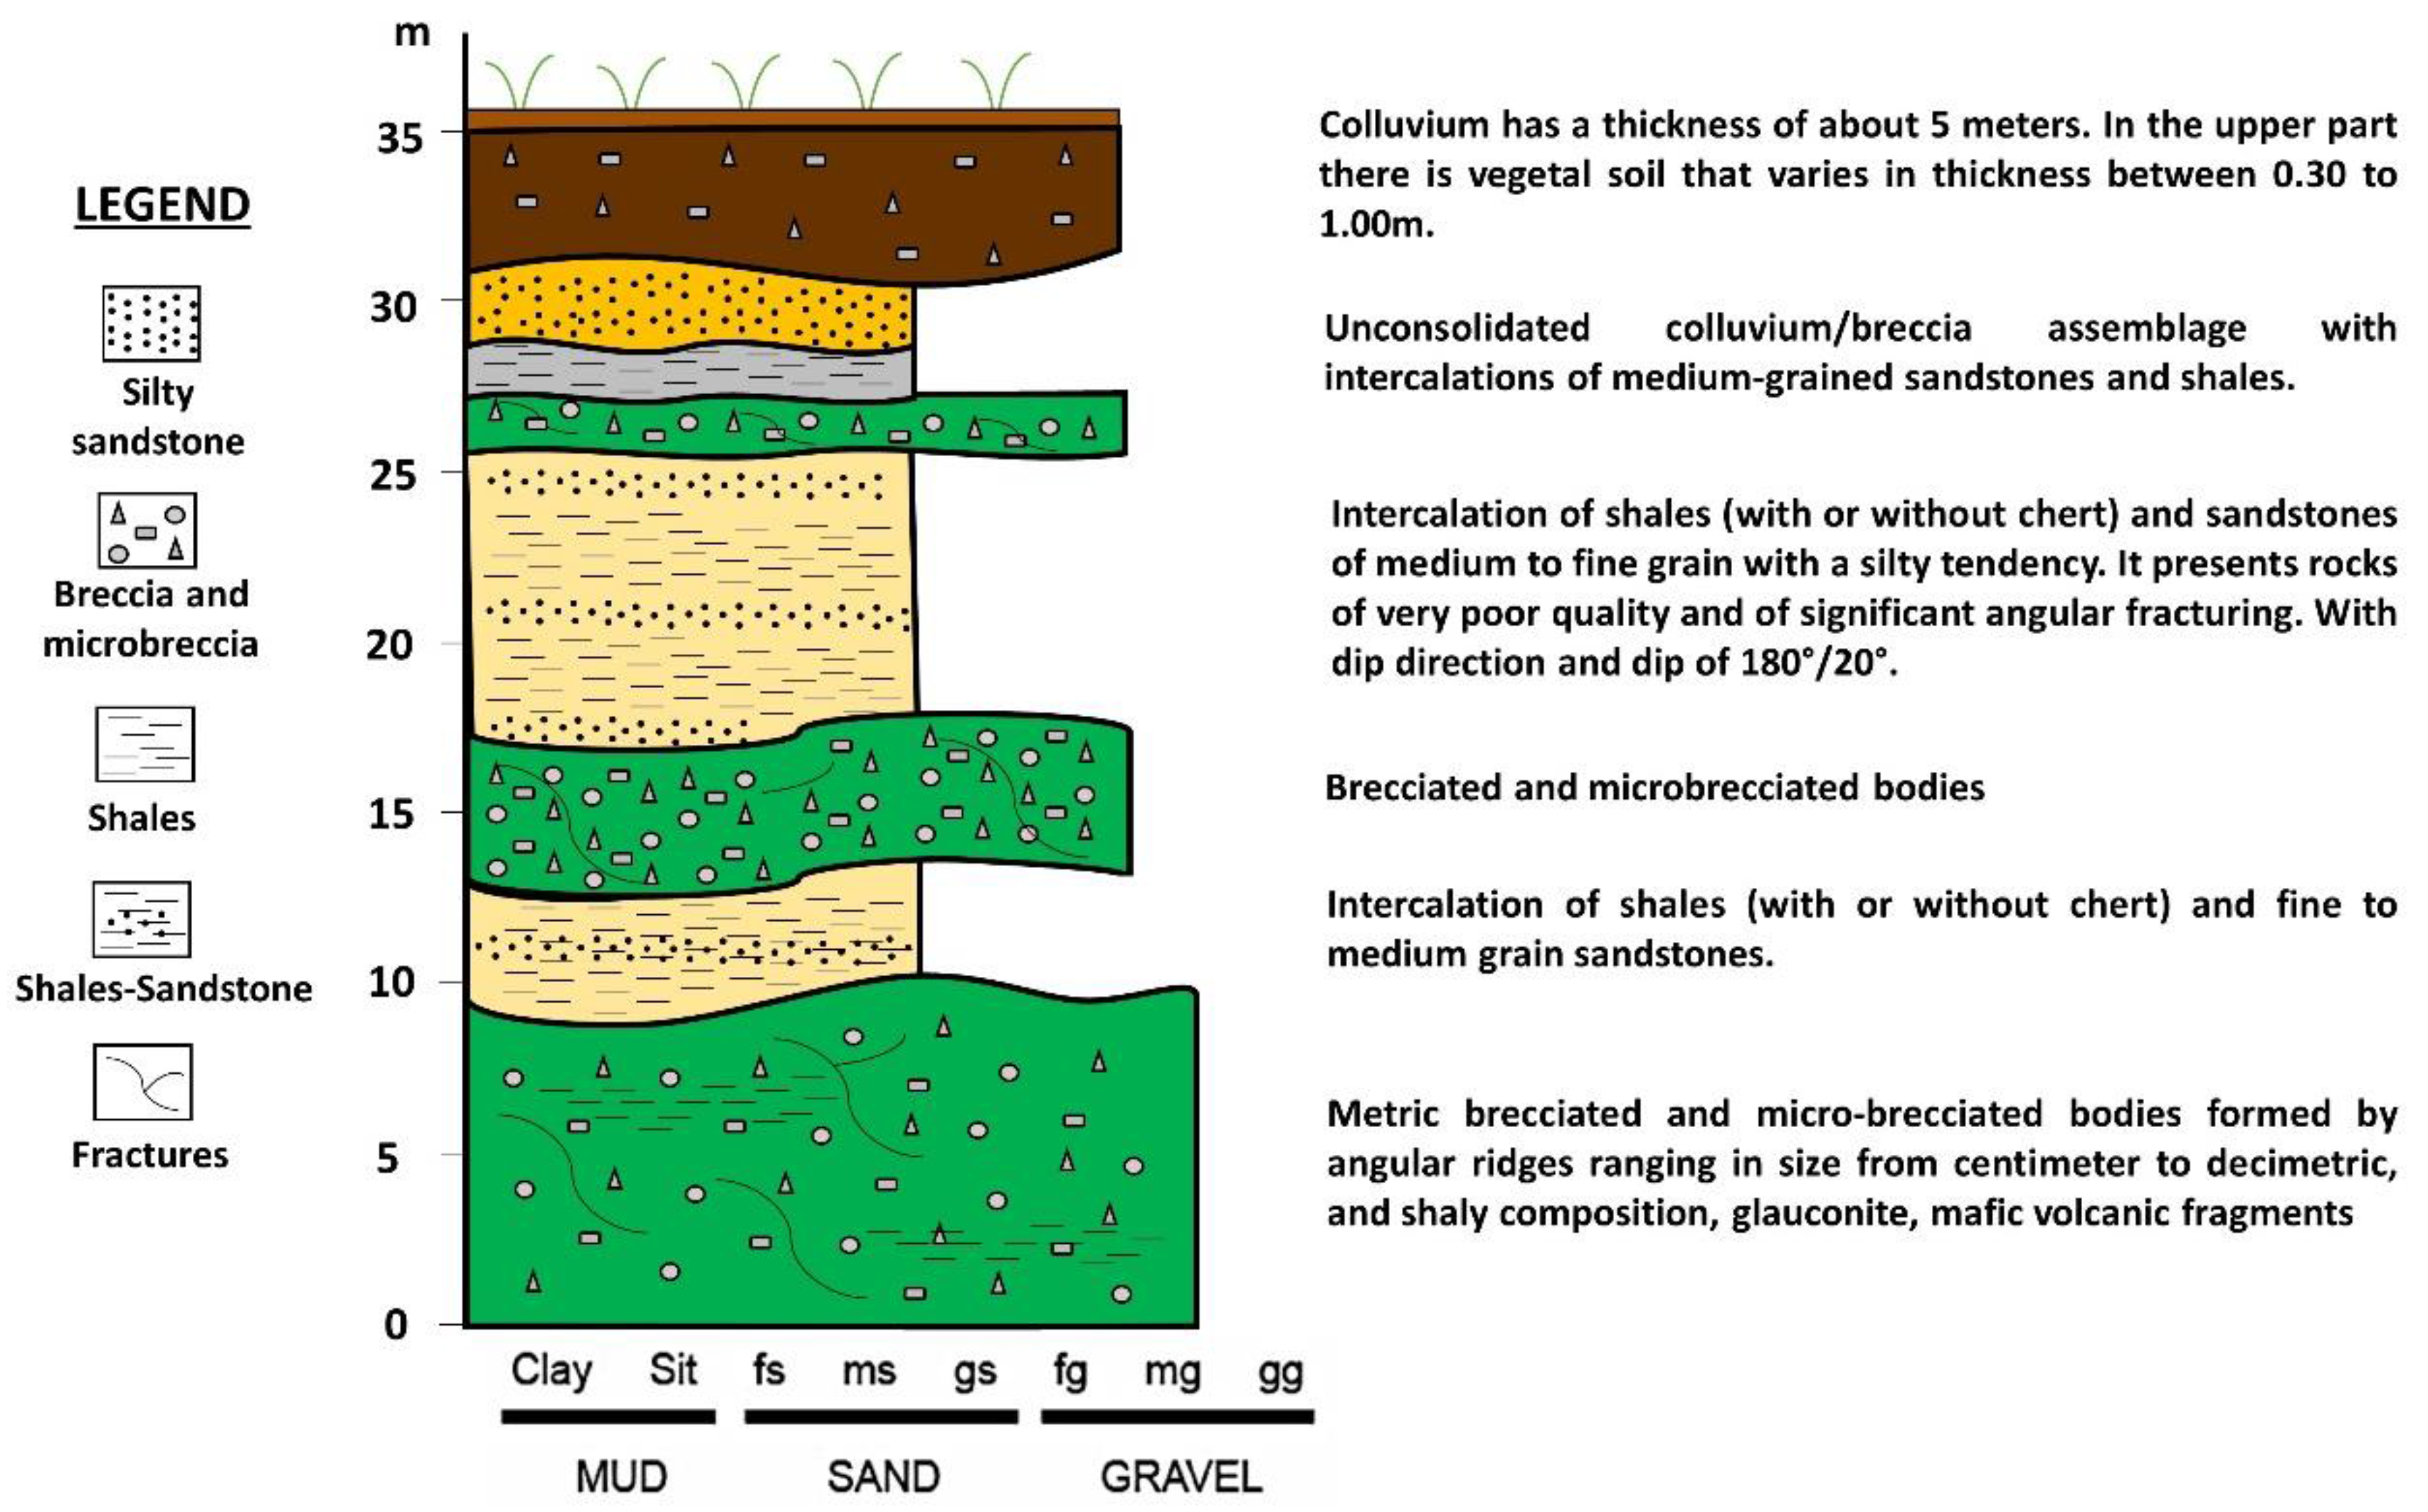
The field data obtained show a sedimentary succession that consists of metric brecciated and microbrechified bodies formed by angular ridges of sizes ranging from centimetric to decimetric. It has a shale composition. Glauconite is present, as are mafic volcanic fragments and medium and fine-grained sandstones. The shale interval is characterized by the presence of intercalations of those medium and fine-grained sandstones. We also saw in the shales parallel laminations and normal and inverse gradations. Subsequently, and with net contact, a succession of centimetre and decimetric layers of medium-grained sandstones, siliceous chert shales and fissile shales are present. This layer is overlaid by a set of unconsolidated colluvium/breccia with intercalations of medium-grained sandstones and shales. Colluvial material appears on the top of the sedimentary succession (
Figure 6).
The lithological layers have a preferential dip of 15–20° and a dip direction of 180–200°. The studied area is strongly fractured (three families of discontinuities: 180°/22°, 170°/16° and 140°/53°). Raised lithological units reached a thickness of 35 m. This data are complemented by the geological profiles made that are presented in
Supplementary Figures S1–S3 and
Supplementary Table S3.
4.2.2. VESs
Eighteen VESs have been interpreted with IPI2win software (versión 3.0.1), and resistivity curves were adjusted to represent the strata with an error of less than 6%.
Table 8 shows the lithologies based on the resistivities determined in the VESs. The interpretations of the 18 VESs can be seen in
Supplementary Table S4.
4.2.3. Pits
In the geological studies carried out in the pits, stratigraphic columns were constructed (an example is seen in
Table 9).
In
Table 9 (representative of the eight pits), we can see that the column reaches a depth of 2.50 m. In general, the levels determined in this section correspond to (from base to top): sandstones and microbreccias with glauconite, medium-grained sandstones, medium-grained sandstones and dark shales and soil. Information from all pits is presented in
Supplementary Table S5.
4.2.4. Drilling
Table 10 shows the lithologies based on the samples recovered from the boreholes and the depths reached in each one. The materials obtained from the drilling are mainly sandstones and shales from the Cayo Formation. A more detailed description of each drilling can be seen in
Supplementary Table S6.
4.2.5. VESs and Drilling Correlation
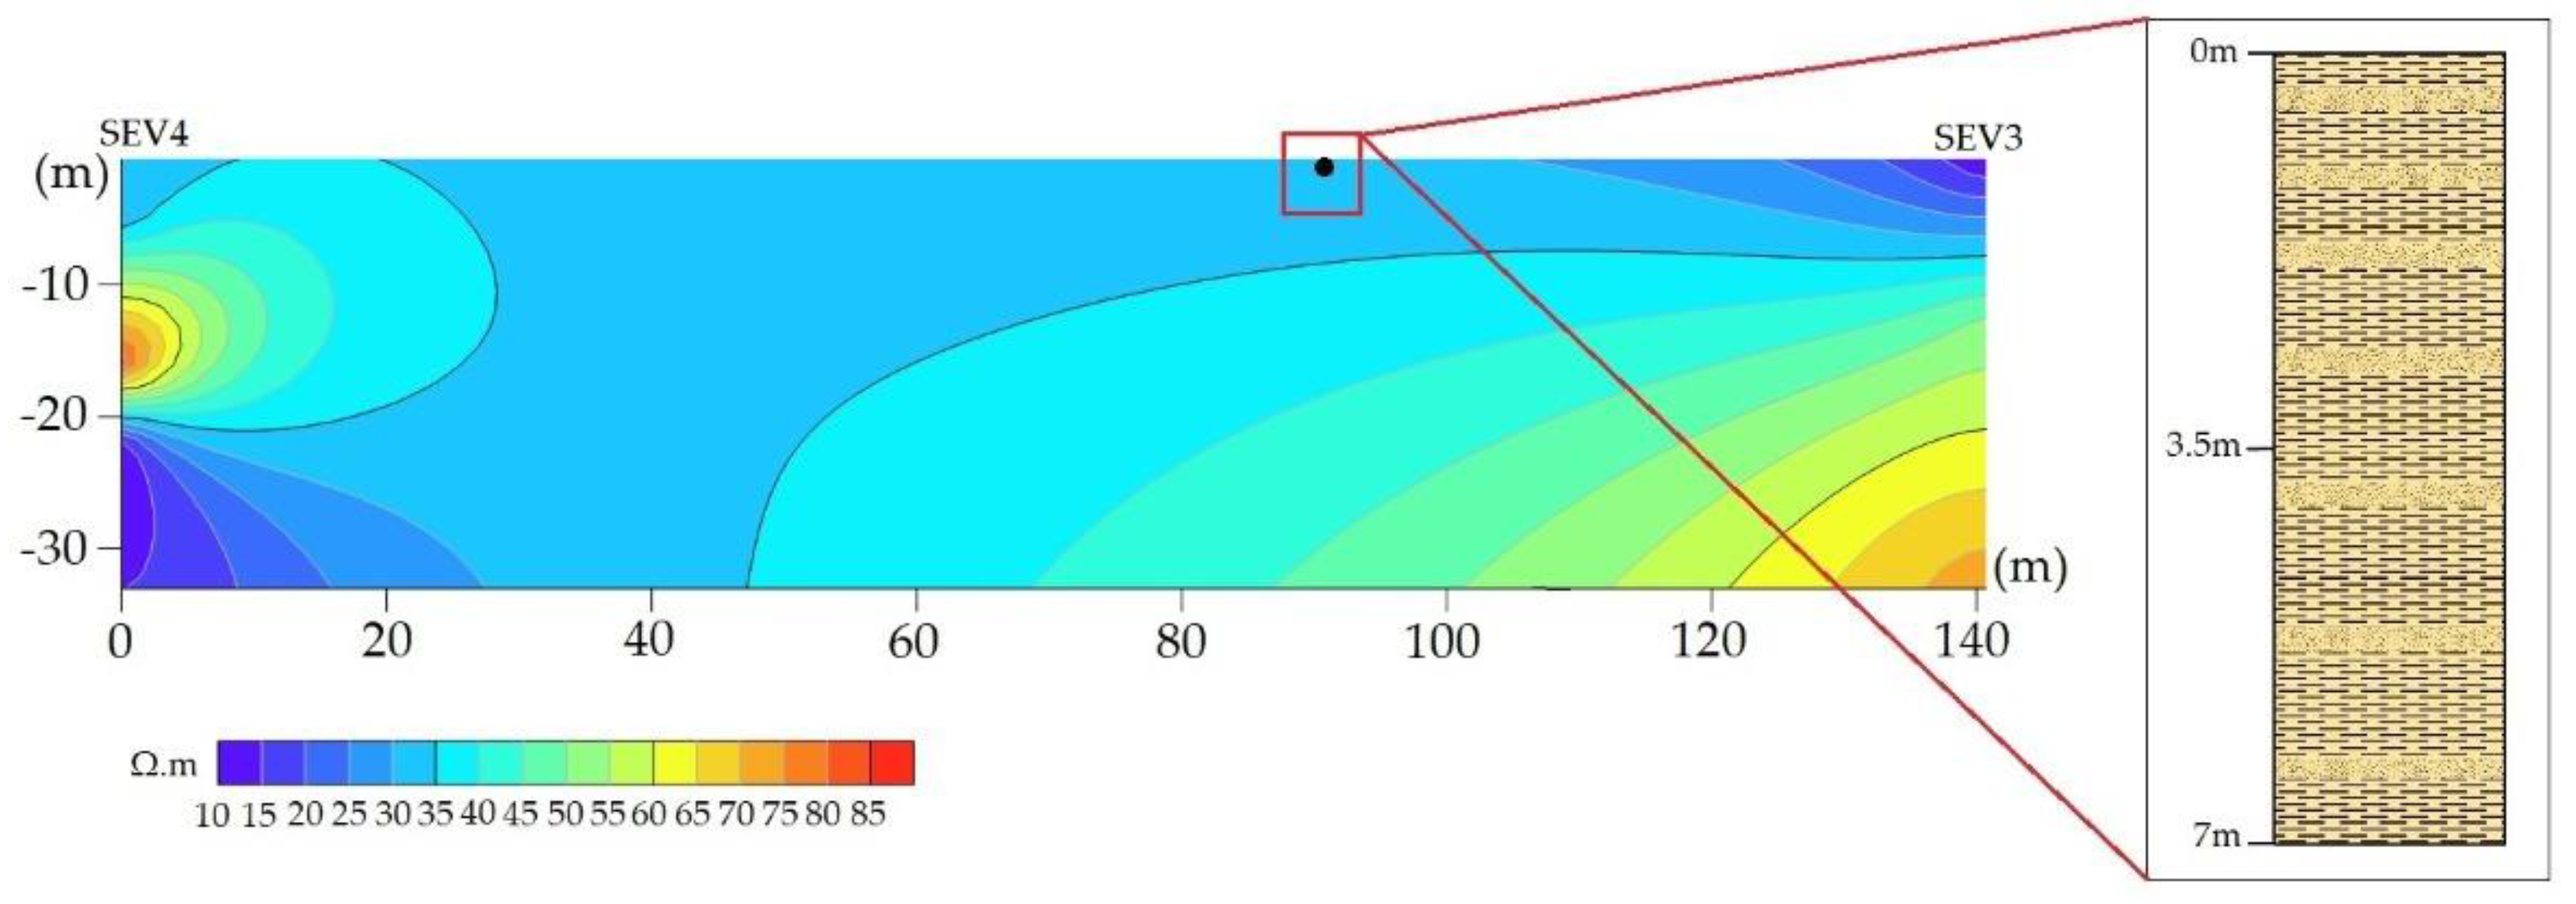
Three correlations have been made between VESs and perforations using kriging interpolation. One of the correlations between drilling D1 and the VESs close to it (VES3 and VES4) is presented in
Figure 7. Two other correlations have been made with drilling D2 with VES1 and VES8 and drilling D3 with VES10 and VES11. These can be seen in
Supplementary Figures S4 and S5.
4.3. Geomechanical Study
4.3.1. Description of Materials and Physical-Mechanical Properties
The materials defined from pits and outcrop characterisation are generally sandstones and shales from the Cayo Fm. The data in the columns can be extrapolated to the geomechanical stations. Of the 16 geomechanical stations defined, results of the physical–mechanical characterization of rocks were obtained.
Table 11 demonstrates that sandstone is the most common rock type, according to the characteristic of the Cayo Fm. The rock samples were of fair quality (270–685 Kg/cm
2).
4.3.2. Geomechanical Characteristics of Soil and Rock Stations
The results of the geomechanical characterisation of rock stations are shown in
Table 10. The study in the geomechanical soil stations revealed a moderate to residual weathered soil degree. Additionally, these stations are characterized by no water to minimal surface water, and from little vegetation to being largely covered by adequate vegetation. In the case of the characterised soils, it was found that the predominant soil is represented by clayey colluvial soil, with weathered sandstone blocks of medium grain (
Table 12).
The results of the geomechanical characterisation of rock stations are shown in
Table 13. The weathering degree values are in categories II and III, and the GSI values are between 70 and 60. The RQD values are between 55 and 70%. Lithostructural group values are in categories II and III.
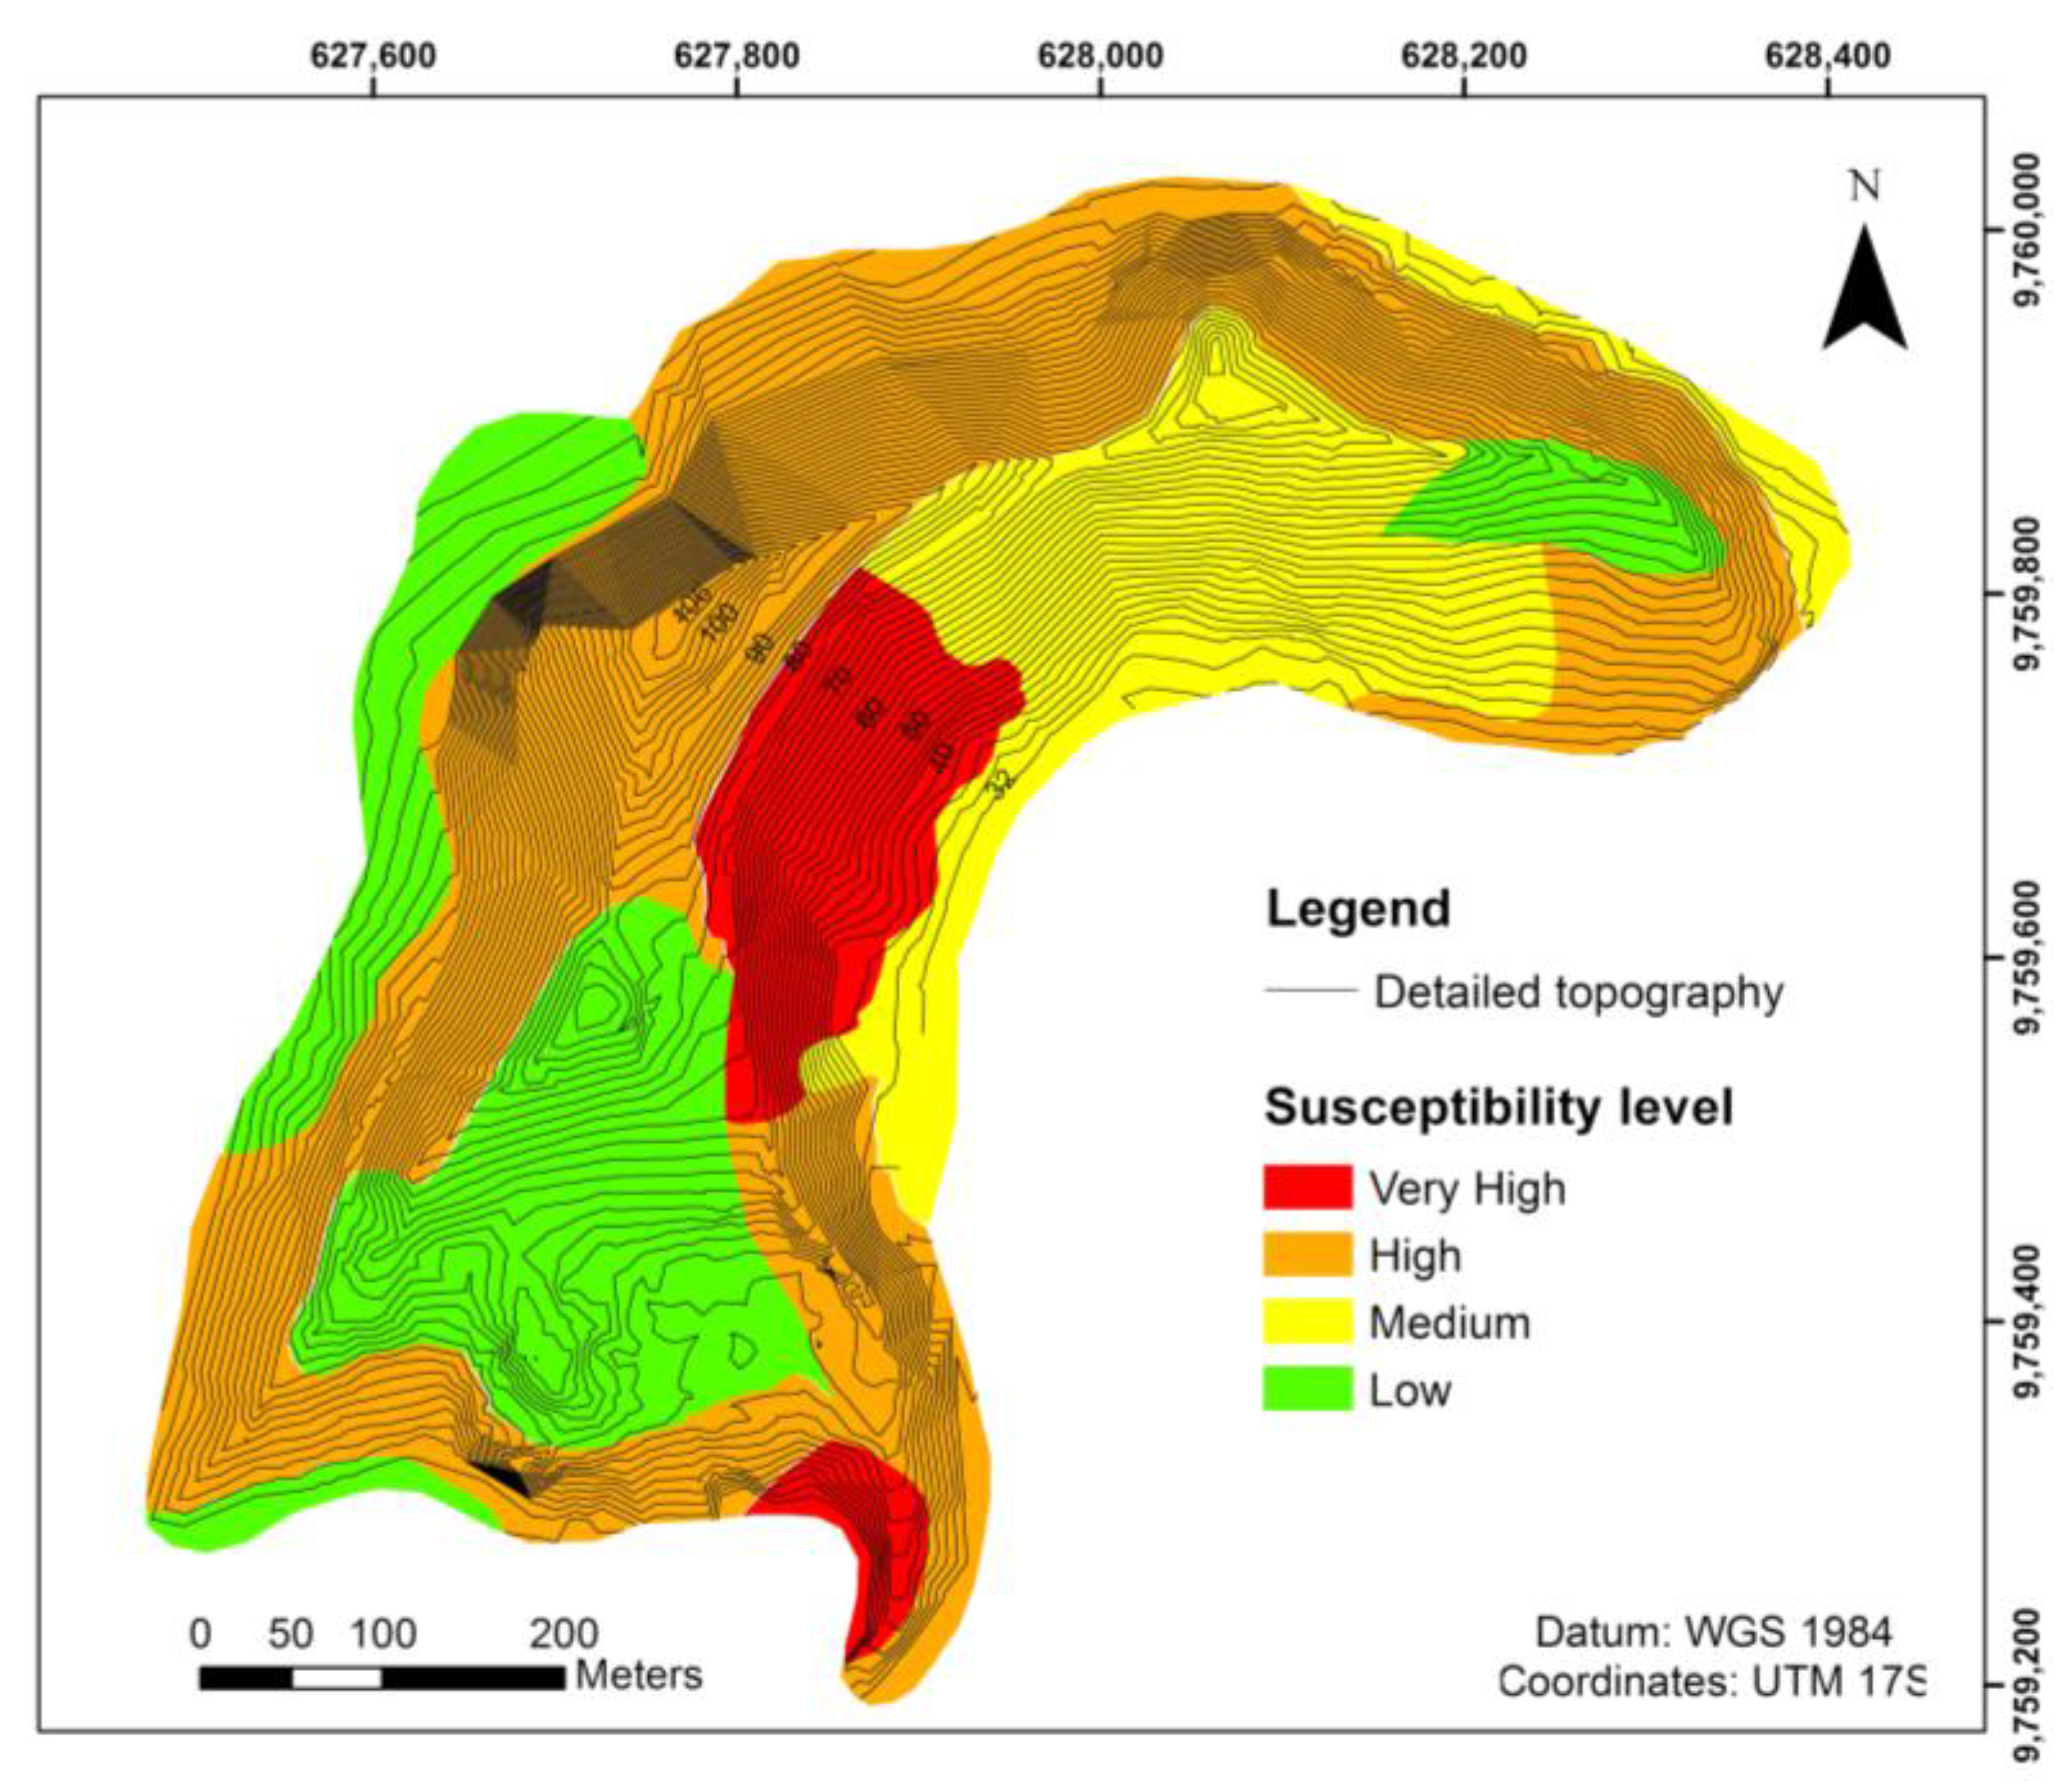
4.4. Detachment and Landslide Susceptibility
According to the proposed susceptibility classifications,
Table 14 and
Table 15 present the overall mass movement susceptibility assessment (
Table 6 and
Table 7).
Figure 8 shows the zoning of the study area.
In soils (
Table 12), four stations (GS05–GS07, GS09) were found to belong to landslide susceptibility category III, one (GS03) to category IV and three (GS01, GS11 and GS12) to category V. In rocks (
Table 13), three stations (GS04, GS08, GS10) fall into category III, and five stations (GS02, GS13–GS16) into category IV. Regarding the areas in
Figure 7, 22.80% of the total area has low susceptibility, 19.11% medium susceptibility, 48.54% high susceptibility and 9.55% very high susceptibility.
4.5. Stability Assessment
The 16 critical profiles can be seen in
Figure 9.
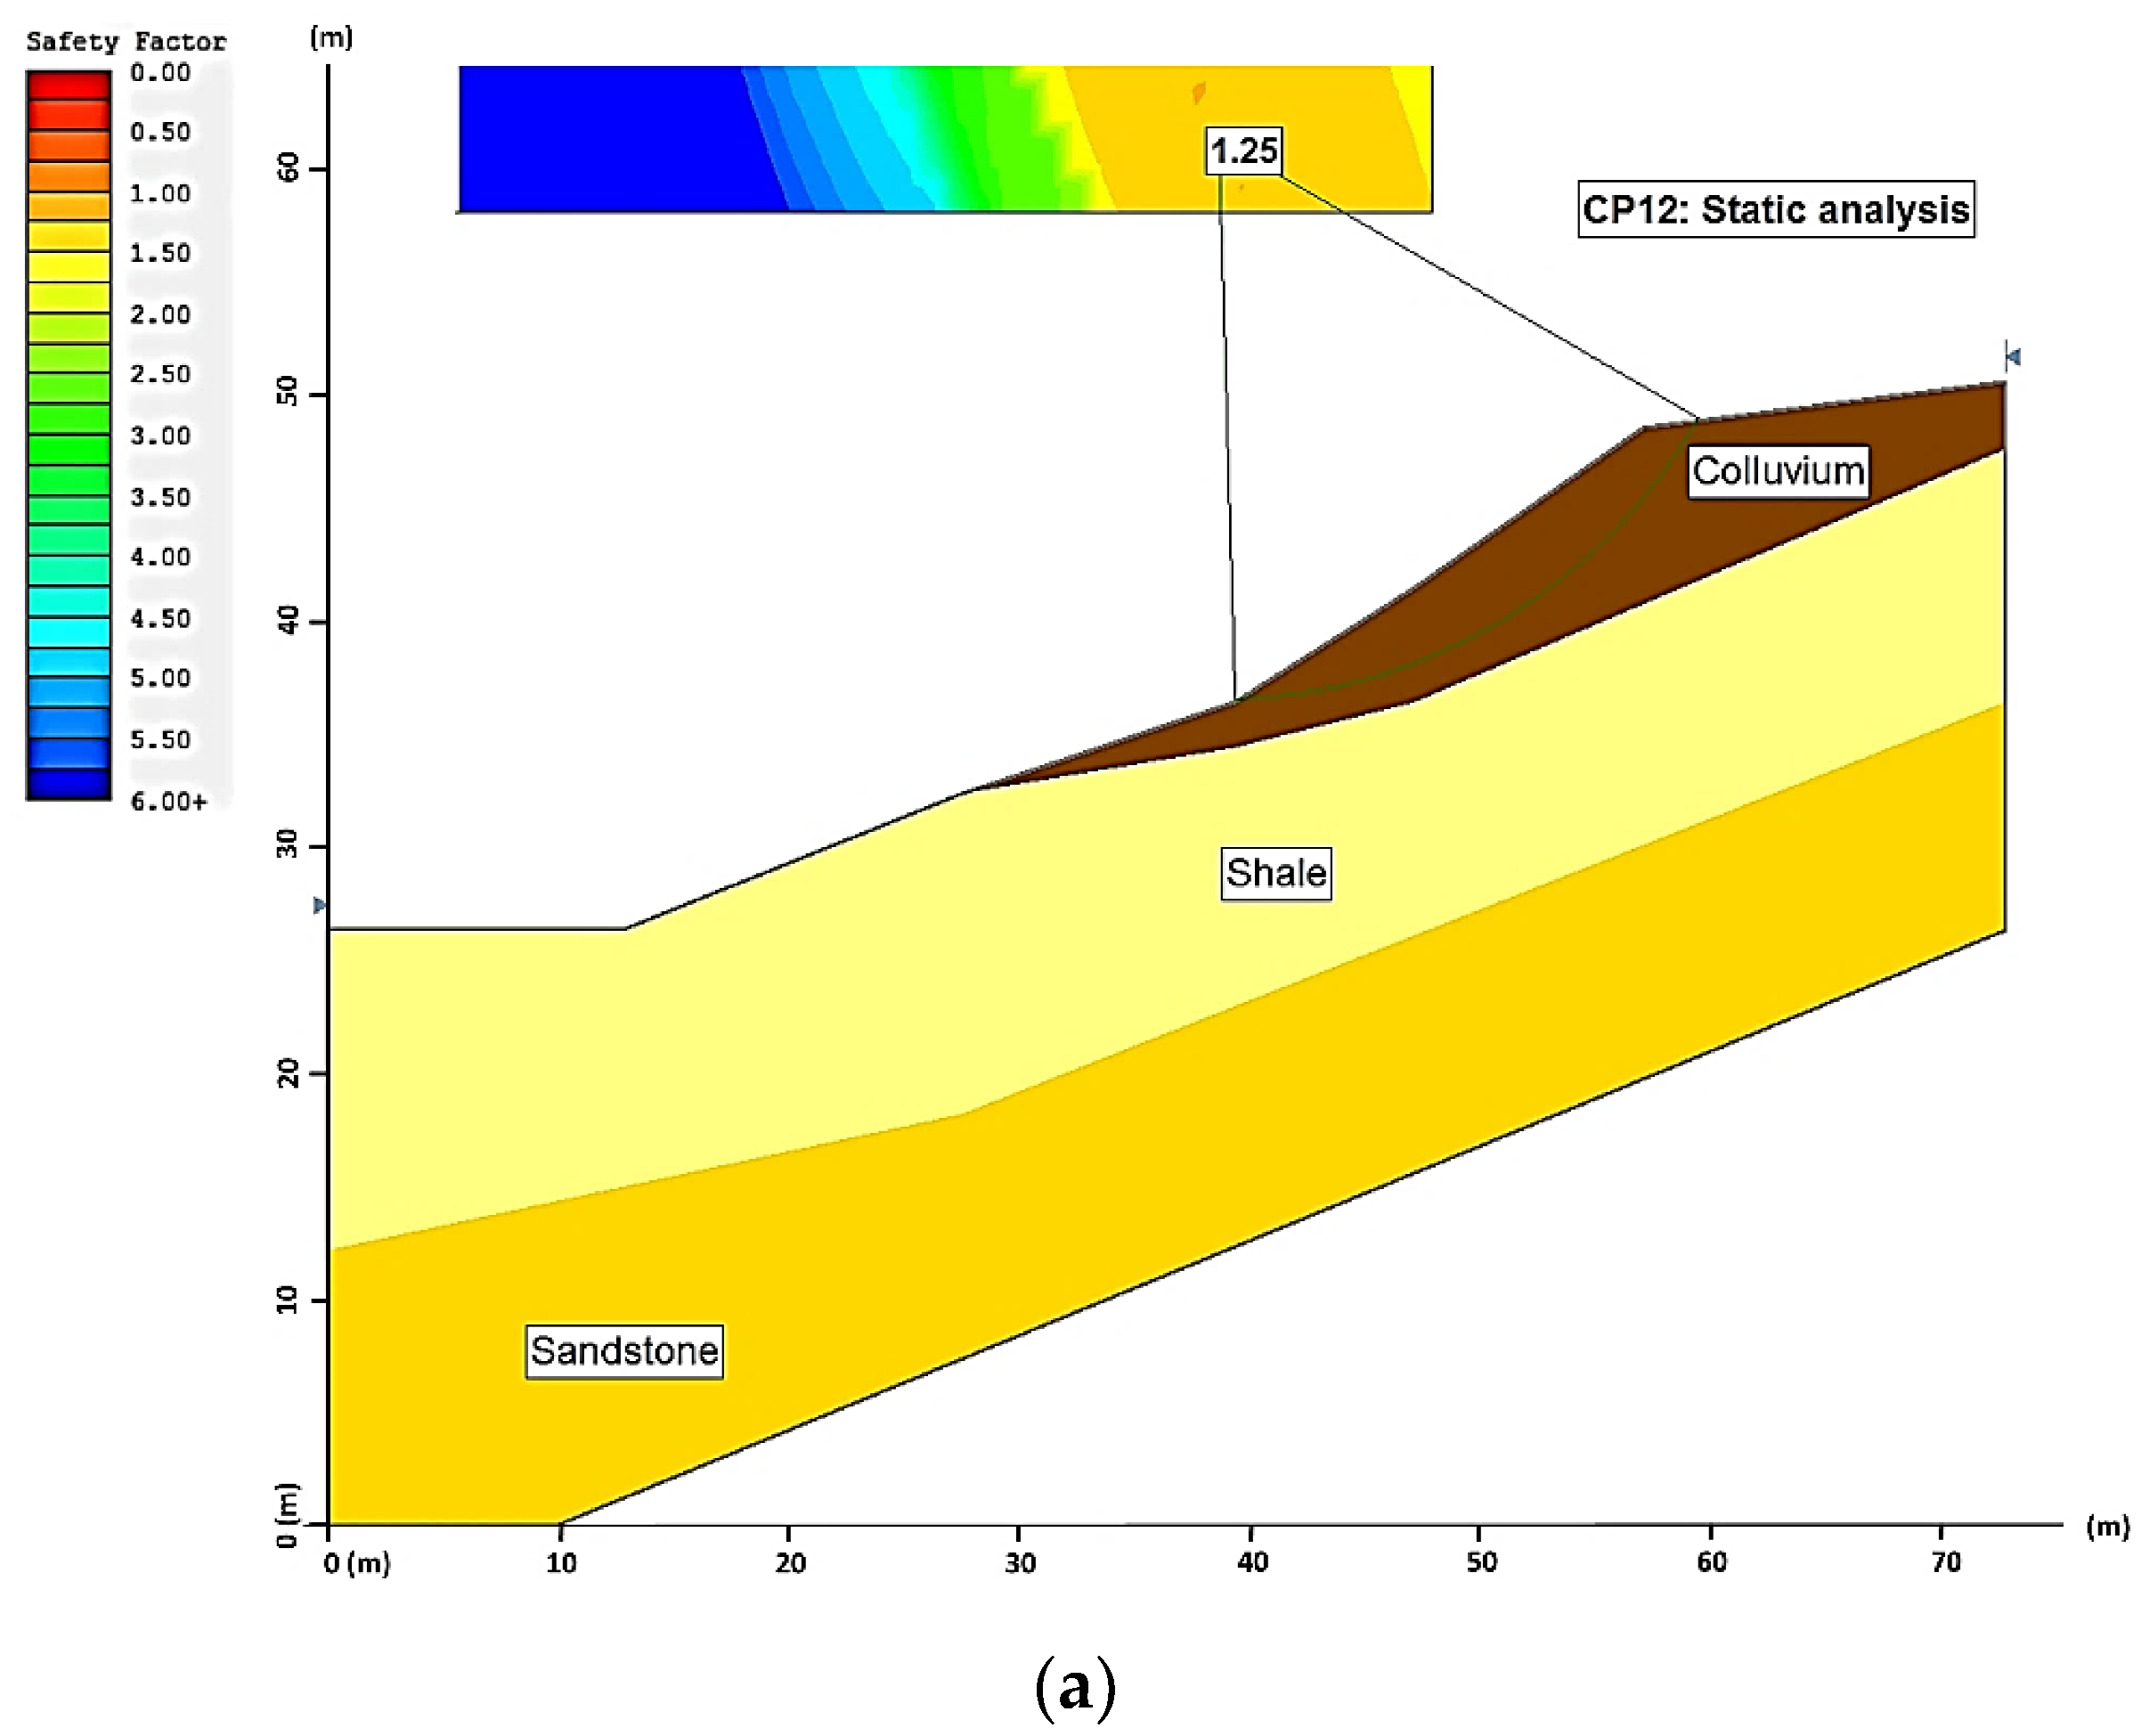
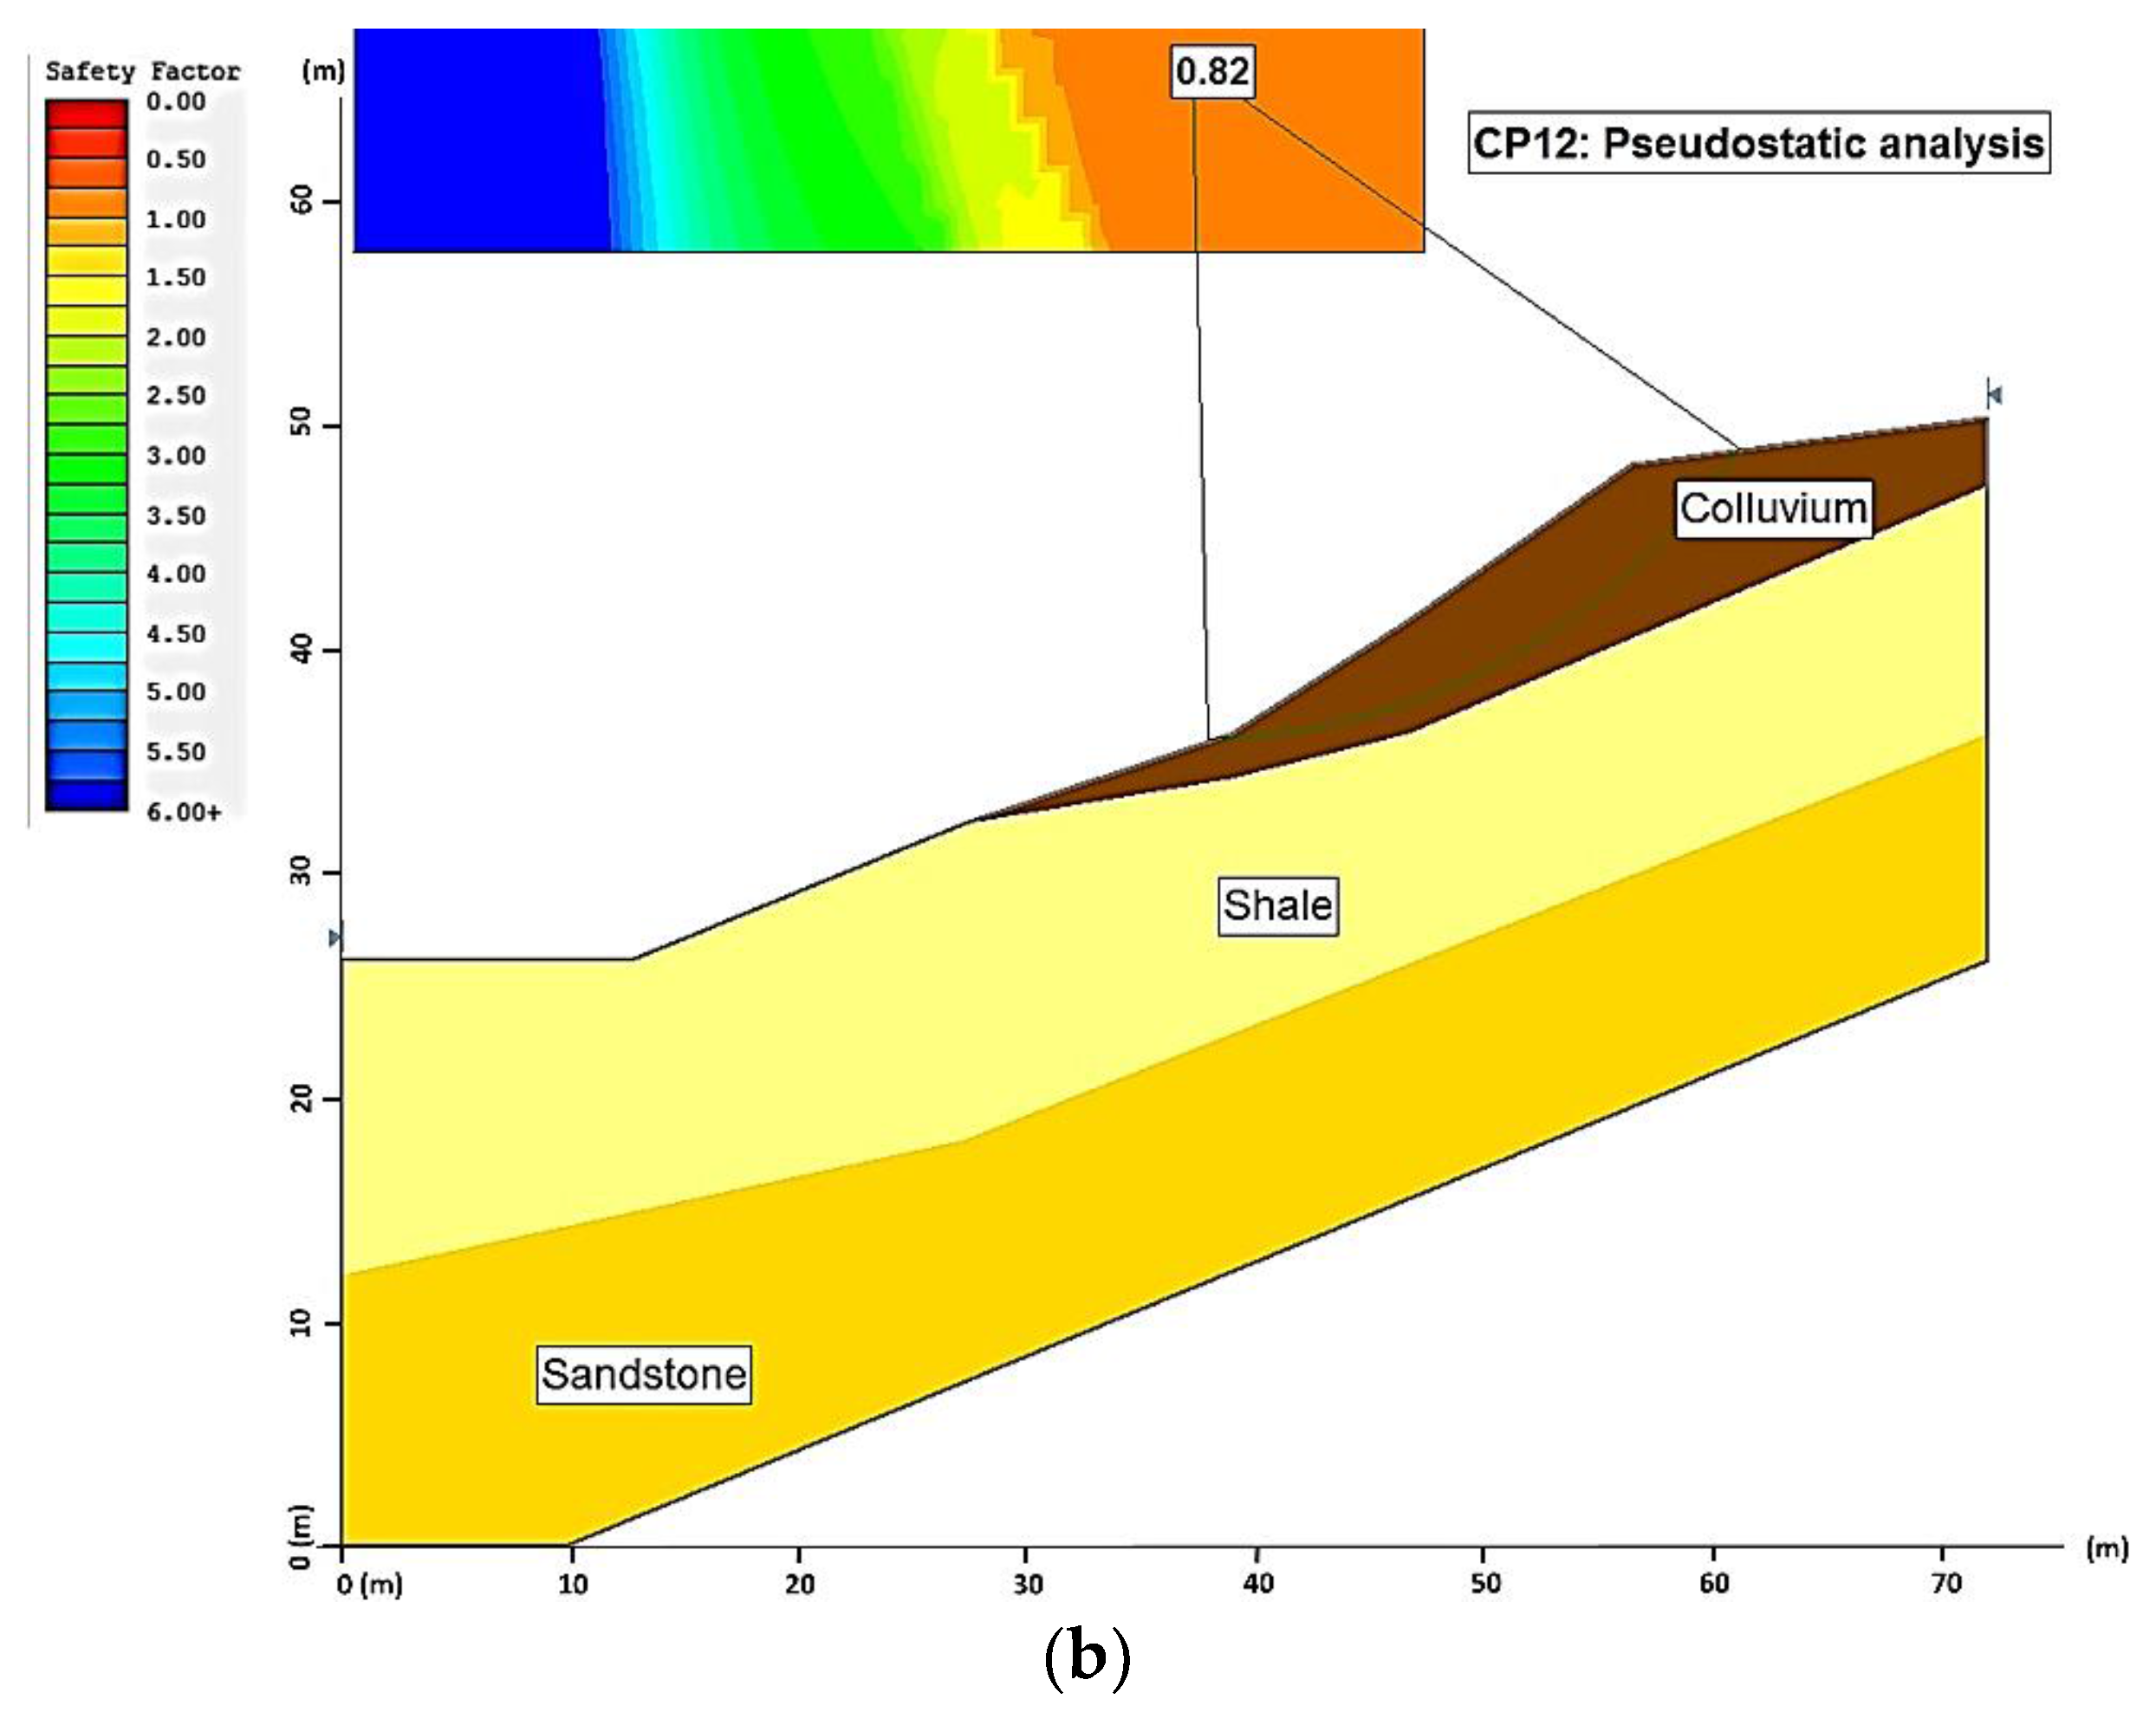
Figure 10a,b shows examples of profiles (CP12,
Figure 9) in the SLIDE program in static and pseudostatic conditions. For the stability assessment, the geotechnical parameters of
Table 16 were used, which were obtained from the results of
Table 11. In some profiles, colluvium’s presence was taken into account—its values of density, cohesion and friction angle present in a previous work were used [
33].
Table 17 shows the comparison of the susceptibility analysis and the safety factors (SF) of the stability analysis in the SLIDE program (obtained from critical profiles in
Figure 5). The safety factor was found to be between 0.76 and 2.64. Regarding susceptibility levels, the profiles CP10–CP16 range from high to very high susceptibility, while the profiles CP01–CP09 range from low to high.
5. Analysis of Results and Discussion
The sedimentary succession of “Las Cabras” hill (Duran) is characterised by the alternation of breccias, strongly fractured and weathered fine-grained silty sandstones, shales and argillites. The rock mass has a high weathering degree and both mechanical and chemical deterioration, which favours the formation of clay and residual soils. The instability observed on different slopes of “Las Cabras” hill is due to—among other causes—the dipping of the layers in the direction of the slope. This means that they are susceptible to different types of mass movement, as indicated by several authors [
3,
4].
Susceptibility was assessed (
Figure 7) through a combination of methods, in which several geomechanical parameters were considered [
21,
57,
61,
63,
64]. This allowed a specific categorisation (low to very high) of the landslide and rockfall conditions in the study area. The stability analysis demonstrated that different zones present an unstable equilibrium. Three of the studied profiles obtained values lower than one (profiles CP10, CP12 and CP13), and two profiles obtained values close to one (profiles CP15 and CP16). According to the NEC-15 [
66], Melentijevic [
69] and Morante et al. [
21], safety factors (SF) less than one represent instability.
The zones classified with high and very high susceptibility (
Figure 8) correspond to layers of shales and fractured sandstones. These zones were validated with the low resistivities (between 0 and 45 Ωm) in the first 15 m of the VESs carried out (
Supplementary Table S4). Additionally, from the results of
Table 15 (comparing SC and SF
pseudostatic), it can be observed that they agree with one another well. For example, the CP10 profile has a very high SC that agrees with the obtained SF of 0.76. Additionally, the CP04 profile has a high SC and agrees with the SF obtained of 1.25 (in
Supplementary Figure S6 can be seen the zoning map using the safety factor). Thanks to these comparisons, the reliability of the applied expert methodology can be established. This methodology considers the experience of the researchers and the geological-geotechnical characteristics, the relief and the environmental characteristics of the study site. This method has been used to assess landslide and detachment susceptibility in areas of sub-vertical and vertical slopes, and urban areas or sites of direct or indirect impact on populations or heritage sites. [
21,
54,
56,
64].
The obtained results provide a basis for stabilisation measures, solutions and territorial planning that guarantee safety. As a guideline of territorial planning, if it is not possible to ensure security in a given area, it must be reorganised.
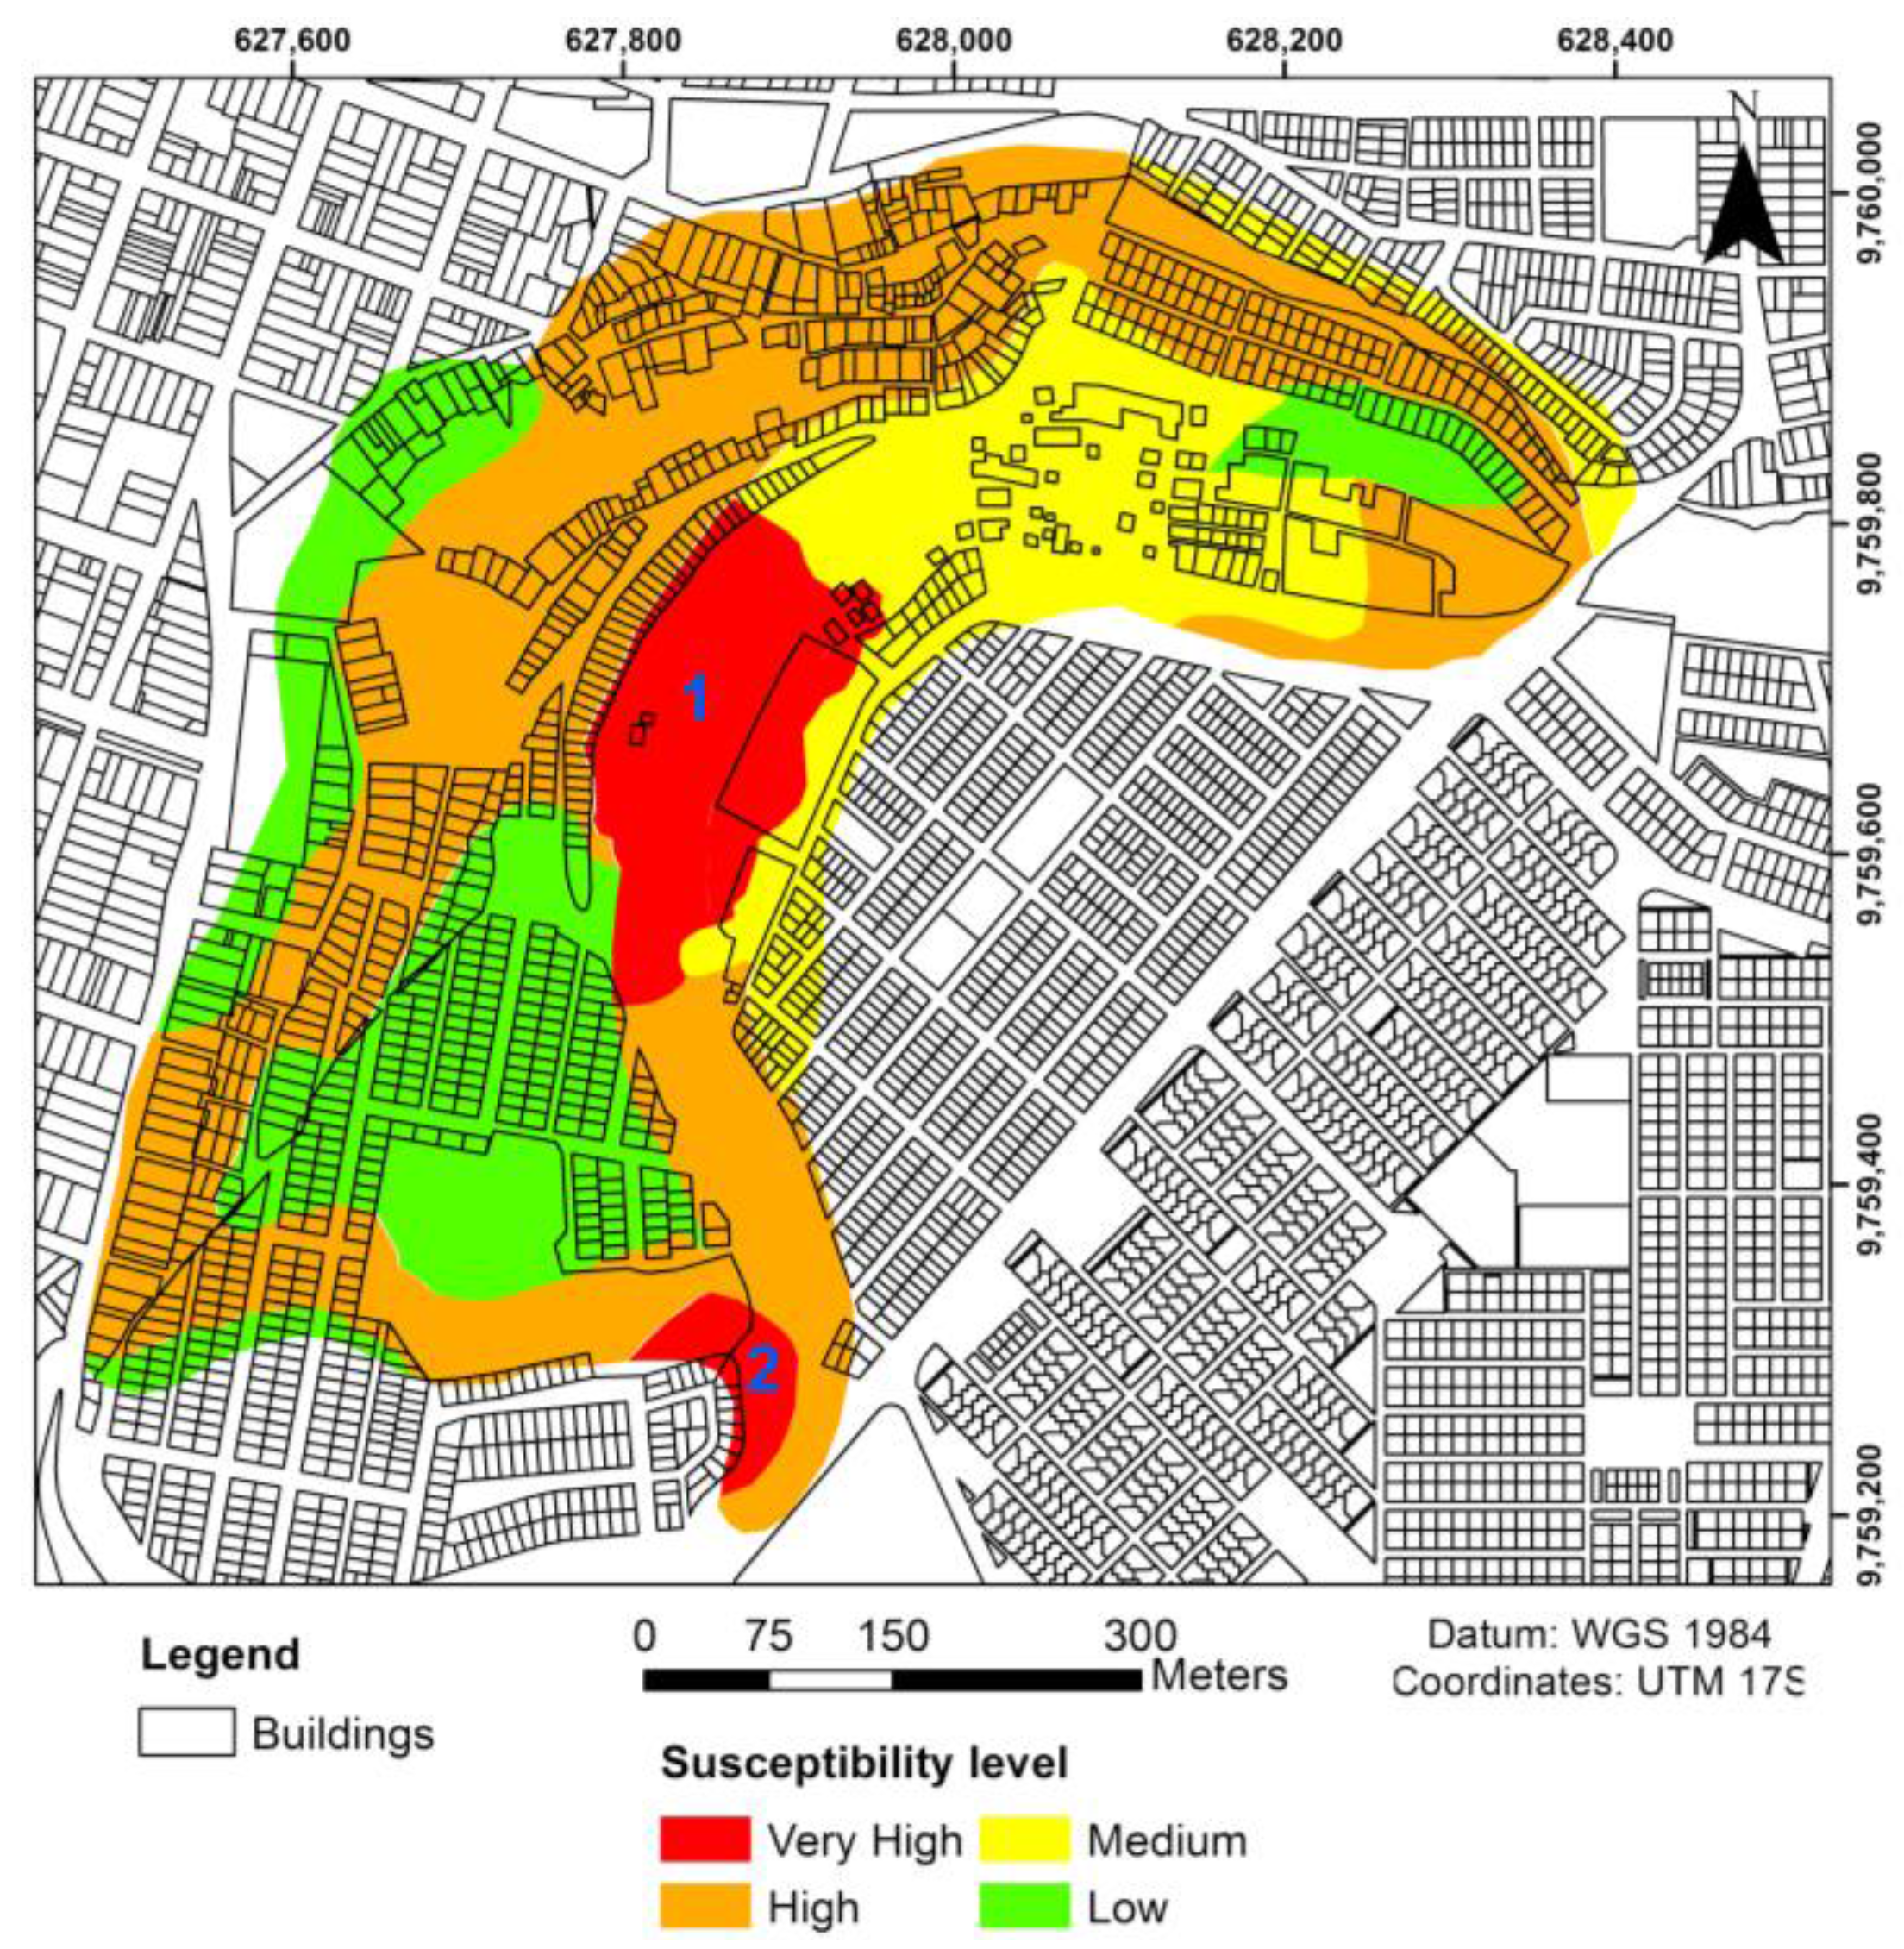
Figure 11 indicates the areas that must be given top priority. Two zones were identified where human settlements are present and the landslide susceptibility is very high: area 1 (2.93 Ha) and area 2 (0.54 Ha).
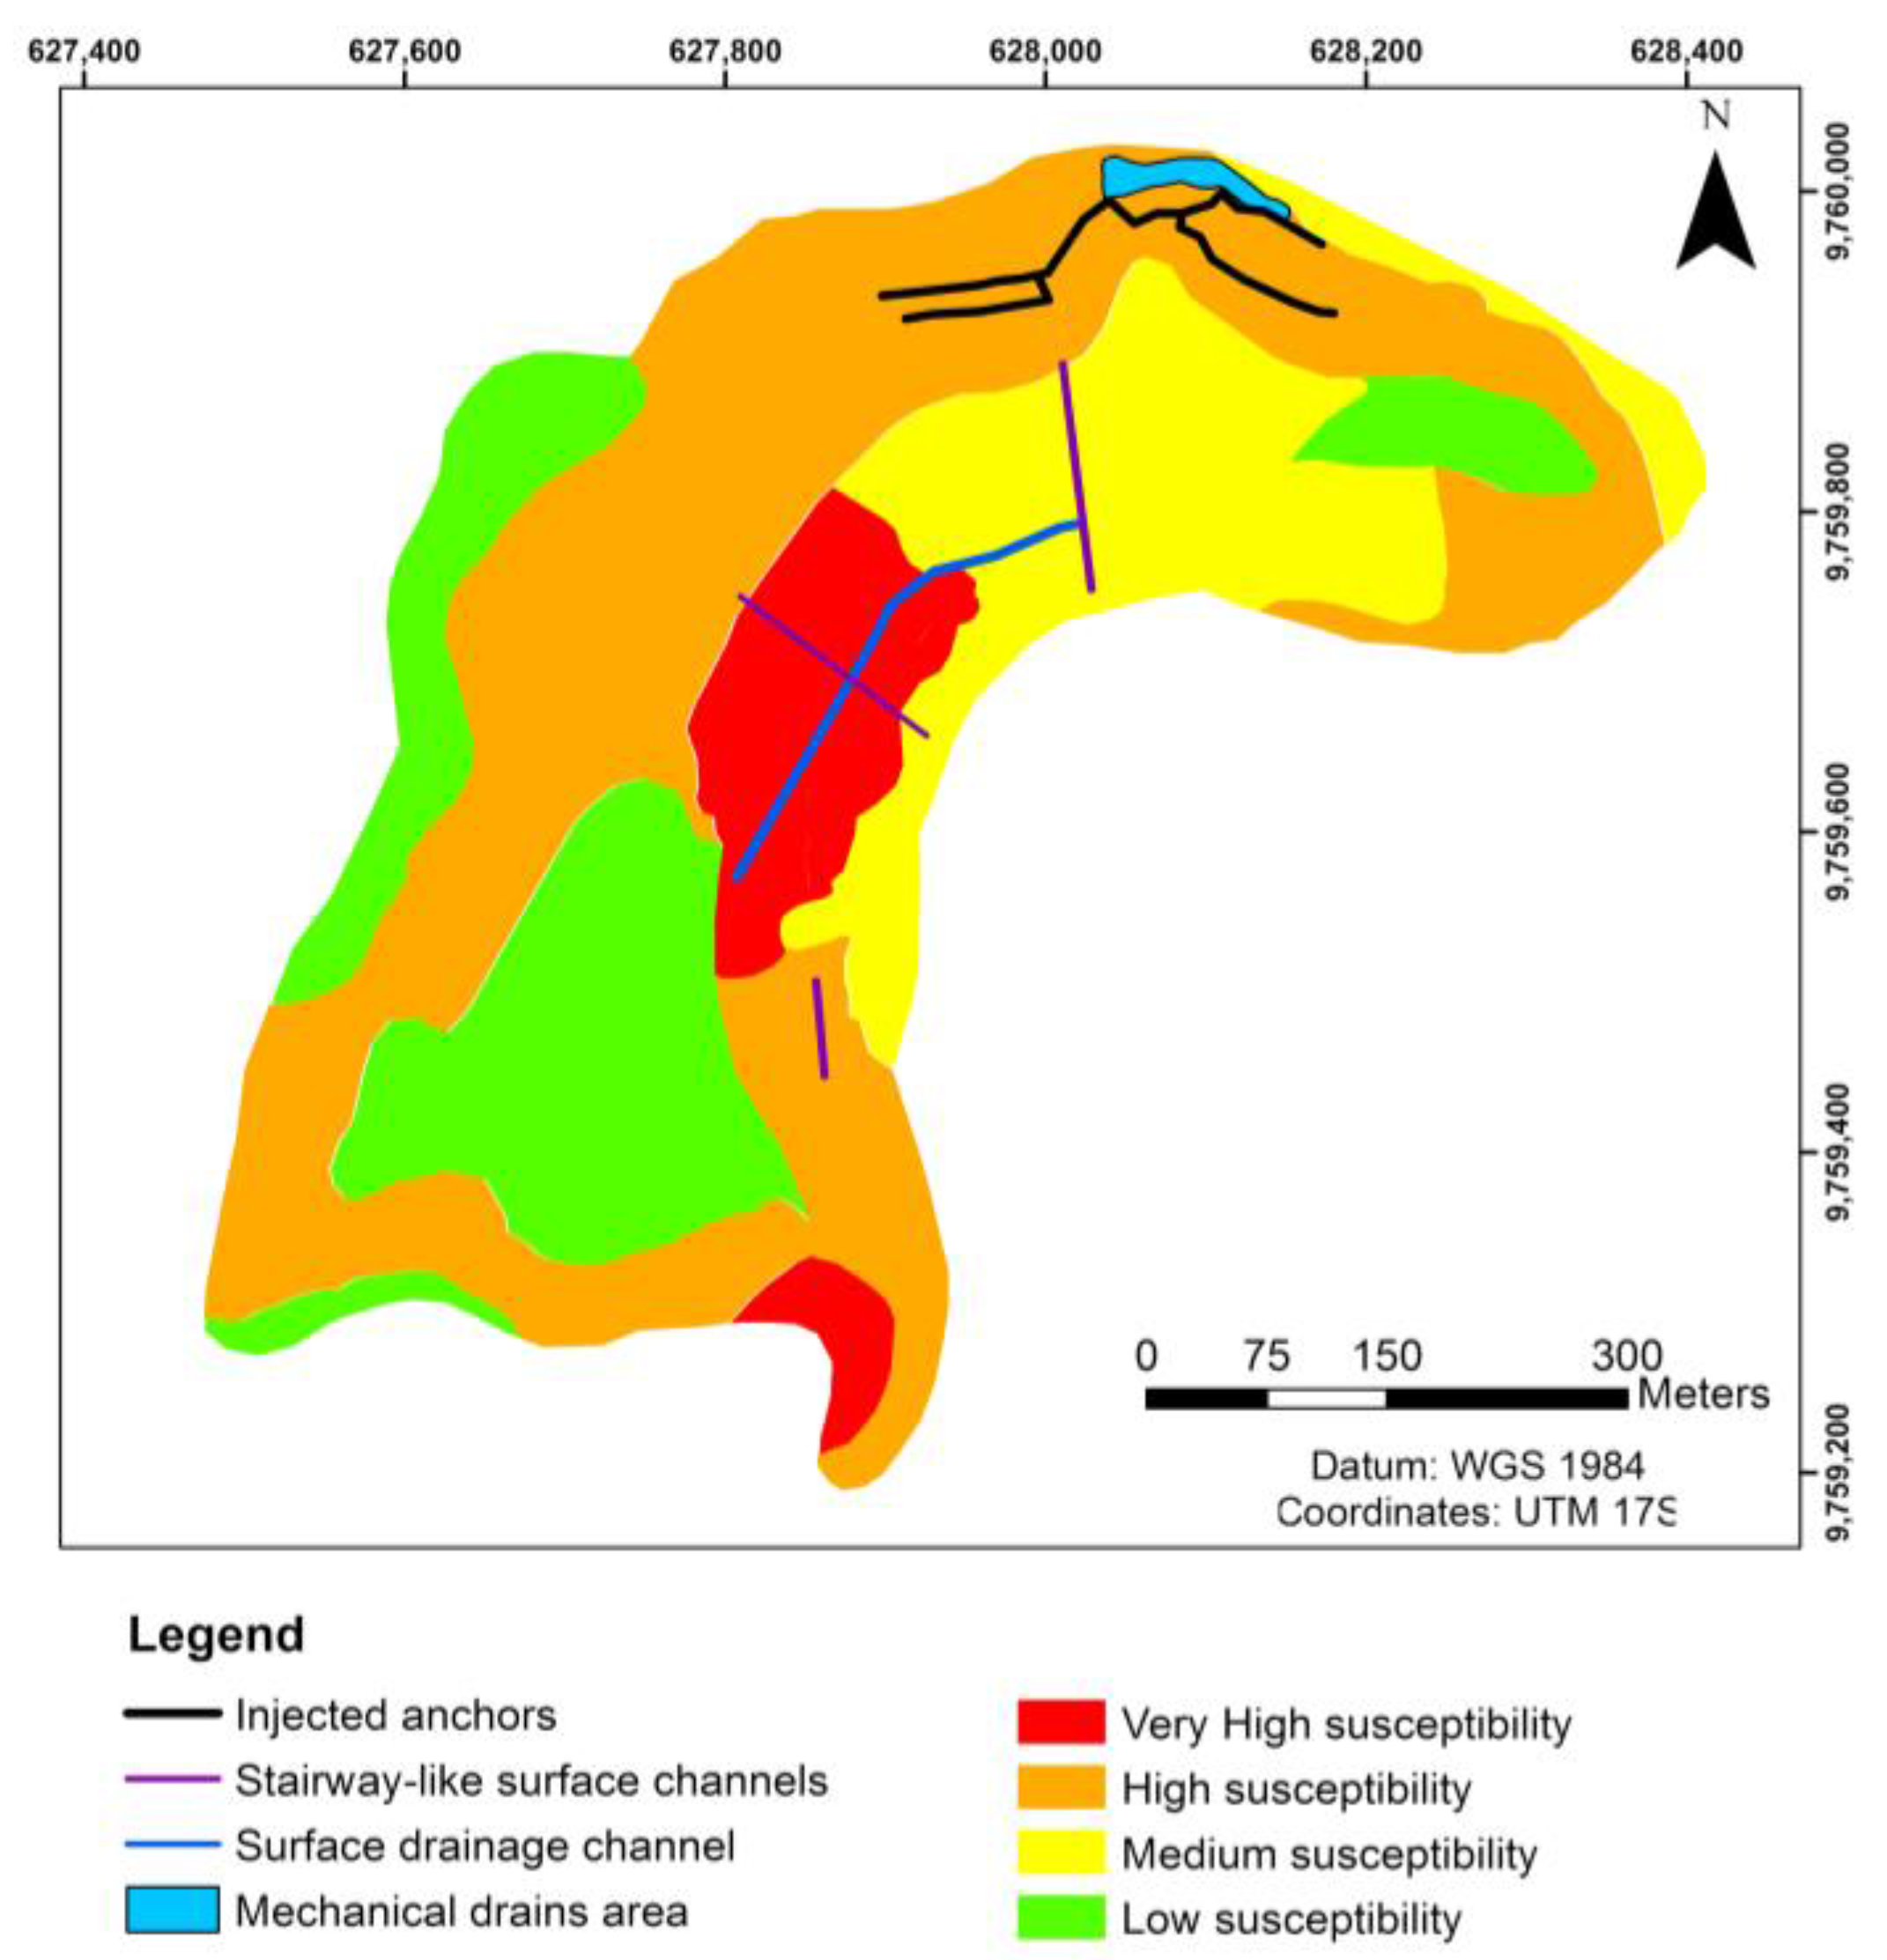
The stabilising measures should be selected so that they also generate added value. These works must start on the crown of the slope and proceed downwards. We do not propose to vacate houses, except those few that are particularly unsafe and are removed from the rest of the buildings. Solutions are proposed for both the southern and northern sides of “Las Cabras” hill. For the northern side, injected anchors (using gunite and Ø25 mm rods) and mechanical drains are proposed to reduce the water table in that area, and to be applied in combination with stairway-like surface channels to evacuate rainwater (
Figure 12).
Although a detailed study of triggers is beyond the scope of this study, a general approach is presented. Three possible factors were identified. Seismic activity is significant in the study area (up to 0.24 g [
66]) and is considered a possible triggering factor. Furthermore, two anthropic factors, namely, the presence of houses in inappropriate places (without territorial planning) and a sewer system in poor condition, must also be considered as potential triggers. These anthropic factors were not considered in the current stability analysis.
In summary, the problematic situation in Las Cabras hill is mainly due to the instability characteristics of the rock mass (deterioration, fracturing and in some cases the dipping of the layers) and the action of anthropic effects. This situation is conditioned by:
Instability of some slopes, due to, among other causes, the dip of the layers in the direction of the slope, the degree of fracturing and deterioration of the topmost ground layers. This facilitates erosion due to water flow through fissures, with the consequent destabilisation of the ground and buildings.
The terrain’s morphology, inadequate location and technical deficiencies of some of the constructions. Additionally, most buildings were constructed without any design or planning, which resulted in a chaotic distribution.
Malfunction of the natural drainage system, which is clogged due to uncontrolled constructions. The lack of additional water drainage channels.
6. Conclusions
The diagnosis of the current situation regarding the stability of “Las Cabras” hill was established through a geological–geomechanical study that included evaluating stability and susceptibility to landslide and detachment and the calculation of safety factor. The obtained results revealed a slope, on the northwest side, of very high to high susceptibility to landslide and detachment (more than 60% of the total area) and unstable areas (with SF less than 1). On the other hand, the most critical areas were the profiles CP10 to CP16 because the dip of the layers has a general south–southwest trend, which coincides with the slope of the terrain. It is recommended in critical sectors to leave buffer strips at the foot of these sectors and implement monitoring and protection measures.
As that part of the hill consists of competent and moderately competent rocks, three factors were considered to affect the possibility of mass movement: (a) problems with drainage (both rainwater and sewage); (b) negative anthropic actions (e.g., housing in inappropriate places, with direct and indirect consequences); and (c) the existing fracturing and weathering degrees of the rock.
Possible solutions to compensate for instabilities are based on controlling erosive processes on the rock masses that could move or slide. Solutions are proposed for both the north and south sides, including the implementation of injected anchors, mechanical drains and stairway-type surface channels to evacuate rainwater. These measures necessarily depend on territorial regulation and require constant monitoring due to the presence of buildings in the affected areas.
Supplementary Materials
The following materials are available online at
https://www.mdpi.com/article/10.3390/app11115013/s1. Table S1: Parameters used for the susceptibility evaluation. (Modified from: Ambalagán [
58], Suárez [
53], González, [
59], Nicholson [
57] and Blanco [
30]). Table S2: Descriptions of parameters used for the susceptibility evaluation. (Modified from: Ambalagán [
58], Suárez [
53], González, [
59], Nicholson [
57] and Blanco [
30]). Table S3: Descriptions of geological profiles 1, 2 and 3. Table S4: Descriptions of the 18 VESs. Table S5: Descriptions of pits P1 to P7. Table S6: Descriptions of the three perforations made (D1, D2 and D3). Figure S1: Geological profile 1. Figure S2: Geological profile 2. Figure S3: Geological profile 3. Figure S4: Correlations between the VESs (1–8) and drilling D2. It can be seen that the material obtained from drilling D2 (Shales) coincides with the resistivity presented (values between 20.0 and 30.0). Figure S5: Correlations between the VESs (10-11) and drilling D3. It can be seen that the material obtained from drilling D3 (Shales) coincides with the resistivity presented (values between 20.0 and 30.0). Figure S6: Zoning plan according to safety factor assessment
Author Contributions
Conceptualisation, P.C.-M., F.M.-C., R.B.-T. and J.B.-B.; methodology, P.C.-M., R.B.-T., J.B.-B. and E.B.; software, J.B.-B.; validation, P.C.-M., J.B.-B., F.M.-C. and R.B.-T.; formal analysis, R.B.-T., E.B. and D.S.-C.; investigation, P.C.-M., F.M.-C., R.B.-T. and D.S.-C.; resources, P.C.-M., E.B. and J.B.-B.; data curation, J.B.-B. and R.B.-T.; writing—original draft preparation, R.B.-T. and J.B.-B.; writing—review and editing, P.C.-M., F.M.-C., E.B., J.B.-B. and D.S.-C.; visualisation, J.B.-B. and E.B.; supervision, P.C.-M. and F.M.-C.; project administration, P.C.-M., F.M.-C. and J.B.-B.; funding acquisition, P.C.-M., F.M.-C. and E.B. All authors have read and agreed to the published version of the manuscript.
Funding
This research was funded by “Registro del Patrimonio Geológico y Minero y su incidencia en la defensa y preservación de la geodiversidad en Ecuador” (Registry of Geological and Mining Heritage and its impact on the defense and preservation of geodiversity in Ecuador); CIPAT-01-2018”; and “Studies and proposals for the stabilization of Las Cabras hill.”
Institutional Review Board Statement
Not applicable.
Informed Consent Statement
Not applicable.
Data Availability Statement
Acknowledgments
This work has been made possible thanks to support from ESPOL Polytechnic University. This work is based on previous initiatives sponsored by the Red Minería XXI (CYTED: 407310RT0402, IGME). The authors would like to express their thanks to Timea Kovacs for her suggestions, and to Maribel Aguilar and Joselyne Solórzano, researchers at CIPAT-ESPOL, for their collaboration. The authors would like to thank three anonymous reviewers for their constructive comments and the editorial office for the editorial handling.
Conflicts of Interest
The authors declare no conflict of interest.
References
- Cruden, D.M. A simple definition of a landslide. Bull. Int. Assoc. Eng. Geol.—Bull. L’Association Int. Géologie l’Ingénieur 1991, 43, 27–29. [Google Scholar] [CrossRef]
- Gudiyangada Nachappa, T.; Tavakkoli Piralilou, S.; Ghorbanzadeh, O.; Shahabi, H.; Blaschke, T. Landslide Susceptibility Mapping for Austria Using Geons and with the Dempster-Shafer Theory. Appl. Sci. 2019, 9, 5393. [Google Scholar] [CrossRef]
- Cruden, D.M.; Varnes, D.J. Landslide types and processes. Spec. Rep. Natl. Res. Counc. Transp. Res. Board 1996, 247, 36–75. [Google Scholar]
- Fell, R.; Corominas, J.; Bonnard, C.; Cascini, L.; Leroi, E.; Savage, W.Z. Guidelines for landslide susceptibility, hazard and risk zoning for land use planning. Eng. Geol. 2008, 102, 85–98. [Google Scholar] [CrossRef]
- Guzzetti, F.; Mondini, A.C.; Cardinali, M.; Fiorucci, F.; Santangelo, M.; Chang, K.T. Landslide inventory maps: New tools for an old problem. Earth-Sci. Rev. 2012, 112, 42–66. [Google Scholar] [CrossRef]
- Azarafza, M.; Ghazifard, A.; Akgün, H.; Asghari-Kaljahi, E. Landslide susceptibility assessment of South Pars Special Zone, southwest Iran. Environ. Earth Sci. 2018, 77, 805. [Google Scholar] [CrossRef]
- Segoni, S.; Rosi, A.; Rossi, G.; Catani, F.; Casagli, N. Analysing the relationship between rainfalls and landslides to define a mosaic of triggering thresholds for regional-scale warning systems. Nat. Hazards Earth Syst. Sci. 2014, 14, 2637–2648. [Google Scholar] [CrossRef]
- Carrara, A.; Crosta, G.; Frattini, P. Geomorphological and historical data in assessing landslide hazard. Earth Surf. Process. Landforms 2003, 28, 1125–1142. [Google Scholar] [CrossRef]
- Glade, T.; Crozier, M.J. Landslide geomorphology in a changing environment. Geomorphology 2010, 120, 1–2. [Google Scholar] [CrossRef]
- Calista, M.; Miccadei, E.; Piacentini, T.; Sciarra, N. Morphostructural, meteorological and seismic factors controlling landslides in weak rocks: The case studies of Castelnuovo and Ponzano (north east Abruzzo, central Italy). Geoscience 2019, 9, 122. [Google Scholar] [CrossRef]
- Dai, Z.; Guo, J.; Luo, H.; Li, J.; Chen, S. Strength Characteristics and Slope Stability Analysis of Expansive Soil with Filled Fissures. Appl. Sci. 2020, 10, 4616. [Google Scholar] [CrossRef]
- Dai, F.C.; Lee, C.F.; Ngai, Y.Y. Landslide risk assessment and management: An overview. Eng. Geol. 2002, 64, 65–87. [Google Scholar] [CrossRef]
- Gardner, J.S.; Dekens, J. Mountain hazards and the resilience of social-ecological systems: Lessons learned in India and Canada. Nat. Hazards 2007, 41, 317–336. [Google Scholar] [CrossRef]
- Turconi, L.; Luino, F.; Gussoni, M.; Faccini, F.; Giardino, M.; Casazza, M. Intrinsic environmental vulnerability as shallow landslide susceptibility in environmental impact assessment. Sustainability 2019, 11, 6285. [Google Scholar] [CrossRef]
- Mavroulis, S.; Triantafyllou, I.; Karavias, A.; Gogou, M.; Katsetsiadou, K.-N.; Lekkas, E.; Papadopoulos, G.A.; Parcharidis, I. Primary and Secondary Environmental Effects Triggered by the 30 October 2020, Mw = 7.0, Samos (Eastern Aegean Sea, Greece) Earthquake Based on Post-Event Field Surveys and InSAR Analysis. Appl. Sci. 2021, 11, 3281. [Google Scholar] [CrossRef]
- Liu, S.; Segoni, S.; Raspini, F.; Yin, K.; Zhou, C.; Zhang, Y.; Casagli, N. Satellite InSAR as a New Tool for the Verification of Landslide Engineering Remedial Works at the Regional Scale: A Case Study in the Three Gorges Resevoir Area, China. Appl. Sci. 2020, 10, 6435. [Google Scholar] [CrossRef]
- Froude, M.J.; Petley, D.N. Global fatal landslide occurrence from 2004 to 2016. Nat. Hazards Earth Syst. Sci. 2018, 18, 2161–2181. [Google Scholar] [CrossRef]
- Mineo, S.; Pappalardo, G.; Mangiameli, M.; Campolo, S.; Mussumeci, G. Rockfall analysis for preliminary hazard assessment of the cliff of taormina Saracen Castle (Sicily). Sustainability 2018, 10, 417. [Google Scholar] [CrossRef]
- Carrión Mero, P.; Blanco Torrens, R.; Borja Bernal, C.; Aguilar Aguilar, M.; Morante Carballo, F.; Briones Bitar, J. Geomechanical and Analysis of the Effects of Rock Massif in Zaruma City, Ecuador. In Proceedings of the LACCEI International Multi-Conference for Engineering, Education and Technology, Montego Bay, Jamaica, 24–26 July 2019; Latin American and Caribbean Consortium of Engineering Institutions: Boca Raton, FL, USA, 2019; Volume 2019. [Google Scholar]
- Gordo, C.; Zêzere, J.L.; Marques, R. Landslide susceptibility assessment at the basin scale for rainfall- and earthquake-triggered shallow slides. Geosciences 2019, 9, 268. [Google Scholar] [CrossRef]
- Morante, F.; Aguilar, M.; Ramírez, G.; Blanco, R.; Carrión, P.; Briones, J.; Berrezueta, E. Evaluation of Slope Stability Considering the Preservation of the General Patrimonial Cemetery of Guayaquil, Ecuador. Geosciences 2019, 9, 103. [Google Scholar] [CrossRef]
- Sestraș, P.; Bilașco, Ș.; Roșca, S.; Naș, S.; Bondrea, M.; Gâlgău, R.; Vereș, I.; Sălăgean, T.; Spalević, V.; Cîmpeanu, S. Landslides Susceptibility Assessment Based on GIS Statistical Bivariate Analysis in the Hills Surrounding a Metropolitan Area. Sustainability 2019, 11, 1362. [Google Scholar] [CrossRef]
- Evans, S.G.; Hungr, O. The assessment of rockfall hazard at the base of talus slopes. Can. Geotech. J. 1993, 30, 620–636. [Google Scholar] [CrossRef]
- Crosta, G.B.; Agliardi, F. A methodology for physically based rockfall hazard assessment. Nat. Hazards Earth Syst. Sci. 2003, 3, 407–422. [Google Scholar] [CrossRef]
- Macciotta, R.; Martin, C.D.; Morgenstern, N.R.; Cruden, D.M. Quantitative risk assessment of slope hazards along a section of railway in the Canadian Cordillera—A methodology considering the uncertainty in the results. Landslides 2016, 13, 115–127. [Google Scholar] [CrossRef]
- Barrantes Castillo, G.; Barrantes Sotela, O.; Núñez Roman, O. Efectividad de la metodología Mora-Vahrson modificada en el caso de los deslizamientos provocados por el terremoto de Cinchona, Costa Rica. Rev. Geográfica América Cent. 2011, 2, 141–162. [Google Scholar]
- Anbalagan, R.; Chakraborty, D.; Kohli, A. Landslide hazard zonation (LHZ) mapping on meso-scale for systematic town planning in mountainous terrain. J. Sci. Ind. Res. 2008, 67, 486–497. [Google Scholar]
- Briones-Bitar, J.; Carrión-Mero, P.; Montalván-Burbano, N.; Morante-Carballo, F. Rockfall Research: A Bibliometric Analysis and Future Trends. Geosciences 2020, 10, 403. [Google Scholar] [CrossRef]
- Brabb, E.E.; Pampeyan, E.H.; Bonilla, M.G. Landslide susceptibility in San Mateo County, California. In Miscellaneous Field Studies Map; U.S. Geological Survey: Reston, CA, USA, 1972; Volume 360. [Google Scholar]
- Kienholz, H. Maps of Geomorphology and Natural Hazards of Grindelwald, Switzerland: Scale 1:10,000. Arct. Alp. Res. 1978, 10, 168. [Google Scholar] [CrossRef]
- Fell, R. Landslide risk assessment and acceptable risk. Can. Geotech. J. 1994, 31, 261–272. [Google Scholar] [CrossRef]
- Rossi, M.; Guzzetti, F.; Reichenbach, P.; Mondini, A.C.; Peruccacci, S. Optimal landslide susceptibility zonation based on multiple forecasts. Geomorphology 2010, 114, 129–142. [Google Scholar] [CrossRef]
- Blanco, R. Estudios y Propuestas de Estabilización del Cerro Las Cabras; CIPAT-ESPOL: Guayaquil, Ecuador, 2015. [Google Scholar]
- Grozavu, A.; Mǎrgǎrint, M.C.; Patriche, C.V. GIS applications for landslide susceptibility assessment: A case study in Iaşi county (Moldavian plateau, Romania). In WIT Transactions on Information and Communication Technologies; Springer: Berlin, Germany, 2010; Volume 43. [Google Scholar]
- Lee, S.; Ryu, J.H.; Kim, I.S. Landslide susceptibility analysis and its verification using likelihood ratio, logistic regression, and artificial neural network models: Case study of Youngin, Korea. Landslides 2007, 4, 327–338. [Google Scholar] [CrossRef]
- Morante Carballo, F.; Carrión Mero, P.; Ángel Chávez, M.; Aguilar Aguilar, M.; Briones Bitar, J. Design of the Stabilization Solutions in the General Patrimonial Cemetery of Guayaquil, Ecuador. In Proceedings of the LACCEI International Multi-Conference for Engineering, Education and Technology, Montego Bay, Jamaica, 24–26 July 2019; Latin American and Caribbean Consortium of Engineering Institutions: Boca Raton, FL, USA, 2019; Volume 2019. [Google Scholar]
- Universo 12 Familias Saldrán del Cerro Las Cabras en Durán. Available online: http://www.eluniverso.com/noticias/2014/01/24/nota/2075171/12-familias-saldran-cerro-cabras (accessed on 15 January 2021).
- Universo Deslaves en la Parte sur del Cerro Las Cabras. Available online: https://www.eluniverso.com/2004/02/18/0001/18/51DC33943191487EBF2C609A95D9FD23.html (accessed on 15 January 2021).
- Durán Cerro Las Cabras. Available online: http://www.duran.gob.ec/municipio/inicio/ (accessed on 29 March 2021).
- INEC Censo Poblacional. Available online: https://www.ecuadorencifras.gob.ec/institucional/home/ (accessed on 29 March 2021).
- INAMHI Datos Meteorológicos e Hidrológicos. Available online: www.serviciometeorologico.gob.ec (accessed on 29 March 2021).
- Machiels, L.; Garcés, D.; Snellings, R.; Vilema, W.; Morante, F.; Paredes, C.; Elsen, J. Zeolite occurrence and genesis in the Late-Cretaceous Cayo arc of Coastal Ecuador: Evidence for zeolite formation in cooling marine pyroclastic flow deposits. Appl. Clay Sci. 2014, 87, 108–119. [Google Scholar] [CrossRef]
- Machiels, L.; Morante, F.; Snellings, R.; Calvo, B.; Canoira, L.; Paredes, C.; Elsen, J. Zeolite mineralogy of the Cayo formation in Guayaquil, Ecuador. Appl. Clay Sci. 2008, 42, 180–188. [Google Scholar] [CrossRef]
- Hans, E. Thalmann. Micropaleontology of Upper Cretaceous and Paleocene in Western Ecuador. Am. Assoc. Pet. Geol. Bull. 1946, 30, 337–347. [Google Scholar]
- Benitez, S. Évolution géodynamique de la province côtière sud-équatorienne au Crétacé supérieur—Tertiaire. Géology Alp. 1995, 71, 3–163. [Google Scholar]
- Carrión-Mero, P.; Quiñonez-Barzola, X.; Morante-Carballo, F.; Montalván, F.J.; Herrera-Franco, G.; Plaza-Úbeda, J. Geometric Model of a Coastal Aquifer to Promote the Sustainable Use of Water. Manglaralto, Ecuador. Water 2021, 13, 923. [Google Scholar] [CrossRef]
- Carrión-Mero, P.; Morante-Carballo, F.; Toalombo-Chimborazo, M.; Mora-Villón, D.; Briones-Bitar, J.; Berrezueta, E. Groundwater Exploration for a Susutainable Supply Plan in a Rural Community: Case Cadeate, Santa Elena, Ecuador. In Proceedings of the LACCEI International Multi-Conference for Engineering, Education and Technology, Online, 27–31 July 2020; Latin American and Caribbean Consortium of Engineering Institutions: Boca Raton, FL, USA, 2020. [Google Scholar]
- Li, D.; Wong, L.N.Y. The Brazilian Disc Test for Rock Mechanics Applications: Review and New Insights. Rock Mech. Rock Eng. 2013, 46, 269–287. [Google Scholar] [CrossRef]
- Andreev, G.E. A review of the Brazilian test for rock tensile strength determination. Part I: Calculation formula. Min. Sci. Technol. 1991, 13, 445–456. [Google Scholar] [CrossRef]
- Hoek, E. Estimating Mohr-Coulomb friction and cohesion values from the Hoek-Brown failure criterion. Int. J. Rock Mech. Min. Sci. Geomech. Abstr. 1990, 27, 227–229. [Google Scholar] [CrossRef]
- Labuz, J.F.; Zang, A. Mohr–Coulomb Failure Criterion. Rock Mech. Rock Eng. 2012, 45, 975–979. [Google Scholar] [CrossRef]
- Deere, D.U. Technical Description of Rock Cores.pdf. Felsmech. Ingenieurgeol. 1963, I, 18–22. [Google Scholar]
- Palmström, A. Measurement and of rock mass jointing. In In-Situ Characterization of Rocks—Chapter 2; CRC Press: Boca Raton, FL, USA, 2001; pp. 1–40. [Google Scholar]
- Carrión-Mero, P.; Solórzano, J.; Chávez, M.Á.; Blanco, R.; Morante-Carballo, F.; Aguilar, M.; Briones-Bitar, J. Evaluation of geomechanical features and stability for the recommendations and rehabilitation of the Humberto Molina Hospital, Zaruma, El Oro, Ecuador. In Sustainable Development and Planning XI.; WIT Press: Ashurst, UK, 2020; Volume I, pp. 455–466. [Google Scholar]
- Chavez, M.; Guardado, R. Evaluación ingeniero-geológica del deterioro de las rocas en la provincia de Manabí, Ecuador. Minería y Geol. 2008, 24, 13. [Google Scholar]
- Carrión-Mero, P.; Pineda-Ruiz, R.; Chávez, M.Á.; Morante-Carballo, F.; Blanco, R.; Aguilar, M.; Briones-Bitar, J. Geomechanical evaluation of the Olon cliff for stabilization pre-design of the Blanca Estrella del Mar Sanctuary, Santa Elena, Ecuador. In Sustainable Development and Planning XI.; WIT Press: Ashurst, UK, 2020; Volume I, pp. 467–479. [Google Scholar]
- Suárez, J. Deslizamientos Y Estabilidad De Taludes En Zonas Tropicales. Inst. Investig. Erosión Deslizam. 1998, 1, 550. [Google Scholar]
- López-Jimeno, C. Manual de Estabilización y Revegetación de Taludes.; Ediciones Graficas Árias Montano: Madrid, Spain, 1999. [Google Scholar]
- Hoek, E.; Carter, T.G.; Diederichs, M.S. Quantification of the geological strength index chart. In Proceedings of the 47th US Rock Mechanics/Geomechanics Symposium 2013, San Francisco, CA, USA, 23–26 June 2013; Volume 3, pp. 1757–1764. [Google Scholar]
- Hoek, E.; Brown, E.T. The Hoek–Brown failure criterion and GSI—2018 edition. J. Rock Mech. Geotech. Eng. 2019, 11, 445–463. [Google Scholar] [CrossRef]
- Nicholson, D.T.; Hencher, S. Assesment the potential for deterioration of engineered Rock Slopes. In Proceedings of the International Symposium of Engineering and the Environment, Athens, Greece, 23–27 June 1997; pp. 911–917. [Google Scholar]
- Ambalagán, R. Terrain Evaluation and Landslides Hazard Zonation for Environmental Regenaration and Land Use Planning in Mountainow Terrain. In Proceedings of the Sixth International Symposium on Landslide, Innsbruck, UK, 11–15 April 1992; Bell, D.H., Ed.; Wiley: Rotterdam, The Netherlands; Wiley: Christchurch, New Zealand, 1992; pp. 861–871. [Google Scholar]
- González, A.J. Metodología y Criterios de Clasificación para Inventarios de Movimientos de Masas. In Proceedings of the Memorias I Simposio Sudamericano de Deslizamiento, Paipa, Colombia, 7–10 August 1989; Sociedad Colombiana de Geotecnia: Paipa, Colombia, 1989; pp. 677–698. [Google Scholar]
- Carrión-Mero, P.; Aguilar-Aguilar, M.; Morante-Carballo, F.; Domínguez-Cuesta, M.J.; Sánchez-Padilla, C.; Sánchez-Zambrano, A.; Briones-Bitar, J.; Blanco-Torrens, R.; Córdova-Rizo, J.; Berrezueta, E. Surface and Underground Geomechanical Characterization of an Area Affected by Instability Phenomena in Zaruma Mining Zone (Ecuador). Sustainability 2021, 13, 3272. [Google Scholar] [CrossRef]
- Rocscience. Slide 5.0 Guide; Rocscience Inc.: Toronto, ON, Canada, 2002; p. 90. [Google Scholar]
- MIDUVI Capítulos de la NEC (Norma Ecuatoriana de la Construcción). Available online: https://www.habitatyvivienda.gob.ec/documentos-normativos-nec-norma-ecuatoriana-de-la-construccion/ (accessed on 29 March 2021).
- Bishop, A.W. The use of the slip circle in the stability analysis of slopes. Geotechnique 1955, 5, 7–17. [Google Scholar] [CrossRef]
- Bishop, A.W. The use of pore-pressure coefficients in practice. Geotechnique 1954, 4, 148–152. [Google Scholar] [CrossRef]
- Melentijevic, S. Estabilidad de Taludes en Macizos Rocosos con Criterios de Rotura no Lineales y Leyes de Fluencia no Asociada. Ph.D. Thesis, E.T.S.I. Caminos, Canales y Puertos (UPM), Madrid, Spain, 2005. [Google Scholar]
Figure 1.
Location of the study area: (a) locations of Duran and Guayaquil cantons within the Province of Guayas, Ecuador; and (b) geology of the study area.
Figure 1.
Location of the study area: (a) locations of Duran and Guayaquil cantons within the Province of Guayas, Ecuador; and (b) geology of the study area.
Figure 2.
The proposed methodology for this study.
Figure 2.
The proposed methodology for this study.
Figure 3.
Locations of sites for geological and geomechanical characterisation studies.
Figure 3.
Locations of sites for geological and geomechanical characterisation studies.
Figure 4.
(a) Sandstone rock mass with intercalations. (b) Lateritic soil product of residual shale weathering.
Figure 4.
(a) Sandstone rock mass with intercalations. (b) Lateritic soil product of residual shale weathering.
Figure 5.
(a) Map of housing in the study area. (b) Detailed topography of the study area.
Figure 5.
(a) Map of housing in the study area. (b) Detailed topography of the study area.
Figure 6.
Slope stratigraphic column.
Figure 6.
Slope stratigraphic column.
Figure 7.
Correlations between the VESs (4-3) and drilling D1. It can be seen that the material obtained from drilling D1 (shales) coincides with the resistivity presented (values between 35.0 and 40.0).
Figure 7.
Correlations between the VESs (4-3) and drilling D1. It can be seen that the material obtained from drilling D1 (shales) coincides with the resistivity presented (values between 35.0 and 40.0).
Figure 8.
Zoning plan according to susceptibility to landslide and detachment.
Figure 8.
Zoning plan according to susceptibility to landslide and detachment.
Figure 9.
Critical profiles for stability assessment.
Figure 9.
Critical profiles for stability assessment.
Figure 10.
CP12 profile results in (a) static condition and (b) pseudostatic condition.
Figure 10.
CP12 profile results in (a) static condition and (b) pseudostatic condition.
Figure 11.
Housing and susceptibility zoning.
Figure 11.
Housing and susceptibility zoning.
Figure 12.
Recommended stabilization solutions by location in the study area.
Figure 12.
Recommended stabilization solutions by location in the study area.
Table 1.
RQD values according to Deere [
52].
Table 1.
RQD values according to Deere [
52].
| RQD% | Quality |
|---|
| <25 | Very poor |
| 25–50 | Poor |
| 50–75 | Fair |
| 75–90 | Good |
| 90–100 | Excellent |
Table 2.
Correlation between RQD and volumetric discontinuity according to Palmstrom [
53].
Table 2.
Correlation between RQD and volumetric discontinuity according to Palmstrom [
53].
| RQD% | Condition |
|---|
| RQD = 115–3.3 Jv | Si Jv > 4.5 |
| RQD = 100 | Si Jv ≤ i J |
Table 3.
Weathering degree based on ISMR [
53].
Table 3.
Weathering degree based on ISMR [
53].
| Term | Description | Weathering Degree |
|---|
| Fresh | No visible sign of rock material weathering. Perhaps slight discolouration on major discontinuity surface. | I |
| Slightly weathered | Discolouration indicates weathering of rock material and discontinuity surfaces. All rock material may be discoloured by weathering. | II |
| Moderately weathered | Less than half of the rock material is decomposed or disintegrated into the soil. Fresh or discoloured rock is present either as a continuous framework or as a core stone. | III |
Highly
weathered | More than half of the rock material is decomposed or disintegrated into the soil. Fresh or discoloured rock is present either as a continuous framework or as a core stone. | IV |
| Completely weathered | All rock material is decomposed or disintegrated into the soil. The original mass structure is still largely intact. | V |
Residual
soil | All rock material is converted to the soil. The mass structure and the material fabric is destroyed. There is a significant volume change, but the soil has not been significantly transported. | VI |
Table 4.
Main parameters and weights assigned to rock mass in the susceptibility coefficient estimation, based on [
21,
57,
61,
63,
64].
Table 4.
Main parameters and weights assigned to rock mass in the susceptibility coefficient estimation, based on [
21,
57,
61,
63,
64].
| Parameter | Weight |
|---|
| Lithology (L) | 0.0 to 4.0 |
| Geological structure (Gs) | 0.0 to 4.0 |
| Morphometry (M) | 0.0 to 4.0 |
| Discontinuity (D) | 0.0 to 4.0 |
| Weathering rank (Wr) | 0.0 to 4.0 |
| Water presence (W) | 0.0 to 3.0 |
| Vegetable cover (Vc) | 0.0 to 3.0 |
| Seismic activity (S) | 0.0 to 4.0 |
| SC: (L + Gs + M + D + Wr + W + Vc + S) | 0.0 to 30.0 |
Table 5.
Main parameters and weights assigned to soil in the susceptibility coefficient estimation, based on [
21,
57,
61,
63,
64].
Table 5.
Main parameters and weights assigned to soil in the susceptibility coefficient estimation, based on [
21,
57,
61,
63,
64].
| Parameter | Weight |
|---|
| Soil characteristic (quality) (Sq) | 0.0 to 4.0 |
| Geological structure (Gs) | 0.0 to 4.0 |
| Morphometry (M) | 0.0 to 4.0 |
| Weathering rank (Wr) | 0.0 to 4.0 |
| Water presence (W) | 0.0 to 3.0 |
| Vegetable cover (Vc) | 0.0 to 3.0 |
| Seismic activity (S) | 0.0 to 4.0 |
| SC: (Sq + Gs + M + Wr + W + Vc + S) | 0.0 to 26.0 |
Table 6.
Detachment susceptibility classification (rock mass). Based on [
21,
57,
61,
63,
64].
Table 6.
Detachment susceptibility classification (rock mass). Based on [
21,
57,
61,
63,
64].
| Susceptibility Level | Susceptibility Coefficient (SC) | Description |
|---|
| I | Very low susceptibility SD ≤ 5.0 | Stable conditions |
| II | Low susceptibility: 5.0 < SD ≤ 10.0 | Stable conditions
Monitoring recommended |
| III | Median susceptibility: 10.0 < SD ≤ 15.0 | Predominantly stable conditions
Systematic monitoring required |
| IV | High susceptibility: 15.0 < SD ≤ 20.0 | Potentially unstable conditions |
| V | Very high susceptibility: SD > 20.0 | Unstable conditions |
Table 7.
Landslide susceptibility classification (soil). Based on [
21,
57,
61,
63,
64].
Table 7.
Landslide susceptibility classification (soil). Based on [
21,
57,
61,
63,
64].
| Susceptibility Level | Susceptibility Coefficient (SC) | Description |
|---|
| I | Very low susceptibility SD < 5.0 | Stable conditions |
| II | Low susceptibility: 5.0 < SD ≤ 8.0 | Stable conditions. Monitoring recommended |
| III | Median susceptibility: 8.0 < SD ≤ 12.0 | Predominantly stable conditions
Systematic monitoring required |
| IV | High susceptibility: 12.0 < SD ≤ 16.0 | Potentially unstable conditions |
| V | Very high susceptibility: SD > 16.0 | Unstable conditions |
Table 8.
Geoelectrical interpretation of the lithology based on VESs.
Table 8.
Geoelectrical interpretation of the lithology based on VESs.
| Interpretation | Resistivity (Ωm) |
|---|
| Colluvium-Anthropic Fill | 0.0–20.0 |
| Shales | 20.0–45.0 |
| Fractured silty sandstone | 45.0–100.0 |
| Compact sandstone | 100.0–600.0 |
| Breccia/microbreccia | >600.0 |
Table 9.
Stratigraphic column of pit P08.
Table 9.
Stratigraphic column of pit P08.
Coordinates: 628011/9759883
Depth: approximately 2.50 m
Description: Pit in possible artificial fill over sandy-clay soil with sandstones, shales and microbreccias.
Vegetable earth: Humus with abundant roots with a thickness of 25 cm. Centimetre to decimetre sized clasts of dark shales and sandstones.
Water level: Not apparent
Detailed description:
0.00–0.25 m: humus with abundant roots and some centimetric-decimetric clasts of dark shales and sandstones. Matrix-supported texture.
0.25–1.00 m: predominance of decimetre size clasts in sandy-clay matrix (grain-supported texture). The clasts are medium-grained sandstones and dark shales.
1.00–1.60 m: medium-grained sandstones, presenting typical concentric fractures, along which fine-grained sandstones appear.
1.60–2.50 m: microbreccias with glauconite. |  |
Table 10.
Information of boreholes.
Table 10.
Information of boreholes.
| Drill | D1 | D2 | D3 |
|---|
| Coordinates | 628098/9759901 | 627875/9759831 | 627771/9759514 |
| Rock mass | Sandstones | Clay soil, shales and sandstones. | Sandstones and shales. |
| Depth (m) | 7.00 | 6.00 | 5.00 |
Table 11.
Physical–mechanical properties of rock samples from geomechanical stations.
Table 11.
Physical–mechanical properties of rock samples from geomechanical stations.
| Station | Rock Type and Characteristics | Density
(g/cm3) | Compressive Strength (Kg/cm2) | Cohesion
(Kg/cm2) | Friction Angle
(Degrees) |
|---|
| GS02 | Medium-grained sandstone | 2.40 | 575 | 130 | 34–40 |
| GS04 | Siliceous shale | 2.35 | 320 | 105 | 39–43 |
| GS08 | Medium-grained sandstone | 2.50 | 605 | 140 | 40–43 |
| GS10 | Fine-grained sandstone | 2.38 | 410 | 110 | 34–38 |
| GS13 | Medium-grained sandstone | 2.54 | 685 | 150 | 36–43 |
| GS14 | Sandstone with intercalations of high compressive strength rocks | 2.62 | 655 | 125 | 37–42 |
| GS15 | Medium-grained sandstone | 2.40 | 475 | 120 | 32–38 |
| GS16 | Sandstone with intercalations of low compressive strength rocks | 2.35 | 270 | 115 | 37–41 |
Table 12.
Description of geomechanical soil stations.
Table 12.
Description of geomechanical soil stations.
| Station | Soil Description
(Characteristic) | Geological Structure | Water Presence | Vegetable Cover | Weathering Degree |
|---|
| GS01 | Residual soil formed by shale weathering | Weakness planes favour sliding | No water presence | Little vegetation cover | Residual soil |
| GS03 | Predominantly sandy-wet soil, significant clayey fraction | Slope position somewhat favourable concerning weakening planes | Minimal surface waters action | No vegetation cover | Moderately weathered |
| GS05 | Predominantly clayey colluvial soil, with weathered sandstone blocks of medium grain | Slope position somewhat favourable concerning weakening planes | No water presence | Covered mainly by adequate vegetation cover | Moderately weathered |
| GS06 | Colluvium of clay composition and plastic behaviour | Slope position somewhat favourable concerning weakening planes | No water presence | Covered mainly by adequate vegetation cover | Slightly weathered |
| GS07 | Predominantly clayey soil with a high level of humidity and plastic behaviour | Weakness planes favour sliding | No water presence | Partially covered by adequate vegetation cover | Slightly weathered |
| GS09 | Soil consisting of little compacted plastic clays | Slope position somewhat favourable concerning weakening planes | Minimal surface waters action | Covered mainly by adequate vegetation cover | Moderately weathered |
| GS11 | Very dry, compact clay with a high sand fraction | Weakness planes favour sliding | Minimal surface waters action | No vegetation cover | Completely weathered |
| GS12 | Alluvium | Weakness planes favour sliding | Minimal surface waters action | No vegetation cover | Completely weathered |
Table 13.
Geomechanical characteristics of the rock stations.
Table 13.
Geomechanical characteristics of the rock stations.
| Station | RQD (%) | WeatheringRank | GSI | Lithostructural Group | Vegetal Cover | Discontinuity |
|---|
| GS02 | 55–65 | IV | 70–60 | III | No vegetation cover | 600 mm spacing, aperture 0.5 mm |
| GS04 | 50–60 | III | 70–60 | II | Covered mainly by adequate vegetation cover | 150 mm spacing, aperture between 3.0 and 4.0 mm |
| GS08 | 50–60 | III | 70–60 | II–III | Covered mainly by adequate vegetation cover | 600 mm spacing, aperture between 0.6 and 0.8 mm |
| GS10 | 55–70 | III | 70–60 | II–III | Little vegetation cover | 200 to 600 mm spacing, aperture between 0.5 and 1.0 mm |
| GS13 | 55–65 | III | 70–60 | II–III | Partially covered by adequate vegetation cover | 600 mm spacing, aperture 0.5 mm |
| GS14 | 55–70 | III | 65–50 | II | Partially covered by adequate vegetation cover | 400 to 500 mm spacing, aperture between 0.7 and 1.0 mm |
| GS15 | 55–70 | III | 65–50 | II | Partially covered by adequate vegetation cover | 200 to 600 mm spacing, aperture between 0.5 and 1.0 mm |
| GS16 | 50–60 | III | 70–60 | II | Partially covered by adequate vegetation cover | 600 mm spacing, aperture 1.0 mm |
Table 14.
Assessment of landslide susceptibility in soils.
Table 14.
Assessment of landslide susceptibility in soils.
| Susceptibility Category | Stations in Soil |
|---|
| GS01 | GS03 | GS05 | GS06 | GS07 | GS09 | GS11 | GS12 |
|---|
| III | | | 12.0 | 11.5 | 12.5 | 11.5 | | |
| IV | | 15.5 | | | | | | |
| V | 19.5 | | | | | | 20.0 | 19.5 |
Table 15.
Assessment of detachment susceptibility in rock mass.
Table 15.
Assessment of detachment susceptibility in rock mass.
| Susceptibility Category | Stations in Rock |
|---|
| GS02 | GS04 | GS08 | GS10 | GS13 | GS14 | GS15 | GS16 |
|---|
| III | | 15.0 | 15.00 | 15.0 | | | | |
| IV | 16.0 | | | | 17.5 | 17.5 | 17.5 | 17.5 |
Table 16.
Geotechnical parameters used in stability analysis. Colluvium data from [
33].
Table 16.
Geotechnical parameters used in stability analysis. Colluvium data from [
33].
| Material | Density (kN/m3) | Cohesion (kPa) | Friction Angle (Degrees) |
|---|
| Colluvium | 21.00 | 10.00 | 25.00 |
| Shale | 26.00 | 14.00 | 42.00 |
| Sandstone | 28.00 | 20.00 | 38.00 |
Table 17.
Results obtained from the stability analysis considering the 16 critical profiles.
Table 17.
Results obtained from the stability analysis considering the 16 critical profiles.
Critical
Profile | Susceptibility
Coefficient (SC) | Static Condition (SFstatic) | Pseudostatic Condition
as = 0.24 g (SFpseudostatic) |
|---|
| CP01 | Low to high | 2.19 | 1.71 |
| CP02 | Low to high | 3.66 | 2.64 |
| CP03 | Low to high | 1.62 | 1.25 |
| CP04 | High | 1.36 | 1.25 |
| CP05 | High | 1.42 | 1.12 |
| CP06 | High | 1.59 | 1.21 |
| CP07 | High | 2.26 | 1.64 |
| CP08 | Medium to high | 2.85 | 2.14 |
| CP09 | Medium to high | 2.15 | 1.59 |
| CP10 | Very high | 1.15 | 0.76 |
| CP11 | Medium to very high | 2.07 | 1.16 |
| CP12 | High | 1.25 | 0.82 |
| CP13 | Medium | 1.51 | 0.88 |
| CP14 | High | 2.43 | 1.26 |
| CP15 | High | 1.48 | 1.00 |
| CP16 | Medium to high | 1.69 | 1.02 |
| Publisher’s Note: MDPI stays neutral with regard to jurisdictional claims in published maps and institutional affiliations. |
© 2021 by the authors. Licensee MDPI, Basel, Switzerland. This article is an open access article distributed under the terms and conditions of the Creative Commons Attribution (CC BY) license (https://creativecommons.org/licenses/by/4.0/).


 ,
, 


