Article

Use of Pupil Area and Fixation Maps to Evaluate Visual Behavior of Drivers inside Tunnels at Different Luminance Levels—A Pilot Study

1
Department of Information Science and Engineering, Ningbo University, Ningbo 315211, China
2
School of Computer Science and Technology, Shandong Technology and Business University, Yantai 264003, China
3
Department of Civil and Environmental Engineering, College of Engineering and Computing, Florida International University, Miami, FL 33174, USA
4
Ningbo Leesten Technology Co., Ltd., Ningbo 315000, China
*
Author to whom correspondence should be addressed.
Appl. Sci. 2021, 11(11), 5014; https://doi.org/10.3390/app11115014
Submission received: 22 April 2021 / Revised: 26 May 2021 / Accepted: 27 May 2021 / Published: 28 May 2021
(This article belongs to the Special Issue Risk Assessment in Traffic and Transportation)

Abstract

:
This study reports the results of a pilot study on spatiotemporal characteristics of drivers’ visual behavior while driving in three different luminance levels in a tunnel. The study was carried out in a relatively long tunnel during the daytime. Six experienced drivers were recruited to participate in the driving experiment. Experimental data of pupil area and fixation point position (at the tunnel’s interior zone: 1566 m long) were collected by non-intrusive eye-tracking equipment at three luminance levels (2 cd/m2, 2.5 cd/m2, and 3 cd/m2). Fixation maps (color-coded maps presenting distributed data) were created based on fixation point position data to quantify changes in visual behavior. The results demonstrated that luminance levels had a significant effect on pupil areas and fixation zones. Fixation area and average pupil area had a significant negative correlation with luminance levels during the daytime. In addition, drivers concentrated more on the front road pavement, the top wall surface, and the cars’ control wheels. The results revealed that the pupil area had a linear relationship with the luminance level. The limitations of this research are pointed out and the future research directions are also prospected.

1. Introduction

China’s strong sustainable economic development has greatly inspired the construction of new highways, especially road tunnels. Road tunnels have become popular due to their advantages of reducing traffic transportation time, relieving pressure on ground transportation, and facilitating rapid economic development [1,2,3]. By the end of 2020, China had 21,316 tunnels with 21,999.3 km, among which there were 1394 extra-long tunnels (length > 3 km) with 6235.5 km, and 5541 long tunnels (1 km < length < 3 km) with 9633.2 km [4].
With the increase of tunnels, traffic accidents in tunnels are becoming more and more serious [5,6,7]. Although the probability of accidents occurring and the probability of being injured in tunnels is lower as compared to open roadways, the impact is of greater severity in injuries and deaths [8,9,10]. Moreover, the crash rate in tunnels is twice as high as those outside tunnels [11].
Previous traffic crash statistics and studies have shown that the human factor is a primary aspect that causes road traffic accidents [12,13,14,15,16]. Besides, statistical analysis showed that 80–90% of information used by drivers in driving was gathered by visual observation [17,18], of which dynamic information accounts for 95%. Therefore, drivers’ dynamic visual features are by far the most relevant features to a tunnel’s safe driving [19,20,21]. In the tunnel section, the driver’s speed is relatively high, and the different environments in the tunnel affect the perceived difficulty and directly influence driving safety [22]. Various studies have shown that tunnel illumination influences drivers’ driving behaviors [23]. Enhancing the illumination inside the tunnel could improve the tunnel’s visibility. Therefore, it is significant to investigate the law of drivers’ eye movements in tunnels under different illumination levels, as it could shed light on strategies to improve traffic safety.

2. Literature Review

As an important driving mode, driving visual information has an inevitable relationship with safe driving. In order to improve traffic safety in tunnels, extensive studies on the visual features and driver behavior were made [24,25,26]. Studies on drivers’ visual behaviors in tunnel environments consisted of two categories.
The first category was virtual research, which was carried out in a driving simulator. Akamatsu et al. [27] conducted the driving simulator and real road tests both during daytime and nighttime conditions, in order to analyze the influences of road tunnels and other structures on driver behavior. Ten male drivers took part in the experiment and made a round trip at 60 km/h. The experimental results demonstrated that the accelerator stroke increased before the tunnel, then remained constant on the road. However, a small decrease of the accelerator stroke occurred at 50 m before the tunnel. Gramann et al. [28] evaluated the eye movements of sixteen male students using a computer simulated tunnel. Experimental data demonstrated that the gaze position was directed toward the tunnel’s visual centroid during straight road segments. In contrast, the gaze was centered on the outer wall during turns. In addition, fixations in the stimulus were significantly fewer than those before or after the turn. In a VTI driving simulator [23], eye movement data from twenty-eight participants were recorded to investigate how tunnel lighting affects attentive and visually distracted drivers. Results showed that the tunnel design and illumination had a certain influence on the driver’s driving behavior. It can also be revealed that light-colored tunnel walls were more important in keeping the driver’s visual attention focused forward, as compared to strong illumination. Wan et al. [29] discussed the impact of sidewall markings, specifically observing the effect of tunnel color on the speed perception of drivers at a low-luminance condition, through a road tunnel driving simulation model. Tests results revealed that the temporal frequency and color of sidewall markings had a significant influence on the driver’s stimulus (vehicle speed and reaction time). In addition, under the condition of red-color combination and sidewall markings, the over-estimation of speed was the highest and speed judgment was relatively simple. Xiao et al. [30] recorded eye movement parameters and vehicle speed data of eighteen participants in a driving simulator to analyze speed control behavior and driver’s looking behavior. Drivers’ behavioral data showed that there were no significant interactive effects between visibility and traffic sign setting plans, but visibility had a significant effect on vehicle speed. Besides, fixation data showed that the fixation duration did not vary significantly at different levels of visibility. Wang et al. [31] recruited sixty-eight male coach drivers to take part in a driving mission on a simulated mountain highway. The study analyzed the drivers’ eye movement indicators, including blink duration, blink frequency, eye closing duration, and pupil diameter. The results indicated that the decrease or increase of the driver’s visual behavior could obviously reflect the variations of driving performance. Accordingly, pupil diameter, blink duration, and blink frequency were negatively correlated with changes in attentional allocation, and positively correlated with speed perception and reaction time. Han et al. [11] discussed the effect of the delineator on driver’s eye movement in different road alignment scenarios. The study collected behavioral data from thirty-five participants, including fixation time and pupil size. Drivers’ behavioral data showed that the participants had smaller pupil diameter and slower pupil diameter changes when driving in tunnels equipped with delineators. Also, they analyzed the influence of delineator configuration on the tunnel driver’s scanning path in tunnels [32], and quantified the complexity of individual switching patterns by Markov-based entropy method. The results showed that subjects’ interest areas varied with driving scenarios. Additionally, more than 50% of gaze time was spent on the left and tight curve portions of the straight-line section. Qin [33] evaluated the impact of color decoration of interior tunnel walls on the driving characteristics. The subjective evaluation, constant speed driving duration, and lane offset of sixty licensed drivers were analyzed in the study. The investigation results demonstrated that under the same environmental information, there was no significant influence on subjective evaluation value of the subjects, and environmental data in the color decoration scheme had a significant effect on their constant speed driving duration. Although it is true that experiments conducted in driving simulators do have the advantage of being easier to accomplish, are less risky, and require less of a budget than those conducted on real roads [34], they have limitations which cannot reproduce the environment on the real road [35].
The second category is field research, carried out in real tunnel scenarios. Narisada and Yoseoikawa [36] used the corneal reflection eye-maker recorder to investigate eye movements of drivers while approaching tunnel entrances. In the study, two experienced male observers drove a car at speeds between 55 km/h and 100 km/h and stated the moment they began to focus their visual attention on the tunnel entrance in front. Analysis results demonstrated that the minimum duration of the eye mark fixed on a certain point was 0.1–0.2 s, and in some cases, eye marks tended to stay in a certain position on the road scene for a relatively long time. Zhao and Liu [37] studied drivers’ characteristics variation as they passed through the tunnel exit. They also used the BP neural network to establish a mathematical model of fixation time and eye saccade amplitude at the tunnel exit portal. Results indicated that the variation of drivers’ visual characteristics changed based on the distance from the tunnel exit. Additionally, when approaching the tunnel exit, the fixation duration and number of fixation of drivers are reduced, while drivers’ saccade amplitude at the tunnel exit is increased. Yan et al. [19] collected test data of nine drivers at the tunnel entrance and inside sections to assess how drivers’ visual features had changed during driving. The drivers’ eye movement data showed an increase in the average values of fixation duration of 100 m outside the tunnel entrance, but a decrease in fixation number. In addition, drivers had a long-time fixation while driving through the tunnel. Shao et al. [38] collected drivers’ eye movement and pupil diameter together with their heart rate (HR) at the Xi’an men tunnel’s entrance and exit. Factor analysis was used to extract a comprehensive measure that could reflect nanoscopic driving behavior. Analysis results concluded that, for the entrance zone, the road section (−40 m, 40 m) is unsafe, which may cause the driving deceleration and increase in heart rate. Besides, the fluctuation rate of pupillary diameter is sharply in the section (−5 m, 25 m). Moreover, attention should be paid to the 150 m to 110 m section before the vehicle exits the tunnel. Hu et al. [39] used a head-mounted eye-tracking system to record the parameters of eye movement of thirty-two participants while driving under different spatial-visual conditions in the tunnel’s entrance zone. Results indicated that route familiarization had a significant effect on the number of fixations, average saccade amplitude, and average speed. However, route familiarization had a weak influence on the fixation duration and average saccade speed. Moreover, in the tunnel entrance zone, the fixations of familiar drivers were fewer than those of unfamiliar drivers at all driving intervals, and unfamiliar drivers chose to drive at lower speeds and tended to slow down farther from the tunnel portal. Yang and Chen [40] analyzed pupil area, XY sight angle, percentage of fixation times, and mean fixation times of participants in the Liang feng ya tunnel of the Lanhai Expressway, and studied visual behavior of drivers in extra-long tunnel sections of the expressway. The analysis data of this study demonstrated that the pupil area of the driver increased in the tunnel’s inner section, gradually enlarged, and then fluctuated continuously after entering the tunnel. Additionally, the driver’s attention in the inner section was more concentrated and downward. Fu et al. [41] discussed the differences in visual perception and driving behavior at the entrance of short, medium-length, and long tunnels, under naturalistic driving conditions. Five indicators were adopted in the study, including fixation, saccade, speed, deceleration, and position. The experiment results revealed that the length of the tunnel is a crucial factor affecting the speed of drivers at tunnel entrances. Moreover, the deceleration value under the short-tunnel condition is greater than that under medium and long tunnels. Jiao et al. [42] carried out a real-world test in the East Lake Tunnel (Wuhan, China) and collected data on drivers’ fixation and saccade from five different radii and straight sections. The results demonstrated that there are significant differences in the distribution of drivers’ fixation points under different turning and alignment conditions. Besides, the turning condition had a significant effect on mean fixation time and average fixation frequency, but the radius had no significant effect on mean fixation time and average fixation frequency.
The above-mentioned existing studies primarily concentrated on analyzing the characteristics of eye movement of the driver while the driver enters or exits the tunnel. However, the interior section of a tunnel is often the longest extension of the tunnel. The expected luminance of this section is about 2.5 cd/m2, which belongs to the mesopic vision range [43,44], thus the safety evaluation of this section is more important. In this study, an innovative method (using fixation maps) of examining the effect of luminance levels on visual characteristics was investigated. Taking the Chibai tunnel of Tongshen expressway in Tonghua City (Jilin, China) as a case study, the relationship between pupil area and fixation maps under different luminance levels was studied. Six experienced male drivers were recruited in the study, where they traversed from 252 m inside the tunnel entrance portal to 60 m before the tunnel exit portal at different luminance levels during the daytime. According to the research results, this paper also puts forward suggestions for improving highway safety.

3. Materials and Methods

3.1. Test Participants

The real vehicle test took place in a mountain road tunnel, which is more dangerous than driving on a normal road. Thus, 6 experienced male drivers participated in the study, with an average age of 39.5 years old and a standard deviation of 9.4 years. Their driving experience ranged from 12 to 32 years. All participants had a lot of tunnel-driving experience and drove through tunnels at least once a month. In addition, none of the participants showed more than slight anxiety while driving in tunnels.
To ensure the accuracy of eye-tracking data, the participants did not exhibit achromatopsia, and their visual acuity was normal. Additionally, the participants had no psychological or physical health problems and no major traffic safety incidents. Information about the driver’s age and driving experience is given in Table 1.

3.2. Driving Scenario and Environment

The Chibai tunnel of Tongshen Expressway, located in Tonghua city (Jilin Province, China), was an experimental site in this study. The characteristics of this tunnel are presented in Table 2. The tunnel is double-arched with isolated compartments for vehicles in different directions, with two lanes in each direction.
The luminance required for the tunnel interior zone can be calculated using Equation (1).
L i n = { 0.0007 v 2 0.0693 v + 2.6 N 350 0.0005 v 2 0.0207 v + 0.9 350 < N < 1200 0.0012 v 2 0.0732 v + 2.1 N 1200
where, Lin is the luminance of interior zone; v is design vehicle speed, unit is km/h; N is traffic volume, unit is veh/(h·ln). For the Chibai tunnel, v = 80 km/h, N = 704 veh/(h·ln), thus Lin = 2.5 cd/m2.

3.3. Experimental Instrument and Vehicle

For behavior tracking, the eye tracker Dikablis Ergoneers Professional 3.0 with a set of three cameras was used. One camera was for collecting the scene image with 1920 × 1080 pixels, one was for collecting left eye movement data with 648 × 488 pixels, and one was for collecting right eye movement data with 648 × 488 pixels. The eye tracker had a sampling rate of 60 Hz, a pupil tracking accuracy of 0.05°, and a glance direction accuracy of 0.1–0.3°.
The collection and preprocessing of driving behavior data was performed by D-Lab software (Ergoneers GmbH, Geretsried, Germany) [45,46,47,48]. Eye movement was recorded using an Asus laptop with an Intel Core i5, 16 G memory, 512 G SSD. The test vehicle was a front-engine, mid-size car (Wuling Rongguang 6450B, SGMW). Figure 1 shows the eye tracker and the test vehicle, and Table 3 gives basic information about the test vehicle.

3.4. Experimental Procedure

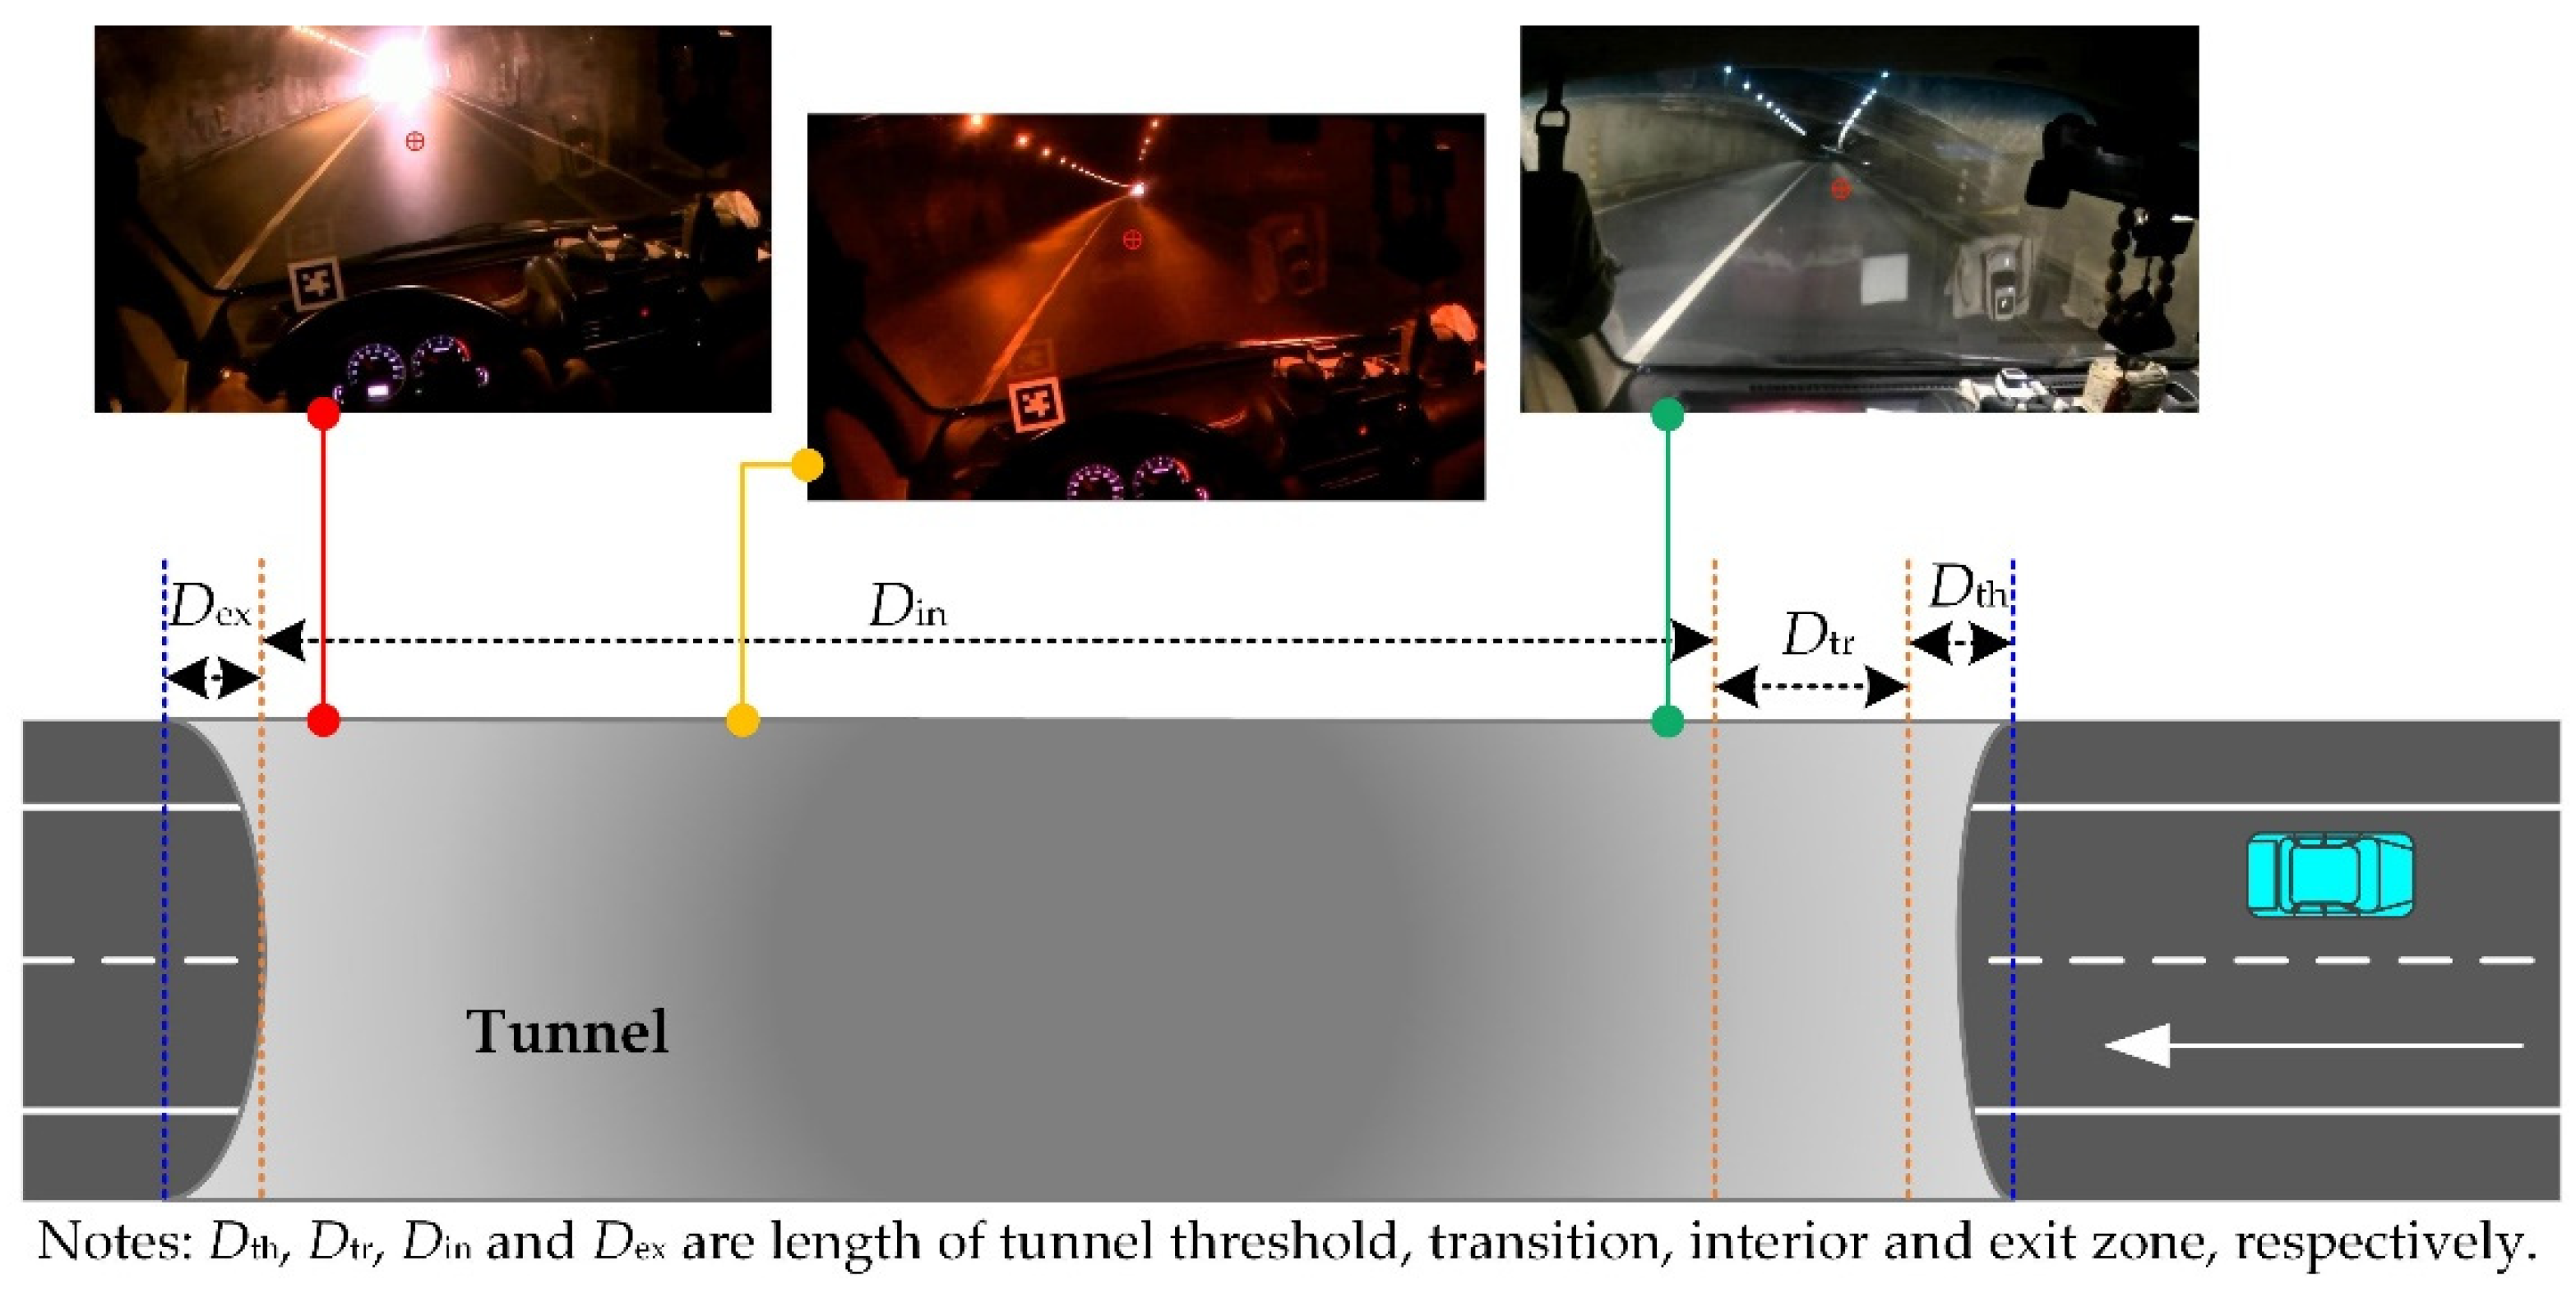
The test was conducted in clear sky weather. Before starting the test, participants were informed of the general objectives and procedures of the actual test. They were then asked to travel freely through the tunnel, based on their normal driving habits and traffic regulations. Each participant took the total length of 1566 m from 252 m inside the tunnel entrance gate to 60 m before the tunnel exit portal (shown in Figure 2), with free-flow speed of about 60 km/h under three luminance conditions (2 cd/m2, 2.5 cd/m2, 3 cd/m2, the tunnel interior luminance can be adjusted by the tunnel lighting control software [49]). Eye movement data was stored in separate files on the laptop placed in the vehicle’s rear. The period for completing the experiments for the three luminance levels was less than 1 h, for which no visual fatigue was observed. The specific steps of the test were as follows:
(1)
Before testing, each participant was briefed on the objectives and procedures of the experiment. Also, each participant was familiar with the test vehicle before the test.
(2)
The participant drove the vehicle to the starting point, checked the test equipment, such as laptop, power supply, and eye tracker, and the experimenter connected the eye tracker to the laptop.
(3)
Before the former test, the experimenter helped the driver put on an eye tracker and adjusted the eye tracker pupil lens and the scene lens to the most comfortable angle under normal working conditions.
(4)
The experimenter calibrated the eye tracker, and the participants adjusted their bodies to a comfortable sitting position and kept their heads as still as possible during the test.
(5)
During the test, the experimenter checked the work of the eye tracker in real-time and corrected the abnormal data timely. As the vehicle drove out of the tunnel, test data collection stopped, thus text and video data were saved.
(6)
After the driver completed the experimental test for a luminance level, the experimenter would check the accuracy of eye-movement data. If there was a problem with the data, the experiment would be redone starting from step (4), after a brief break. The experiment was repeated for the three predetermined luminance levels starting from step (2).
(7)
Once a participant completed the experiments for the three luminance levels, the next participant would perform the tests starting from step (2). It is worth mentioning that all six drivers completed the experiments in strict accordance with the above steps.
During the test, when overtaking occurs, recorded data will be marked for subsequent processing easily.

4. Results and Analysis

Drivers’ visual behaviors were segmented into fixation periods and saccades. In this study, we studied the pupil area and fixation point distribution of participants at different luminance levels.

4.1. Pupil Area

4.1.1. Data Preprocessing

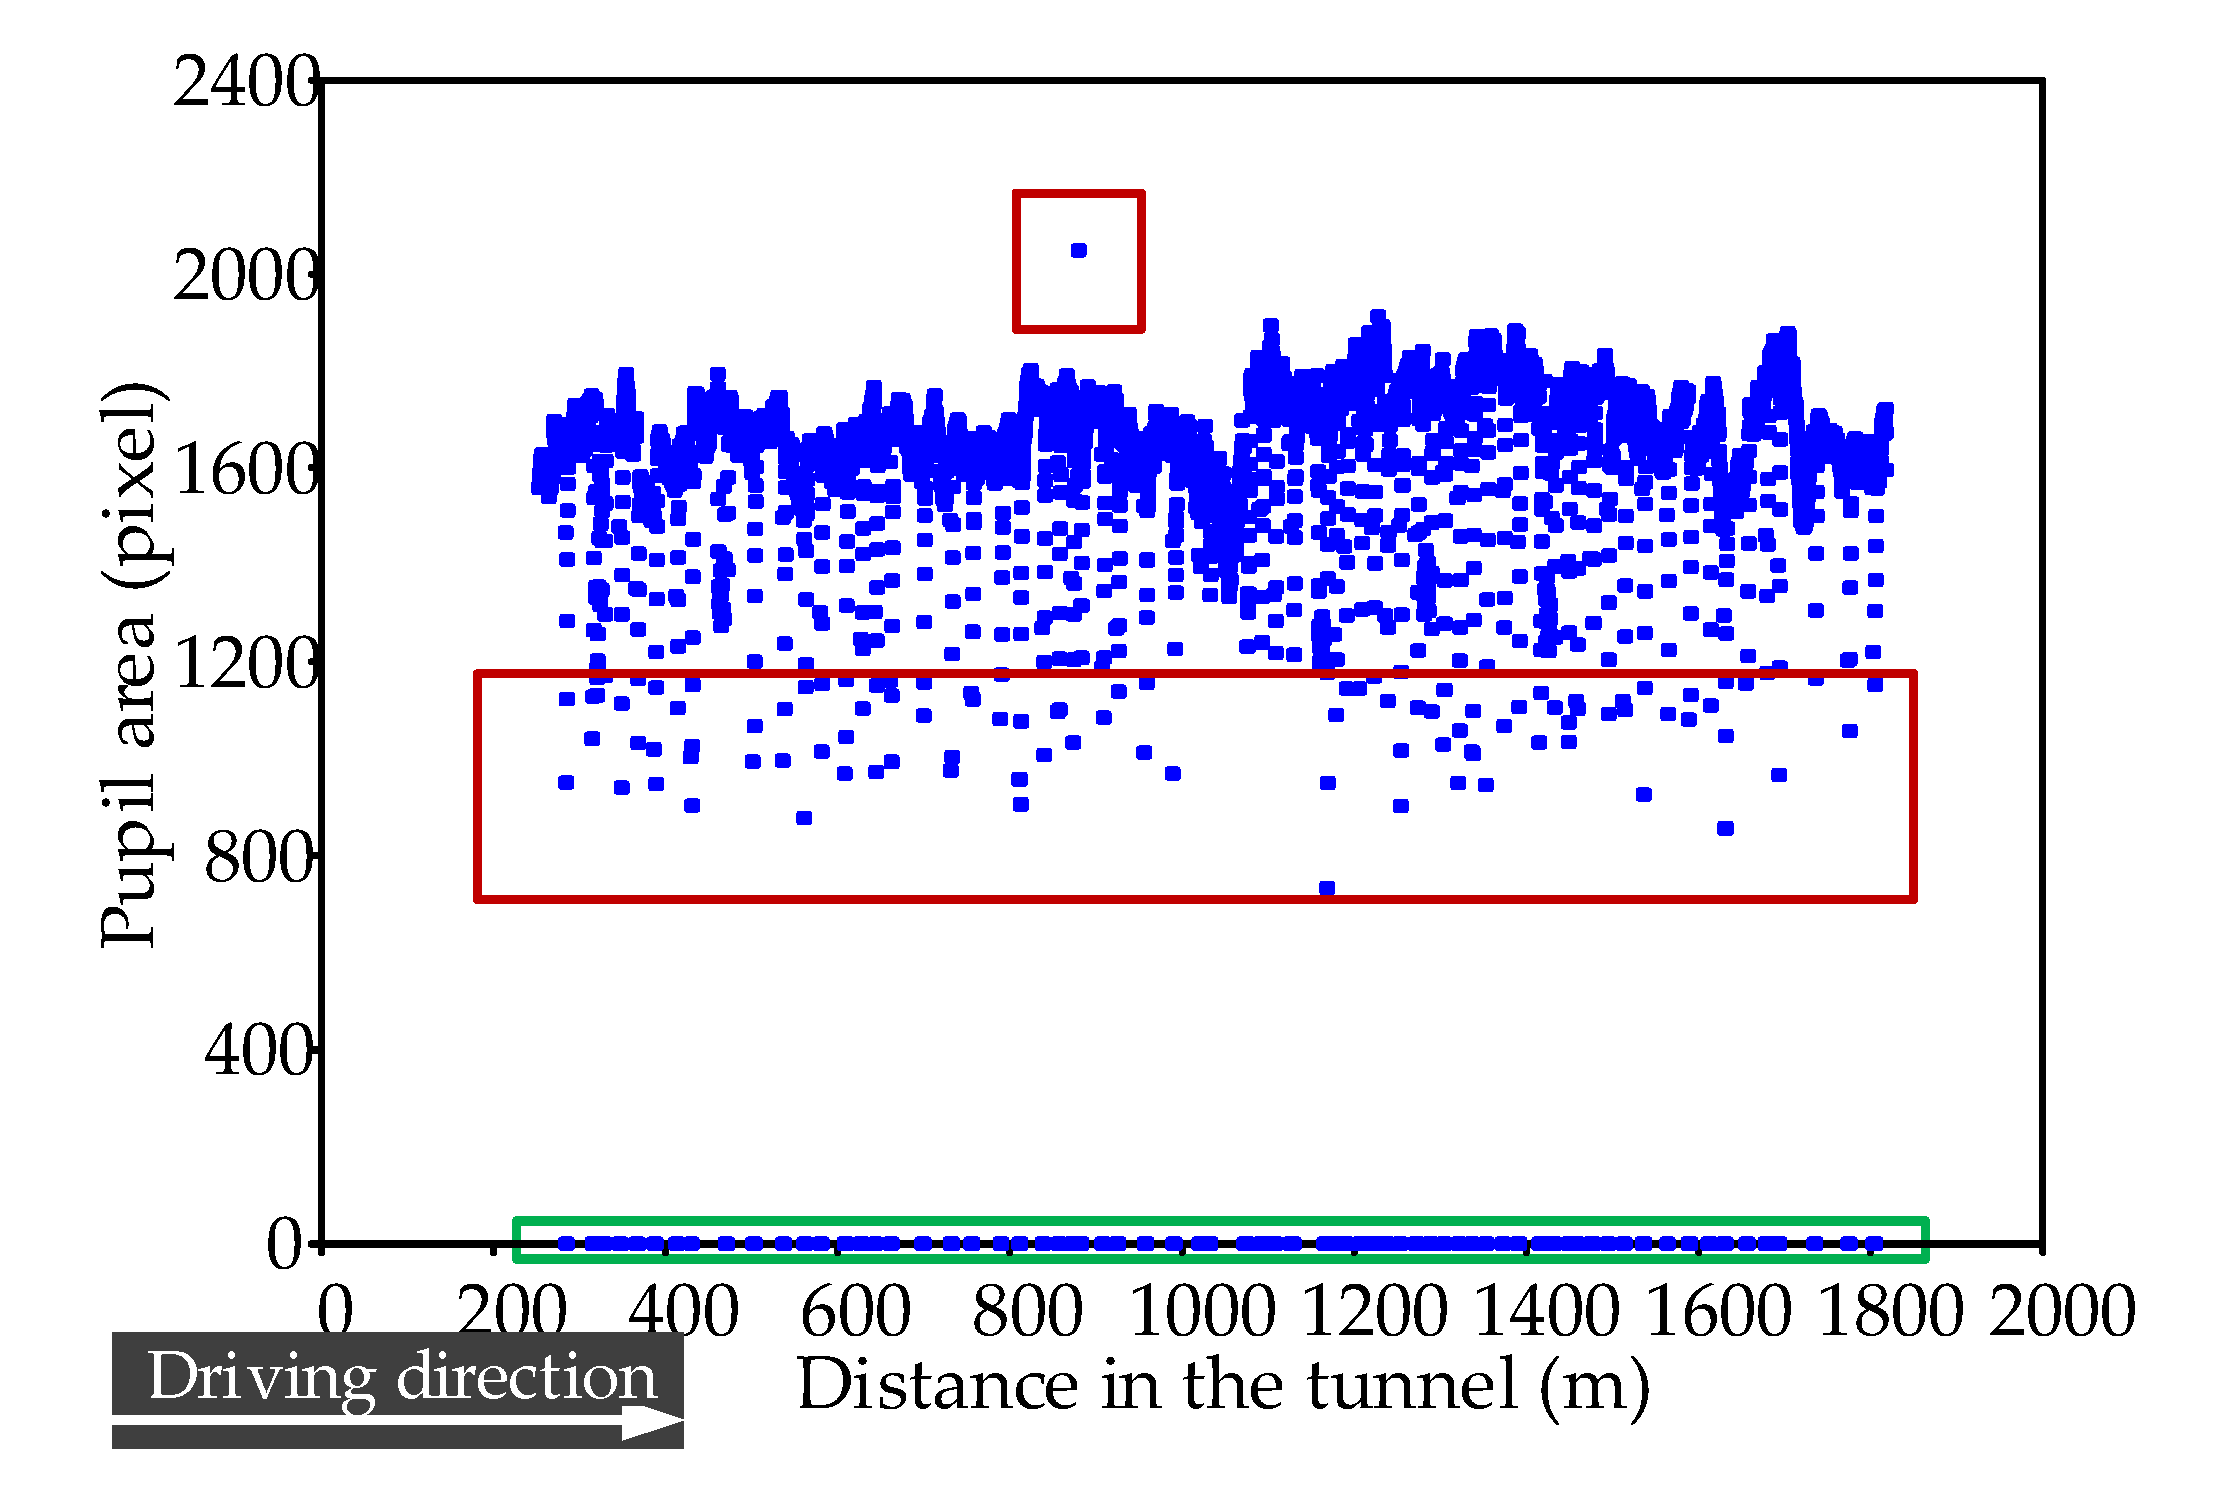
Before performing data analysis, original pupil data was collected by the eye tracker (Figure 3) and preprocessed to reduce the interference of abnormal data. For example, in Figure 3, pupil data in a green rectangle reflects abnormally low amplitude estimates of brief duration. This phenomenon can be caused by several factors, such as eye blink, sharp changes in luminance, and abnormal reflection in the cornea. In addition, pupil data in the red rectangle is another type of abnormal data, mainly due to the color similarity of iris and pupil dilation.
Before analyzing the dynamics of the pupil area, the pupil blink data and unlikely pupil area were eliminated. Figure 4 illustrates an example of processed data along with original data. As observed in Figure 4, preprocessed pupil data is messy, possibly due to the driver’s iris tremors and their mental activity. The noisy data is smoothed by Wavelet Transform through a MATLAB program in this study. It was noted that there were significant individual differences in eye movement parameters among the six drivers. It should be noted all experimental figures after Figure 4 used processed data only.

4.1.2. Pupil Area Analysis

Light reflection of the pupil will cause the pupil to contract when the light levels increase and vice versa. Changes in pupil areas are the most popular physiological and psychological indexes that reflect the cognitive process of drivers [50,51,52,53]. Besides, reasonable lighting conditions will keep the driver’s pupil area constant, allowing the driver to be more comfortable in the driving process and to reduce workload intensity [54,55,56].
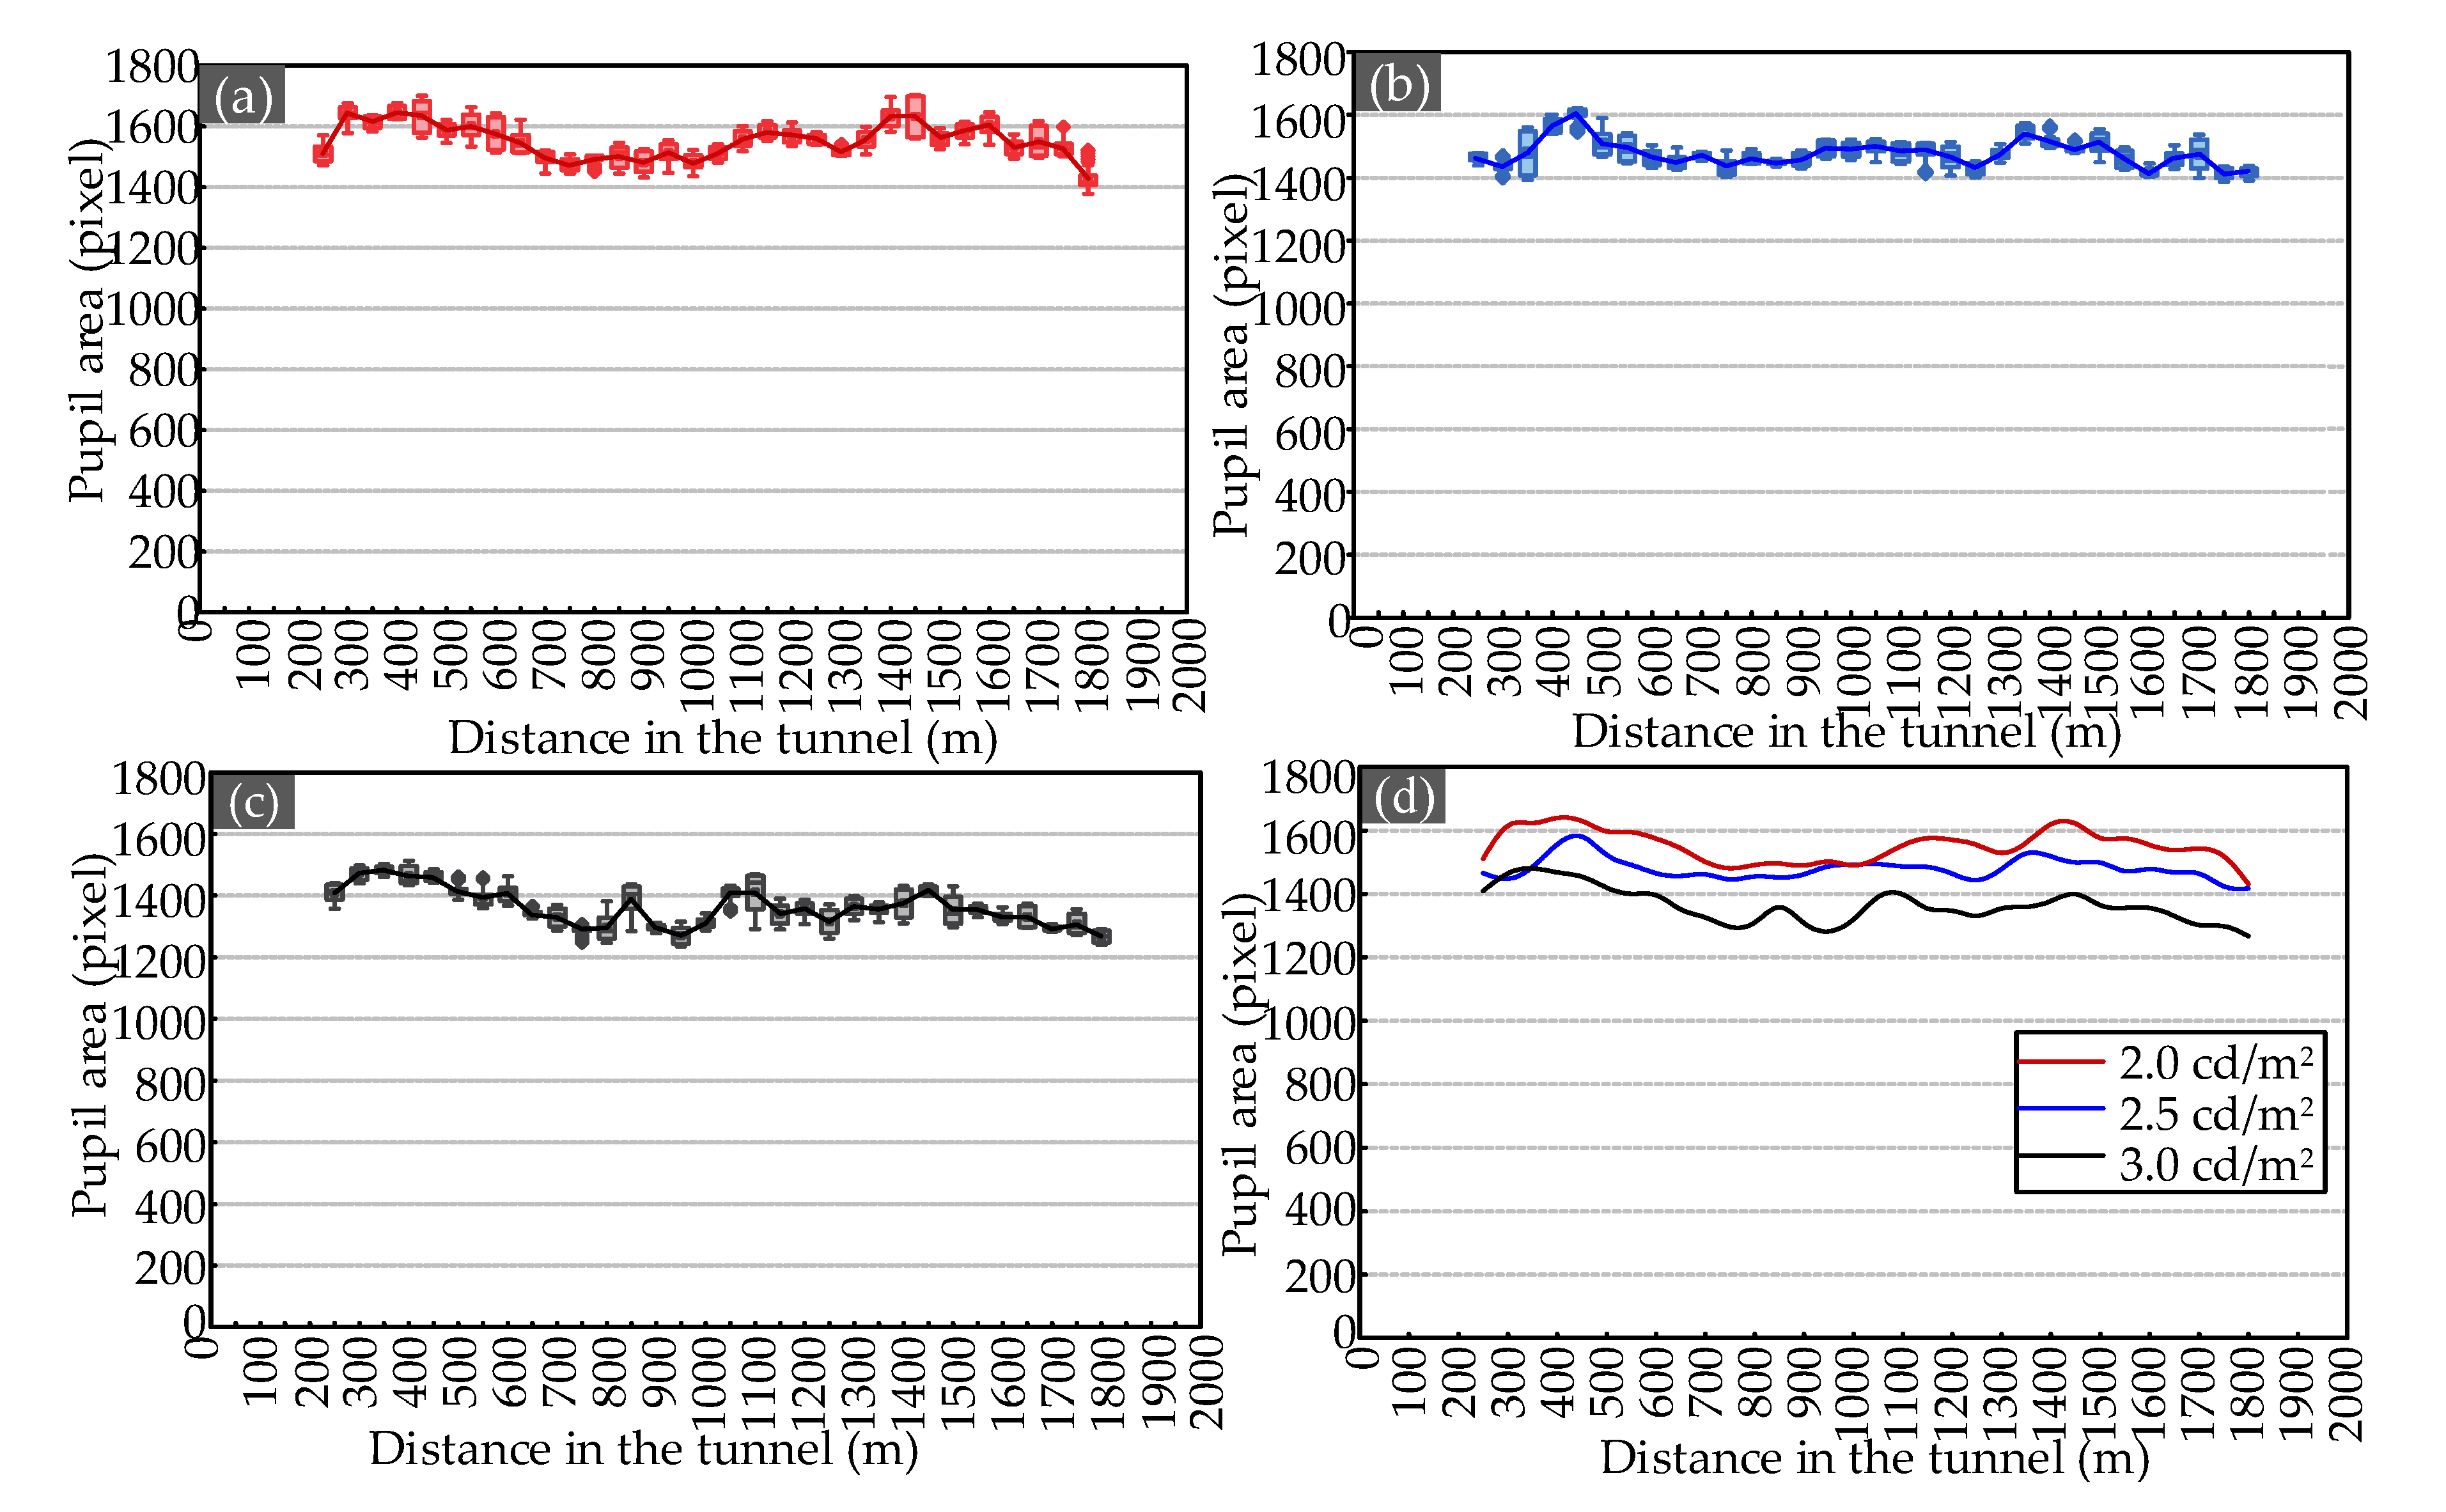
Figure 5 shows the relationship between the driver’s pupil area and the driver’s position with respect to the tunnel entrance under different luminance levels during the daytime. As shown in this figure, the pupil area varied slightly compared to the driver’s position, but the pupil area remained nearly constant. For L = 2, 2.5, and 3 cd/m2, the pupil area ranges between 1400 and 1600 pixels, 1400 and 1600 pixels, and 1200 and 1400 pixels, respectively. Besides, the pupil area of the beginning and the exit sections are higher than the interior section. As can be inferred from Figure 5d, the pupil area decreases with an increase in luminance levels.
Figure 6 illustrates the average pupil area of each driver in three luminance levels. The correlation between pupil area and luminance level was studied. The fitting comparison between the pupil area and the luminance level revealed that a linear function exhibited a better fitting result (as shown in Figure 6). The fitting equation of average pupil area versus luminance level is given in Equation (2).
P A = 1944.39 191.8 L ,
where PA is the average pupil area (pixel); L is the luminance level (cd/m2). The coefficient of determination of R2 is 0.974, which means that the reliability of the fitting equation is acceptable. The results clearly show that the pupil area decreased significantly with the increase of the luminance level.

4.2. Fixation

Fixation is defined as the time period where visual gaze is maintained on a single point (red point in Figure 2), which includes fixation duration, the number of fixations, and the fixation area of interest (AOI). Fixation maps of AOI are developed based on the collected fixation positions of drivers’ eyes while navigating the road tunnel [33]. A fixation map is a graphical representation of data in which values are depicted by color.

4.2.1. Data Preprocessing

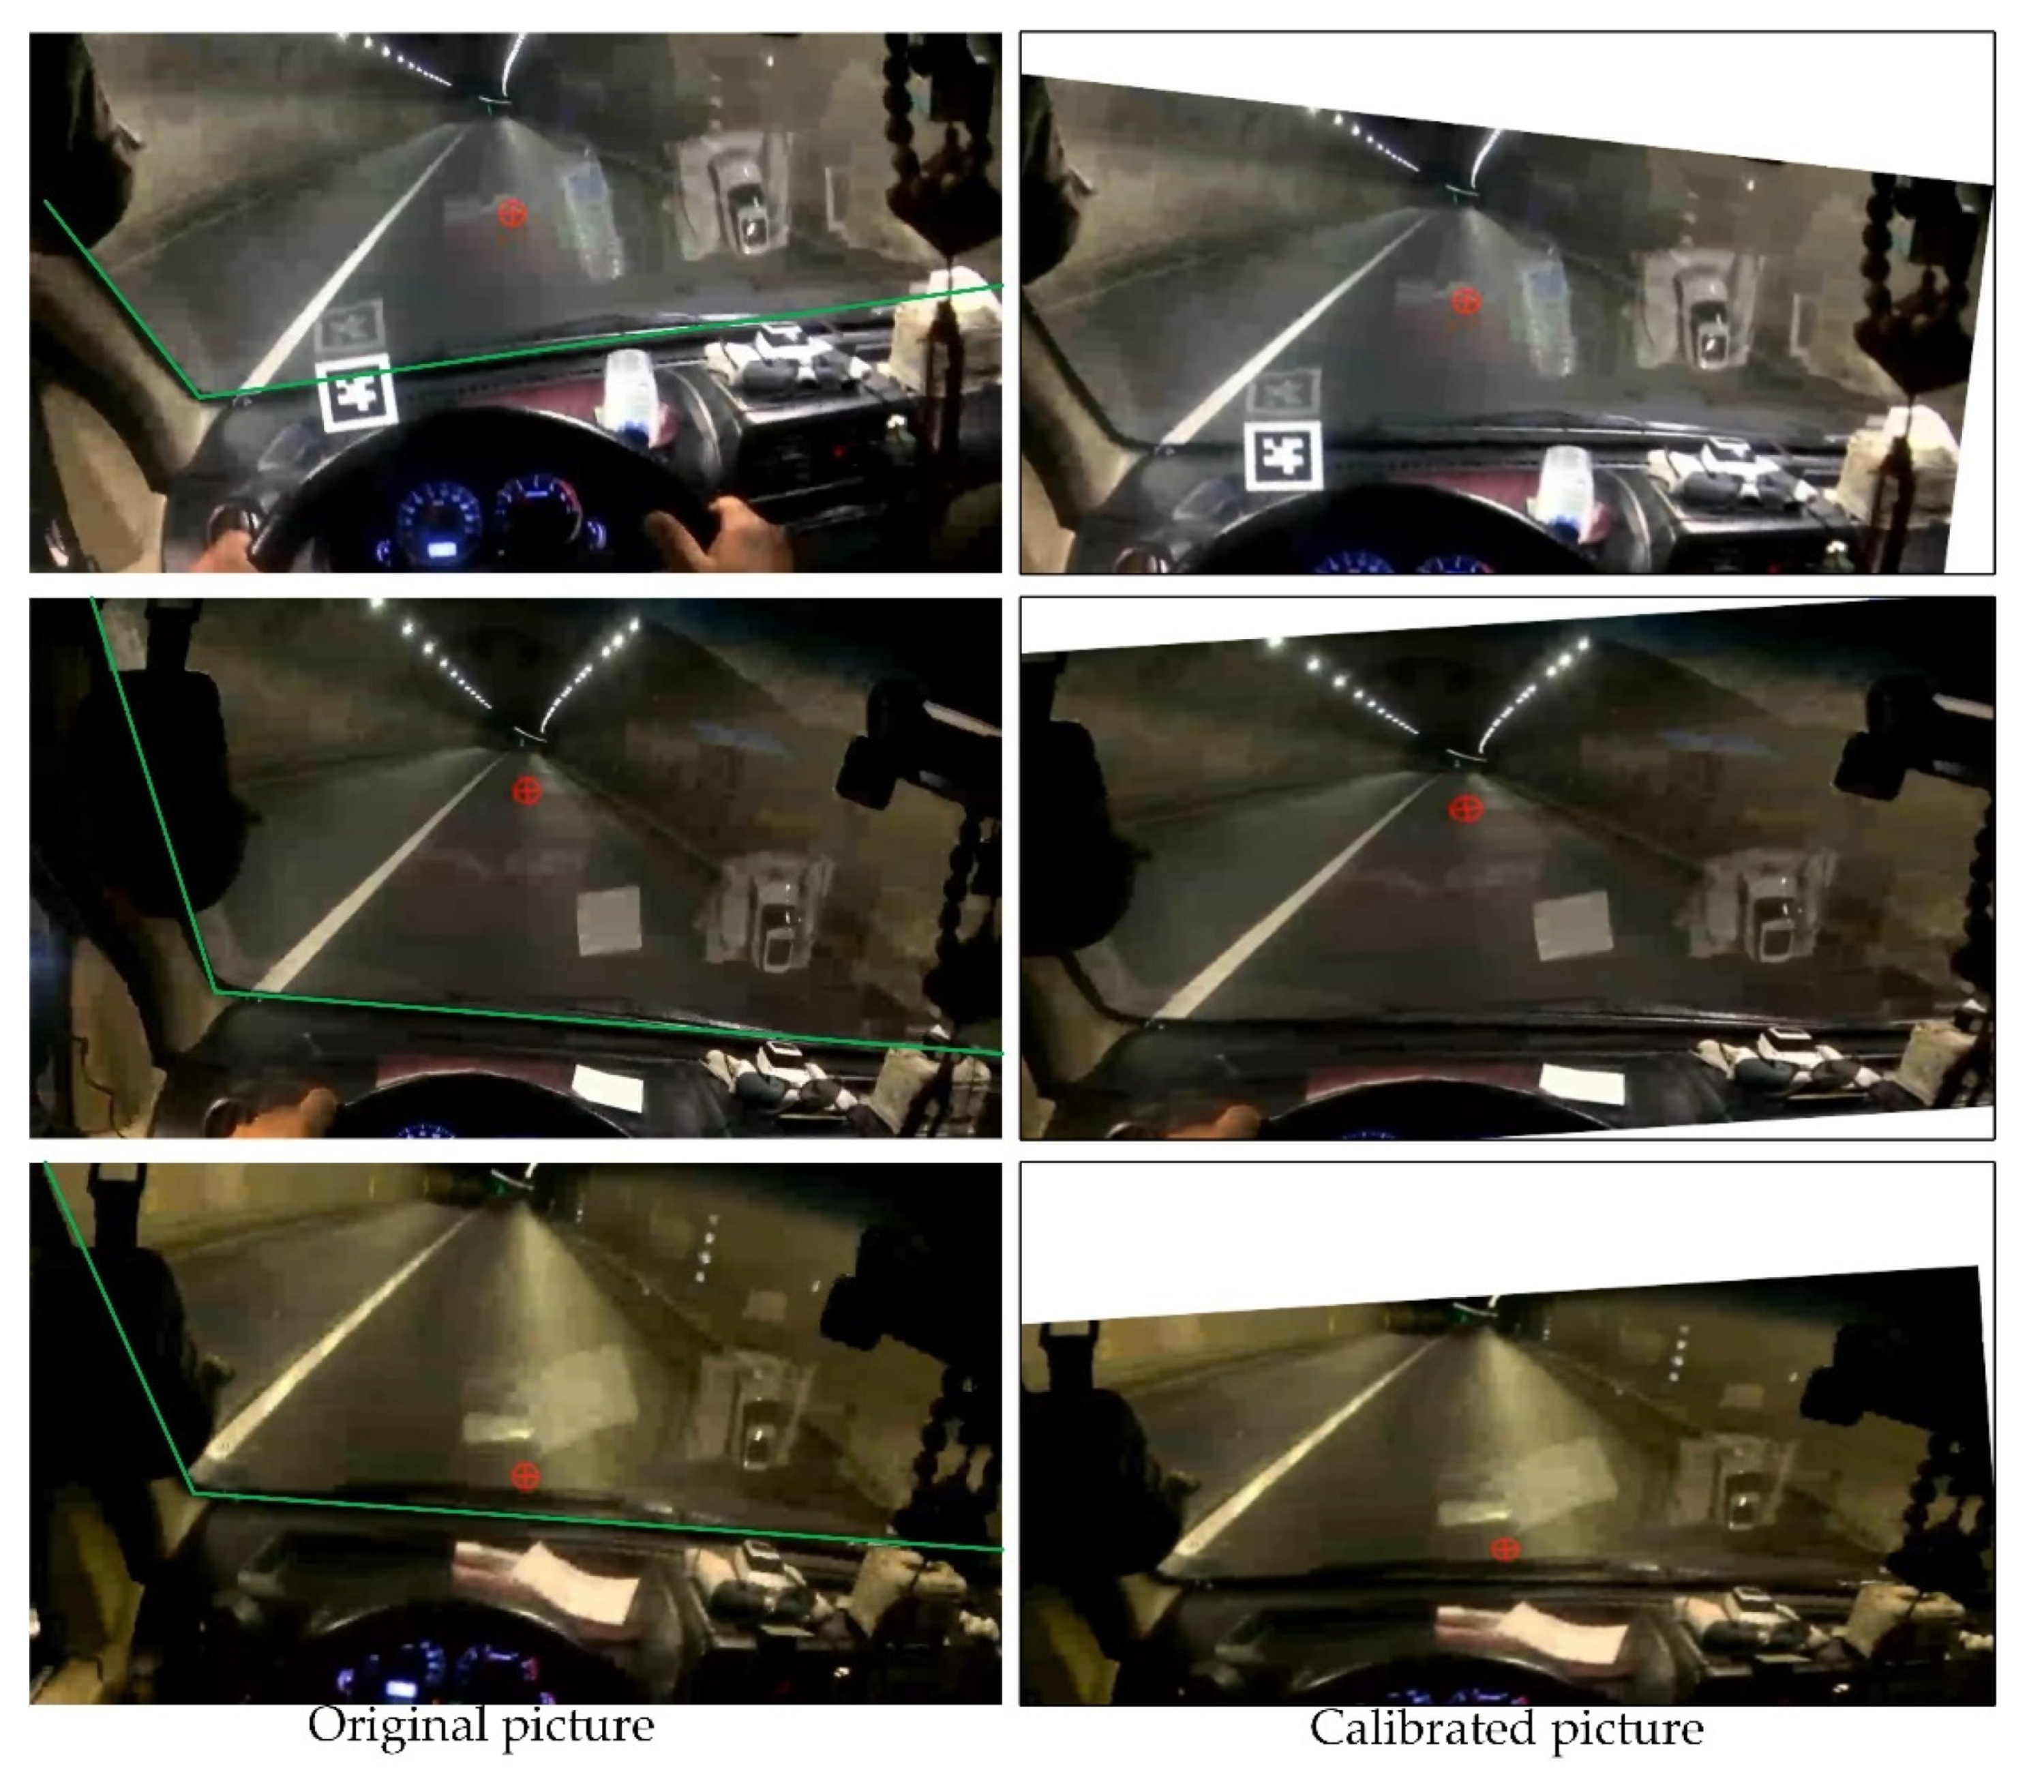
Examples of fixation maps are presented in Figure 7. It can be inferred from Figure 7 that two drivers had different vision because of the distinct positions of their heads and angles from which the driver’s vision is viewed. Therefore, the view images needed to be rotated and cropped before performing the fixation map’s analysis. Thus, a datum line is necessary to adjust view images to the same angle. When the driver was sitting in the vehicle, the same vehicle body contour appeared on the scene camera. Thus, the car body contour was selected as the datum line (green lines in Figure 8). Images used in the subsequent analysis were all rotated with the intersection of the two green lines. Additionally, the redundant edges were cropped to acquire the same image size. The original and calibrated images are presented in Figure 8.

4.2.2. Fixation Maps Analysis

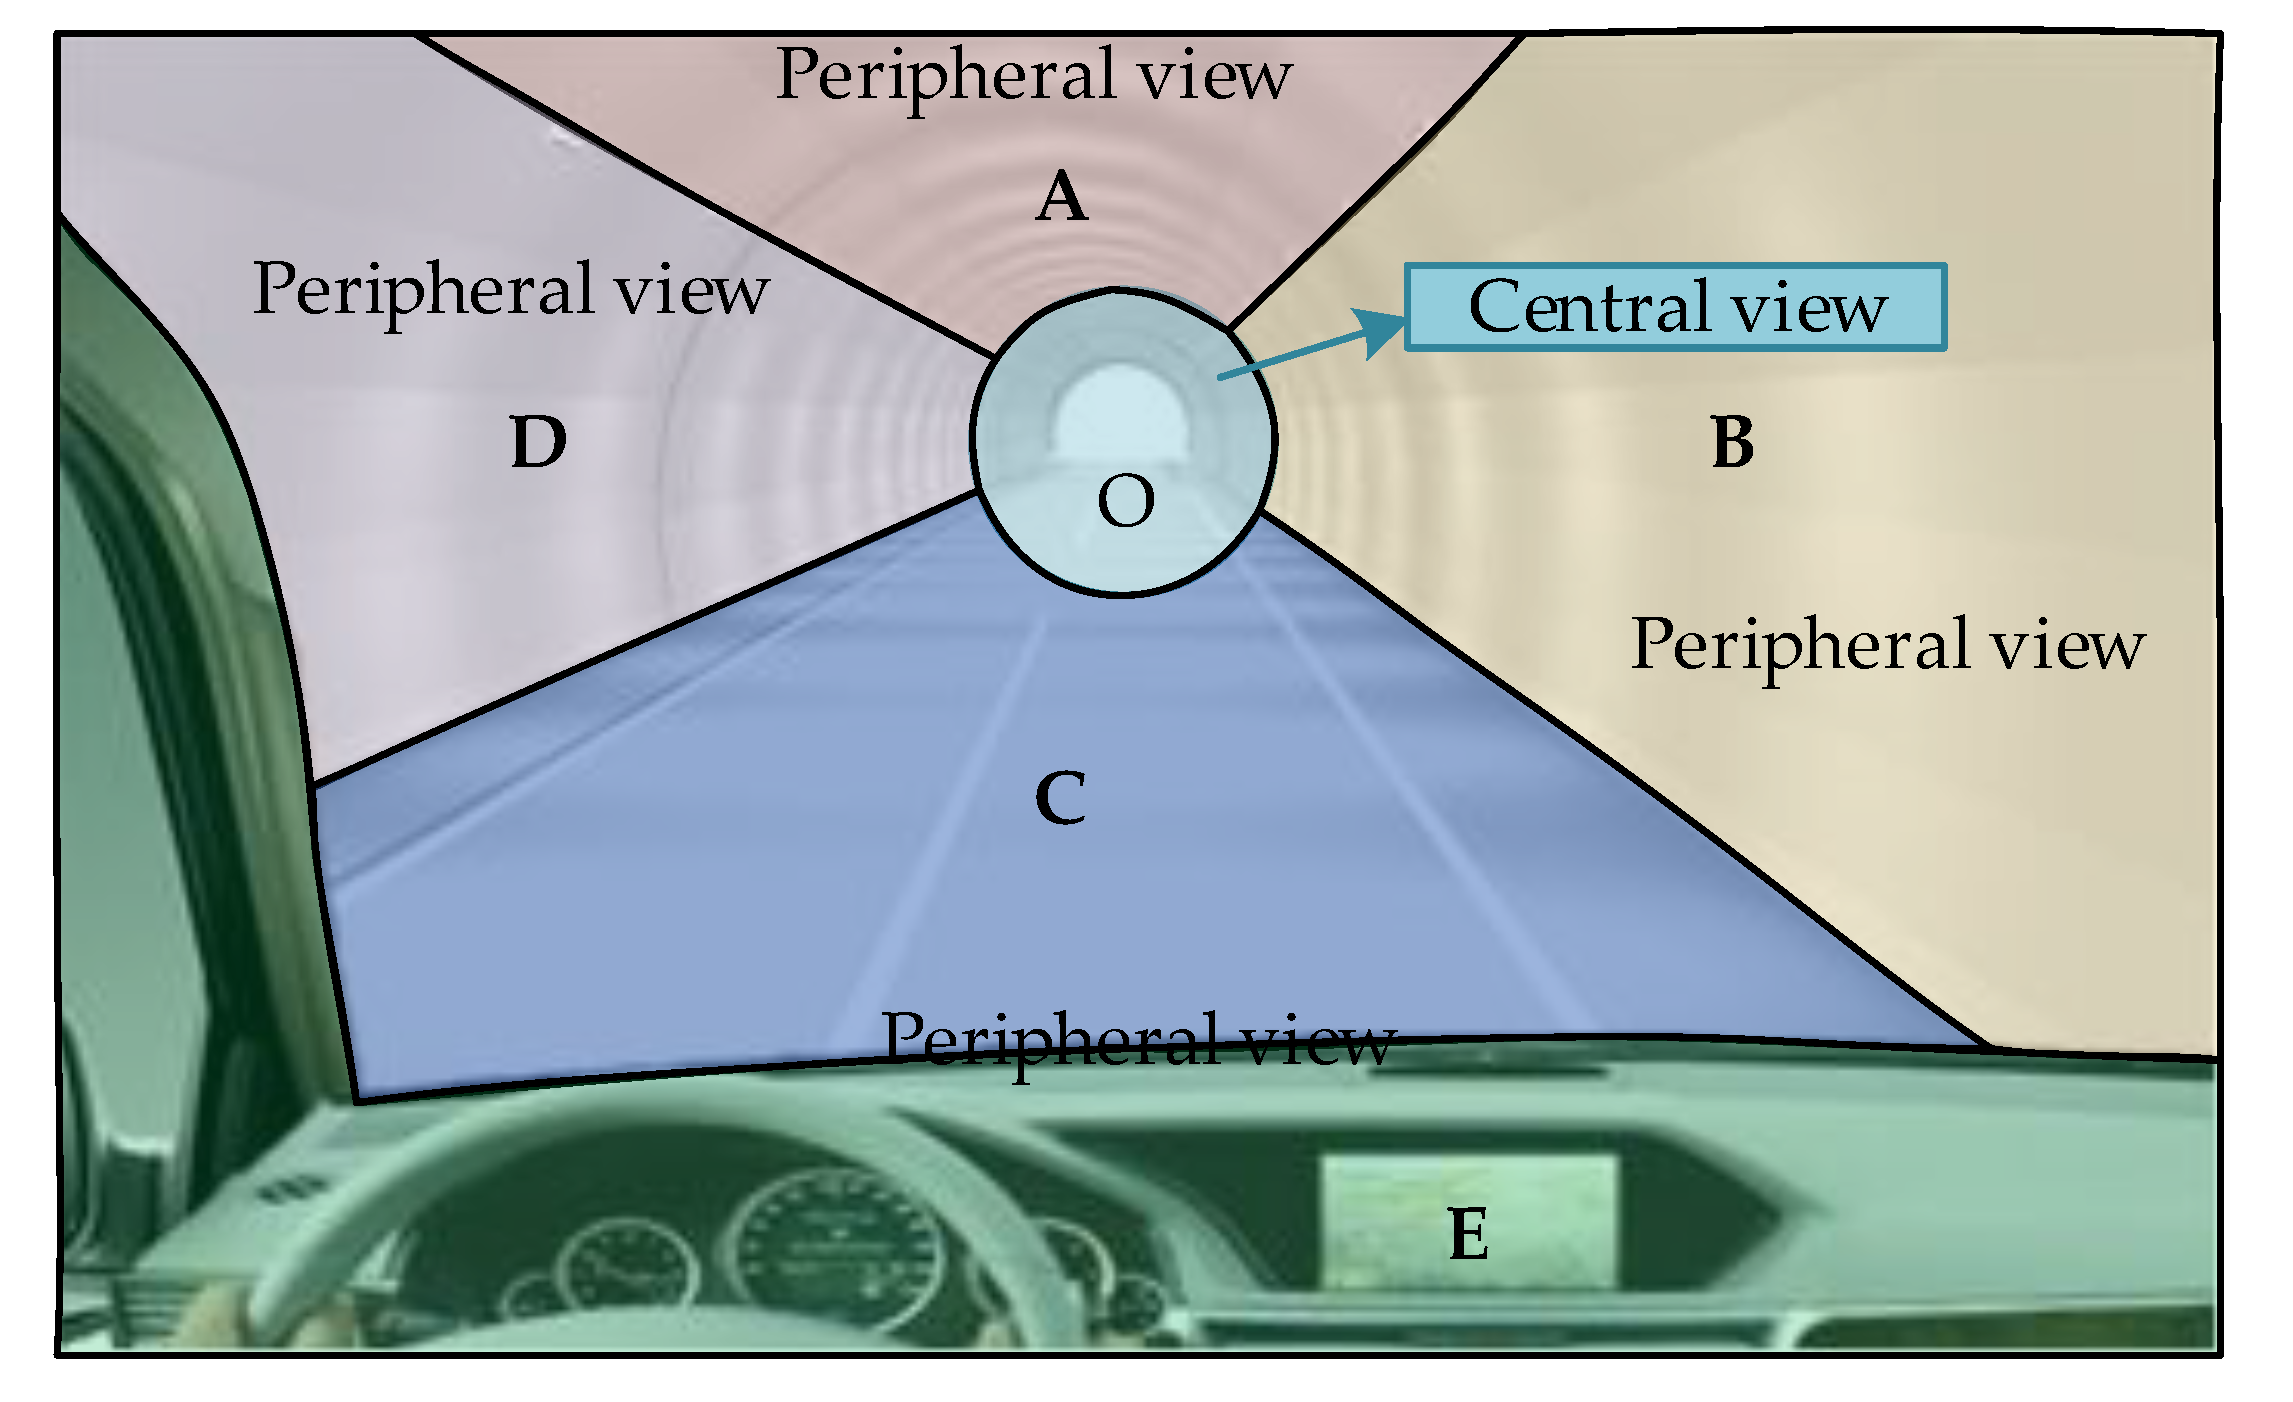
Drivers’ AOI reflects the degree of the drivers’ attention while driving. Drivers’ visual field in the tunnel’s environment consists of two sections: central view section and peripheral view section [57], see Figure 9. To describe the tunnel’s inside visual environment accurately, the peripheral view areas were divided into five spatial regions.
  • Region A (upper region): it represents the top wall;
  • Region B (right region): it represents the right interior wall;
  • Region C (lower region): it represents the road surface;
  • Region D (left region): it mainly includes the left interior wall;
  • Region E (dashboard): it mainly includes Vehicle’s Instrument Panel/Car Dashboard.
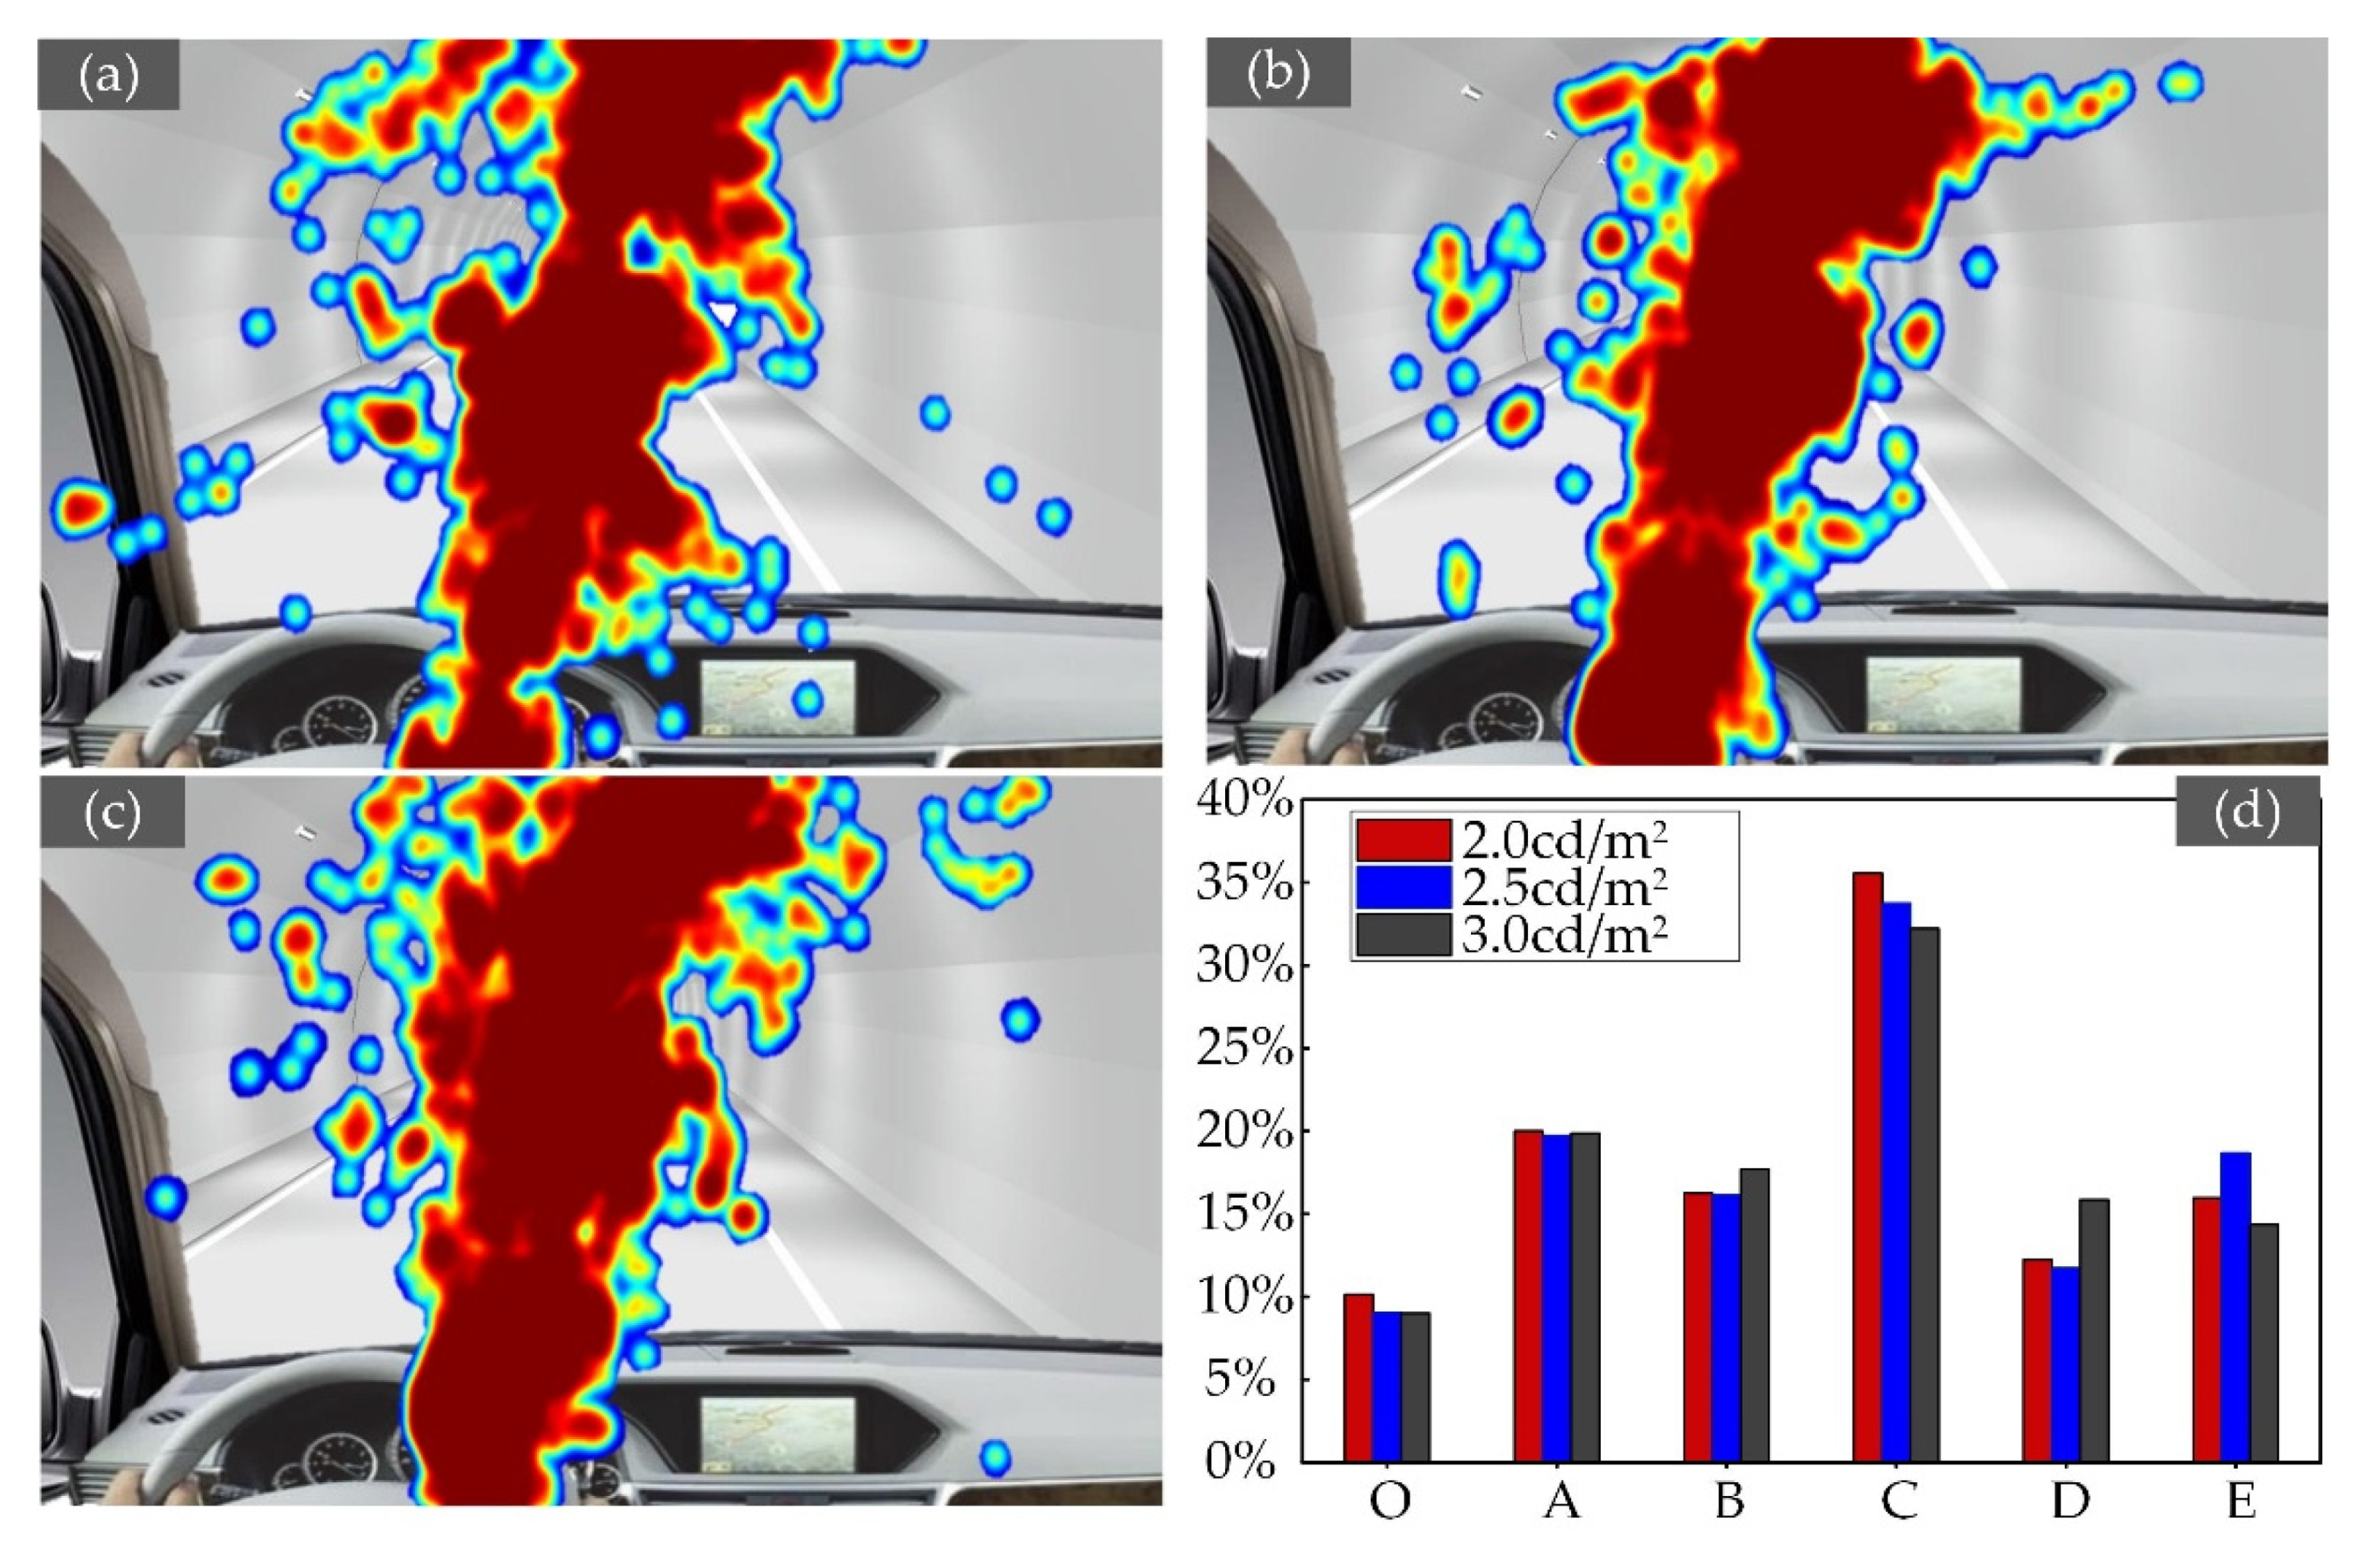
In this study, a MATLAB surface-mapping program was developed to create color fixation maps. The program calculating the fixation points’ centroid and spread distance of fixation points aims to compare subjects’ visual behavior in three luminance level scenarios. Fixation maps were generated based on the fixation points extracted from the calibrated scene images. On the fixation map, warmer colors denote a higher concentration of fixation points, while colder colors show a lower concentration.
Figure 10 presents fixation maps extracted from the eye-tracking frames of six participants for the three luminance levels: (a) 2 cd/m2, (b) 2.5 cd/m2, (c) 3 cd/m2. The results show that the portion with high gaze frequency is concentrated on the road surface (region C), the top wall surface (region A), and with somewhat less frequency on the steering wheel (region E). Figure 10d illustrates the percentage of fixation points in each area for the three luminance levels. The results in Figure 10d show that region C has the largest fixation points for the three luminance levels, followed by region A, then region E.
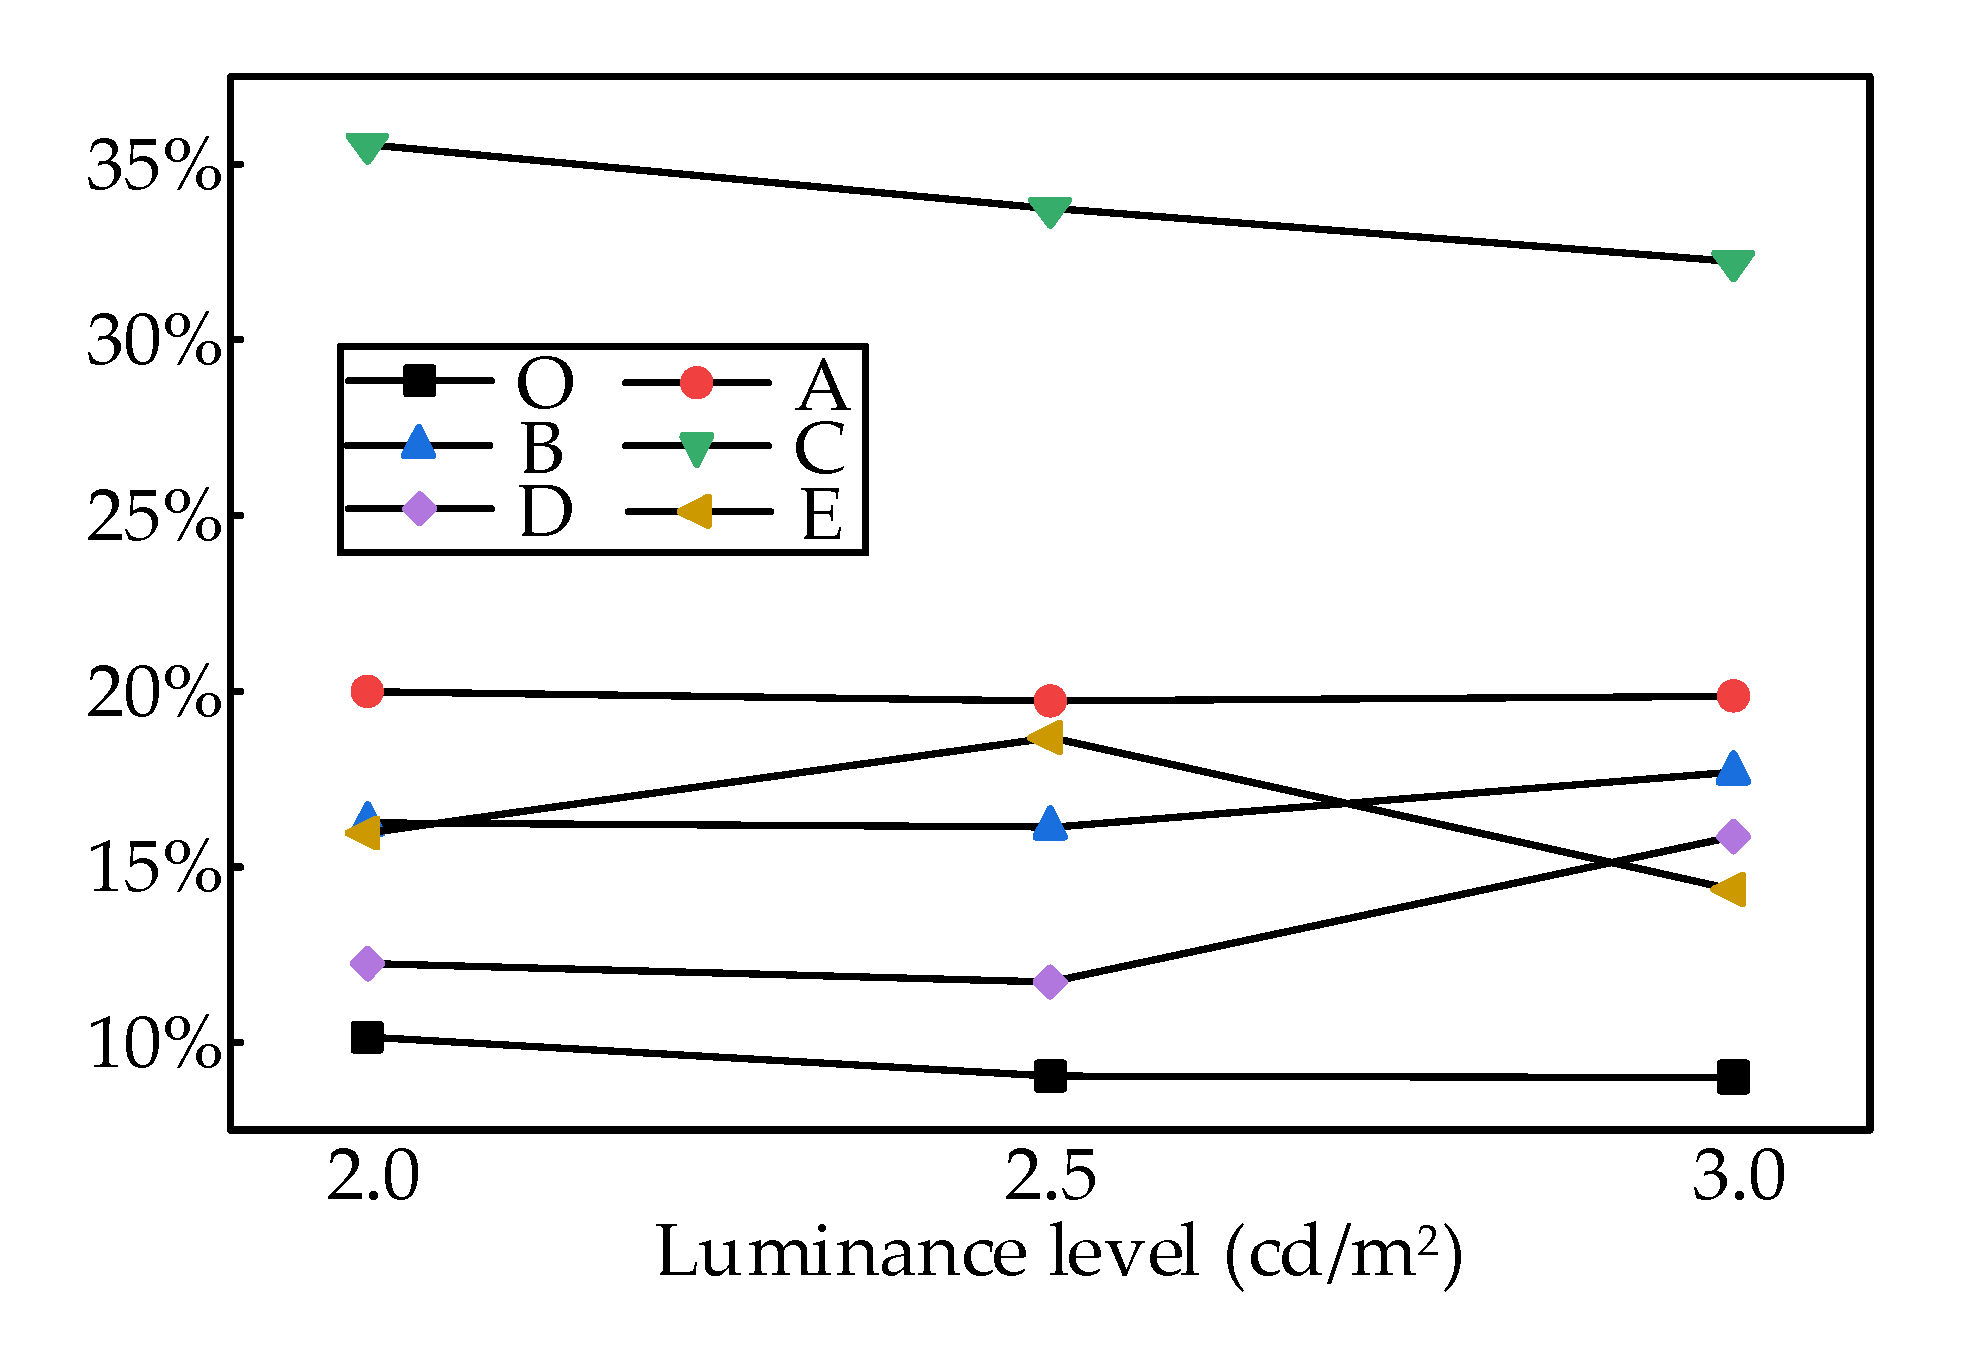
Figure 11 gives the percentage of fixation point numbers in each region under three luminance levels. It can be concluded that the gaze frequency in region C significantly decreases as the luminance level increases. Likewise, the gaze frequency in regions A and O decreases as the luminance level increases. However, the gaze frequency in regions B and D increases as the luminance level increases.

5. Conclusions

Through field research, drivers’ eye movement data were collected by eye-tracking equipment. By analyzing these data, the study explored how luminance levels affect drivers’ visual characteristics (pupil area and fixation point) when driving through the tunnel interior zone. Only six drivers (a small sample size due to the integration of safety considerations, limited time, and funds), were used in this study because this process was conducted as a pilot test. The conclusions are as follows:
(1)
When driving through the tunnel interior zone, the pupil area remains at a relatively stable level. The results showed that the luminance level had a significant effect on the drivers’ eye movement indicators, pupil area, and fixation point position.
(2)
The average pupil area was negatively correlated with luminance level, which implies that the driver’s dynamic visual acuity can be improved by reducing his pupil area, which in turn increases his ability to identify moving objects. Moreover, the relationship between pupil area and luminance level fitted a linear function.
(3)
When driving in the tunnel, the participants’ fixation areas are mainly on the front road pavement, on the top wall surface, and on the dashboard. The results revealed that the road pavement is the most important region for drivers in the tunnel’s interior zone.
(4)
Although the study presented some promising practices, the study also has limitations. The main limitation is the small sample size (i.e., 6 drivers). Future studies should increase the number of drivers to confirm the results. Also, future studies should be carried out under different weather conditions. Furthermore, the tests should distinguish between the novice subjects and the experienced subjects, male and female subjects, in addition to other parameters.

Author Contributions

Conceptualization, L.Q. and X.-H.S.; methodology, L.Q. and Q.-L.C.; software, Q.-L.C.; formal analysis, L.Q. and Y.-N.W.; writing—original draft preparation, L.Q.; writing—review and editing, A.S.L.; supervision, X.-H.S.; funding acquisition, X.-H.S. All authors have read and agreed to the published version of the manuscript.

Funding

This research was funded by ZHEJIANG PROVINCIAL NATURAL SCIENCE FOUNDATION OF CHINA, grant number LQ21E080005; by NATIONAL NATURAL SCIENCE FOUNDATION OF CHINA, grant number 61701069; by MAJOR SCIENCE AND TECHNOLOGY SPECIAL PROJECT IN JIANGBEI DISTRICT, NINGBO CITY, grant number 201901A03.

Institutional Review Board Statement

The study was approved by the Institutional Review Board of School of Information Science and Engineering, Ningbo University.

Informed Consent Statement

Informed consent was obtained from all subjects involved in the study.

Data Availability Statement

Conflicts of Interest

The authors declare no conflict of interest.

References

  1. Tsai, M.-S.; Lee, X.-H.; Lo, Y.-C.; Sun, C.-C. Optical design of tunnel lighting with white light-emitting diodes. Appl. Opt. 2014, 53, H114–H120. [Google Scholar] [CrossRef]
  2. Makarov, V.V. Island Megalopolises: Tunnel Systems as a Critical Alternative in Solving Transport Problems. Engineering 2018, 4, 138–142. [Google Scholar] [CrossRef]
  3. Qin, L.; Shi, X.; Leon, A.S.; Tong, C.; Ding, C. Dynamic luminance tuning method for tunnel lighting based on data mining of real-time traffic flow. Build. Environ. 2020, 176, 106844. [Google Scholar] [CrossRef]
  4. Transportation Department. Statistical Bulletin on the Development of the Transportation Industry in 2020. Available online: https://xxgk.mot.gov.cn/2020/jigou/zhghs/202105/t20210517_3593412.html (accessed on 19 May 2021).
  5. Robatsch, K.; Nussbaumer, C. Comparative analysis of safety in tunnel. In Proceedings of the Young Researchers Seminar, Brno, Czech Republic, 27–30 May 2007. [Google Scholar]
  6. Amundesen, F.H.; Engelbrektsen, A. Studies on Norwegian Road Tunnels II. An Analysis on Traffic Accidents in Road Tunnels; Vegdirektoratet, Road and Traffic Department, Traffic Department, Traffic Safety Section: Oslo, Norway, 2009. [Google Scholar]
  7. Caliendo, C.; De Guglielmo, M.L. Accident Rates in Road Tunnels and Social Cost Evaluation. Procedia Soc. Behav. Sci. 2012, 53, 166–177. [Google Scholar] [CrossRef] [Green Version]
  8. Ma, Z.-L.; Shao, C.-F.; Zhang, S.-R. Characteristics of traffic accidents in Chinese freeway tunnels. Tunn. Undergr. Space Technol. 2009, 24, 350–355. [Google Scholar] [CrossRef]
  9. Carvel, R.; Marlair, G. A History of Fire Incidents in Tunnels. In The Handbook of Tunnel Fire Safety; Beard, A.N., Marlair, G., Eds.; ICE Publishing: London, UK, 2005; pp. 3–41. [Google Scholar]
  10. Ni, H.L.; Dai, Y.H.; Zhao, Q.X. Research on distribution characteristics of traffic accidents in expressway tunnel. Highway 2010, 4, 126–129. [Google Scholar]
  11. Han, X.; Shao, Y.; Pan, B.; Yu, P.; Li, B. Evaluating the impact of setting delineators in tunnels based on drivers’ visual characteristics. PLoS ONE 2019, 14, e0225799. [Google Scholar] [CrossRef] [Green Version]
  12. Zhang, W.; Dai, J.; Pei, Y.; Li, P.; Yan, Y.; Chen, X. Drivers’ Visual Search Patterns during Overtaking Maneuvers on Freeway. Int. J. Environ. Res. Public Health 2016, 13, 1159. [Google Scholar] [CrossRef] [PubMed] [Green Version]
  13. Qin, L.; Dong, L.-L.; Xu, W.-H.; Zhang, L.-D.; Leon, A.S. Influence of Vehicle Speed on the Characteristics of Driver’s Eye Movement at a Highway Tunnel Entrance during Day and Night Conditions: A Pilot Study. Int. J. Environ. Res. Public Health 2018, 15, 656. [Google Scholar] [CrossRef] [Green Version]
  14. Chang, X.; Li, H.; Rong, J.; Qin, L.; Zhao, X. Spatiotemporal Characteristics of Vehicle Trajectories in a Connected Vehicle Environment—A Case of an Extra-Long Tunnel Scenario. IEEE Syst. J. 2020, 1–12. [Google Scholar] [CrossRef]
  15. Kinateder, M.; Pauli, P.; Müller, M.; Krieger, J.; Heimbecher, F.; Rönnau, I.; Bergerhausen, U.; Vollmann, G.; Vogt, P.; Mühlberger, A. Human behaviour in severe tunnel accidents: Effects of information and behavioural training. Transp. Res. Part F Traffic Psychol. Behav. 2013, 17, 20–32. [Google Scholar] [CrossRef]
  16. Kowler, E. Eye movements: The past 25years. Vis. Res. 2011, 51, 1457–1483. [Google Scholar] [CrossRef] [Green Version]
  17. Ren, Y.-Y.; Li, X.-S.; Zheng, X.-L.; Li, Z.; Zhao, Q.-C. Analysis of Drivers’ Eye-Movement Characteristics When Driving around Curves. Discret. Dyn. Nat. Soc. 2015, 2015, 462792. [Google Scholar] [CrossRef]
  18. Li, S.-W.; Ji, B.-K.; Sun, W.-C.; Wang, L.-H.; Yang, Z.-K. Study on the Influence of Driving Experience on Visual Characteristic. Adv. Mech. Eng. 2013, 5, 1–7. [Google Scholar] [CrossRef] [Green Version]
  19. Yan, Y.; Yuan, H.; Wang, X.; Xu, T.; Liu, H. Study on driver’s fixation variation at entrance and inside sections of tunnel on highway. Adv. Mech. Eng. 2015, 7, 273427. [Google Scholar] [CrossRef]
  20. Sivak, M. The Information That Drivers Use: Is it Indeed 90% Visual? Perception 1996, 25, 1081–1089. [Google Scholar] [CrossRef]
  21. Mannering, F. The effect of interstate speed limits on driving speeds: Some new evidence. In Proceedings of the 86th Annual Meeting of the Transportation Research Board, Washington, DC, USA, 21–25 January 2007. Paper No. 07-0120. [Google Scholar]
  22. Ferdinando, S.; Iacopo, G.; Simone, B. Energy optimization of road tunnel lighting systems. Sustainability 2015, 7, 9664–9680. [Google Scholar]
  23. Kircher, K.; Ahlstrom, C. The impact of tunnel design and lighting on the performance of attentive and visually distracted drivers. Accid. Anal. Prev. 2012, 47, 153–161. [Google Scholar] [CrossRef] [PubMed]
  24. Underwood, G.; Chapman, P.; Brocklehurst, N.; Underwood, J.; Crundall, D. Visual attention while driving: Sequences of eye fixations made by experienced and novice drivers. Ergonomics 2003, 46, 629–646. [Google Scholar] [CrossRef]
  25. Xu, C.; Liu, P.; Wang, W.; Li, Z. Evaluation of the impacts of traffic states on crash risks on freeways. Accid. Anal. Prev. 2012, 47, 162–171. [Google Scholar] [CrossRef]
  26. Wen, H.; Sun, J.; Zeng, Q.; Zhang, X.; Yuan, Q. The effects of traffic composition on freeway crash frequency by injury severity: A Bayesian multivariate spatial modeling approach. J. Adv. Transp. 2018. [Google Scholar] [CrossRef]
  27. Akamatsu, M.; Imachou, N.; Sasaki, Y.; Ushiro-Oka, H.; Hamanaka, T.; Onuki, M. Simulation study on driver’s bahavior while driving through a tunnel in a rolling area. In Proceedings of the DSC North America 2003, Dearborn, MI, USA, 8–10 October 2003. [Google Scholar]
  28. Gramann, K.; El Sharkawy, J.; Deubel, H. Eye-movements during navigation in a virtual tunnel. Int. J. Neurosci. 2009, 119, 1755–1778. [Google Scholar] [CrossRef] [PubMed]
  29. Wan, H.; Du, Z.; Yan, Q. The speed control effect of highway tunnel sidewall markings based on color and temporal frequency. J. Adv. Transp. 2016, 50, 1352–1365. [Google Scholar] [CrossRef]
  30. Xiao, D.L.; Fang, Y.; Zhang, Y.N.; Guo, Z.Y. Analysis of driving behavior at the bridge-tunnel transition section in reduced visibility situations. In Proceedings of the 4th International Conference on Transportation Information and Safety (ICTIS), Banff, AB, Canada, 8–10 August 2017; pp. 581–588. [Google Scholar] [CrossRef]
  31. Wang, Y.; Ma, C.; Li, Y. Effects of Prolonged Tasks and Rest Patterns on Driver’s Visual Behaviors, Driving Performance, and Sleepiness Awareness in Tunnel Environments: A Simulator Study. Iran. J. Sci. Technol. Trans. Civ. Eng. 2018, 42, 143–151. [Google Scholar] [CrossRef]
  32. Han, X.; Shao, Y.; Yang, S.; Yu, P. Entropy-Based Effect Evaluation of Delineators in Tunnels on Drivers’ Gaze Behavior. Entropy 2020, 22, 113. [Google Scholar] [CrossRef] [PubMed] [Green Version]
  33. Qin, X.; Zhang, N.; Zhang, W.; Meitner, M. How does tunnel interior color environment influence driving behavior? Quantitative analysis and assessment experiment. Tunn. Undergr. Space Technol. 2020, 98, 103320. [Google Scholar] [CrossRef]
  34. Bella, F. Can Driving Simulators Contribute to Solving Critical Issues in Geometric Design? Transp. Res. Rec. J. Transp. Res. Board 2009, 2138, 120–126. [Google Scholar] [CrossRef]
  35. Calvi, A.; D’Amico, F. A study of the effects of road tunnel on driver behavior and road safety using driving simulator. Adv. Transp. Stud. 2013, 30, 59–76. [Google Scholar]
  36. Narisada, K.; Yoseoikawa, K. Tunnel entrance lighting—Effect of fixation point and other factors on the determination of requirements. Light. Res. Technol. 1974, 6, 9–18. [Google Scholar] [CrossRef]
  37. Zhao, W.; Liu, H. Drivers’ Visual feature variation in long-tunnel exit of expressway. In Proceedings of the ICTIS 2011, First International Conference on Transportation Information and Safety, Wuhan, China, 30 June–2 July 2011; pp. 45–52. [Google Scholar] [CrossRef]
  38. Shao, F.; Xu, Q.; Xu, X.; Ma, C. Measuring Safety for urban tunnel entrance and exit based on nanoscopic driving behaviors. In Proceedings of the 2016 Eighth International Conference on Measuring Technology and Mechatronics Automation (ICMTMA), Macau, China, 11–12 March 2016; pp. 386–392. [Google Scholar] [CrossRef]
  39. Hu, Y.; Liu, H.; Zhu, T. Influence of spatial visual conditions in tunnel on driver behavior: Considering the route familiarity of drivers. Adv. Mech. Eng. 2019, 11, 168781401985366. [Google Scholar] [CrossRef] [Green Version]
  40. Yang, Y.; Chen, F. Research on the characteristics of driver visual behavior in highway extra-long tunnel. IOP Conf. Ser. Earth Environ. Sci. 2019, 295, 042139. [Google Scholar] [CrossRef]
  41. Fu, X.; He, S.; Du, J.; Wang, X.; Ge, T. Variations in Naturalistic Driving Behavior and Visual Perception at the Entrances of Short, Medium, and Long Tunnels. J. Adv. Transp. 2020, 2020, 7630681. [Google Scholar] [CrossRef]
  42. Jiao, F.; Du, Z.; Wang, S.; Yang, L.; Ni, Y. Research on drivers’ visual characteristics in different curvatures and turning conditions of the extra-long urban underwater tunnels. Tunn. Undergr. Space Technol. 2020, 99, 103360. [Google Scholar] [CrossRef]
  43. Viikari, M.; Chen, W.; Eloholma, M.; Halonen, L.; Chen, D. Comparative study of two visual performance based mesopic models based on reaction time and contrast threshold data. Light Eng. 2006, 14, 21–32. [Google Scholar]
  44. He, Y.; Rea, M.; Bierman, A.; Bullough, J. Evaluating Light Source Efficacy under Mesopic Conditions Using Reaction Times. J. Illum. Eng. Soc. 1997, 26, 125–138. [Google Scholar] [CrossRef]
  45. Akkil, D.; Isokoski, P. Accuracy of interpreting pointing gestures in egocentric view. In Proceedings of the 2016 ACM International Joint Conference on Pervasive and Ubiquitous Computing, Heidelberg, Germany, 12–16 September 2016; pp. 262–273. [Google Scholar]
  46. Braunagel, C.; Rosenstiel, W.; Kasneci, E. Ready for take-over? A new driver assistance system for an automated classification of driver take-over readiness. IEEE Intell. Transp. Syst. Mag. 2017, 9, 10–22. [Google Scholar] [CrossRef]
  47. Wibirama, S.; Nugroho, H.A. Towards understanding addiction factors of mobile devices: An eye tracking study on effect of screen size. In Proceedings of the Annual International Conference of the IEEE Engineering in Medicine and Biology Society, EMBS, Seogwipo, Korea, 11–15 July 2017; pp. 2454–2457. [Google Scholar]
  48. Kasneci, E.; Sippel, K.; Aehling, K.; Heister, M.; Rosenstiel, W.; Schiefer, U.; Papageorgiou, E. Driving with Binocular Visual Field Loss? A Study on a Supervised On-Road Parcours with Simultaneous Eye and Head Tracking. PLoS ONE 2014, 9, e87470. [Google Scholar] [CrossRef] [PubMed] [Green Version]
  49. Qin, L.; Dong, L.-L.; Xu, W.-H.; Zhang, L.-D.; Leon, A.S. An Intelligent Luminance Control Method for Tunnel Lighting Based on Traffic Volume. Sustainability 2017, 9, 2208. [Google Scholar] [CrossRef] [Green Version]
  50. Jukka, H.; Jorma, T.; AnnaMari, A. Pupil dilation as a measure of processing load in simultaneous, interpretation and other language tasks. Q. J. Exp. Psychol. Hum. Exp. Psychol. 1995, 48, 598. [Google Scholar]
  51. Wickens, C.D.; Hollands, J.G. Engineering Psychology and Human Performance; Prentice-Hall: Englewood Cliffs, NJ, USA, 1999. [Google Scholar]
  52. Ahlstrom, C.; Nyström, M.; Holmqvist, K.; Fors, C.; Sandberg, D.; Anund, A.; Kecklund, G.; Åkerstedt, T. Fit-for-duty test for estimation of drivers’ sleepiness level: Eye movements improve the sleep/wake predictor. Transp. Res. Part C Emerg. Technol. 2013, 26, 20–32. [Google Scholar] [CrossRef]
  53. Di Stasi, L.; Marchitto, M.; Antolí, A.; Cañas, J. Saccadic peak velocity as an alternative index of operator attention: A short review. Eur. Rev. Appl. Psychol. 2013, 63, 335–343. [Google Scholar] [CrossRef]
  54. Brisson, J.; Mainville, M.; Mailloux, D.; Beaulieu, C.; Serres, J.; Sirois, S. Pupil diameter measurement errors as a function of gaze direction in corneal reflection eye trackers. Behav. Res. Methods 2013, 45, 1322–1331. [Google Scholar] [CrossRef] [PubMed]
  55. Du, Z.G.; Zhu, S.Y.; Pan, X.D. Experimental study on visual adaptation of highway tunnel based on pupil area change. In Proceedings of the National Highway Science and Technology Innovation Forum, Cairo, Egypt, 10–12 February 2008. [Google Scholar]
  56. Brimley, B.K.; Carlson, P.J.; Hawkins, H.G. Use of Fixation Heat Maps to Evaluate Visual Behavior of Unfamiliar Drivers on Horizontal Curves. Transp. Res. Rec. J. Transp. Res. Board 2014, 2458, 16–26. [Google Scholar] [CrossRef]
  57. Yuan, W.; Fu, R.; Guo, Y.; Xue, C.; Wu, F. Analysis of visual fixation areas and visual transition characteristics during the driving process. In Proceedings of the International Conference on Road Safety and Simulation, Indianapolis, IN, USA, 14–16 September 2011. [Google Scholar]
Figure 1. Photos of (a) eye tracker; (b) test vehicle.
Applsci 11 05014 g001
Figure 2. Driver’s view at different locations.
Applsci 11 05014 g002
Figure 3. Original data of pupil area.
Applsci 11 05014 g003
Figure 4. Processed data.
Applsci 11 05014 g004
Figure 5. Box plot of average pupil area of drivers for different luminance levels in the daytime: (a) under 2 cd/m2; (b) under 2.5 cd/m2; (c) under 3cd/m2; and (d) comparison results of average pupil area for three luminance levels.
Applsci 11 05014 g005
Figure 6. Pupil area versus luminance level.
Applsci 11 05014 g006
Figure 7. Fixation maps of two participants.
Applsci 11 05014 g007
Figure 8. Original and calibrated images.
Applsci 11 05014 g008
Figure 9. Drivers’ visual space and visual region division.
Applsci 11 05014 g009
Figure 10. Fixation map of the six participants for the three-luminance levels: (a) 2 cd/m2; (b) 2.5 cd/m2; (c) 3 cd/m2; (d) illustrates the percentage of fixation points in each region for the three luminance levels.
Applsci 11 05014 g010
Figure 11. Comparison of fixation areas percentage.
Applsci 11 05014 g011
Table 1. Basic information of participants.
ParticipantDriving Experience (Years)AgeDriver’s License TypeVision
11332A 1>1.0
21235A>1.0
31436A>1.0
41237A>1.0
51639A>1.0
63258A>1.0
1 Driving license type A indicates that drivers are allowed to drive heavy passenger vehicles.
Table 2. Characteristics of Chibai tunnel.
ItemInformation
Length (m)1878
Height (m)7.45
Lanes (m)3.75 × 2
Shoulder width (m)1.5
Design speed (km/h)80
Speed limit (km/h)60
Lighting facilitiesLED
Longitudinal slope0 degree
Table 3. Information about the test vehicle.
ItemInformation
Vehicle weight1.2 tons
Engine displacement1.2 L
Maximum torque112 Nm
Maximum power61 KW (83 Ps)
Publisher’s Note: MDPI stays neutral with regard to jurisdictional claims in published maps and institutional affiliations.