1. Introduction
Currently, the development of technology and the computational capacity of devices has allowed the creation of innovative technological tools such as augmented reality (AR) and virtual reality (VR) [
1]. AR is a concept that has been developing since the beginning of the 1900s and is defined as the superimposition of virtual elements in a real environment [
2]. AR systems superimpose on the real world other meaningful 3D virtual elements so that the user can interact with them [
3]. When using AR, one never loses contact with the real world and, at the same time, one can interact with all the overlapped virtual information [
4,
5].
In recent years, there has been a proliferation of information technologies, which contribute to society’s efficient use of natural resources, ensuring more sustainable lifestyles and educational models [
6]. Current learning processes should be supported by these educational models, which should promote the delivery of digitized educational information [
7]. AR together with mobile learning can be the answer to this new educational model and, due to its characteristics, can facilitate understanding of educational content and increase students’ motivation and interest [
8].
This technology has three main characteristics: it combines the real and the virtual, it interacts in real time, and it can be executed in three dimensions [
9]. AR has been used in a range of fields such as: medicine [
10,
11], military training [
12], aviation [
3], telerobotics [
13], robotics [
11], entertainment [
14], and education [
4,
9,
15].
In the educational area, AR is gaining a lot of interest from educational institutions and teachers due to its diversity of applications for different levels of education and subjects [
16]. The versatility with which this technology is being developed has allowed the proliferation of applications for various educational areas such as mathematics, mechanics, physics and urban planning, among many others [
9].
AR is a technological tool with an incredible didactic potential that allows the design of innovative educational environments [
17]. This enables students to access educational experiences in an innovative way, allowing them to improve their understanding and reflect on their learning [
18]. This technological tool has proven to be effective in education, as it strengthens learning, making it more interactive and dynamic [
19,
20]. In addition, it has been shown that using AR within an educational environment is highly effective in improving student learning [
4,
18]. In higher education, AR helps students improve their skills and knowledge in subjects such as electrical theory, agronomy, chemistry, biology, geometry, and technological topics [
21,
22,
23].
Due to all the features that AR technology offers, it is important to investigate how mobile devices are being used for innovation in higher education through using AR applications. Therefore, this work, through the design of a mobile application (NetAR), aims to explore the effect that an AR application has on engineering students. This application was developed to be used as a complement to traditional education in the area of data networks, with two main topics, ISO/OSI (International Standardization Organization/Open System Interconnection) model and static information routing. By using NetAR, students can interact and observe 3D elements directly on their mobile devices, which can result in a better understanding of the topics covered. In addition, mobile devices are encouraged as a way to involve and engage students in their learning. However, there are usability issues that may impact learning effectiveness and motivation. For example, phone size and interaction techniques are perhaps two major limiting factors in mobile phone-based AR [
24]. Due to this, a usability analysis of the application was performed using the IBM Computer System Usability Questionnaire (CSUQ) tool.
The rest of the paper is organized as follows:
Section 2 indicates a background of augmented reality,
Section 3 presents the use of AR together with mobile devices for education,
Section 4 describes the design of the mobile application,
Section 5 shows the methodology applied in our research,
Section 6 presents the discussion of the findings, and
Section 7 provides conclusions and future work.
2. Background of Augmented Reality
Education is one of the foundations of modern society and aims to prepare students to become integral members of a society that today is increasingly committed to technological development [
25]. One of the technologies that has grown the most in recent years is AR, which consists of presenting the user with additional information in 3D that can be visualized using their mobile devices [
25]. There are several initiatives related to AR and mobile learning which have focused on developing innovative teaching and learning methodologies for multiple disciplines and educational levels [
22,
26,
27].
The new generation of students (digital natives) have different skills and aptitudes, which make them more attuned to technology compared to previous generations [
28]. It is for this reason that this generation requires their educational institutions and teachers to implement and adapt new tools and technologies in the learning process [
29]. There are a range of technological tools that can create an intelligent learning environment, one of these being AR [
15]. This technology allows adapting educational content focused on students with the aim of improving their practical skills, emphasizing that theoretical knowledge is the basis, but skills developed in the practical environment are always necessary [
5]. AR allows students to create an environment where learning can be driven towards intelligent education based on information technologies, which help to change educational paradigms [
25]. There are some initiatives that show significant and determinant results on the efficiency of student learning that are related to AR technologies (30% faster student activity and teamwork, 50% better understanding of information, and 50% easier exchange of complex information) [
21,
30].
In addition, there is a standard for augmented reality learning experience models (ARLEM). The standard was developed with the help of a reference implementation, MIRAGE XR, to demonstrate how real-life training applications can be created and edited using an augmented reality editor for learning experiences [
31]. This defines a general integrated conceptual model that describes the interactions between the physical world, the user, and digital information and context for AR-assisted learning [
32]. The purpose of this standard is to support the discovery, retrieval, transfer, and execution of AR-enabled learning content, thereby facilitating the creation of educational repositories [
31].
AR is used in a wide variety of fields, from entertainment to education [
30]. Many of the studies have opted for mobile applications due to the portability and ubiquity that mobile devices offer [
27,
33,
34,
35,
36]. One of the limitations in the use of mobile applications has been the technological advances at the beginning of the 2010s, since using a smartphone with AR was not as easy and other less portable options were chosen [
27]. Currently, these limitations are almost nonexistent, as new information technologies and mobile devices are much more affordable and facilitate the development of AR applications [
6].
Currently, there are several initiatives using AR to generate an innovative educational approach in higher education [
37,
38]. For example, Wang [
39] uses a combination of AR and maps to support geography field education at Beijing University. Harun et al. [
37] analyzes the impact on learning in students learning specific topics in the field of applied physics with the use of AR. Sharmin and Chow [
40] realized a mobile application using AR to support teaching dental students in an oral biology course. This app will support students in learning independently and will allow them to self-assess at their own convenience. The construction industry has also benefited from AR technology; here, Vasilevski et al. [
41] and Kim and Irizarry [
42] use mobile applications with AR, as it allows users to see the real world with an addition of external information and can influence students’ learning satisfaction in spatial skills. In addition, AR is used for language learning [
43], postal networks [
44], books, science and technologies [
45], chemistry [
38], and interior design [
46].
Today, the bring your own devices (BYOD) philosophy is more widely used in the educational field, being applied in an educational context in which students use their personal devices in their learning activities [
47]. Mixing the potential of AR with the features provided by mobile learning results in a powerful tool to boost autonomous and mobile learning [
30]. Although AR is considered a gamification tool, by using it as an educational supplement, interactive environments can be created for students, motivating them to participate in education [
9,
30].
Motivation is considered to be a student’s desire to participate in an educational environment and engage in learning [
26]. As part of an increasingly technological society, interaction with the real world is relevant to the learning process [
27]. AR is an optimal tool to generate an engaging learning environment and can be used as an educational alternative with which the student can experience the innovative educational environment [
25]. The traditional educational methodology was based on acquiring new knowledge by reading books and listening to lectures from teachers, whereas AR presents a new learning approach that suggests that it is easier for students to learn concepts through visual stimulation that can be interacted with [
9].
3. Mobile Devices and Augmented Reality in Education
In distance learning environments, it has been possible to notice several deficits in the used education model, especially in practical subjects [
5,
48]. One of the biggest problems is the lack of teacher and student communication, the difficulty of the teacher in solving individual student problems, and the loss of interest in the classes [
48]. To solve these problems, teachers must look for new tools and innovative methodologies to improve the distance learning experience [
49]. It is important to emphasize that information technologies are increasingly being used in education, and AR together with mobile devices are two of the technologies that have produced the most innovations in this educational field [
20,
30,
50]. In addition, the use of mobile devices has increased considerably; approximately half of the students use them to investigate in greater detail the topics covered in class and to obtain additional information about them [
51]. Mobile devices are widely used due to their features and benefits such as having information at the user’s fingertips, use of online educational material, high portability, universality, and ubiquity [
35,
52]. Today, almost everyone has at least one mobile device, and 74.43% of these have an Android operating system [
53]. Because of this, the development of learning applications that seeks to cover the widest possible audience focuses on Android devices. In addition, a study conducted in 2017 [
19] indicates that the preferred devices for the use of AR technologies are mobile devices, due to their ease of use, portability, and cost, compared to laptops or desktop computers. However, there are other items such as smart glasses that are also being widely used for AR applications [
20].
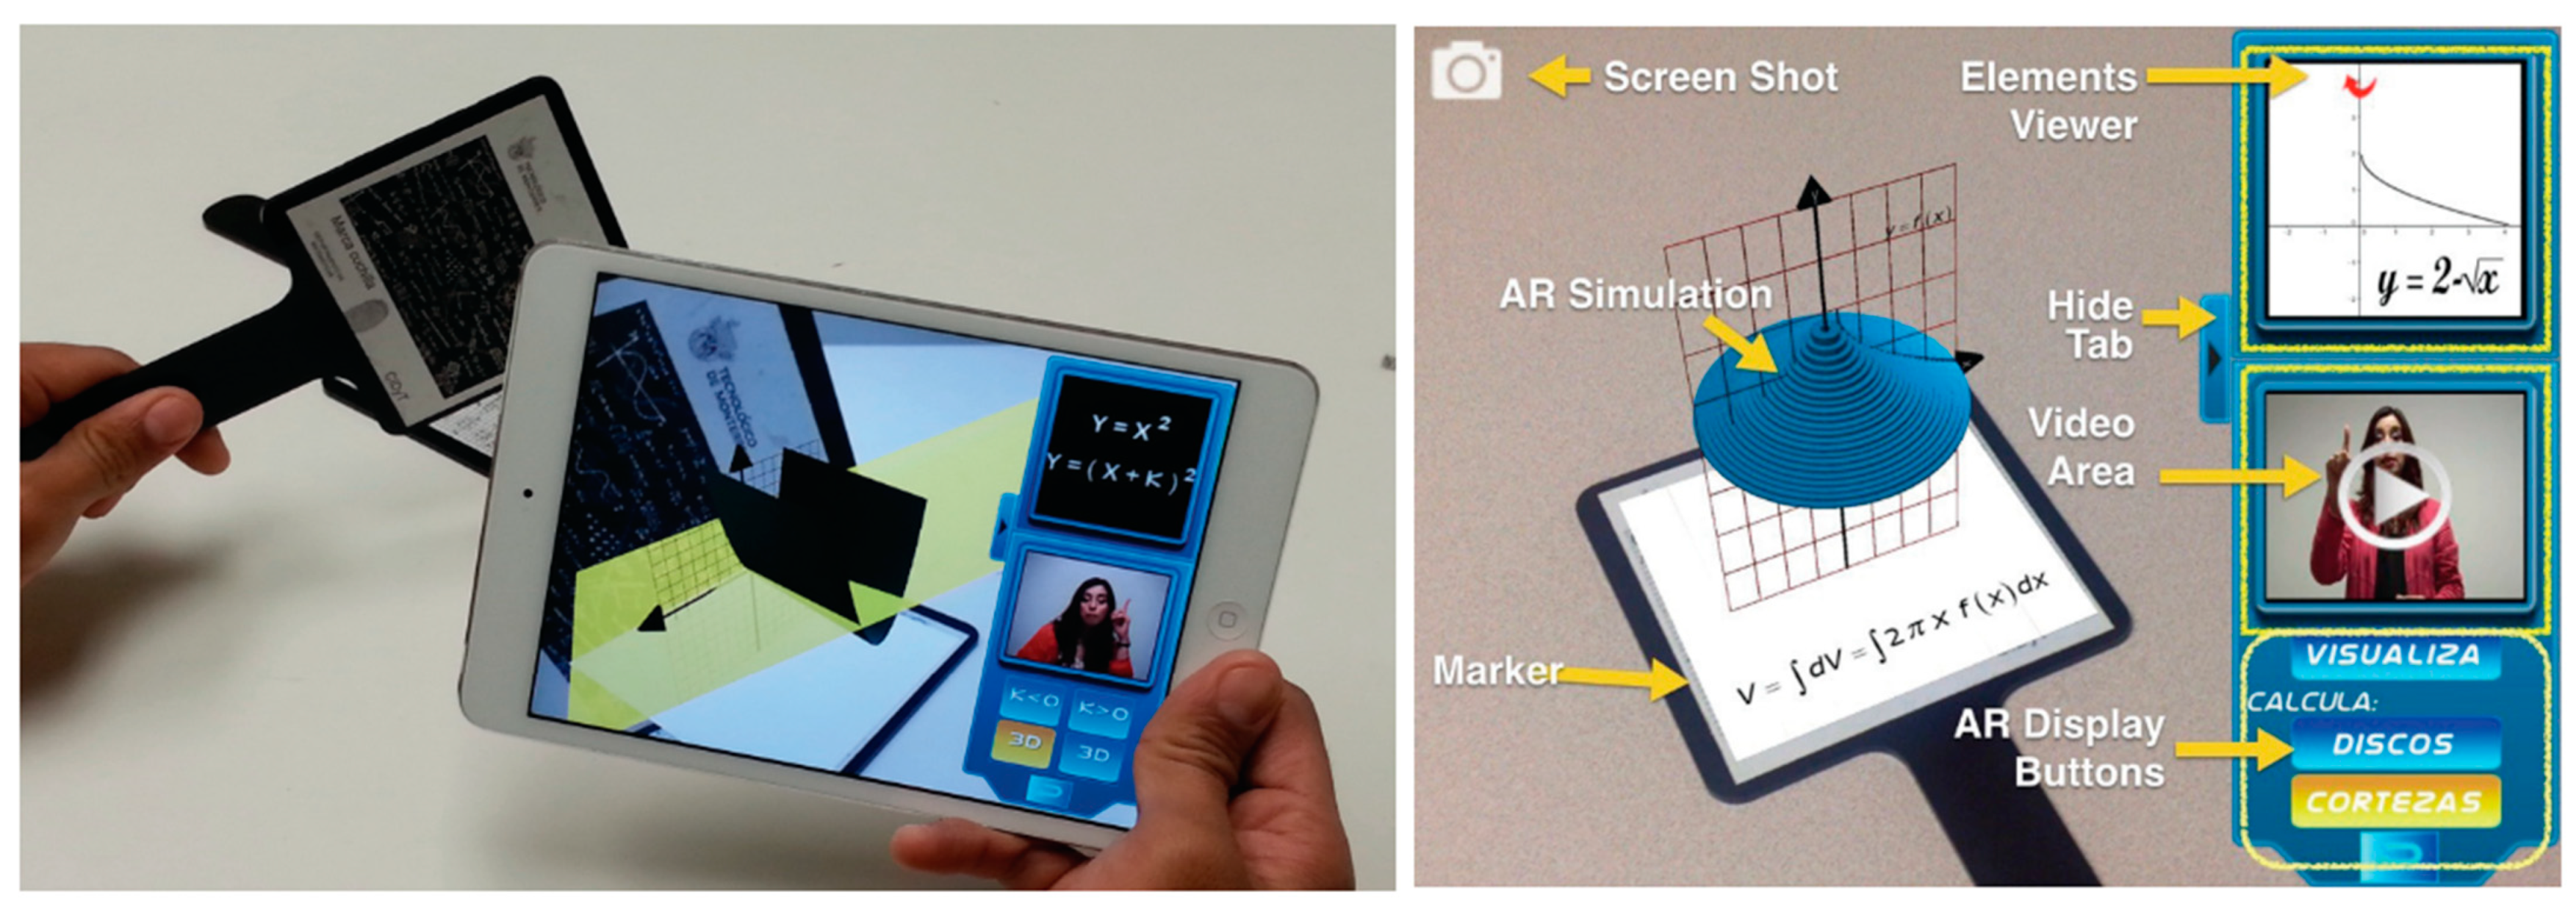
There are several examples of initiatives using AR and mobile devices in education. One of these is a mobile application that allows learning calculus through spatial visualization of 3D objects [
23], as can be seen been in
Figure 1. This application works through an interactive menu that shows mathematical functions, a video of extra information, and the 3D graph of the function. There are also mobile applications using AR in the field of anatomy, which are capable of recognizing bones and muscles to provide the user with interactivity and better learning [
54]. On the other hand, a technique currently used with mobile AR applications is interactive books, which are based on the presentation of 3D objects with AR technology when viewing the pages of the book [
55].
Cisco’s networking academy program has integrated a blended learning model (AR and VR) effectively to prepare its learners for network security positions using online learning courses and e-learning platforms [
56]. Tranter, technology presenter at Cisco and author of “Virtual and Augmented Reality in Education” [
17], mentions that, being immersed in a highly visual society, the more you can engage learners with visual stimuli, the more likely they are to consume and retain that information. For this reason, it is stated that an AR tool will help both teachers and students to have a much friendlier and more didactic study environment.
It is also important to identify the effects of technology integration in educational environments and how they can maximize and enhance learning [
50]. The use of AR techniques allows the learner to experience sensations and explore learning experiences that, in some cases, may exceed those offered by traditional lectures [
5]. AR uses mobile devices to provide real-world abstraction and contextual visualization; therefore, the use of AR in conjunction with smart devices encourages interest and increases motivation for learning [
51].
Within education, there have been research studies that evaluate how student motivation can be improved with the use of AR. One of these initiatives claims that student motivation, using an AR-based methodology, increased by 11% [
57]. The results of other studies conclude that people are willing to be taught using AR [
30], because it makes learning more flexible [
15], and increases interest in subjects that may not be entertaining and motivating [
34]. Students’ performance improves when using AR; however, this increase is closely related to the type of cognitive abilities of each person [
58].
4. NetAR Mobile Application Design
NetAR was designed based on an image target that the mobile device can identify and track, in order to superimpose the AR on it [
59]; the same image target was used for all the developed scenes. Each scene had its own movements and animations and was developed in such a way that the users can view the scene in 360 degrees by moving their mobile device at different angles.
The project focused on the design of sketches and animation ideas that could then be programmed with the AR Unity application development tool. This software streamlined the creation of visual learning content by integrating tools such as a 2D and 3D figure viewer, a scenario control system, support for importing external packages and models, and an error compiler into a single development platform.
NetAR was developed for mobile devices with Android operating system. The purpose of the application was to provide a series of AR scenes focused on networking topics (ISO/OSI model and static routing). It was designed to be intuitive and easy to navigate for the user; user response times depend on the resources of the mobile device used. The application provides several facilities to users as it is user-friendly, and by presenting information in a visual way, it is easier for users to learn and retain that information compared to using textbooks. The animations are presented simultaneously with audios that explain the general topic being covered and subtitles, displayed at the bottom of the screen, that serve to facilitate the understanding of the topics involved and allow hearing-impaired users to understand what is happening in the animations.
Once the user starts the NetAR application, a menu appears on the screen. The menu has the option to select the desired topics, which can be seen in
Table 1. In addition, there is a help option that shows a manual explaining the basic operation of the application. In the settings option, the user can turn the volume up or down as desired.
NetAR has two main levels designed to deliver information on two relevant topics in the networking area (ISO/OSI model and static routing):
Level 1. This first level was developed for students who have never studied or do not know the concepts of networking and the ISO/OSI model. At this level, the basic concepts of data networks are studied and the layers of the ISO/OSI model are analyzed. In
Figure 2 of NetAR, the seven layers of the ISO/OSI model can be appreciated and the way in which the information travels from the origin to the destination can be observed. Furthermore, NetAR shows the construction of the different protocol data units (PDU), all this using AR for a better understanding.
Level 2. The second level was developed for students who have an understanding of the OSI model and the fundamental concepts of networking. The subject of this level, as can be seen in
Figure 3, involves how to route data from source to destination using static routing protocols. NetAR shows the packet travel and the decision making (next hop based on the IP address) of the devices involved so that the messages can travel from source to destination and vice versa.
It takes the user an average of 25 min to go through all the application topics to fully cover the OSI model and the fundamental concepts of networking. Once they have reviewed all the topics, they will be able to answer general questions about them and identify the basic elements of routing, such as utilized devices and how packets travel through the network. As for the OSI model, they will be able to identify which layer each information unit is in and what fields it carries.
5. Methodology
This section describes the methodology adopted for the study. It includes the usability analysis of NetAR through the IBM CSUQ tool (James Lewis, 1995, Boca Ratob, FL, USA) [
60], and the evaluation of the participants through a control group.
5.1. Usability Analysis of the Mobile App
5.1.1. Participants
For the NetAR usability analysis, there were 80 participants, of which 63 were men (78.75%) and 17 were women (21.25%). The participants were selected by convenience sampling and were students from a university in Ecuador. The age of the participants was between 18 and 21 years. Of the 80 participants, 60 were between 18 and 19 years old and 20 were between 20 and 21 years old. Of the 80 participants, 78 reported that they knew and had used a mobile game-like application with AR; 74 of them reported that they did not know and had not used an educational mobile application with AR. All participants had a mobile device of their own, 80% had only a smartphone, 45% had a smartphone and a tablet, and 65% of them had internet access via mobile data.
5.1.2. Tasks
The participants had to perform three tasks:
Print the image target and open the mobile application to start navigating the different modules of the app.
Open the ISO/OSI model option, navigate and use the navigation controls.
Open the routing option, navigate and use the navigation controls.
Each participant accepted an informed consent that was given to them via a web form, after which they took a demographic survey; then, each participant received training in the use of NetAR. Participants were able to ask questions after using the application. After their doubts were clarified and they were sure they had mastered the application, they performed the three tasks requested. The experimentation lasted about 25 min; after the completion of the tasks, they were asked to complete the IBM CSUQ survey.
5.2. Study Design Using a Control Group
The usability study was conducted with the same participants because the subject of data networks was part of their curriculum and the concepts shown in the mobile application (the ISO/OSI model and routing) were the most difficult for the students.
The selected participants were students of two courses at different levels of the engineering career; group beginners (40 participants) were those who had no previous knowledge of networking. Group advanced (40 participants) consisted of those who were familiar with the concepts of networking, IP addressing, and the ISO/OSI model.
To perform the proposed analysis, for each group (beginners and advanced), an experimental group (EG) and a control group (CG) were chosen by random sampling technique as seen in
Table 2.
5.3. Learning Model
Two learning models were used for this research:
This learning method was used for the CG participants. The instructor used the conventional model (presentations and traditional lecture) on networking concepts for the beginners and advanced groups.
This learning method was used for the EG participants. The instructor used the conventional model (traditional presentations and lectures) and the NetAR application to explain networking concepts for beginners and advanced groups.
The study originated from the need to measure the effectiveness of NetAR, which was developed for learning basic networking concepts for engineering students. The present study was conducted over a period of 3 weeks, during weekdays. In the first and second weeks, the models were used as a teaching methodology for each group (EG and CG). During the third week, all participants were assessed with specially designed questionnaires. Both groups learned the networking concepts for three hours on one day per week. This multiple-choice questionnaire evaluated the learning challenges of the participants in both groups (CG and EG). The structure and questions of these questionnaires were based on the guidelines given by the CISCO Academy in the CCNA&1 Introduction to Data Networking V7 course.
All groups of participants had the same teacher, the same learning time, and the same learning content. Each questionnaire consisted of 10 questions weighted 1 point each, resulting in 10 points for each questionnaire. To validate the reliability and validity of the questionnaires, Kuder Richardson was used, with a result of KR20 = 0.74 (acceptable between (0.70–0.90)). In addition, the time it took each participant to complete the questionnaire was recorded to analyze the results.
Of all the EG participants, 98% installed the application on their smartphones, and 2% on a tablet with Android OS. The instructor gave an introduction on how to use the application and its features, how to move forward, how to select a particular option, how to start and pause the animation, and how to navigate in order to visualize the AR design completely. All students actively participated in the study and followed all the instructions.
5.4. Used Variables
Independent variables
Learning method;
Learning level (LL);
Beginners group
Advanced group
Dependent variable
6. Results
6.1. Usability Results
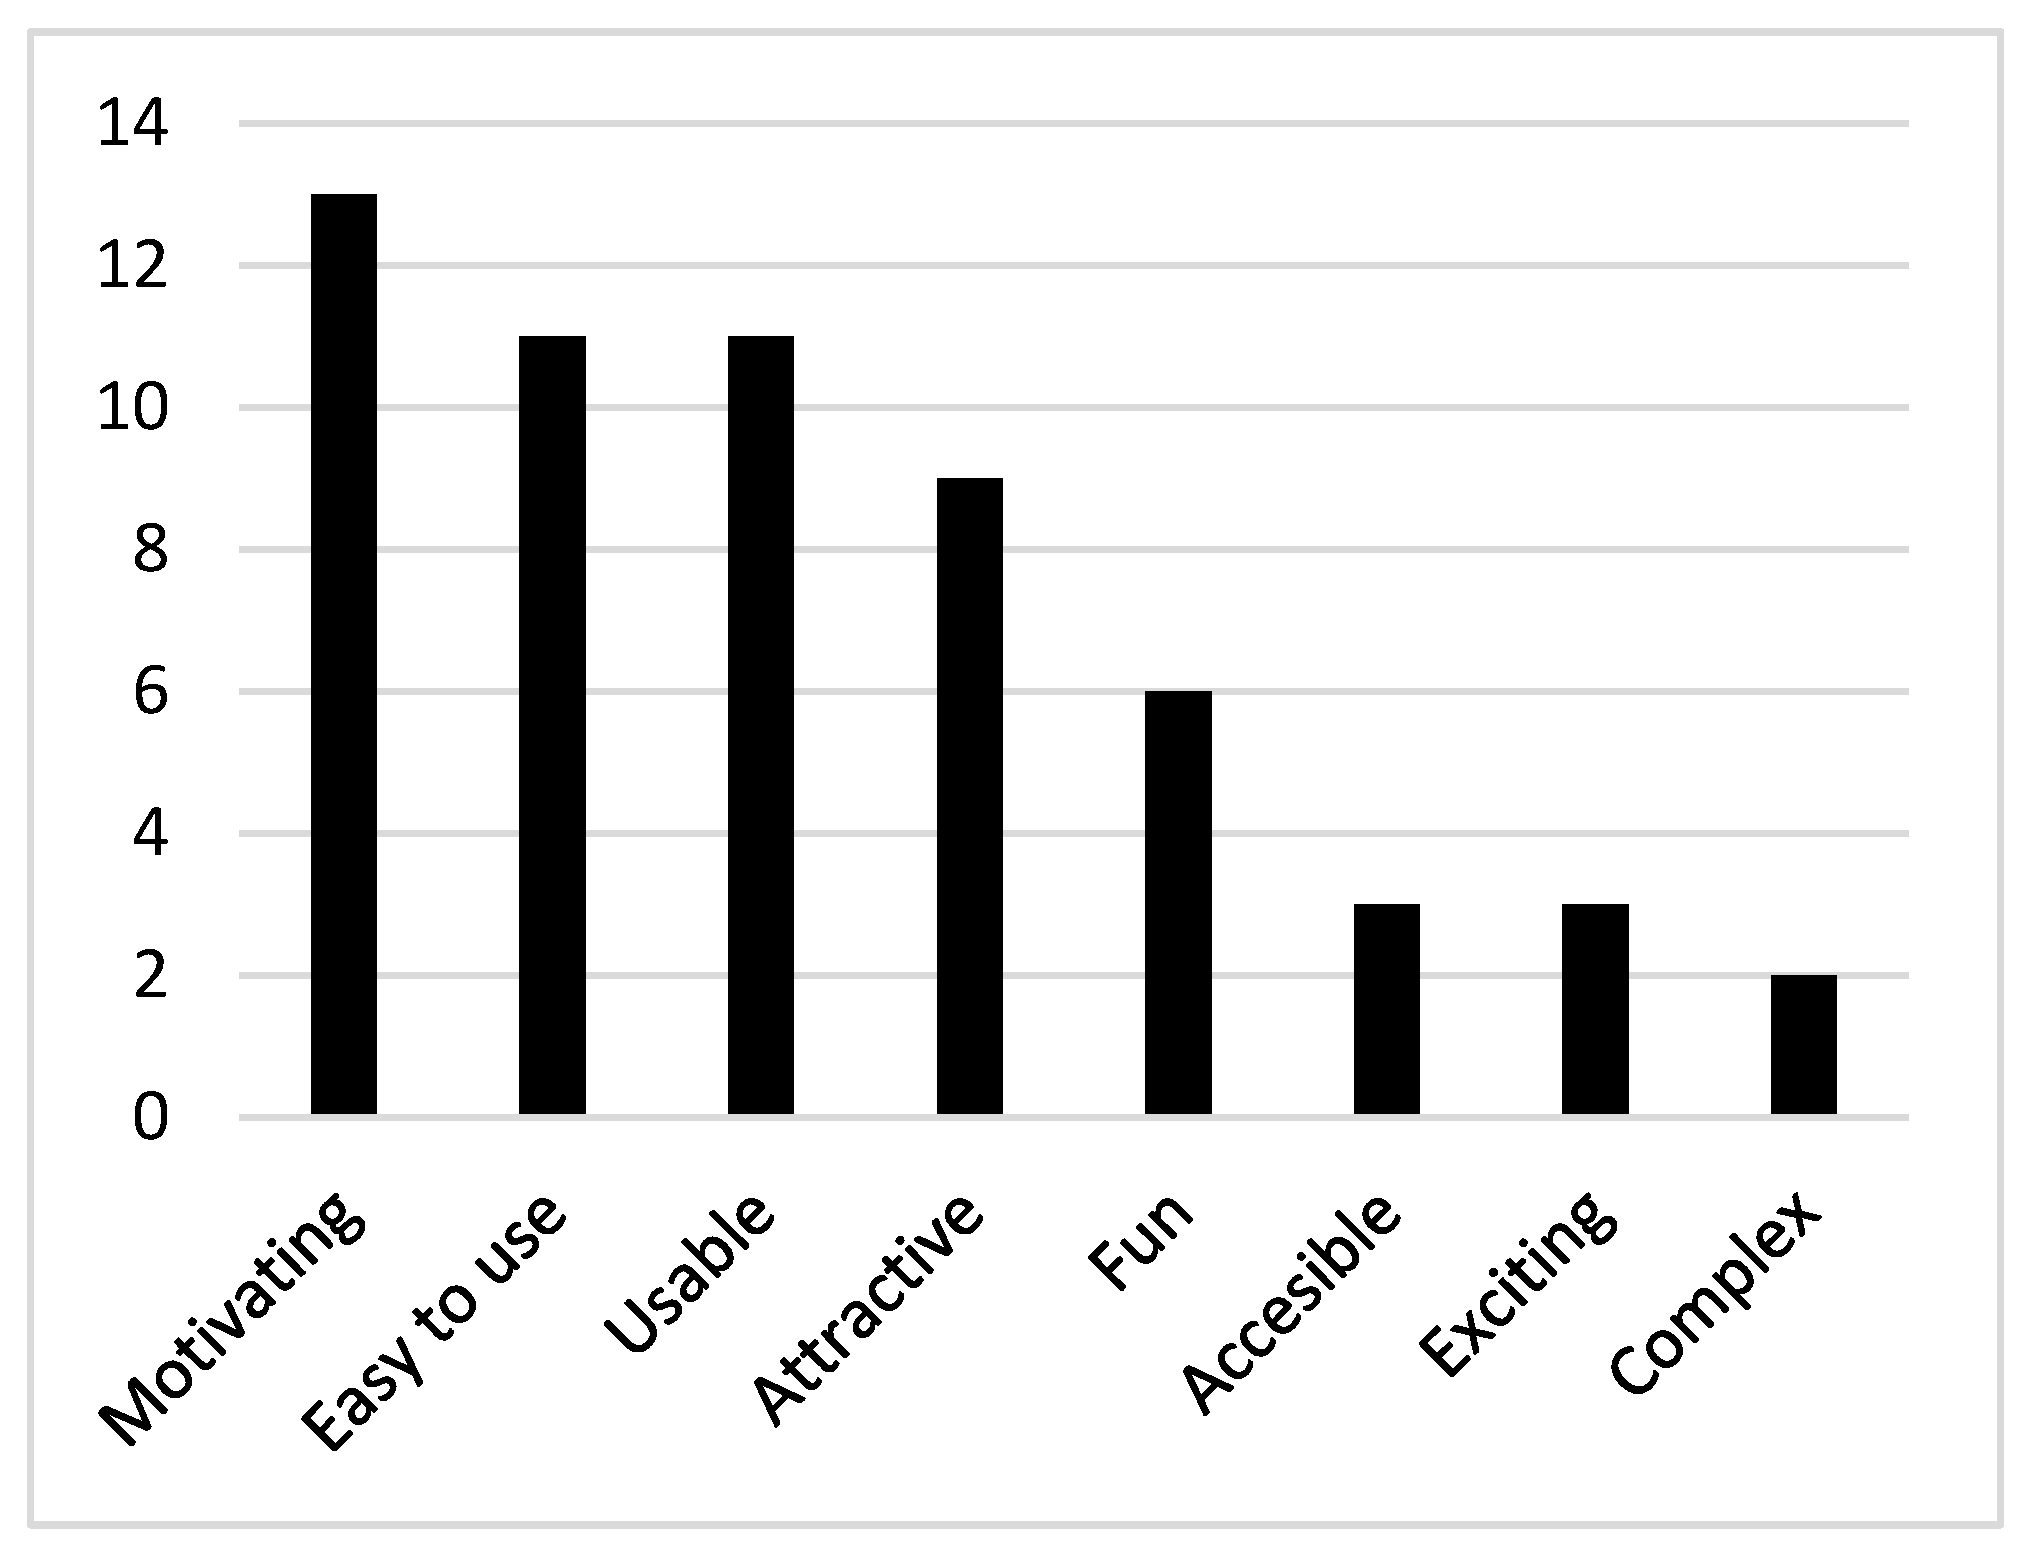
This section presents the results of the application of the IBM CSUQ instrument; in addition, participants were invited to describe the application using the most representative word from a set of desirability tools [
61]. As can be seen in
Figure 4, the most frequent words that users attributed to NetAR were motivating, easy to use, and usable.
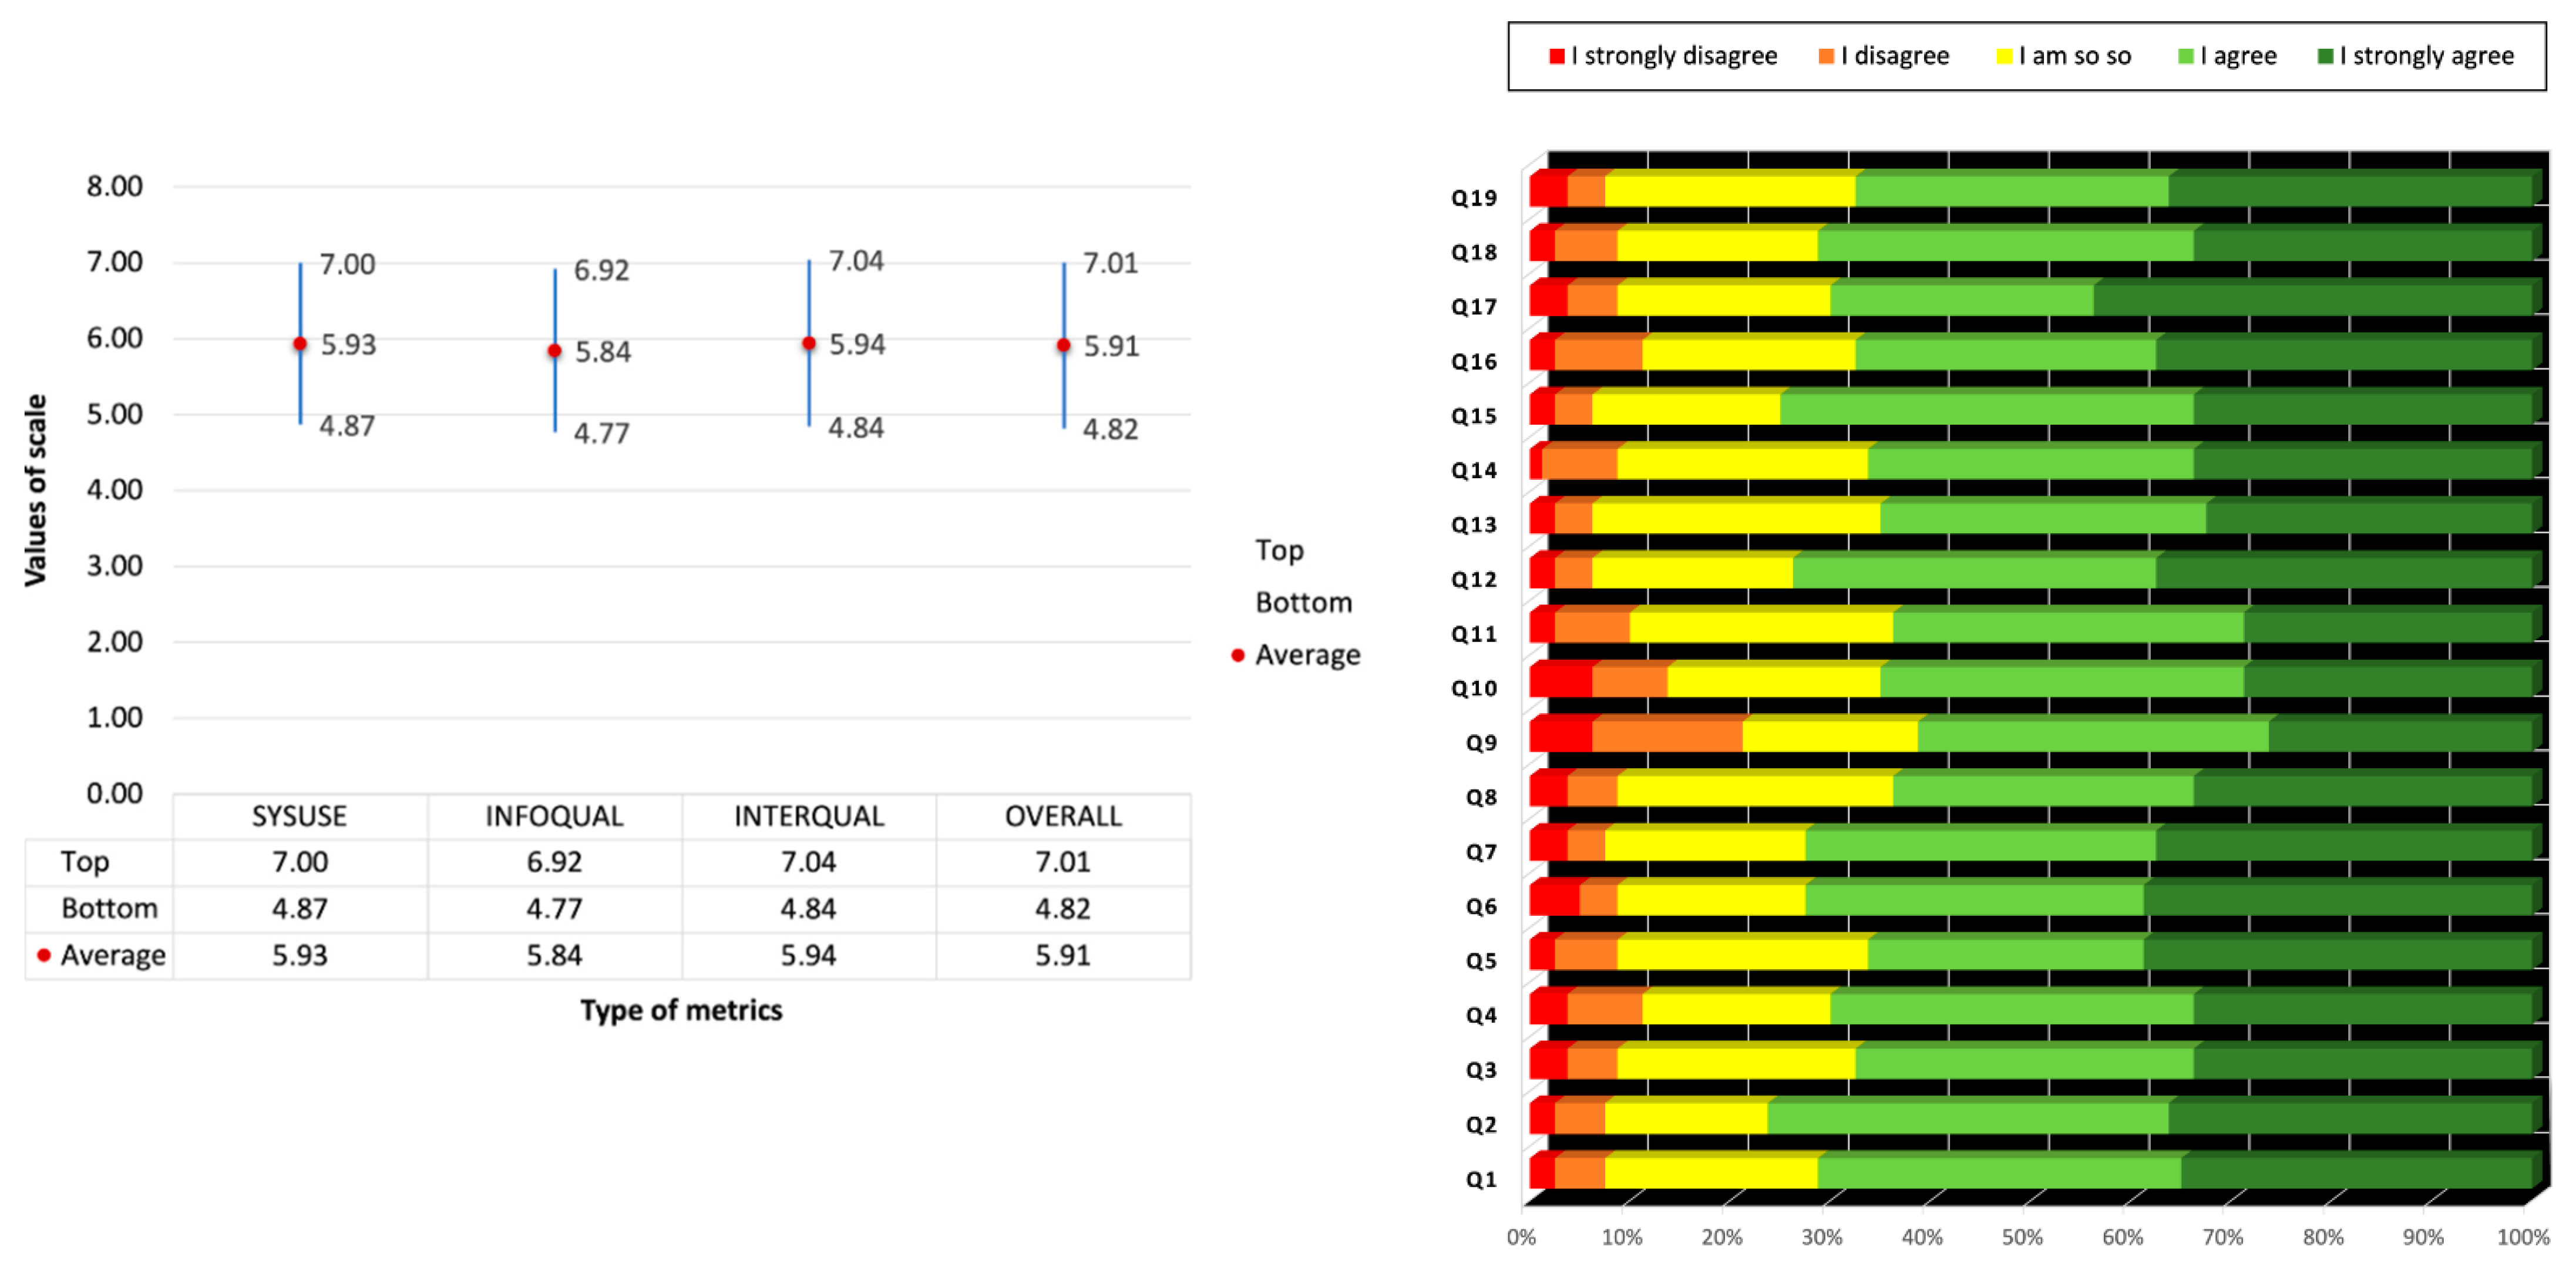
Table 3 shows the mean, median, and standard deviation measures aggregated by the four CSUQ categories.
Figure 5 shows the results of the IBM CSUQ questionnaire. A positive result is observed, given that the majority of the participants answered with the responses that have to do with “I agree” and “I strongly agree”. Looking at the results, the study suggests that overall user satisfaction follows a positive trend, with the average result being
μ = 5.91 out of a maximum of 7 and a standard deviation of
σ = 1.08. As for the usability of the system (SYSUSE), there is a similar trend, with an average value (
μ = 5.93) higher than the other factors of analysis both in the minimum value and in the average, showing that the usability is satisfactory for the users. The information quality (INFOQUAL) has the lowest results, with an average value (
μ = 5.84) indicating that it can be improved; therefore, we have considered that future improvements should aim at more accurate description of the scenes, more relevant models, and a detailed user manual.
On the other hand, the interface quality (INTERQUAL) shows the highest values (μ = 5.94), denoting that the interface was appreciated by the users and they consider the system to be easy to use.
Question P9 is the most negatively rated question (μ = 5.5625, σ = 1.311, and M = 6), which indicates that the system should improve when displaying error messages and how to solve them. The best rated questions are: question P2 (μ = 6.03, σ = 0.981, and M = 6) and question P12 (μ = 6.03, σ = 0.981, and M = 6), which indicates that the participants were able to effectively use the application because the information was easy to find. Regarding the usability of the system, question Q6 (μ = 5.96, σ = 1.130, and M = 6) and question Q7 (μ = 5.96, σ = 1.130, and M = 6) indicate that most users felt comfortable using the application and it took them little time to learn how to use it.
Figure 5 shows the values obtained for each question of the IBM CSUQ. In summary, the results of the questionnaire were perceived as highly positive. INFOQUAL and SYSUSE have the highest values, reflecting the fact that overall satisfaction with the application is strongly related to the information and ease of use of the system.
In general, the usability of the system was well received and it can be considered that the participants were comfortable with the structure of the system, the content, and its interactive functions.
6.2. Results of the Experimentation with the Control Group and the Experimental Group
Establishing the criteria for measuring the usefulness of NetAR is important for evaluating its effectiveness. One way to identify the effectiveness of the mobile application is to analyze the “mean questionnaire score” between EG and CG; the EG score should be statistically higher than the CG score. For this, the following hypotheses were proposed:
Hypothesis 1 (H1). There is no significant difference in the mean score of the questionnaire between EG and CG.
Hypothesis 2 (H2). There is a significant difference in the mean score of the questionnaire between EG and CG.
To address hypotheses 0 and 1, a Z-test was applied to evaluate the performance of the two groups (EG and CG) in the different learning modalities and the effectiveness of the NetAR interface, as can be seen in
Table 4. This test was performed with a reliability of 95%. A two-sample test (T) assuming unequal variances was used on the results of the two groups to obtain the variance of each group (95% reliability) and use it in the Z-test.
In
Table 4, it can be noticed that the value of
z = 6.48 which is greater than the critical value of
z (one-queue) = 1.6448 and greater than the critical value of
z (two-queue) = 1.9599. In addition, the p value was less than
σ; therefore, the null hypothesis H1 is rejected and H2 is accepted, and it can be stated that there is a significant difference in the mean score of the questionnaire between EG and CG.
These results may be the result of the use of the mobile application, and we can conclude that the use of NetAR influenced the difference in scores obtained. For this reason, the hypotheses of performance with each of the teaching methods were proposed:
Hypothesis 3 (H3). There is a significant difference between the scores of the four groups due to the teaching method used.
Hypothesis 4 (H4). There is no significant difference between the four groups due to the teaching method used.
To accept or reject hypotheses H3 and H4, a two-way ANOVA with 95% reliability was used for the four. These groups (dependent variable) were evaluated with a questionnaire to identify whether the use of the mobile application (independent variable) influenced their score (dependent variable) or whether the higher score result was circumstantial. The sample used and the variables are described in
Table 5; the detail of the groups is shown in
Table 6.
Table 7 shows the ANOVA data; here, it is noticeable that the probability of the data for the four groups is
p = 4.26342 × 10
−8 which is a value less than the
σ = 0.05; furthermore, the F value is greater than the critical value of F for the four groups. These results indicate that we can accept H3 and reject H4. Therefore, it can be stated that there are significant differences between the groups, and these are caused by the type of learning to which they were exposed. Furthermore, use of NetAR had a directly proportional effect on the result of the questionnaire, compared to traditional learning.
Figure 6 shows the average of the questionnaire results for beginners and advanced groups with their two clusterings (CG and GE). It can be seen that the groups that used NetAR had a higher performance in the two questionnaires. This confirms that the use of NetAR influenced the performance of the students. It can also be evidenced that the participants of the advanced group performed better than the participants of the beginners group.
To begin the analysis of the results, it must be taken into account that the beginners group was completely different from the advanced group. In addition, the questionnaires were different for each group of participants.
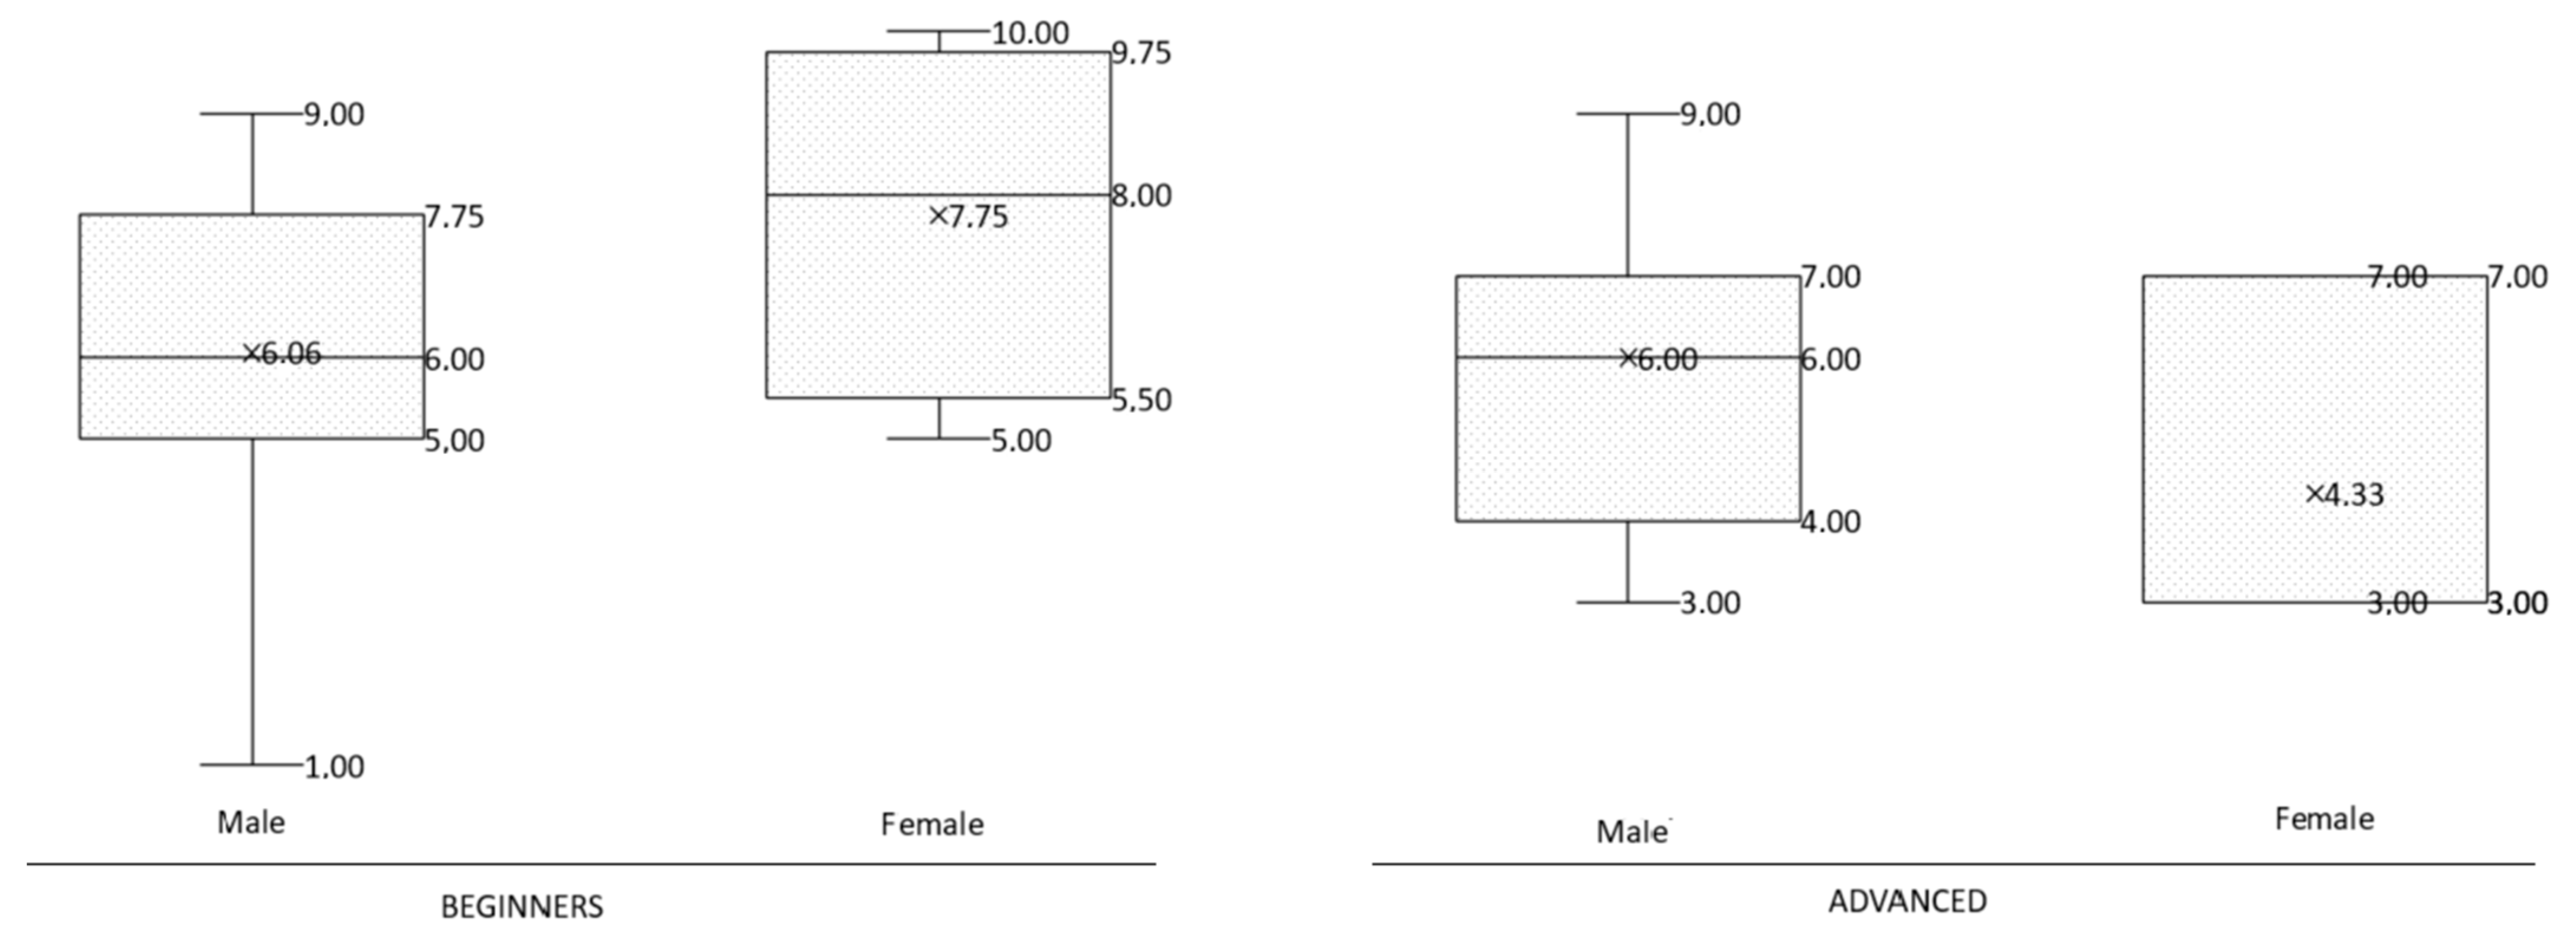
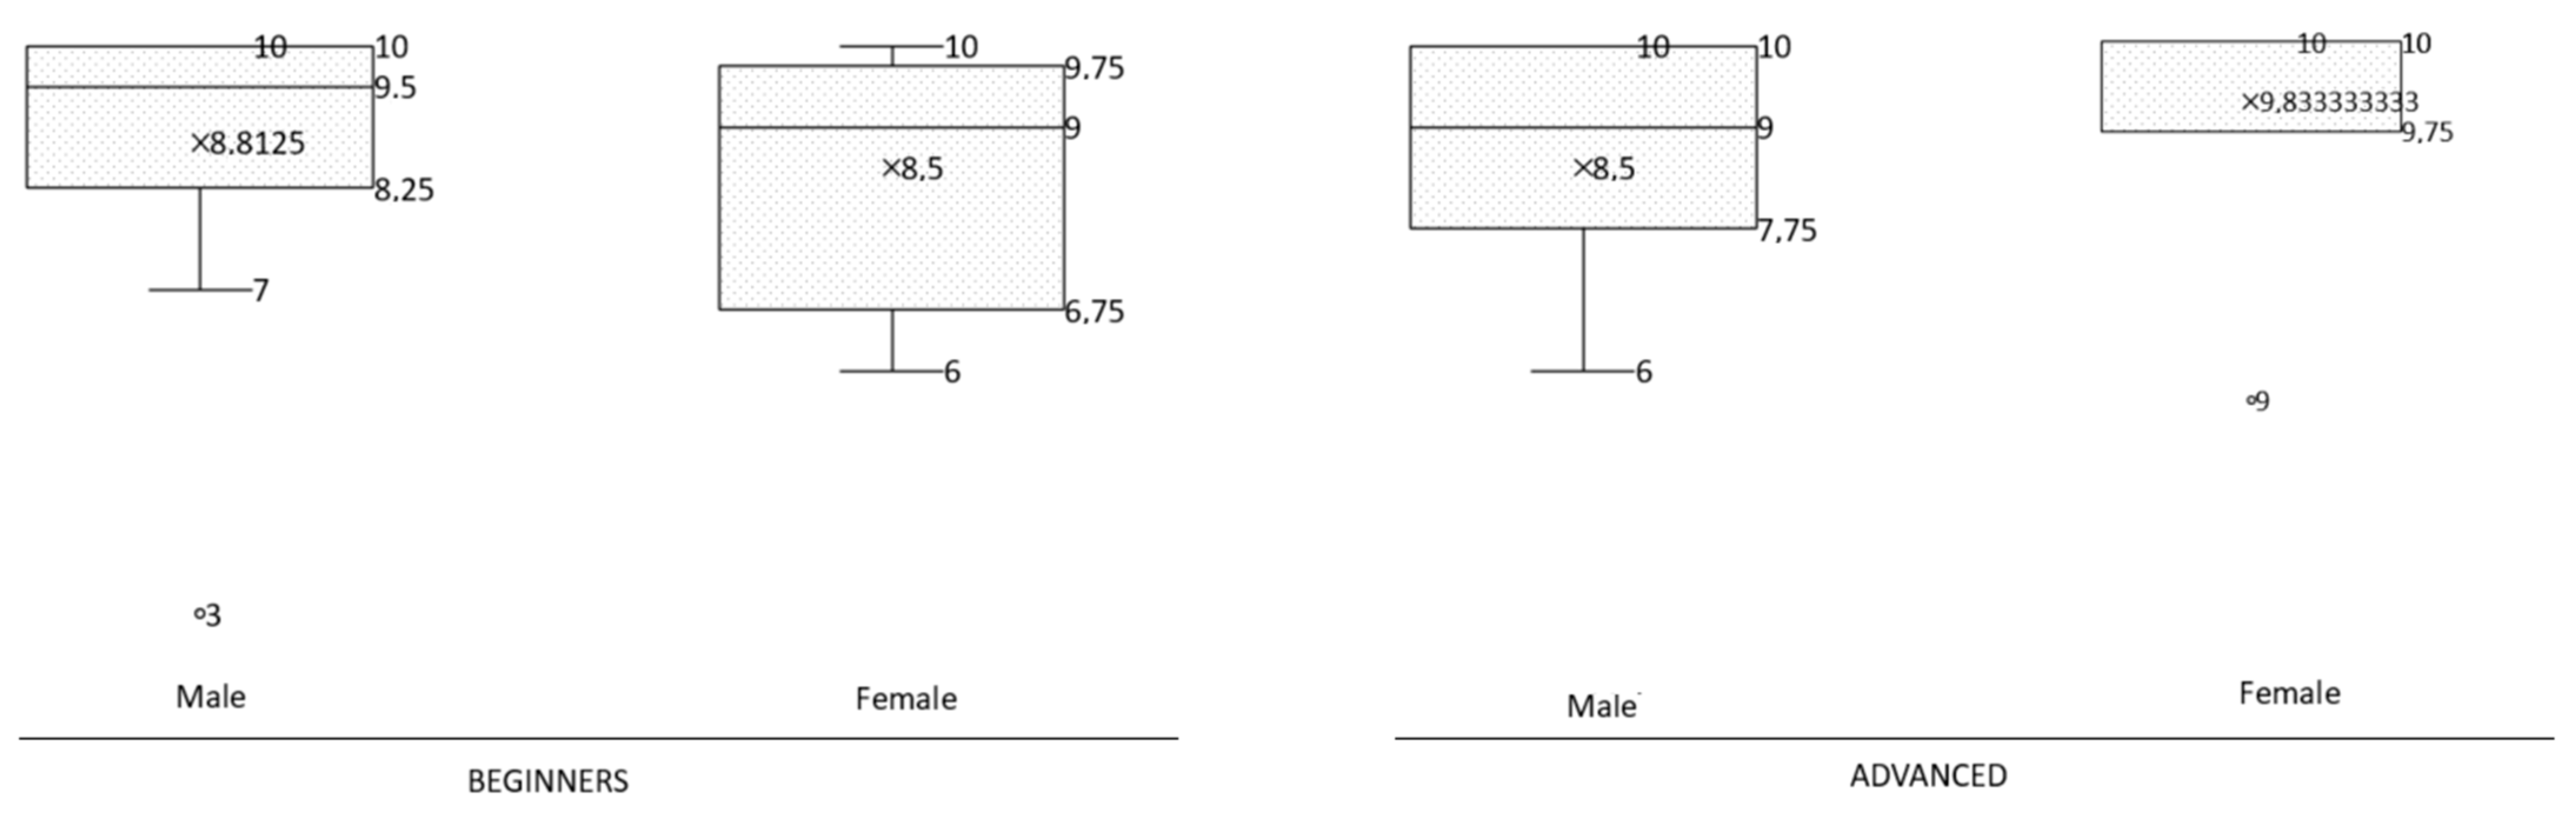
Figure 7 and
Figure 8 show the results evaluated according to the gender of the participants.
There was a significant difference in both groups. These graphs indicate that in the beginners group, men had a better understanding of the theoretical part of the networking topics. On the other hand, in the advanced group, women excelled in the more complex networking topics such as data routing.
This result is due to the fact that the average was greatly affected by the number of participants of each gender. Since there were fewer women than men, a few high marks could greatly raise the average, while a few low marks would cause the average to drop considerably.
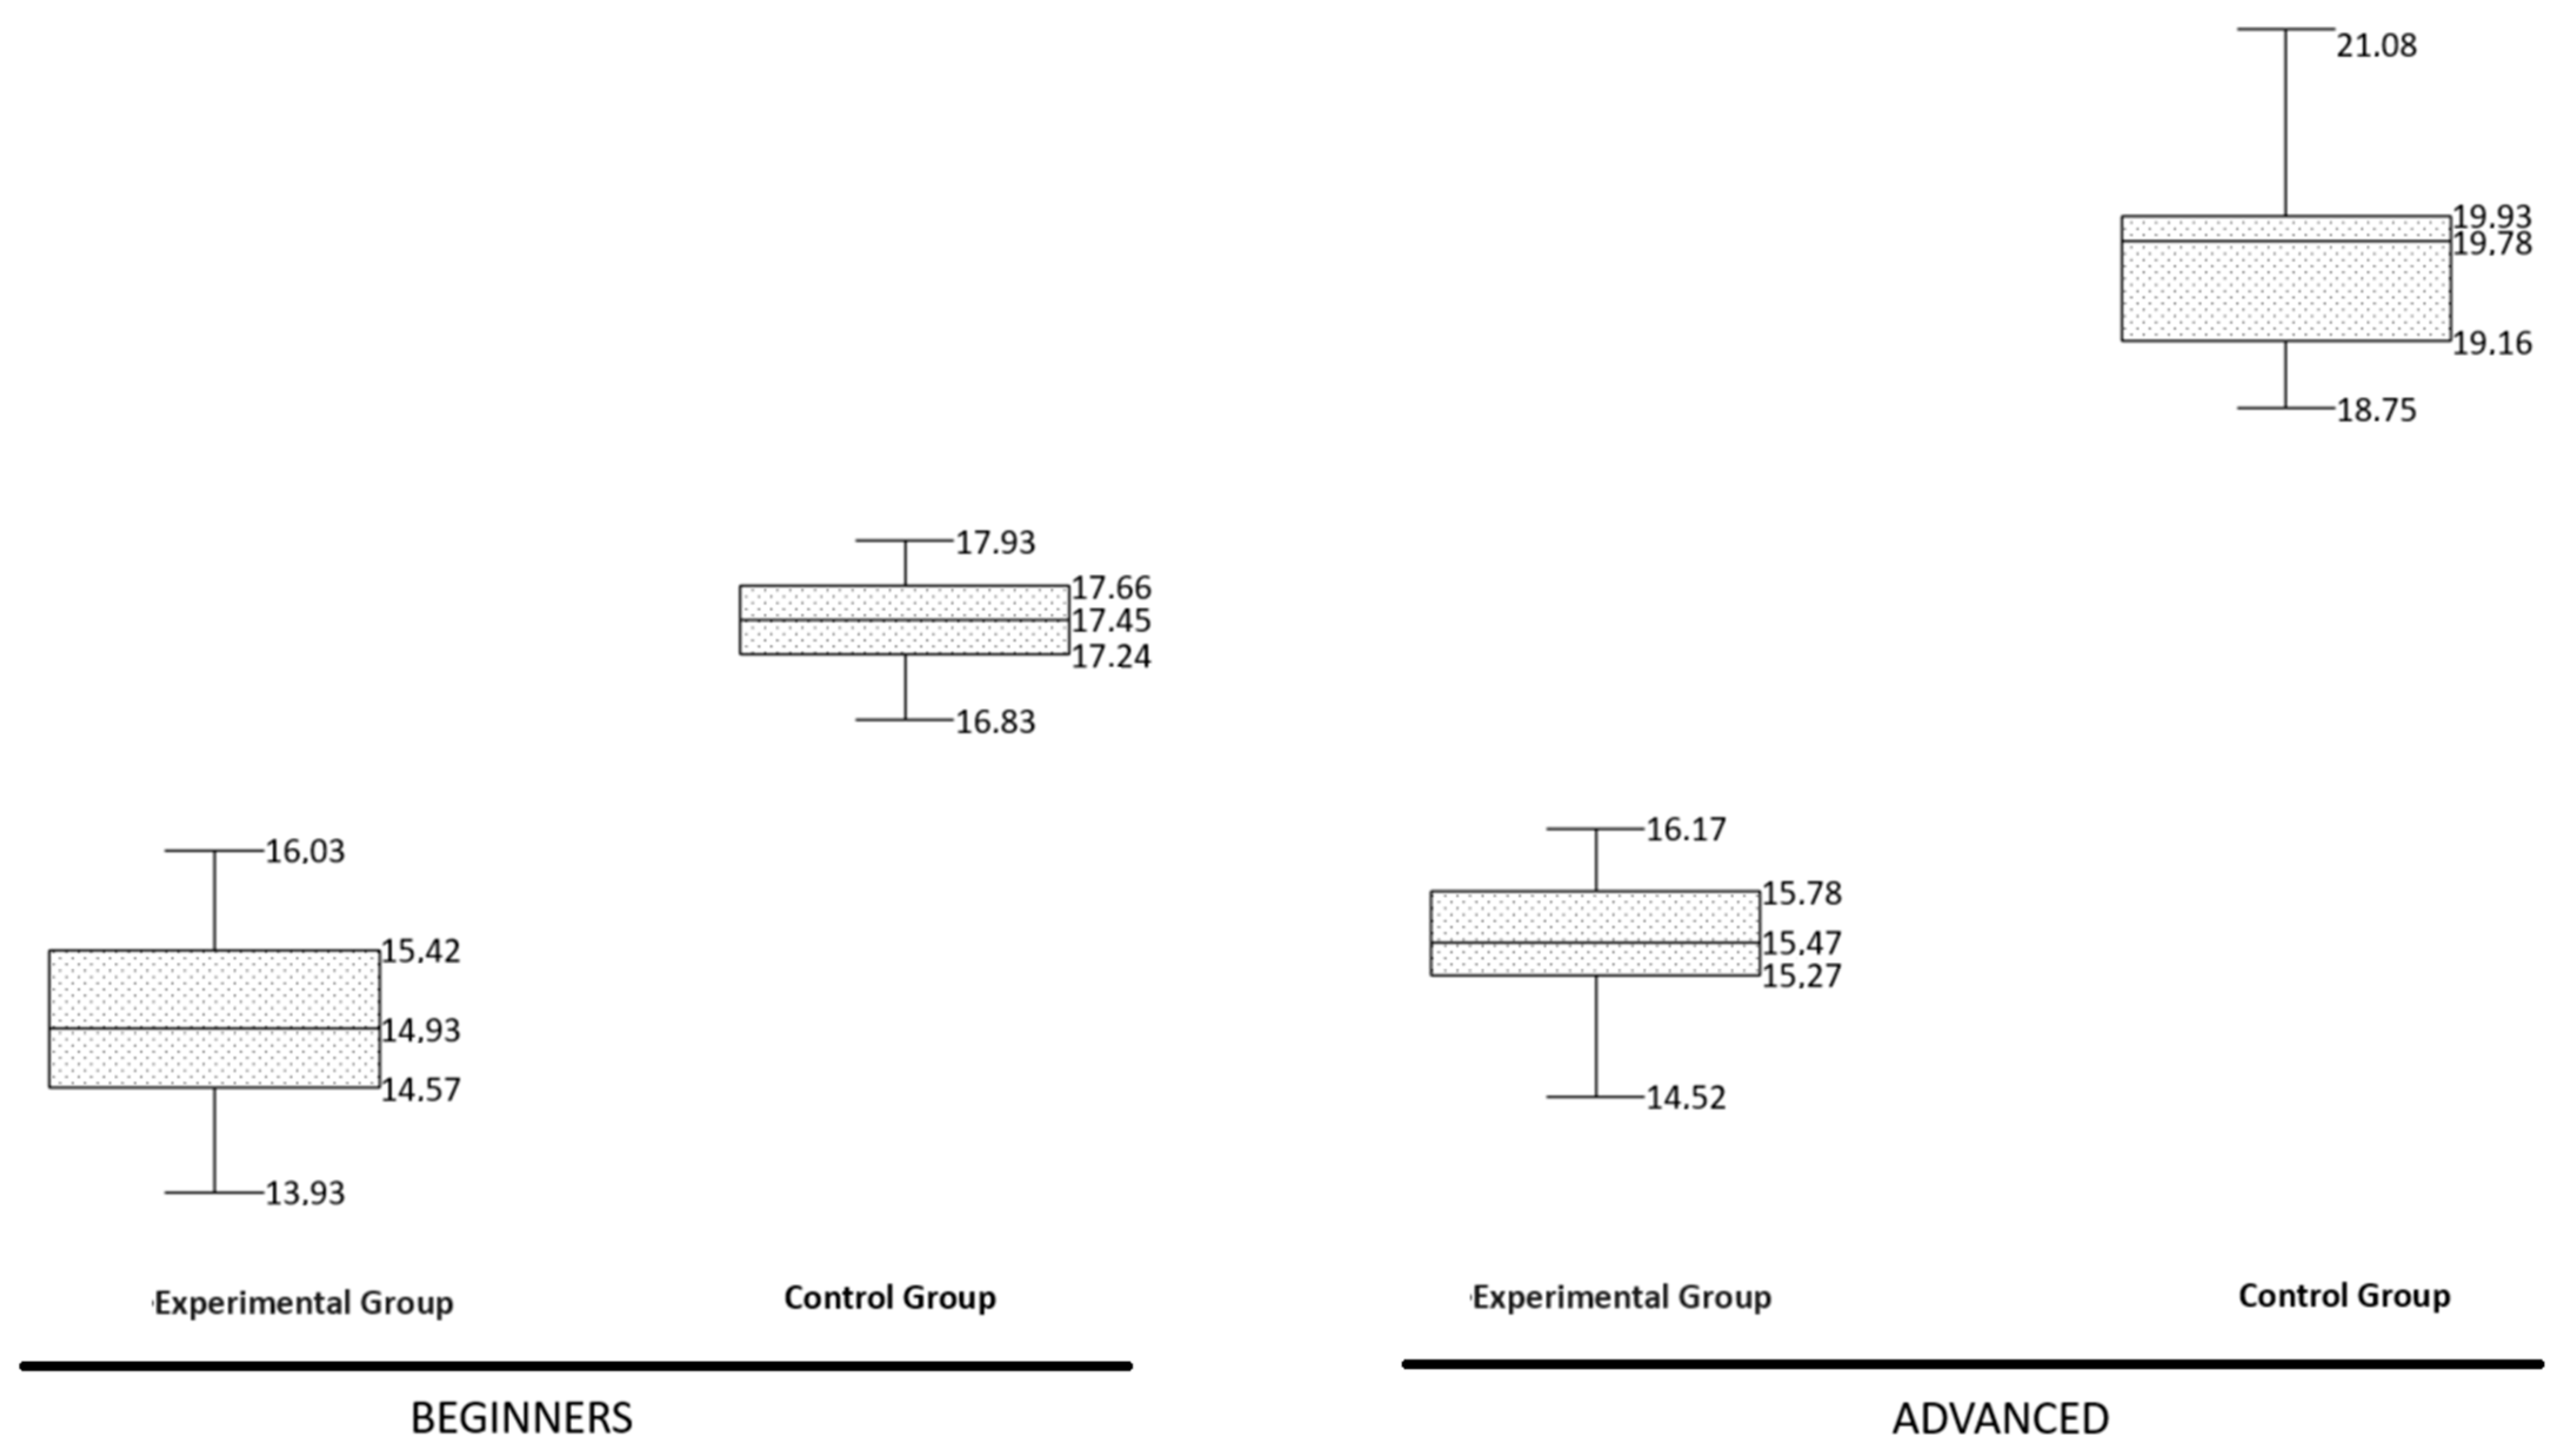
The questionnaire for both groups started at the same time, and the completion time of each participant was recorded.
Figure 9 shows that the two groups showed a statistically significant difference in questionnaire completion time. In the beginners group, the EG participants took an average of 14.93 min to complete the questionnaires and the CG participants took an average of 17.45 min. On the other hand, in the advanced group, EG participants took on average 15.47 min to complete the questionnaires, and those in the CG group took on average 19.78 min.
In both groups, beginners and advanced, the EG participants exceeded the CG participants in time to solve the questionnaire, suggesting that those who used the app felt more confident and therefore were able to solve it in less time. We interpret this as follows: since the application is highly visual and interactive, it allows students to remember and understand in greater depth the more complex topics with less study time.
7. Discussion
Based on the analysis of the results of the questionnaires, it is corroborated that both groups of participants enjoyed the experience that NetAR offers in comparison with the traditional method. The participants indicated that the application helped them to better comprehend the topics since it helped generate interest and motivation in their learning. Moreover, the typography and size of the letters displayed in the titles and texts of each scene were easy to read for the users.
The findings of the presented research confirmed that the use of the mobile application improved the learning ability of the participants who used the app; they could effectively understand the concepts validated by the results of the test. The NetAR mobile application is a medium to ensure dynamic learning of networking concepts. Although many of the participants were not familiar with educational AR applications, they did not have any problems using the technology. The application turned out to be very intuitive. This meant that, with a simple demonstration, most of the participants could use the application properly. This gives evidence of the results of the usability evaluation used in this work, which show that the students had no difficulty integrating this new technology into their studies. All participants completed the proposed activities without problems and there were no technical setbacks relevant enough to reduce the students’ enthusiasm to complete the activities.
It was confirmed that the mobile application encouraged participants to learn while being more motivated, in comparison with conventional methods. The participants are familiar with current technologies, making NetAR not only an optimal tool for learning in a formal study environment, but also for motivating users and encouraging autonomous learning.
The importance of this work and its results are in line with the findings of several investigations [
9,
21,
62], which show positive results in motivation, attention and satisfaction for the learning environment based on AR technology. Furthermore, they indicate that this method of learning produces greater motivation, due to the interaction and the use of technological tools that are very attractive to users. This new teaching methodology can generate in students a better way to assimilate content and visualize complex graphical representations more effectively.
When analyzing the background previously, it was found that most of the studies with AR and mobile devices that exist are empirical; more scientific studies are needed to corroborate the results obtained, which is why this work focuses on showing results analyzed with students in a real learning environment.
When reviewing the discussion in the different studies, it is evident that they agree on several aspects, the most important of which are: using AR applications for longer periods of time to determine how good the results are in the long term [
27], performing experimentation with different tasks to determine which are the best [
57], performing for longer periods of use with both groups [
13], performing work with scientific tools [
15], and improving accessibility so that it also helps people with disabilities [
63]. For these reasons, it is suggested that considering the use of mobile applications using AR as a common practice in education, both formal and informal, will help to modernize and update study environments in multiple areas of knowledge and educational levels.
8. Conclusions and Future Work
The analysis of this research was developed during the months of January and February of this year. The design and construction of the mobile application was carried out by a group of teachers and students as their own research project. A requirements analysis was carried out for its construction and it was based on an agile methodology (SCRUM). Once the application was finished, it was distributed free of charge to teachers and students. It should be noted that the mobile application is still in the process of improvement; accessibility issues will be addressed so that it can be used by people with disabilities. Once this last step is completed, it will be uploaded to the Google Play Store for free download.
AR is one of the technological innovations that make it possible for the real world and the virtual world to merge and work in an integrated way. Through this technology, blended learning environments can be created, where the real world can be enriched with dynamic virtual content. This learning environment offers new ways of acquiring knowledge and skills.
Two important results were obtained through this study, one concerning the usability of the application and the other related to the learning performance caused by the use of the application. Both are related to the objective of creating enriching experiences for students through technology.
Regarding the results obtained in terms of usability, the participants stated that they had a positive experience with the application and had no major problems in its use. The SYSUSE, INFOQUAL, and INTERQUAL results of the IBM CSUQ questionnaire showed positive values. Therefore, it can be concluded that the application was easy to use for students.
On the other hand, the statistical analysis between the EG and CG showed a significant difference for the participants who used NetAR as part of their learning. This indicates that the use of NetAR helped the students to have a better learning experience and a deeper understanding of the topics studied in class.
Finally, the work performed was successful and corroborated the two hypotheses stated at the beginning of the study: H3 (there is a significant difference in the mean score of the questionnaire between the EG and CG) and Ha (there is a significant difference between the scores of the two groups because of the teaching method used) with very favorable results, which are reaffirmed with previous studies reviewed in the background.
For future work, the study should conduct experimentation with a larger group of students and for a longer period of time in order to analyze long-term usability and analyze what type of content produces the best results for students.
In the previous background review, it was evident that the main focus of AR applications is on elementary and high school students and that very few applications have support options for people with disabilities. For this reason, the accessibility of NetAR is an issue that should be considered for improvement, so that the greatest number of people will be able to use it and benefit from its features. In addition, the application should be migrated to be functional in other platforms such as iOS.
In addition, it is proposed to optimize the application in such a way that it consumes as few resources as possible and can be executed in a greater number of mobile devices. Finally, it will be important to implement an internal storage structure (database) that allows saving evaluation parameters such as: grades, time of use, and learning progress in the application, so that the application becomes a fully featured tool and can be used as a support for both teachers and students.
Author Contributions
Conceptualization, S.C.-C., J.-L.P.-M., and S.L.-M.; methodology, S.C.-C., D.A.-V., M.M.-N., F.A.V.-G., and S.L.-M.; validation, S.C.-C., J.-L.P.-M., and S.L.-M.; formal analysis, S.C.-C., J.-L.P.-M., and S.L.-M.; investigation, S.C.-C., D.A.-V., M.M.-N., F.A.V.-G., J.-L.P.-M., and S.L.-M.; resources, S.C.-C., D.A.-V., M.M.-N., F.A.V.-G., J.-L.P.-M., and S.L.-M.; data curation, S.C.-C., D.A.-V., M.M.-N., F.A.V.-G., J.-L.P.-M., and S.L.-M.; writing original draft preparation, D.A.-V., M.M.-N., F.A.V.-G., S.C.-C., and S.L.-M.; writing review and editing, S.C.-C., D.A.-V., M.M.-N., F.A.V.-G., and S.L.-M.; visualization, S.C.-C., J.-L.P.-M., and S.L.-M.; supervision, S.C.-C., and S.L.-M.; project administration, S.C.-C., and S.L.-M.; funding acquisition, S.L.-M. All authors have read and agreed to the published version of the manuscript.
Funding
This work was supported by the EduTech project (609785-EPP-1-2019-1-ES-EPPKA2-CBHEJP) co-funded by the Erasmus+ Programme of the European Union.
Data Availability Statement
Not applicable.
Conflicts of Interest
The authors declare no conflict of interest.
References
- Vakaliuk, T.A.; Shevchuk, L.D.; Shevchuk, B.V. Possibilities of Using AR and VR Technologies in Teaching Mathematics to High School Students. Univers. J. Educ. Res. 2020, 8, 6280–6288. [Google Scholar] [CrossRef]
- Azuma, R.T. A Survey of Augmented Reality. Presence Teleoperators Virtual Environ. 1997, 6, 355–385. [Google Scholar] [CrossRef]
- Guest, W.; Wild, F.; Vovk, A.; Lefrere, P.; Klemke, R.; Fominykh, M.; Kuula, T. A technology acceptance model for augmented reality and wearable technologies. J. Univers. Comput. Sci. 2018, 24, 192–219. [Google Scholar] [CrossRef]
- Ong, S.K.; Yuan, M.L.; Nee, A.Y.C. Augmented reality applications in manufacturing: A survey. Int. J. Prod. Res. 2008, 46, 2707–2742. [Google Scholar] [CrossRef]
- Andujar, J.M.; Mejias, A.; Marquez, M.A. Augmented Reality for the Improvement of Remote Laboratories: An Augmented Remote Laboratory. IEEE Trans. Educ. 2011, 54, 492–500. [Google Scholar] [CrossRef]
- Alghazi, S.; Kamsin, A.; Almaiah, M.; Wong, S.; Shuib, L. For Sustainable Application of Mobile Learning: An Extended UTAUT Model to Examine the Effect of Technical Factors on the Usage of Mobile Devices as a Learning Tool. Sustainatibility 2021, 13, 1856. [Google Scholar] [CrossRef]
- Gómez-Galán, J.; Vázquez-Cano, E.; De La Rosa, A.L.; López-Meneses, E. Socio-Educational Impact of Augmented Reality (AR) in Sustainable Learning Ecologies: A Semantic Modeling Approach. Sustainatibility 2020, 12, 9116. [Google Scholar] [CrossRef]
- Bucea-Manea-Țoniş, R.; Bucea-Manea-Țoniş, R.; Simion, V.E.; Ilic, D.; Braicu, C.; Manea, N. Sustainability in Higher Education: The Relationship between Work‒Life Balance and XR E-Learning Facilities. Sustainatibility 2020, 12, 5872. [Google Scholar] [CrossRef]
- Martín-Gutiérrez, J.; Fabiani, P.; Benesova, W.; Meneses, M.D.; Mora, C.E. Augmented reality to promote collaborative and autonomous learning in higher education. Comput. Hum. Behav. 2015, 51, 752–761. [Google Scholar] [CrossRef]
- Wild, F.; Klemke, R.; Lefrere, P.; Fominykh, M.; Kuula, T. Technology Acceptance of Augmented Reality and Wearable Technologies. In Proceedings of the International Conference on Immersive Learning, Coimbra, Portugal, 26–29 June 2017; Communications in Computer and Information Science. Springer Science and Business Media LLC: Cham, Switzerland, 2017; Volume 725, pp. 129–141. [Google Scholar]
- Juan, M.C.; Loachamin-Valencia, M.; Garcia-Garcia, I.; Melchor, J.M.; Benedito, J. ARCoins. An Augmented Reality App for Learning about Numismatics. In Proceedings of the International Conference on Advanced Learning Technologies, Timisoara, Romania, 3–7 July 2017; pp. 466–468. [Google Scholar]
- Livingston, M.A.; Rosenblum, L.J.; Brown, D.G.; Schmidt, G.S.; Julier, S.J.; Baillot, Y.; Swan, J.E.; Ai, Z.; Maassel, P. Military applications of augmented reality. In Handbook of Augmented Reality; Springer: New York, NY, USA, 2011; pp. 671–706. [Google Scholar] [CrossRef]
- Mourtzis, D.; Zogopoulos, V.; Vlachou, E. Augmented Reality Application to Support Remote Maintenance as a Service in the Robotics Industry. Procedia CIRP 2017, 63, 46–51. [Google Scholar] [CrossRef]
- Von Itzstein, G.S.; Billinghurst, M.; Smith, R.T.; Thomas, B.H. Encyclopedia of Computer Graphics and Games. Encycl. Comput. Graph. Games 2020. [Google Scholar] [CrossRef]
- Okimoto, M.L.L.; Okimoto, P.C.; Goldbach, C.E. User Experience in Augmented Reality Applied to the Welding Education. Procedia Manuf. 2015, 3, 6223–6227. [Google Scholar] [CrossRef] [Green Version]
- Wu, H.-K.; Lee, S.W.-Y.; Chang, H.-Y.; Liang, J.-C. Current status, opportunities and challenges of augmented reality in education. Comput. Educ. 2013, 62, 41–49. [Google Scholar] [CrossRef]
- Tranter, C. Virtual and Augmented Reality in Education. Cisco Blogs/Education/Virtual in Eucation. 2017. Available online: https://news-blogs.cisco.com/education/virtual-and-augmented-reality-in-education (accessed on 19 January 2021).
- Vázquez-Cano, E.; Marín-Díaz, V.; Oyarvide, W.R.V.; López-Meneses, E. Use of Augmented Reality to Improve Specific and Transversal Competencies in Students. Int. J. Learn. Teach. Educ. Res. 2020, 19, 393–408. [Google Scholar] [CrossRef]
- Akçayır, M.; Akçayır, G. Advantages and challenges associated with augmented reality for education: A systematic review of the literature. Educ. Res. Rev. 2017, 20, 1–11. [Google Scholar] [CrossRef]
- Lee, K. Augmented Reality in Education and Training. TechTrends 2012, 56, 13–21. [Google Scholar] [CrossRef]
- Parras-Burgos, D.; Fernández-Pacheco, D.G.; Barbosa, T.P.; Soler-Méndez, M.; Molina-Martínez, J.M. An augmented reality tool for teaching application in the agronomy domain. Appl. Sci. 2020, 10, 3632. [Google Scholar] [CrossRef]
- Almarabeh, H.; Amer, E.F.; Sulieman, A. The Effectiveness of Multimedia Learning Tools in Education. Int. J. Adv. Res. Comput. Sci. Softw. Eng. 2015, 5, 761–764. [Google Scholar]
- Quintero, E.; Salinas, P.; González-Mendívil, E.; Ramirez, H. Augmented Reality app for Calculus: A Proposal for the Development of Spatial Visualization. Procedia Comput. Sci. 2015, 75, 301–305. [Google Scholar] [CrossRef] [Green Version]
- Ferrer, V.; Perdomo, A.; Rashed-Ali, H.; Fies, C.; Quarles, J. How Does Usability Impact Motivation in Augmented Reality Serious Games for Education? In Proceedings of the International Conference on Games and Virtual Worlds for Serious Applications (VS-GAMES), Poole, UK, 11–13 September 2013; Institute of Electrical and Electronics Engineers (IEEE): Piscataway, NJ, USA, 2013; pp. 1–8. [Google Scholar] [CrossRef]
- Kiryakova, G.; Angelova, N.; Yordanova, L. The potential of augmented reality to transform education into Smart education. TEM J. 2018, 7, 556–565. [Google Scholar] [CrossRef]
- Wei, X.; Weng, D.; Liu, Y.; Wang, Y. Teaching based on augmented reality for a technical creative design course. Comput. Educ. 2015, 81, 221–234. [Google Scholar] [CrossRef]
- Di Serio, Á.; Ibañez, M.B.; Kloos, C.D. Impact of an augmented reality system on students’ motivation for a visual art course. Comput. Educ. 2013, 68, 586–596. [Google Scholar] [CrossRef] [Green Version]
- Dingli, A.; Seychell, D. The New Digital Natives; Springer: Berlin/Heidelberg, Germany, 2015. [Google Scholar] [CrossRef]
- Traxler, J. Inclusion in an age of mobility. Res. Learn. Technol. 2016, 24. [Google Scholar] [CrossRef] [Green Version]
- Molnar, G.; Szuts, S.; Biro, K. Use of Augmented Reality in Learning. Acta Polytech. Hung. 2018, 15, 209–222. [Google Scholar] [CrossRef]
- Fridolin, W.; Christine, P.; Benedickt, H.; Ralf, K. IEEE Standard for Augmented Reality Learning Experience Models. In Proceedings of the IEEE International Conference on Teaching, Assessment, and Learning for Engineering, Takamatsu, Japan, 8–11 December 2020; pp. 1–3. [Google Scholar] [CrossRef]
- Fridolin, W.; Christine, P.; Brandt, D. IEEE: Standard for Augmented Reality Learning Experience Model; IEEE Std. 1589–2020; IEEE: Piscataway, NJ, USA, 2020; pp. 1–48. [Google Scholar] [CrossRef]
- Criollo-C, S.; Moscoso-Zea, O.; Guerrero-Arias, A.; Jaramillo-Alcazar, A.; Lujan-Mora, S. Mobile Learning as the Key to Higher Education Innovation: A Systematic Mapping. IEEE Access 2021, 9, 66462–66476. [Google Scholar] [CrossRef]
- Lindner, C.; Rienow, A.; Jürgens, C. Augmented Reality applications as digital experiments for education—An example in the Earth-Moon System. Acta Astronaut. 2019, 161, 66–74. [Google Scholar] [CrossRef]
- Criollo, C.S.; Lujan-Mora, S.; Jaramillo-Alcazar, A. Advantages and Disadvantages of M-Learning in Current Education. In Proceedings of the IEEE World Engineering Education Conference (EDUNINE), Buenos Aires, Argentina, 11–14 March 2018; pp. 1–6. [Google Scholar]
- Criollo, C.S.; Guerrero-Arias, A.; Jaramillo-Alcázar, Á.; Luján-Mora, S. Mobile Learning Technologies for Education: Benefits and Pending Issues. Appl. Sci. 2021, 11, 4111. [Google Scholar] [CrossRef]
- Harun; Tuli, N.; Mantri, A. Experience Fleming’s rule in Electromagnetism Using Augmented Reality: Analyzing Impact on Students Learning. Procedia Comput. Sci. 2020, 172, 660–668. [Google Scholar] [CrossRef]
- Sanii, B. Creating Augmented Reality USDZ Files to Visualize 3D Objects on Student Phones in the Classroom. J. Chem. Educ. 2019, 97, 253–257. [Google Scholar] [CrossRef] [Green Version]
- Wang, X. User-Centered Design of a Mobile Application Using a Combination of Augmented Reality and Maps for Geo-FIELDWORK Education. Ph.D. Thesis, Department of Science, Technology and Policy Studies (STePS), Universiteit Twente, Enschede, The Netherlands, 2020. [Google Scholar]
- Sharmin, N.; Chow, A.K. Augmented Reality Application to Develop a Learning Tool for Students: Transforming Cellphones into Flashcards. Heal. Inform. Res. 2020, 26, 238–242. [Google Scholar] [CrossRef]
- Vasilevski, N.; Birt, J. Analysing construction student experiences of mobile mixed reality enhanced learning in virtual and augmented reality environments. Res. Learn. Technol. 2020, 28. [Google Scholar] [CrossRef] [Green Version]
- Kim, J.; Irizarry, J. Evaluating the Use of Augmented Reality Technology to Improve Construction Management Student’s Spatial Skills. Int. J. Constr. Educ. Res. 2021, 17, 99–116. [Google Scholar] [CrossRef]
- Lee, J. Problem-based gaming via an augmented reality mobile game and a printed game in foreign language education. Educ. Inf. Technol. 2020, 3, 1–29. [Google Scholar] [CrossRef]
- Radosavljevic, S.; Radosavljevic, V.; Grgurovic, B. The potential of implementing augmented reality into vocational higher education through mobile learning. Interact. Learn. Environ. 2018, 28, 404–418. [Google Scholar] [CrossRef]
- Stojšić, I.; Ivkov-Džigurski, A.; Maričić, O.; Stanisavljević, J.; Jovanov, J.M.; Višnić, T. Students’ Attitudes toward the Application of Mobile Augmented Reality in Higher Education. Drus. Istraz. 2020, 29, 535–554. [Google Scholar] [CrossRef]
- Chang, Y.-S.; Hu, K.-J.; Chiang, C.-W.; Lugmayr, A. Applying Mobile Augmented Reality (AR) to Teach Interior Design Students in Layout Plans: Evaluation of Learning Effectiveness Based on the ARCS Model of Learning Motivation Theory. Sensors 2019, 20, 105. [Google Scholar] [CrossRef] [Green Version]
- Criollo, C.; Luján-Mora, A. SWOT analysis of bring your own devices in mobile learning. In Proceedings of the International Conference on Mobile Learning, Lisbon, Portugal, 14–16 April 2018; pp. 148–152. [Google Scholar]
- Zavizion, V.F.; Bondarenko, I.M.; Avierin, D.I.; Hojouj, M.I.; Davlietova, N.O.; Cherednychenlo, N.O.; Prokhach, A.V.; Mashtaler, V.E.; Dmytrenko, K.O.; Lohvynenko, V.V.; et al. Distance learning: Opportunities and challenges in quarantine. Medicni Perspekt. (Med. Perspect.) 2020, 25, 4–12. [Google Scholar] [CrossRef]
- Berezhna, S.; Prokopenko, I. Higher Education Institutions in Ukraine during the Coronavirus, or COVID-19, Outbreak: New Challenges vs New Opportunities. Rev. Rom. Pentru Educ. Multidimens. 2020, 12, 130–135. [Google Scholar] [CrossRef]
- Fojtik, R. Ebooks and Mobile Devices in Education. Procedia Soc. Behav. Sci. 2015, 182, 742–745. [Google Scholar] [CrossRef] [Green Version]
- Derounian, J.G. Mobiles in class? Act. Learn. High. Educ. 2017, 21, 142–153. [Google Scholar] [CrossRef]
- Criollo-C, S.; Lujan-Mora, S. M-Learning and Their Potential use in the Higher Education: A Literature Review. In Proceedings of the 2017 International Conference on Information Systems and Computer Science (INCISCOS), Quito, Ecuador, 23–25 November 2017; pp. 268–273. [Google Scholar]
- StatCounter. Mobile Operating System. Mobile Operating System Market Share Worldwide. 2020. Available online: https://gs.statcounter.com/os-market-share/mobile/worldwide (accessed on 19 January 2021).
- Cakmak, Y.O.; Daniel, B.K.; Hammer, N.; Yilmaz, O.; Irmak, E.C.; Khwaounjoo, P. The Human Muscular Arm Avatar as an Interactive Visualization Tool in Learning Anatomy: Medical Students’ Perspectives. IEEE Trans. Learn. Technol. 2020, 13, 593–603. [Google Scholar] [CrossRef]
- Jin, L.; Wen, Z.; Billinghurst, M.; Kato, H.; Poupyrev, I. Adorning VRML worlds with environmental aspects. IEEE Eng. Med. Boil. Mag. 2001, 21, 6–9. [Google Scholar] [CrossRef]
- Yekela, O.; Thomson, K.-L.; van Niekerk, J. Information Security Education for a Global Digital Society; Springer: Cham, Switzerland, 2017. [Google Scholar]
- Khan, T.; Johnston, K.; Ophoff, J. The Impact of an Augmented Reality Application on Learning Motivation of Students. Adv. Human Comput. Interact. 2019, 1–14. [Google Scholar] [CrossRef] [Green Version]
- Chen, C.-M.; Tsai, Y.-N. Interactive augmented reality system for enhancing library instruction in elementary schools. Comput. Educ. 2012, 59, 638–652. [Google Scholar] [CrossRef]
- Developer Portal: Vuforia Developer Library. Image Targets. 2020. Available online: https://library.vuforia.com/features/images/image-targets.html (accessed on 19 January 2021).
- Lewis, J. IBM computer usability satisfaction questionnaires: Psychometric evaluation and instructions for use. Int. J. Hum. Comput. Interact. 1995, 7, 57–78. [Google Scholar] [CrossRef] [Green Version]
- Benedek, J.; Miner, T. Measuring Desirability: New Methods for Evaluating Desirability in a Usability Lab Setting. In Proceedings of the Usability Professionals Association, Orlando, FL, USA, 8–12 July 2002. [Google Scholar]
- Elmqaddem, N. Augmented Reality and Virtual Reality in Education. Myth or Reality? Int. J. Emerg. Technol. Learn. (iJET) 2019, 14, 234. [Google Scholar] [CrossRef] [Green Version]
- Garzón, J.; Pavón, J.; Baldiris, S. Systematic review and meta-analysis of augmented reality in education settings. Virtual Real. 2019, 23, 447–459. [Google Scholar] [CrossRef]
| Publisher’s Note: MDPI stays neutral with regard to jurisdictional claims in published maps and institutional affiliations. |
© 2021 by the authors. Licensee MDPI, Basel, Switzerland. This article is an open access article distributed under the terms and conditions of the Creative Commons Attribution (CC BY) license (https://creativecommons.org/licenses/by/4.0/).


 ,
, 


